wages, productivity and employment: a review of theory and
TRANSCRIPT
Institute for Employment Studies 1
Wages, productivity and employment: A review of theory and international data
European Employment Observatory Thematic expert ad-hoc paper
Nigel Meager and Stefan Speckesser
Institute for Employment Studies
Sovereign House
Church Street
Brighton BN1 1UJ
United Kingdom
May 2011
2 Wages, productivity and employment
Contents
1 Introduction and overview 3
2 Reviewing the relationship of wages, productivity and employment 7
2.1 Short run 7
2.2 Medium run 12
2.3 Long run 16
2.4 Available empirical evidence and methodological problems 19
2.5 Policy rules for wage-setting in the light of economic theory 21
2.6 Summary 24
3 Analysis of international data 26
3.1 Indicators 26
3.2 Short run: Before and after the recession 42
3.3 Medium and long run 51
3.4 Differential growth of wages and productivity and aggregate
employment performance 59
4 Concluding remarks 65
4.1 Does wage moderation really lead to better economic and
employment performance? 65
4.2 How should monitoring be undertaken? 66
5 References 69
6 Appendix 72
Institute for Employment Studies 3
1 Introduction and overview
The relationship between wages and productivity (or more specifically, the
relationship between wage growth and productivity growth) has become one of
particular policy relevance in recent years, in light of the recent economic crisis
and emerging imbalances between Eurozone countries. As the ILO has observed:
‚With the Euro, balanced trade requires that wages in all member states grow in
line with national productivity plus targeted inflation rate of the ECB. Otherwise
counties with relative higher growth in unit labour costs will systematically lose
market share and build up trade deficits. The case for a coordinated wage policy to
avoid imbalances, beggar thy neighbour policies and a waste of potential growth is
overwhelming: it is alarming that it has been ignored for so long. Those who let unit
labour costs rise too fast are equally repsonible for the explosion of imbalances after
the abolition of the exchange rate mechanism as those who gained market shares
through wage restraint‛.(Hoffer and Spiecker 2011, p. 2)
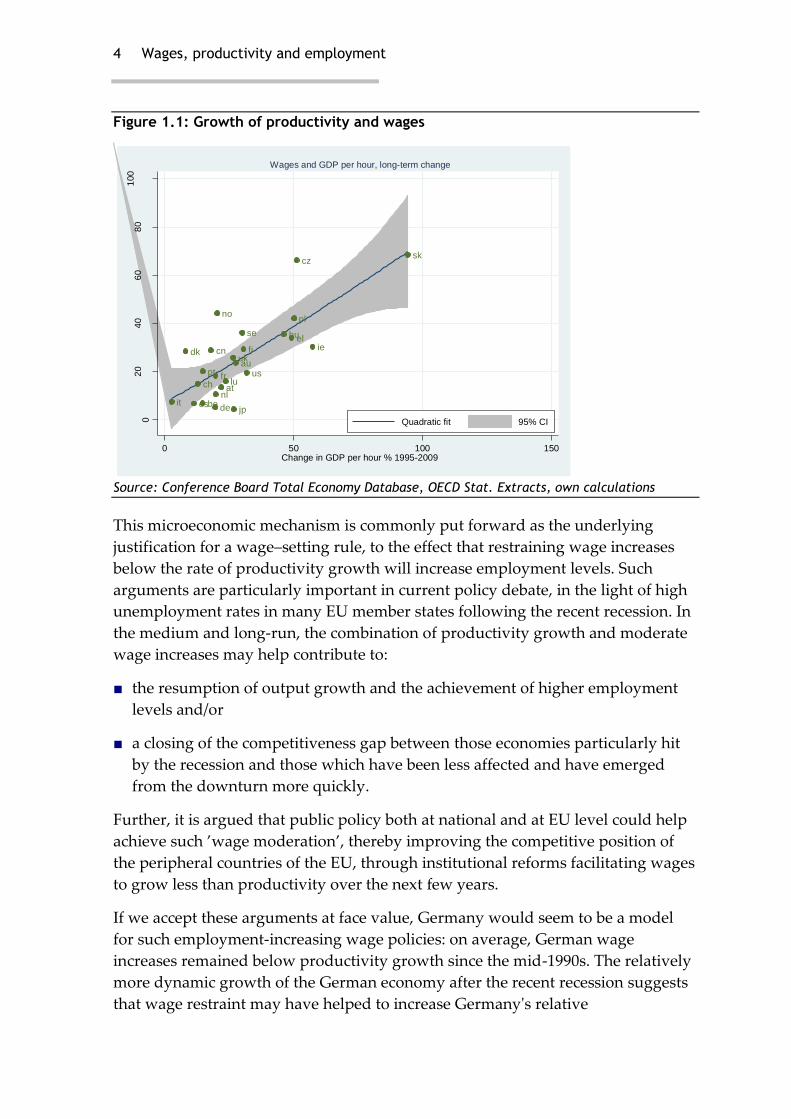
That there is an important relationship between the growth of productivity and
the growth of wages at national level is in little doubt. Figure 1.1 clearly shows this
relationship, using data for 25 countries for the years 1995-20091.
The stylised fact of an empirical association between wages and productivity is
consistent with traditional microeconomic theory, and in particular the idea that
wages – at a microeconomic level – are closely related to marginal productivities.
Microeconomic theory also implies that labour demand would increase if
productivity per unit of labour input increased (at given wages), because a further
extension of production would increase firms' profits.
1 In section 3 below we explore this relationship in more detail
4 Wages, productivity and employment
Figure 1.1: Growth of productivity and wages
at
be
cz
dk fi
fr
de
elhu
ie
it
lu
nl
pl
pt
sk
es
se
uk
us
cn
au
no
ch
jp
02
04
06
08
01
00
% c
han
ge
in
av. w
ag
es 1
995
-20
09
0 50 100 150Change in GDP per hour % 1995-2009
Quadratic fit 95% CI
Wages and GDP per hour, long-term change
Source: Conference Board Total Economy Database, OECD Stat. Extracts, own calculations
This microeconomic mechanism is commonly put forward as the underlying
justification for a wage–setting rule, to the effect that restraining wage increases
below the rate of productivity growth will increase employment levels. Such
arguments are particularly important in current policy debate, in the light of high
unemployment rates in many EU member states following the recent recession. In
the medium and long-run, the combination of productivity growth and moderate
wage increases may help contribute to:
■ the resumption of output growth and the achievement of higher employment
levels and/or
■ a closing of the competitiveness gap between those economies particularly hit
by the recession and those which have been less affected and have emerged
from the downturn more quickly.
Further, it is argued that public policy both at national and at EU level could help
achieve such ’wage moderation’, thereby improving the competitive position of
the peripheral countries of the EU, through institutional reforms facilitating wages
to grow less than productivity over the next few years.
If we accept these arguments at face value, Germany would seem to be a model
for such employment-increasing wage policies: on average, German wage
increases remained below productivity growth since the mid-1990s. The relatively
more dynamic growth of the German economy after the recent recession suggests
that wage restraint may have helped to increase Germany's relative
Institute for Employment Studies 5
competitiveness (e.g. compared with the southern EU member states) and that
public policy facilitated this through far-reaching institutional reforms, e.g. of non-
working benefits and increased employment flexibility. Improving the relative
competitiveness of the deficit countries through wage adjustments may, therefore,
when seen from this perspective, result in higher growth in these countries and
less requirement for fiscal transfers from the surplus countries.
However, while this argumentation is plausible in the short-run, given the links
between wage moderation and employment growth when productivity is growing
at the microeconomic level, the medium and long run effectiveness of such
policies is much less clear, in the light both of economic theory and of empirical
data. This is well illustrated by a comparison of the US and Germany since the
mid 1990s: while the growth rates of wages and total labour compensation per
employee were much closer to the growth rate of productivity in the US than in
Germany (i.e. there was less wage moderation in the US), productivity and output
grew faster in the US than in Germany, as did aggregate employment.
In addition, any policy of wage moderation would also have to take account of
other important variables affecting productivity growth, such as changes in the
composition of the workforce, and because of this a simple targeting of wage
increases below observed labour productivity growth would be potentially
misleading. Additionally, much better empirical data are needed in order to be
able to assess the impact of wage-setting at sub-national levels, in order to take
account of, for example, the competitiveness of particular sectors, which are more
exposed to international competition and in which international competition more
clearly affects output and employment levels.
With this background, this paper explores the relationship between productivity
growth and wage growth and its importance for employment outcomes, drawing
on two main sources:
■ First we briefly review the economic literature which sets out, from a theoretical
perspective (and we also refer to empirical evidence in the literature where it is
available), the short-, medium- and long-run associations between wages and
productivity, and implicitly the importance of productivity-orientated wage
setting for employment outcomes. The medium- and long-run relationship is
particularly affected by the system of industrial relations and wage–setting, and
the extent to which it allows for sufficient flexibility to align wages and
productivity (including downward adjustment of wages if productivity
decreases) in order to achieve high employment levels and internationally-
competitive industries and services. Since there is great institutional variety
across EU member states (and the other countries included in this review), our
account is necessarily selective.
6 Wages, productivity and employment
■ Next we present an analysis of international data illustrating this relationship in
the short-run (before and after the 2009-2010 recession), as well as in the
medium- and long-run. OECD data for 2010 suggest that wages grew much less
than productivity in countries with severe output contractions during the
recession (e.g. Ireland and Estonia). This is evidence of wage flexibility at the
aggregate level in these EU member states, which might contribute to the
eventual restoration international competitiveness. However it is necessary to
stress at the outset that our analysis faces significant limitations. In particular,
data for 2010 are available only at the level of aggregate economies or EU
member states and for a limited number of countries. In addition, we cannot
control for many other important variables influencing productivity. A fuller
analysis at the level of sectors (in particular those exposed to international
competition) would be an important supplement to understand the potential
effectiveness of wage moderation strategies.
Institute for Employment Studies 7
2 Reviewing the relationship of wages, productivity and employment
In this chapter we discuss (in sections 2.1 to 2.3) what is known about the
relationship between wage and productivity growth, and its impact on
employment outcomes, drawing on the economic literature (both theoretical and
empirical). In doing so, we distinguish between the short-, medium- and long-run
as, while the distinctions between these three are somewhat arbitrary, it is
nevertheless the case that the predictions of economic theory and their policy
implications differ according to the time perspective being considered.
We then (in section 2.4) briefly focus on some of the empirical evidence on these
relationships (much of which relates to the US), and highlight some of the
methodological difficulties making empirical analysis in this area difficult (this, in
turn, sets the scene for our own exploration of cross-country data in chapter 3).
Finally in section 2.5 we raise the question of whether and how the observations of
economic theory can be translated into practical policy rules linking wage-setting
to productivity growth, illustrating this with a couple of country examples.
2.1 Short run
2.1.1 Basic microeconomic theory
Standard microeconomic theory2 suggests a clear relationship between
productivity, wages and labour demand, in which wages correspond to the
marginal productivity of labour and can be derived from the profit-maximising
2 A standard textbook representation of the microeconomics of labour demand can be found, for
example, in Borjas (2010, Chapter 3), Hammermesh (1993, Chapter 1) or Franz (2009, Chapter 3).
8 Wages, productivity and employment
behaviour of firms. Before describing this link in more detail, it is worth
emphasising that the fundamental theoretical assumption of a firm being a profit-
maximising entity applies only to private sector enterprises. Other market
structures and the increasing relevance of public sector employment for labour
market performance in many countries are not accommodated by this kind of
microeconomic theory. Nonetheless, there are important policy implications
which can be derived from the theory.
In its simplest form, the theory posits that a firm maximises profits. These profits
are equal to the sales from its goods (sold at prices exogenously given under
perfect competition) minus the costs of its factors of production (capital and
labour). The relationship between these production factors and their output is
specified in neoclassical theory by a production function. Typically it is assumed
that the firm's capital stock is constant in the short run, such that profit-
maximising behaviour determines the optimal level of production, at which a
marginal worker's contribution to profit is equal to that worker’s wage. The
marginal productivity condition sets the point at which an individual firm's
output expansion should stop: if growth continues such that marginal revenues no
longer exceed the costs of marginal labour input, profitability would fall.
Although the model is very simplistic, it generates some plausible conclusions
about the relationship between productivity and wages:
■ If productivity per unit of labour input (or per worker) increases, while wages
remain constant, this will increase labour demand, because a further extension
of production will increase profits.
■ Given a fixed labour supply, the increased labour demand would result in
higher pay, until a new profit-maximising equilibrium is reached at which
wages again equal marginal productivity.
In the medium- and long-run (which we consider further in sections 2.2 and 2.3
below), standard microeconomic theory assumes firms can alter not only their
employment levels, but also their capital stock. As a result changes in the price of
labour (wages) and/or the price of capital (interest rates) can lead firms to
substitute labour for capital or vice versa. Thus, whereas in the short-run wage
increases have only a scale effect, in the medium- and long-run they result in both
scale and substitution effects.
However, even in the medium-run, the adjustment of both capital and labour
would result in an allocation of factors of production corresponding to their
marginal products under perfect competition. Once again, increases in wages
would follow from increases in labour productivity. Since the neoclassical model
assumes an exogenously-given price level on goods markets under perfect
Institute for Employment Studies 9
competition, both the scale and the substitution effects of an increase in wages on
labour demand are unambiguously negative (see Franz 1999: 125).
The clear implication from the standard microeconomic theory is that wages
follow the development of productivity. This link has also been used as a rule for
assessing the employment implications of particular wage levels set in collective
bargaining, i.e. whether they are set in a way to achieve full employment. This, it
is argued, can be ensured through decentralised or flexible wage-bargaining
processes3. The link between flexible wage bargaining and a higher level of
employment has also been one of the central findings in Calmfors and Driffill
(1988)4 explaining why highly decentralised (but also highly-centralised) wage
setting may result in higher employment levels than is the case under industry-
level wage bargaining.
However, the underlying limitation of short-run microeconomic analyses of this
kind is that they do not allow for any influence of wage-setting on productivity.
The assumption in these simple models that productivity increases are exogenous
has been challenged by models of ‘efficiency wages’ as well as by theories about
the long-run impact of particular wage levels being set in the economy.
Key points
Standard micro-economic theory posits a clear relationship between wages growth and productivity growth in the short run, with wages adjusting to changes in productivity. In practice, even though the assumptions of economic theory are not always satisfied, this model has been used to justify wage-setting rules, aiming to ensure that wage growth does not exceed productivity growth, in order to generate full-employment. A key assumption of such simple models is that productivity developments are exogenous, and wages adjust to productivity.
2.1.2 Efficiency wages
An important development of the simple neoclassical model (albeit one that still
relies on highly stylised assumptions about individual and firm behaviour)
introduces the concept of ‘efficiency wages’ (Shapiro and Stiglitz, 1984). Under
most efficiency wage models, the link between wages and productivity is no
longer straightforward even in the in short-run.
3 An important advocate of this approach is the German Council of Economic Experts (e.g. in
their annual report 1996, paragraph 326)
4 See the discussion in section 2.2.2 below.
10 Wages, productivity and employment
Efficiency wage models reject the premise that wages are aligned to the marginal
productivity of workers under perfect competition. In contrast, these models
argue that paying higher-than-market wages can be a rational choice for firms, e.g.
in order to increase the work effort of employees. This applies particularly if there
are sources of alternative income (e.g. benefits) for the unemployed, and the
models assume that individual workers maximise their utility taking account of
wages, alternative incomes and efforts, all of which contribute to determining
their marginal product.
In the world set out in simple efficiency wage models, the possibility is allowed
for that, at any level of wages, more than one type of worker exists. In particular,
they hypothesise:
■ ‘productive workers’ whose utility is based (positively) on wages, but is also
linked (negatively) to their work effort and to the likelihood of losing their job
(and becoming reliant on benefits);
■ ‘shirking workers’ who earn the same wage with less work effort, but who face
a higher risk of job loss if their employer discovers the ‘shirking’, and therefore
a higher risk of reliance on unemployment benefits, with lower utility.
This kind of model leads to an equilibrium under which wages are set at the level
at which workers decide not to ‘shirk’. This implies that wages will be higher: a)
the higher the effort the firms try to extract from workers; b) the higher the
alternative utility from e.g. unemployment benefits; and c) the smaller the
probability that firms discover the shirking (see Franz 1999: 312).
In this sense, efficiency wage models imply a kind of ’reverse causality’: rather
than wages being set according to productivity, they have to be set at a particular
level in order to achieve a specific productivity in a world with labour market
institutions (e.g. unemployment benefits), which reduce the "penalty associated with
being fired" (Shapiro and Stiglitz 1984: 434).
The policy lesson from efficiency wage theory is that institutional reforms, e.g. an
increase in labour market flexibility or a reduction of unemployment benefits can
reduce levels of efficiency wages and – in line with standard microeconomic
thinking – increase employment levels.
Such models can also help to explain:
"why wages adjust only slowly in the face of aggregate shocks. A decrease in the
demand for labour will ultimately cause a lower wage and a higher level of
unemployment. In the transition, however, the wage decrease will match the growth
in the unemployment pool, which may be a sluggish process" (Shapiro and Stiglitz
1984: 434).
Institute for Employment Studies 11
When it comes to the relation between wages and productivity, it is important to
note that efficiency wages are particularly relevant for "firms, which find shirking
particularly costly" (ibid.).
Key points
More sophisticated models (e.g so-called ‘efficiency-wage’ models) allow for the possibility that, even in the short-run, it may be efficient for firms to set wages at levels different from that implied by the simple microeconomic theory, and they also take account of the potential influence of institutional arrangements (e.g. the existence and level of unemployment benefits) on the relationship between wages, productivity and employment.
2.1.3 Employment-neutral wage policies
In conventional wage bargaining models, there is broad consensus that the
development of productivity is the primary variable influencing the wage-setting
behaviour of unions. At the same time, the kinds of microeconomic theory
discussed above suggest a policy choice of setting a particular wage in order to
achieve a higher level of employment, in particular if wage increases remain
below the rate of productivity growth.
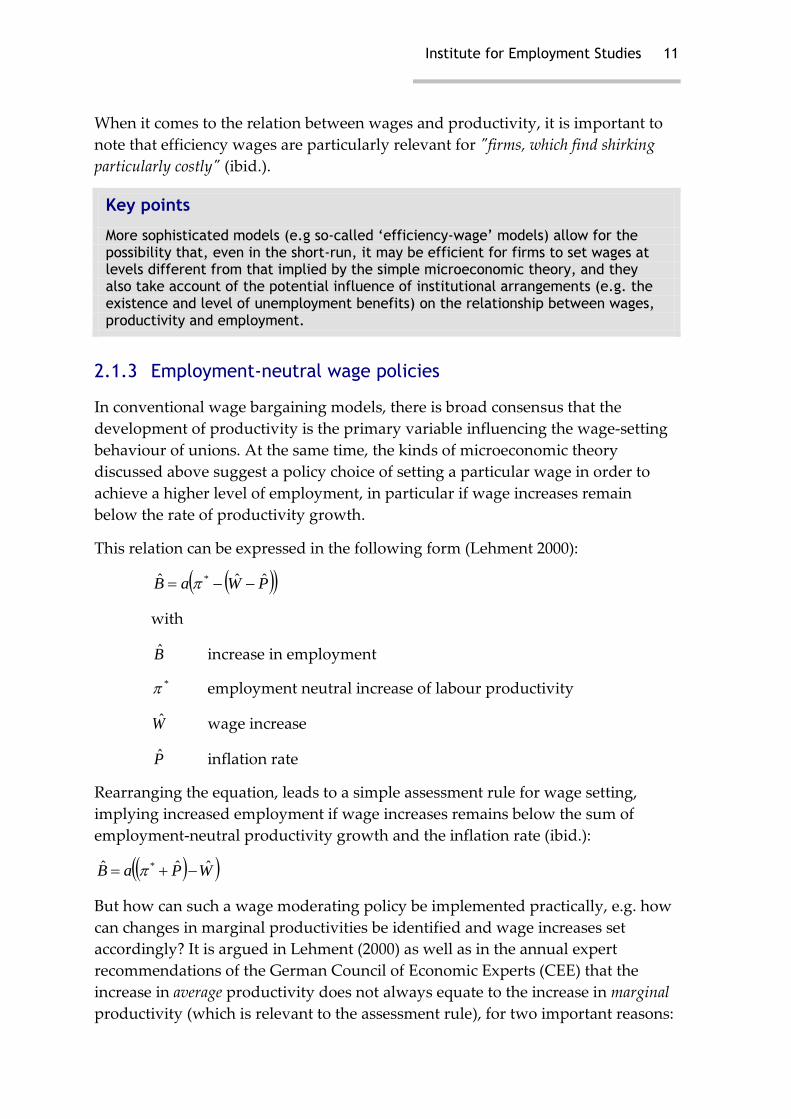
This relation can be expressed in the following form (Lehment 2000):
PWaB ˆˆˆ *
with
B increase in employment
* employment neutral increase of labour productivity
W wage increase
P inflation rate
Rearranging the equation, leads to a simple assessment rule for wage setting,
implying increased employment if wage increases remains below the sum of
employment-neutral productivity growth and the inflation rate (ibid.):
WPaB ˆˆˆ *
But how can such a wage moderating policy be implemented practically, e.g. how
can changes in marginal productivities be identified and wage increases set
accordingly? It is argued in Lehment (2000) as well as in the annual expert
recommendations of the German Council of Economic Experts (CEE) that the
increase in average productivity does not always equate to the increase in marginal
productivity (which is relevant to the assessment rule), for two important reasons:
12 Wages, productivity and employment
■ compositional changes in the employed labour force: if, for example,
restructuring results in a reduction in low-productivity employees, the
observed average productivity of remaining workers will increase. Wages
increasing less than productivity in such circumstances would not result in
employment increases, as there has been no substantial change in the
underlying productivity of employees.
■ changes in capital costs: if average productivity increases for a given level of
employment, wage increases cannot simply be aligned to this change if there
are simultaneously changes in relative capital costs. Thus, if productivity
increases e.g. due to further investments in physical capital, the additional
capital costs have to be accounted for when deriving the appropriate
’employment-neutral’ levels of wage increases for policy purposes.
For policy decision-making, it is therefore important to distinguish increases in
labour productivity from those originating from changes in technology and the
composition of the workforce. In Lehment (2000), the employment-neutral rate of
wage increase was the found to be about a third below the observed growth rate
in productivity per hour. In addition, the effectiveness of a productivity-orientated
wage policy depends crucially on the timely alignment of productivity increases
and wage changes: since the negotiations are about future wages, the alignment
has to allow for the fact that productivity increases in the future are uncertain.
Key points
The key policy question (if the predictions of economic theory are accepted) is what level of wage growth is consistent with maintaining (or increasing) employment levels? While various simple models exist for assessing the effect of a given relationship between wage increases and productivity increases on employment, their practical implementation is hindered by the difficulty of taking account of factors such as: the changing composition of the workforce (which may mean that observed average productivity differs significantly from marginal productivity, which is relevant to decision-making); changes in technology, and the changing cost of capital.
2.2 Medium run
2.2.1 Wage rigidities
The medium run alignment of wages and productivity depends relatively more on
the interplay of bargained wages and changes in other factor prices (in particular
physical capital), than in the short run. Blanchard (2006) introduces the concept of
the "bargained wage" as opposed to the "warranted wage". Even under standard
microeconomic assumptions like perfect competition, bargained wages are aligned
to anticipated future output and could differ from the warranted wage, e.g. if prices
Institute for Employment Studies 13
for other factors of production increase. In such a case, bargained wages may grow
faster than the warranted wage, and employment would decline in order to
maintain zero net profits for firms under perfect competition.
Blanchard (2006) proposes this as the key process causing increased
unemployment in the 1970s and 1980s, when changes in oil prices and the
reduction of the growth of total factor productivity resulted in labour productivity
increases much below the level of the 1960s5. In these circumstances, bargaining
outcomes exceeded the warranted wages and unemployment increased
accordingly. Of course, the 1970s increase in unemployment varied between
countries due to differing institutional circumstances, which allowed warranted
and bargained wages to realign more or less speedily, and due to the nature of
wage rigidities, which can be real or nominal:
"‘Real wage rigidities’ captured the speed at which (…) workers would for example
accept a slowdown in actual wages in response to a productivity slowdown. The
slower the adjustment, the higher and the longer lasting the effects of adverse shocks
on unemployment.
‘Nominal wage rigidities’ captured the speed at which nominal wages adjusted to
changes in prices. The slower the adjustment, the larger the decrease in the real
wage in response to an unanticipated increase in prices (…) and (…) the more the
monetary authorities could use inflation to reduce real wages and (…)
unemployment in response to an adverse supply shock." (Blanchard 2006)
Blanchard (2006) argues that accommodating monetary policy was aimed at
mitigating the consequences of the 1970s supply shock and delayed the
unemployment increase for some time. Subsequently, however, the contractionary
monetary policy of the early 1980s, aimed at reduction of inflation, increased real
interest rates and – as a result of falling capital accumulation – increased
unemployment even further. A neutral monetary policy, it is argued, would have
increased unemployment more significantly in the short run, but the surge in
unemployment would have been of shorter duration.
Key points
The economic literature commonly attributes medium-run divergences of wage growth from that warranted by productivity growth to wage ‘rigidities’ associated with institutional features of the bargaining system. Such an account is often cited
5 Blanchard (2006) reports the rate of technological progress falling from 5% in the 1950s and
1960s to 2% in the 1970s and 1980s.

14 Wages, productivity and employment
to explain persistent unemployment following the oil shocks of the 1970s in many countries, exacerbated in some cases by monetary policy responses.
2.2.2 Bargaining flexibility
As we have seen, the theoretical literature suggests that the interplay of real wage-
setting and labour demand is the relevant mechanism for aligning wages and
productivity and of achieving a high level of employment. Therefore, most
modern microeconomic research focuses on the role of the bargaining system in
allowing real wages to respond to shocks and adjusting flexibly to changes in
productivity, rather than on the role of mitigating fiscal and monetary policies.
Initially, this research began with the empirical observation that corporatist
countries (characterised by a high degree of centralisation of wage negotiations)
generally achieved lower unemployment rates. If wages increased faster than
productivity in such a highly centralised system, it was argued, there would be an
immediate effect on prices, which would offset any increase in real wages.
Calmfors and Driffill (1988) extended this view, in a well-known contribution to
the literature, highlighting the famous non-linear relationship between the degree
of centralisation of the bargaining system and employment levels. Under this
model both highly centralised systems and highly decentralised systems are able
to align wages and productivity ensuring a high level of employment, while
systems with intermediate levels of centralisation (e.g. with industry-level wage
bargaining) tend to result in wages set above a level that would ensure high
employment. The main reason is that a highly decentralised system of
negotiations, e.g. at firm level, leads to wage increases at or below the increase of
marginal productivity because individual firms would not be able to increase
prices on the goods markets. Rather, they would simply lose market share to
competitors offering close substitutes for their products.
This model has been put forward to explain why competitive systems like that of
the US achieved well-aligned wage and productivity increases, while coordinated
economies with industry-level wage bargaining (Germany in particular, has been
cited in this context), tended to experience wage increases above increases in
productivity, resulting in a poor employment performance. If negotiations take
place at sector level, the competition between firms offering close substitutes does
not apply, and there is no mechanism restraining union wage-setting to increases
below or close to productivity growth.
While the essence of the Calmfors and Driffill model dominates mainstream
economic thinking in this area, more recent extensions to this literature (e.g.
Fitzenberger and Franz, 2003, who consider the insider-outsider problem of wage
negotiations) cast doubt on the proposition that a fully decentralised system
Institute for Employment Studies 15
necessarily leads to superior employment outcomes than an intermediate system
operating at sector level. However, at the other end of the spectrum, there remains
little doubt that a highly centralised system of coordination is superior with regard
to ensuring that wage increases reflect productivity growth.
Key point
More recent developments in the economic literature highlight the nature of the bargaining regime as a key influence on medium-run outcomes. In particular bargaining systems that are either highly centralised at national level or highly decentralised can secure a closer link between wage growth and productivity, than intermediate models (based for example on sector-level bargaining). While there have been some challenges to this analysis, it has been widely used to explain inter-country differences in this area.
2.2.3 International competition
This emphasis on the level of collective bargaining appropriate to achieve wage
adjustments linked to productivity still guides much of the research on wage
flexibility, although it only holds for the case of a closed economy. Thus while the
predictions of Calmfors and Driffill might be expected to apply to the aggregate
EU economy, this may not be the case for individual EU member states, because
the common market introduced competition across countries and thus there is a
potential for substitution even for countries with industry-level wage bargaining.
The view in the economic literature seems to be that the introduction of the Euro
as well as increased global competition have made the particular system of wage
formation less relevant for the alignment of wages and productivity: indeed some
research (e.g. Danthine and Hunt, 1994) suggests that when consideration of the
wage bargaining process is extended to open economies, both key results from the
earlier literature (the relative superiority of coordinated wage negotiations, and
the notion that industry-level wage bargaining results in poor labour market
outcomes) may not apply when sectors are exposed to international competition.
"If the force of international competition is sufficiently strong (…) the margin for
manoeuvre left to the unions decreases considerably" (Danthine and Hunt 1994:
537).
Thus global competition can result in a clearer orientation of wage setting to
reflect productivity changes, even when operating at sector level. As argued by
Martin (1999), a possible effect of introducing the Euro would be to stimulate
international convergence of bargaining, thereby bringing wage outcomes closer
to those of decentralised negotiations (as in the US) unless, of course, there is a
shift towards sectoral or fully-coordinated negotiations at the aggregate EU level.
Key point

16 Wages, productivity and employment
The impact of global competition, as well as the coming together of countries in trading blocs or monetary union may weaken the validity of predictions based on different national bargaining structures. In particular, the alleged inferiority of sector-level bargaining as a mechanism for co-ordinating wage and productivity developments becomes less relevant (at least in sectors exposed to international competition).
2.3 Long run
2.3.1 The impact of wages growth on long-term productivity growth
Standard microeconomic models assume that technological change is exogenous
in the short- and medium-run. More recently, however, endogenous growth
theory rejects this assumption, on the basis that changes in factor use resulting
from factor price changes impact on technological progress. Unlike traditional
theory, endogenous growth models do not assume that marginal productivities
decrease at the aggregate level as they do at the microeconomic level of firms. In
this sense, productivity growth at the level of an economy results from investment
in capital stock at firm level, but diffusion and learning effects create non-private
returns and technological progress beyond the microeconomic entity (see Romer
1990). Unlike Solow-type growth models (Solow 1956), these models do not
predict that growth in productivity results in a steady state after some time, or that
productivity growth requires external changes in technological progress.
Assuming that the nature of technological change is endogenous in this way,
resulting from capital investments (depending on wages as well as capital costs)
helps explain why moderate bargaining outcomes (even wage increases below
productivity increases) may not be an effective mechanism to increase
employment. This could be the reason why even some countries with histories of
very moderate wage increases have not experienced the expected levels of
employment, e.g. Japan or Germany.
This is the starting point of a model developed by Hellwig and Irmen (2001), who
assume that firms' choices of innovation investments depend on both (real)
interest rates and (real) future wages. The set-up of the model is inter-temporal
and assumes rational expectations (i.e. anticipations of wage increases materialise
as actual wage increases). Under the usual profit-maximising framework, firms
anticipating a high level of future wages have incentives to invest in productivity-
enhancing innovations or be driven from the market. Therefore, a high growth
rate of wages leads to investments in productivity-enhancing capital. As in
standard theory, wages and productivity will be aligned in the long run, because
firms with productivity increases below the level of wage increases will eventually
be unable to pay their wage bills and go out of business.
Institute for Employment Studies 17
The verdict about aggressive wage policies derived from this kind of model is as
negative (for employment levels) as in the standard microeconomic theory, but the
underlying mechanism is different. Aggressive wage setting would result in
productivity-enhancing investments and productivity growth far above the
growth of aggregate demand, and:
"The shortfall of demand growth from productivity growth causes a shrinkage in
employment, even if wages and productivity grow at the same rate, and the
condition for employment neutrality (…) is satisfied". (Hellwig and Irmen 2001: 5)
It is worth noting that in these models employment outcomes result from changes
in aggregate demand (rather than supply) in a world deciding about real prices
and not (as in traditional Keynesian thinking) money wages as the key relevant
variables for employment contracts. The model is also consistent with
microeconomic theory in the sense that employment levels result from wages and
marginal productivity being aligned. And yet, the important finding is that
(although wages and productivity may be observed growing at the same rate in
practice), a simple microeconomic rule of thumb, based on targeting wage
increases below or at productivity increases may still fail to increase or sustain
employment once the inter-temporal effects of wage setting on capital
investments, productivity and output levels in subsequent periods are accounted
for. In consequence, consumption is
"not autonomous in the Keynesian sense [but] results from intertemporal
optimisation of households and firms and their coordination by interest rates"
(ibid.: 6).
This finding provides an alternative explanation of the poor employment
performance of Europe in the 1980s, despite relatively moderate wage increases.
Thus Hellwig and Irmen (2001) suggest that the expansive wage policies of the
1970s increased productivity so much that an output gap was opened, which
could not be subsequently closed. The declining labour share thereafter may:
"reflect the effects of the previous wage push on the development of labour
productivity (…), i.e. dynamic substitution effect" (ibid.)
Bester and Petrakis (2003) take a similar view. Here, too, the direction of causality
is questioned: while empirical observations might suggest that the ratio of wages
to labour productivity partly reflects an upskilling of the labour force and
improvements in labour productivity (e.g. through the adoption of new
technologies), the alternative view is always that higher wages can result in long-
run substitution away from labour through new technologies. There are some
empirical studies (see Chennels and van Reenen, 1997) in favour of this view.
While Bester and Petrakis (2003) assume some kind of dynamic innovation
process, there remains ultimately a cost-push effect of wages growth. Hence, long
18 Wages, productivity and employment
run productivity growth at the level of individual industries is driven by the
growth rate of wages.
Through this relationship, the argument suggests that the growth rate of wages
determines the number of active firms, their labour costs per unit of output, the
size of the firms and the output of the industry in the long run. The level of wages
is less relevant to aggregate employment in the long run, although it is still
important in determining the level of labour productivity and employment within
an industry.
Key points
Much recent theoretical analysis, including the so-called ‘endogenous growth’ literature challenges the assumption of traditional microeconomic analysis that technological change is exogenous (particularly in the long-run). In these models ‘excessive’ wage growth may be one of the factors stimulating capital investment in new technology. While, in some variants of these models, wages growth greater than productivity still leads to lower employment in the long-run (because of substitution effects towards capital and away from labour at the firm or industry level), in other variants the endogenous technological change generates externalities beyond the investing firm which benefit employment. An important conclusion is that the introduction of endogenous technological change in such models breaks the simple link between wages growth and employment growth (via productivity) and allows for the possibility that wage moderation below productivity growth at national level may fail to have the anticipated employment benefits.
2.3.2 Empirical evidence on the reverse causality
Millea (2002) reports empirical evidence6 about the bi-directional relationship
between wages and productivity, in particular considering the nature of the wage
setting process in different countries. The empirical evidence of this paper – as
well as that of a more in-depth study for Germany (Fuess and Millea 2006) – can
be interpreted in the light of efficiency wages, i.e. explaining productivity as
resulting from particular wage levels, for given characteristics of the labour
market (e.g. the total level of unemployment). It shows that the effects of
productivity on wages differ substantially between the six countries of the
analysis, but there is evidence for conventional wage bargaining following
productivity in most countries with the exception of the US. The authors interpret
this in the light of union coverage, with the US having the smallest share of
workers covered by collective bargaining. At the same time, the study shows the
6 Based on an analysis of time-series data to estimate long-run linear associations between
productivity and wage growth, separating the effects from productivity on wages from the
effect in the reverse direction and contemporaneous effects.
Institute for Employment Studies 19
evidence for efficiency wages being strongest in the US, Canada and Italy, the
countries with the shortest duration of unemployment benefits. Since longer
durations and more generous levels of unemployment benefits are likely to reduce
the ’efficacy of efficiency wage payments’, these findings are broadly consistent
with theory. More generous levels of unemployment benefits such as in Sweden or
France also correlate with a weak efficiency wage mechanism.
Overall, the evidence shows that the greater the union coverage the clearer is the
link between productivity and wages, i.e. it reflects a mechanism associated with a
conventional bargaining system, according to which unions take their share of
increases in productivity. The highly decentralised system of wage bargaining in
the US is consistent with an opposite direction of causality, however (in line with
efficiency wage setting).
Key point
While the research described above provides some evidence for the bi-directional wage-productivity relationship there is, it seems, no empirical research confirming a long-run relationship whereby wage growth increases productivity via inter-temporal substitution towards capital, which would link the generation of technological change to wage setting as suggested by endogenous growth theory.
2.4 Available empirical evidence and methodological problems
Turning now, in more detail, to empirical evidence in the research literature on the
relationship between wages and productivity growth, much of this relates to the
US. Most studies find increasing evidence that wages have grown below
productivity in the last 30 years and discuss this finding in the light of increasing
income inequality and not (as is typically found in the European debate: see Gros
2010) with regard to relative changes in a country’s competitive position.
Mishel and Shierholz (2011) describe a widening gap between growth rates of
productivity and wages (and labour compensation, including bonus payments).
Labour compensation growth was particularly low in the private sector, while the
growth of average wages was particularly weak for college educated public sector
workers.
Harrison (2009) reports a similar divergence between the growth of real earnings
and productivity in the US and Canada, but this results largely from rising
earnings inequality (i.e. increases in the top one per cent of the income distribution
alongside stagnant or falling income shares elsewhere). There are also, however,
important measurement issues affecting the observed decline in labour earnings,
e.g. when taking account of the depreciation of fixed assets, which has increased
20 Wages, productivity and employment
as a result of adoption of new technologies, and which has tended to push the
labour share downwards.
Fleck, Glaser and Sprague (2011) provide further evidence on a widening wage-
productivity gap, which began in the mid 1970s. However, they note that this may
also result, in part, from the measures of labour productivity not having been
adjusted for compositional changes in the workforce, and from the choice of
different price indices to adjust for inflation7.
Lopez-Villavicencio and Silva (2010) analyse a macroeconomic panel of OECD
countries between 1985 and 2007 finding that wage increases have exceeded
productivity growth for permanent workers, while the opposite is true for
temporary workers, in line with their the lower bargaining power. Given the great
inter-country variation of the share of temporary workers, this may be an
important reason explaining why the existence and size of the wage-productivity
gap varies between countries.
Key points
In our view, the evidence of the widening gap between wages and productivity is not robust with regard to the specific indicators chosen in many of the papers. In line with Feldstein (2008), we would highlight two major problems of the available descriptive evidence:
■ There are differences in the observed changes in price levels, affecting the growth rates presented in these essays. Using the Consumer Price Index (CPI) in order to obtain real wages and not output price indices results in lower growth rates, because the CPI rose more than output prices (in the US, see Feldstein 2008: 593). It would be more appropriate in the light of the theoretical link between productivity and wages to express both in real terms using output price levels.
■ Secondly, wages have grown on average less than total labour compensation because of changes in labour costs at the same time. Feldstein (2008) notes that "Because of the rapid growth of health insurance benefits and other fringe benefits, wage and salary payments declined from 89.4% of total compensation in 1970 to just 80.9% in 2006. As a result, the annual rate of increase in wage and salary payments was 0.3% less than the rate of increase in total compensation".
When both these factors are taken into account, the growth of labour compensation is actually quite similar to the growth of productivity. In addition, as was noted earlier, the observed growth of labour productivity is likely to overstate the change in marginal productivity, as it does not control for changes in the composition of the workforce or increases in capital costs. Given that most of the empirical descriptions
7 The compensation data have been adjusted based on the CPI, while a price deflator was used to
obtain real growth in output; an approach which has also been criticised in Feldstein (2008).
Institute for Employment Studies 21
in the literature do not fully address these weaknesses, the reported productivity trends are likely to be somewhat misleading indicators of true changes in labour productivity.
2.5 Policy rules for wage-setting in the light of economic theory
In this section we briefly consider the extent to which the policy rules for wage-
setting in relation to productivity, emerging from the theoretical discussions and
empirical evidence discussed above can be seen to influence policy debate in the
real world. To this end we highlight some relevant examples of such debate.
2.5.1 Facilitating wage moderation as an employment policy through institutional reforms: The German case
In most of its annual reports, the German Council of Economic Experts (CEE) has
emphasised the importance of wage moderation, i.e. that wages should grow
below productivity increases in order to increase employment levels. In
implementing this concept for policy purposes, as noted above, changes in price
levels as well as changes in productivity have to be modelled appropriately. This
is difficult in practice, because of two important problems:
■ First, some changes in price levels cannot be compensated for, either because
they are driven by taxation (and therefore not neutral in distributional terms),
or because exporting firms cannot achieve higher price levels on international
markets. In addition, wage-setting decisions in the real world are made under
uncertainty because they have to respond to anticipated rather than observed
price changes.
■ Second, observed changes in marginal productivity have to be interpreted in
the light of compositional changes to the workforce: lower productivity jobs
disappear, higher productivity jobs remain, but the effective productivity at the
workplace remains unchanged.
Since marginal productivity cannot be observed, it must be estimated. In practice,
the CEE assumes a particular production function8, implying, holding capital
8 A linear homogeneous function.
22 Wages, productivity and employment
constant, that the output change due to a change in labour input reflects the
marginal productivity of the factor9.
The CEE advocated wage moderation as a policy in order to increase employment
from the mid-1990s, and, although basic wages increased only very moderately
since then, there were nevertheless higher than employment-neutral increases in
labour costs per employee, caused by increases in social insurance contributions.
Thus, the German case also shows that the adoption of wage moderation as a basis
for an employment policy requires a clearer analysis of the total labour
compensation rather than the wage. As Feldstein (2008) notes, the percentage of
wages as a component of total compensation has gone down in many countries,
and measured wage growth may no longer be a good representation of the total
growth rate of labour compensation.
A comparatively weak Euro in the early 2000s, coupled with changes to
unemployment benefits systems and continued institutional reforms reducing
union bargaining power through further deregulation (e.g. in order to facilitate
fixed-term employment), contributed to a situation of relatively weak increases in
German labour costs in the 2000s. With the exception of Japan, no other country
has achieved such low increases in labour costs per employee, but nonetheless, the
employment gains in Germany were fairly modest until very recently.
2.5.2 Setting minimum wages to achieve poverty reduction without losing low-productivity jobs
Standard microeconomic theory also plays an important role in setting minimum
wages, which exist in the majority of the EU member states. Eurofund (2009)
provides a thorough description of the existing minimum wage regimes, which
consist either of systems of indexation (in most countries by aligning minimum
wage increases to price changes and some increment related to estimated increases
in workers’ productivity), or of collective bargaining agreements declared as the
wage floor for specific sectors (e.g. in Austria, Denmark, Finland, Germany, Italy
and Sweden). The coverage of minimum wages varies widely, with more workers
9 Empirically, this marginal productivity corresponds to the wage share. The change rate of
marginal productivity is therefore estimated as the sum of the change rate of the wage share
and the growth rate of average productivity. This growth rate of productivity is corrected for
the change of employment as the observed growth rate of productivity plus the change rate of
employment multiplied by one minus the wage share. Finally, adding the average change rate
of the wage share to the growth rate of productivity, correcting for employment change, results
in an estimate of the change rate of the marginal productivity of labour accounting for
employment changes, which is the relevant measure for wage bargaining, according to the CEE.
Institute for Employment Studies 23
covered in the Eastern European member states (but also in France) and relatively
fewer in most other European countries (often less than 5 per cent of the
workforce).
In recent years, there has been a lot of debate about the introduction of statutory
minimum wages and the levels at which they should be set, and there are two
prominent examples that show the trade-off between reducing poverty and
putting employment opportunities at risk:
■ In Germany, there is currently a lively academic and policy debate about
introducing a statutory minimum wage at the level of the whole economy
rather than the sector level (where minimum wages can already be created by
the Federal Government by declaring collective bargained agreements as
generally-binding wage floors). While some simulations indicate that
introducing a level of €7.50 per hour throughout the economy would not result
in significant changes in the average hourly pay in the economy, it would
increase labour costs very substantially at the lower end of the wage
distribution, in particular in East Germany and, due to the nature of the gender
pay distribution, would affect the female workforce more than men (Müller and
Steiner 2008). Since wages would increase, some economists have argued that
many of these employment opportunities would be at risk (Franz 2007: 435), a
finding reinforced by some sector studies of binding collective agreements (e.g.
Möller and König 2008, but only for East Germany). In contrast, Möller (2008)
argues that the introduction of a minimum wage below a certain level would be
either neutral or even increase employment, while negative effects would
dominate only for a too high level of minimum wage.
■ The employment neutrality of the introduction of a minimum wage at an
appropriate level is consistent with the findings in the United Kingdom, where
a national minimum wage was been introduced in 1999, with some
differentiation by age bands, but of a generally binding nature for all sectors of
the economy. While it substantially increased the relative pay level of the
lowest pay workers and reduced the gender pay gap, no significant effects on
employment have been found by a range of studies, and the most pessimistic
predictions of employer organisations and others who opposed its introduction
have certainly not been realised. According to Metcalf (2008), the lack of
employment effect did not result from being set at a level which was generally
"too-low-to-matter”: it now affects about 10% of the employed workforce and
has risen substantially over time. There is also only weak evidence that the lack
of employment impact resulted from non-compliance and the mitigation of
negative effects by the Tax Credit system which was introduced over the same
period. The more likely explanation of the employment neutrality of the UK
National Minimum Wage is that it may have increased productivity through
24 Wages, productivity and employment
capital investments and improvements in work organisation (in line with
efficiency wage theory as outlined above). At the same time, there is also
evidence that the price changes resulting from the introduction of the minimum
wage were to some extent passed on to the goods markets, especially in labour-
intensive sectors.
2.6 Summary
As has suggested by Figure 1.1 in the introduction, the strong empirical link between wages and productivity is consistent with economic theory. Other than through the operation of labour laws and social insurance (which indirectly influence bargaining power) or by setting minimum wages, it would seem that the influence of public policy in the formation of this relationship is fairly limited in the short as well as in the medium and long run.
In the short run, the idea that wages are related to marginal products is plausible and, under assumptions of perfect competition, wage moderation would indeed translate into output expansion. However, the increase in production would also increase labour demand, which is likely to offset this effect, at least in part, because it would entail further upward pressure on wages. Whether or not downward wage adjustments (or wage increases below productivity growth, as in the US following the recent recession) are feasible in practice depends very much on the flexibility of labour market institutions. These would need to facilitate flexibility and/or involve social partners endorsing high levels of employment as a target in wage-setting. Again the influence of public policy here is rather limited, e.g. to setting minimum wages or to the decision of whether to introduce them at all.
In the medium run, wage negotiations (in particular under international competition) link wages and productivity irrespective of the level and structure of bargaining processes. If wage growth exceeds productivity growth due to exogenous increases in aggregate demand, as observed before the 2008-2010 recession in some European countries (e.g. due to cheap credit in Greece for consumption or in
Spain/Ireland for construction spending10), the likely implication is that wage
moderation in the following period will re-establish this close relation. Neither long-term employment-increasing wage-moderation as in Germany (where wages in the
most recent period increased faster than productivity11), nor wage increases above
productivity growth are likely outcomes in the medium run, because international competition tends to force alignment between wages and productivity. Such an
adjustment appears to be currently under way in Ireland12, where labour costs and
wages are decreasing while productivity increases substantially, realigning wages and productivity once more.
10 See Figure 3.9 below, and compare with Gros 2010: 2
11 See Figure 3.13 and Figure 3.14 below
12 See Figure 3.14 below

Institute for Employment Studies 25
In line with the predictions of endogenous growth models, long run productivity increases depend on capital investment, which itself is partly an outcome of wage growth of the past. Even a moderate/employment-neutral or employment-increasing wage policy with wage increases below productivity growth would fail to increase employment if wages set in the past had caused productivity increases exceeding increases in aggregate demand. Under such circumstances, even wage moderation would no longer be a useful policy instrument to increase employment.
26 Wages, productivity and employment
3 Analysis of international data
In this chapter, building on the review of the literature reported in the previous
chapter we look at the development of potential indicators for regular monitoring
of wage and productivity data for policy purposes.
We then go on to report some simple descriptive analyses of recent trends in and
patterns of wages and productivity growth, across a range of advanced economies
(both EU member states and a selection of other OECD members), and interpret
these trends and patterns in the light of the theoretical and empirical literature.
3.1 Indicators
3.1.1 Productivity
In the following analysis, productivity is measured by observed Gross Domestic
Product per hour of work in the economy (GDP/h) using data obtained from the
Conference Board – a business-financed research organisation – covering the
period up to the end of 2010. These data are internationally adjusted using
Purchasing Power Parities (EKS), resulting in ’international’ dollars and were
adjusted to 2010 real prices13. The resulting time series as shown in Figure 3.1,
which was included in the thematic paper by Meager and Higgins (2010), shows
that labour productivity in the EU remained below the US level for the available
time series.
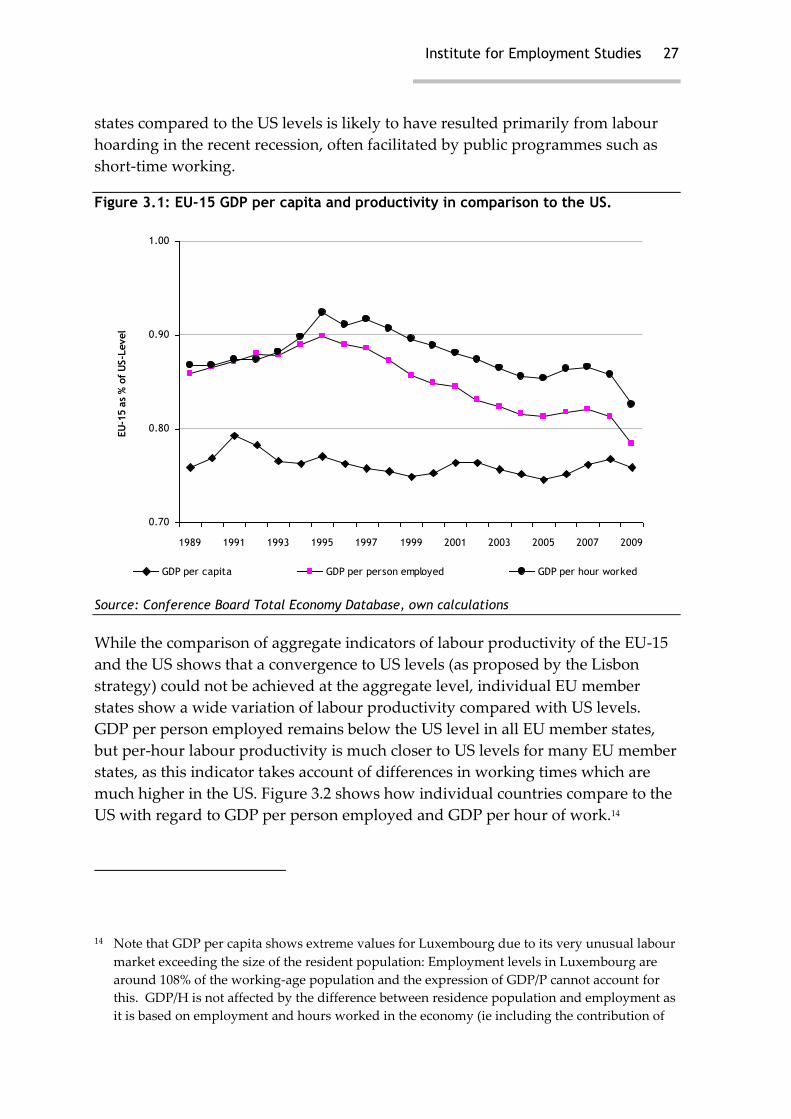
As described in Meager and Higgins (2010), the remarkable recent decline of
hourly productivity and productivity per person employed of the EU-15 member
13 The data were downloaded from "The Conference Board Total Economy Database"
(http://www.conference-board.org/data/economydatabase/) in March 2011.
Institute for Employment Studies 27
states compared to the US levels is likely to have resulted primarily from labour
hoarding in the recent recession, often facilitated by public programmes such as
short-time working.
Figure 3.1: EU-15 GDP per capita and productivity in comparison to the US.
0.70
0.80
0.90
1.00
1989 1991 1993 1995 1997 1999 2001 2003 2005 2007 2009
EU
-15 a
s %
of
US-L
evel
GDP per capita GDP per person employed GDP per hour worked
Source: Conference Board Total Economy Database, own calculations
While the comparison of aggregate indicators of labour productivity of the EU-15
and the US shows that a convergence to US levels (as proposed by the Lisbon
strategy) could not be achieved at the aggregate level, individual EU member
states show a wide variation of labour productivity compared with US levels.
GDP per person employed remains below the US level in all EU member states,
but per-hour labour productivity is much closer to US levels for many EU member
states, as this indicator takes account of differences in working times which are
much higher in the US. Figure 3.2 shows how individual countries compare to the
US with regard to GDP per person employed and GDP per hour of work.14
14 Note that GDP per capita shows extreme values for Luxembourg due to its very unusual labour
market exceeding the size of the resident population: Employment levels in Luxembourg are
around 108% of the working-age population and the expression of GDP/P cannot account for
this. GDP/H is not affected by the difference between residence population and employment as
it is based on employment and hours worked in the economy (ie including the contribution of
28 Wages, productivity and employment
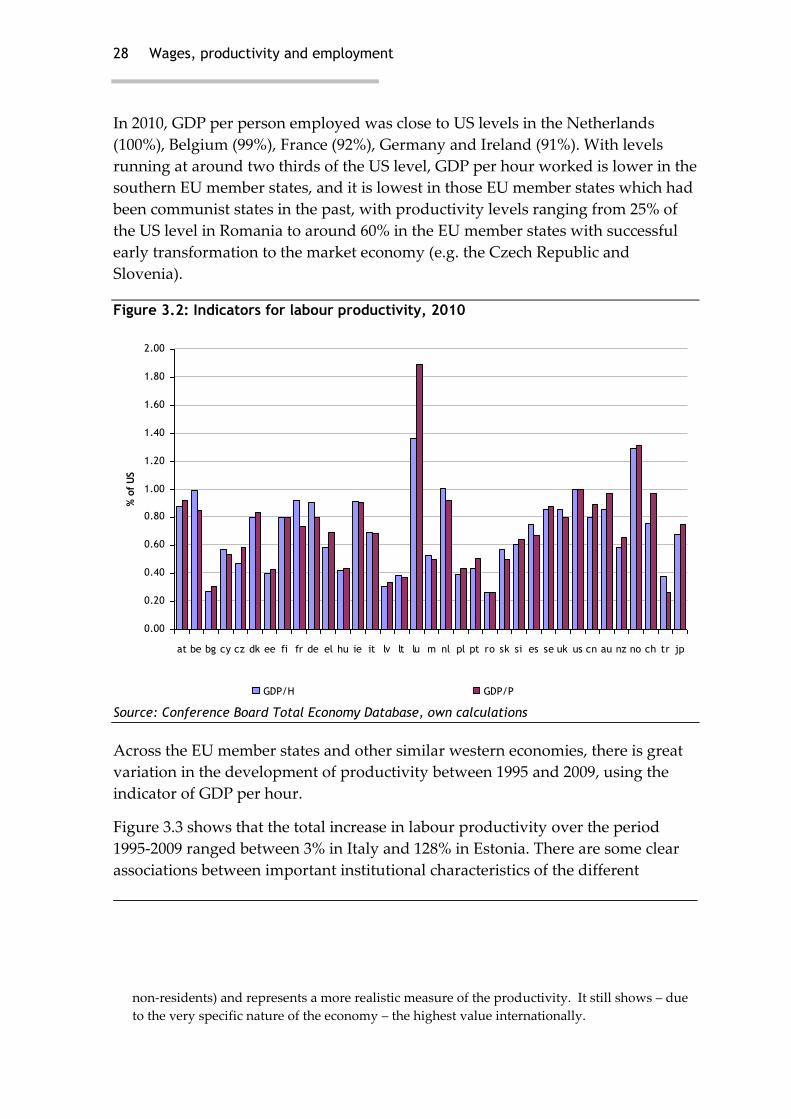
In 2010, GDP per person employed was close to US levels in the Netherlands
(100%), Belgium (99%), France (92%), Germany and Ireland (91%). With levels
running at around two thirds of the US level, GDP per hour worked is lower in the
southern EU member states, and it is lowest in those EU member states which had
been communist states in the past, with productivity levels ranging from 25% of
the US level in Romania to around 60% in the EU member states with successful
early transformation to the market economy (e.g. the Czech Republic and
Slovenia).
Figure 3.2: Indicators for labour productivity, 2010
0.00
0.20
0.40
0.60
0.80
1.00
1.20
1.40
1.60
1.80
2.00
at be bg cy cz dk ee fi fr de el hu ie it lv lt lu m nl pl pt ro sk si es se uk us cn au nz no ch tr jp
% o
f U
S
GDP/H GDP/P
Source: Conference Board Total Economy Database, own calculations
Across the EU member states and other similar western economies, there is great
variation in the development of productivity between 1995 and 2009, using the
indicator of GDP per hour.
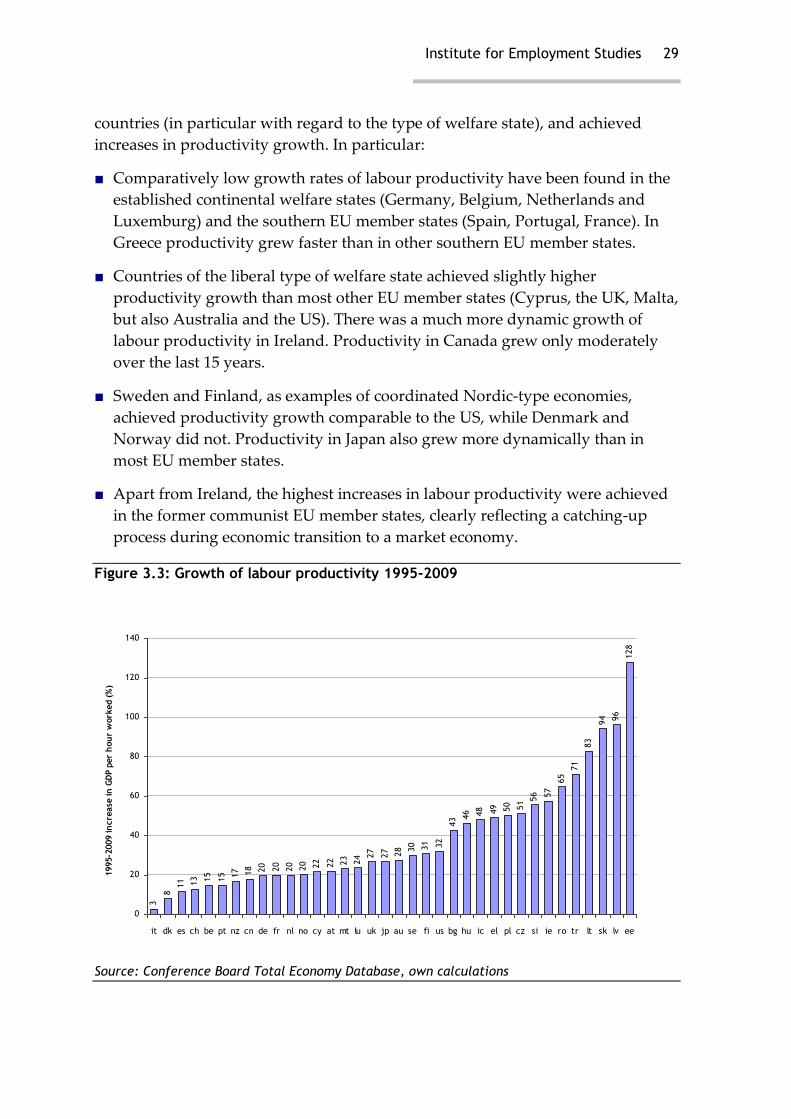
Figure 3.3 shows that the total increase in labour productivity over the period
1995-2009 ranged between 3% in Italy and 128% in Estonia. There are some clear
associations between important institutional characteristics of the different
non-residents) and represents a more realistic measure of the productivity. It still shows – due
to the very specific nature of the economy – the highest value internationally.
Institute for Employment Studies 29
countries (in particular with regard to the type of welfare state), and achieved
increases in productivity growth. In particular:
■ Comparatively low growth rates of labour productivity have been found in the
established continental welfare states (Germany, Belgium, Netherlands and
Luxemburg) and the southern EU member states (Spain, Portugal, France). In
Greece productivity grew faster than in other southern EU member states.
■ Countries of the liberal type of welfare state achieved slightly higher
productivity growth than most other EU member states (Cyprus, the UK, Malta,
but also Australia and the US). There was a much more dynamic growth of
labour productivity in Ireland. Productivity in Canada grew only moderately
over the last 15 years.
■ Sweden and Finland, as examples of coordinated Nordic-type economies,
achieved productivity growth comparable to the US, while Denmark and
Norway did not. Productivity in Japan also grew more dynamically than in
most EU member states.
■ Apart from Ireland, the highest increases in labour productivity were achieved
in the former communist EU member states, clearly reflecting a catching-up
process during economic transition to a market economy.
Figure 3.3: Growth of labour productivity 1995-2009
3
8
11 13 15
15 17 18 20 20
20 20 22 22 23 24 2
7
27 28 30 31 32
43 4
6 48 49 50 51 5
6 57
65
71
83
94 96
128
0
20
40
60
80
100
120
140
it dk es ch be pt nz cn de fr nl no cy at mt lu uk jp au se fi us bg hu ic el pl cz si ie ro tr lt sk lv ee
1995-2
009 in
cre
ase
in
GD
P p
er
hou
r w
ork
ed (
%)
Source: Conference Board Total Economy Database, own calculations
30 Wages, productivity and employment
3.1.2 Wages and labour costs
We reviewed previous empirical studies in section 2.4 which showed that (notably
in the US) wages have not increased as much as productivity for many years. It is
likely that simultaneous changes on the aggregate labour market may have
contributed to these developments, including wage growth being dampened as a
result of labour supply expansion (through increased female participation or
immigration). Nevertheless, it seems that at least some of the observed wage-
productivity gap (and associated fall in the labour share) is a statistical artefact
due to qualitative changes in compensation packages. Focusing on wages may not
tell the full story about developments in labour costs for two important reasons:
■ First, there is a growing importance of variable compensation elements in
many countries. While wages represent regular payments (e.g. basic wages,
cost-of-living allowances and other guaranteed and regularly paid allowances),
total earnings additionally incorporate overtime payments, bonuses and
gratuities regularly and irregularly paid, remuneration for time not worked and
payments in kind (OECD 2011).15 Not fully accounting for these additional
elements biases wages data downwards, especially in countries with an
established history of performance elements to pay like the US and some other
Anglo-Saxon economies. In such cases, the choice of wages as an indicator
would understate the true factor costs.
■ Second, even total earnings understate the true factor costs, insofar as they do
not include employer contributions to statutory social security schemes,
private insurance, unfunded employee social benefits paid by employers for
children/spouses/family, education or other allowances in respect of
dependants, payments made to workers because of illness, accidental injury,
maternity leave, etc. This, for example, would bias the labour cost measure
downwards in countries with substantial employer contributions to mandatory
social insurance, particularly relevant in continental Europe.
For these reasons it is also important to look at measures of total compensation
which are included in some data sets such as those of OECD. Even this measure
may not represent total labour costs, which would additionally include the cost of
vocational training, other welfare costs (e.g. cost of canteens), costs of transport of
workers, cost of work clothes, cost of recruitment and some specific taxes.
However, it is likely to be very difficult to compare these other elements of total
labour costs internationally, because of institutional differences between countries
15 http://stats.oecd.org/mei/default.asp?lang=e&subject=11
Institute for Employment Studies 31
(e.g. with regards to vocational training), and because consistent measures are not
readily available in comparative datasets.
For the empirical analysis presented here, therefore, we rely on OECD data on
both the growth of average wages for a full-time equivalent in the economy and
total labour compensation per employee. We look at developments in these data
for EU member states and a selection of other major economies, namely the US,
Canada, Japan, Australia and New Zealand and non-EU European countries.
Growth rates of wages and labour compensation per employee were derived from
variables shown in 2008 USD PPPs and 2008 constant prices. Labour
compensation per employee was used instead of hourly labour compensation
because the latter is available for fewer countries16.
3.1.3 Basic description of potential indicators and further issues
In the following, we describe the growth of productivity, average wages and
labour compensation per employee for our sample of countries in order to
understand whether the relationships in the data reflect those hypothesised in the
economic literature.
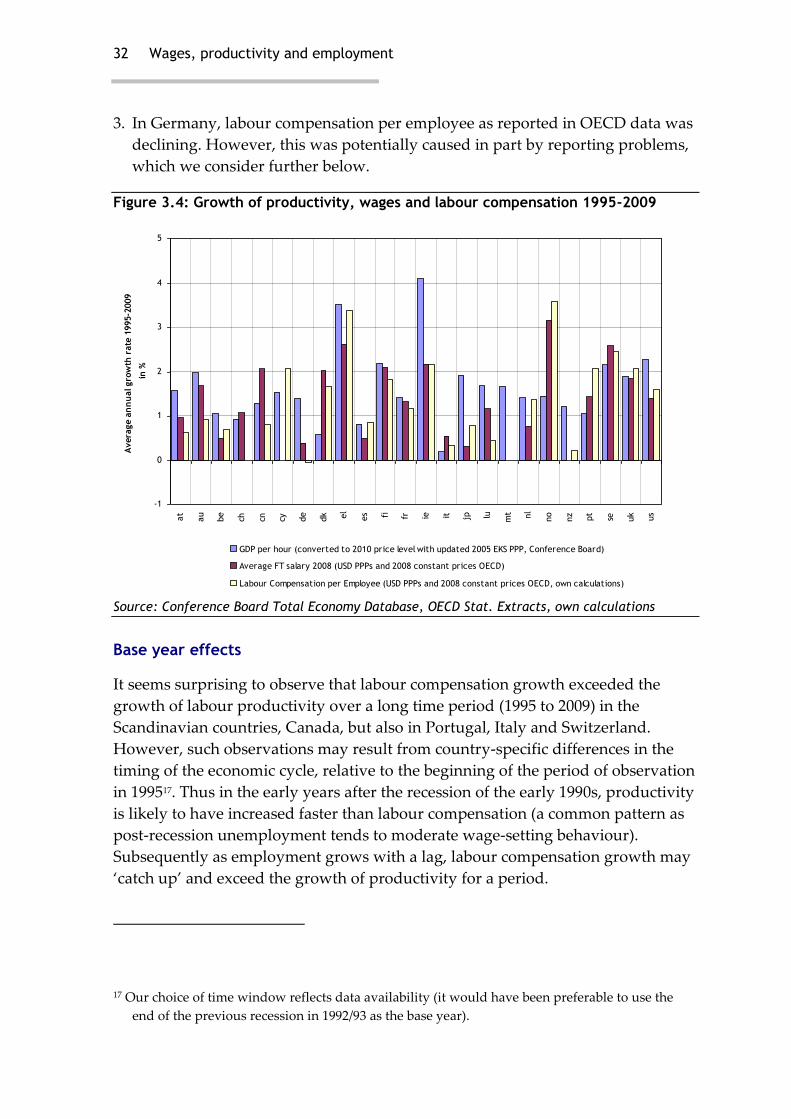
Figure 3.4 shows that GDP per hour has grown around 1.64% per year on average
in the different countries over the period 1995-2009. The growth of full-time wages
and labour compensation per employee remained slightly below this level, with
average annual rates of 1.41% and 1.46% per year. However, there are some
interesting further observations:
1. In Sweden, Canada, Denmark, Norway, Italy and Switzerland, real wages grew
faster than GDP per hour, which may partly reflect country-specific differences
in the economic cycle considered further below (e.g. for Sweden which
experienced a particularly severe economic crisis in the early 1990s, following
which wage growth is likely to have lagged productivity growth by several
years).
2. In most cases, the growth of labour compensation per employee was less than
wages growth, with important exceptions like the UK, US, Japan where variable
compensation/performance pay is more relevant. However, compensation also
grew faster than wages in Greece, Norway and the Netherlands.
16 In practice, given that there were no substantial falls in working time over the period of
observation, this is likely to be an acceptable indicator for current purposes, although a per-
hourly indicator would clearly be preferable.
32 Wages, productivity and employment
3. In Germany, labour compensation per employee as reported in OECD data was
declining. However, this was potentially caused in part by reporting problems,
which we consider further below.
Figure 3.4: Growth of productivity, wages and labour compensation 1995-2009
-1
0
1
2
3
4
5
at
au
be
ch cn cy de
dk el
es fi fr ie it jp lu mt nl
no
nz pt
se uk us
Avera
ge a
nn
ual gro
wth
rate
1995-2
009
in %
GDP per hour (converted to 2010 price level with updated 2005 EKS PPP, Conference Board)
Average FT salary 2008 (USD PPPs and 2008 constant prices OECD)
Labour Compensation per Employee (USD PPPs and 2008 constant prices OECD, own calculations)
Source: Conference Board Total Economy Database, OECD Stat. Extracts, own calculations
Base year effects
It seems surprising to observe that labour compensation growth exceeded the
growth of labour productivity over a long time period (1995 to 2009) in the
Scandinavian countries, Canada, but also in Portugal, Italy and Switzerland.
However, such observations may result from country-specific differences in the
timing of the economic cycle, relative to the beginning of the period of observation
in 199517. Thus in the early years after the recession of the early 1990s, productivity
is likely to have increased faster than labour compensation (a common pattern as
post-recession unemployment tends to moderate wage-setting behaviour).
Subsequently as employment grows with a lag, labour compensation growth may
‘catch up’ and exceed the growth of productivity for a period.
17 Our choice of time window reflects data availability (it would have been preferable to use the
end of the previous recession in 1992/93 as the base year).
Institute for Employment Studies 33
A similar effect of using 1995 as the base year is likely to apply to the observed
growth rates of labour productivity, wages and labour compensation in the former
communist countries. Due to economic restructuring following transformation to
market economies, these countries show exceptionally high growth rates and
equally, labour compensation growth may follow productivity growth.
Equity-based labour compensation
Some elements of labour compensation, in particular those based on stock options
or the productive capital of firms, may not be fully accounted for in standard
statistical definitions. Many large, publicly-listed firms implement compensation
plans based on capital stock, which link performance outcomes (e.g. increases in
the firm’s market values) to labour compensation either by allowing employees to
become shareholders or through remuneration based on stock option plans. Such
payments often cannot be clearly separated into labour or capital income, because
of institutional factors (e.g. specific taxation arrangements) or because they
establish long-term incentives, requiring employees to hold shares for some time
under which pay-offs attributable to labour inputs may materialise only after a
significant time lag (e.g. when options are vested). Equity-based compensation
may be categorised in technical terms as part of the firm's capital stock, and is in
any case, unlikely to be reported consistently across countries. This issue is, in
particular, likely to bias downwards the data from the US, where long-term
incentives can be extensive. More generally, there are reported problems with the
consistency of OECD indicators, because they exclude some compensation
elements in some countries18 or for a part of the time-series.
Key point
In our view, structural under-reporting of different elements of labour compensation, which varies between countries and over time, substantially limits the conclusions which can be drawn from international comparisons of indicators like wages or total labour compensation per employee.
3.1.4 Alternative indicators
Given the strengths and weaknesses of the core indicators for wages and
productivity discussed above, it is also worth briefly considering some of the
18 The OECD lists a number of exceptions from international reporting standards
(http://stats.oecd.org/mei/default.asp?lang=e&subject=11), but the most important are
potentially that bonuses regularly paid are excluded for Belgium, France, Germany (and those
irregularly paid for Estonia, Greece, Portugal).
34 Wages, productivity and employment
alternative measures which might throw further light on the underlying
relationships.
Wage share as a percentage of GDP
Another potentially relevant indicator in the light of wage growth is the
development of the wage share (or labour share) as a percentage of GDP.
If achieved increases in productivity result in a corresponding increase in real
wages, the labour share of GDP should remain unchanged. Short-term wage
increases above the level of productivity are likely to increase the labour share of
GDP, an observation found for many of the EU member states between the mid-
1960s and the mid-1970s (European Commission 2007: 241-243) 19. In the longer-
run, however, changes in production technology will have an effect, and a short-
run increase in the wage share (due, for example, to aggressive wage policies) may
ultimately be offset if employment declines because of this. It is interesting to note
that following the earlier growth in the labour share, such employment reductions
seem to have cancelled this gain in the labour share entirely, and labour shares in
the 1990s are similar to those of the 1960s and have been falling slightly since in
most countries.
The wage share has been extensively discussed in the Employment in Europe
(EiE) report 2007 (European Commission 2007: 237) as a measure of the
distribution of national incomes to capital and labour and in light of the increasing
concerns that workers "are not getting their fair share of the gains from technological
progress and globalisation" (ibid.). Therefore, the labour share was – and still is –
widely regarded as important for social cohesion.
In principle, a declining labour share would indicate that labour obtains less of the
production output as factor remuneration. Kaldor's (1963) famous observation that
the wage share was more or less constant over time has not been confirmed in
practice, and there were substantial increases in the labour shares in the late 1960s
and early 1970s, which have been described in detail in the EiE report. Glyn (n.y.)
reviews some international developments which help to explain the reduction in
the wage share, in particular the loss of wage bargaining power in the context of
more global competition, but he attributes little weight to other possible
explanations such as higher levels of labour taxation and unemployment benefits.
19 Indeed, if we do not assume perfect competition (e.g. if price increases can be achieved on the
goods market), medium run increases in the labour share of this kind are consistent with theory.
Institute for Employment Studies 35
Figure 3.5 shows that wage shares (indicated by markers related to the right axis) of
countries used in this analysis are spread around 65% of GDP in most cases, with
some exceptions: The UK records a comparatively high wage share of 71% (as
does Switzerland with 76%) in 2008. Most of the eastern EU member states report
relatively low labour shares of 60% and below.
The flexibility of the wage bargaining system cannot on its own explain inter-
country variations in wages share of the GDP, e.g. Germany and the US show
exactly the same share of 63%, although traditionally German unions and sectoral
bargaining systems were believed to have generated comparatively strong
bargaining power.
As a second relevant measure, Figure 3.5 also shows the change in the wage share
between 1990 and 2008, which was on average a reduction of around 4 percentage
points. The major EU economies, the UK, France and Germany, have experienced
a reduction of 4 percentage points and Italy of 7 percentage points. Compared
with this, the US and Japan have observed reductions of 2 percentage points,
while no clear pattern is observable for the smaller EU member states, including
the former communist EU member states in Eastern Europe. Although some of the
latter show very substantial reductions in the labour share (e.g. Poland, Hungary
and Slovenia), others show only very moderate decreases (e.g. Slovakia: 3
percentage points) or even increases (the Czech Republic, Lithuania, Latvia).
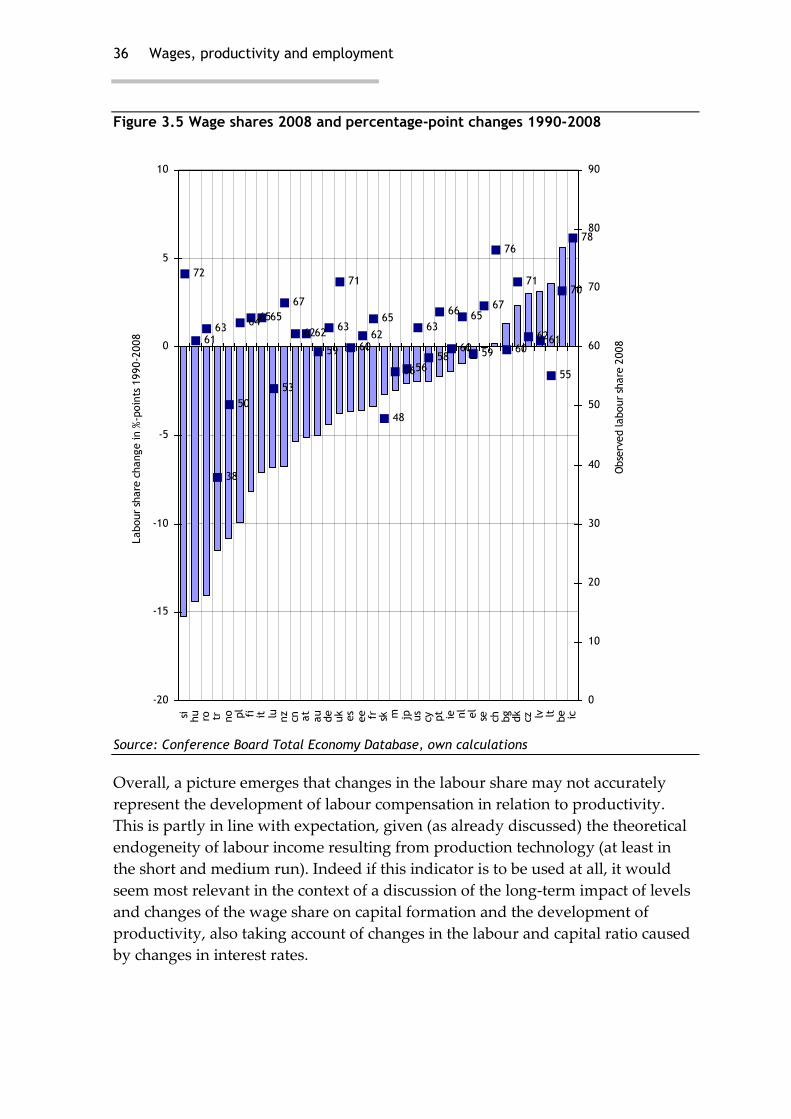
36 Wages, productivity and employment
Figure 3.5 Wage shares 2008 and percentage-point changes 1990-2008
72
6163
38
50
646565
53
67
6262
59
63
71
6062
65
48
5656
63
58
66
60
65
59
67
76
60
71
6261
55
70
78
-20
-15
-10
-5
0
5
10si hu ro tr no pl fi it lu n
zcn a
tau
de
uk es
ee fr sk m jp us
cy pt ie nl
el
se ch bg
dk
cz lv lt be ic
Labour
share
change in %
-poin
ts 1
990-2
008
0
10
20
30
40
50
60
70
80
90
Obse
rved labour
share
2008
Source: Conference Board Total Economy Database, own calculations
Overall, a picture emerges that changes in the labour share may not accurately
represent the development of labour compensation in relation to productivity.
This is partly in line with expectation, given (as already discussed) the theoretical
endogeneity of labour income resulting from production technology (at least in
the short and medium run). Indeed if this indicator is to be used at all, it would
seem most relevant in the context of a discussion of the long-term impact of levels
and changes of the wage share on capital formation and the development of
productivity, also taking account of changes in the labour and capital ratio caused
by changes in interest rates.
Institute for Employment Studies 37
In addition, there are some (more severe) problems associated with the labour
share as a potential indicator for monitoring purposes, which arise from the
statistical construction of the indicator:
■ First, changes in employment structure, e.g. reductions in working time and the
extent of part-time work, cannot be controlled for in this indicator (although
they can be in constructing some of the other indicators such as hourly wages or
average labour compensation at the level of national aggregates). While it is
possible to hold the structure of employment constant and to report a wage
share unaffected by employment growth, in this case the choice of the base year
affects the development of the wage share.
■ Second, in order to measure labour income in the first place, it is necessary to
construct a ‘wage’ for self-employed or family members working in self-
employed business without a clearly observed income (usually assumed to be
equivalent to some kind of average wage). Given the significant role of self-
employment in some economies and the big inter-country differences in the
self-employment rate, this further detracts from the use of this indicator for
monitoring purposes.
■ Third, this indicator also shares some of the other weaknesses of wages data
discussed above, for example, the fact that reported labour incomes in different
countries may not include (or may include to differential extents) some of the
non-wage elements, and this is an issue of greater relevance in a world in which
equity-based compensation and other non-wage elements of remuneration
packages become more important in many countries.
Key point
In sum – and in addition to the theoretical problems with the indicator – the wage share and trends in it are just too inaccurate measures to contribute to a useful understanding of changes in labour costs and remuneration relevant to quantities of production or levels of employment. This is particularly true if non-standard elements of remuneration are taken into account.
Unit labour costs
Unit labour costs offer an alternative view into the growth of labour
compensation, which expresses the ratio of wages/labour costs to total GDP. This
indicators, too, has to account for labour compensation of self-employed and
usually corrects for the level of self-employment in the economy either by adding
"hypothetical" wages for the self-employed or by re-weighting the observed unit
labours costs to account for the self employed.
38 Wages, productivity and employment
Unit labour costs can be expressed as nominal or real unit labour costs by either
relating wage costs to the real or nominal GDP:
■ Nominal wage costs represent the ratio based on the real GDP;
■ Real wage costs express the ratio based on nominal values as the contribution of
labour to total output, which can be observed by the total wages observed in
the economy.
Internationally, there are different methods in use in order to adjust the real unit
labour costs for the problem that wages cannot be observed for the self employed,
either by assuming some kind of average wage that can be applied to the self
employed or by correcting the measure obtained from relating nominal wage costs
to GDP or Gross Value Added. Eurostat and the ECB use an indicator of unit
labour costs as re-weighting the real wage costs are expressed in the above by
multiplying them with a correction factor that shows total employment including
self-employment as a percentage of the employees. While Eurostat data are
available for all EU member states, other European countries and Japan20, there are
no such data available for the US, Canada, Australia and New Zealand. We
therefore decided to rely on information for unit labour costs from OECD
Statistics.21
The potential difficulties with this indicator are very similar to those discussed
above in the context of the wages share (e.g. relating to the role of self-
employment, and to non-standard elements of remuneration). For these reasons
we discuss only briefly in section 3.3.3 below OECD data on the ratio of labour
costs and real output (based on an index with 2005 as the base year of real output).
20http://epp.eurostat.ec.europa.eu/tgm/download.do;jsessionid=9ea7971b30dc5f7331a6582841a1b4d
58ac5cc34f3f6.e34RaNaLaN0Mc40LcheTaxiLbN8Se0?tab=table&plugin=1&language=en&pcode
=tsieb070
21 Note that the OECD Data also include a correction for labour costs of self-employed, by
assuming "that labour compensation per hour or per person is equivalent for the self employed
and employees of businesses. This assumption may be more or less valid across different
countries and economic activities thus affecting the comparability of unit labour cost level data."
(http://stats.oecd.org/OECDStat_Metadata/ShowMetadata.ashx?Dataset=ULC_ANN&Coords=[
SUBJECT].[ULABUL99]&Lang=en&)

Institute for Employment Studies 39
Real exchange rates
An analysis of real effective exchange rates could potentially complement the
analysis of the relation of wages and productivity with regards to their impact on
a particular country's competitiveness. Real effective exchange rates capture both
■ the development of a domestic currency relative to the currencies of other
countries and
■ changes in the domestic price level.
In order to derive the real effective exchange rate, the domestic currency is
compared to a basket of other currencies and then deflated by nominal unit labour
costs: Eurostat compares a domestic currency with the other EU member states
and Australia, Canada, United States, Japan, Norway, New Zealand, Mexico,
Switzerland, and Turkey, ie provides a weighted multilateral exchange rate of any
EU member state relative to this basket. The weighting of the different exchange
rates the countries' different shares of either exports or imports or both. As an
example, one would consider an export-based weighting for one particular
country in order to understand a change in national competitiveness on
international markets for domestic products22. Such a weighted multilateral
exchange rate would correspond to a nominal effective exchange rate.
If price levels in the domestic economy and in the other areas of the currency
basket are developing at the same rate, the nominal and the real effective exchange
rates are identical. However, if labour costs (and correspondingly prices) were
increasing at a higher rate in some countries than in others, the real effective
exchange rates would differ. This is immediately apparent for the countries of the
Euro area: Since the nominal exchange rates are fixed, a higher increase in the
domestic price level of one of the member states than in the others would result in
imported products to become relatively more attractive to consumers and hence,
this domestic economy would lose in competitiveness. Within the aggregate area
obviously, a gain in competitiveness of one country the results in a loss of
competitiveness in another. Eurostat reports REERs for the EU member states and
other important economies as Index values (1999 corresponding to 100%), which
are shown in Table 3.1 below for selective years.
22 See for a concise definition of the REER provided by Eurostat:
http://epp.eurostat.ec.europa.eu/portal/page/portal/product_details/dataset?p_product_code=T
SDEC330
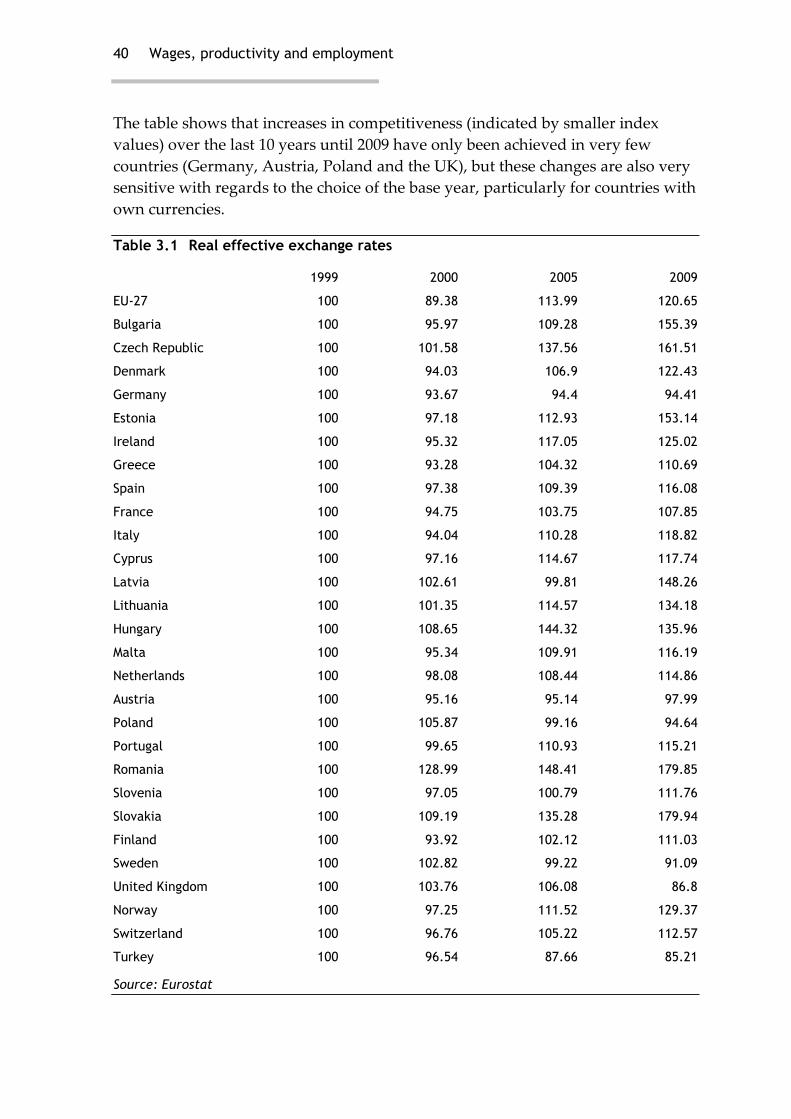
40 Wages, productivity and employment
The table shows that increases in competitiveness (indicated by smaller index
values) over the last 10 years until 2009 have only been achieved in very few
countries (Germany, Austria, Poland and the UK), but these changes are also very
sensitive with regards to the choice of the base year, particularly for countries with
own currencies.
Table 3.1 Real effective exchange rates
1999 2000 2005 2009
EU-27 100 89.38 113.99 120.65
Bulgaria 100 95.97 109.28 155.39
Czech Republic 100 101.58 137.56 161.51
Denmark 100 94.03 106.9 122.43
Germany 100 93.67 94.4 94.41
Estonia 100 97.18 112.93 153.14
Ireland 100 95.32 117.05 125.02
Greece 100 93.28 104.32 110.69
Spain 100 97.38 109.39 116.08
France 100 94.75 103.75 107.85
Italy 100 94.04 110.28 118.82
Cyprus 100 97.16 114.67 117.74
Latvia 100 102.61 99.81 148.26
Lithuania 100 101.35 114.57 134.18
Hungary 100 108.65 144.32 135.96
Malta 100 95.34 109.91 116.19
Netherlands 100 98.08 108.44 114.86
Austria 100 95.16 95.14 97.99
Poland 100 105.87 99.16 94.64
Portugal 100 99.65 110.93 115.21
Romania 100 128.99 148.41 179.85
Slovenia 100 97.05 100.79 111.76
Slovakia 100 109.19 135.28 179.94
Finland 100 93.92 102.12 111.03
Sweden 100 102.82 99.22 91.09
United Kingdom 100 103.76 106.08 86.8
Norway 100 97.25 111.52 129.37
Switzerland 100 96.76 105.22 112.57
Turkey 100 96.54 87.66 85.21
Source: Eurostat
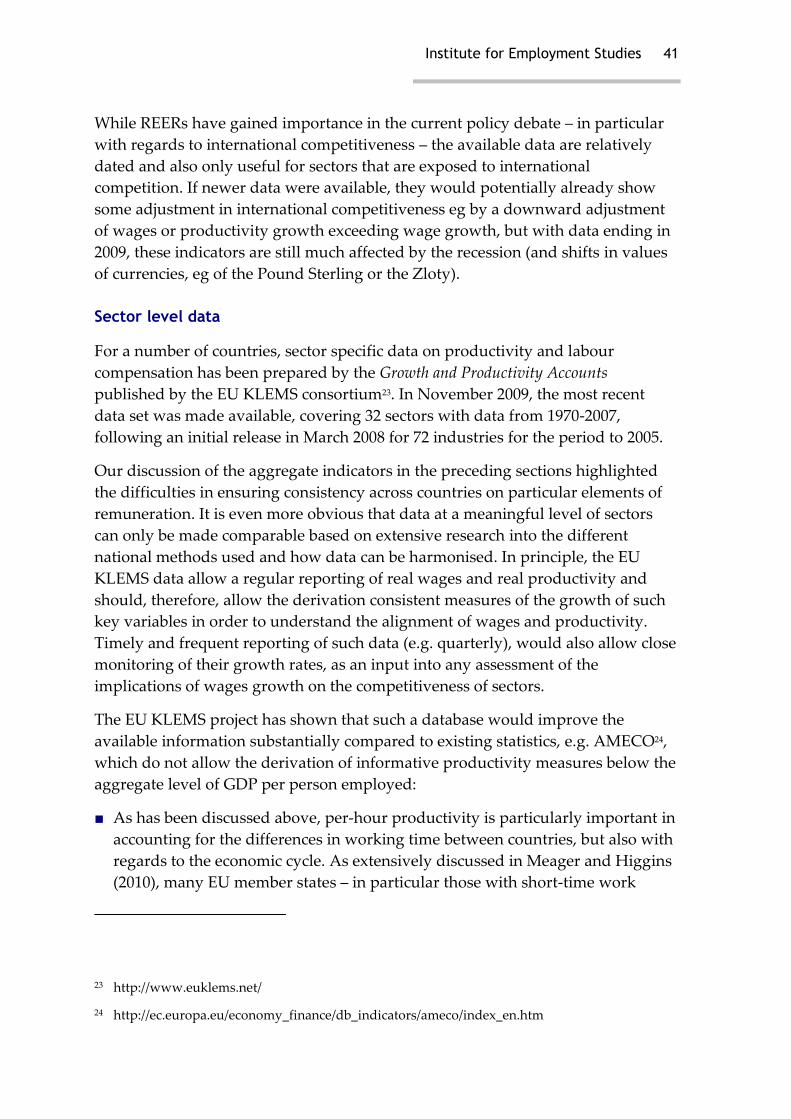
Institute for Employment Studies 41
While REERs have gained importance in the current policy debate – in particular
with regards to international competitiveness – the available data are relatively
dated and also only useful for sectors that are exposed to international
competition. If newer data were available, they would potentially already show
some adjustment in international competitiveness eg by a downward adjustment
of wages or productivity growth exceeding wage growth, but with data ending in
2009, these indicators are still much affected by the recession (and shifts in values
of currencies, eg of the Pound Sterling or the Zloty).
Sector level data
For a number of countries, sector specific data on productivity and labour
compensation has been prepared by the Growth and Productivity Accounts
published by the EU KLEMS consortium23. In November 2009, the most recent
data set was made available, covering 32 sectors with data from 1970-2007,
following an initial release in March 2008 for 72 industries for the period to 2005.
Our discussion of the aggregate indicators in the preceding sections highlighted
the difficulties in ensuring consistency across countries on particular elements of
remuneration. It is even more obvious that data at a meaningful level of sectors
can only be made comparable based on extensive research into the different
national methods used and how data can be harmonised. In principle, the EU
KLEMS data allow a regular reporting of real wages and real productivity and
should, therefore, allow the derivation consistent measures of the growth of such
key variables in order to understand the alignment of wages and productivity.
Timely and frequent reporting of such data (e.g. quarterly), would also allow close
monitoring of their growth rates, as an input into any assessment of the
implications of wages growth on the competitiveness of sectors.
The EU KLEMS project has shown that such a database would improve the
available information substantially compared to existing statistics, e.g. AMECO24,
which do not allow the derivation of informative productivity measures below the
aggregate level of GDP per person employed:
■ As has been discussed above, per-hour productivity is particularly important in
accounting for the differences in working time between countries, but also with
regards to the economic cycle. As extensively discussed in Meager and Higgins
(2010), many EU member states – in particular those with short-time work
23 http://www.euklems.net/
24 http://ec.europa.eu/economy_finance/db_indicators/ameco/index_en.htm
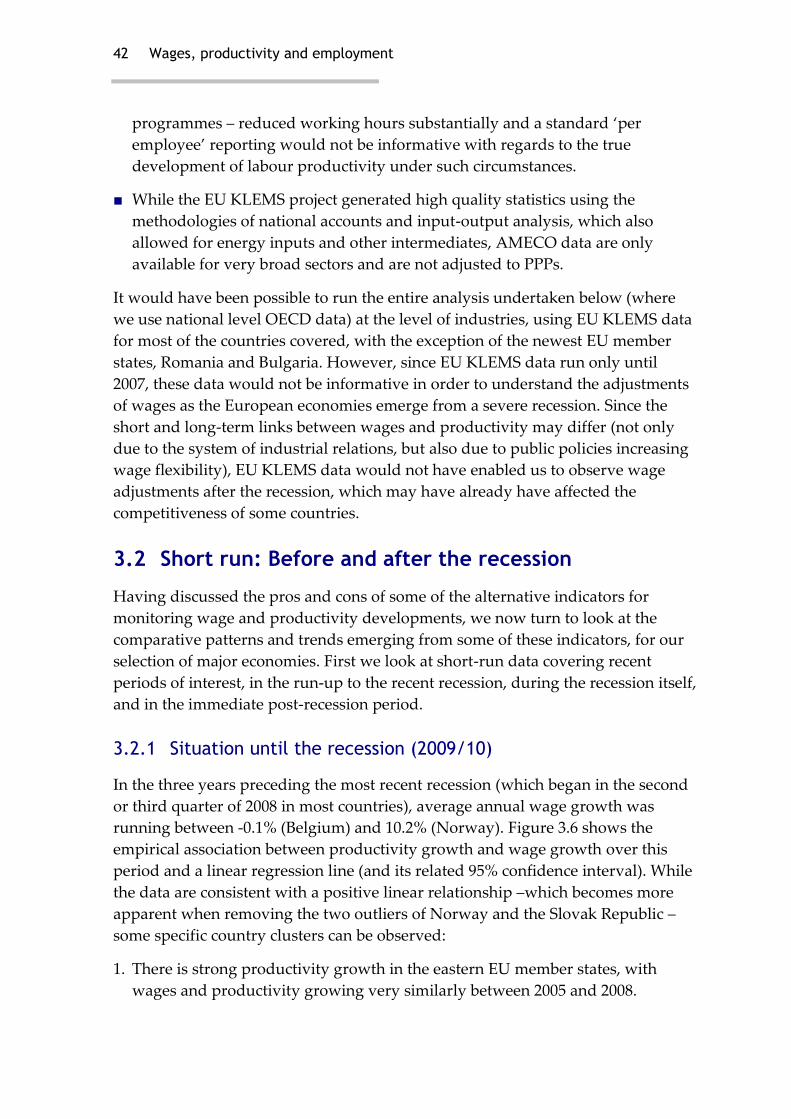
42 Wages, productivity and employment
programmes – reduced working hours substantially and a standard ‘per
employee’ reporting would not be informative with regards to the true
development of labour productivity under such circumstances.
■ While the EU KLEMS project generated high quality statistics using the
methodologies of national accounts and input-output analysis, which also
allowed for energy inputs and other intermediates, AMECO data are only
available for very broad sectors and are not adjusted to PPPs.
It would have been possible to run the entire analysis undertaken below (where
we use national level OECD data) at the level of industries, using EU KLEMS data
for most of the countries covered, with the exception of the newest EU member
states, Romania and Bulgaria. However, since EU KLEMS data run only until
2007, these data would not be informative in order to understand the adjustments
of wages as the European economies emerge from a severe recession. Since the
short and long-term links between wages and productivity may differ (not only
due to the system of industrial relations, but also due to public policies increasing
wage flexibility), EU KLEMS data would not have enabled us to observe wage
adjustments after the recession, which may have already have affected the
competitiveness of some countries.
3.2 Short run: Before and after the recession
Having discussed the pros and cons of some of the alternative indicators for
monitoring wage and productivity developments, we now turn to look at the
comparative patterns and trends emerging from some of these indicators, for our
selection of major economies. First we look at short-run data covering recent
periods of interest, in the run-up to the recent recession, during the recession itself,
and in the immediate post-recession period.
3.2.1 Situation until the recession (2009/10)
In the three years preceding the most recent recession (which began in the second
or third quarter of 2008 in most countries), average annual wage growth was
running between -0.1% (Belgium) and 10.2% (Norway). Figure 3.6 shows the
empirical association between productivity growth and wage growth over this
period and a linear regression line (and its related 95% confidence interval). While
the data are consistent with a positive linear relationship –which becomes more
apparent when removing the two outliers of Norway and the Slovak Republic –
some specific country clusters can be observed:
1. There is strong productivity growth in the eastern EU member states, with
wages and productivity growing very similarly between 2005 and 2008.
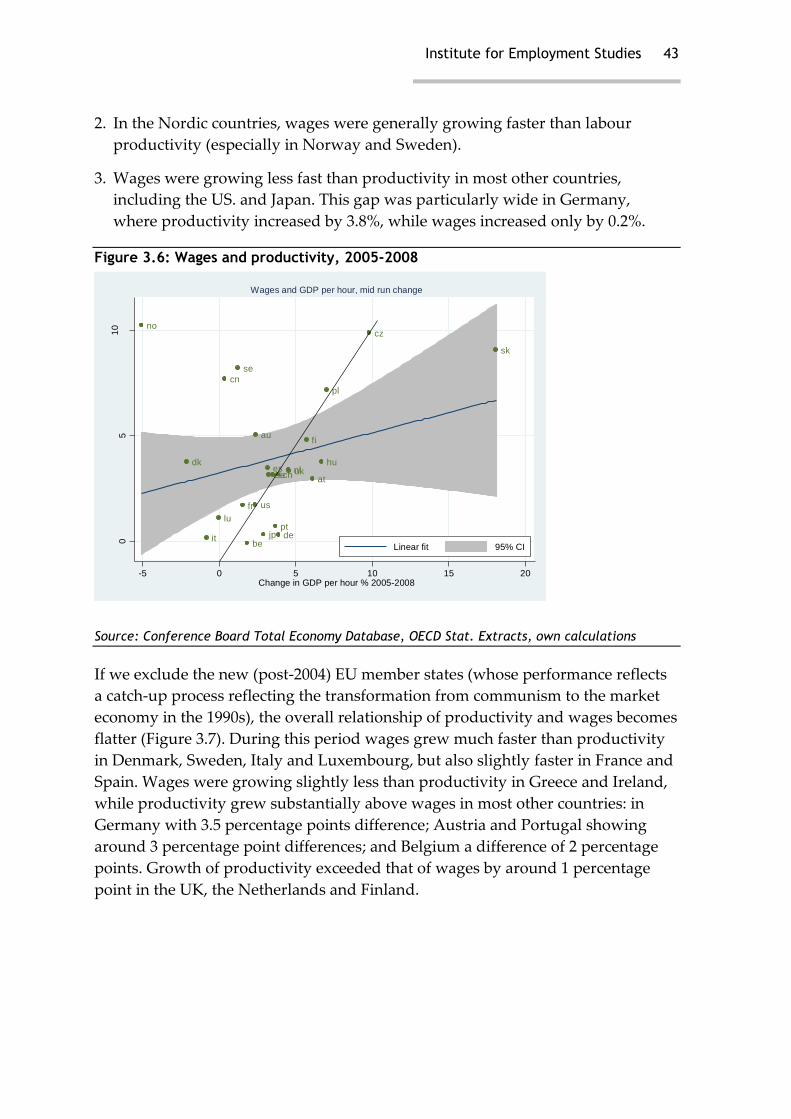
Institute for Employment Studies 43
2. In the Nordic countries, wages were generally growing faster than labour
productivity (especially in Norway and Sweden).
3. Wages were growing less fast than productivity in most other countries,
including the US. and Japan. This gap was particularly wide in Germany,
where productivity increased by 3.8%, while wages increased only by 0.2%.
Figure 3.6: Wages and productivity, 2005-2008
Source: Conference Board Total Economy Database, OECD Stat. Extracts, own calculations
If we exclude the new (post-2004) EU member states (whose performance reflects
a catch-up process reflecting the transformation from communism to the market
economy in the 1990s), the overall relationship of productivity and wages becomes
flatter (Figure 3.7). During this period wages grew much faster than productivity
in Denmark, Sweden, Italy and Luxembourg, but also slightly faster in France and
Spain. Wages were growing slightly less than productivity in Greece and Ireland,
while productivity grew substantially above wages in most other countries: in
Germany with 3.5 percentage points difference; Austria and Portugal showing
around 3 percentage point differences; and Belgium a difference of 2 percentage
points. Growth of productivity exceeded that of wages by around 1 percentage
point in the UK, the Netherlands and Finland.
at
be
cz
dk
fi
fr
de
el
hu
ie
it
lu
nl
pl
pt
sk
es
se
uk
us
cn
au
no
ch
jp
05
10
% c
han
ge
in
av. w
ag
es 2
005
-20
08
-5 0 5 10 15 20Change in GDP per hour % 2005-2008
Linear fit 95% CI
Wages and GDP per hour, mid run change
at
be
cz
dk
fi
fr
de
el
hu
ie
it
lu
nl
pl
pt
sk
es
se
uk
us
cn
au
no
ch
jp
05
10
% c
han
ge
in
av. w
ag
es 2
005
-20
08
-5 0 5 10 15 20Change in GDP per hour % 2005-2008
Linear fit 95% CI
Wages and GDP per hour, mid run change
44 Wages, productivity and employment
Figure 3.7: Wages and productivity, 2005-2008, EU-15 only
N.B. OECD Wage Data not available for some EU member states joining the EU in or after 2004, NZ, IC and TR, Source: Conference Board Total Economy Database, OECD Stat. Extracts, own
calculations
As discussed earlier, labour compensation offers an alternative (and, in some
ways, potentially superior) indicator for labour costs. The association of growth of
labour productivity and labour compensation is shown in Figure 3.8 for the
sample of 36 developed economies. The figure shows a similarly close association
of wages and productivity growth, with the Eastern EU member states
experiencing the highest growth rates between 2005 and 2008.
This indicator shows fewer empirical regularities than is the case for the wage
growth/productivity growth relationship. Labour compensation was growing
faster than productivity in many EU member states, including eastern European.
Labour compensation was growing more slowly than productivity in the UK (by -
5.1 percentage points), Germany (-3.9), Austria (-3.9 points), Slovenia (-3.1), but
also slightly lower in many other EU member states, Japan and the US.
at
be
dk
fi
fr
de
el ie
it
lu
nl
pt
es
se
uk
02
46
8
% c
han
ge
in
av. w
ag
es 2
005
-20
08
-2 0 2 4 6Change in GDP per hour % 2005-2008
Linear fit 95% CI
Wages and GDP per hour, mid run change
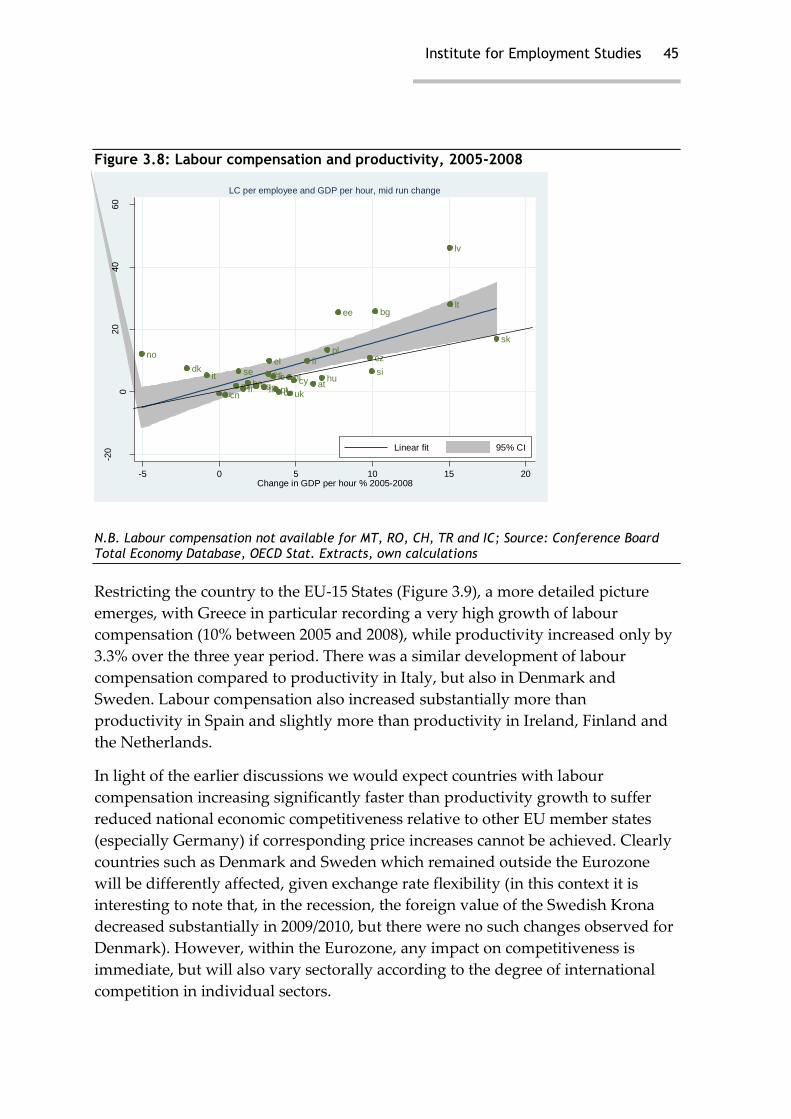
Institute for Employment Studies 45
Figure 3.8: Labour compensation and productivity, 2005-2008
N.B. Labour compensation not available for MT, RO, CH, TR and IC; Source: Conference Board Total Economy Database, OECD Stat. Extracts, own calculations
Restricting the country to the EU-15 States (Figure 3.9), a more detailed picture
emerges, with Greece in particular recording a very high growth of labour
compensation (10% between 2005 and 2008), while productivity increased only by
3.3% over the three year period. There was a similar development of labour
compensation compared to productivity in Italy, but also in Denmark and
Sweden. Labour compensation also increased substantially more than
productivity in Spain and slightly more than productivity in Ireland, Finland and
the Netherlands.
In light of the earlier discussions we would expect countries with labour
compensation increasing significantly faster than productivity growth to suffer
reduced national economic competitiveness relative to other EU member states
(especially Germany) if corresponding price increases cannot be achieved. Clearly
countries such as Denmark and Sweden which remained outside the Eurozone
will be differently affected, given exchange rate flexibility (in this context it is
interesting to note that, in the recession, the foreign value of the Swedish Krona
decreased substantially in 2009/2010, but there were no such changes observed for
Denmark). However, within the Eurozone, any impact on competitiveness is
immediate, but will also vary sectorally according to the degree of international
competition in individual sectors.
atbe
bg
cy
cz
dk
ee
fi
fr de
el
huieit
lv
lt
lu
nl
pl
pt
sk
siesse
ukus
cnaunz
no
jp
-20
020
40
60
LC
per
em
plo
ye
e c
ha
ng
e %
200
5-2
008
-5 0 5 10 15 20Change in GDP per hour % 2005-2008
Linear fit 95% CI
LC per employee and GDP per hour, mid run change
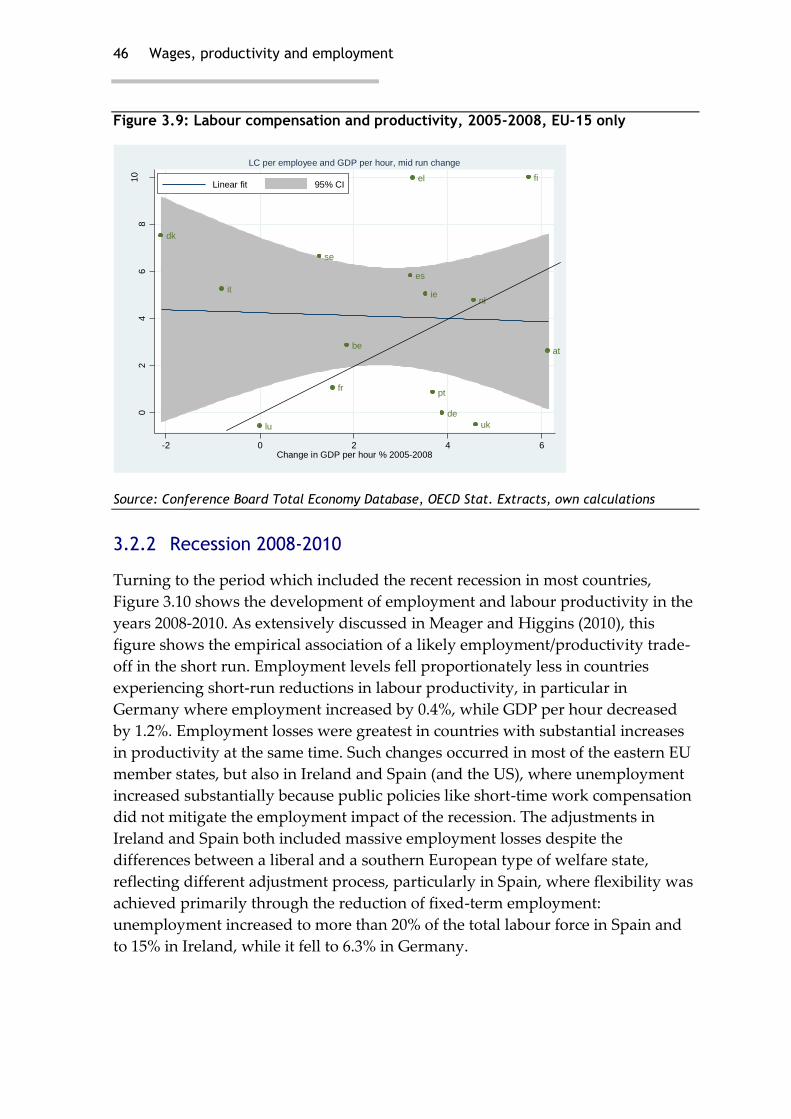
46 Wages, productivity and employment
Figure 3.9: Labour compensation and productivity, 2005-2008, EU-15 only
Source: Conference Board Total Economy Database, OECD Stat. Extracts, own calculations
3.2.2 Recession 2008-2010
Turning to the period which included the recent recession in most countries,
Figure 3.10 shows the development of employment and labour productivity in the
years 2008-2010. As extensively discussed in Meager and Higgins (2010), this
figure shows the empirical association of a likely employment/productivity trade-
off in the short run. Employment levels fell proportionately less in countries
experiencing short-run reductions in labour productivity, in particular in
Germany where employment increased by 0.4%, while GDP per hour decreased
by 1.2%. Employment losses were greatest in countries with substantial increases
in productivity at the same time. Such changes occurred in most of the eastern EU
member states, but also in Ireland and Spain (and the US), where unemployment
increased substantially because public policies like short-time work compensation
did not mitigate the employment impact of the recession. The adjustments in
Ireland and Spain both included massive employment losses despite the
differences between a liberal and a southern European type of welfare state,
reflecting different adjustment process, particularly in Spain, where flexibility was
achieved primarily through the reduction of fixed-term employment:
unemployment increased to more than 20% of the total labour force in Spain and
to 15% in Ireland, while it fell to 6.3% in Germany.
atbe
dk
fi
fr
de
el
ieit
lu
nl
pt
es
se
uk
02
46
810
LC
per
em
plo
ye
e c
ha
ng
e %
200
5-2
008
-2 0 2 4 6Change in GDP per hour % 2005-2008
Linear fit 95% CI
LC per employee and GDP per hour, mid run change

Institute for Employment Studies 47
Figure 3.10: Employment and productivity, 2008-2010
atbe
bg
cycz
dk
ee
fi
fr
de
elhu
ie
it
lv
lt
lu
mt
nl
pl
ptro
sksi
es
seuk
us
cn
au
nzno
ch
tr
jp
ic
-20
-15
-10
-50
5
Em
plo
ym
ent
ch
an
ge
% 2
008
-20
10
-5 0 5 10 15Change in GDP per hour % 2008-2010
Linear fit 95% CI
Employment and GDP per hour, 2008-2010 change
Source: Conference Board Total Economy Database, own calculations
As would be expected, given the growth in unemployment, there was only very
moderate wage and labour compensation growth in most countries over this
period. Figure 3.11 shows percentage changes in real labour compensation per
employee and GDP per hour between 2008 and 2010 for countries for which
comparable data from are available from OECD. While the expected positive
association between both variables remains, the figure shows the wide variation
across EU member states.
Labour compensation has fallen during the recession in Estonia, Greece and
Hungary and has grown less than productivity in most EU member states with
available data. There are, however, with some important exceptions: in particular,
in Germany, Italy, Slovenia and Finland, labour compensation increased, while
productivity decreased, which would suggest a negative impact on relative
international competitiveness in those countries.
At the other end of the spectrum, labour productivity increased 12 percentage
points more than labour compensation (which declined by 1.3%) in Estonia;
similarly productivity grew significantly faster than labour compensation in
Ireland. Labour compensation also decreased substantially in Greece (-4.9%),
while GDP per hour remained relatively constant (+0.8%).

48 Wages, productivity and employment
Figure 3.11: Labour compensation per employee and productivity, 2008-2010
be
dk
ee
fi de
elhu
ieit
nl
sk
si
es
se
no
-50
510
LC
per
em
plo
ye
e c
ha
ng
e %
200
8-2
010
-5 0 5 10 15Change in GDP per hour % 2008-2010
Linear fit 95% CI
LC per employee and GDP per hour, mid run change
N.B. Countries without OECD data for 2010 have been excluded from the analysis
Source: Conference Board Total Economy Database, OECD Stat. Extracts, own calculations
3.2.3 Emerging from the recession
By the end of the recession in most countries in 2010, the differential labour
market effect of the decline in economic activity can be seen even more clearly
(Figure 3.12). In contrast to the period at the beginning of the recession,
productivity increased in 2009-10 in all countries with the exception of Iceland,
Romania and Greece, but there is also persistent evidence of the employment-
productivity trade-off, with countries tending to record either large increases in
productivity and employment declines (e.g. eastern European EU member states,
Ireland) or smaller increases in productivity and stable or increasing employment
(Germany, France and the UK).
The only major EU economy achieving both substantial increases in productivity
as well as employment during 2009-2010 is Poland, but it is also worth noting that
there was also a very substantial – and fast – reduction of the foreign value of the
Polish currency over this period, resulting in substitution for domestic goods and,
following the recession, strong export growth.
Figure 3.13 shows, for the same period, annual growth rates of labour productivity
and labour compensation per employee. There is a positive association between
the two variables, but this is solely due to the extreme outlier of Greece. Once
Greece is removed from the analysis (Figure 3.14), a different picture emerges.

Institute for Employment Studies 49
Figure 3.12: Employment and productivity growth: emerging from the recession 2009-2010
atbe
bg
cycz
dk
ee
fifr
de
el
hu
ie
it
lv lt
lumt
nl
pl
ptro
sk
sies
se
uk
us
cn
au
nzno
ch
tr
jpic
-50
5
Em
plo
ym
ent
ch
an
ge
% 2
009
-20
10
-2 0 2 4 6 8Change in GDP per hour % 2009-2010
Linear fit 95% CI
Employment and GDP per hour, 2009-2010 change
Source: Conference Board Total Economy Database, own calculations
Figure 3.13: Labour compensation and productivity changes: emerging from the recession (2009-2010)
be
dk
ee
fide
el
hu
ie
it
nl
sk
si
es
se
no
-4-2
02
4
LC
per
em
plo
ye
e c
ha
ng
e %
200
9-2
010
-2 0 2 4 6 8Change in GDP per hour % 2009-2010
Linear fit 95% CI
LC per employee and GDP per hour, mid run change
N.B. Countries without OECD data for 2010 have been excluded from the analysis
Source: Conference Board Total Economy Database, OECD Stat. Extracts, own calculations
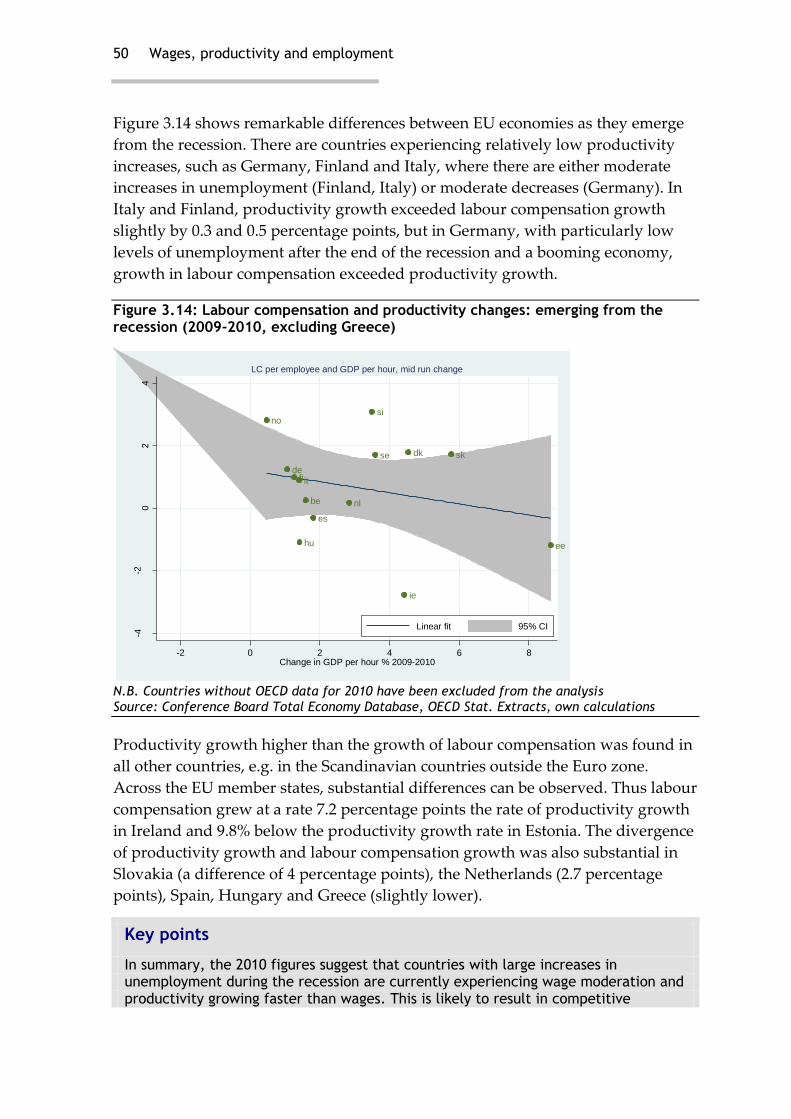
50 Wages, productivity and employment
Figure 3.14 shows remarkable differences between EU economies as they emerge
from the recession. There are countries experiencing relatively low productivity
increases, such as Germany, Finland and Italy, where there are either moderate
increases in unemployment (Finland, Italy) or moderate decreases (Germany). In
Italy and Finland, productivity growth exceeded labour compensation growth
slightly by 0.3 and 0.5 percentage points, but in Germany, with particularly low
levels of unemployment after the end of the recession and a booming economy,
growth in labour compensation exceeded productivity growth.
Figure 3.14: Labour compensation and productivity changes: emerging from the recession (2009-2010, excluding Greece)
be
dk
ee
fide
hu
ie
it
nl
sk
si
es
se
no
-4-2
02
4
LC
per
em
plo
ye
e c
ha
ng
e %
200
9-2
010
-2 0 2 4 6 8Change in GDP per hour % 2009-2010
Linear fit 95% CI
LC per employee and GDP per hour, mid run change
N.B. Countries without OECD data for 2010 have been excluded from the analysis
Source: Conference Board Total Economy Database, OECD Stat. Extracts, own calculations
Productivity growth higher than the growth of labour compensation was found in
all other countries, e.g. in the Scandinavian countries outside the Euro zone.
Across the EU member states, substantial differences can be observed. Thus labour
compensation grew at a rate 7.2 percentage points the rate of productivity growth
in Ireland and 9.8% below the productivity growth rate in Estonia. The divergence
of productivity growth and labour compensation growth was also substantial in
Slovakia (a difference of 4 percentage points), the Netherlands (2.7 percentage
points), Spain, Hungary and Greece (slightly lower).
Key points
In summary, the 2010 figures suggest that countries with large increases in unemployment during the recession are currently experiencing wage moderation and productivity growing faster than wages. This is likely to result in competitive
Institute for Employment Studies 51
advantages in sectors exposed to international competition, in particular within the Euro zone (Estonia, Ireland), and can create new employment opportunities by output expansion if wages growth remains low for some time. There are early signs of such output expansion, e.g. for the industry sector in Ireland, which grew by
13.2% in 2010, although aggregate GDP still declined by 1% over the same period25
However, it is too early for conclusive evidence as to whether wage moderation is a sufficient mechanism to generate the resumption of output growth and employment expansion in Ireland or in any of the other countries severely affected by the recent recession.
3.3 Medium and long run
Having explored some recent (pre- and post-recession) developments in wages
and productivity growth in EU and OECD economies, we turn, in this section, to
look at similar relationships over a slightly longer time horizon (1995-2009)
3.3.1 Wages and productivity
Wage increases and productivity growth are clearly related in the long run. Figure
3.1526 confirms this relationship for all sampled countries with available wage data
from OECD sources. Between 1995 and 2009, wages grew below productivity in
most continental European economies, but the wage-productivity gap was quite
dissimilar across the different EU member states: In France, the increase in
productivity (+19.8%) was close to the increase in real wages (+18.4%), while
productivity in Germany grew similarly by 19.7%, but wages increased only by
5.3%. In all other continental EU member states as well as the US and Canada
wages grew slightly slower than the increase of productivity, but the difference
was not as marked as in Germany. In Japan, the picture was even starker: wages
increased by 4.5%, while productivity increased by 27%.
Wage increases were slightly higher than productivity increases in the Nordic EU
member states, but these countries were only emerging from the recession of the
early 1990s by the beginning of the period of observation (as already noted, with
wage increases lagging behind productivity growth, this pattern may have been
partially affected by the choice of the base year).
The fastest growth of both wages and productivity over this period was observed
in the eastern European EU member states and in Ireland. Wages grew less fast
25 http://www.cso.ie/releasespublications/documents/economy/current/qna.pdf
26 Also shown in the introduction to the paper (Figure 1.1)
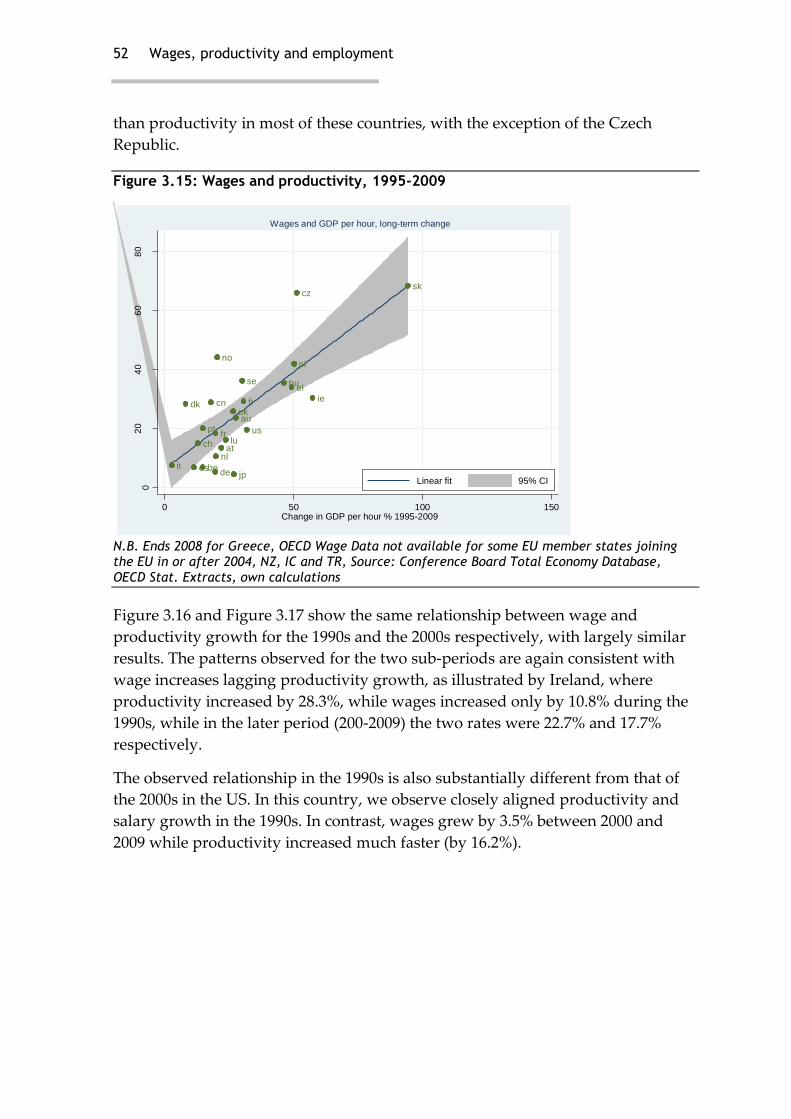
52 Wages, productivity and employment
than productivity in most of these countries, with the exception of the Czech
Republic.
Figure 3.15: Wages and productivity, 1995-2009
at
be
cz
dk fi
fr
de
elhu
ie
it
lu
nl
pl
pt
sk
es
se
uk
us
cn
au
no
ch
jp
02
04
06
08
0
% c
han
ge
in
av. w
ag
es 1
995
-20
09
0 50 100 150Change in GDP per hour % 1995-2009
Linear fit 95% CI
Wages and GDP per hour, long-term change
N.B. Ends 2008 for Greece, OECD Wage Data not available for some EU member states joining the EU in or after 2004, NZ, IC and TR, Source: Conference Board Total Economy Database,
OECD Stat. Extracts, own calculations
Figure 3.16 and Figure 3.17 show the same relationship between wage and
productivity growth for the 1990s and the 2000s respectively, with largely similar
results. The patterns observed for the two sub-periods are again consistent with
wage increases lagging productivity growth, as illustrated by Ireland, where
productivity increased by 28.3%, while wages increased only by 10.8% during the
1990s, while in the later period (200-2009) the two rates were 22.7% and 17.7%
respectively.
The observed relationship in the 1990s is also substantially different from that of
the 2000s in the US. In this country, we observe closely aligned productivity and
salary growth in the 1990s. In contrast, wages grew by 3.5% between 2000 and
2009 while productivity increased much faster (by 16.2%).
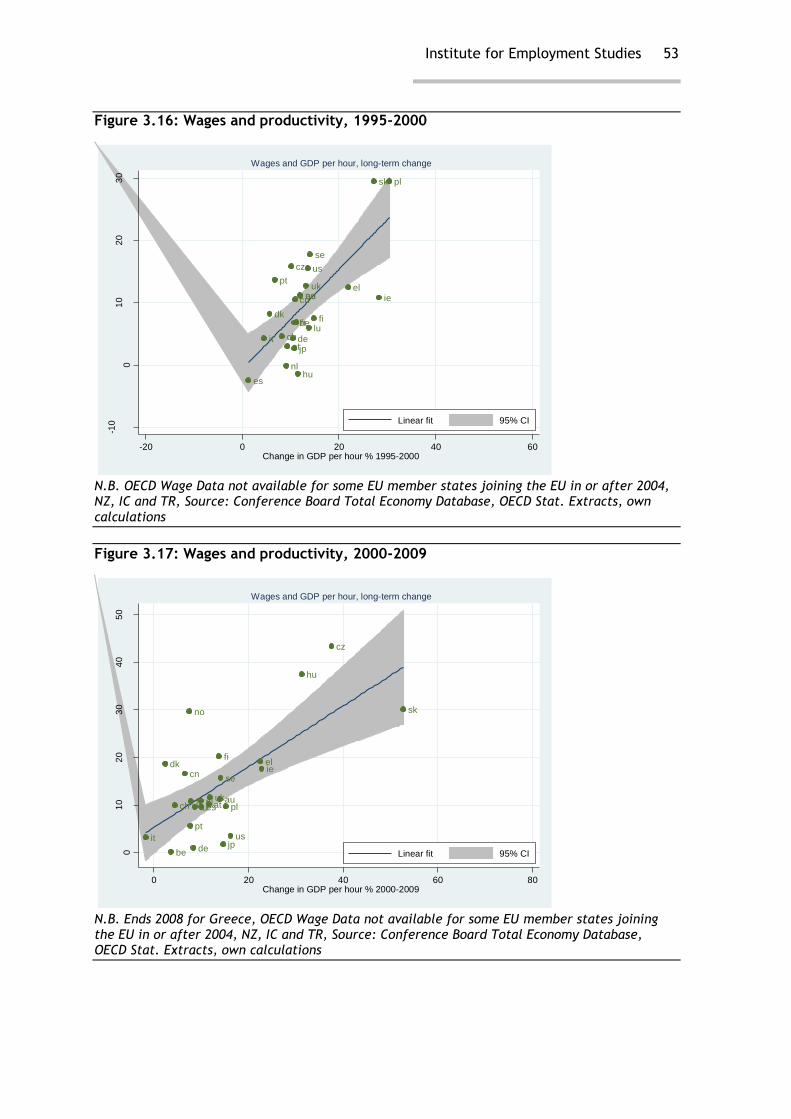
Institute for Employment Studies 53
Figure 3.16: Wages and productivity, 1995-2000
at
be
cz
dkfifr
de
el
hu
ie
it
lu
nl
pl
pt
sk
es
se
uk
us
cnauno
ch
jp
-10
01
02
03
0
% c
han
ge
in
av. w
ag
es 1
995
-20
00
-20 0 20 40 60Change in GDP per hour % 1995-2000
Linear fit 95% CI
Wages and GDP per hour, long-term change
N.B. OECD Wage Data not available for some EU member states joining the EU in or after 2004, NZ, IC and TR, Source: Conference Board Total Economy Database, OECD Stat. Extracts, own
calculations
Figure 3.17: Wages and productivity, 2000-2009
at
be
cz
dkfi
fr
de
el
hu
ie
it
lunl
pl
pt
sk
es
se
uk
us
cn
au
no
ch
jp
01
02
03
04
05
0
% c
han
ge
in
av. w
ag
es 2
000
-20
09
0 20 40 60 80Change in GDP per hour % 2000-2009
Linear fit 95% CI
Wages and GDP per hour, long-term change
N.B. Ends 2008 for Greece, OECD Wage Data not available for some EU member states joining the EU in or after 2004, NZ, IC and TR, Source: Conference Board Total Economy Database, OECD Stat. Extracts, own calculations
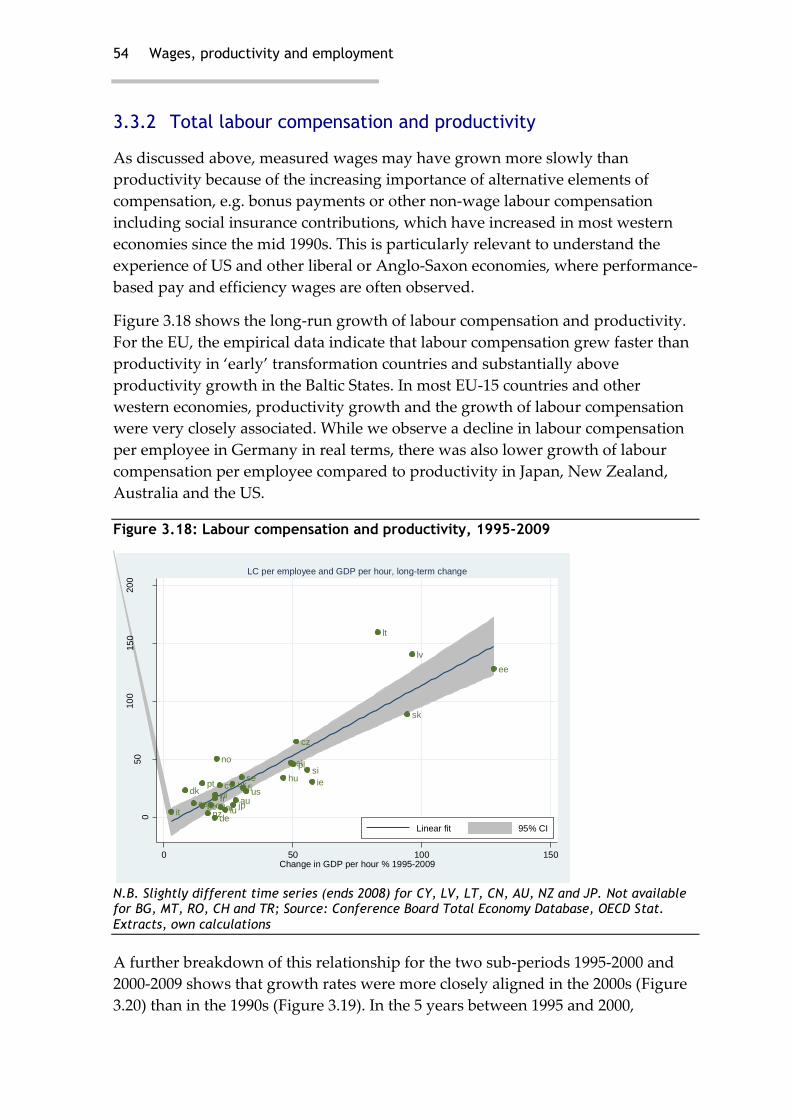
54 Wages, productivity and employment
3.3.2 Total labour compensation and productivity
As discussed above, measured wages may have grown more slowly than
productivity because of the increasing importance of alternative elements of
compensation, e.g. bonus payments or other non-wage labour compensation
including social insurance contributions, which have increased in most western
economies since the mid 1990s. This is particularly relevant to understand the
experience of US and other liberal or Anglo-Saxon economies, where performance-
based pay and efficiency wages are often observed.
Figure 3.18 shows the long-run growth of labour compensation and productivity.
For the EU, the empirical data indicate that labour compensation grew faster than
productivity in ‘early’ transformation countries and substantially above
productivity growth in the Baltic States. In most EU-15 countries and other
western economies, productivity growth and the growth of labour compensation
were very closely associated. While we observe a decline in labour compensation
per employee in Germany in real terms, there was also lower growth of labour
compensation per employee compared to productivity in Japan, New Zealand,
Australia and the US.
Figure 3.18: Labour compensation and productivity, 1995-2009
atbe
cy
cz
dk
ee
fifr
de
el
hu ie
it
lv
lt
lu
nl
pl
pt
sk
si
es
seuk
us
cnau
nz
no
jp
050
10
015
020
0
LC
per
em
plo
ye
e c
ha
ng
e %
199
5-2
009
0 50 100 150Change in GDP per hour % 1995-2009
Linear fit 95% CI
LC per employee and GDP per hour, long-term change
N.B. Slightly different time series (ends 2008) for CY, LV, LT, CN, AU, NZ and JP. Not available for BG, MT, RO, CH and TR; Source: Conference Board Total Economy Database, OECD Stat.
Extracts, own calculations
A further breakdown of this relationship for the two sub-periods 1995-2000 and
2000-2009 shows that growth rates were more closely aligned in the 2000s (Figure
3.20) than in the 1990s (Figure 3.19). In the 5 years between 1995 and 2000,
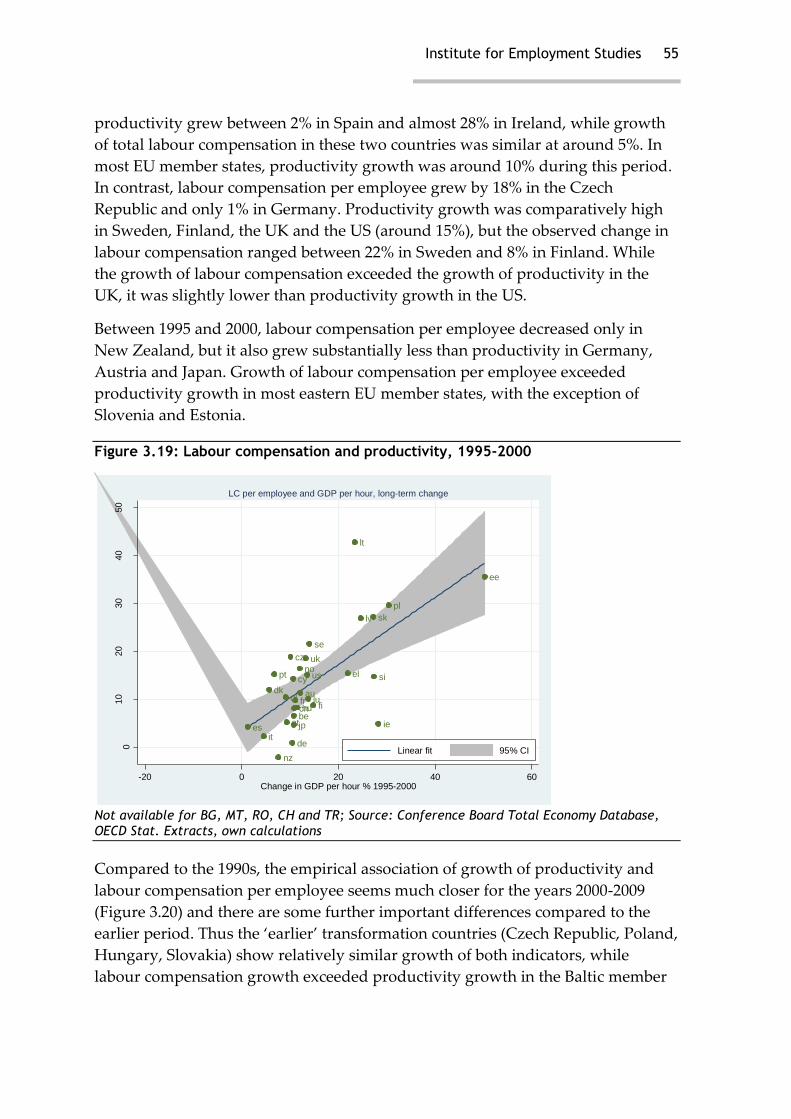
Institute for Employment Studies 55
productivity grew between 2% in Spain and almost 28% in Ireland, while growth
of total labour compensation in these two countries was similar at around 5%. In
most EU member states, productivity growth was around 10% during this period.
In contrast, labour compensation per employee grew by 18% in the Czech
Republic and only 1% in Germany. Productivity growth was comparatively high
in Sweden, Finland, the UK and the US (around 15%), but the observed change in
labour compensation ranged between 22% in Sweden and 8% in Finland. While
the growth of labour compensation exceeded the growth of productivity in the
UK, it was slightly lower than productivity growth in the US.
Between 1995 and 2000, labour compensation per employee decreased only in
New Zealand, but it also grew substantially less than productivity in Germany,
Austria and Japan. Growth of labour compensation per employee exceeded
productivity growth in most eastern EU member states, with the exception of
Slovenia and Estonia.
Figure 3.19: Labour compensation and productivity, 1995-2000
atbe
cy
cz
dk
ee
fifr
de
el
hu
ie
it
lv
lt
lunl
pl
pt
sk
si
es
se
uk
us
cn
au
nz
no
jp
010
20
30
40
50
LC
per
em
plo
ye
e c
ha
ng
e %
199
5-2
000
-20 0 20 40 60Change in GDP per hour % 1995-2000
Linear fit 95% CI
LC per employee and GDP per hour, long-term change
Not available for BG, MT, RO, CH and TR; Source: Conference Board Total Economy Database,
OECD Stat. Extracts, own calculations
Compared to the 1990s, the empirical association of growth of productivity and
labour compensation per employee seems much closer for the years 2000-2009
(Figure 3.20) and there are some further important differences compared to the
earlier period. Thus the ‘earlier’ transformation countries (Czech Republic, Poland,
Hungary, Slovakia) show relatively similar growth of both indicators, while
labour compensation growth exceeded productivity growth in the Baltic member
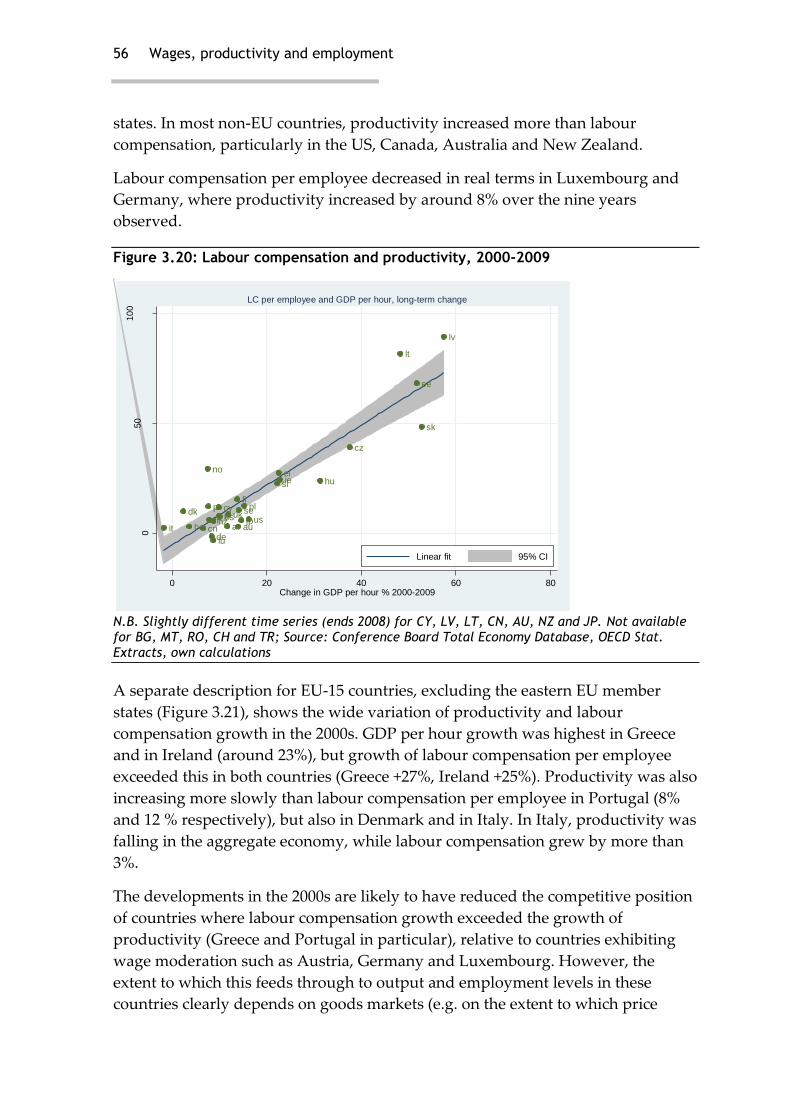
56 Wages, productivity and employment
states. In most non-EU countries, productivity increased more than labour
compensation, particularly in the US, Canada, Australia and New Zealand.
Labour compensation per employee decreased in real terms in Luxembourg and
Germany, where productivity increased by around 8% over the nine years
observed.
Figure 3.20: Labour compensation and productivity, 2000-2009
atbe
cy
cz
dk
ee
fi
fr
de
elhuie
it
lv
lt
lu
nlplpt
sk
si
esseuk
uscn au
nz
no
jp
050
10
0
LC
per
em
plo
ye
e c
ha
ng
e %
200
0-2
009
0 20 40 60 80Change in GDP per hour % 2000-2009
Linear fit 95% CI
LC per employee and GDP per hour, long-term change
N.B. Slightly different time series (ends 2008) for CY, LV, LT, CN, AU, NZ and JP. Not available for BG, MT, RO, CH and TR; Source: Conference Board Total Economy Database, OECD Stat. Extracts, own calculations
A separate description for EU-15 countries, excluding the eastern EU member
states (Figure 3.21), shows the wide variation of productivity and labour
compensation growth in the 2000s. GDP per hour growth was highest in Greece
and in Ireland (around 23%), but growth of labour compensation per employee
exceeded this in both countries (Greece +27%, Ireland +25%). Productivity was also
increasing more slowly than labour compensation per employee in Portugal (8%
and 12 % respectively), but also in Denmark and in Italy. In Italy, productivity was
falling in the aggregate economy, while labour compensation grew by more than
3%.
The developments in the 2000s are likely to have reduced the competitive position
of countries where labour compensation growth exceeded the growth of
productivity (Greece and Portugal in particular), relative to countries exhibiting
wage moderation such as Austria, Germany and Luxembourg. However, the
extent to which this feeds through to output and employment levels in these
countries clearly depends on goods markets (e.g. on the extent to which price

Institute for Employment Studies 57
increases can be secured when labour costs are rising above productivity) and on
real exchange rates affecting international competition (particularly for those
countries outside the Eurozone).
Figure 3.21: Labour compensation and productivity, 2000-2009, EU-15 only
atbe
dk
fi
fr
de
el
ie
it
lu
nl
pt
es
se
uk
-10
010
20
30
LC
per
em
plo
ye
e c
ha
ng
e %
200
0-2
009
0 5 10 15 20 25Change in GDP per hour % 2000-2009
Linear fit 95% CI
LC per employee and GDP per hour, long-term change
Source: Conference Board Total Economy Database, OECD Stat. Extracts, own calculations
3.3.3 Labour share and unit wage costs
An alternative view into the changes in labour compensation observed for
aggregate economies is the change of the labour share, i.e. labour compensation as
a percentage of GDP (but note also our reservations about the value of this as a
comparative indicator in section 3.1.4 above). As noted previously, the labour
share has fallen in many EU member states since the mid-1970s (after a previous
period of growth from the mid-1960s). For the period observed here (1995-2009),
the direction of change in the labour share differs widely. The labour share
increased by more than 5 percentage points in Belgium, Denmark and Greece (and
slightly below that in Sweden) and there were much smaller increases in Norway,
Switzerland, the UK, Portugal and Luxembourg. In all other countries, the labour
share declined over the last 15 years, with Australia, Spain and Ireland showing
the greatest decrease of more than four percentage points.
There is a positive cross-country association between wage growth and the change
in the labour share (Figure 3.22), but with several significant exceptions. The
largest increases in labour shares were achieved in countries with the fastest real
wage growth (Greece, Sweden, Denmark), while equally rapidly growing wages
in Ireland at the same time were associated with one of the greatest declines of the
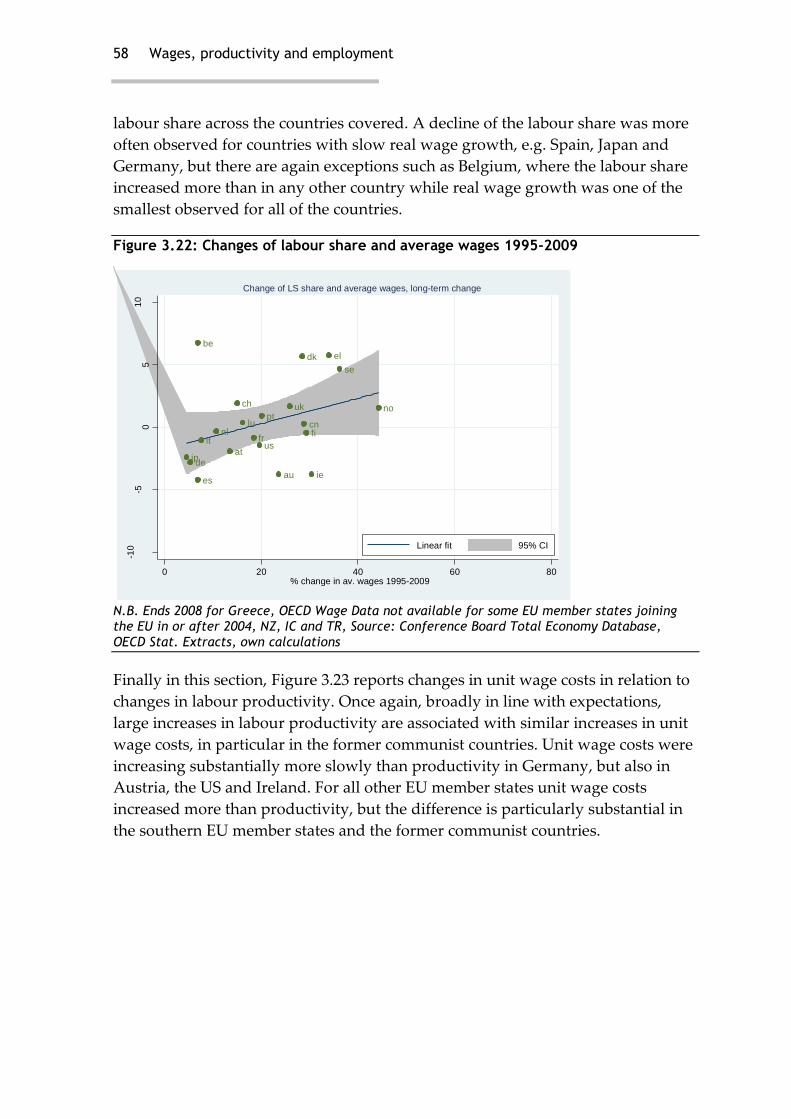
58 Wages, productivity and employment
labour share across the countries covered. A decline of the labour share was more
often observed for countries with slow real wage growth, e.g. Spain, Japan and
Germany, but there are again exceptions such as Belgium, where the labour share
increased more than in any other country while real wage growth was one of the
smallest observed for all of the countries.
Figure 3.22: Changes of labour share and average wages 1995-2009
at
be
dk
fifr
de
el
ie
it
lunl
pt
es
se
uk
us
cn
au
noch
jp
-10
-50
51
0
Ch
an
ge
LS
sha
re %
po
ints
199
5-2
00
9
0 20 40 60 80% change in av. wages 1995-2009
Linear fit 95% CI
Change of LS share and average wages, long-term change
N.B. Ends 2008 for Greece, OECD Wage Data not available for some EU member states joining the EU in or after 2004, NZ, IC and TR, Source: Conference Board Total Economy Database,
OECD Stat. Extracts, own calculations
Finally in this section, Figure 3.23 reports changes in unit wage costs in relation to
changes in labour productivity. Once again, broadly in line with expectations,
large increases in labour productivity are associated with similar increases in unit
wage costs, in particular in the former communist countries. Unit wage costs were
increasing substantially more slowly than productivity in Germany, but also in
Austria, the US and Ireland. For all other EU member states unit wage costs
increased more than productivity, but the difference is particularly substantial in
the southern EU member states and the former communist countries.
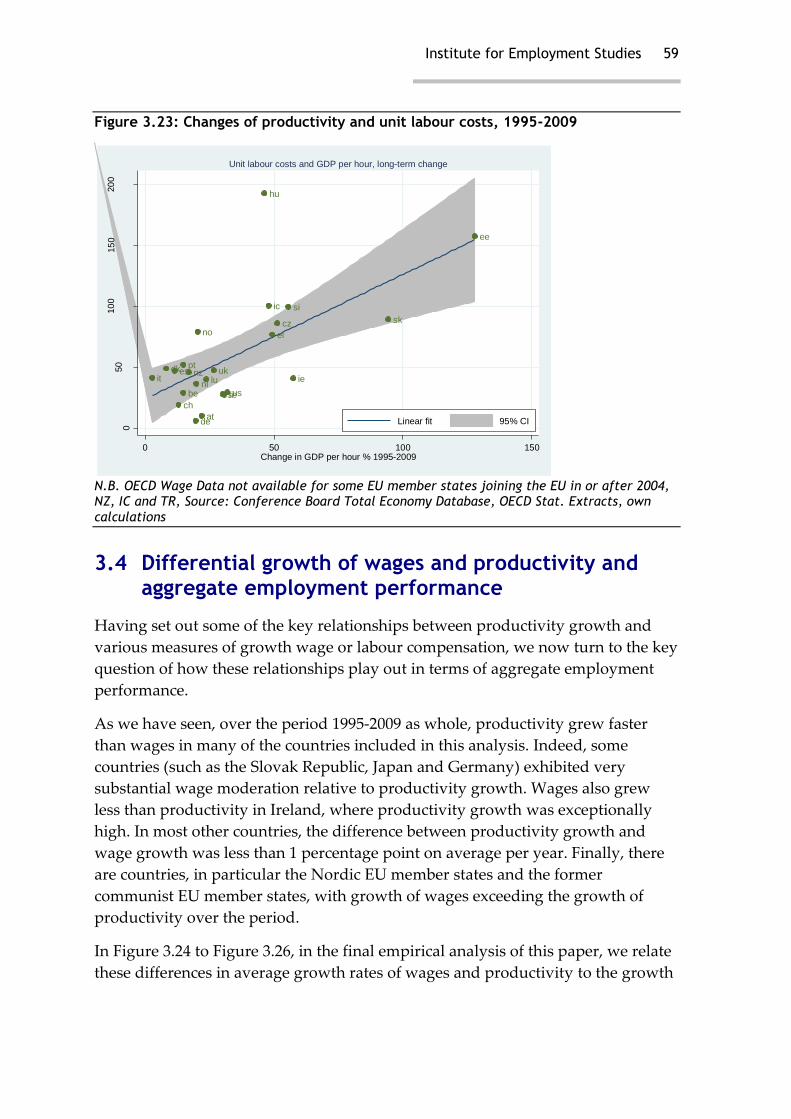
Institute for Employment Studies 59
Figure 3.23: Changes of productivity and unit labour costs, 1995-2009
at
be
cz
dk
ee
fi
de
el
hu
ieit lunl
pt
sk
si
es
se
uk
us
nz
no
ch
ic
050
10
015
020
0
Unit la
bo
ur
costs
ch
an
ge %
199
5-2
00
9
0 50 100 150Change in GDP per hour % 1995-2009
Linear fit 95% CI
Unit labour costs and GDP per hour, long-term change
N.B. OECD Wage Data not available for some EU member states joining the EU in or after 2004, NZ, IC and TR, Source: Conference Board Total Economy Database, OECD Stat. Extracts, own
calculations
3.4 Differential growth of wages and productivity and aggregate employment performance
Having set out some of the key relationships between productivity growth and
various measures of growth wage or labour compensation, we now turn to the key
question of how these relationships play out in terms of aggregate employment
performance.
As we have seen, over the period 1995-2009 as whole, productivity grew faster
than wages in many of the countries included in this analysis. Indeed, some
countries (such as the Slovak Republic, Japan and Germany) exhibited very
substantial wage moderation relative to productivity growth. Wages also grew
less than productivity in Ireland, where productivity growth was exceptionally
high. In most other countries, the difference between productivity growth and
wage growth was less than 1 percentage point on average per year. Finally, there
are countries, in particular the Nordic EU member states and the former
communist EU member states, with growth of wages exceeding the growth of
productivity over the period.
In Figure 3.24 to Figure 3.26, in the final empirical analysis of this paper, we relate
these differences in average growth rates of wages and productivity to the growth
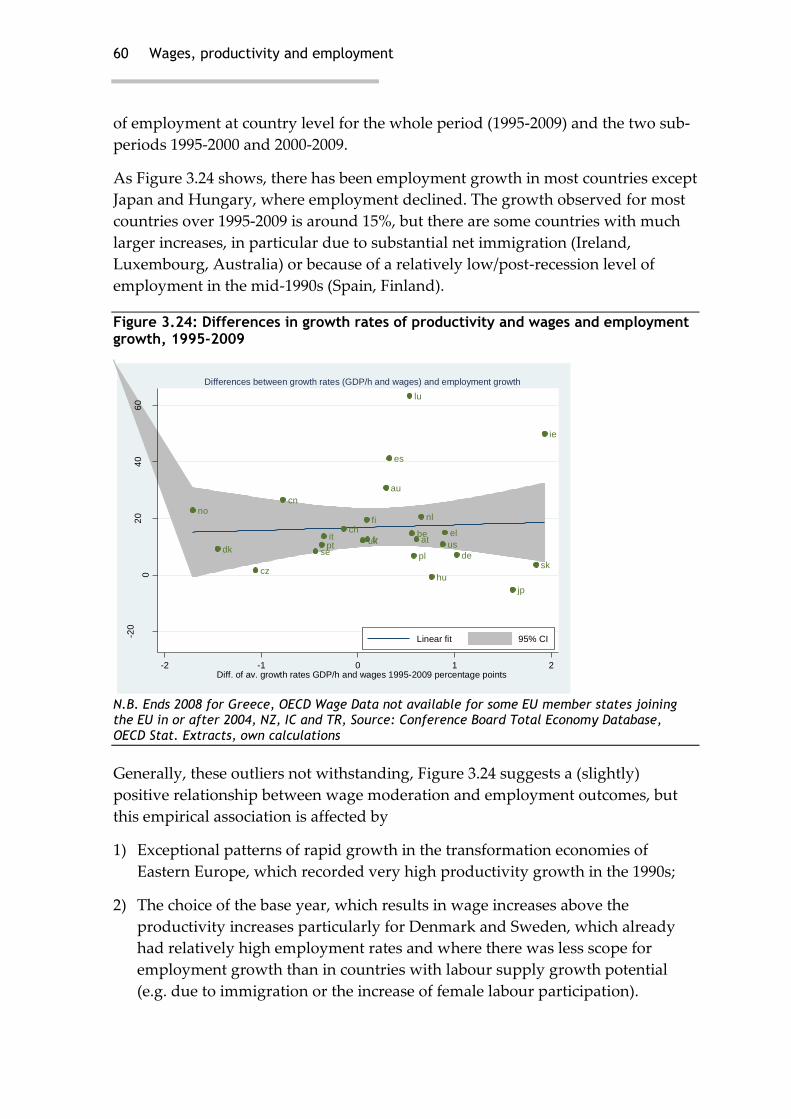
60 Wages, productivity and employment
of employment at country level for the whole period (1995-2009) and the two sub-
periods 1995-2000 and 2000-2009.
As Figure 3.24 shows, there has been employment growth in most countries except
Japan and Hungary, where employment declined. The growth observed for most
countries over 1995-2009 is around 15%, but there are some countries with much
larger increases, in particular due to substantial net immigration (Ireland,
Luxembourg, Australia) or because of a relatively low/post-recession level of
employment in the mid-1990s (Spain, Finland).
Figure 3.24: Differences in growth rates of productivity and wages and employment growth, 1995-2009
atbe
cz
dk
fi
fr
de
el
hu
ie
it
lu
nl
pl
pt
sk
es
se
uk us
cn
au
no
ch
jp
-20
02
04
06
0
Em
plo
ym
ent g
row
th (
%)
199
5-2
00
9
-2 -1 0 1 2Diff. of av. growth rates GDP/h and wages 1995-2009 percentage points
Linear fit 95% CI
Differences between growth rates (GDP/h and wages) and employment growth
N.B. Ends 2008 for Greece, OECD Wage Data not available for some EU member states joining the EU in or after 2004, NZ, IC and TR, Source: Conference Board Total Economy Database,
OECD Stat. Extracts, own calculations
Generally, these outliers not withstanding, Figure 3.24 suggests a (slightly)
positive relationship between wage moderation and employment outcomes, but
this empirical association is affected by
1) Exceptional patterns of rapid growth in the transformation economies of
Eastern Europe, which recorded very high productivity growth in the 1990s;
2) The choice of the base year, which results in wage increases above the
productivity increases particularly for Denmark and Sweden, which already
had relatively high employment rates and where there was less scope for
employment growth than in countries with labour supply growth potential
(e.g. due to immigration or the increase of female labour participation).
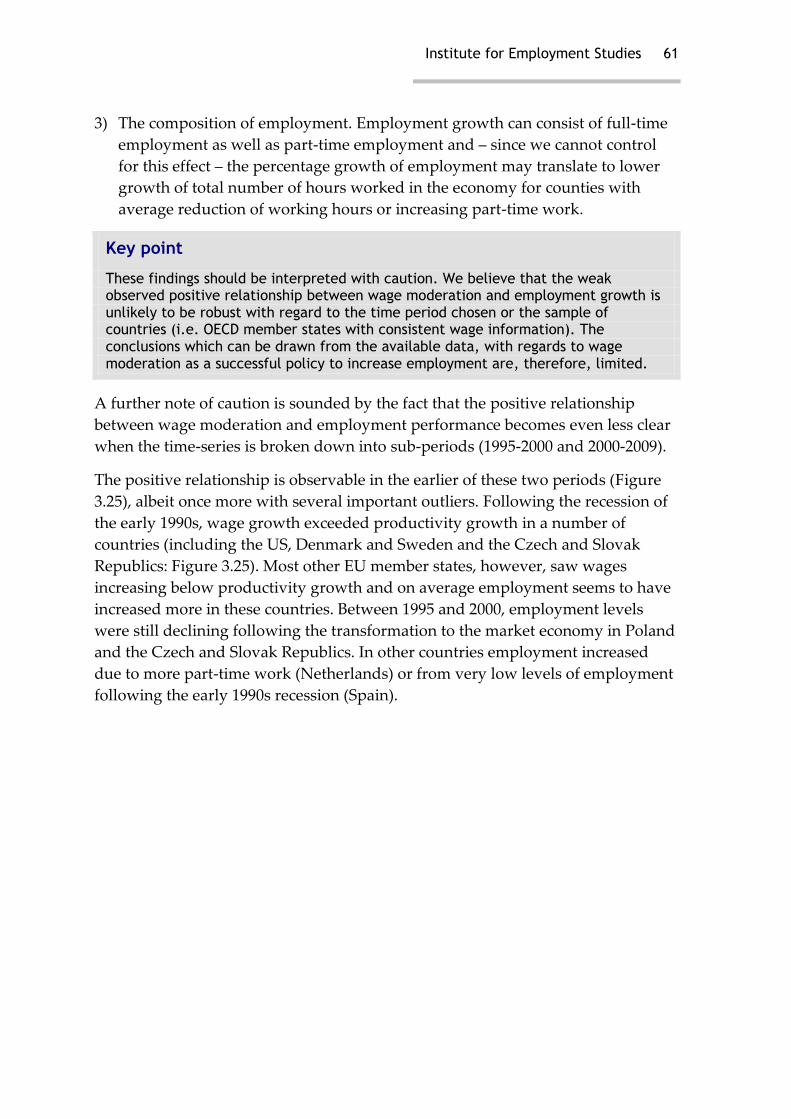
Institute for Employment Studies 61
3) The composition of employment. Employment growth can consist of full-time
employment as well as part-time employment and – since we cannot control
for this effect – the percentage growth of employment may translate to lower
growth of total number of hours worked in the economy for counties with
average reduction of working hours or increasing part-time work.
Key point
These findings should be interpreted with caution. We believe that the weak observed positive relationship between wage moderation and employment growth is unlikely to be robust with regard to the time period chosen or the sample of countries (i.e. OECD member states with consistent wage information). The conclusions which can be drawn from the available data, with regards to wage moderation as a successful policy to increase employment are, therefore, limited.
A further note of caution is sounded by the fact that the positive relationship
between wage moderation and employment performance becomes even less clear
when the time-series is broken down into sub-periods (1995-2000 and 2000-2009).
The positive relationship is observable in the earlier of these two periods (Figure
3.25), albeit once more with several important outliers. Following the recession of
the early 1990s, wage growth exceeded productivity growth in a number of
countries (including the US, Denmark and Sweden and the Czech and Slovak
Republics: Figure 3.25). Most other EU member states, however, saw wages
increasing below productivity growth and on average employment seems to have
increased more in these countries. Between 1995 and 2000, employment levels
were still declining following the transformation to the market economy in Poland
and the Czech and Slovak Republics. In other countries employment increased
due to more part-time work (Netherlands) or from very low levels of employment
following the early 1990s recession (Spain).
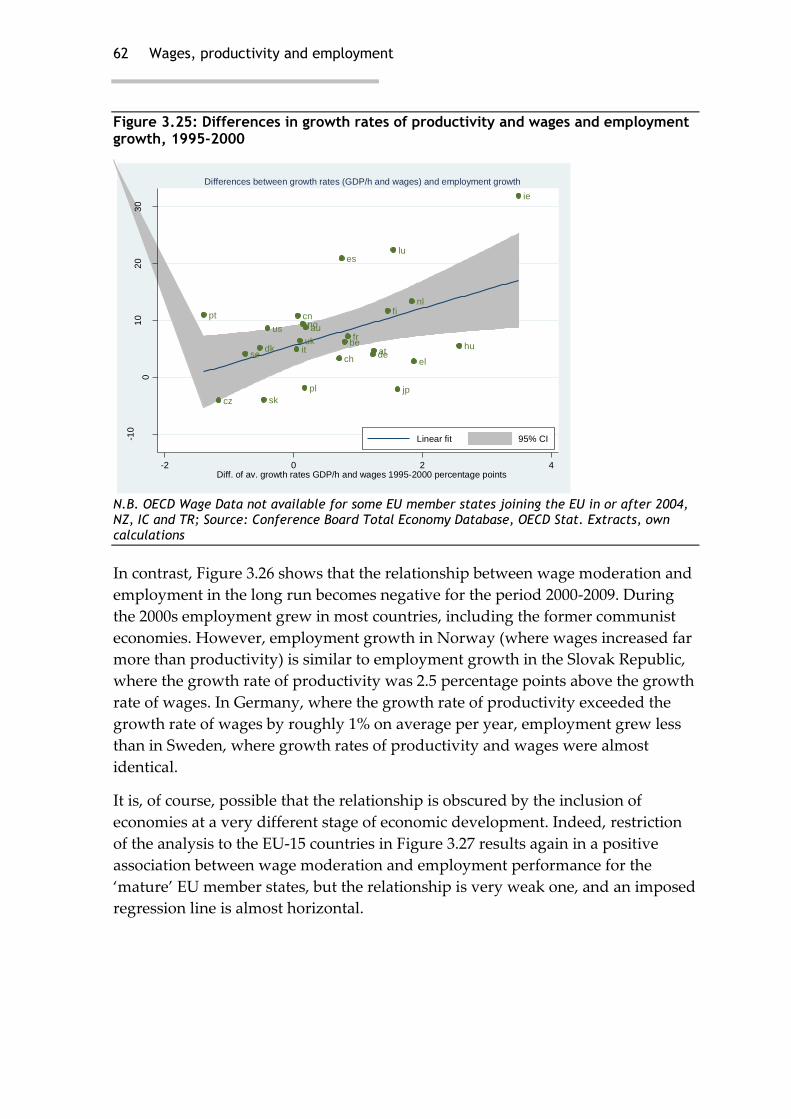
62 Wages, productivity and employment
Figure 3.25: Differences in growth rates of productivity and wages and employment growth, 1995-2000
atbe
cz
dk
fi
fr
deel
hu
ie
it
lu
nl
pl
pt
sk
es
se
uk
us
cn
auno
ch
jp
-10
01
02
03
0
Em
plo
ym
ent g
row
th (
%)
199
5-2
00
0
-2 0 2 4Diff. of av. growth rates GDP/h and wages 1995-2000 percentage points
Linear fit 95% CI
Differences between growth rates (GDP/h and wages) and employment growth
N.B. OECD Wage Data not available for some EU member states joining the EU in or after 2004, NZ, IC and TR; Source: Conference Board Total Economy Database, OECD Stat. Extracts, own calculations
In contrast, Figure 3.26 shows that the relationship between wage moderation and
employment in the long run becomes negative for the period 2000-2009. During
the 2000s employment grew in most countries, including the former communist
economies. However, employment growth in Norway (where wages increased far
more than productivity) is similar to employment growth in the Slovak Republic,
where the growth rate of productivity was 2.5 percentage points above the growth
rate of wages. In Germany, where the growth rate of productivity exceeded the
growth rate of wages by roughly 1% on average per year, employment grew less
than in Sweden, where growth rates of productivity and wages were almost
identical.
It is, of course, possible that the relationship is obscured by the inclusion of
economies at a very different stage of economic development. Indeed, restriction
of the analysis to the EU-15 countries in Figure 3.27 results again in a positive
association between wage moderation and employment performance for the
‘mature’ EU member states, but the relationship is very weak one, and an imposed
regression line is almost horizontal.

Institute for Employment Studies 63
Figure 3.26: Differences in growth rates of productivity and wages and employment growth, 2000-2009
at becz
dk
fifr
de
el
hu
ie
it
lu
nlpl
pt
sk
es
seuk
us
cn
au
no ch
jp
-20
02
04
0
Em
plo
ym
ent g
row
th (
%)
200
0-2
00
9
-2 0 2Diff. of av. growth rates GDP/h and wages 2000-2009 percentage points
Linear fit 95% CI
Differences between growth rates (GDP/h and wages) and employment growth
N.B. OECD Wage Data not available for some EU member states joining the EU in or after 2004, NZ, IC and TR; Source: Conference Board Total Economy Database, OECD Stat. Extracts, own calculations
Figure 3.27: Differences in growth rates of productivity and wages and employment growth, 2000-2009, EU-15 only
at be
dk
fi
fr
de
el
ie
it
lu
nl
pt
es
seuk
-10
01
02
03
0
Em
plo
ym
ent g
row
th (
%)
200
0-2
00
9
-2 -1 0 1Diff. of av. growth rates GDP/h and wages 2000-2009 percentage points
Linear fit 95% CI
Differences between growth rates (GDP/h and wages) and employment growth
N.B. OECD Wage Data not available for some EU member states joining the EU in or after 2004,
64 Wages, productivity and employment
NZ, IC and TR; Source: Conference Board Total Economy Database, OECD Stat. Extracts, own
calculations
An analysis based on labour compensation per employee instead of wages (see
Appendix Figures A1-A3) confirms the weakly positive relationship between
wage moderation and employment growth for the long run as well as for both
sub-periods, but these data are more affected by extremes as they include the
Baltic States, for which OECD wages data were not available. However, the
empirical observations are broadly similar and lead to similar conclusions with
regards to the long run association between wage moderation and employment
outcomes at aggregate level.
Key point
Overall, the empirical data suggest that wage moderation is indeed weakly associated with long-run employment increases, but this finding is likely to be affected by data availability and the time periods covered, and caution is required in drawing policy conclusions.
In order to assess more definitively whether wage moderation is indeed an effective mechanism for increasing competitiveness, leading to production and employment growth, it would be helpful to analyse the development of wages/labour compensation, productivity and employment at less aggregated levels, e.g. for sectors (not currently possible with readily-available and up-to-date comparative data). This would allow us to understand, in particular, whether long-term wage moderation increased competitiveness internationally for sectors exposed to international competition.
Institute for Employment Studies 65
4 Concluding remarks
4.1 Does wage moderation really lead to better economic and employment performance?
Standard microeconomic theory relates wages and productivity very clearly.
While making many simplifying assumptions, the theoretical link between both
measures is extensively used as a criterion to assess wage-setting (and minimum
wage levels) with regard to their implications for employment outcomes. The
main conclusion of microeconomic theory is the following: if the growth of wages
(or more realistically, total labour compensation) exceeds the growth of
productivity, firms would need to reduce output levels and employment in order
to survive. Over time, firms affected by wages growing faster productivity growth
would need to improve productivity growth (e.g. through capital investment),
which would reduce employment opportunities potentially even further. An
alignment of wage growth below the rate of productivity growth is therefore
important in order to maintain high employment levels.
These textbook predictions of neoclassical microeconomic theory are also
discussed in the current political debate at EU level (e.g. Gros 2010). It is argued
that international competition in a single European market (and even more so
under a single currency) would result in reduced competitiveness of firms, sectors
or even entire EU member states if the growth of labour compensation exceeds the
growth of productivity. This could apply in local areas or individual sectors in
different EU member states as more substitutes from other firms and other
countries are available. And equally competitiveness may increase elsewhere at
the same time, as a result of extensive wage moderation following institutional
reforms (the case of Germany is often cited).
The important policy question is: can competitiveness be restored and the
economic/employment situation in some EU member states be improved, through
holding wages growth below productivity increases (or even reducing wages
while productivity growth continues)? Recent data indicate that such adjustments
66 Wages, productivity and employment
are taking place at least to some extent, particularly in economies which enjoy
‘flexible’ bargaining mechanisms (Ireland, Estonia, but also in the US, for
example). It is anticipated that wage moderation should improve/restore
international competitiveness and result in more output and employment in these
countries. However, it is also clear that the success of such a strategy crucially
depends on:
■ The degree of international competition and the availability of substitutes in
consumption, which are very likely to exist for industry and manufacturing, but
not as much for services, public services in particular.
■ The institutions of the labour market. Flexible adjustment processes, including
wage moderation, involve unions and firms bargaining over wages in modern
welfare states. Union wage claims may themselves be affected by
unemployment benefits and employment protection, while public policy
towards labour market regulation may also affect the conditions for wage
moderation.
There are some theoretical and empirical findings presented in this paper
suggesting that wage moderation may increase employment in the medium and
long run, although any relationship appears to be fairly weak, and there are
numerous exceptions at country level, and at different periods.
At the same time, the evidence sows the seeds of doubt about the extent to which
sustained wage moderation (as observed in Germany) is really a successful
mechanism to increase output and employment in the long run. Indeed, empirical
data show that wages were more clearly aligned to productivity in countries such
as the US or the UK (i.e. there was less wage moderation through holding wage
growth below productivity growth). Yet in those countries, over the longer run, in
recent decades these countries report much better employment performance and
higher productivity growth than Germany, where wage growth was held below
productivity growth for a substantial period. It needs also to be remembered that,
even in economic theory (albeit more sophisticated theory than the most simple
models cited by many policy commentators), innovation itself is endogenous, and
excessive wage moderation may reduce innovation activity, resulting in lower
productivity growth in the long run.
4.2 How should monitoring be undertaken?
Whether or not the simple policy recommendation to moderate wage growth in
support of employment growth turns out to be fully justified by the empirical
evidence, there is a strong case for better data and more extensive monitoring in
this area which will:
Institute for Employment Studies 67
■ Provide further, more robust empirical evidence on the wage
growth/productivity growth/employment growth triangle;
■ And, in so far as the relationship is confirmed by the evidence, provide the
basis for monitoring wage and productivity developments to feed into policy
discussions on appropriate wage-setting in individual EU member states.
As EU member states emerge from the recession, productivity growth currently
exceeds the growth of labour compensation in most countries, especially in
countries with flexible labour market institutions (Ireland, Estonia) or with high
degrees of co-ordination (the Nordic countries) in the context of persistent high
levels of unemployment. In Germany, by contrast, where unemployment levels
are already low (and have remained low throughout the crisis) and the economy is
growing strongly, labour compensation growth now exceeds productivity growth.
To some extent, it may be expected that this may help to rebalance the relative
competitiveness of countries and groups of countries in the medium run.
Extending the analysis of wages, productivity and employment to less aggregated
levels (e.g. sectors) is, however, clearly desirable, as the whole question of relative
competitiveness primarily affects sectors exposed, to a greater or lesser extent,
international competition. This would require an informative data set at the level
of sectors, which should consist of:
■ Disaggregated industries rather than broad sectors (as included in AMECO
data);
■ Timely and frequent information in order to observe the impact (and its time
lag) of wage moderation on output, employment and investment activity and
the incentives to innovate;
■ Productivity measured as GDP per hour employed (and not per employee as
included in AMECO data) and further variables that allow to control for
productivity changes arising from changes in the composition of the workforce
and capital stock;
■ Harmonised wage information, including all relevant components of
remuneration;
■ Consistent price level information relevant to production to obtain real growth
of productivity and wages.
Producing such a set of data, perhaps building on the work of the EU KLEMS
database would be an ambitious exercise. Without it, however, it is unlikely either
that the empirical relationships between compensation growth, productivity
growth and employment growth can be fully understood at sectoral level (which
is ultimately the level which matters in a world of international competition), or

68 Wages, productivity and employment
that effective instruments can be development for monitoring developments in
real time, as an aid to policy and wage bargaining processes.
Institute for Employment Studies 69
5 References
Bester H, Petrakis E (2003), ‘Wages and productivity growth in a competitive
industry‘, Journal of Economic Theory, 109 (1), 52-69
Blanchard O (2006), ‘European unemployment: the evolution of facts and ideas’,
Economic Policy, 21, 5-59
Borjas G, (2010), Labour Economics, Fifth International Edition, McGraw Hill
Calmfors L, Driffill J (1988), ‘Bargaining Structure, Corporatism and
Macroeconomic. Performance’, Economic Policy, 6, 14-47
Chennells L, Van Reenen J (1997), ‘Technical Change and Earnings in British
Establishments’, Economica, 64, 587-604
Danthine J, Hunt J (1994), ‘Wage Bargaining Structure, Employment and
Economic Integration’, Economic Journal, 104 (424), 528-41
EU Commission (2007), Employment in Europe 2007, Office for Official Publications
of the European Communities
European Foundation for the Improvement of Living and Working Conditions
Eurofund (2009), Wage formation in the EU, URL:
http://www.eurofound.europa.eu/docs/eiro/tn0808019s/tn0808019s.pdf
Feldstein M (2008), ‘Did wages reflect growth in productivity?’ Journal of Policy
Modelling, 30 (4), 591-594.
Fitzenberger B, Franz W (2003), ‘Industry-Level Wage Bargaining: A Partial
Rehabilitation - The German Experience’, Scottish Journal of Political Economy, 46,
437-457
Fleck S, Glaser J, Sprague S (2011), ‘The compensation-productivity gap: A visual
essay’, Monthly Labor Review, 01/2011, URL
http://www.bls.gov/opub/mlr/2011/01/art3full.pdf
70 Wages, productivity and employment
Franz W (1999), Arbeitsmarktökonomik, 4. Auflage, Springer
Franz W (2007), ‘Der trügerische Charme des Mindestlohns‘, Zeitschrift für
ArbeitsmarktForschung, 40 (4), 431-438
Fuess S, Millea M (2006), ‘Pay and Productivity in ‘Corporatist’ Germany’, Journal
of Labor Research, 27 (3), 397-409
German Council of Economic Experts (1996), Reformen voranbringen,
Jahresgutachten 1996-97 des Sachverständigenrats zur Begutachtung der
gesamtwirtschaftlichen Entwicklung, URL http://www.sachverstaendigenrat-
wirtschaft.de/fileadmin/dateiablage/download/gutachten/1306200.pdf
Glyn A (n.y.), ‘Explaining Labor’s Declining Share of National Income’, G-24 Policy
Brief, No. 4, URL http://www.g24.org/pbno4.pdf
Gouma R, de Vries K, van der Veen-Mooij A (2011), EU KLEMS Growth and
Productivity Accounts March 2011 Update of the November 2009 release, Description of
methodology and country notes, Groningen Growth and Development Centre,
mimeo (URL http://www.euklems.net/data/09ii/sources/March_2011_update.pdf)
Gros D (2010), ‘Europe’s Competitiveness Obsession’, CEPS Commentary, URL
www.ceps.eu/ceps/download/3513
Hammermesh D (1993), Labor Demand, Princeton University Press
Harrison P (2009), ‘Median Wages and Productivity Growth in Canada and the
United States’, Center for the Study of Living Standards Research Note, 2009-2, URL
http://www.csls.ca/notes/Note2009-2.pdf
Hellwig M, Irmen A (2001), ‘Wage Growth, Productivity Growth, and the
Evolution of Employment’, CEPR Discussion Paper 2927, CEPR
Hoffer F and Spiecker F (2011), Change or Lose Europe: ILO Global Job Crisis
Observatory, Geneva: International Labour Office.
http://www.ilo.org/public/libdoc/jobcrisis/download/story108_change_europe.pdf
Kaldor N (1963), ‘Capital accumulation and economic growth’, in Lutz F and
Hague D (eds.), Proceedings of a conference held by the International Economics
Association, Macmillan (Reprint URL
http://unesdoc.unesco.org/images/0015/001576/157612eb.pdf)
Lehment H (2000), ‘Produktivitätsorientierte Lohnpolitik im Auslegungsstreit‘, Die
Weltwirtschaft, 3/2000, 317-329
Lopez-Villavicencio A, Silva J (2010), ‘Employment protection and the non-linear
relationship between the wage-productivity gap and unemployment’, Working
paper CEPN-CNRS, University of Paris Nord
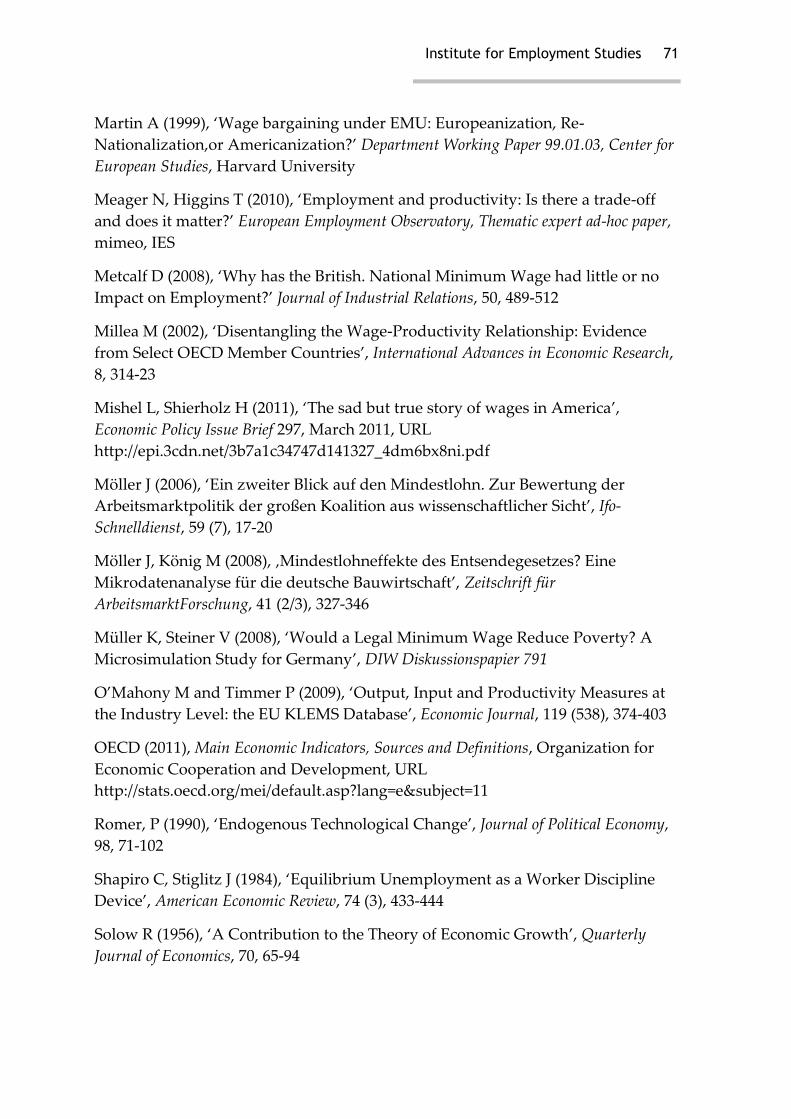
Institute for Employment Studies 71
Martin A (1999), ‘Wage bargaining under EMU: Europeanization, Re-
Nationalization,or Americanization?’ Department Working Paper 99.01.03, Center for
European Studies, Harvard University
Meager N, Higgins T (2010), ‘Employment and productivity: Is there a trade-off
and does it matter?’ European Employment Observatory, Thematic expert ad-hoc paper,
mimeo, IES
Metcalf D (2008), ‘Why has the British. National Minimum Wage had little or no
Impact on Employment?’ Journal of Industrial Relations, 50, 489-512
Millea M (2002), ‘Disentangling the Wage-Productivity Relationship: Evidence
from Select OECD Member Countries’, International Advances in Economic Research,
8, 314-23
Mishel L, Shierholz H (2011), ‘The sad but true story of wages in America’,
Economic Policy Issue Brief 297, March 2011, URL
http://epi.3cdn.net/3b7a1c34747d141327_4dm6bx8ni.pdf
Möller J (2006), ‘Ein zweiter Blick auf den Mindestlohn. Zur Bewertung der
Arbeitsmarktpolitik der großen Koalition aus wissenschaftlicher Sicht’, Ifo-
Schnelldienst, 59 (7), 17-20
Möller J, König M (2008), ‚Mindestlohneffekte des Entsendegesetzes? Eine
Mikrodatenanalyse für die deutsche Bauwirtschaft’, Zeitschrift für
ArbeitsmarktForschung, 41 (2/3), 327-346
Müller K, Steiner V (2008), ‘Would a Legal Minimum Wage Reduce Poverty? A
Microsimulation Study for Germany’, DIW Diskussionspapier 791
O’Mahony M and Timmer P (2009), ‘Output, Input and Productivity Measures at
the Industry Level: the EU KLEMS Database’, Economic Journal, 119 (538), 374-403
OECD (2011), Main Economic Indicators, Sources and Definitions, Organization for
Economic Cooperation and Development, URL
http://stats.oecd.org/mei/default.asp?lang=e&subject=11
Romer, P (1990), ‘Endogenous Technological Change’, Journal of Political Economy,
98, 71-102
Shapiro C, Stiglitz J (1984), ‘Equilibrium Unemployment as a Worker Discipline
Device’, American Economic Review, 74 (3), 433-444
Solow R (1956), ‘A Contribution to the Theory of Economic Growth’, Quarterly
Journal of Economics, 70, 65-94
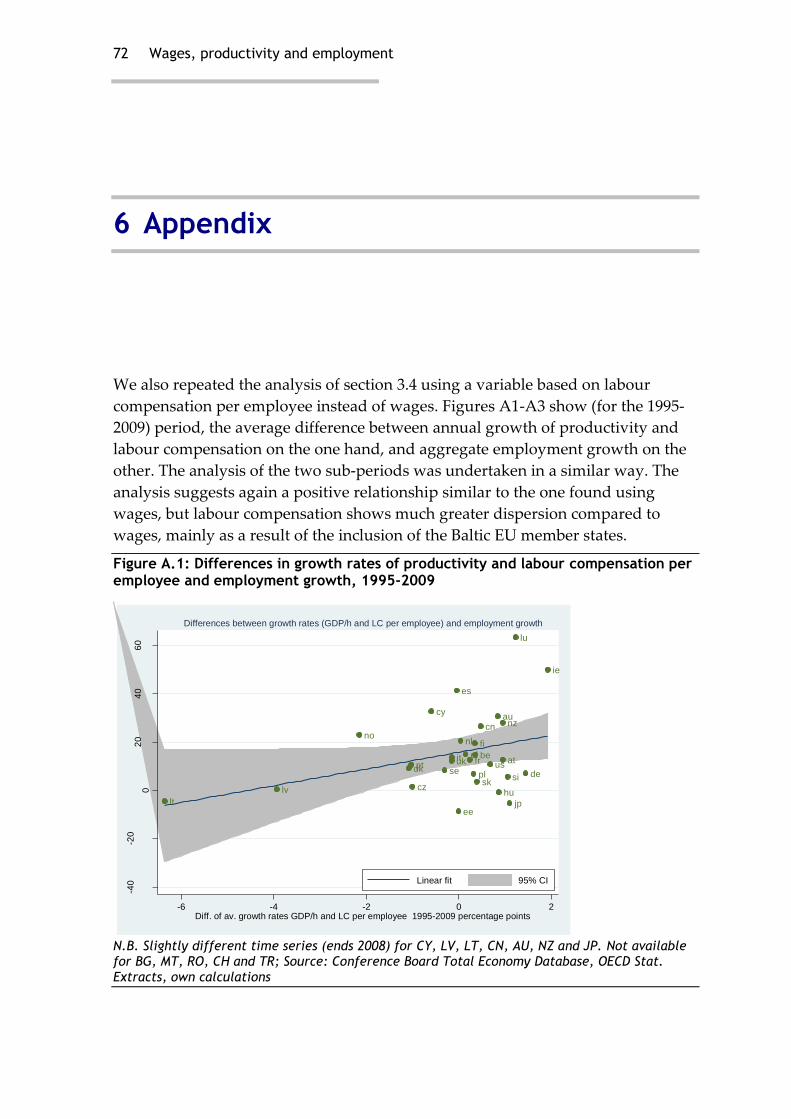
72 Wages, productivity and employment
6 Appendix
We also repeated the analysis of section 3.4 using a variable based on labour
compensation per employee instead of wages. Figures A1-A3 show (for the 1995-
2009) period, the average difference between annual growth of productivity and
labour compensation on the one hand, and aggregate employment growth on the
other. The analysis of the two sub-periods was undertaken in a similar way. The
analysis suggests again a positive relationship similar to the one found using
wages, but labour compensation shows much greater dispersion compared to
wages, mainly as a result of the inclusion of the Baltic EU member states.
Figure A.1: Differences in growth rates of productivity and labour compensation per employee and employment growth, 1995-2009
atbe
cy
cz
dk
ee
fi
fr
de
el
hu
ie
it
lv
lt
lu
nl
plpt
sksi
es
seuk us
cnaunz
no
jp
-40
-20
02
04
06
0
Em
plo
ym
ent g
row
th (
%)
199
5-2
00
9
-6 -4 -2 0 2Diff. of av. growth rates GDP/h and LC per employee 1995-2009 percentage points
Linear fit 95% CI
Differences between growth rates (GDP/h and LC per employee) and employment growth
N.B. Slightly different time series (ends 2008) for CY, LV, LT, CN, AU, NZ and JP. Not available for BG, MT, RO, CH and TR; Source: Conference Board Total Economy Database, OECD Stat.
Extracts, own calculations
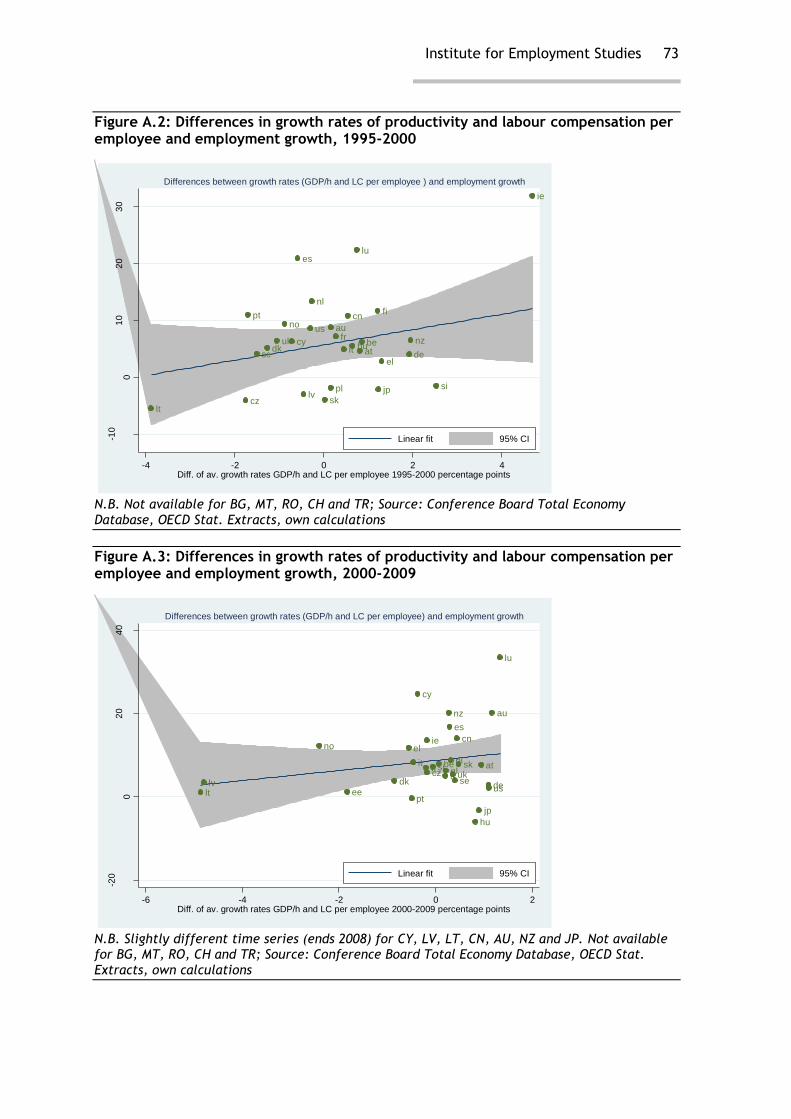
Institute for Employment Studies 73
Figure A.2: Differences in growth rates of productivity and labour compensation per employee and employment growth, 1995-2000
atbecy
cz
dk
ee
fi
fr
deel
hu
ie
it
lv
lt
lu
nl
pl
pt
sk
si
es
se
uk
us
cn
au
nz
no
jp
-10
01
02
03
0
Em
plo
ym
ent g
row
th (
%)
199
5-2
00
0
-4 -2 0 2 4Diff. of av. growth rates GDP/h and LC per employee 1995-2000 percentage points
Linear fit 95% CI
Differences between growth rates (GDP/h and LC per employee ) and employment growth
N.B. Not available for BG, MT, RO, CH and TR; Source: Conference Board Total Economy
Database, OECD Stat. Extracts, own calculations
Figure A.3: Differences in growth rates of productivity and labour compensation per employee and employment growth, 2000-2009
atbe
cy
czdk
ee
fifr
de
el
hu
ie
it
lvlt
lu
nlpl
pt
sksi
es
seuk
us
cn
aunz
no
jp
-20
02
04
0
Em
plo
ym
ent g
row
th (
%)
200
0-2
00
9
-6 -4 -2 0 2Diff. of av. growth rates GDP/h and LC per employee 2000-2009 percentage points
Linear fit 95% CI
Differences between growth rates (GDP/h and LC per employee) and employment growth
N.B. Slightly different time series (ends 2008) for CY, LV, LT, CN, AU, NZ and JP. Not available for BG, MT, RO, CH and TR; Source: Conference Board Total Economy Database, OECD Stat.
Extracts, own calculations