wages in germany, great britain, and the united … · chapter 6 wages in germany, great britain,...
TRANSCRIPT
This PDF is a selection from an out-of-print volume from the NationalBureau of Economic Research
Volume Title: Wages in Germany, 1871-1945
Volume Author/Editor: Gerhard Bry assisted by Charlotte Boschan
Volume Publisher: Princeton University Press
Volume ISBN: 0-87014-067-1
Volume URL: http://www.nber.org/books/bry_60-1
Publication Date: 1960
Chapter Title: Wages in Germany, Great Britain, and the United States
Chapter Author: Gerhard Bry
Chapter URL: http://www.nber.org/chapters/c2510
Chapter pages in book: (p. 266 - 322)
CHAPTER 6
Wages in Germany, Great Britain,and the United States
GeneralIT IS the purpose of this chapter to summarize the major findings inGerman wage behavior and to confront them, wherever possible, with theresults of corresponding inquiries for Great Britain and the United States.Such a comparison should help to determine which features of Germanwage behavior can be regarded as characteristic of wages in general, andwhich must be explained by historical circumstances peculiar to Germany.Ideally, a number of other industrial countries should be included in theinternational comparisons, but only two are dealt with in order to keepthe discussion within manageable limits. Great Britain and the UnitedStates were selected, first, because the industrial histories of the threecountries are roughly comparable; second, because they formed the core ofworld industrialism during the three-quarters of a century ending in 1945;and third, because wage series for each of them are relatively plentiful.
It stands to reason that, within the confines of a brief chapter, thecomparisons must often rest on the results of investigations made bystudents of wages in Great Britain and the United States. At times,readily available summary measures in the form of wage and price indexeswere used. Since these measures for Great Britain and the United Statesare used "as available," that is, without adjustments to assure compar-ability with the German data, most comparisons must be regarded asrough and ready, indicating only broad similarities and differences.
Before we turn to comparison of wage behavior, a brief review of theeconomic development of the three countries is indicated. By the timeGermany had attained political unity and launched its career as an indus-trial nation, Great Britain had already achieved a high level of industriali-zation and a commanding role in the markets for manufactured goods.Britain's advanced industrial development, the limitations of its domesticmarket for industrial products, and its need to import both raw materialsand foodstuffs made that country highly dependent upon industrialexports. To a considerable extent, Germany's industrialization progressedin an atmosphere of economic competition with Great Britain. Duringthe first decades of Germany's economic development, when the industriali-zation process itself created a rapidly mounting demand, German industrialproducts began to replace imports from Britain in the domestic market—especially if the market was protected from British competition. Theconifict became sharper when Germany was well established as an in-dustrial nation, with the needs for raw materials and foreign markets
266
w W
GERMANY, GREAT BRITAIN, AND THE U. S. 267characteristic of an industrially mature country. In foreign marketsGermany soon challenged Britain's virtual monopoly. As for the UnitedStates, it was blessed with a unique combination of advantages. A relativelate-corner to the industrial field, at least compared to Britain, it enjoyedthe benefits of rapid industrial growth. But unlike the other two countries,the United States encompassed a huge territory rich in resources and witha large and growing domestic market—an "empire" within its own borders.This made possible extensive industrial expansion without an immediateneed to invade the markets of competing nations or to defend Americanmarkets politically.
The differences in the economic and political development of the threenations affected the pace of their industrial progress as well as theireconomic and military fortunes during and after their first overt conifict—World War I. Great Britain's victory after heavy losses, America's lateentry into the struggle and her important contribution to the Allied causeto some extent re-established the array of power as it had existed before thewar. Britain maintained an essentially defensive economic position basedon the resources of her empire, and the United States continued a relativelyunimpeded economic growth. Germany, after its defeat, was thrown backto the position of the tardy aspirant who must start anew. But by 1929it had largely recovered from the worst effects of defeat and had modern-ized its productive apparatus. The ravages of the Great Depressionprovided the political opportunities for preparing a new all-out challengeto the international status quo. The National Socialists devoted Germany'sindustrial potential to rearmament, and tried to adjust the Europeanpolitical scene for a second time to what must have appeared to them asa new balance of economic power. World War II was the result of thischallenge. And in that war Germany's defeat was decided—to a fargreater extent than in World War I—by the ever-growing might of twonations, the United States and the Soviet Union. Germany had not beenable to attain industrial predominance by being first in the field likeGreat Britain, or by being large and protected like the United States.German ambitions, if they were to be realized, must overcome strongeconomic and political resistance. The first attempt to break this resistanceended in a major setback, the second in Germany's destruction as apolitical unit.
The patterns of the relationship among the three industrial powershave been important determinants of trends in economic growth and inwage behavior. At an earlier point in this study we have followed realper capita income changes in Germany, Great Britain, and the UnitedStates, for most of the period with which we are concerned (see Table 5).Let us recapitulate the broad findings insofar as they bear upon wagedevelopments. Between 1871 and 1913, real per capita income doubledin Germany and Great Britain, trebled in the United States. Between 1913and 1939 the increase was about one-third in the United States and a little

268 WAGES IN GERMANY
less in the other countries. The climate of the interwar period as a whole,however, differed sharply among the three countries. In Germany, realper capita income for 1925-32 was 7 percent below the 1913 level, inGreat Britain 7 percent above, and in the United States 26 percent above.
There were notable differences also in trade union organization. Thefollowing tabulation shows total union membership in percent of thegainfully occupied population of each country. Before World War I,the degree of organization was relatively low in all three countries, with
Trade Union Membership, in Percent of Labor Force
Germany Great Britaina United States1910 8 14 61920 42 43 121930 24 22 7
a Great Britain's union membership in 1910, 1920, and 1930 is compared with theworking population for 1911, 1921, and 1931. If union membership data in the latterthree years are used for comparison, the percentages are 17, 34, and 21, respectively.souRcE: For Germany, our estimates: union membership, three big unions (Table 11)plus estimated other unions (see Table 12 for interwar period); labor force, interpolatedfrom data for census years (see Table 6). For Great Britain and the United States, seeLeo Wolman, Union Membership in Great Britain and the United States, Bulletin 68,National Bureau of Economic Research, 1937, p. 10.
Great Britain ranking first, Germany in an intermediate position, andthe United States last. After World War I, Germany attained a degree oforganization roughly comparable to that of Great Britain. In all threecountries unionizatio.n grew rapidly between 1910 and 1920, and declinedsharply between 1920 and 1930. By 1920 unions in Germany and GreatBritain accounted for more than 40 percent of the working populations,but in the United States for only 12 percent. In 1930, however, in bothGermany and Great Britain, only 20 to 25 percent of the gainfully occupiedpopulation belonged to trade unions, and in the United States less than7 percent. Unions in the United States did not attain their major growthuntil the later years of the Great Depression. By the end of the 1930'sthe degree of unionization in the United States was probably about 15percent and in Great Britain 28 percent.' In the meantime, however,German trade unions had been ingulfed by the Nazi Labor Front.
Long-Term TrendsMONEY WAGESDuring the three-quarters of a century under review, money wage levelsin all three countries showed clearly defined and substantial growthtrends. The rises were not uninterrupted, but the factors making forgrowth in each of the countries were persistent enough to bring about,
1 EstimateS by Leo Wolman, personal communication.
GERMANY, GREAT BRITAIN, AND THE U. S. 269for the period 187 1-1944, a quadrupling of hourly wages in Germany andGreat Britain, and a sevenfold increase in the United States.
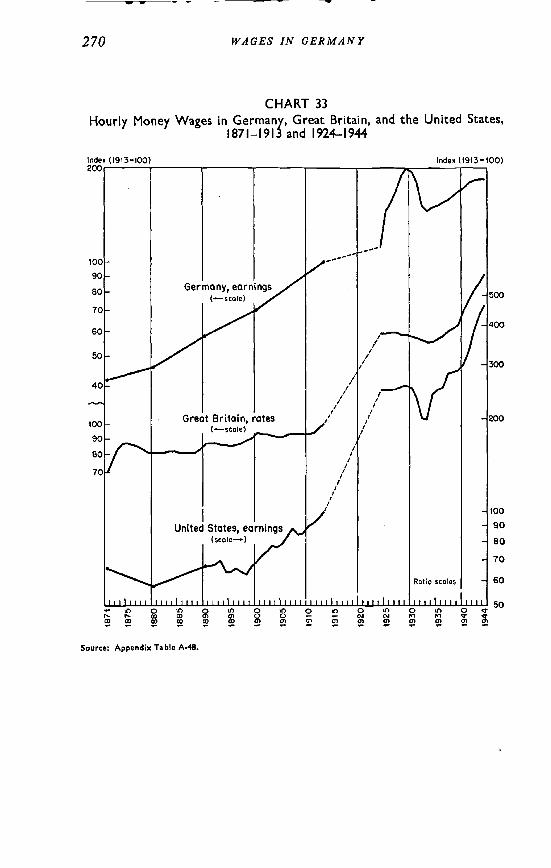
Appendix Table A-48, and Charts 33 and 34 present indexes depictingthe approximate course of wage levels in Germany, Great Britain, and theUnited States.2 We observe from these exhibits that up to World War I,hourly money wages increased most rapidly in Germany, next in theUnited States, and most slowly in Great Britain. After 1913 the picturechanged radically, with Germany now showing the least rapid advance inhourly wages. British rates rose on the whole more steeply after 1913 thandid German rates, and United States earnings made by far the strongestgains (see Chart 33). During the three decades following the outbreak ofWorld War I, hourly wages in Germany rose by about one-half, tripledin Britain, and increased four-to-five times in the United States.3
Average hourly wage levels, relative to 1913, are shown in summarymeasures for selected periods in the following tabulation. For all three
Germany Great Britain United States
Period Rates Earnings Rates - Earnings
1924-32 153 166 194 2431924.39 148 162 194 249192,4-44 147 166 211 281
periods, German money wage levels are seen to be closer to the 1913base than those in Great Britain and the United States. This is true whetherGerman wage rates are compared to British rates, or German earnings toUnited States earnings. The relative positions of money wages in thethree countries are plotted also in the upper portions of Charts 35 and 36.Of particular interest is a comparison of wage changes during the lastdecade and a half of the Reich's existence. Between 1929 and 1944,German hourly wage rates and earnings show a net decrease while Britishwages show an increase of 50 percent and United States wages an evenlarger growth (80 percent in hourly earnings).
Because the measures presented above must have been influenced bydifferences in wage concepts and coverage in. the several national indexes,
2 For Germany, the data developed in Chapter 2 were used. For Great Britain andthe United States, sources and adjustments are described in Appendix Table A-48and notes thereto. The intention was to base comparisons on comprehensive wagemeasures over long periods of time. Resort to disparate wage measures was unavoidable,since comparable long-term series of rates and earnings were not always available.To permit comparisons between roughly equivalent wage measures, both rate andearnings series were reported for post-1913 Germany. Comparison between the twoseries shows a steeper long-term increase in earnings than in rates. In order to excludethe effects of the differences in wage concepts and of differences which might arise fromthe varying industrial and occupational coverage of the national indexes, direct com-parisons of wages for building workers will also be carried through. For 1913 and 1924-44, some measures of wage rates proper can be obtained for all three countries.
For the United States, these observations are largely based on earnings, but thereis no doubt that similar rises would be shown also by rates.
270 WAGES IN GERMANY
CHART 33
Hourly Money Wages in Germany, Great Britain,1871—1913 and 1924—1944
and the United States,
Source: Appendix Table A-48.
Index (1913=100)Index (1913100)200
— 0 't) 0 0 to 0F-. 0 0 0 —0 0 0 0 0 0 Q)
— ' — 'it) 0 IL) 0 U) 0,-. C'J r) qC) C) C) C) 0) 0) 0)— — — .- _ — .-

GERMANY, GREAT BRITAIN, AND THE U.S. 271
CHART 34Daily or Weekly Money Wages
States, 187in Germany, Great Britain, and1—1913 and 1924—1944
the United
Source: Appendix Table A-48.
Index Index
-. 0 U) U) 0 U) 0 I') 0 U) 0 U) 0I.-. P- Q 0 .- — IVI ,fl
U, 0)r r — ' r r r r r r r — —

272 WAGES IN GERMANY
CHART 35
Hourly Money Wages, Cost of Living, and Real Wages in Germany,Great Britain, and the United States, 1924—1938
Germany Great BrLtain
......
S \ •:•:
:L-:•:j j.•:•.. I I I
Real Wages
:::.:.:::::::
.....-.-...:..
:::
:::.
•::::::::::::::::
Rates
•::•
:::
•:—:—
i
i i i
Real_Wages
::
:•: :•:•:•:•:•:•:•:
— lp&
: ::::::::::: Aotio scales
Shaded areas represent business contractions; dots indicate cyclical turning points of the series.Source: Appendix Tables A-48, A-49, and A-50.
Money Wages Money Wages Money Wages
v-...-:
I LI I
Cost of Living
300
250
0200
N)
a)
C
100
200
00150
0
C
Cost of Living
I I i i i i
Cost of Living
100
200
I
0 0 N (OW '.0W 0 N t (0WN N N N) N) N) N) N) N N N N) N) N) N) N) N N N Ni N) Ni N) N)0)0)0)0)0)0)0)0) 0)0)0)0)0) a m 0)0)0)0) O 0)0)0)

GERMANY,
S
GREAT BRITAIN, AND THE U.S. 273
CHART 36Weekly Money Wages, Cost of Living, and Real Wages
Great Britain, and the United States, 1924—1938in Germany,
Germany Great Britain United States
-
3,::
: •:•::::•::::•:: •I
Real Wages
Earnings
W WON WN N N r)mm mm ma) m
—
S.
. Rates
—I I I
Cost of Uving
ELi
\—/
Real Wages
0N N N r4) r()a) a) a) a) a) a) mm
— —.
:
.."
.— — :::
'\
:I I I I I
Real Wages
W WONN N N r)a) a) a) a) a) a) m m
Shaded areas represent business contractions; dots indicate cyclical turning points of the series.Source: Appendix Tables A-48, A-49, and A-50.
Money Wages Money Wages Money Wages
EarningsV
_____________
I t I I I
Cost of Living
I
00II
a)
0C
00II
a)
'C
C
250
200
150
100
90
200
150
tOO
200
ISO
100
90
80
70
Cost of Living

274 WAGES IN GERMANY
an attempt was made to exclude the effect of such differences by comparinghourly wage rates for skilled and for unskilled building workers in thethree countries. These measures will be referred to later, in connectionwith the analysis of real wages and wage differentials. The result, simplystated, is that the relative movements of the three series for building workersgenerally confirm the major findings derived from the comprehensiveindexes (see Appendix Table A-51).4
The seventy-five years covered by our survey witnessed a drasticreduction in the length of the workweek, amounting to roughly one-third,in each of the three countries. Though direction and total reduction aresimilar for all three, the levels and the timing differ from one country toanother. Germany's workers, in 1871, still labored six days a week andabout twelve hours a day, or approximately seventy-two hours a week.In the United States in that year the workweek was shorter, probablynot much above sixty hours.5 About the same workweek prevailed inGreat Britain.6 Table 69 traces the approximate course of the reductionof hours in the three countries. Note that from 1871 to 1932 hours seemto have gone down faster in Germany than in the other two countries.The faster reduction of hours in Germany prior to World War I isintimately related to that country's position as an industrial late-corner,starting out with a long workweek in 1871. After 1933, the extraordinaryconditions that prevailed in Germany make it difficult to ascertain"trends."
In view of the general movement toward shorter working hours in allthree countries, the upward trend of weekly wages is, of course, milderthan that of hourly wages. The differences in the development of hours inthe three countries affect the relation among the national wage trends(see Appendix Table A-48 and Chart 34). From 1871 to 1944 weeklywages increased about threefold in Germany and Great Britain, but almostsixfold in the United States. Again, the pre-1913 trend in German weeklywages is steeper and the post-1913 trend flatter than the comparabletrends in the two otifer countries. The lower average level, relative to 1913,of German wages during the selected interwar periods shows up also inweekly wages. Thus, the major findings derived from hourly wage informa-tion seem confirmed by the movement of weekly wages.
During the interwar period 1924-39,skilledbuildingworkersinGermanycommandedhourly rates about 50 percent above those prevailing in 1913. Comparable British rateswere about 90 percent and United States rates almost 150 percent above pre-WoridWar I levels. Increases in the rates for unskilled building workers were steeper in allthree countries but the order in the relative rise remains the same.
See Clarence D. Long, Wages and Earnings in the United States, 1860-1890(Princeton University Press for National Bureau of Economic Research, 1960), Table 13.See also Cohn Clark, The Conditions of Economic Progress (London, Macmillan,1951), p. 47; and Joseph S. Zeisel, "The Workweek in American Industry," 1850-1956,Monthly Labor Review, January 1958.
A. L. Bowley, "Wages, Earnings and Hours of Work, 1914-1947, United Kingdom,"London and Cambridge Economic Service, Special Memorandum No. 50, May 1947, p.1 1.

GERMANY, GREAT BRITAIN, AND THE U. S. 275
TABLE 69
Hours Worked per Week, Germany, Great Britain, and the United States,Selected Years, 1871-1944
(1913 = 100)
Year Germany Great Britain United States
1871 120 114 1131880 117 102 1121890 113 102 1071900 107 102 1061913 100 100 100
1924 81 87 881929 84 86 891932 75 86 771939 88 89 761944 88 . 90 91
SOURCE:Germany:1871-1913, estimated, see Chapter 1, section on Trends in Hours of Work. For
1913-44, based on ratio of weekly earnings to hourly earnings, as given in AppendixTable A-48.
Great Britain:1871-1913, based on ratio of weekly rates to hourly rates, as given in Appendix
Table A-48. For 1913-42, Cohn Clark's estimate of average hours worked, includingagriculture, The Conditions of Economic Progress (London, Macmillan, 1951), p. 63.For 1944, United Nations, Statistical Yearbook, 1949-1950, p. 89.
United States:187 1-90, Clarence D. Long, Wages and Earnings in the United States, 1860-1890,
Table 13. Spliced to later segment in 1890. For 1890-1913, Albert Rees, in 38thAnnual Report (National Bureau of Economic Research, 1958), p. 59. For 1913-44,Bureau of Labor Statistics, as given in Historical Statistics of the United States, 1789-1945, p. 67, Series D 118.
WAGES AND PRICESWe may ask to what extent the marked wage increases and the differencesbetween the wage trends in the three countries are due merely to variationsin general price levels—for it is obvious that price levels must have hadsome influence on wage trends. Table 70 shows long waves of raw materialprices in all three countries. At the foundation of the Reich in 1871, theseprices were as high or higher than they were on the eve of World War I;in 1890 they were 15 to 20 percent lower; and in 1929 they were 30 to40 percent higher. In 1929, price levels, as measured by the indexes, were50 to 70 percent higher than in 1890, a fact that helps to explain the wagerises during the same period. But between 1871 and 1913 wages rose,although price levels were as low or lower in the later than in the earlieryear. And between 1924 and 1939 hourly wages showed a net rise andprices a net drop. It is true that the price indexes cover only a smallpart of the multitude of goods sold, and also that they are not comparable

276 WAGES IN GERMANY
TABLE 70
Wholesale Prices in Germany, Great Britain, aM the United States,Selected Years, 1871-1944
(1913 = 100)
Year GermanyGreatBritain
UnitedStates
1871189019001913
1008690
100
1188588
100
1198180
100
19241929193219391944
1361318696
110
16513495
113186
141137
93110149
Averages
1924-32
1924-391924-44
123109108
133121133
130122125
SOURCE:Germany: Appendix Table A-I.Great Britain: For 1871-19 13, Sauerbeck-Statist Index, as published by U. S. Bureau
of Labor Statistics, Bul. No. 284, p. 280. For 1913-44, League of Nations, StatisticalYear-book, 1932-33, p. 268, and 1942-44, p. 195.
United States: Historical Statistics of the United States, 1 789-1945, pp. 233-234,Series L 15.
between countries. However, there is satisfactory evidence that neitherthe growth nor the differential behavior of wage trends can be explainedprimarily by variations in wholesale price levels.
Appendix Table A-49 and Chart 37 present data on retail price changes,in the form Of indexes of living costs. These prices show a closer corre-•spondence to wages than do wholesale prices. Marked long-term growthtrends are to be noted both in hourly wages and in living costs through thelast fifty years of the period under investigation. The faster net rise ofGerman wages before World War I—relative to that in the other twocountries—is paralleled by a steeper increase in living costs. Similarly,the slower rise of German wages between 1913 and 1939, for instance,finds a parallel in a milder increase in consumers' retail prices. However,the long-term increases in wages are greater than in living costs, and thedifferences in wage trends are not simply related to differences in retailprices. For instance, the rise of money wages in the United States, from1913 to 1939, exceeds substantially that in Great Britain, whereas the netadvance of living costs appears to have been greater in Great Britain thanin the United States during those years.

GERMANY, GREAT BRITAIN, AND THE U. 5.. 277
CHART 37
Cost of Living in Germany, Great and the United States, 1871—19 13and 1924—1944
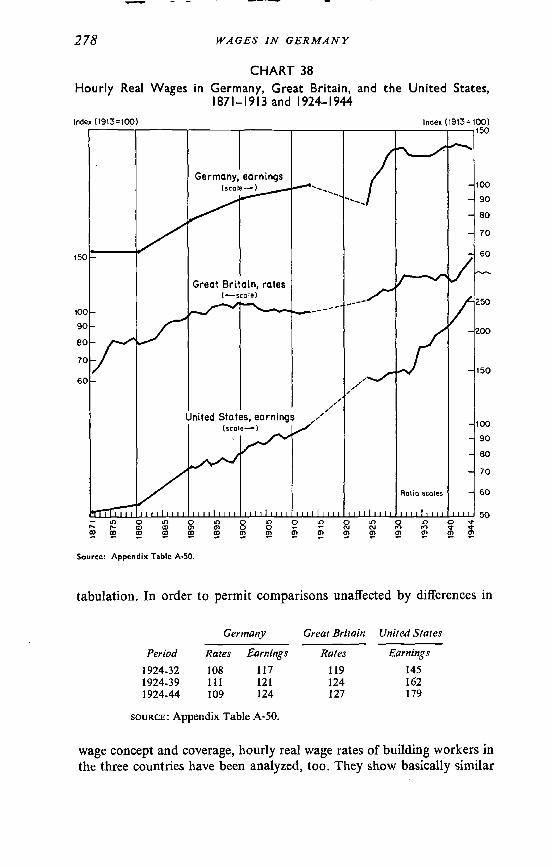
REAL WAGESIt was found that hourly real earnings just about doubled in Germanybetween 1871 and 1944. This increase is of course considerably less thanthat of the comparable money wages, which quadrupled. As indicated bythe indexes presented in Appendix Table A-50 and Chart 38, the increasein German hourly real wages is a little below that in hourly real rates inGreat Britain; it is substantially less than the rise of hourly real earningsin the United States, which was fivefold. Before the outbreak of WorldWar I, German hourly real wages rose faster than British but more slowlythan those in the United States. After 1913, German hourly real wageslagged. The low standing—in relation to 1913—of German hourly realwage levels during the interwar period is brought out again in the lowerpanel of Chart 35 and the three sets of averages found in the following
index (1913=100) Index (1913=100)
Source: Appendix Table A-49.
278 WAGES IN GERMANY
CHART 38
Hourly Real Wages in Germany,1871—19 13
Greatand 1924—1944
Britain, and the United States,
Index (1913=100)
Source: Appendix Table A.50.
Index (1913= 100)
tabulation. In order to permit comparisons unaffected by differences in
SOURCE: Appendix Table A-50.
wage concept and coverage, hourly realthe three countries have been analyzed,
wage rates of building workers intoo. They show basically similar
0 0 IC) 0 0 it) 0 It) 0 It) 0 q1- N 0) 0) 0 0 — — C'.' C'J N) N)
m 0) o 0)— _ -. — •1-. — w_ •- — ,_ — — —
Germany Great Britain United States
Period Rates Earnings Rates Earnings1924-32 108 117 119 1451924-39 111 121 124 1621924-44 109 124 127 179

S
GERMANY, GREAT BRiTAIN, AND THE U. S. 279
Daily or WeeklyCHART 39
Real Wages in Germany, Great Britain, andStates, 1871—1913 and 1924—1944
the United
Index (1913=100)
150
100
90
80
70
behavior.7 The data and measures underlying these results can be foundin Appendix Table A-52.
Appendix Table A-50 and Chart 39 contain measures of weekly realrates and earnings. The rise of weekly real wages is of course affected bythe reduction of working hours which occurred at somewhat different ratesin the three countries. The net rise of weekly real wages between 1871 and1944 amounted to about 55 percent in Germany, in Great Britain to about80 percent, and in the United States to about 300 percent. Between 1871and 1913 the weekly real wage rises in Germany and Great Britain are verysimilar. However, they were concentrated in different subperiods. While
Similarity is to be noted in the low interwar position of German hourly real wagerates, the intermediate position of British, and the high levels of United States wages,all measured relative to 1913. This order—though not the extent of differentiation—isthe same as that observed in money wage trends.
Index (1913= 100)50
Source: Appendix Table A.50.

280 WAGES IN GERMANY
enormous gains seem to have occurred in Great Britain during the decadesof the 1870's and 1880's German real wages rose considerably faster thanBritish toward the end of the century. As pointed out in Chapter 2,around 1900 weekly real earnings in Germany had virtually reached their1913 level. Comparison with real wage behavior in England suggeststhat this was not necessarily a specifically German phenomenon. Indeedthe indexes seem to indicate that 1913 levels in Great Britain were reachedas early as 1890 and that they were actually exceeded around 1900. It isnecessary, however, to make liberal allowances for margins of error.8The evidence available at the time of this writing suggests, in any case,that the decade or decades immediately preceding World War I did notwitness substantial increases of weekly real wages in the two largeEuropean industrial countries. Economic progress for wage earnersduring these years seems to have been concentrated in other directions.In Germany it was expressed in a decline of average hours worked and anincrease of industrial employment opportunities at relatively high wages.In Great Britain the available data on the length of the workweek showonly a 2 percent decrease between 1890 and 1913. However, industrializa-tion in Britain made rapid progress during these years, and the additionalindustrial employment opportunities, at wages in excess of those paidin agriculture or handicrafts, for example, may have contributed to thewell-being of British wage earners.
For the years following 1913, both Appendix Table A-50 and Chart39 point up the generally high levels—relative to that base year—ofweekly real earnings in the United States and the low levels in Germany.Note that in 1929 and 1939 the relatives for Germany are higher than thosefor Great Britain. However, the British index numbers are based on wagerates for a normal workweek, and therefore do not reflect the wageincreases accruing from overtime, other work at premium pay, and perhapschanges in the composition of the work force. These elements may havebeen important factors in the wage increases between 1913 and the twoprosperous years under consideration. Thus, for these two years, theincrease of weekly earnings probably exceeded the reported increase ofweekly rates. The real wage position of the three countries during theinterwar years can be judged on the basis of the period averages relative
8 Phelps Brown and Handfield-Jones, in their article, "The Climacteric of the 1890's:A Study in the Expanding Economy," Oxford Economic Papers, October 1952, calledattention to the stagnation of real wages in several industrial countries during thepre-1913 decades. They advanced the idea that the "climacteric" was an internationalphenomenon, brought about by basically similar circumstances. But note that, pendingfurther studies, the similarity of the "leveling-out" should not necessarily be regardedas a proof of the phenomenon. The limited coverage of the cost-of-living data in parti-cular may have brought about a similar bias in several countries. For the United States,furthermore, recent recomputations of real wages show little of the leveling-out thatcharacterized earlier estimates. The more recent studies, by Albert Rees and by ClarenceD. Long, were used throughout to describe wage behavior in the United States up to1913.

GERMANY, GREAT BRITAIN, AND THE U. s. 281
to 1913, given below. During 1924-32 the average level of German weekly
Germany Great Britain United States
Earnings Rates Earnings1924-32 96 104 1251924-39 101 108 1301924-44 105 110 147
SOURCE: Appendix Table A-50.
real earnings was 4 percent below 1913 levels and substantially lower thanthe comparable position of British and United States wages. The rankingof the three countries is, with respect to wage increases, the same ifthe period is extended forward to 1939 or to 1944.
An important finding of the study of German wages was the closeresemblance of trends in weekly real earnings to corresponding trendsin per capita income. That such resemblance exists for all three countriesis suggested by the following tabulation of interwar levels relative to1913.
Weekly Real Wages and Per Capita Real Income, 1(1913 = 100)
Great UnitedGermany Britain States
Weekly real wagesb 99 105 125Per capita real national income 93 107 126
a The period 1925 through 1932 was selected so that comparison between wages andincome could be made for the same years. German real Income data are not availablefor the year 1924.
b Earnings for Germany and the United States, rates for Great Britain.souRcE: See Appendix Table A-SO (weekly real wages), and Table 5 (per capita realincome).
Note that the relative position of weekly real wages is extremely closeto that of per capita real national income, particularly in Britain and theUnited States. However, a good deal of this surprisingly high correspond-ence must be attributed to coincidence. There is, for example, considerabledifference in the coverage of wage and income indexes. Moreover, indexlevels in individual years vary far more than do the averages. Nevertheless,comparison of real wage indexes and per capita real income data showsthe following points of correspondence:
I. Weekly real wages reflect the strong net rise in per capita real incomein the years 1871 to 1939.
2. Between these end years the approximately equal rise of per capitaincome in Germany and Great Britain, as well as the substantiallygreater rise in the United States, is reflected in real wage behavior.
3. A similar correspondence is notable also for the interwar periods1925-32 or 1925-33, relative to 1913.

282 WAGES IN GERMANY
4. The rank of the countries and the basic correspondence of realwages and real income are maintained also if the period of comparisonis expanded to 1939. That is, during the decade and one-half betweenthe stabilization of the German currency and the onset of WorldWar II, German weekly real earnings and per capita real incomeaveraged approximately their 1913 levels; British real rates and percapita income were roughly 10 percent above 1913; United Statesearnings were about 20 percent and per capita income 30 percentabove their levels on the eve of World War I.
It is not necessary to analyze such correspondence in every detail.Note, however, a striking lack of agreement with reference to the UnitedStates, where per capita real income is reported to have almost trebledduring the years 1871-1913, while weekly real earnings advanced by only70 percent. Part of this difference can be readily explained as a consequenceof the industrialization process, during which the employment compositionshifted from agriculture to manufacturing. But there may be other causessuch as the use of different deflators, and perhaps inadequacies in thebasic information. Apart from this major exception, a basically closerelation between per capita national income and average weekly realearnings in the three countries prevails.
Wage DifferentialsGENERALTrends of German wages—according to the analysis in Chapter 2—tendedto show considerably less dispersion than, for instance, trends of differentgroups of wholesale prices. Similar conclusions follow from a cursoryexamination of data for Britain and the United States. Again, it is not somuch the absence of consonant changes in the price structure that dis-tinguishes wage changes from price changes, but rather the grossly in-congruous behavior of a few classes—which can be found usually inwholesale prices but rarely in wages. To take an example from the UnitedStates: while the index of building material prices computed by theUnited States Bureau of Labor Statistics increased two and one-half timesbetween 1890 and 1944, the index of metal and metal product pricesdecreased slightly.9 Such divergences in trends cannot be found in wagemovements. The reason is that technological progress and consequentdecreases in production costs may affect industrial products in widely.different ways, though they tend to have a uniform influence upon theprice of labor.
The relative uniformity of wage changes does not, of course, precludegradual changes in the wage structure. For Germany these changes havebeen measured by wage differentials and described in Chapter 3. We haveobserved a long-term tendency toward decreasing differentials, that is,
See Historical Statistics of the United States, 1789-1945, pp. 23 3-34.
GERMANY, GREAT BRITAIN, AND THE U. S. 283toward a greater equality in the wage structure. However, the equalizingtrends showed differing strengths in the several segments of the wagestructure and during different periods of German wage history.
SKILL DIFFERENTIALSThe analysis of German skill differentials showed a long-term tendencytoward narrowing, and a fairly close empirical relationship betweenchanges in skill differentials and changes in living costs. In keeping withthe latter relationship we found a tendency toward first a widening, andthen a narrowing, of skill differentials before 1913. During World War Iand continuing through the inflation, the skill gap declined sharply, andby 1923 had virtually disappeared. Stabilization brought a re-establish-ment of substantial differences between the wages of skilled and unskilled,but never to the extent obtaining before the war. In the early post-stabilization years there was a moderate tendency toward a further narrow-ing of the skill gap. However, from the end of the 1920's the relationbetween wage rates of unskilled and skilled workers remained fairly stable.This was the case not only during the last years of collective bargaining,but also during the wage administration of the National Socialists. Forall of this period wage rates of unskilled male workers, in an average ofseventeen industries, amounted to about 80 percent of those forskilled.
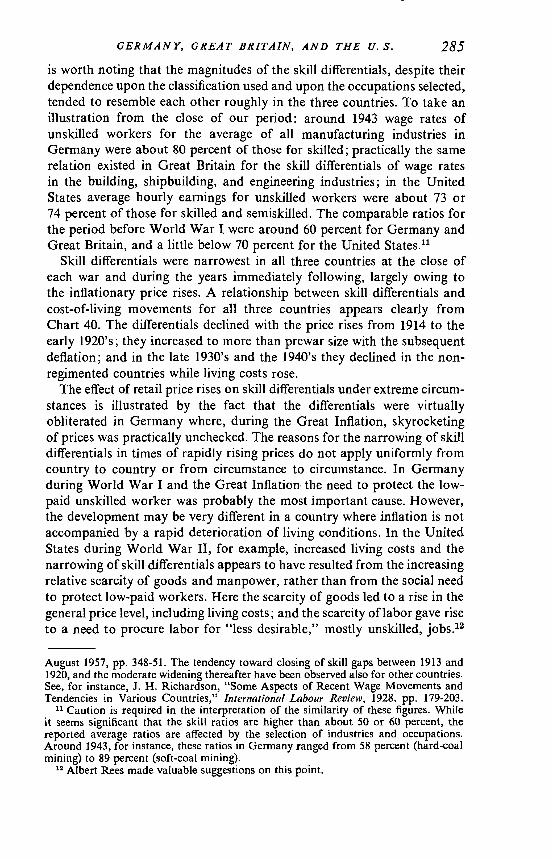
Neither the long-term tendency toward a narrowing of skill differentialsnor the close relation between these differentials and living costs was apeculiarly German phenomenon, as we may observe when we compareskill differentials in the building industries of Germany, Great Britain,and the United States. Chart 40 and Appendix Table A-53 show importantelements of correspondence among the major changes in skill differentials.Noteworthy in this connection decline of these differentials between1913 and the early 1920's, the subsequent moderate increase to less thanprewar scope, and the more recent tendency toward a further reduction ofthe skill gap. Illustrations are taken from the building industry becauselong-term data on that industry are available for all three countries.There is much evidence that basically similar trends characterized wagebehavior in the manufacturing, mining, and transportation industries.'0 It
10 For the United States, see Leo Wolman, in 32nd Annual Report, National Bureauof Economic Research, 1952, P. 43; Harry Ober, "Occupational Wage Differentials1907-1947," Monthly Labor Review, August 1948, pp. 127-34; Philip W. Bell, "CyclicalVariations and Trend in Occupational Wage Differentials in American Industry since1914," Review of Economics and Statistics, 1951, pp. 328 if.; Edwin Mansfield, "WageDifferentials in the Cotton Textile Industry, 1933-1952," in Review of Economics andStatistics, February 1955, p. 80. For Great Britain, see the data for industries otherthan building presented by K. G. J. C. Knowles and D. J. Robertson, "Differencesbetween the Wages of Skilled and Unskilled Workers, 1880-1950," Bulletin of the OxfordUniversity Institute of Statistics, April 1951, p. 111; also Bowley, "Wages, Earnings andHours of Work, 1914-1947, United Kingdom," p. 6. For evidence on further contractionof British skill differentials during recent years, see Edwin Mansfield, "A Note onSkill Wage Differentials in Britain, 1948-54," Review of Economics and Statistics,

284 WAGES IN GERMANY
CHART 40
Skill Differentials in the Building Industry andGreat Britain, and the United
Cost of Living,States, 1904—1950
Germany,
Per cent
Great Britain
Index (1913=100) Germany250
200
150
100
50
300
250-
200 - ' Cost of living,'II II150 -
I100 - .—'-——a———
HIll 11111111 I I iii ii iiil iiuli iiil i I tili iiili iiilUnited States
250,I
200- s. // \•____ Cost of living ..'/I150- III
100 -
50-
i i Ii I I I I i i i I i I I
40
30
20
to
40
30
o ui 0 0 In 0 ifl Ino 0 . — C\J C"J
0' 01 0} 01 01 0)— — — ' — r r —
The differentials are the difference between wage rates skilled and unskilled workers, expressed as percentor the former.Source: Table 74, Appendix Tables A.49, A-53, and their sources.
GERMANY, GREAT BRITAIN, AND THE u. s. 285
is worth noting that the magnitudes of the skill differentials, despite theirdependence upon the classification used and upon the occupations selected,tended to resemble each other roughly in the three countries. To take anillustration from the close of our period: around 1943 wage rates ofunskilled workers for the average of all manufacturing industries inGermany were about 80 percent of those for skilled; practically the samerelation existed in Great Britain for the skill differentials of wage ratesin the building, shipbuilding, and engineering industries; in the UnitedStates average hourly earnings for unskilled workers were about 73 or74 percent of those for skilled and semiskilled. The comparable ratios forthe period before World War I were around 60 percent for Germany andGreat Britain, and a little below 70 percent for the United States."
Skill differentials were narrowest in all three countries at the close ofeach war and during the years immediately following, largely owing tothe inflationary price rises. A relationship between skill differentials andcost-of-living movements for all three countries appears clearly fromChart 40. The differentials declined with the price rises from 1914 to theearly 1920's; they increased to more than prewar size with the subsequentdeflation; and in the late 1930's and the 1940's they declined in the non-regimented countries while living costs rose.
The effect of retail price rises on skill differentials under extreme circum-stances is illustrated by the fact that the differentials were virtuallyobliterated in Germany where, during the Great Inflation, skyrocketingof prices was practically unchecked. The reasons for the narrowing of skilldifferentials in times of rapidly rising prices do not apply uniformly fromcountry to country or from circumstance to circumstance. In Germanyduring World War I and the Great Inflation the need to protect the low-paid unskilled worker was probably the most important cause. However,the development may be very different in a country where inflation is notaccompanied by a rapid deterioration of living conditions. In the UnitedStates during World War II, for example, increased living costs and thenarrowing of skill differentials appears to have resulted from the increasingrelative scarcity of goods and manpower, rather than from the social needto protect low-paid workers. Here the scarcity of goods led to a rise in thegeneral price level, including living costs; and the scarcity of labor gave riseto a need to procure labor for "less desirable," mostly unskilled, jobs.'2
August 1957, pp. 348-5 1. The tendency toward closing of skill gaps between 1913 and1920, and the moderate widening thereafter have been observed also for other countries.See, for instance, J. H. Richardson, "Some Aspects of Recent Wage Movements andTendencies in Various Countries," International Labour Review, 1928. pp. 179-203.
Caution is required in the interpretation of the similarity of these figures. Whileit seems significant that the skill ratios are higher than about 50 or 60 percent, thereported average ratios are affected by the selection of industries and occupations.Around 1943, for instance, these ratios in Germany ranged from 58 percent (hard-coalmining) to 89 percent (soft-coal mining).
12 Albert Rees made valuable suggestions on this point.
286 WAGES IN GERMANY
The evidence presented in Chart 40 suggests that living costs are notthe only major determinant of skill differentials. In the United Stateswe may note the diverse directions of the changes in these two variablesbefore World War I, and the stability of the differentials during much of theinterwar period—while living costs showed distinct short-term variations.But even broad long-term tendencies show far from perfect correspondence.Apart from the rise in living costs, a wide variety of long-term factorstend to operate toward a narrowing of skill differentials. Among these are:(1) the increasing use of mass-production techniques with an accompanyingbreakdown of skilled operations into simpler jobs; (2) the mechanizationof some typical tasks of unskilled labor, such as handling, storing, andtransporting materials, entailing large expenditures for capital equipment;(3) the spread of general education, democratic ideologies, and politicalfranchise; (4) the efforts of trade unions to reduce skill differentials, andthe increasing unionization of unskilled workers; (5) the growing role ofgovernment in wage determination, tending to promote greater wageequality especially in times of social stress; and possibly (6) the equaliza-tion of efficiency fostered by generally higher levels of health and economicwell-being. There are, on the other hand,, factors that set limits to thenarrowing of skill differentials: (1) differences in aptitudes and training;(2) the growing supply of unskilled labor; (3) greater ease of substitutionand sharper competition among unskilled workers; (4) a tendency to"freeze" the wage structure in order to simplify negotiation of wagecontracts. Skill differentials, despite the observed historical trends towardnarrowing, must be regarded as a permanent feature of any industrialwage structure.'3
AGE DIFFERENTIALSInformation on differentials in German wage rates is largely qualitative.There are no series by which trends in these differentials can be measuredover long periods of time. But information available for a number ofbriefer periods shows that:
1. Wage rates for younger workers during World War I tended toincrease more than those for adults, and especially more than thosefor skilled adults.
2. During the 1920's and early 1930's, age differentials tended to decline,largely as a consequence of the inclusion of wages for youths incollective bargaining contracts.
3. Over the whole period 187 1-1945, the status of apprentices changedfrom that of paying workers to that of paid workers.
4. The coverage of apprentice remuneration by collective bargainingThere might, of course, also be factors leading toward wider skill differentials.
An example may be technological developments requiring high skills and affecting therelative scarcity of skilled workers as compared with unskilled. For a discussion of arelated subject see Richard Perlman, "Forces Widening Occupational Wage Differ-entials," Review of Economics and Statistics, May 1958.

-w
GERMANY, GREAT BRITAIN, AND THE U. S. 287contracts tended to standardize and raise the level of such wages inrelation to adult workers' pay.
Age differentials, apart from their decrease, diminished in importancein the wage structure, largely as a result of the increasingly stringentprovisions of child labor legislation.
Indications of a narrowing of age differentials and of a decline in theirimportance in the wage structure can be found also in the wage histories ofGreat Britain and of the United States. In Great Britain, child labor legisla-tion as well as union campaigns tended to improve the wage levels of childrenand youths relative to those of adults. A special problem, that of "dead-end employment," was created by the fact that age differentials, forinstance in British coal mines, were large for youths up to 17 years of agebut contracted sharply at age 18 and over. This resulted in a commonpractice of "sacking" most youths at the age of 18, when higher wagelevels made their employment less profitable. A gradual raising of wages foryouths and a consequent narrowing of age differentials brought the solu-tion to this problem.'4 And reduced employment of youths generallybrought about a decreasing importance of age differentials in the Britishwage structure.
There is little doubt that in the United States, as well, the general trendin age differentials between wages of youths and adults was downward.During the last decades of the period under review the general tendencyin both governmental wage regulations and collective bargaining contractsin this country was to establish "entry rates" without special provisionsfor the remuneration of youths.'5 As in the other two countries, a decreasingimportance of the age differential in the wage structure can be observedas child labor legislation gained ground. In keeping with the experienceof other industrial countries, child labor, as reported by the Census,increased up to the beginning of this century, when about one-fifth of allchildren between 10 and 16 years of age were listed as gainfully occupied.It is possible that the reported increase may reflect to some degree improvedreporting, and shifts from agricultural to industrial jobs, since earlierreporting of gainfully employed youths in agricultural occupations mighthave been unreliable. Less subject to doubt, however, is the subsequentdrastic reduction of the percentage of youths in the American labor force.By 1930 less than one-twentieth of the 10 to 16 age group was gainfullyoccupied; by 1940 this ratio must have dropped further.'6 Thus the major
14 See Paul T. David, Barriers to Youth Employment (American Council on Education,1942), pp. 85-86.
15 It is sometimes pointed out that this does not always mean an improvement in therelative remuneration of youths. See Ibid., p. 87.
16 Ibid., p. 50. See also Clarence D. Long, The Labor Force in Wartime America,(National Bureau of Economic Research, Occasional Paper 14, 1944), Table 2; and, bysame author, The Labor Force under Changing Income and Employment (PrincetonUniversity Press, for the National Bureau of Economic Research, 1958), AppendixTable A-2.

-w
288 WAGES IN GERMANY
trends observed in wage levels, related to age of German workers, appearto have been experienced also in Great Britain and the United States.'7
SEX DIFFERENTIALSSex differentials in Germany tended to show a moderate decline during theperiod under investigation. The decline was concentrated largely between1914 and 1924, and was more clearly apparent when wages of women(skilled or unskilled) were compared with those of skilled men. The riseof wage rates for unskilled men, during the period noted, was steeper thanthat for women. During the 1920's the gap between rates for women andthose for men closed somewhat more, but from 1933 on, the rate structurewas practically frozen, and little change can be observed in the relationof women's wage rates to those of skilled male workers.
The above observations are based on rates for comparable occupations.'8More important for the average wage level of employed women—butnot measurable by available statistics—is the fact that more and morewomen were admitted to remunerative occupations and to industriespaying higher wages, a factor contributing heavily to the general trendtoward greater equality between women's and men's wages. Investigationsof fairly wide coverage but somewhat doubtful comparability show averagesex differentials to have been about 60 percent during the 1870's, about55 percent before the outbreak of World War I, and somewhat below 50percent on the eve of World War II.
The long-term decline in sex differentials has been observed also inother industrial countries. In Great Britain the differential between men'sand women's earnings was reported as 56 percent of men's earnings in1906 and 52 percent in 1924 and 1935. A further narrowing of thedifferential is reported on the basis of a different sample for the period.1938-45 (from 53 percent to 47 or 48 percent).19 Both the dimensions andthe trends of the British differentials are rather close to their Germancounterparts. For the United States a long-term trend toward decliningsex differentials can be inferred from the statistics of average hourlyearnings published by the National Industrial Conference Board. Forthe group of industries reported on, average hourly earnings by womenworkers were below 60 percent of those received by male workers in 1914.This ratio fluctuated between 60 and 70 percent during the period 1920-44,and tended to stay above 70 percent in 1947 and 1948.20 A recent study of
For a description of recent world-wide trends toward a decline of age differentialsand toward equal pay for equal work, see "Wage Differentials Affecting YoungWorkers," International Labour Review, December 1955, especially pp. 531-34.
18 Sex differentials in average hourly earnings for a combination of industries (constantweights) can be computed from the mid-1930's on. Between 1935 and 1943, sex differ-entials declined minutely (see Table 61).
19 Bowley, "Wages, Earnings and Hours of Work, 1914-1947, United Kingdom,"p.6.
20 National Industrial Conference Board, The Economic Almanac, 1950, p. 343.Publication of the data ceased after July 1948.

rGERMANY, GREAT BRITAiN, AND THE U.s. 289
sex differentials in the American cotton textile industry revealed a cleartendency toward reduced differentials, between 1933 and 1952. The narrow-ing of the gap was largely concentrated in the periods of the early NewDeal and World War 11.21
It appears that labor shortages during times of war have played animportant role, historically, in equalizing wages of men and women. Therelative gains in women's wages were sometimes reduced after the war—but never to prewar levels. It might be mentioned in this context that thetrend toward narrowing sex differentials during and after a war has beenobserved also in France and other countries.22
CITY-SIZE, REGIONAL, AND INDUSTRIAL DIFFERENTIALSTendencies toward a tightening of the German wage structure, measuredby narrowing differentials, have been observed as between cities of differentsize, between different regions, and between different industries. Thenarrowing of these differentials appears to have been less marked and lessunambiguous than, for example, the narrowing of skill differentials.
Some information on the narrowing of regional differentials is availablealso for Great Britain and the United States. Although no publishedreport of long-term changes of these differentials in Great Britain wasfound, it appears that regional differentials narrowed in the course oftime and—because of the development of national minimum rates—possibly more for unskilled than for skilled workers.23 For the UnitedStates the narrowing of North-South differentials—due to broadeningindustrialization, unionization, and so on—is well established. "In mostindustries, southern wage rates have been rising relative to comparablenorthern rates during the past fifty years. The narrowing of the South-North differential has generally been more marked during the past twodecades."24 Fr the cotton textile industry, the decline of the North-Southdifferential during the past twenty years has recently been analyzed.25A narrowing of regional differentials for the United States as a whole hasalso been found by several observers.26
Also industrial differentials in the United States have narrowed. This is21 Mansfield, op. cit., p. 82.22 See, for example, Richardson, op. cit., p. 191.23 This evaluation was contributed by K. G. J. C. Knowles of the Institute of Statistics,
Oxford University. A suggestion of decreasing regional differentiation appears also inthe discussion of district and local wage variations in Great Britain, in MargotHeinemann's Wages Front (London, Lawrence and Wishart, 1947), pp. 145-53. Thisauthor, incidentally, describes also long-term trends toward narrowing of differencesbetween wages for time workers and for piece workers (p. 210).
24 R. A. Lester, "Southern Wage Differentials: Developments, Analysis, and Impli-cations," Southern Economic Journal, April 1947, p. 386.
25 Mansfield, op. cit., p. 81.For the period 1907-19, see J. W. Bloch, "Regional Wage Differentials 1907-46,"
Monthly Labor Review, April 1948, p. 371. For 1939-46, see W. Woytinsky and associates,Employment and Wages in the United States (Twentieth Century Fund, 1953),p. 481.

290 WAGES IN GERMANY
evident from 1933 on,27 but was pronounced during and afterWorld War Woytinsky analyzed the industrial earnings structureduring the first four decades of this century, but his findings did not leadto clear-cut conclusions.29 The decline of industrial differentials since theGreat Depression was largely brought about by the establishment ofminimum wages, and by wage increases in similar absolute amounts fordifferent industries •30
CONCLUSIONS
A general trend toward a tightening of the wage structure is observablefor all three countries, pronounced in skill, age, and sex differentials butperceptible also in regional, city-size, and industrial differentials. It canhardly have come about by chance that in all these aspects of the wagestructure the long-term trend was in the same direction—toward greaterequality. The mass production of goods, their distribution throughoutwide areas, the tendencies toward tight industrial organization, the growthof communication, and the spread of education—all these tend to reducedifferences among groups of the labor force and thus the differences intheir wages.
Cyclical BehaviorMONEY WAGESThe discussion of German money wages in Chapter 4 dealt with theconformity of wage cycles to general business cycles, their timing in relationto reference turning points, their cyclical amplitudes, their numericalcontribution to total payroll changes, and their relation to labor marketconditions. The results of the investigation are summarized below and,whenever possible, compared with related findings on wage behavior inGreat Britain and the United States.
Conformity. Perhaps the most important finding on the cyclical behaviorof German wage rates as distinguished from earnings is the rarity ofsubstantial cyclical declines. Between 1871 and 1944 wage rates showed
27 A. M. Ross and W. Goidner, "Forces Affecting the Interindustry Wage Structure,"Quarterly Journal of Economics, 1950, pp. 255 and 263.
28 See, for instance, David R. Roberts, "The Meaning of Recent Wage Changes,"in into Labor Issues, R. A. Lester and J. Shister, eds. (Macmillan, 1948), pp.228-29. See also Herman P. Miller, "Changes in the Industrial Distribution of Wagesin the United States, 1939-1949," in An Appraisal of the 1950 Census Income Data(Studies in Income and Wealth, Vol. 23, Princeton University Press for National Bureauof Economic Research, 1958).
29 W. Woytinsky, Earnings and Social Security in the United States (Social ScienceResearch Council, 1943), p. 202.
80 Ross and Goidner regard the closing of the wage structure as a kind of statisticalillusion produced by the unsatisfactory method of measuring fairly uniform absoluteincreases in percentage terms (op. cit., pp. 263-65). It seems to this writer that increasingequality in the wage structure remains a tangible effect of the fairly uniform absoluteincreases—whatever form be used to describe the underlying wage changes.

—
GERMANY, GREAT BRiTAIN, AND THE U. S. 291material losses only twice: during the long and severe contraction follow-ing the Grunderjahre boom of the early 1870's, and during the GreatDepression of At times, as during the 1925-26 contraction,monthly wage rates leveled out or decreased minutely; declines in someindustries amounted to one and one-half percent of the peak level. Inother industries contracts were permitted to lapse but the levels of theexpired agreements continued to appear in the statistics (see Chart 15and Chapter 4, p. 130). At other times, as during the major contractionsprior to 1913, a deceleration in the increase of wage rates has frequentlybeen observable, even on the basis of the crude annual data. Finally, therewere instances where no cyclical responses of wage rates to changes inbusiness conditions could be discovered. However, if all responses—including deceleration of growth—are counted, money wage rates on thewhole appear to have conformed fairly closely to major cyclical changes ingeneral business conditions.
Both the resistance of wage rates to sizable downward adjustments,and cyclical response in the form of deceleration or leveling out can beobserved also in British and United States wage experience. For the periodbefore World War I, cyclical observations are based on annual data only.In Great Britain, wage rates reacted to all major contractions in the formof actual, albeit mild, declines. Their reaction to the briefer contractions,such as those occurring between 1900 and 1914, are not clear.32 For theUnited States there is no doubt that during the major price and earningsdeclines wage rates also receded.33 However, the available annual serieson rates, show no reaction to the three brief contractions that occurred inthe period
For the period following World War I the cyclical behavior of wagerates can be judged on the basis of monthly information. In the course ofthe five contractions between 1919 and 1945 in both Great Britain and theUnited States, wage rates showed substantial declines only in connectionwith the deflationary postwar contraction of 1920-21 and during theGreat Depression. Wage rates either did not react cyclically to the othercontractions or responded so inperceptibly that only special techniquesrevealed the responses.35 However, the mild rate cycles thus established
The change of money wage levels brought about by the stabilization of the currencyat the close of the year 1923 are disregarded here.
For basic data see Wood, op. cit., pp. 102 if., and Bowley, Wages and Income inthe United Kingdom since 1860 (London, Cambridge University Press, 1937).
" For basic data see Appendix Table A-48, col. 7 (1871-90), and Historical Statisticsof the United States, 1 789-1945, p. 69. The latter figures refer to union rates and may notbe representative for the period.
See Wesley C. Mitchell, Gold, Prices, and Wages under the Greenback Standard(University of California Publications in Economics, 1908), Table 37. Furthermore, wagematerial published by labor departments of various states contains instances of cyclicalsensitivity of wage rates during later contractions.
See Daniel Creamer, assisted by Martin Bernstein, "Behavior of Wage Rates duringBusiness Cycles" (National Bureau of Economic Research, Occasional Paper 34,1950), Charts 1 through 5.

292 WAGES IN GERMANY
could be related to reference cycles. All in all, it can be said that in Britainand the United States, as well as in Germany, wage rates conformed fairlywell to major changes in business conditions.
The response of earnings to cyclical changes in business activity isclearer than that of rates. In Germany quarterly shift earnings of coalminers showed, on the whole, good conformity over the period 1889-1932and a skipping of only a few brief, mild cycles. Comprehensive earningsseries became available in 1924, but for a decade were published in annualform only. From these series it appears that earnings responded clearlyto the later of the two business cycles occurring between 1924 and 1932.During the brief and mild contraction of 1925-26, the rise in hourly earn-ings showed only a minute deceleration, and that in weekly earnings asomewhat stronger one. A more regular cyclical response of hourly earn-ings, compared to wage rates, emerges also from an examination ofUnited States data.
In general, weekly earnings show more reliable cyclical responses thanhourly earnings. There is, however, a strong difference between serieson an annual and on -a monthly basis. On an annual basis, weekly earningsseries tend to be cyclically rather insensitive to mild business cycles. Thisis valid for both Germany and the United States. As pointed out pre-viously, weekly earnings in Germany showed only a mild response tothe 1925-26 contraction. In the United States weekly earnings, on anannual basis, declined during only three out of the five business contractionsoccurring between 1920 and 1939. Monthly series of weekly earnings onthe other hand, declined in all five contractions.
Timing. The outstanding feature in the timing of turning points inGerman wage rates is their substantial lag behind turns in general businessconditions. At the two times when distinct specific turns in wage ratesoccurred (the Gründerjahre and the Great Depression), wage rates inannual form show lags of one year or more. For the interwar period, thetiming of wage rates can be established on the basis of monthly data.Only two business cycles fall into the poststabilization phase of this period.However, at each of the four turning points involved, a substantial lagof wage rates behind monthly reference dates appears. The lags varybetween seven and twenty months, their precise extent being dependentpartly on the rules adopted for determining specific turning points.36
The tendency of turning points in wage rates to lag behind those ingeneral business conditions appears clearly also in British and UnitedStates experience (compare the annual dates for reference and specificturning points given in Table 71; see also Chart 35). For Great Britain,the average length of the lag during the 1920-40 period has been computedat eleven months, for the United States over the period 1923-31, at ninemonths.37 With reference to the turning point preceding the Great
36 See Chapter 4, pp. 138 if." See Cleamer, op. cit., pp. 17 and 30. NBER referencecycle turns are used throughout.

GERMANY, GREAT BRITAIN, AND THE U. S. 293
TABLE 71
Percentage Change of Money Wages during the Great Depression,Germany, Great Britain, and the United States
(change expressed in percent of peak levels)
GERMANY GREAT BRITAIN UNITED STATES
Peak Trough Change Peak Trough Change Peak Trough Change
Reference ContractionRATES AND EARNINGS, ALL INDUSTRY
.
Hourly rates
Hourly earningsWeekly earnings
1929 1932 —19 1929 1932 —41929 1932 —24 ... ... ..1929 1932 —33 ... ... ..
1929
1929
1929
1932
1932
1932
—18—21—32
Specific ContractionHourly ratesHourly earningsWeekly earnings
1930 1937 —22 1927 1934 —71929 1933 —27 ... ... ..1929 1932 —33 ... ... ..
192919291929
193319331933
—23—22—33
HOURLY WAGE RATES, BUILDING
Reference ContractionSkilled workers 1929 1932 —25 1929 1932 —7 1929 1932 —11Unskilled workers 1929 1932 —25 1929 1932 —8 1929 1932 —11
Specific ContractionSkilled workers 1930 1936 —35 1929 1934 —9 1931 1933 —17Unskilled workers 1930 1936 —34 1929 1934 —10 1930 1933 —19
souRcE: Appendix Tables A-48 and A-51. For United States rates, see Statistical Abstract of theUnited States, 1940, p. 339 (entrance rates for 13 industries).
Depression, German wage rates lagged as much as nineteen months, thosein Great Britain and the United States about one year. In this instancethe German rates obviously exhibited a particularly effective resistanceto downward revision.
The fact that there were pronounced lags in the turning points of wage-rates in all three countries supports the thesis that such lags are inherentin the economic nature of wage rates. Some major reasons for the occur-rence of the lags were discussed in connection with the German experience(see Chapter 4, p. 142 if.). Among them were the difficulty of identifyingturning points at the time of their occurrence; the unpopularity of wage-rate cuts, and the need for a sufficiently strong change in employment andprofit conditions to make moves for wage adjustments feasible; the exist-ence of contractual obligations extending over many months. No doubtthese factors help to explain the wage-rate lags in Great Britain and theUnited States as well.
At this point we should note the relation between the strong lags in theturning points of wage rates and the skipping of brief mild cycle phases,which we have observed earlier. Briefer contractions might run their

294 WAGES IN GERMANY
course before wage rates begin to respond, and significant declines beprevented by the ensuing recovery. This tendency is re-enforced inperiods of long-term upward trends in wage rates, which tend to delaythe occurrence of upper turning points and thus contribute further tothe skipping.
Besides the timing of turns in wage rates, Tab1e 71 also gives someindication of the timing of turns in earnings during the Great Depression.The German evidence shows greater frequency of coincidences and reducedlags of earnings compared with lags in wage rates. There is no comparableevidence for Great Britain for the same years. In the United States, annualseries of both average hourly and weekly earnings show coincidence at the1929 peak and a one-year lag at the 1932 trough. The generally closertiming of turns in weekly earnings, and to a certain extent also hourlyearnings, was brought about by the lead (or, on an annual basis, theapproximate coincidence) of turns in average hours worked comparedwith turns in general business conditions. It should be noted, however,that the observed coincidences are based on annual data. On the basisof monthly data, earnings in the United States definitely show lags,38and a similar situation might be surmised in the case of Germany.
Amplitudes. One of the characteristics of German wage rates, mentionedabove in connection with their conformity to business cycles, is theirstrong resistance to downward adjustments. Thus, cyclical responses tocontractions consisted often merely of growth deceleration or leveling-out into plateaus. Close scrutiny of plateau periods for which monthlydata are available reveals, however, that behind the macroscopic pictureof these plateaus there may lie mild cycles with minute amplitudes.Appendix Table A-21 and Chart 37, for instance, show that in connectionwith the 1925-26 business contraction average wage rates not only leveledout, but actually declined by about 0.5 percent of the peak—with somewhatlarger declines in certain industries. This finding checks neatly withCreamer's measurement of similar mild wage-rate cycles in Great Britainand the United States.39 During the two periods when German wagerates underwent major full cycles, their fluctuations happened to beroughly similar. During the Gründerjahre cycle their specific advance wasabout 50 percent, their decline 20 percent. During the interwar period thespecific advance between 1924 and 1930 was 68 percent, and the declineduring the Great Depression was 22 percent—all measured on an annualbasis in percent of levels at initial turns.40
The annual reference turning points marking the boundaries of theGreat Depression are set by the National Bureau at 1929 and 1932 for
38 Ibid., p. 32.Ibid., Charts 1, 2, 3, and 5.Measured in percent of peak-trough averages, the increase during the Grunderjahre
cycle is 45 percent for building rates and 33 percent for printing rates, the decline 20percent and 7 percent respectively. During the interwar period average hourly ratesincreased by 50 percent of the peak-trough average, and decreased 25 percent.

GERMANY, GREAT BRITAIN, AND THE u. S. 295each of the three countries covered by the present study. The coincidenceof these reference years enables us to compare wage changes in the threecountries. The comparative data are set forth in Table 71 which alsopresents information on amplitudes during the corresponding specificcycles. As to the amplitudes of wage rates, the most conspicuous featureof the comparison is the mild decline in British as compared with Germanand United States rates, an observation which applies both to the com-prehensive wage measures and to the building industry wage rates. Therelatively mild decline in British rates, furthermore, is apparent in bothreference and specific cycle behavior. The question arises why Britishrates declined relatively little and why, for instance, wage rates in Germany—the country that experienced the longest lag before any rate reactionappeared at all—finally showed significantly stronger declines. In principle,there are many factors which could be held responsible for the compara-tively severe decline of rates in Germany, and the mild decline in Britain.Prominent among them might be the severity of the contraction of businessactivity as measured by the cutbacks in real national income or employ-menL Also, the fall in price levels would be expected to exert an importantinfluence. The following tabulation describes the decline in these factorsin the three countries between 1929 and 1932. Great Britain shows themildest declines in all the selected indicators of contraction severity.4'
Percentage Changes in Per Capita Real Income, Employment, Wholesale Prices,and Retail Prices: Germany, Great Britain, United States, 1929-1932
(percent of peak levels)
Germany Great Britain United StatesPer capita real income —26 —4 —37Employment, excluding agriculture —29 —9 —25Wholesale prices —34 —29 —32Retail prices —21 —13 —20
SOURCE:Per capita real income, Table 5. Employment, United Nations, Statistical Yearbook
1948, p. 80. Wholesale prices, Table 70. Retail prices, Appendix Table A-49.
For Germany and the United States, behavior of wage rates as well asthat of earnings can be compared on the basis of the data in Table 71.Both comprehensive measures show broadly similar declines during theGreat Depression. During the reference contraction the declines in thecomposite series of rates amounted to 18 to 19 percent, in hourly earningsto a little more than 20 percent, and in weekly earnings to somewhatmore than 30 percent. For specific contractions a similar relation generallyprevailed.42 The close resemblance between wage declines in the twocountries is not found in building wage rates. As shown by the lower
Note also, however, that between 1924 and 1929 British wage rates declined, incontrast to the increases observable in Germany and the United States.
42 The exception is the relation between hourly rates and earnings in the UnitedStates. However, the coverage of the hourly rates and earnings series for this countryis so different that little systematic importance can be attached to their relative ampli-tudes in either reference or specific contractions.

296 WAGES IN GERMANY
panel of Table 71, German building rates decreased about twice as muchas United States rates.
Per capita national real income experienced a greater decline in theUnited States than in Germany (see the tabulation above), and theemployment and price measures give evidence of roughly similar behavior.Why, then, did German wages react as strongly or even more strongly tothe Great Depression than their counterparts in the United States? Itis possible, of course, that the difference is due to variations in the con-cepts and the industrial coverage of the measures used. The steep Germanwage-rate decline, on the other hand, occurred under circumstances whichcould well provide an explanation for it. One of the unique features ofGerman wage history during the Great Depression was the "deflationary"intervention by the government. In particular, it was Chancellor BrUning'sFourth Emergency Decree which finally forced German wage rates downalmost to their ultimate trough levels. It may be surmised that such govern-ment intervention brought rates to levels lower than they would havetouched if market factors alone had been the prevailing force. Bruning'sintervention may also explain the curious fact that the decline could be asstrong as it was in the very country where the delay of the wage-ratedecline was so prolonged.
Occasionally one encounters statements to the effect that wage rateshave a long-term tendency toward increasing rigidity. Since German wagerates underwent only two substantial declines during the period 1871-1945, broad generalizations would scarcely be acceptable on the basis ofthe available evidence. Nevertheless, it is interesting to compare the twoinstances of marked decline. The wage-rate declines during the post-Gründerjahre contraction and during the Great Depression were roughlysimilar in magnitude. But wholesale-price declines were somewhat milderand production declines very much milder during the first contractionthan during the second. That is, although the limited German evidencedoes not of itself indicate any "tendency" toward more pronounceddownward rigidity, it would not be incompatible with such a thesis, ifthe wage decline is measured against employment and price changes.The British experience has been examined by Dunlop,43 who finds noevidence of long-term trends in wage-rate variability, measured either byitself or in relation to employment and price changes. Creamer notes sometendency toward increasing rigidity for the United States during theperiod 1920-49, especially if wage reactions are compared with fluctuationsin production and employment. However, Creamer hesitates to generalizefrom so brief a periodP' Our knowledge of the wage behavior in the threecountries obviously does not support any sweeping statements on long-term trends toward increasing rigidity.
"John T. Dunlop, "Trends in the Rigidity of English Wage Rates," Review ofEconomic Studies, June 1939, PP. 190 and 198.
"Creamer, op. cit., pp. 39-40.

GERMANY, GREAT BRITAIN. AND THE U. S. 297
Wage Cycles and Labor Market ConditionsEMPLOYMENT. Since wage rates are prices prevailing in the labor market,
some major processes in this market were studied in order to determinetheir effect on wage behavior. Wage-rate behavior in Germany has beenrelated to employment on an aggregative, as well as on an industry-by-industry basis. As far as timing relationships are concerned, the sub-stitution of cyclical turns in employment for those in general businessconditions does not modify the basic findings on the sluggishness in theresponse of wage rates. In particular, the lag in German wage ratesbehind changes in general business conditions cannot be explained by asystematic lag of turns in employment or unemployment. Creamer hasset forth similar findings for Great Britain and the United States.45Moreover, the differences between turning points in various industriesdo not appear to be related to corresponding differences in employmentconditions in these industries, but rather to the length and expirationdates of wage agreements.
More fruitful has been the attempt to relate the amplitude of wage rateresponses to those in employment. For Germany it has been shown thatcycles which brought only mild wage responses were those characterizedby milder declines in employment. The same situation prevailed also inGreat Britain and the United States.46 However, for none of the threecountries would the evidence support a statement to the effect thatcyclical responses of wage rates are directly proportional to declines inemployment. The declines of United States wage rates during the 1920-2 1and 1929-32 contractions certainly bear little resemblance to employ-ment changes during the same periods. Nor is this finding surprising;the amplitude of wage-rate declines is obviously codetermined by otherfactors, such as changes in price levels.
If comparisons between employment changes and wage-rate changeswere carried out industry-by-industry during the same cycle, the effect ofchanges in the price level would be minimized. Such changes would infact be ruled out if the comparisons were made between the same dates.In order to see whether, under such circumstances, wage-rate changes bearany relation to business activity in various industries, German employ-ment and production data were compared with wage rates, for the refer-ence contraction 1929-32. A fair degree of correlation was established(see Chapter 4, p. 159 and Table 39). In Great Britain, juxtaposition of theavailable wage-rate and employment information by industry, for theGreat Depression, showed no significant relationship between changesin wages and those in employment.47 Exploratory study of hourly wage
Ibid., Table 1 and Chart 5.Ibid., pp. 12 and 26.This observation is based on changes in wage rates, as given by E. C. Ramsbottom
in "The Course of Wage Rates in the United Kingdom, 1921-1934," Journal of theRoyal Statistical Society, 1935, pp. 665-66; and as given by Bowley, London and

298 WAGES IN GERMANY
and employment behavior in the United States suggests a low positivecorrelation between the mentioned variables.48 The relationship observedfor Germany should not, of course, be interpreted as denoting a simplecausal relationship between employment and wage fluctuations. Manyof the cyclically sensitive industries, such as building and hard-coal mining,happen also to be high-wage industries. The positive relation betweenemployment and wage-rate decline could thus be due, at least in part, tothe tendency of high rates to decline more than low rates.49 Similarly, thefact that some industries with smaller wage-rate declines also experiencedrelatively small employment setbacks does not necessarily supportcontentions that employment changes determine wage changes, or thatwage rigidity has but slight effect upon employment. Again, it must beunderstood that the low-wage consumers' goods industries may tend tosuffer less decline in wages and employment for reasons other than thosereflected in either of the two variables.
LABOR STRIFE AND GOVERNMENT ACTIVITY. In studying the Germanexperience, no way was found to isolate the effect of union or employeractivity on wage cycles. It was possible, however, to relate the occurrenceof labor strife—strikes and lockouts—to the lag of wage rates after lowerturning points. Strikes tended to reach their heights (in terms of man-days lost) close to mid-expansion, that is, after the rise of living costsbegan to depress the purchasing power of the hourly rate, after increasedemployment began to ease competitive pressures in the labor market, andafter increased sales provided some leeway for businesses to grant wagerises. Evidence in the United States confirms the occurrence of peaks inlabor strife well within the expansion phase. Albert Rees5° finds, onexamination of the period 1915 to 1940, that strike peaks character-istically precede peaks in general business activity by about five months.He reports also a lag of strike troughs behind reference troughs. Rees'sfindings are in keeping with the observation in Germany of low-strikeactivity during contractions, though the German evidence does not showsufficient regularity to permit a generalization on the timing of troughsin labor strife. For Great Britain, it is possible to establish a basicallypositive general conformity of strike activity to business cycles. However,Cambridge Economic Service, May 1947, p. 12. For employment, see Agatha L.Chapman, Wages and Salaries in the United Kingdom, 1920-1938 (London, CambridgeUniversity Press, 1953), pp. 98-100. The wage-employment comparisons were hamperedby the fact that information for these two measures is rarely available for comparableindustrial classifications. Furthermore, wage rates showed relatively small declines duringthe Great Depression.
"This study was based on (1) average hourly earnings and employment in twenty-onemanufacturing industries, as reported by the National Industrial Conference Board,and (2) entrance rates for common labor and employment as reported by the Bureauof Labor Statistics.
"This is not always true, however. Brewing, a high-wage industry, showed a smalldecline in wage rates.
"Industrial Conflict and Business Fluctuations," Journal of Political Economy,October 1952.

GERMANY, GREAT BRITAIN, AND THE u. s. 299
the annual information examined does not show any evidence of peaksin labor strife at or close to the mid-expansion phase of the cycle, as wasobservable for Germany.51
German wage history offers many examples of effective governmentintervention in wage setting. Throughout the Weimar Republic, thesettling of wage disputes by compulsory arbitration provided a tool forgovernment influence. Up to the onset of the Great Depression, this toolwas used largely to promote "social progress"—to iron out wage in-equities and to support, in a moderate fashion, wage earners' demandsthat they participate in the fruits of economic recovery. After thedepression was under way, however, the arbitration boards changed theirgoals, attempting instead to bring about a moderate decline of wage rates.More drastic acts of intervention by the government were embodied inthe deflationary emergency decrees of 1930 and 1931. The second effecteda reduction of wage rates to 1927 levels—leading to a total wage-ratecut of about 10 percent. After the National Socialists took power, wagesbecame wholly subject to government administration, and wage rateswere stabilized at or close to depression levels. In Great Britain there wasno comparable government initiative aimed at wage setting, but theUnited States government did intervene in the process. Its interventionwas initiated only after the trough of the Great Depression was reached,and had as its objective the raising and not the lowering or stabilizationof wage levels. These differences in wage policy are reflected clearly inthe differentiated short-term trends of German and United States wagelevels (see Charts 35 and 36).
WAGES AND OTHER PAYROLL COMPONENTS. Chapter 4 sets forth theattempt to establish for Germany the separate contributions to changesin the total industrial payroll, of wage rates, excess of hourly earningsover rates, average hours worked, and employment. Tabulated beloware the percentage changes in each of the above variables and the per-centage contribution made by each factor to the decline of the total payrollfor the years 1929-32 in Germany and in the United States. Unfortunately,comparable information is not available for Great Britain.
A striking feature of this evidence is the close resemblance of Germanand United States experience in both the extent and structure of payrolldeclines. During a contraction of roughly similar magnitude—as measuredby employment—the changes in the payroll and its components, and thecontribution of the various components to the total decline were verysimilar in the two countries. For both countries about 60 percent of thetotal payroll decline is attributable to the drop in employment and only18-20 percent to the change in wage rates.52
51 See data on industrial disputes, International Labour Office, Yearbook of LabourStatistics, 1937, and 1951-52.
52 This statement refers, of course, to the numerical contribution of these factorsonly, not to their causal importance.

300 WAGES IN GERMANY
Germany United States
Percentage Changes, 1929-32
1. Employment —41 —382. Average hours worked —9 —133. Hourly earnings —25 —214. Excess of earnings over rates —8 —45. Wage rates per hour —18 —18
Payroll 59
Contributiona to Payroll Decline, 1929-32(percent)
1. Employment 59.7 57.22. Average hours worked 11.9 17.43. (Hourly earnings)b (28.4) (25.4)4. Excess of earnings over rates 10.8 5.35. Wage rates per hour 17.6 20.1
100.0 100.0a The method used in the derivation of these measures is briefly explained in Chapter
4, footnote 59.b Hourly earnings (line 3) are subtotals of lines 4 + 5.
WAGES AND PRICESGerman wage rates were found to be a rather insensitive type of price,with regard both to timing and amplitudes. They turned later and declinedless than most major categories of wholesale prices—in fact later and lessthan living costs.
The later and lesser cyclical reactions of wage rates as compared withwholesale prices can be said to have occurred in all three countries. Onan annual basis, the specific peaks of wage rates, closest to the 1929 turnin general business conditions, were reached in the following years:
Hourly Wage Rates Wholesale Prices
Germany 1930 1928Great Britain 1927 1924United States 1929 1928
As for amplitudes, a comparison of percentage declines, measured frompeak levels, between the reference turning points of 1929 and 1932 standsas follows:
Hourly Wage Rates Wholesale Prices
Germany —19 —34Great Britain —4 —29United States —18 —32
The lesser variability of wage rates can be demonstrated also by a com-parison of wage and price behavior during periods when wage rates under-went the minute declines observable in monthly records, describedpreviously. While German wage rates declined by about 0.5 percent inconnection with the 1925-26 contraction in general business conditions,
GERMANY, GREAT BRITAIN, AND THE U. S. 301wholesale prices dropped by 10 percent or more. Similarly, in the twomild contractions of the 1920's (1924-26 and 1927-28 in Great Britain;1923-24 and 1926-27 in the United States) both countries experienced onlyminute indications of cyclicity in wage rates but clear reactions in whole-sale prices.53 Thus, although the differing compositions of the nationalindexes preclude a quantitative comparison of, for instance, the changein wage-price ratios in the three countries, the finding that there is relativelyslight variability in wage rates, as compared with wholesale prices, isfirmly established.
The cyclical insensitivity of wage rates to downward pressures appearsless pronounced in comparison with retail prices for goods and services.The German experience during the years 1924-32 shows that in specificand reference expansions wages went up more, and in contractions declinedless, than living costs. Somewhat analogous relations prevail also, for thesame period, in Great Britain and the United States. The relation of moneywages and living costs, and the consequent changes in real wages, can beobserved in Charts 35 and In all three countries the prevailingtendency during the period 1924-32 for wage levels was to increase or holdtheir own in the face of mild decreases in living costs and, when livingcosts declined radically, to show smaller declines than the latter. Therelations of living costs and wage rates in the three countries for the period1924-38 can be followed in Chart 35. They are, of course, reflected in themovements of real wages, to which we shall now turn.
REAL WAGESConformity. Real wage rates in Germany before World War I showed
occasional evidence of inverse conformity to business cycles, particularlywhen wage rates were fixed for a number of years—as in the printingindustry—and when real wage fluctuations were thus due entirely tocost-of-living changes. On the whole, however, and particularly if the laterand more sensitive monthly information of the interwar period is usedas a guide, positive conformity of real wage rates with changes in businessconditions must be regarded as the norm. Appraisal of conformity is
The price indexes used in these comparisons are the Sauerbeck Index for GreatBritain, and the Bureau of Labor Statistics Index of Wholesale Prices for the UnitedStates. Note that the declines of British wholesale prices in the contractions of 1924-26and 1927-28 are not separated by any significant specific expansion.
"In Great Britain wage rates changed but little between 1924 and 1932. But theslight increase, and the leveling-out through 1927, were accompanied by a living-costdecline of about 8 percent. And during the remainder of the period both wage ratesand living costs declined, the latter exhibiting significantly larger movements. In 1932wage rates were about 5 percent below their 1925 levels, living costs about 19 percentbelow. Also in the United States, wage rates, hourly earnings, and living costs showedrelatively shallow movements up to 1930. In 1924 and 1925 living costs rose, and during1926 through 1930 they decreased, in the face of practically stable wage rates. From1930 to 1932 or 1933, the decrease in living costs exceeded the declines in wage rates.(Based on wage rate and earnings data as reported by Creamer, op. cit., Table A. Thecost-of-living data are those compiled and published by the Bureau of Labor Statistics.)

--
302 WAGES IN GERMANY
complicated by long lags in real wage rates, but if allowance is made fortiming relations, the preponderance of positive conformity is clear enough.In the case of real earnings, even the pre-1913 evidence tends to showpositive conformity, an impression that is confirmed by the behavior ofearnings during the interwar period.
The positive conformity of German money and real wage rates tobusiness cycles lends support to the critics of J. M. Keynes' thesis thatmoney and real rates tend to move, cyclically, in opposite directions.As Chart 14 shows, the behavior of money and real wage rates wascharacterized by positive co-variance rather than by inverse variation,especially during cyclical rather than intracyclical movements.
A tendency toward positive conformity in the cyclical fluctuations ofmoney and real wage rates has been found also by Dunlop55 and byTarshis56 for Great Britain and the United States. Their findings havebeen doubted by Ruggles.57 Dunlop makes the following summary state-ment: "Statistically, real wage rates generally rise with an increase in wagerates, rise during the first period after the peak, and then fall under thepressure of severe wage reductions."58 This would describe quite well thebehavior of German wage rates during the 1926-32 cycle. It would describeonly approximately, however, the German wage behavior of the 1924-26cycle, since the eventual decline of real wage rates was brought about byrising living costs rather than by severe money wage-rate reductions, andsince the decline occurred only after the next expansion in business hadbegun. Ruggles has expressed, on a priori grounds, some expectationsabout the behavior of money and real wage rates, as follows "In amild recession or in the early phases of a major depression it would bequite possible for the real wage rate to decline, largely because of the lagin the response of rent to changes in income. In a deeper, more prolongeddepression, however, it seems likely that the real wage rate would rise.Rent becomes more variable than money wage rates in the longer run,so that the only components of expenditures whose prices remain lessflexible than money wage rates are a few public utilities." It is clearlyoutside the scope of this study to evaluate the theoretical merits of Ruggles'expectations. It appears, however, that the behavior of German wagerates does not support his view. Typically, German real wage rates roseduring mild contractions and during the early phases of severe contractions,but declined as the depression deepened.
John T. Dunlop, "The Movement of Real and Money Wages," Economic Journal,June 1938, pp. 413-434.
56 Lone Tarshis, "Changes in Real and Money Wages," Economic Journal, March1939, pp. 150-154.
Richard Ruggles, "The Relative Movements of Real and Money Wage Rates,"Quarterly Journal of Economics, November 1940, pp. 130-144.
58op. cit., p. 434.Richard Ruggles, "The Nature of Price Flexibility and the Determinants of
Relative Price Changes in the Economy," Business Concentration and Price Policy(Princeton University Press for National Bureau of Economic Research, 1955), p. 495.

GERMANY, GREAT BRITAIN, AND THE U. S. 303Timing. The lag of turning points in German real wage rates behind
those in general business conditions is still more pronounced than the lagin money wage rates. At the 1925 peak the lag in money wage rates waseight months, that in real wage rates twelve months. At the 1929 peak,a money wage lag of thirteen or twenty months occurred, as comparedwith a real wage lag of about two or even two and one-half years.6°It is not clear whether a similar extension of lags occurred also at troughs.Following the 1925-26 contraction, money and real wage rates showedabout the same lag. After the Great Depression, on the other hand, thereoccurred a slight upturn of real rates between July 1932 and February1933, while money rates were still declining. It is difficult, however, todistinguish cyclical and shorter-term movements at that point; and from1933 on, the stabilization of money wage rates under the Nazis led to anabnormally extended decline in real wage rates—with no revival up to theend of World War II.
The lag of real wages behind money wages can be observed also inGerman hourly earnings. Annual series of hourly real earnings, forinstance, show a lag of two years, while the peak of hourly money earningscoincides with the business cycle peak. When we look at weekly earnings,however, we find that both the money and real wage series turn togetherwith general business conditions—a result of the important role playedby hours in the determination of weekly earnings.
The more pronounced lag of real as compared with money wages canbe shown to prevail in all three countries at the 1929 peak. The peak inreal wage rates was reached in Germany, Great Britain, and the UnitedStates in 1931, that is, two years after the reference turning point and oneor more years after the turn of money rates in each country. (See Table72 and Charts 36 and 37.) Real wage rates also lagged considerably behindthe 1932 reference trough. However, while real wages lagged behindmoney rates in Germany and Great Britain, they turned in the same yearin the United States. Comparison of the lower panels of Tables 71 and 72indicates the extended lags of real wage rates as compared with moneyrates for skilled and unskilled building workers in the three countries.The findings are similar to those based on the comprehensive measures.6'
60 At the 1925 peak, the break of the sharp wage rise and the leveling-out into theintermediate plateau in November was regarded as the upper turning point of moneywage rates. Real wage rates show a clear peak in March 1926. For the onset of theGreat Depression, the alternative figures mentioned refer to the beginning (P1) and end(P2) of their peak plateau in the case of money rates, and to the first and second doublepeak in the case of real rates (see Chart 14).
61 All series show longer lags of real rates at both the peak and the trough. With theexception of one instance (the turn of skilled workers' rates in the United States afterthe 1929 peak), all real rates had their peak in 1931, that is, two years after the referencepeak and one or two years later than money rates. At the subsequent trough the lag ofreal rates was two years longer than that of money rates in the United States, threeyears longer in Great Britain, and at least eight years longer under the extraordinaryconditions prevailing in Germany.

304 WAGES IN GERMANY
TABLE 72Percentage Change of Real Wages during the Great Depression,
Germany, Great Britain, and the United States
GERMANY GREAT BRITAIN UNITED STATES
Percent Percent PercentPeak Trough Change Peak Trough Change Peak Trough Change
RATES AND EARNINGS, ALL INDUSTRY
Reference ContractionHourly rates 1929 1932 +4 1929 1932 +10 1929 1932 +3Hourly earnings 1929 1932 —4 ... ... ... 1929 1932 —1WeekJy earnings 1929 1932 —15 ... ... ... 1929 1932 —15
Spec(flc ContractionHourly rates 1931 1944 —18 1931 1937 —4 1931 1933 —3Hourly earnings 1931 1936 —6 ... ... ... 1931 1932 3
Weekly earnings 1929 1932 —15 ... ... ... 1929 1932 —15
HOURLY WAGE RATES, BUILDING
Reference Contraction .
Skilled workers 1929 1932 —4 1929 1932 +7 1929 1932 +10Unskilled workers 1929 1932 —5 ... 1932 +5 1929 1932 +11
Specific ContractionSkilled workers 1931 1944 —30 1931 1937 —6 1933 1935 —7Unskilled workers 1931 1944 —29 1931 1937 —5 1931 1935 —6
sOURCE: Appendix Tables A-50 and A-52.
Also in hourly earnings, the stronger lag of real wages as compared withmoney wages is in evidence. The peak of hourly money earnings in 1929coincided with that of general business conditions, both for German andfor United States wage earners; but hourly real earnings did not turnuntil 1931. The longer delay in the turn of hourly real earnings appearedin Germany also at the end of the Great Depression. However, in theUnited States hourly real earnings hit their trough in 1932—one yearbefore money earnings. For Great Britain, there are no earnings data forthe period under review.
The cyclical timing of weekly real earnings, finally, reflects the responsivebehavior of average hours worked, of the output of piece work, and of theincidence of premium payments, rather than changes in basic rates.In Germany and the United States weekly earnings, both money and real,turned at the reference peak year of 1929. Weekly real earnings also turnedin the reference trough year of 1932. However, in the United States thereal earnings trough occurred one year earlier than that of money earnings,reflecting the anomaly previously reported for average hourly earnings.
Amplitudes. Even a casual comparison of the record of money wages
GERMANY, GREAT BRITAIN, AND THE U. s. 305(Charts 33 and 34) with that of real wages (Charts 38 and 39) revealsclearly the smaller cyclical amplitudes of the latter. Let us look moreclosely at real-wage behavior during the Great Depression. In all threecountries we find the smaller amplitudes of real wages (see Tables 71and 72 and Charts 35 and 36). There are, however, a number of specialsituations which modify the generalization, to be considered below.
Between the terminal years of the 1929-32 slump, money wage rates inall three countries show uniquely steep declines. Yet living costs declinedstill faster, so that the indexes of hourly real rates show actual increasesin the three countries (and building rates, increases in Great Britain andthe United States). These increases indicate, of course, a low degree ofresponsiveness of real wage rates to the decline in business conditions.The described increases of real wage rates, between the reference turns,do not imply that real rates were depression-proof. Declines in real ratesdid occur, albeit with delay. However, the comprehensive rate indexes,as well as the series describing changes in building rates, all show specificreal rate decreases, which are smaller than the comparable decreases inmoney rates.
The general observation that real wages have smaller amplitudes thanmoney wages holds also for average hourly and weekly earnings. Com-parative information is available for Germany and the United Statesonly. In these two countries real wages as well as money wages experienceddeclines of very similar magnitudes; the weekly real earnings declinesin both countries amounted to 15 percent.
Wages during War and InflationGENERALChapter 5 of this study dealt with the behavior of German wages underextraordinary circumstances, such as the two world wars and the GreatInflation. The purpose of that chapter was to describe the unique deter-minants of wage behavior in Germany during those episodes. Here, thetask is to compare the major findings with corresponding findings forGreat Britain and the United States. Apart from the difficulty of sum-marizing the detailed description presented for Germany, it might seemaltogether futile to undertake a comparison of individual national situa-tions. Nevertheless, despite the unique character of special events in eachof the countries, their national histories have some features in common.The two world wars involved all three countries. The Great Inflationand subsequent stabilization were but the specific ways in which Germanyunderwent its postwar adjustment; and the development of NationalSocialism up to World War II was, to be sure, the peculiar course Germanyfollowed in moving out of the Great Depression and into rearmament.Thus the course of events in Germany had historic and economic counter-parts in British and American experience, although, of course, with

306 WAGES IN GERMANY
marked differences from country to country. Germany lost the two worldwars; Great Britain and the United States were victors. Germany wasunable to control her currency depreciation after World War I; the othertwo countries managed to do so. Germany's economic expansion after1932 was dominated by a rearmament drive, while the expansions inGreat Britain and the United States, at least for the greater part of theperiod before 1939, were predominantly in the civilian sector of theeconomy.
The broad similarities as well as the broad differences in the threecountries' experiences during these unusual periods must be reflected intheir wage histories. This, at least, is a surmise worth testing. For thispurpose, the major similarities and differences in the economic fortunesand in the wage behavior of the three countries will be analyzed below.
WORLD WAR IMoney wages during World War I increased each year in Germany,Great Britain, and the United States. In all three countries wage levelswent up more sharply in the second half of the war than in the first. Andin all three countries earnings tended to rise more than wage rates. How-ever, there were marked differences in the extent of wage increases, therise being sharpest in Germany and mildest in the United States. Thedifferences, already discernible between 1914 and 1916 levels, becamemore pronounced during the latter part of the war.
The information underlying the above generalizations is assembled inTable 73. Data on wage rates of skilled building workers and earnings ofcoal miners, available for all three countries, permit comparisons oftolerably similar categories. The comprehensive wage indexes presentedin the last three columns of the table show so many differences in concepts,coverage, and composition that they cannot be directly compared. Theydo, however, shed some light on the representativeness of the morenarrowly defined measures and, at least for Germany and the UnitedStates, provide some rough indication of comparative wage trends.Over the years 1914 to 1918 wage rates of building workers rose by abouta quarter in the United States, by 60 percent in Britain, and by about100 percent in Germany. Average weekly earnings rose more sharply inall instances, and again the most marked increase occurred in Germany,the least marked in the United States. Indications are that between thefirst and the last year of the war, average earnings increases in eachcountry may have exceeded those in its building rates by roughly 30percentage points.
The order of wage rises corresponds with the extent to which thecountries were affected by the war. Germany, closest to actual battle-grounds and ultimately defeated, experienced the strongest rises. TheUnited States, far removed from the scenes of the conflict, entering it laterthan the other participants, and being on the victorious side, showed

TABLE 73Money Wages in Germany, Great Britain, and the United States, 1914-1923
WAGEBUILDING
RATES OF SWORKERS,
KILLEDPER HOUR
EARNINGSPER W
OF COAL MINERSEEK OR SHIFT
COMPREHENSIVE IWAGES PER WEEK
NDEXESOR DAY
Great United Great United Great UnitedGermany Britain States Germany,
weeklyBritain,
shiftStates,weekly
Germany, Britain,earnings weekly
States,weekly
Year (May) (July) (May) (Year) (Year) (Year)or rates rates
(July)earnings
.
1914 bOa 100 100 100 lOOb 100 100C 100 100
1915 102& 103 101 110 115b 106 121C 108 100
1916 116 108 104 130 129b 116 141C 118 111
1917 152 123 110 160 136b 144 194C 135 125
1918 20D 160 122 200 195b 178 235c 175 152
1919 ... 188 139 340 224b 207 360d 210 175
1920 703 259 186 794 260 233 820b 252 2131921 859 252 189 1,206 246 250 920b 250 1941922 3,171 191 179 4,IOOb 154 250 4,220h 188 1861923 237,627 183 197 2,762,lOOb 160 257 2,781,300b 168 200
a April.
b July.Average of March and September.
d Third quarter.SOURCE:
Building RatesGermany (data refer to Berlin): 1914-18: Waldemar Zimmermann, "Die Veränderung der
Einkommens- und Lebensverhältnisse der deutschen Arbeiter durch den Krieg," in Die Einwirkungdes Krieges auf Bevolkerungsbewegung, Einkommen und Lebenshaltung in Deutschland, Wirtschafts-und Sozialgeschich:e des We It krieges (Carnegie Foundation for International Peace, Stuttgart,Deutsche Verlags-Anstalt, 1932), p. 398. For 1920-23: Robert Kuczynski, "Postwar Labor Condi-tions in Germany," U. S. Bureau of Labor Statistics, Bul. 380, pp. 125-27. Weekly rates given areadjusted for change of hours. (Adjustment factor: 51 to 46, prewar to postwar hours as reportedin source.)
Great Britain: Bowley index, as given in C. E. Lyon, British Wages, U.S. Department of Com-merce, Trade Promotion Series, No. 42, 1926. Weekly rates given are adjusted for change of hoursin London. (Adjustment factor: 50 to 44, prewar to postwar hours as reported by A. L. Bowley,"Wages, Earnings and Hours of Work, 1914-1947, United Kingdom," London and CambridgeEconomic Service, Special Memorandum No. 50, p. 11.) The change of hours in London is fairlyrepresentative for that in the cities included in the wage-rate index. See A. L. Bowley, Prices andWages in the United Kingdom, 1914-1920 (Oxford, Clarendon Press, 1921), pp. 116-20.
United States: Historical Statistics of the United States, 1889-1945, p. 69, Series D 154 and D 156.Miners' Earnings
Germany (data refer to Ruhr): Wirtschaft und Statistik, 1925, "Zahien zur Geldentwertung inDeutschland, 1914 bis 1924," p. 41.
Great Britain: 1914-19, A. L. Bowley, Wages and Prices in the United Kingdom, 1914-1920, p. 150.(Figures refer to July.) For 1920-23, A. L. Bowley, Wages and Income in the United Kingdom since 1860(Cambridge University Press, 1937), p. 22.
United States: Paul H. Douglas, Real Wages in the United States, 1890-1926 (Houghton Muffin,1930), p. 162.
Comprehensive IndexesGermany: 1914-18, daily earnings of male workers in twelve industries, average for March and
September; see Appendix Table A-37. For 1919-23, weekly wage rates of skilled workers in eightindustries, see Appendix Table A-42, col. 3.
Great Britain: Wages in eleven occupations, predominantly weekly rates. Bowley data as reportedin C. E. Lyon, op. cit., p. 52. Where range was given, mid-point was selected.
United States: Full-time earnings in all manufacturing industries, see Douglas, op. cit., p. 130.307

308 WAGES IN GERMANY
smaller increases. The connection between the two sets of facts lies prob-ably in the extent to which direct participation and all-out effort increasedinflationary tendencies—in the absence of direct price and wage controls.
TABLE 74Cost of Living in Germany, Great Britain, and the United States, 1914-1923
Germany Great United States
Ministry of
Year Labour Bowley
1914 100I
100
II
100 1001915 125 125 120 1011916 165 145 135 108
1917 245 180 160 128
1918 304 205 180 150
1919 403 210 ... 172
1920 988 232 ... 2001921 1,301 219 ... 178
1922 14,602 184 ... 167
1923 15,437 bill 169 ... 170
The adjusted (Bowley) index takes into account the increasing proportion of incomespent on food and clothing during the years 1914 to 1918. It assigns progressivelylarger estimated weights to these items. The unadjusted (Ministry of Labour) indexkeeps weights constant throughout. See A. L. Bowley, Prices and Wages in the UnitedKingdom, 1914-20 (Cambridge University Press, 1937), pp. 74-75.SOURCE:
Germany: Appendix Table A-41, col. 2, put on base 1914 = 100.Great Britain: For 1914-18, from Bowley, op. cit., p. 106. For 1919-23, see Charles
E. Lyon, British Wages, p. 52 (base shifted to 1914).United States: Historical Statistics of the United 1 789-1945, p. 236. Series
L 41 (B.L.S. Index, all items), base shifted to 1914 = 100.
The available wholesale price indexes are too different in compositionand coverage to permit comparisons in the wartime changes of pricelevels.62 The movements of retail prices, as represented by cost-of-livingindexes, exhibit indeed the same order, with regard to price increases, asthat observed for wages. Table 74 shows that living costs in the UnitedStates increased by one-half, in Great Britain they doubled, and in Germanytrebled.
62 The German index comprises thirty-eight commodities—eighteen foods andtwenty industrial raw materials (see Wirtschafl and Statistik, 1925, "Zahlen zur Geldent-wertung in Deutschland 1914 bis 1923"). For Great Britain there is the Board of TradeTndex covering forty-seven articles—twenty-five foods, six coal and metals, six textileraw materials, and ten miscellaneous; the Economist Index covering forty-four rawmaterials; and the Statist Index covering forty-five raw materials. (See U.S. Bureau ofLabor Statistics, Bul. 284, pp. 26 1-62, 270, and 276-78.) For the United States there arevarious indexes, the most comprehensive being that of the Bureau of Labor Statistics,which during the war years covered between three hundred and four hundred com-modities. See Ba!. p. 284, p. 109 and Bul. 200, p. 8).

GERMANY, GREAT BRITAIN, AND THE U. S. 309Whatever the merits of the foregoing speculation on the connection
between money wage levels and degree of war effort, the relation betweenretail price changes and wage changes is close and significant. The extentto which retail price changes modified the comparative movement inmoney wages will be examined next. The reader is asked to bear in mindthat the quotients describing the relation of money wage changes and cost-of-living changes in comparison with prewar levels are particularlydifficult to interpret in times of rapid shifts such as wars. Real wagesunder such circumstances, are indeed far from "real." It is, therefore,the broad changes rather than the specific numerical values of the realwage quotient with which we are here concerned.
In contrast to the direction of money wage changes, the general trendof real wages was downward. Specifically, the data assembled in Table 75show lower real wage levels in 1918 than in 1914 for all series exceptminers' shift earnings in the United States and possibly in Great Britain—depending upon the cost-of-living index used as deflator.63 In each country,real-rate declines are more pronounced than earnings declines, a factwhich follows from the smaller rise of money rates as compared withearnings. The changes in real wage rates range from —35 percent to —3percent, in earnings from —32 percent to + 13 percent. While in moneywages Germany experienced the most pronounced and the United Statesthe smallest rises, in real wages the decline was largest in Germany andsmallest in the United States.64
The comparison of real wage movements in the three countries illus-trates—in different ways than comparison of money wage movements—theclose relation between wage behavior and the political and economicdevelopments of each country. The extraordinary decline of real wages inGermany during World War I was traced, in Chapter 5, to the long-drawn-out war experience, to the proximity of military operations and,most important, to the military disasters that befell that nation. Thesomewhat smaller decline in British real wages would appear plausiblein the light of the greater protection from war damage and the victoriousoutcome of the conifict. The remarkably favorable showing of theUnited States, with earnings levels approximately maintained or evenincreased, must be explained by the same factors.
POSTWAR ADJUSTMENTSThe behavior of money wages, in the five years following World War I,is dominated by the fate of the respective price levels in the threecountries. The major differences are to be noted between countries withrapidly depreciating currencies and those that underwent deflation or
63 Note, however, that the weekly earnings decline in the United States was negligible.64 This is true for each of the selected wage types if the cost-of-living indexes pub-
lished by the respective governments are used as deflators. Real rates in building appearto be an exception, if A. L. Bowley's adjusted living-cost index is used to deflate theBritish wage data.

TAB
LE 7
5R
eal W
ages
in G
erm
any,
Gre
at B
ritai
n, a
nd th
e U
nite
d St
ates
, 191
4-19
23
a April.
b Ju
ly.
Dai
ly e
arni
ngs a
vera
ges f
or M
arch
and
Sep
tem
ber.
d W
eekl
y ra
tes,
third
qua
rter.
Wee
kly
rate
s, Ju
ly.
soui
ca: T
he se
ries f
or re
al w
ages
are
der
ived
from
mon
ey w
ages
(Tab
le 7
3) a
nd c
ost-o
f-liv
ing
inde
xes (
Tabl
e 74
and
sour
ces
ther
eto)
, with
this
exc
eptio
n: R
eal e
arni
ngs i
n th
e U
nite
d St
ates
for c
oal m
iner
s and
all
man
ufac
turin
g w
orke
rs w
ere
take
n di
rect
lyfr
om P
aul H
. Dou
glas
, Rea
l Wag
es in
the
Uni
ted
Star
es, 3
890-
1926
,pp
.13
0 an
d 16
2. F
or G
reat
Brit
ain
colu
mns
(i) a
re d
efla
ted
byth
e M
inis
try o
f Lab
our i
ndex
, col
umns
(is)
by
the
Bow
ley
inde
x.
0
BW
LDIN
GW
AG
E R
ATE
S O
F SK
ILLE
DW
OR
KER
S, P
ER H
OU
REA
RN
ING
S O
F C
OA
L M
INER
SPE
R W
EEK
OR
SH
IFT
CO
MPR
EHEN
SiV
E IN
DEX
ESW
AG
ES P
ER W
EEK
OR
DA
Y
Yea
r
Ger
man
y
(May
)
Gre
at B
ritai
nU
nite
dSt
ates
(May
)
Ger
man
y
Wee
kly
Earn
ings
(Yea
r)
Gre
at B
ritai
nSh
ift E
arni
ngs
Uni
ted
Stat
esW
eekl
yEa
rnin
gs(Y
ear)
Ger
man
y
Earn
ings
or R
ates
(Yea
r)
Gre
at B
ritai
nW
eekl
y R
ates
III
(July)
(Jul
y)
Uni
ted
Stat
esW
eekl
yEa
rnin
gs(Y
ear)
III
(July)
(Jul
y)I
11
(Year)
(Yea
r)
1914
1915
1916
1917
1918
bOa
796
71 60
65a
100
100
82
86
73
80
68
77
78
89
100
99
96
85
83
100
87
80
67
68
lOOb
lOOb
92b
96b
88b
96b
76b
85b
95b
108b
100
108
108
112
113
bOOC
96C
87c
79c
77c
100
100
86
90
80
87
75
8485
97
100
102
104
98
99
1919
1920
1921
1922
1923
... 55 87 92
56
90
...
112
...
115
...
104
...
108
...
81 89
105
106
115
88
83
95 74
b51b
107b
...
112
...
112
...
84...
95...
116
113
141
151
153
90d
74e
73e
72e
62e
100
...
109
...
114
...
108
...
99...
101
103
110
113
119

GERMANY, GREAT BRiTAIN, AND THE U. S. 311managed to maintain their price levels. Germany suffered one of the mostconspicuous sieges of hyperinflation, as a comparison of its money wagelevels with those of Great Britain and the United States amply demon-strates. Some differences between price behavior in Great Britain and inthe United States are worth mentioning. Although in comparison withprewar conditions both British and United States retail price levels in1923 (measured by living costs) are about equally high (roughly 70 percentabove 1913), in Great Britain the level was attained after rapid pricerises up to 1920 and subsequent declines, while the amplitudes of pricefluctuations in the United States were appreciably milder (see Table74). These conditions are reflected in the differential movement of moneywages in the two countries. Between 1920 and 1923, for instance, a sharpdecline in British wage rates and earnings compares with an actual increasein the corresponding measures in the United States. The decline in Britishwages is obviously related to the deflationary price behavior during thisperiod. However, the increase in United States wage levels occurs despitea reduction in living costs. Thus, factors other than the fate of the currencymust have affected money wage movements. These factors will be reflectedmore clearly in the behavior of real wages.
Table 75 contains real wage information for the series introduced inthis section, up to the year 1923. The prewar base is maintained, since itoffers a more meaningful standard for comparison than, say, the immediatepostwar years 1919 or 1920.65 Comparisons of real wage movementsrelative to prewar levels are startling. In 1923, for instance, real wages inGermany were 44 to 49 percent below prewar levels, in Britain from 5percent below to 8 percent above, and in the United States 15 percent to53 percent above 1913—the position within the range depending upon theparticular wage category in each instance. Thus, in the adjustment periodafter World War I the tendencies that developed during the war itselfwere continued. The political and economic conditions after the warobviously were consequences of the differentiated war experiences. Theyaffected real wage levels of the three countries in much the same directionsas war conditions had affected them previously. This perpetuation offortunes and calamities was to lead, also in subsequent years, to differ-entiated courses in general economic trends and in wage behavior.
THE WAY OUT OF THE GREAT DEPRESSIONWage behavior from the trough of the Great Depression to the outbreakof World War II differed substantially among the three countries (seeTable 76). Money wage rates of building workers declined in all threecountries from 1932 to 1933, but the decrease in German building rates
The year 1914 is here used as indicating prewar levels, in order to maintain com-parability with the measures describing wage behavior during World War I. The use ofthe year 1913 as basis of comparison would not affect any conclusions, since neitherwages nor prices changed substantially between these two years.
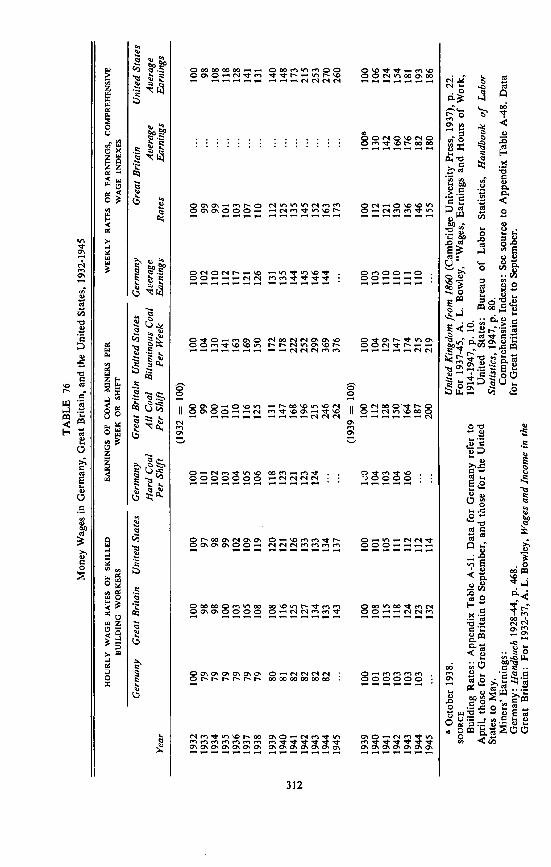
TAB
LE 7
6M
oney
Wag
es in
Ger
man
y, G
reat
Brit
ain,
and
the
Uni
ted
Stat
es, 1
932-
1945
a O
ctob
er 1
938.
SOU
RC
EB
uild
ing
Rat
es: A
ppen
dix
Tabl
e A
-51.
Dat
a fo
r Ger
man
y re
fer t
oA
pril,
thos
e fo
r Gre
at B
ritai
n to
Sep
tem
ber,
and
thos
e fo
r the
Uni
ted
Stat
es to
May
.M
iner
s' Ea
rnin
gs:
Ger
man
y: H
andb
uch
1928
-44,
p. 4
68.
Gre
at B
ritai
n: F
or 1
932-
37, A
. L. B
owle
y, W
ages
and
Inco
me
in th
e
Uni
ted
Kin
gdom
from
186
0 (C
ambr
idge
Uni
vers
ity P
ress
, 193
7), p
. 22.
For 1
937-
45, A
. L. B
owle
y, "
Wag
es, E
arni
ngs a
nd H
ours
of W
ork,
1914
-194
7, p
. 10.
Uni
ted
Stat
es: B
urea
u of
Lab
or S
tatis
tics,
Han
dboo
k of
Lab
orSt
atis
tics,
1947
, p. 8
0.C
ompr
ehen
sive
Inde
xes:
See
sour
ce to
App
endi
x Ta
ble
A-4
8. D
ata
for G
reat
Brit
ain
refe
r to
Sept
embe
r.
—
HO
UR
LY W
AG
E R
ATE
S O
F SK
ILLE
DB
UIL
DIN
G W
OR
KER
SEA
RN
ING
S O
F C
OA
L M
INER
S PE
RW
EEK
OR
SH
IFT
WEE
KLY
RA
TE
S O
RW
AG
EEAR
NIN
GS,
CO
MPR
EHEN
SIV
EIN
DEX
ES
Ger
man
yG
reat
Brit
ain
Uni
ted
Stat
esG
erm
any
Gre
at B
ritai
n U
nite
d St
ates
Ger
man
yG
reat
Brit
ain
Uni
ted
Stat
es
Yea
rH
ard
Coa
lPe
r Shi
ftA
ll C
oal
Bitu
min
ous C
oal
Per S
hift
Per W
eek
Ave
rage
Earn
ings
Rat
esA
vera
geEa
rnin
gsA
vera
geEa
rnin
gs
(193
2 =
100)
1932
100
100
100
100
100
100
100
100
...10
019
3379
9897
101
9910
410
299
...98
1934
7998
9810
210
013
011
099
...10
819
3579
100
9910
310
114
111
210
1...
118
1936
7910
310
210
411
016
311
710
3...
128
1937
7910
510
910
511
616
912
110
7...
141
1938
7910
811
910
612
515
012
611
0...
131
1939
8010
812
011
813
117
213
111
2...
140
1940
8111
612
112
314
717
813
512
5...
148
1941
8212
512
612
116
822
214
413
5...
173
1942
8212
713
312
319
625
214
514
5...
215
1943
8213
413
312
421
529
914
615
2...
253
1944
8213
313
4...
246
369
144
163
...27
019
45...
143
137
...26
237
6...
173
...26
0(1
939
100)
1939
100
100
100
1._O
100
100
100
100
100
1940
101
108
101
104
112
104
103
112
130
106
1941
103
115
105
103
128
129
110
121
142
124
1942
103
118
111
104
150
147
110
130
160
154
1943
103
124
112
106
164
174
111
136
176
181
1944
103
123
112
...18
721
511
014
618
219
319
45...
132
114
...20
021
9...
155
180
186

GERMANY, GREAT BRITAIN, AND THE U. S. 313was particularly steep, owing to especially unfavorable conditions in thebuilding industry.66 Fundamental differences in wage-rate behavioremerge from 1933 onward. Between that year and the outbreak of WorldWar II, building wage rates in Germany were stabilized close to theirdepression levels, while in Great Britain they increased by 10 percent, andin the United States by more than 20 percent—all measured from theirspecific troughs. Comparison with levels at the reference turn of 1932further increases the differences between the experience of the threecountries. The reasons for these extreme differences may be traced togovernment interference in wage determination. In Germany the policiesof the National Socialists aimed at wage stabilization, while in the UnitedStates the policies of the New Deal tended to encourage wage-rate increasesboth directly and indirectly by furthering collective bargaining and thegrowth of unionism.
The differential behavior of wage rates is reflected in differences amongearning trends. Coal miners' earnings in 1939 were 18 percent above 1932levels in Germany, 31 percent above in Great Britain, and 72 percentabove in the United States. The data used would, however, appear tofavor the United States experience, where earnings are measured perweek, while in Germany and Great Britain they are measured per shift.Number of shifts worked per man and week are cyclically sensitive andthus, in expansions of general business activity, tend to boost the rise ofaverage weekly earnings above that of average shift earnings. For thecomprehensive weekly earnings measures, direct comparison is possibleonly between Germany and the United States. The comparison showsstronger gains for the United States than for Germany, whether 1932 or1933 is used as a point of departure. However, the difference between thecomposite indexes (weekly earnings for both countries) is far less pro-nounced than that between the reports on miners' earnings (shift earningsfor Germany, weekly earnings for United States). Part of the explanationmust lie in the fact that German wage policy under National Socialismbrought about a significant extension of working hours per week, whilehours in the United States actually declined.67 Moreover, in Germany theincreasing resort to payment according to results helped to raise averageweekly earnings.
The comparative behavior of money wages should be evaluated in thelight of concomitant changes in price levels, and especially in living costs.Reference to Table 77 shows that for the period 1932-39 changes in livingcosts can provide only part of the explanation of wage behavior. Livingcosts declined in all three countries between 1932 and 1933, and rosethereafter—just as wage rates did. But the rises of living costs in the three
The comprehensive index of German wage rates shows a decline of only 4 percentbetween these dates.
67 In Germany average weekly hours in manufacturing establishments increased by17 percent between 1932 and 1939, while in the United States they declined fractionallybetween the two dates (see Table 69).
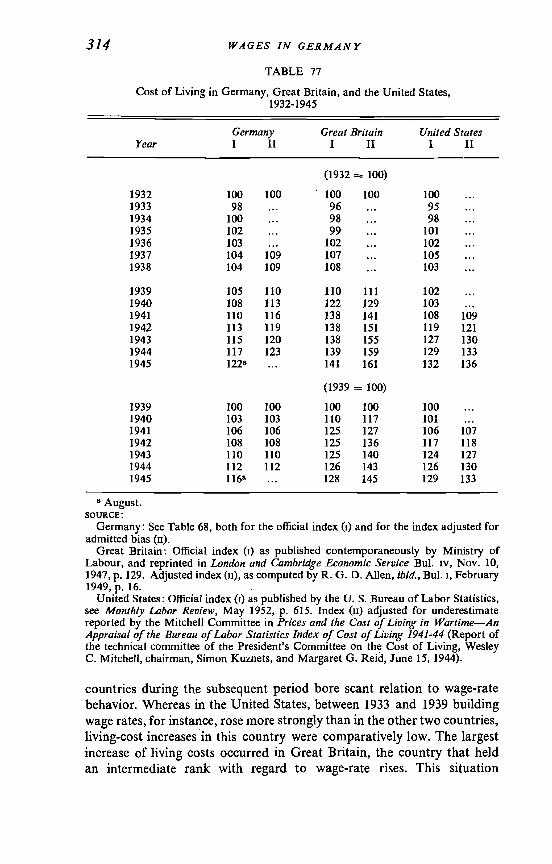
314 WAGES IN GERMANY
TABLE 77
Cost of Living in Germany, Great Britain, and the United States,1932-1945
GermanyYear I II
GreatI
BritainII
UnitedI
StatesII
(1932 100)
1932 100 100 100 100 1001933 98 96 951934 100 98 981935 102 99 101
1936 103 ... 102 102
1937 104 109 107 105
1938 104 109 108 103
1939 105 110 110 111 102
1940 108 113 122 129 103
1941 110 116 138 141 108 109
1942 113 119 138 151 119 121
1943 115 120 138 155 127 130
1944 117 123 139 159 129 133
1945 1226 141 161 132 136
(1939 100)
1939 100 100 100 100 100
1940 103 103 110 117 101
1941 106 106 125 127 106 107
1942 108 108 125 136 117 118
1943 110 110 125 140 124 127
1944 112 112 126 143 126 130
1945 1166 128 145 129 133
August.
SOURCE:
Germany: See Table 68, both for the official index (i) and for the index adjusted foradmitted bias (u).
Great Britain: Official index (i) as published contemporaneously by Ministry ofLabour, and reprinted in London and Cambridge Economic Service Bul. iv, Nov. 10.,1947, p. 129. Adjusted index (u), as computed by R. G. D. Allen, ibid., But. i, February1949, p. 16.
United States: Official index (i) as published by the U. S. Bureau of Labor Statistics,see Monthly Labor Review, May 1952, p. 615. Index (ii) adjusted for underestimatereported by the Mitchell Committee in Prices and the Cost of Living in Wartime—AnAppraisal of the Bureau of Labor Statistics Index of Cost of Living 1941-44 (Report ofthe technical committee of the President's Committee on the Cost of Living, WesleyC. Mitchell, chairman, Simon Kuznets, and Margaret 0. Reid, June 15, 1944).
countries during the subsequent period bore scant relation to wage-ratebehavior. Whereas in the United States, between 1933 and 1939 buildingwage rates, for instance, rose more strongly than in the other two countries,living-cost increases in this country were comparatively low. The largestincrease of living costs occurred in Great Britain, the country that heldan intermediate rank with regard to wage-rate rises. This situation

GERMANY, GREAT BRITAIN, AND THE U. S. 315emphasizes the favorable wage trends in the United States, shown in thefollowing comparison of real wages.
Real wage rates in Germany declined between 1932 and 1939, approxi-mately maintained their levels in Great Britain, and increased in theUnited States. For building wage rates, the movements may be followedin detail in Table 78.68 The same order is maintained in the movement ofreal earnings of coal miners and—for Germany and the United States—ofcomprehensive weekly earnings series. The larger increase of real earningsin the United States and the smaller increase in Germany cannot be tracedto the developments of real per capita income in these countries. Referenceto Table 5 shows indeed that income increased considerably faster inGermany than in the United States between 1932 and 1939. The distri-bution of the increase of income rather than the extent of the increaseaccounts for the differential development of workers' real earnings in thetwo countries. It is the contrast between the guns-before-butter policy ofthe German National Socialists and the social policies of the New Deal,which is reflected in the real earnings behavior of the two countries inthe years following the Great Depression.
WORLD WAR IIMoney Wages. During World War II wage levels in all three countries
rose, continuing a post-1932 trend. As can be seen in Table 76 and Chart41, Germany, during the war, experienced very mild wage increases only,reflecting the thoroughgoing system of controls and perhaps the highutilization of manpower that were in effect as early as 1939. Between1939 and the years 1943 or 1944 (the last years for which information isavailable) wage rates of German building workers increased by 3 percent,shift earnings of coal miners by 6 percent, and weekly earnings in allGerman industry by about 10 percent. Much greater increases occurredin wage levels in Great Britain and the United States than in Germany----just as they had before the war. This is true both for wage rates and forearnings. Weekly earnings levels in the latter countries rose by about80 to 90 percent, compared with the 10 percent increase in German weeklyearnings reported above.
For the period of World War II wage comparisons of the three countriesmay be based on several sets of fairly similar data. Specifically, hourlywage rates of skilled building workers, average shift or weekly earnings ofcoal miners, and average weekly earnings for all industry (or an approxi-mation to such coverage) will be used for the following observations.The most striking characteristic of wage rates for building workers is theirrelatively mild rise in all three countries, amounting to only 3 percent in
The reader is reminded of the nonrepresentative character of the decline in Germanbuilding wage rates, particularly during the first two years of the comparison period.Between 1932 and 1934, real building wage rates in that country declined by 20 percentwhereas the comprehensive index of real wage rates declined by only 3 percent. (Seealso Table A- 13.)
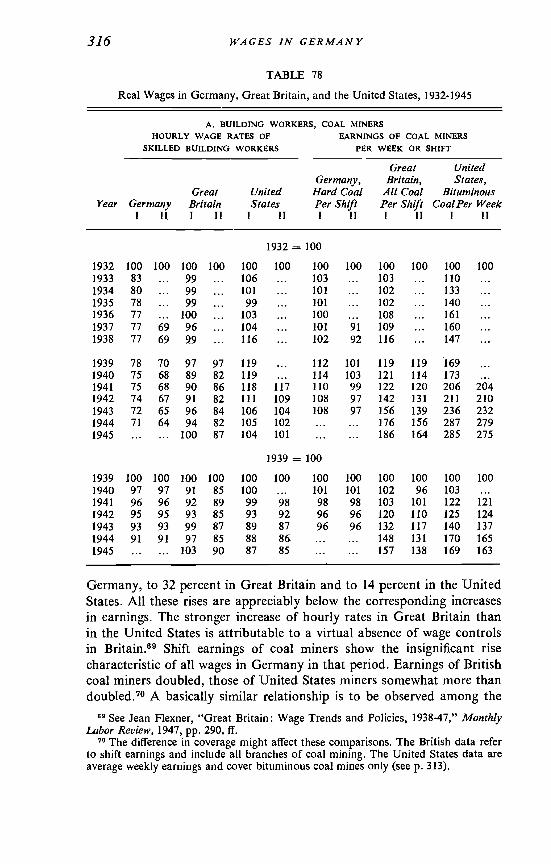
316 WAGES iN GERMANY
TABLE 78
Real Wages in Germany, Great Britain, and the United States, 1932-1945
A. BUILDING WORKERS, COAL MINERSHOURLY WAGE RATES OF EARNINGS OF COAL
SKILLED BUILDING WORKERS PER WEEK OR SHIFT
Great UnitedGermany, Britain, States,
Great United Hard Coal All Coal BituminousYear Germany Britain States Per Per CoalPer Week
I II I II I II I II I IL I II
1932 = 100
1932 100 100 100 100 100 100 100 100 100 100 100 1001933 83 ... 99 ... 106 ... 103 ... 103 ... 1101934 80 ... 99 ... 10! ... 101 ... 102 ... 1331935 78 ... 99 ... 99 ... 101 ... 102 ... 1401936 77 ... 100 ... 103 ... 100 ... 108 ... 161
1937 77 69 96 ... 104 ... 101 91 109 ... 1601938 77 69 99 ... 116 ... 102 92 116 ... 147
1939 78 70 97 97 119 ... 112 101 119 119 1691940 75 68 89 82 119 ... 114 103 121 114 1731941 75 68 90 86 118 117 110 99 122 120 206 2041942 74 67 91 82 111 109 108 97 142 131 211 2101943 72 65 96 84 106 104 108 97 156 139 236 2321944 71 64 94 82 105 102 ... ... 176 156 287 2791945 ... ... 100 87 104 101 ... ... 186 164 285 275
1939 = 100
1939 100 100 100 100 100 100 100 100 100 100 100 1001940 97 97 91 85 100 ... 101 101 102 96 1031941 96 96 92 89 99 98 98 98 103 101 122 1211942 95 95 93 85 93 92 96 96 120 110 125 1241943 93 93 99 87 89 87 96 96 132 117 140 1371944 91 91 97 85 88 86. ... ... 148 131 170 1651945 ... ... 103 90 87 85 ... ... 157 138 169 163
Germany, to 32 percent in Great Britain and to 14 percent in the UnitedStates. All these rises are appreciably below the corresponding increasesin earnings. The stronger increase of hourly rates in Great Britain thanin the United States is attributable to a virtual absence of wage controlsin Britain.69 Shift earnings of coal miners show the insignificant risecharacteristic of all wages in Germany in that period. Earnings of Britishcoal miners doubled, those of United States miners somewhat more thandoubled.7° A basically similar relationship is to be observed among the
69 See Jean Flexner, "Great Britain: Wage Trends and Policies, 1938-47," MonthlyLabor Review, 1947, pp. 290, if.
The difference in coverage might affect these comparisons. The British data referto shift earnings and include all branches of coal mining. The United States data areaverage weekly earnings and cover bituminous coal mines only (see p. 313).

GERMANY, GREAT BRITAIN, AND THE U. S. 317
Table 78, continued
B. COMPREHENSIVE INDEXES, WEEKLY RATES OR EARNINGS
Year
WEEKLY RATES Oft EARNINGS,COMPREHENSIVE WAGE INDEXES
Germany,AverageEarnings
I II
Great Britain UnitedStates,
AverageEarnings
1 II
AverageRates Earnings
I II I 11
1932 = 100
1932 100 100 100 100 100 100
1933 105 100 1041934 110 100 110
1935 111 100 117
1936 114 ... 99 1261937 117 105 98 134
1938 121 110 101 127
1939 126 113 100 100 137
1940 126 113 95 89 144
1941 131 117 97 94 161 159
1942 128 115 103 94 180 1781943 128 .114 109 96 200 199
1944 124 111 115 101 210 203
1945 121 105 198 190
1939 = 100
1939 100 100 100 100 bOa bOa 100 100
1940 100 100 95 89 110 104 105
1941 104 104 97 94 111 109 117 116
1942 102 102 103 94 124 114 131 1301943 101 101 109 96 138 123 145 142
1944 98 98 115 101 140 124 153 148
1945 121 105 137 121 144 139
a October 1938.SOURCE: Money wages, see Table 76. Cost of living, see source to Table 77. The cost-of-living index numbers used for deflation were not always those given in Table 77. Incases where the wage quotation referred to a specific month, the cost-of-living indexfor the same month was used. For the adjusted cost-of-living indexes the monthlylevels were approximated by raising the official index for the month by an adjustmentfactor derived from annual data. Real wages in columns (i) are derived by use of theofficial cost-of-living indexes as published contemporaneously. Real wages in columns(ii) take account of adjustments as presented in Table 77. Building rates for Germanyrefer to April, for Great Britain to September, for the United States to May. Also thecomprehensive wage rates for Great Britain refer to September.
more comprehensive weekly earnings measures (available for all threecountries from 1938 on, the year Great Britain started to report averageweekly earnings in time series form). The increases during the war amounted

318 WAGES IN GERMANY
CHART 41
Coal Miners' Earnings in Two Wars, Germany, GreatUnited States
Britain, and the
Money earningsReal earnings
Index (1914 100)220
200
180
160
140
120
100
80
60
World War IIndex (1914 100>
220
aoo
180
160
140
120
100
80
60
Index (1939=100)220
100
World War
801939 '41 '43 '45 1939 '41
Index (1939=100)220
Source: Table 79.
to 10 percent in Germany, 80 percent in Greatthe United States.7'
Britain, and 86 percent in
The German data cover the period up to 1944 only. The British and United Statesearnings indexes differ with regard to industrial composition and other elements ofconstruction. For instance, the British treat two persons at half-time work as one fullyemployed worker, while in the United States half-time workers are fully counted in theemployment indexes. It is believed, however, that for the broad comparisons here
1914 '16 '18 1914 '16 '18
Germany
1914 '16 '18
II
200 -
180 -
160 -
140 -
120 -
Great Britain
-7JI ,_/
I I I I I I
'43 '45 1939 '41 '43 '45
- — —— --
I 60
140
120
100
80

GERMANY, GREAT BRITAIN, AND THE U. S. 319Living Costs. It is particularly necessary, when one seeks to appraise
wage behavior during wartime, to juxtapose wage developments withthe concomitant changes in the retail price levels of goods typicallyconsumed by working-class families (see Table 77). The problems createdby rapidly changing consumption patterns have already been pointed out.The need to maintain the character of one's price measure over time con-ificts increasingly with the need to keep the measure representative ofcurrent patterns of expenditure. How did the statistical agencies of the threenations react to these difficulties? The Germans approached the problemby gradual substitution of available goods of similar function and foodsof similar caloric value—a procedure which, in view of the grave shortages,led to basic changes in the quality and composition of the goods priced.In the United States also, the composition of the index underwent changes;scarce goods were dropped, and available goods or grades of goods werelinked to the established index. But these substitutions were not nearly soradical as those in the German index, and the retail price measure couldthus maintain a higher degree of comparability over time without becom-ing obsolete. In Great Britain, at the outbreak of World War II, the govern-ment decided to postpone a long-overdue revision of its retail pricemeasure. Thus Great Britain continued during that period to employ anindex established in 1904 (and revised only slightly thereafter), geared totime-honored consumption patterns. Furthermore, subsidies to stabilizefood prices were granted predominantly for the goods represented, oreven overrepresented, in the British measure. The resulting "stabilizationof the index" was presumably intended to limit the inflationary con-sequences of wage-rate changes arising out of contracts with escalatorclauses. While some downward bias in the measure of living costs and someupward bias in real wages must be expected in the contemporaneousmeasures of all three countries, the bias is apt to be least serious in theUnited States index, and considerably more serious in those of Germanyand Great Britain. In Germany, the bias is created mainly by lack of goodsand deterioration of quality—elements whose quantitative impact on theindex is difficult to measure. In Great Britain, the bias is caused mainlyby the limitation of the index to a number of simple price-supportedstaples. In all three countries the defects of the indexes were recognized,and attempts were made to gauge the extent of bias and possibly to revisethe cost-of-living measure. In Germany the inadequacy of the index had
pursued The indexes offer an adequate guide. The U.S. Bureau of Labor Statistics in1944 computed weekly earnings changes in Great Britain and in the United Statesbetween October 1938 and July 1943, using comparable industrial groups and the same(United States) employment composition as weights. The results were in line with thoseshown by the unadjusted data, in that they indicated similar weekly earnings trends inboth countries. The similarity was produced by a smaller increase of hours but a largerincrease of hourly earnings in Great Britain as compared with the United States. See"Wartime Hours and Earnings in the United States and Great Britain," MonthlyLabor Review, July 1944, especially pp. 153-54 and 156.
320 WAGES iN GERMANY
already become evident during the preparedness economy preceding theactual launching of the war. 72 In the United States the debate raged duringthe war years and led to re-evaluations of living-cost changes.73 In GreatBritain a major revision of the index was undertaken in 1947, when attemptswere made to recompute all changes in living costs on the basis of thenew index structure.74 In the present analysis of living costs and in thecomparison of real wages, allowance, in the form of alternative indexes,has been made for revisions.
Real Wages. We now turn to the quotients which result when we divideconsumers' goods price indexes into money wage measures—"real wages."For the years under discussion these measures can at best indicate broadtendencies. They are presented in Table
Real wage rates per hour, as represented by time rates for skilled build-ing workers, decreased during World War II in all three countries. Thelowest relative level, 15 percent below 1939, occurred in 1942 in GreatBritain (deflation by Allen index). These rates, because of their minimumcharacter, can scarcely be regarded as describing properly the effectivelypaid real hourly rates in any of the three countries—not to speak of themany other important elements that shape the total wage picture in time ofwar. It is more instructive, therefore, to turn to measures of real earnings.
Looking at the real earnings of coal miners, we find the following orderin the extent of war changes: in Germany real earnings fell, in Britainthey rose, and in the United States they rose still more. Specifically, realshift earnings of German coal miners were 4 percent below 1939 levelsin 1943. Real shift earnings of British coal miners rose by 57 percentbetween the beginning and the last year of the war, according to officialfigures. If deflation is carried through by the adjusted living-cost measure,as computed by Allen, the increase amounts to only 38 percent. TheUnited States figures show a weekly earnings increase for bituminouscoal miners of close to 70 percent (or 63 percent after adjustment) betweenthe years 1939 and 1945. Coal mining was of course an important industryduring the war, and earnings in that industry are not necessarily indicativeof earnings behavior in general. Weekly real earnings changes for allindustry are in fact somewhat more moderate, Germany registering asmall decline, Great Britain an increase of 20 percent (deflated by therevised retail price measure), and the United States a rise of about 40percent. In all three countries there was a decline of weekly real earningsin the last year reported. In Germany the decline appears in the figures
See Chapter 5, section on Wages under National Socialism.See Report of the President's Committee on the Cost of Living, Office of Economic
Stabilization, 1945, as quoted in Table 77.See R. G. D. Mien, "Prices," London and Cambridge Economic Service, February
1949.The revised living-cost measures, discussed above, have also been included in
the tabulations. For Germany the revisions related to increases during the period1933-37. Thus only the level but not the movement of living costs and real wages duringWorld War Ii are affected by these adjustments.

GERMANY, GREAT BRITAIN, AND THE u. s. 321
for 1944 (and must be assumed to have continued through the remainderof the war), in Great Britain and the United States it appears only in thedata for 1945. Both the decline during the late war years and the differentialfor Germany and the other two countries reflect again the major economic,political, and military circumstances of the three powers at the end of thewar.
Comparison of the Two War Periods. The availability of information onminers' earnings, in both world wars and for all three countries, permitssome comparisons of wage behavior during the two wars. The course ofmoney earnings and real earnings of miners is illustrated in Table 79and Chart 41. In these comparisons it is important to consider that thefirst war lasted about four years and the second about six. For moneywages, we find the greatest contrast in wage behavior in Germany for thetwo war periods. In that country coal miners' earnings doubled duringthe first war, but increased by only a very few percent during the second.The increases in miners' money earnings in England and America were
TABLE 79Coal Miners' Earnings in Two World Wars: Germany, Great Britain, and
the United States
MONEY EARNINGS REAL EARNINGS
Great United Great UnitedGermany Britain, States, Germany, Britain, States,
Hard Coal, All Coal, Bit. Coal, Hard Coal, All Coal, Bit. Coal,Year per Shift per Shift per Week per per per Week
WORLD WAR I(1914 = 100)
1914 100 100 100 100 100 100
1915 110 115 106 88 96 108
1916 131 129 116 79 96 108
1917 165 136 144 67 85 112
1918 208 195 178 68 108 113
WORLD WAR II(1939 = 100)
1939 100 100 100 100 100 100
1940 105 112 103 101 96 103
1941 103 128 129 98 101 121
1942 104 150 147 96 110 124
1943 106 164 174 96 117 137
1944 ... 187 215 ... 131 1651945 ... 200 219 ... 138 163
SOURCE:For 1914-18: Germany, fur das Berg-, Hlltten- und Salinenwesen, passtm.
Deflation by cost-of-living index as derived from data published by the StatistischeReichsamt.
Great Britain, A. L. Bowley, Prices and Wages in the United Kingdom, 1914-20,pp. 106 and 150. Deflation by "modified mdcx."
United States: Douglas, Real Wages in the United States, p. 162.For 1939-45: Money wages, Table 76; real wages, Table 78.

322 WAGES iN GERMANY
somewhat milder during the first four years of World War II than duringWorld War I. However, in the course of the last two years of the morerecent conflict, the cumulative increase in war wages clearly surpassedthat experienced from 1914 to 1918. The totalitarian approach to thecontrol of money wages obviously was more effective than the less incisivemeasures adopted in Great Britain and the United States.
For real wages, we observe a marked similarity in the comparativebehavior of the three countries between the two wars. In both, Germanyoccupied the least favorable and the United States the most favorableposition. The most conspicuous contrast between the two wars is theapparently more favorable real earnings record in all three countriesduring World War II. During World War I real earnings of German coalminers were cut drastically, and earnings of their British counterpartswere moderately reduced, whereas earnings of United States minersincreased by about 10 percent. These movements are to be compared withthe insignificant decline of miners' real earnings in Germany (at leastduring the first four war years), with the substantial increase of miners'earnings in Britain, and the still more pronounced gains of miners'earnings in the United States during World War II. The findings mayappear surprising, in view of the greater scope, longer duration, andgreater destructiveness of the more recent conflict. Yet there are plausibleexplanations for the reported developments. For Germany, our informa-tion reaches only to 1943. Up to that year that country was able to avoidthe worst consequences of war conditions. It was militarily successful,could base its war production not only on the efforts of Germans but alsoon the exploitation of foreign workers, and consistently ransacked theeconomies of conquered areas by sequestering their production, wearingout their equipment, and so on.76 For the British experience the greatereffectiveness of the German blockade during first war and the moresubstantial aid from abroad during the second war may provide someexplanation. For both Germany and Great Britain the higher productivityof labor in the second as compared with the first war forms an importantcondition for the more favorable showing of real earnings in World WarII. As for the United States, World War II brought about such an un-paralleled expansion of industrial activity that new records were setin output of war and war-related goods, and at the same time weekly realearnings could rise more than they did during the earlier war.
The experiences of the three countries during World War I had pro-found effects upon their respective economic conditions and upon theirwage histories during the decadesL following the Armistice of 1918.Similarly sweeping effects were also to follow from the varying experiencesof these countries during World War II. But this is a new story that willrequire the perspective of future students for its presentation andappraisal.
See JUrgen Kuczynski and M. Witt, The Economics of Barbarism (London, 1942).