w1 intangible asset valuation approaches, methods and · w1 intangible asset valuation approaches,...
TRANSCRIPT
W1 Intangible asset valuation approaches, methods and
Robert Reilly
procedures
Firm Managing Director, Willamette Management Associates
Workshop PremiseWorkshop Premise
• The attendee is already familiar with generally accepted business valuation approaches, methods, and procedures
• This workshop is intended to illustrate generally accepted intangible asset valuation approaches and methods for various transaction, taxation, financing, pp , , g,litigation, and accounting purposes.
• This workshop is not limited to the fair value valuation of identifiable intangible assets for IFRS 3, IAS 38, or other GAAP accounting purposes., , g p p
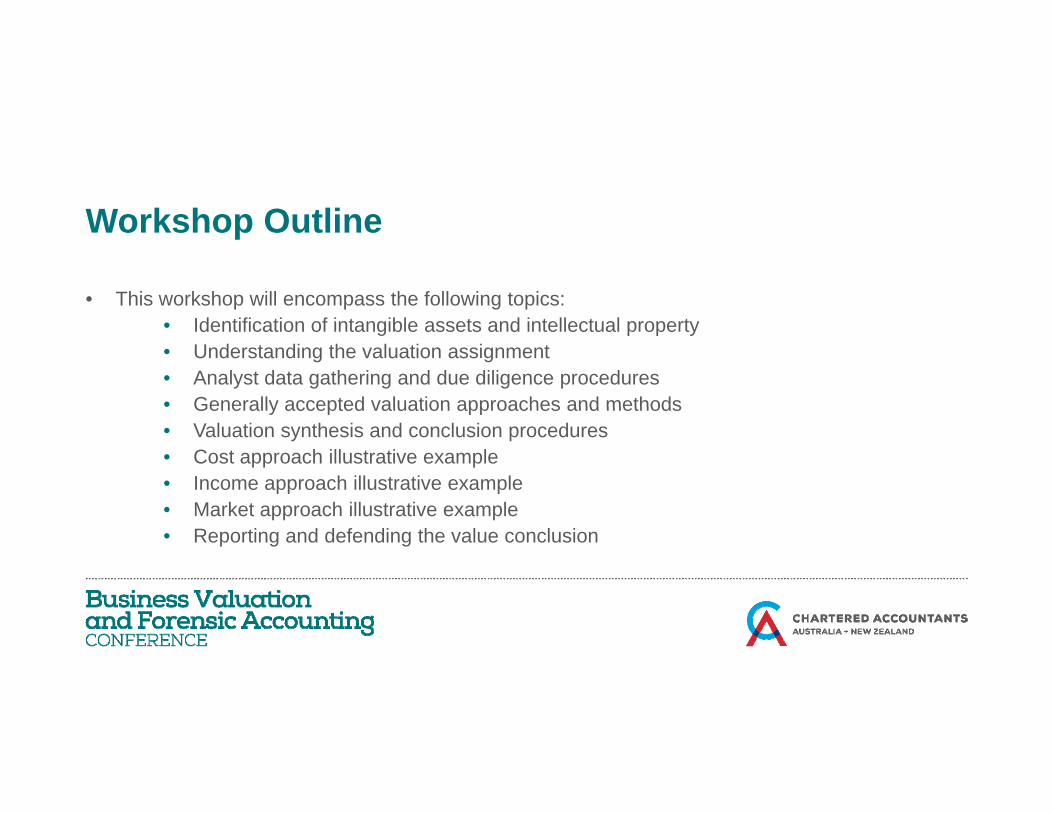
Workshop OutlineWorkshop Outline
• This workshop will encompass the following topics:• Identification of intangible assets and intellectual property• Understanding the valuation assignment• Analyst data gathering and due diligence procedures• Generally accepted valuation approaches and methodsGenerally accepted valuation approaches and methods• Valuation synthesis and conclusion procedures• Cost approach illustrative example• Income approach illustrative example• Market approach illustrative example• Reporting and defending the value conclusion
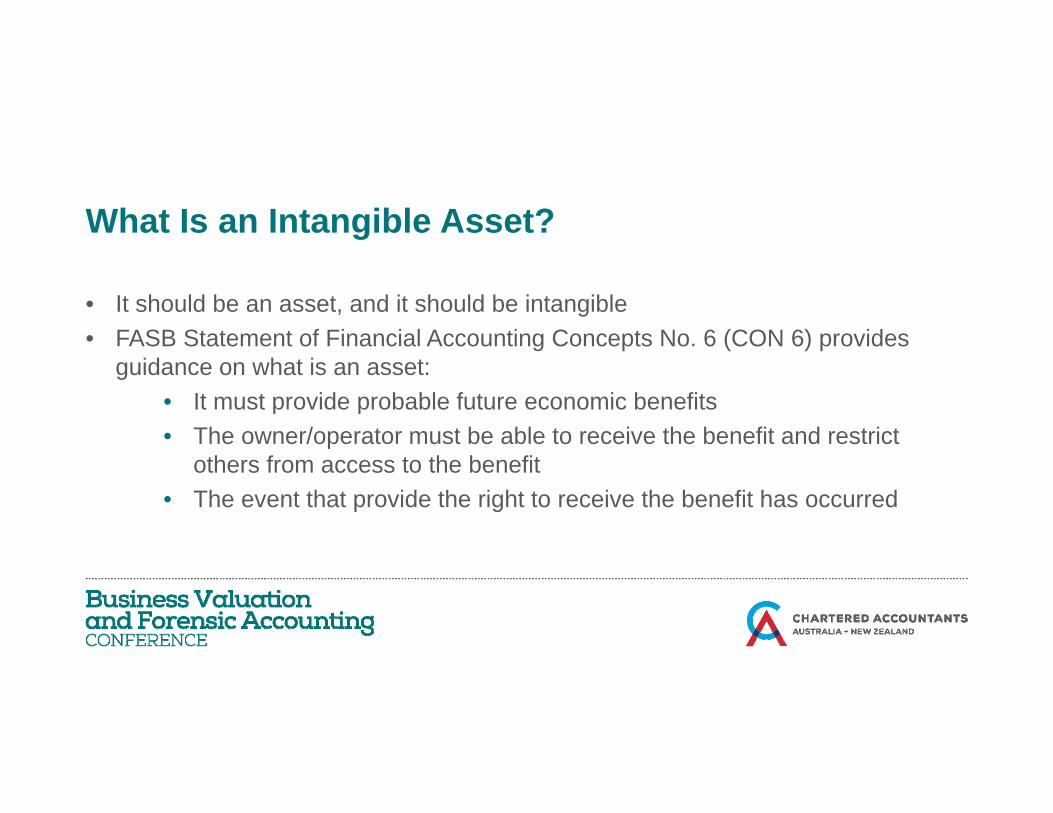
What Is an Intangible Asset?What Is an Intangible Asset?
• It should be an asset, and it should be intangible• FASB Statement of Financial Accounting Concepts No. 6 (CON 6) provides
guidance on what is an asset:• It must provide probable future economic benefitsIt must provide probable future economic benefits • The owner/operator must be able to receive the benefit and restrict
others from access to the benefit • The event that provide the right to receive the benefit has occurred• The event that provide the right to receive the benefit has occurred
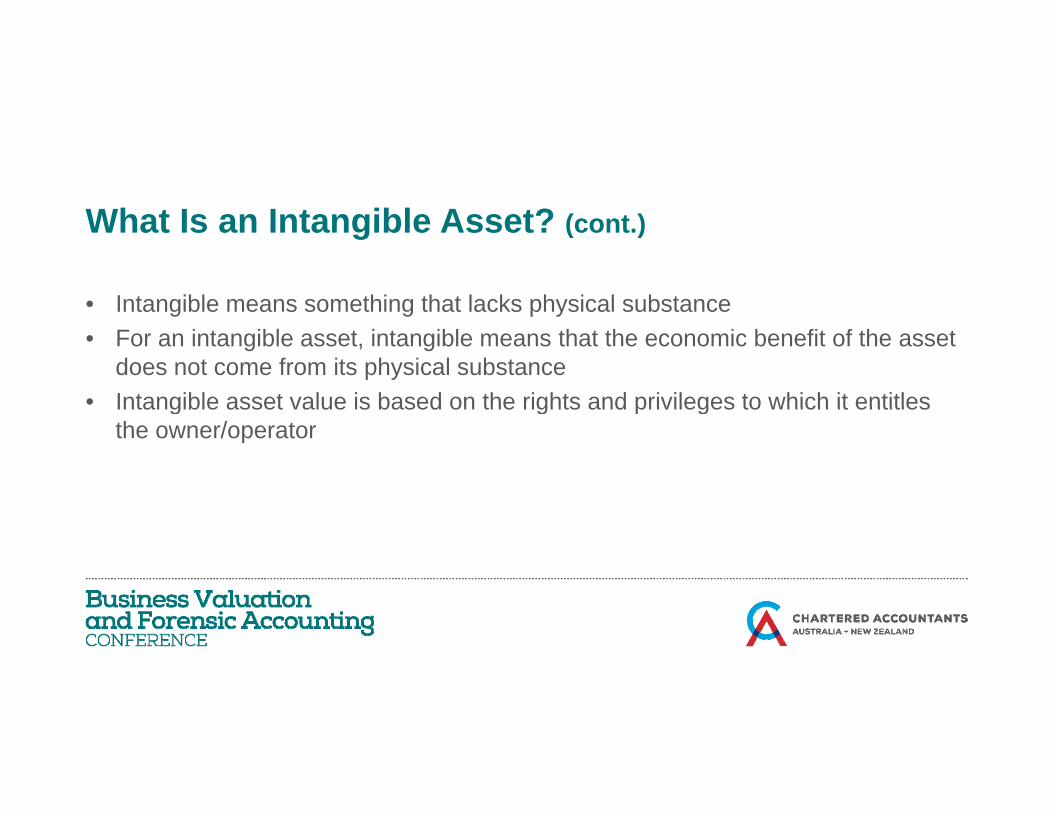
What Is an Intangible Asset? (cont )What Is an Intangible Asset? (cont.)
• Intangible means something that lacks physical substance• For an intangible asset, intangible means that the economic benefit of the asset
does not come from its physical substance• Intangible asset value is based on the rights and privileges to which it entitlesIntangible asset value is based on the rights and privileges to which it entitles
the owner/operator
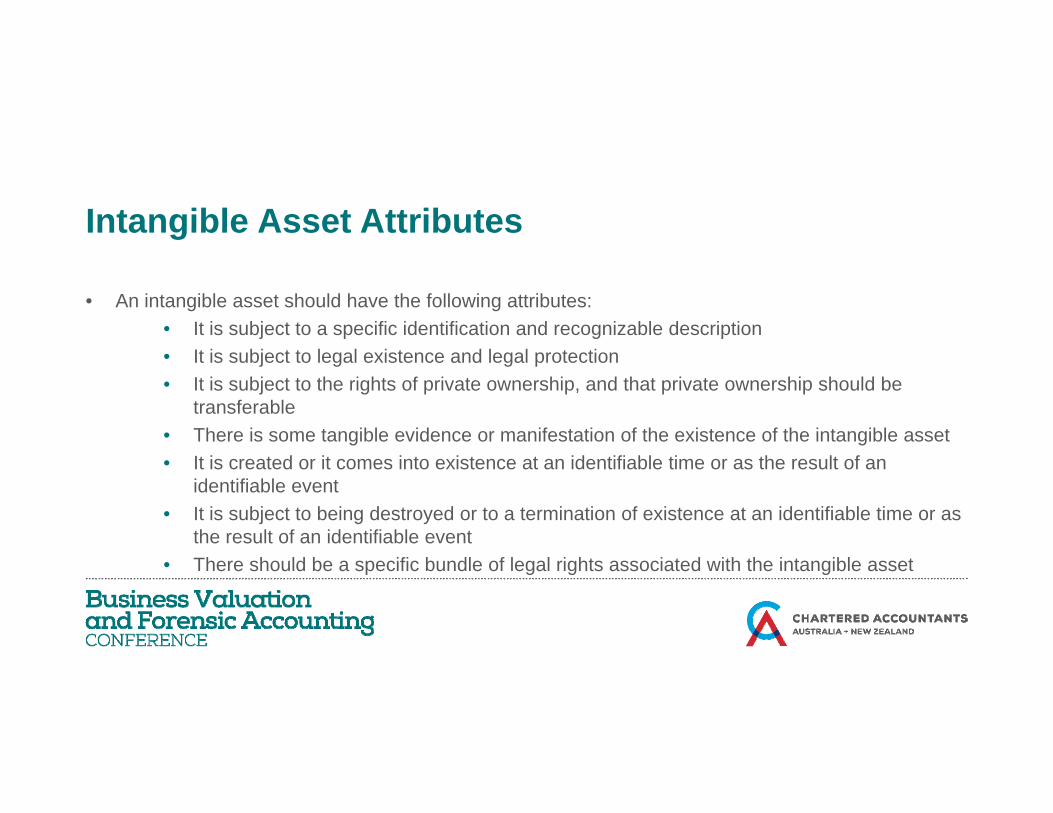
Intangible Asset AttributesIntangible Asset Attributes
• An intangible asset should have the following attributes:• It is subject to a specific identification and recognizable description• It is subject to legal existence and legal protection• It is subject to the rights of private ownership, and that private ownership should be
transferabletransferable• There is some tangible evidence or manifestation of the existence of the intangible asset• It is created or it comes into existence at an identifiable time or as the result of an
identifiable event• It is subject to being destroyed or to a termination of existence at an identifiable time or as
the result of an identifiable event• There should be a specific bundle of legal rights associated with the intangible asset
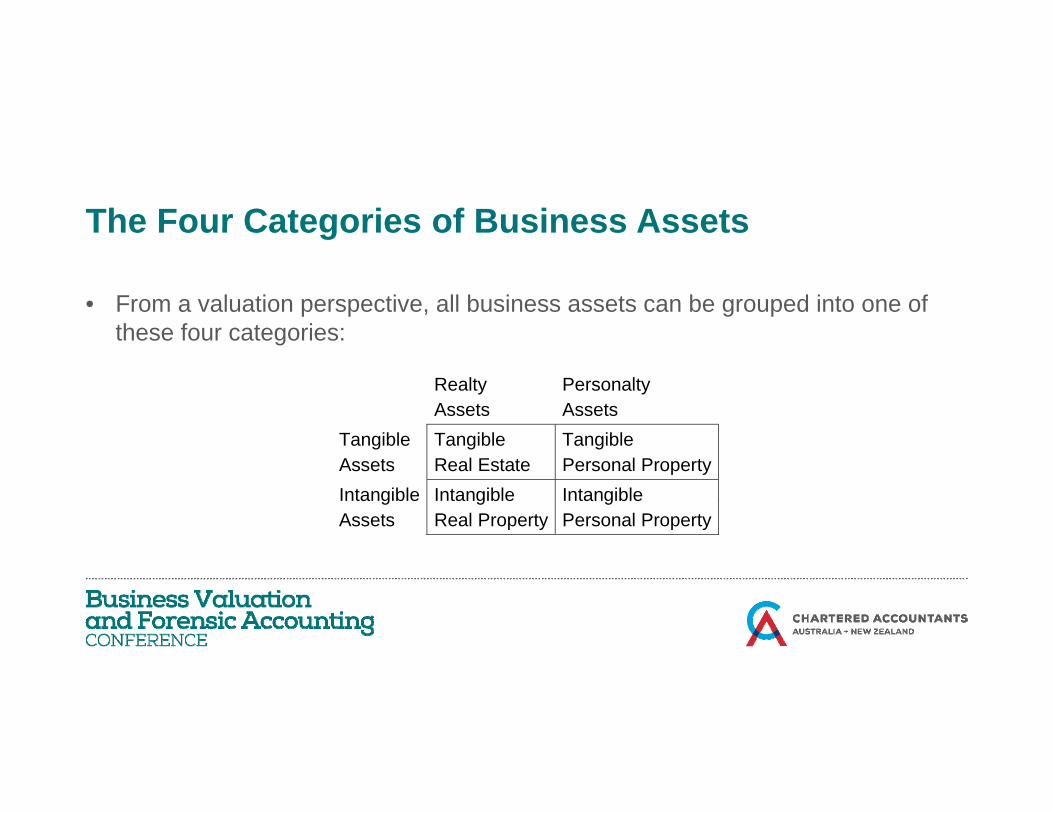
The Four Categories of Business AssetsThe Four Categories of Business Assets
• From a valuation perspective, all business assets can be grouped into one of these four categories:
Realty Assets
Personalty AssetsAssets Assets
Tangible Assets
Tangible Real Estate
Tangible Personal Property
Intangible Intangible IntangibleIntangible Assets
Intangible Real Property
Intangible Personal Property
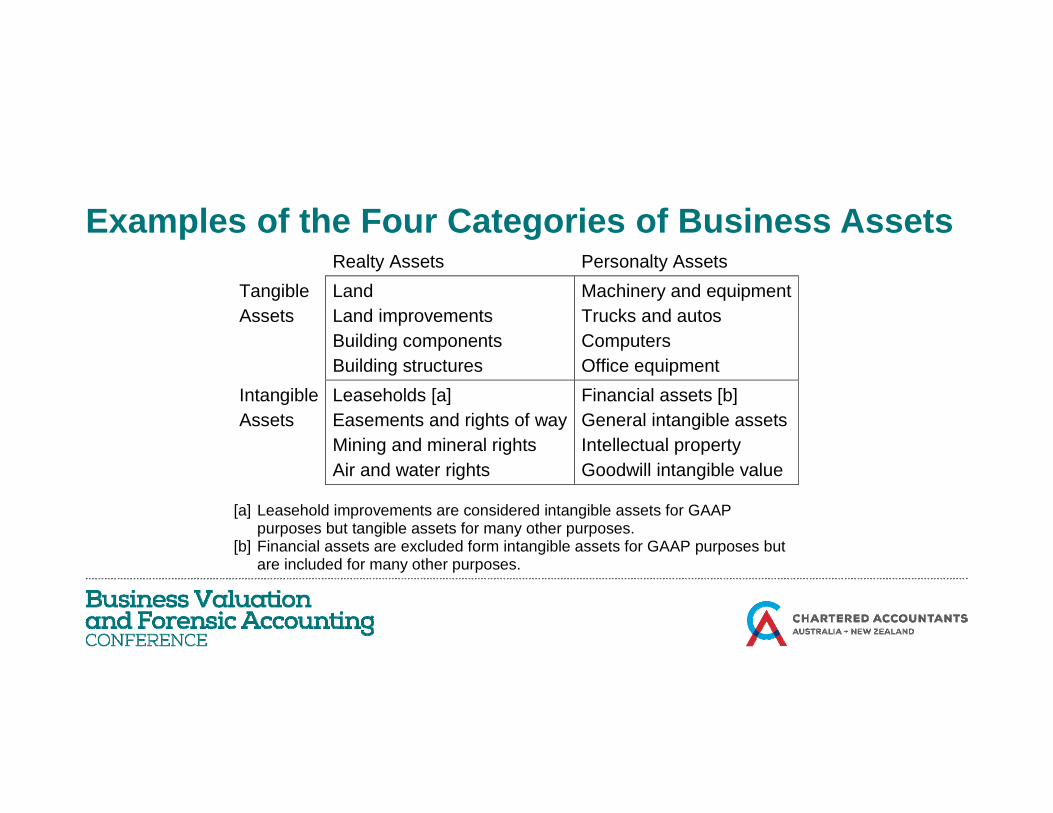
Examples of the Four Categories of Business AssetsExamples of the Four Categories of Business Assets Realty Assets Personalty Assets Tangible Assets
Land Land improvements
Machinery and equipment Trucks and autosAssets Land improvements
Building components Building structures
Trucks and autos Computers Office equipment
Intangible Leaseholds [a] Financial assets [b] Assets Easements and rights of way
Mining and mineral rights Air and water rights
General intangible assets Intellectual property Goodwill intangible value
[a] Leasehold improvements are considered intangible assets for GAAP
purposes but tangible assets for many other purposes. [b] Financial assets are excluded form intangible assets for GAAP purposes but
are included for many other purposes.

Categories of Identifiable Intangible AssetsCategories of Identifiable Intangible Assets
• The following are common categories of identifiable intangible assets:• Marketing-related intangible assets• Customer-related intangible assets• Artistic intangible assetsg• Contract-related intangible assets• Technology-related intangible assets
• According to GAAP, goodwill is also an intangible asset, although it is not anAccording to GAAP, goodwill is also an intangible asset, although it is not an identifiable intangible asset
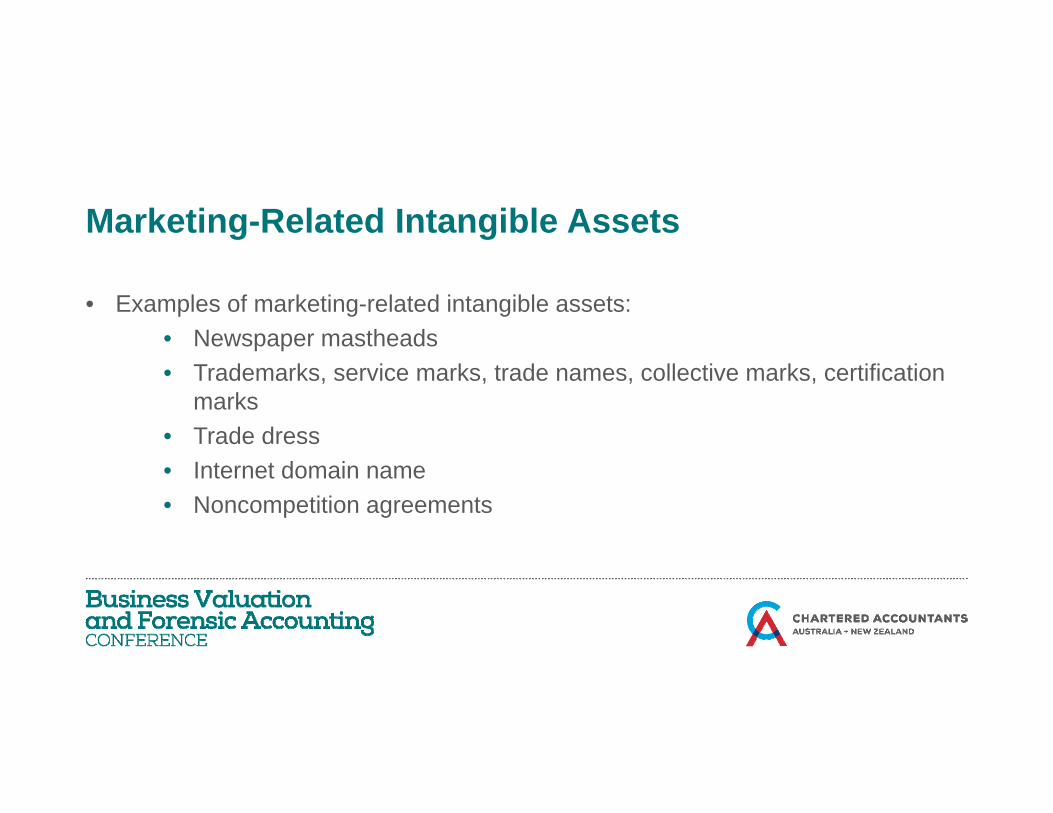
Marketing-Related Intangible AssetsMarketing Related Intangible Assets
• Examples of marketing-related intangible assets:• Newspaper mastheads• Trademarks, service marks, trade names, collective marks, certification
marksmarks• Trade dress• Internet domain name
N titi t• Noncompetition agreements
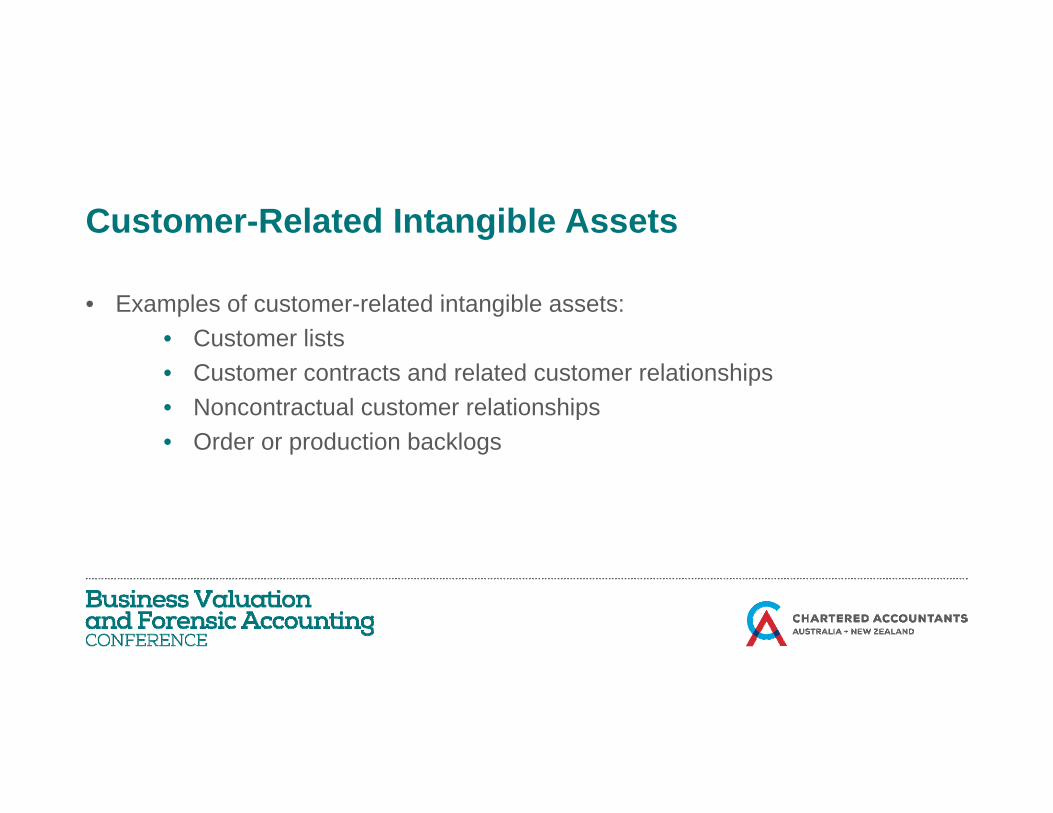
Customer-Related Intangible AssetsCustomer Related Intangible Assets
• Examples of customer-related intangible assets:• Customer lists • Customer contracts and related customer relationships• Noncontractual customer relationships• Noncontractual customer relationships• Order or production backlogs
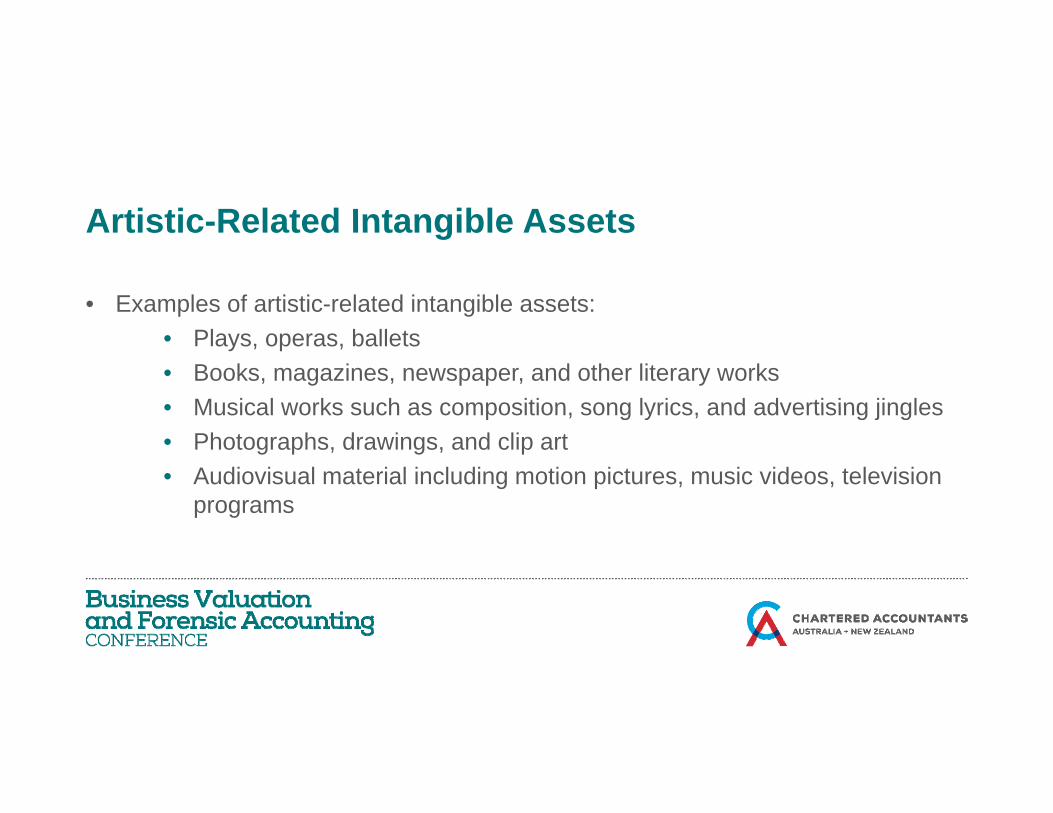
Artistic-Related Intangible AssetsArtistic Related Intangible Assets
• Examples of artistic-related intangible assets:• Plays, operas, ballets• Books, magazines, newspaper, and other literary works• Musical works such as composition song lyrics and advertising jingles• Musical works such as composition, song lyrics, and advertising jingles• Photographs, drawings, and clip art• Audiovisual material including motion pictures, music videos, television
programs
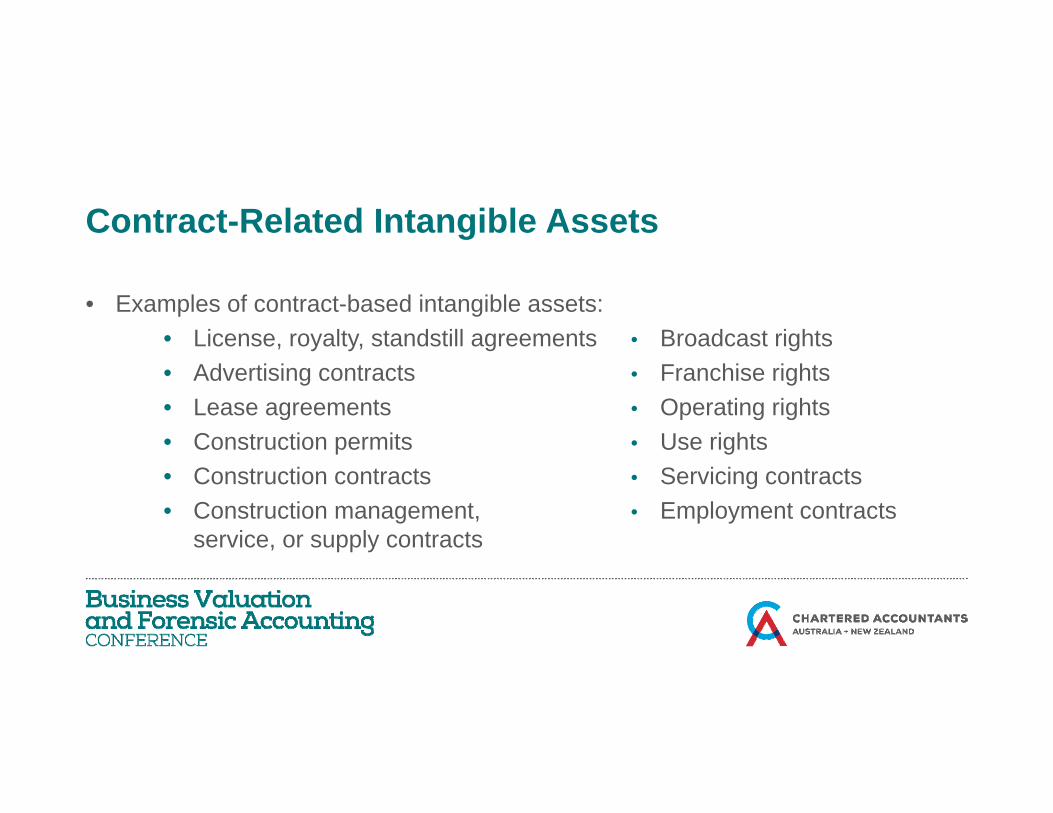
Contract-Related Intangible AssetsContract Related Intangible Assets
• Examples of contract-based intangible assets:• License, royalty, standstill agreements Broadcast rights• Advertising contracts Franchise rights• Lease agreements Operating rights• Lease agreements Operating rights• Construction permits Use rights• Construction contracts Servicing contracts• Construction management, Employment contracts
service, or supply contracts
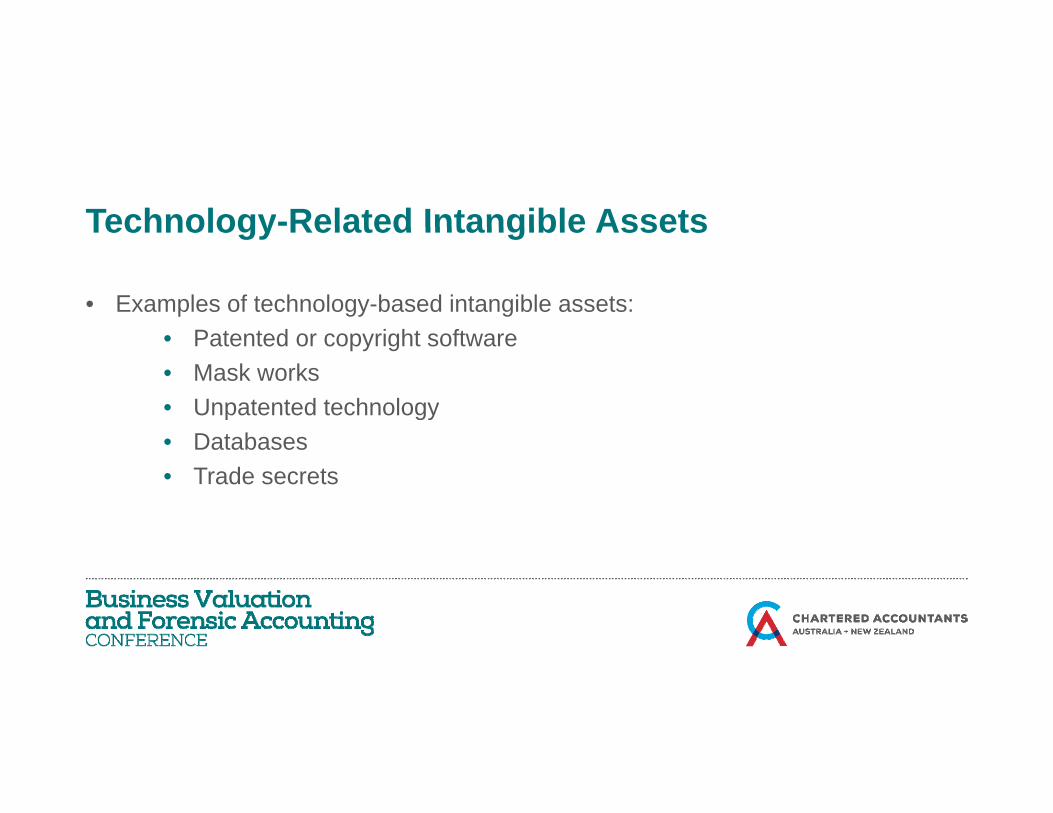
Technology-Related Intangible AssetsTechnology Related Intangible Assets
• Examples of technology-based intangible assets:• Patented or copyright software• Mask works• Unpatented technology• Unpatented technology• Databases• Trade secrets
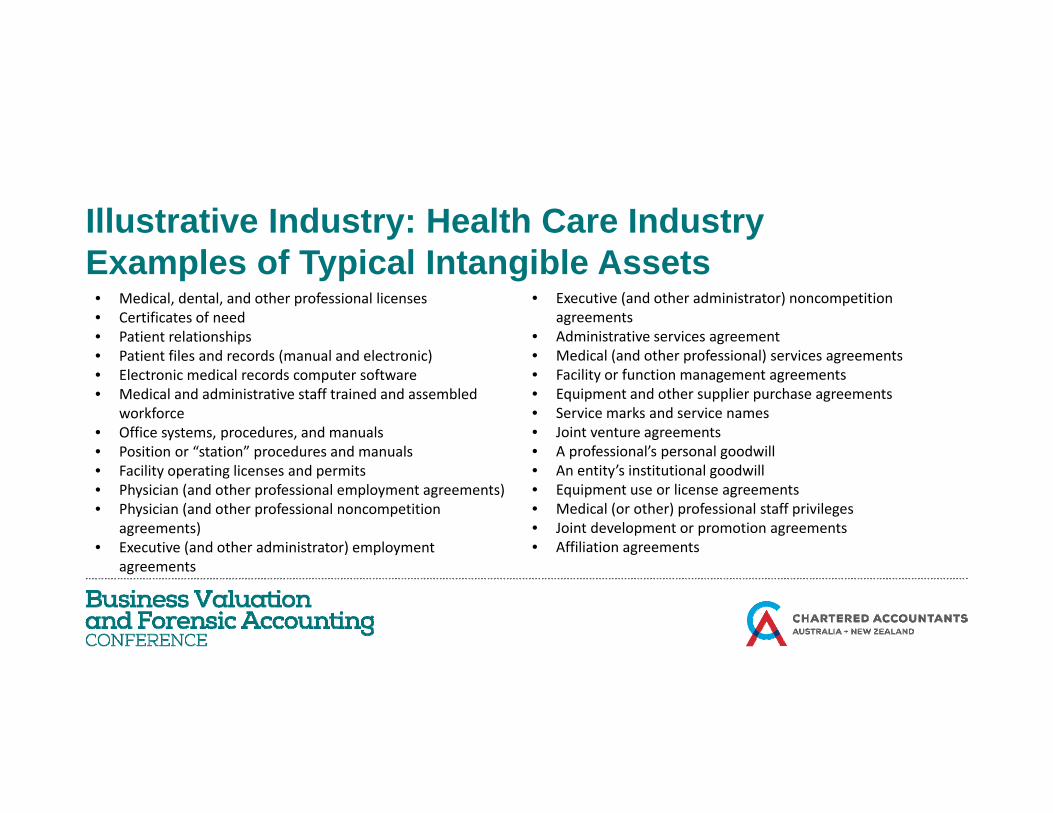
Illustrative Industry: Health Care IndustryIllustrative Industry: Health Care IndustryExamples of Typical Intangible Assets
• Medical, dental, and other professional licenses• Certificates of need
• Executive (and other administrator) noncompetition agreements• Certificates of need
• Patient relationships• Patient files and records (manual and electronic)• Electronic medical records computer software• Medical and administrative staff trained and assembled
agreements• Administrative services agreement• Medical (and other professional) services agreements• Facility or function management agreements• Equipment and other supplier purchase agreements
workforce• Office systems, procedures, and manuals• Position or “station” procedures and manuals• Facility operating licenses and permits• Physician (and other professional employment agreements)
• Service marks and service names• Joint venture agreements• A professional’s personal goodwill• An entity’s institutional goodwill• Equipment use or license agreementsy ( p p y g )
• Physician (and other professional noncompetition agreements)
• Executive (and other administrator) employment agreements
q p g• Medical (or other) professional staff privileges• Joint development or promotion agreements• Affiliation agreements
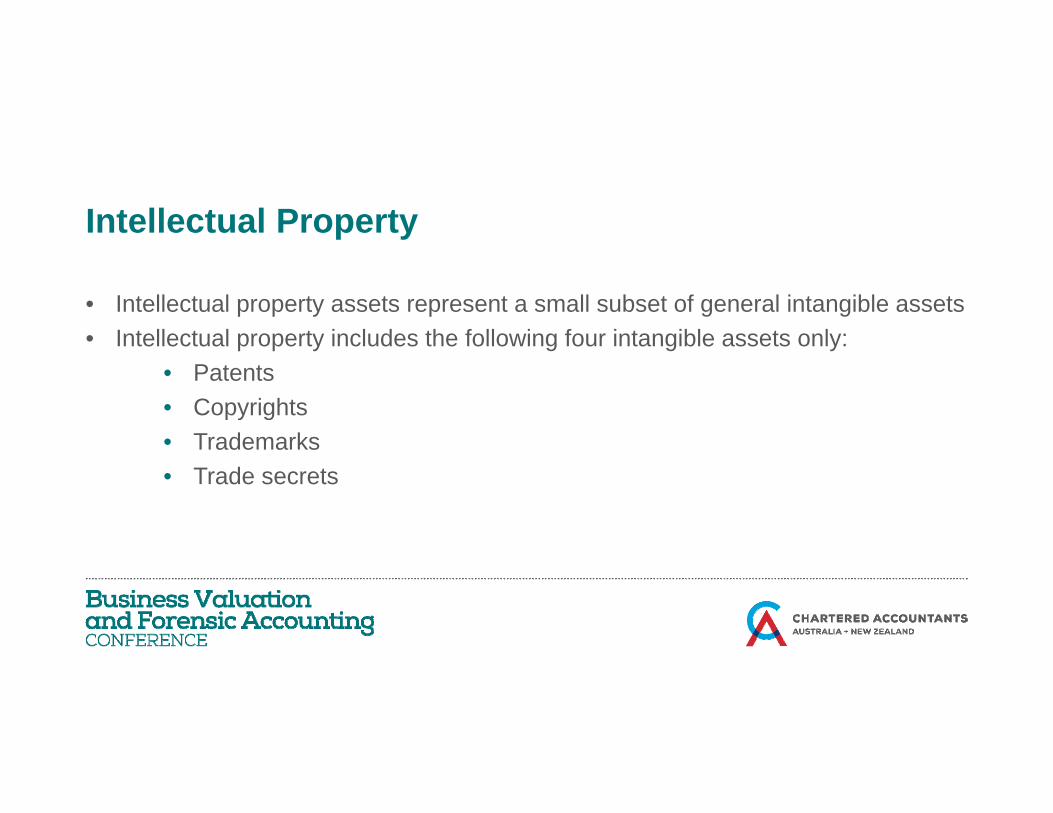
Intellectual PropertyIntellectual Property
• Intellectual property assets represent a small subset of general intangible assets• Intellectual property includes the following four intangible assets only:
• Patents• Copyrights• Copyrights• Trademarks• Trade secrets
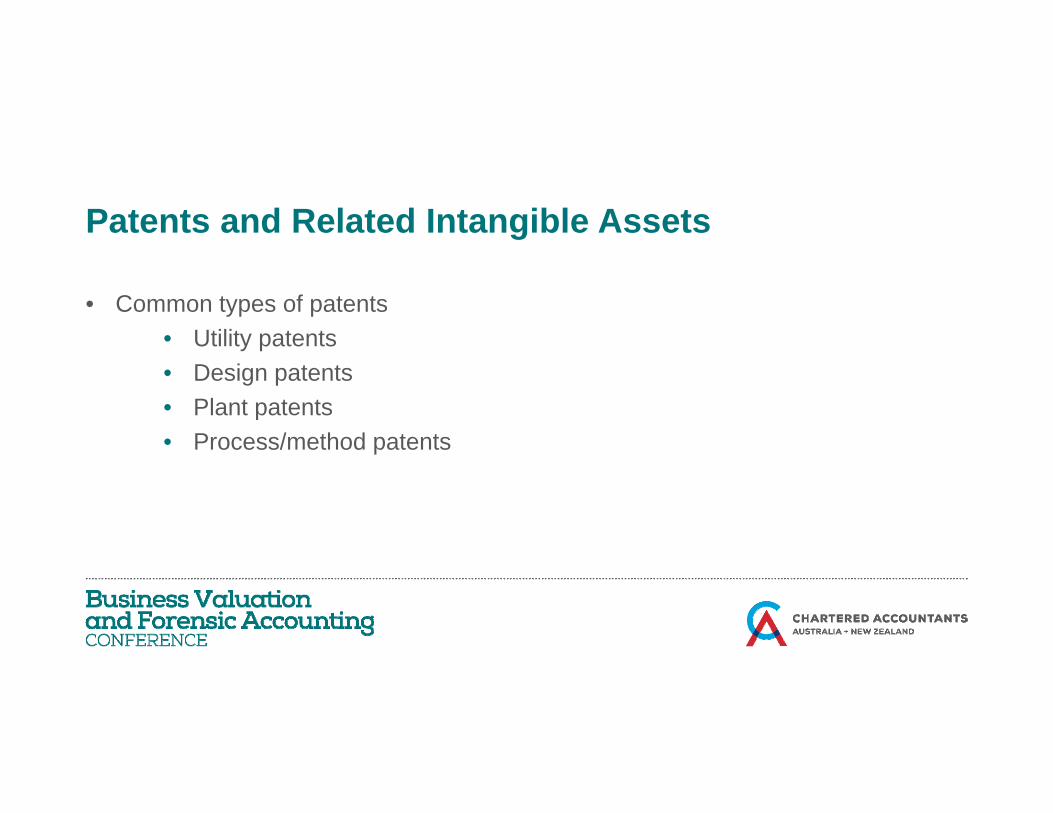
Patents and Related Intangible AssetsPatents and Related Intangible Assets
• Common types of patents• Utility patents• Design patents• Plant patents• Plant patents• Process/method patents
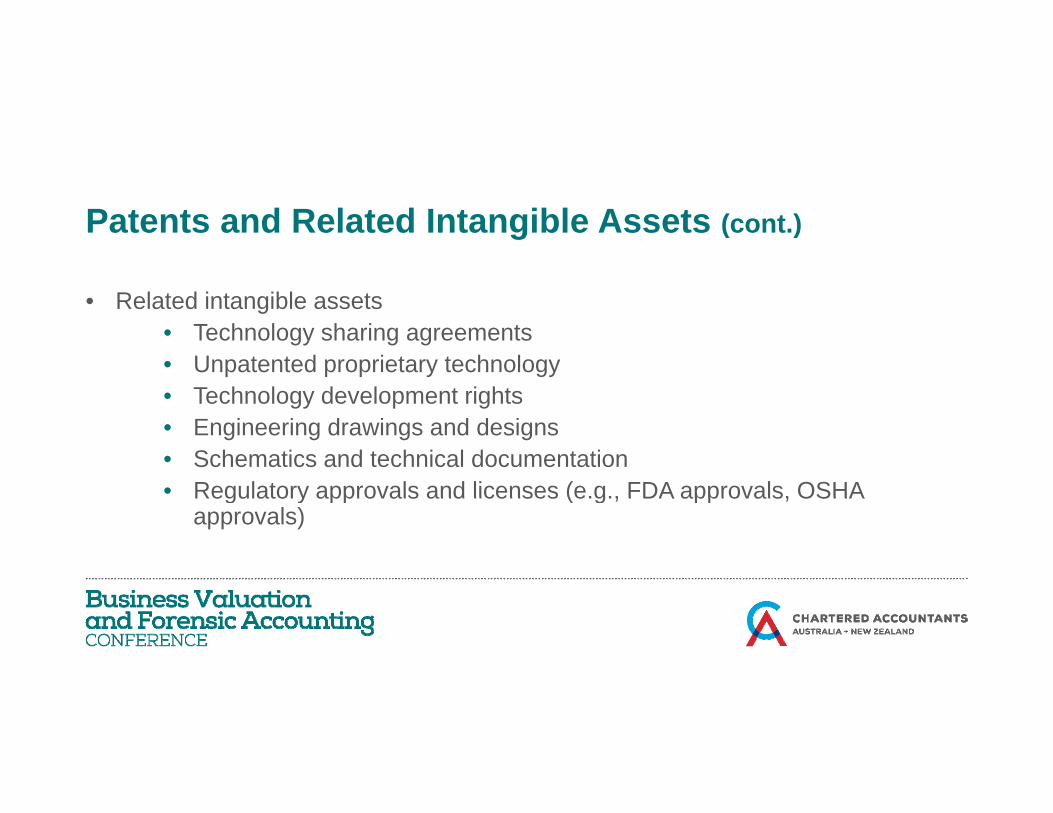
Patents and Related Intangible Assets (cont )Patents and Related Intangible Assets (cont.)
• Related intangible assets• Technology sharing agreements• Unpatented proprietary technology• Technology development rightsgy p g• Engineering drawings and designs• Schematics and technical documentation• Regulatory approvals and licenses (e.g., FDA approvals, OSHARegulatory approvals and licenses (e.g., FDA approvals, OSHA
approvals)
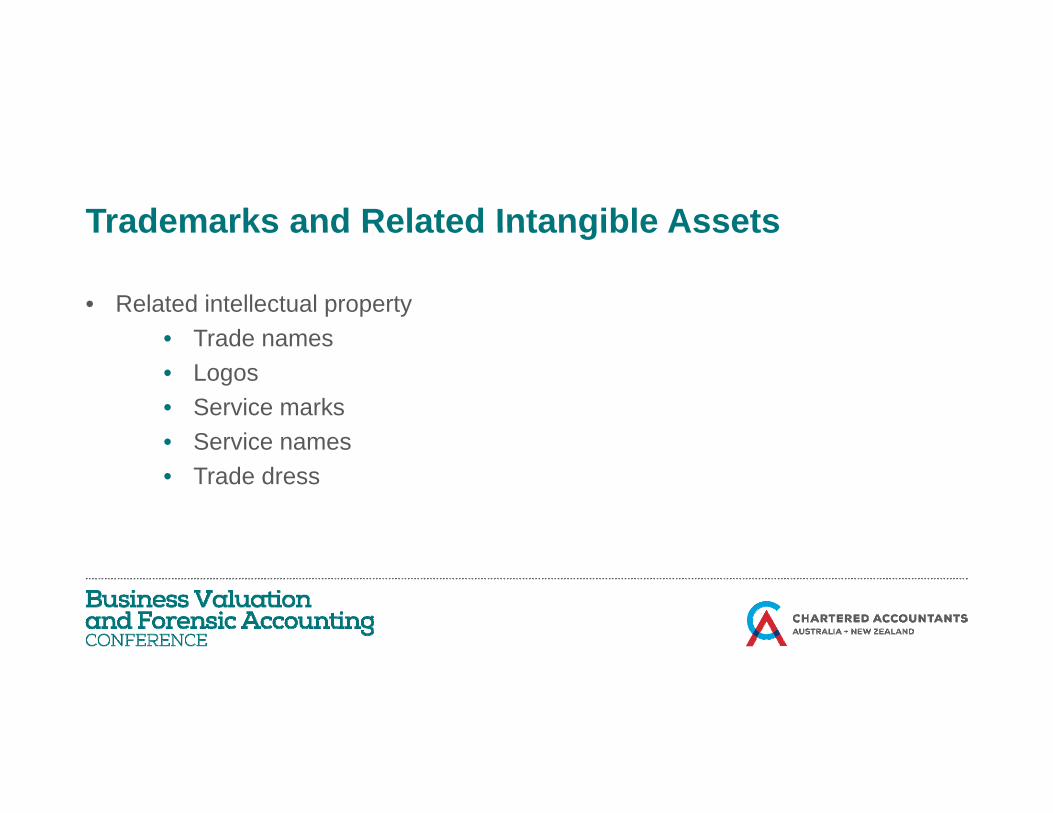
Trademarks and Related Intangible AssetsTrademarks and Related Intangible Assets
• Related intellectual property• Trade names• Logos• Service marks• Service marks• Service names• Trade dress
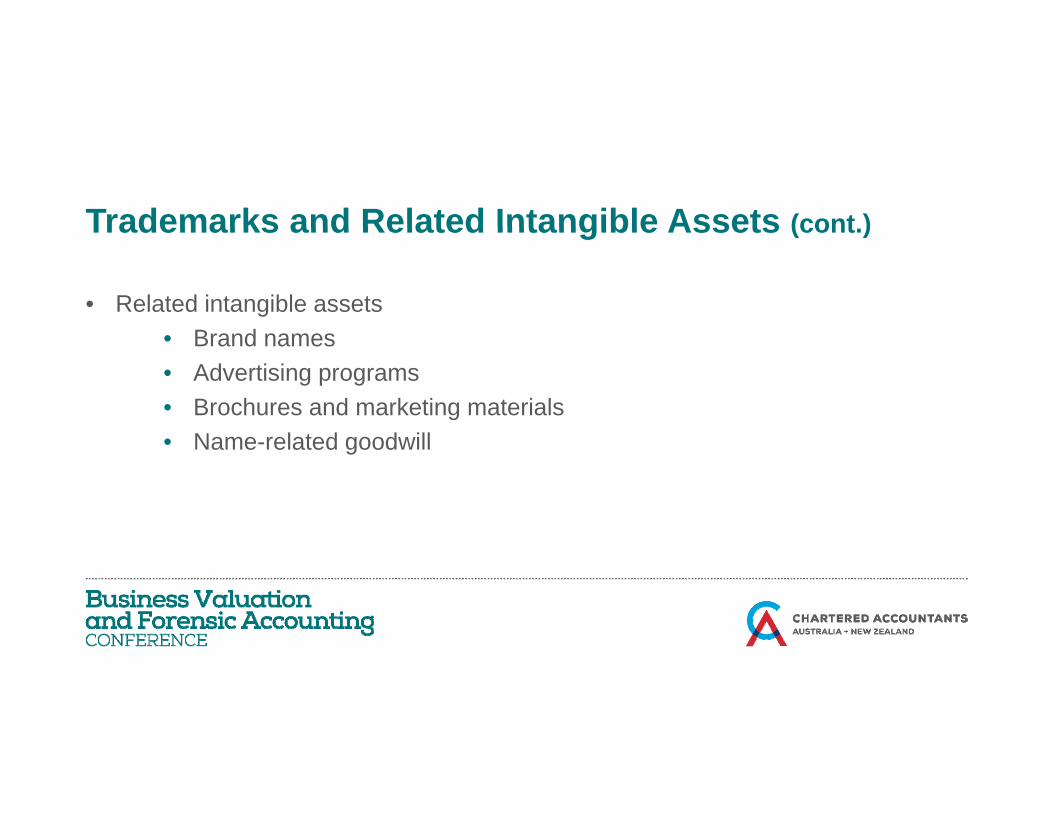
Trademarks and Related Intangible Assets (cont )Trademarks and Related Intangible Assets (cont.)
• Related intangible assets• Brand names• Advertising programs• Brochures and marketing materials• Brochures and marketing materials• Name-related goodwill
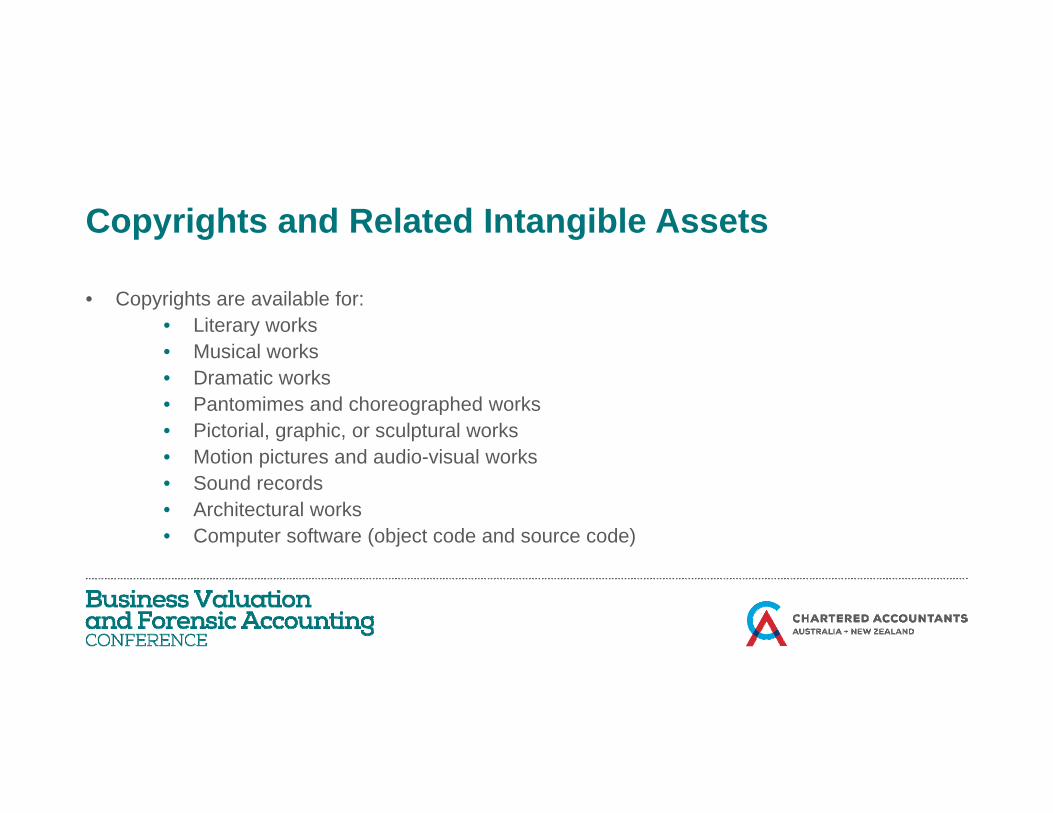
Copyrights and Related Intangible AssetsCopyrights and Related Intangible Assets
• Copyrights are available for:• Literary works• Musical works• Dramatic works• Pantomimes and choreographed worksPantomimes and choreographed works• Pictorial, graphic, or sculptural works• Motion pictures and audio-visual works• Sound records• Architectural works• Computer software (object code and source code)
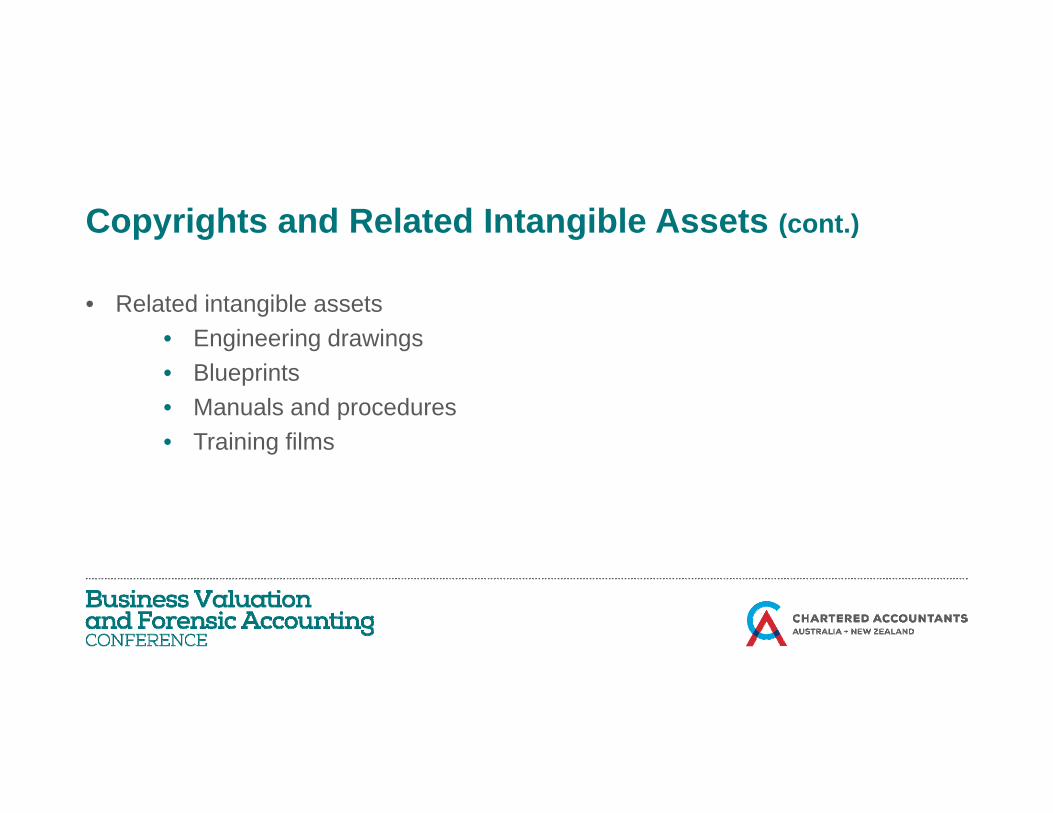
Copyrights and Related Intangible Assets (cont )Copyrights and Related Intangible Assets (cont.)
• Related intangible assets• Engineering drawings• Blueprints• Manuals and procedures• Manuals and procedures• Training films
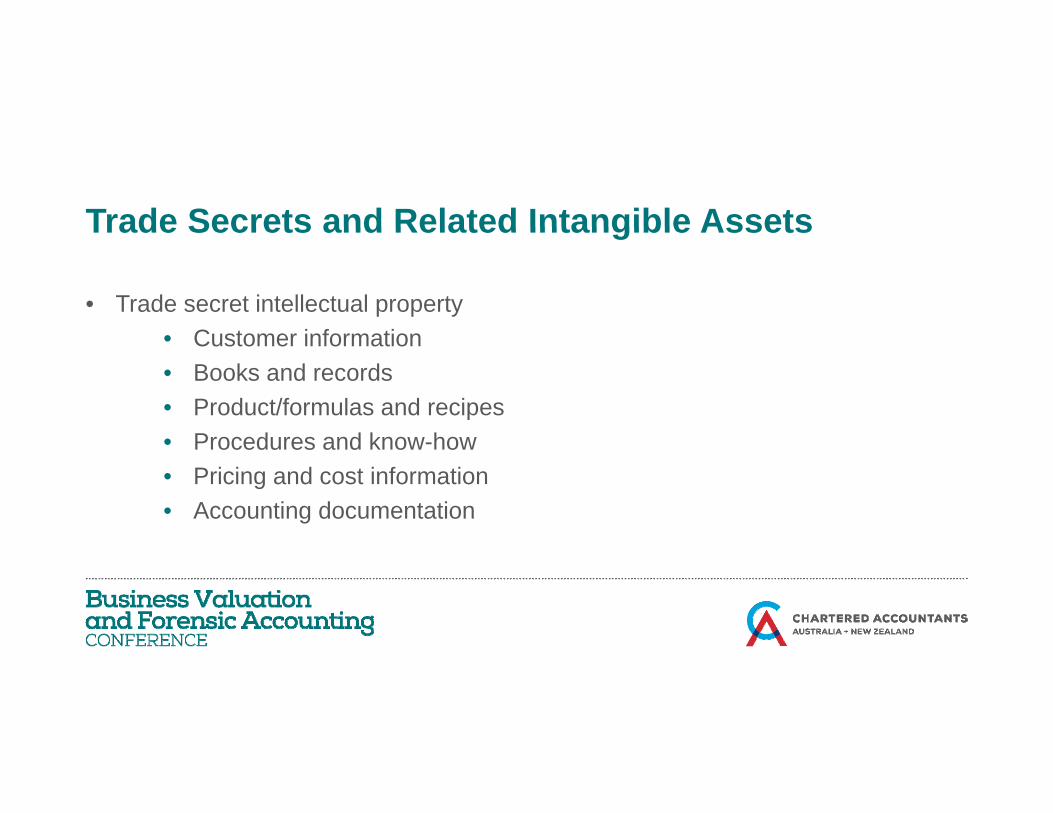
Trade Secrets and Related Intangible AssetsTrade Secrets and Related Intangible Assets
• Trade secret intellectual property• Customer information• Books and records• Product/formulas and recipes• Product/formulas and recipes• Procedures and know-how• Pricing and cost information• Accounting documentation
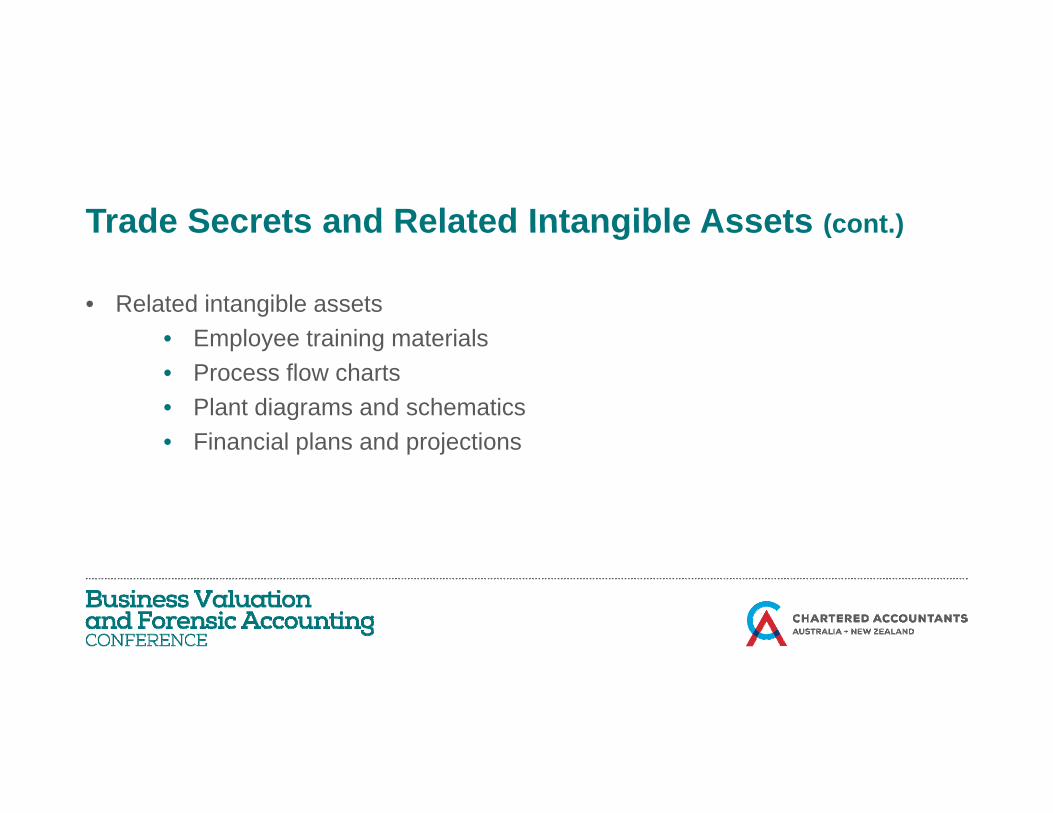
Trade Secrets and Related Intangible Assets (cont )Trade Secrets and Related Intangible Assets (cont.)
• Related intangible assets• Employee training materials• Process flow charts• Plant diagrams and schematics• Plant diagrams and schematics• Financial plans and projections
What is Not an Intangible Asset?What is Not an Intangible Asset?
• There are intangible attributes or intangible influences that may affect the value of intangible assets
• These attributes or influences are not assets
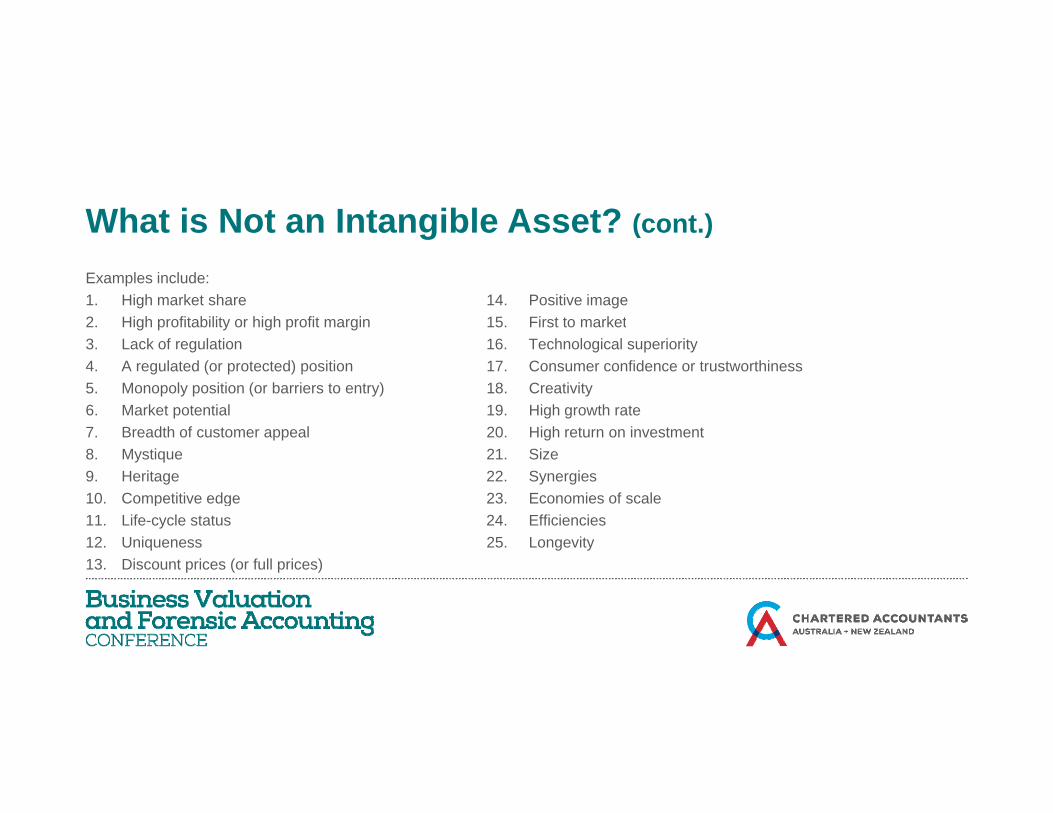
What is Not an Intangible Asset? (cont )What is Not an Intangible Asset? (cont.)
Examples include:1. High market share 14. Positive image2 Hi h fit bilit hi h fit i 15 Fi t t k t2. High profitability or high profit margin 15. First to market3. Lack of regulation 16. Technological superiority4. A regulated (or protected) position 17. Consumer confidence or trustworthiness5. Monopoly position (or barriers to entry) 18. Creativity6 M k t t ti l 19 Hi h th t6. Market potential 19. High growth rate7. Breadth of customer appeal 20. High return on investment8. Mystique 21. Size9. Heritage 22. Synergies10 Competitive edge 23 Economies of scale10. Competitive edge 23. Economies of scale11. Life-cycle status 24. Efficiencies12. Uniqueness 25. Longevity13. Discount prices (or full prices)
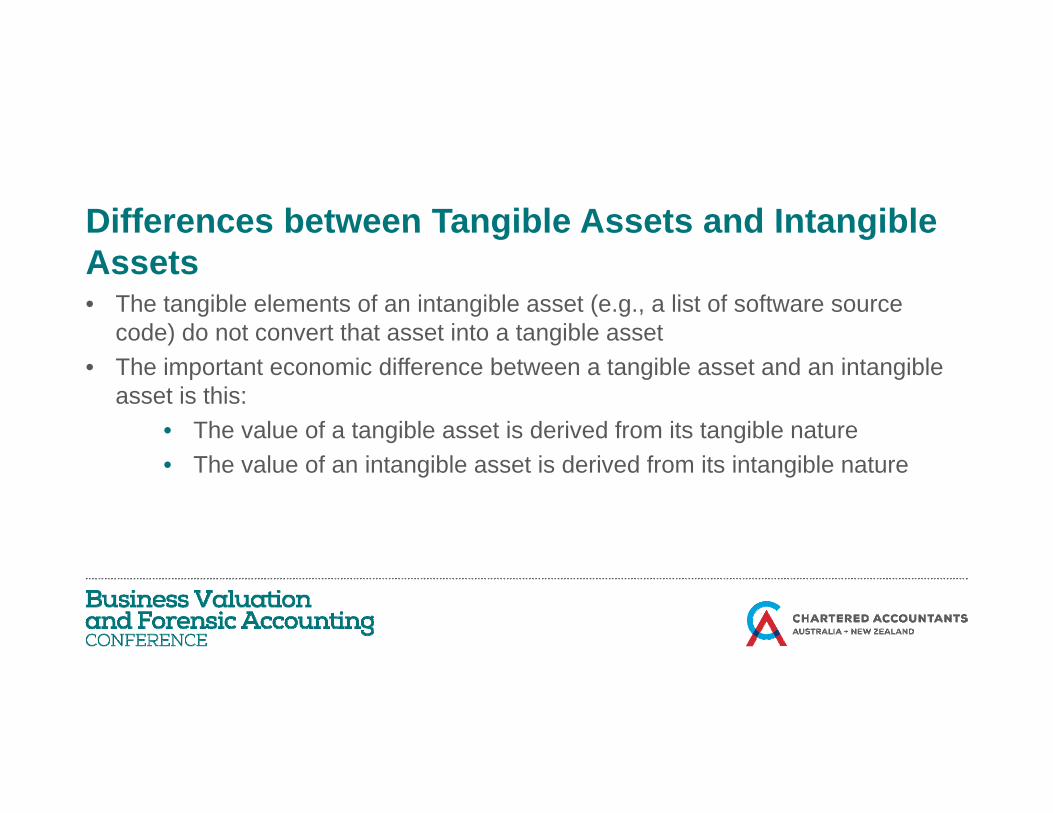
Differences between Tangible Assets and IntangibleDifferences between Tangible Assets and Intangible Assets• The tangible elements of an intangible asset (e.g., a list of software source
code) do not convert that asset into a tangible asset• The important economic difference between a tangible asset and an intangible
asset is this:• The value of a tangible asset is derived from its tangible nature• The value of an intangible asset is derived from its intangible nature
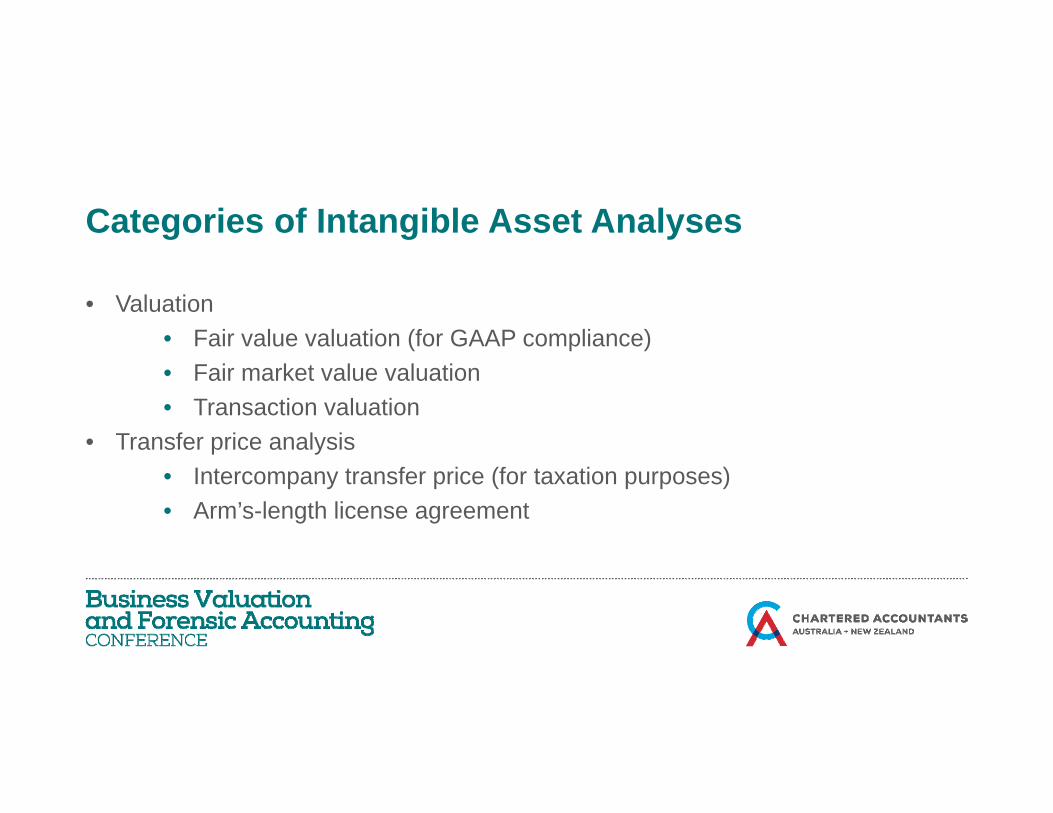
Categories of Intangible Asset AnalysesCategories of Intangible Asset Analyses
• Valuation• Fair value valuation (for GAAP compliance)• Fair market value valuation• Transaction valuation• Transaction valuation
• Transfer price analysis• Intercompany transfer price (for taxation purposes)• Arm’s-length license agreement
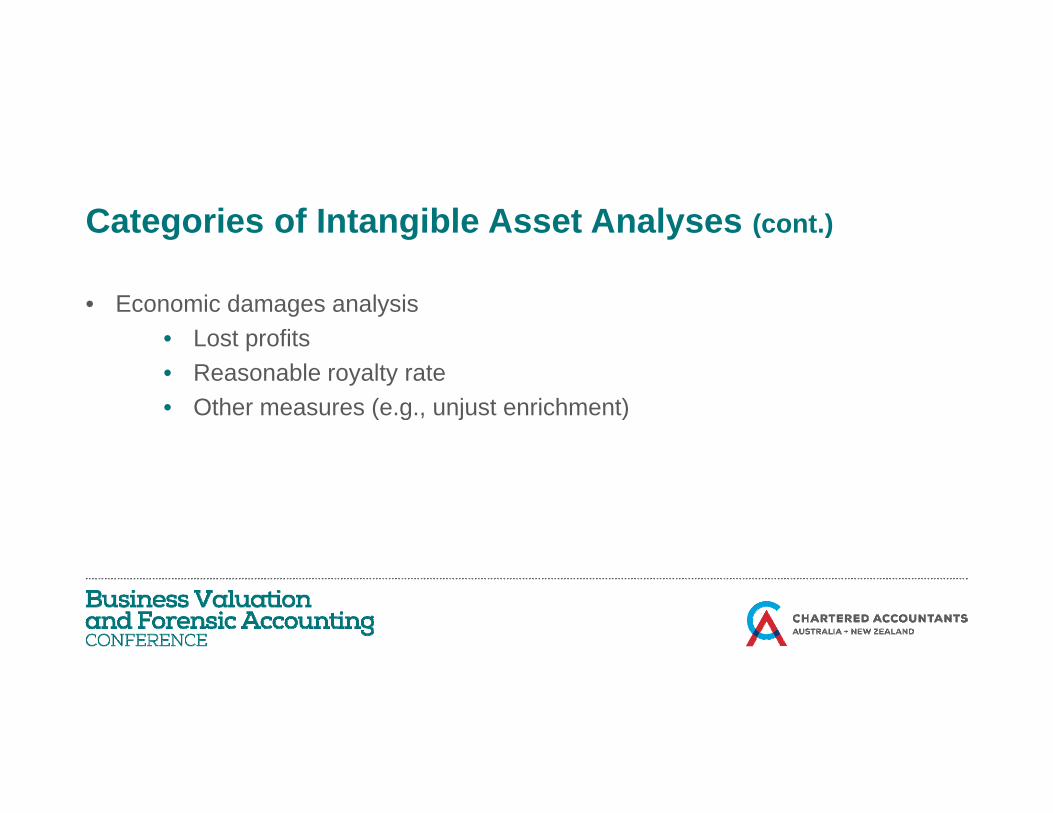
Categories of Intangible Asset Analyses (cont )Categories of Intangible Asset Analyses (cont.)
• Economic damages analysis• Lost profits• Reasonable royalty rate• Other measures (e g unjust enrichment)• Other measures (e.g., unjust enrichment)
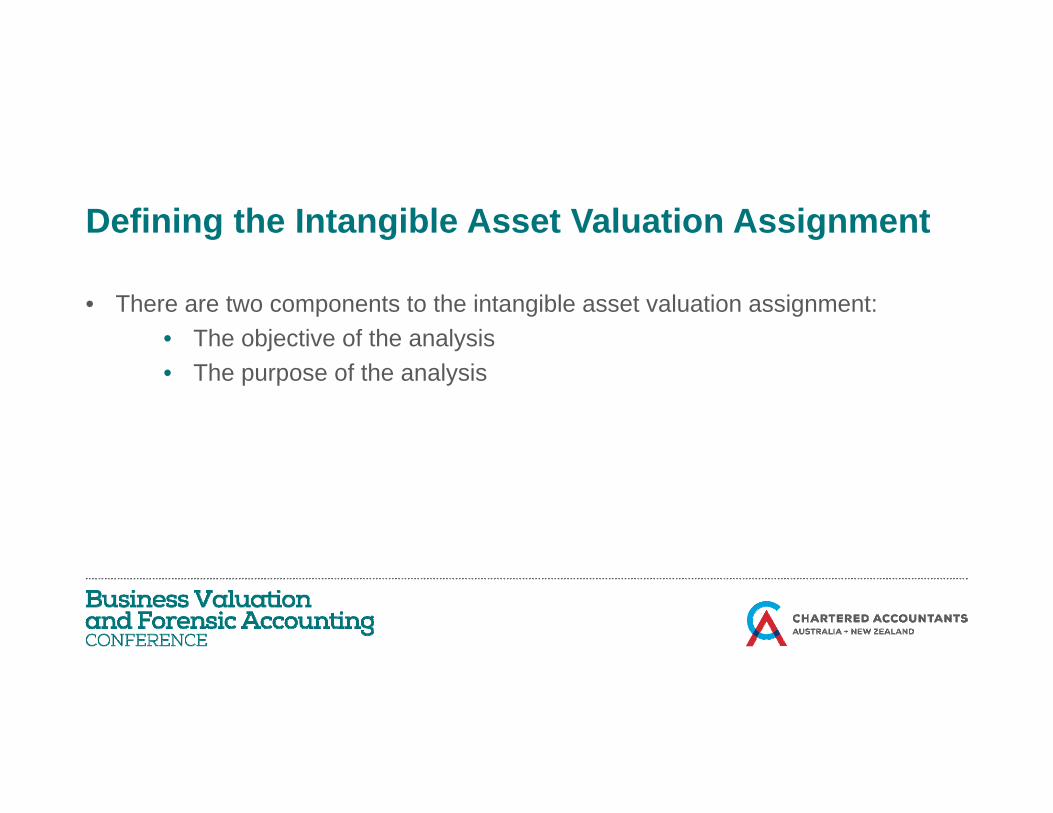
Defining the Intangible Asset Valuation AssignmentDefining the Intangible Asset Valuation Assignment
• There are two components to the intangible asset valuation assignment:• The objective of the analysis• The purpose of the analysis
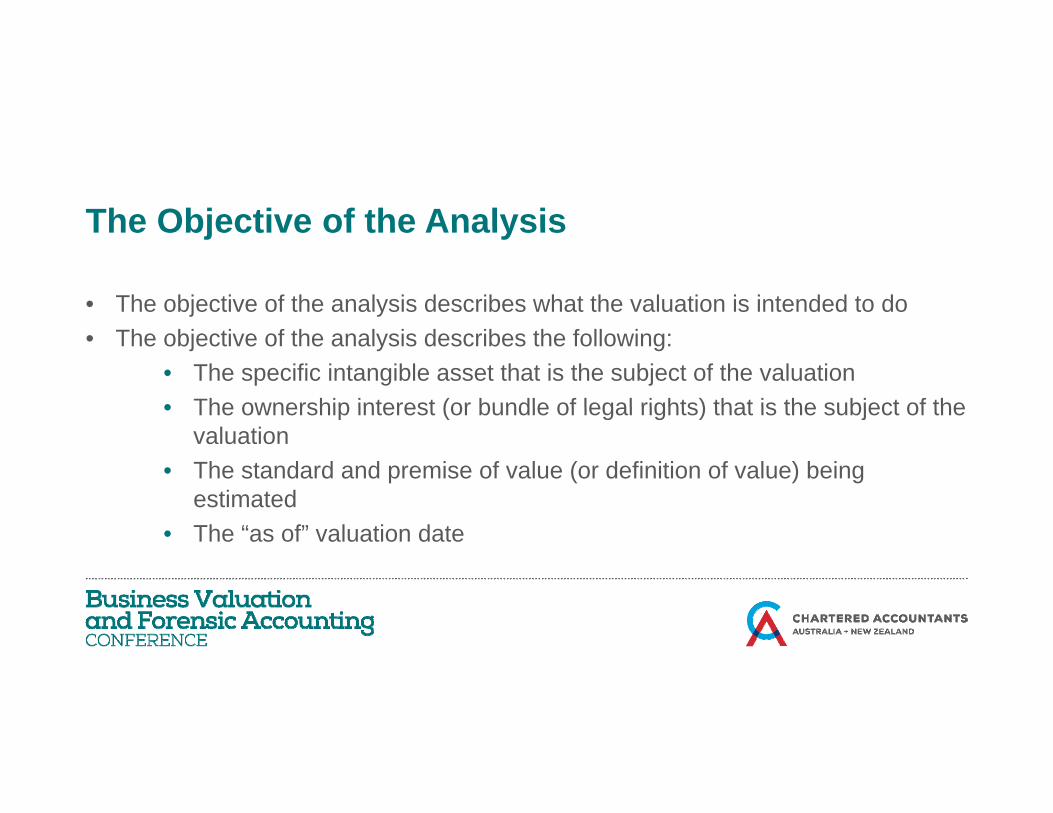
The Objective of the AnalysisThe Objective of the Analysis
• The objective of the analysis describes what the valuation is intended to do• The objective of the analysis describes the following:
• The specific intangible asset that is the subject of the valuation• The ownership interest (or bundle of legal rights) that is the subject of the• The ownership interest (or bundle of legal rights) that is the subject of the
valuation• The standard and premise of value (or definition of value) being
estimatedestimated• The “as of” valuation date
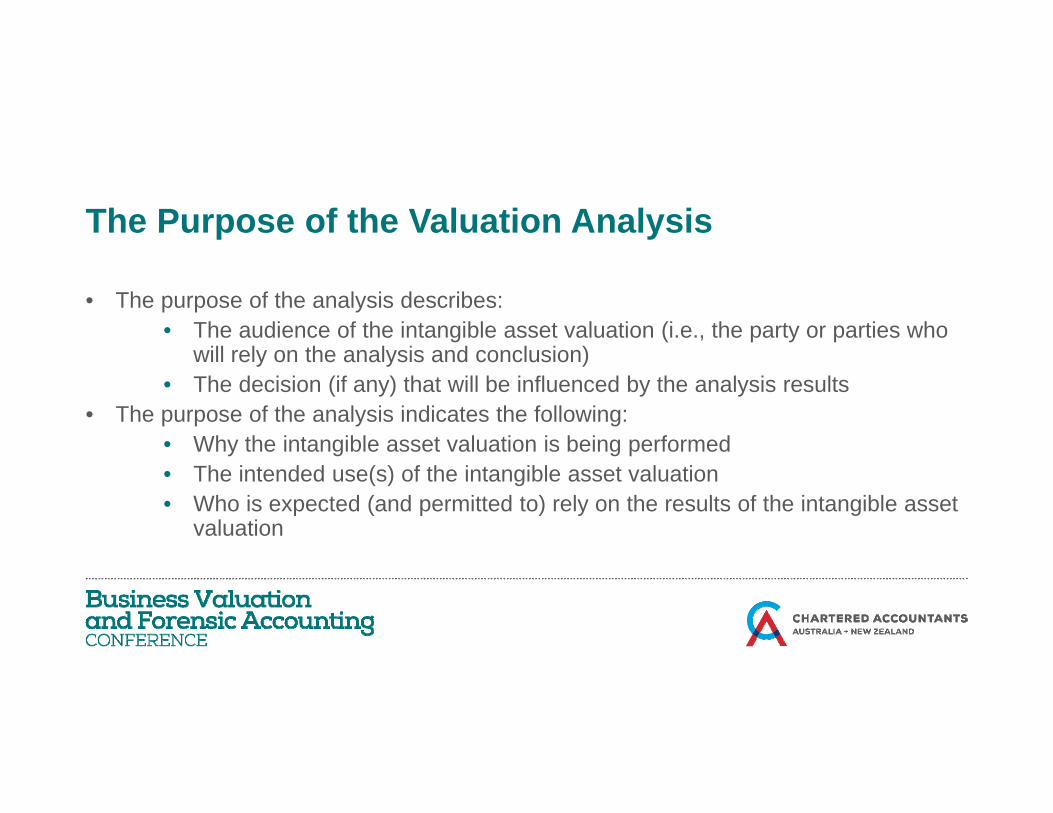
The Purpose of the Valuation AnalysisThe Purpose of the Valuation Analysis
• The purpose of the analysis describes:• The audience of the intangible asset valuation (i.e., the party or parties who
will rely on the analysis and conclusion)• The decision (if any) that will be influenced by the analysis results
Th f th l i i di t th f ll i• The purpose of the analysis indicates the following:• Why the intangible asset valuation is being performed• The intended use(s) of the intangible asset valuation
Wh i t d ( d itt d t ) l th lt f th i t ibl t• Who is expected (and permitted to) rely on the results of the intangible asset valuation

Selecting the Appropriate Standard of ValueSelecting the Appropriate Standard of Value
• Alternative intangible asset standards of value include the following:• Fair market value Investment/investor value• Fair value – financial accounting Owner value• Fair value statutory proceedings Insurable value• Fair value – statutory proceedings Insurable value• Market value Collateral value• Acquisition value Reasonably equivalent value• Use/user value Arm’s-length price
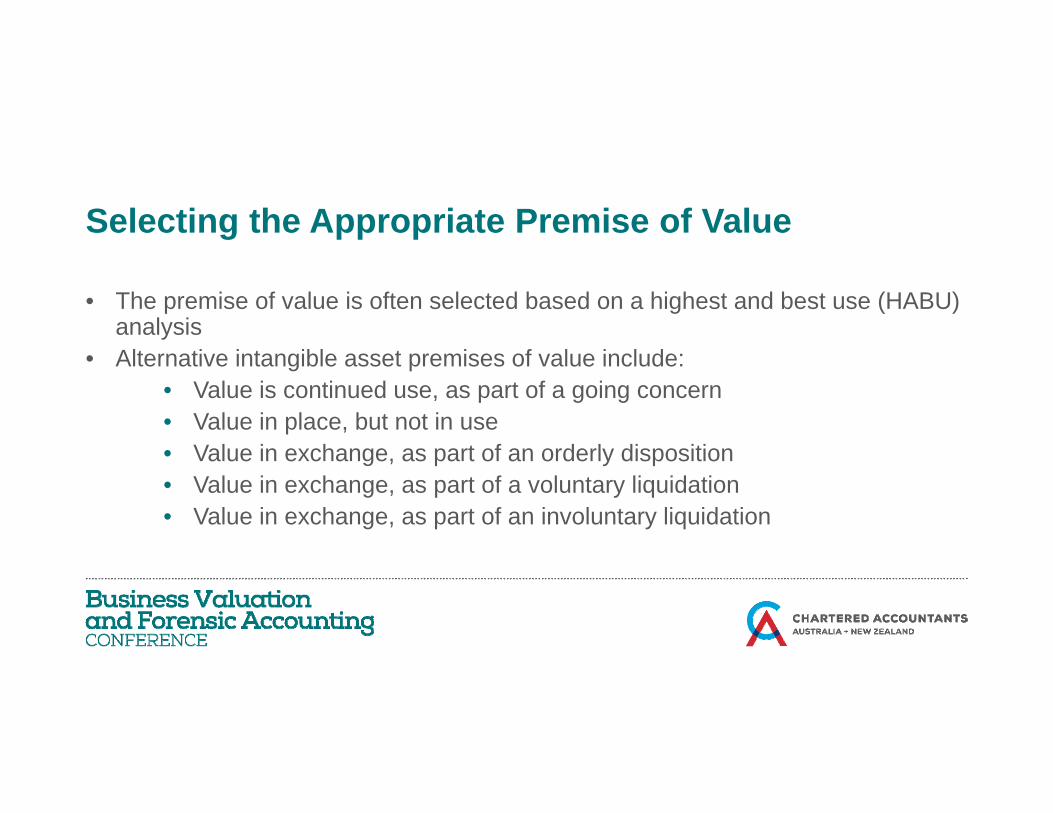
Selecting the Appropriate Premise of ValueSelecting the Appropriate Premise of Value
• The premise of value is often selected based on a highest and best use (HABU) analysis
• Alternative intangible asset premises of value include:• Value is continued use, as part of a going concern• Value in place, but not in use• Value in exchange, as part of an orderly disposition• Value in exchange, as part of a voluntary liquidationg p y q• Value in exchange, as part of an involuntary liquidation

Premise of Value ConsiderationsPremise of Value Considerations
• The analyst often selects the appropriate premise based on the following criteria:• The purpose and objective of the valuation; that is, what premise of value
makes the most sense, given the stated purpose and objective of the valuation?
• The actual functional and economic status of the intangible asset; that is, under what premise of value is the intangible asset actually operating?
• The HABU of the intangible asset; that is, what premise of value (or what marketplace) would conclude the greatest estimated value for the intangible asset if it was actually offered for sale?
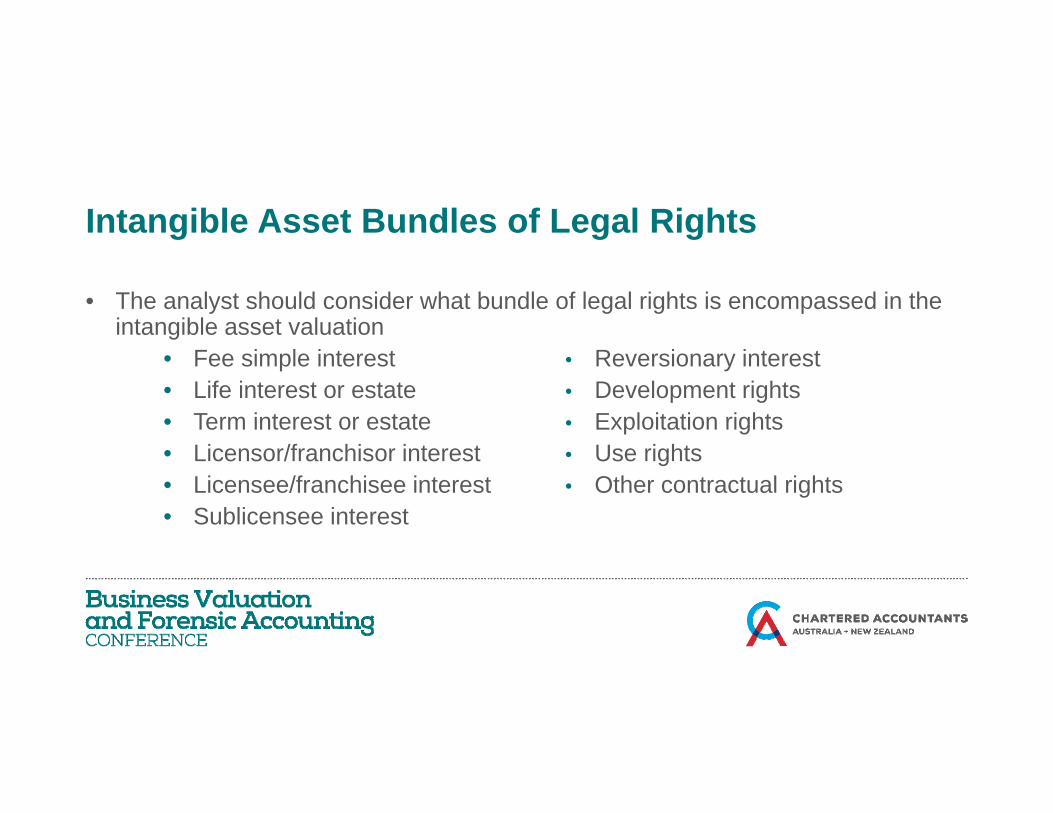
Intangible Asset Bundles of Legal RightsIntangible Asset Bundles of Legal Rights
• The analyst should consider what bundle of legal rights is encompassed in the intangible asset valuation
• Fee simple interest Reversionary interest• Life interest or estate Development rights• Term interest or estate Exploitation rights• Licensor/franchisor interest Use rights• Licensee/franchisee interest Other contractual rightsg• Sublicensee interest
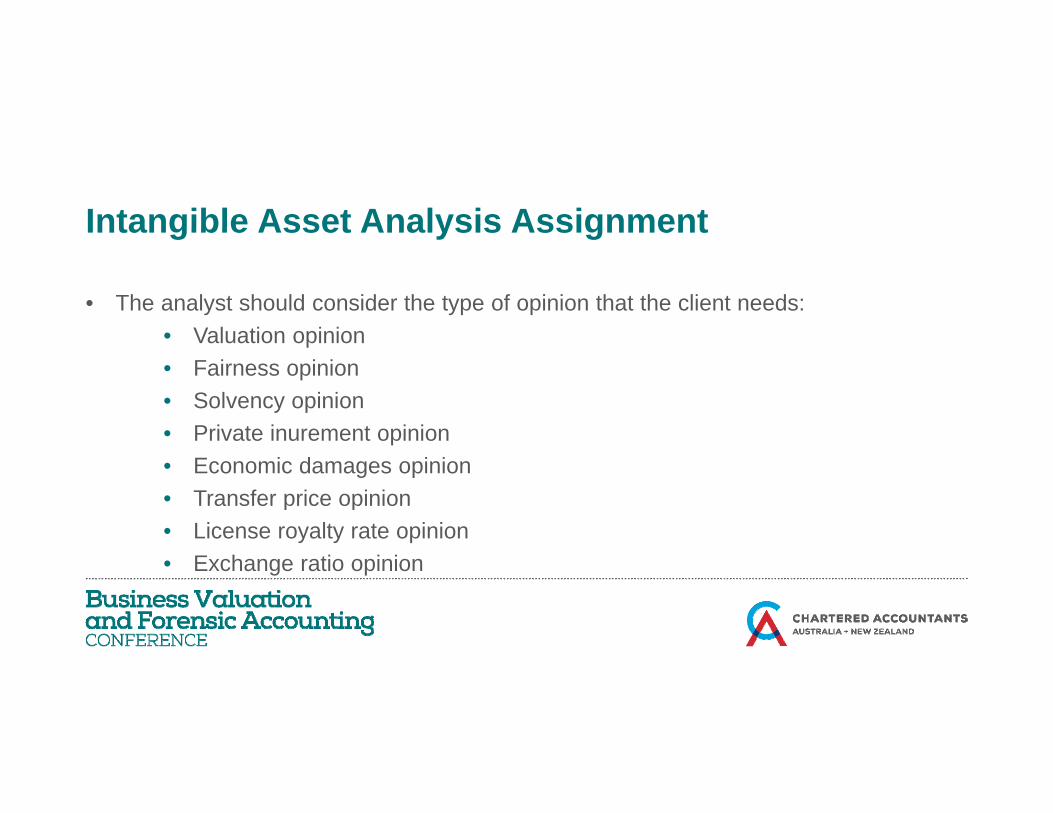
Intangible Asset Analysis AssignmentIntangible Asset Analysis Assignment
• The analyst should consider the type of opinion that the client needs:• Valuation opinion• Fairness opinion• Solvency opinionSolvency opinion• Private inurement opinion• Economic damages opinion• Transfer price opinion• Transfer price opinion• License royalty rate opinion• Exchange ratio opinion
Intangible Asset Data Gathering and Due DiligenceIntangible Asset Data Gathering and Due Diligence
• The analyst typically gathers and analyzes information related to the current intangible asset owner/operator
• Such information typically includes the following:• Owner/operator historical and prospective financial statementsOwner/operator historical and prospective financial statements• Owner/operator historical and prospective development/maintenance
costs• Owner/operator current and expected resource/capacity constraints• Owner/operator current and expected resource/capacity constraints
Intangible Asset Data Gathering and Due DiligenceIntangible Asset Data Gathering and Due Diligence (cont.)• Description and estimate of the intangible asset economic benefits to the current
owner/operatorowner/operator• associated revenue increase (e.g., related product unit price/volume, market
size/position)• associated expense decrease (e.g., expense related to product returns, COGS, SGA,
R&D)R&D)• associated investment decrease (e.g., inventory, capital expenditures)• associated risk decrease (existence of intangible asset licenses/contracts, decrease
of cost of capital components)assessment of the intangible asset impact on the owner/operator strategic position:• assessment of the intangible asset impact on the owner/operator strategic position: SWOT – strengths, weaknesses, opportunities, and threats
Intangible Asset Market Potential ConsiderationsIntangible Asset Market Potential Considerations
• The analyst may consider the intangible asset market potential outside of the current / towner/operator
• The analyst may consider the following factors:• Change in the market definition or the market size for an alternative owner/user• Change in alternative/competitive uses to an alternative owner/user• Change in alternative/competitive uses to an alternative owner/user• The intangible asset ability to create inbound/outbound license opportunities to an
alternative owner/user• Whether the current owner can (1) operate the intangible asset and also (2) ( ) p g ( )
outbound license the intangible asset (in different products, different markets, different territories, etc.)
Review of Intangible Asset Financial ProjectionsReview of Intangible Asset Financial Projections
• The analyst may review and challenge (1) any owner/operator-prepared y y g ( ) y p p pfinancial projections and (2) any owner/operator-prepared measures of intangible asset economic benefits.
• The analyst may perform the following benchmark analyses:y y p g y• compare owner/operator prior projections to prior actual results of
operationscompare owner/operator projections to current capacity constraints• compare owner/operator projections to current capacity constraints
• compare owner/operator projections to the current total market size
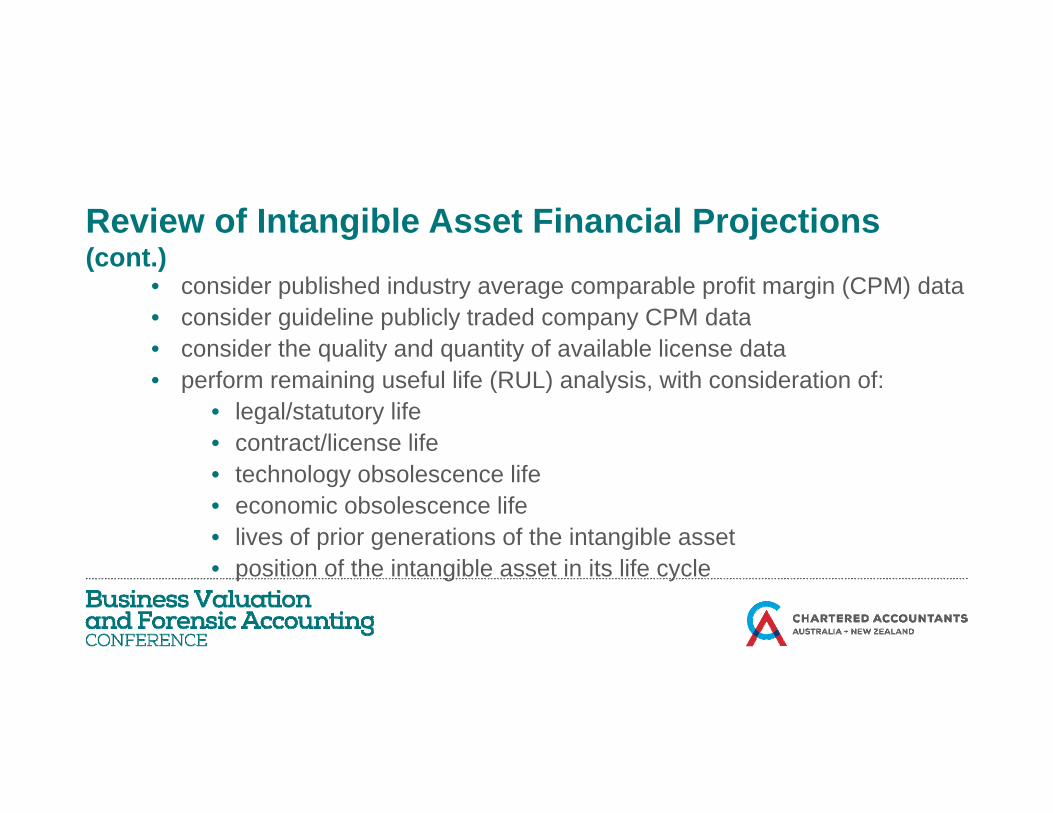
Review of Intangible Asset Financial ProjectionsReview of Intangible Asset Financial Projections (cont.)
• consider published industry average comparable profit margin (CPM) data• consider guideline publicly traded company CPM data• consider guideline publicly traded company CPM data• consider the quality and quantity of available license data• perform remaining useful life (RUL) analysis, with consideration of:
legal/stat tor life• legal/statutory life• contract/license life• technology obsolescence life
i b l lif• economic obsolescence life• lives of prior generations of the intangible asset• position of the intangible asset in its life cycle
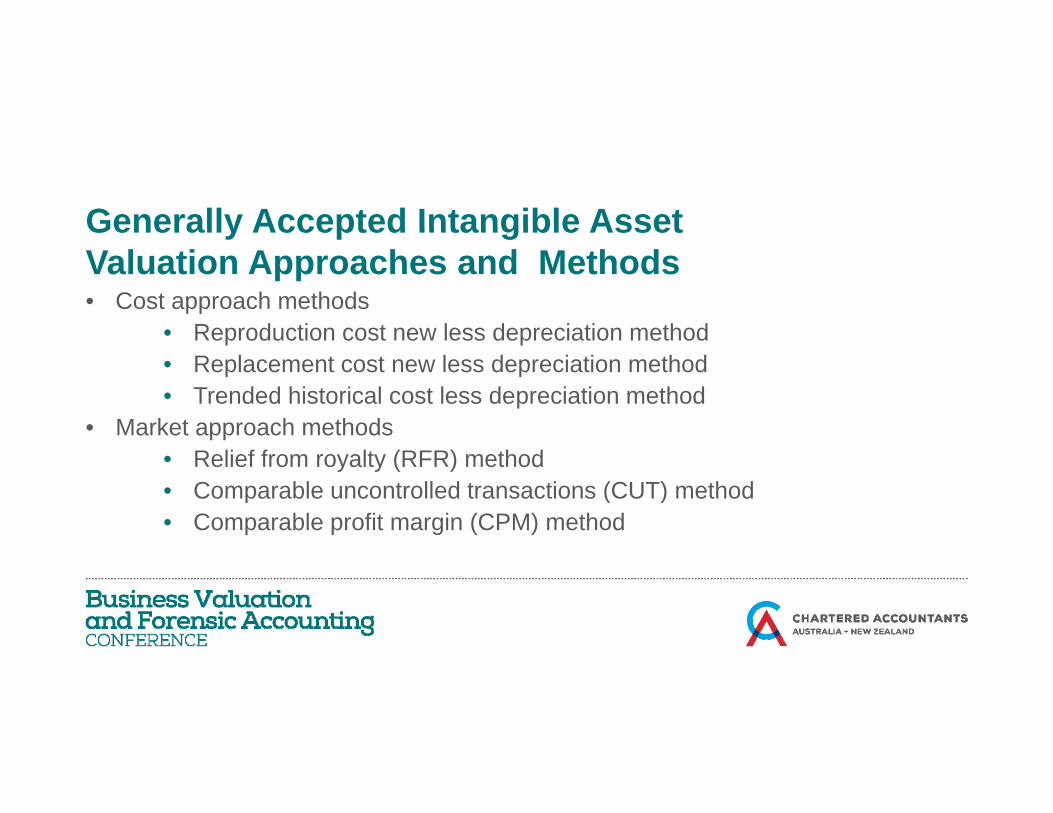
Generally Accepted Intangible AssetGenerally Accepted Intangible AssetValuation Approaches and Methods• Cost approach methods
• Reproduction cost new less depreciation method• Replacement cost new less depreciation method• Trended historical cost less depreciation methodp
• Market approach methods• Relief from royalty (RFR) method• Comparable uncontrolled transactions (CUT) methodComparable uncontrolled transactions (CUT) method• Comparable profit margin (CPM) method
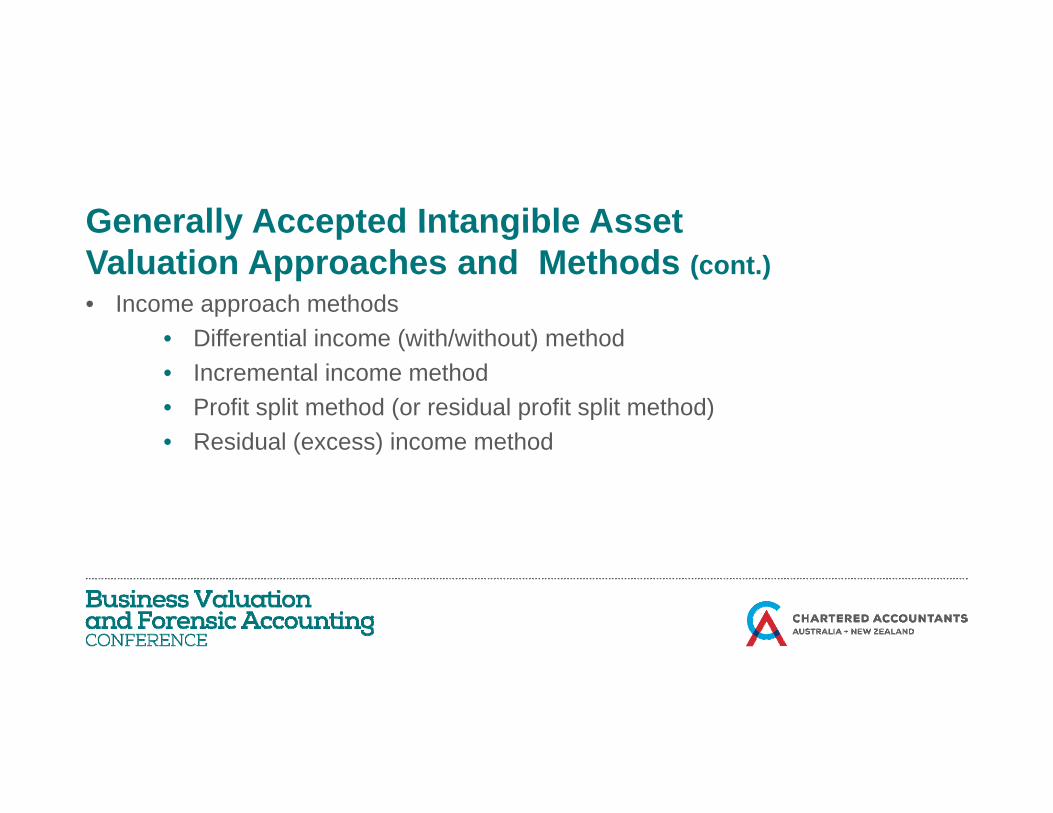
Generally Accepted Intangible AssetGenerally Accepted Intangible AssetValuation Approaches and Methods (cont.)• Income approach methods
• Differential income (with/without) method• Incremental income method• Profit split method (or residual profit split method)• Profit split method (or residual profit split method)• Residual (excess) income method
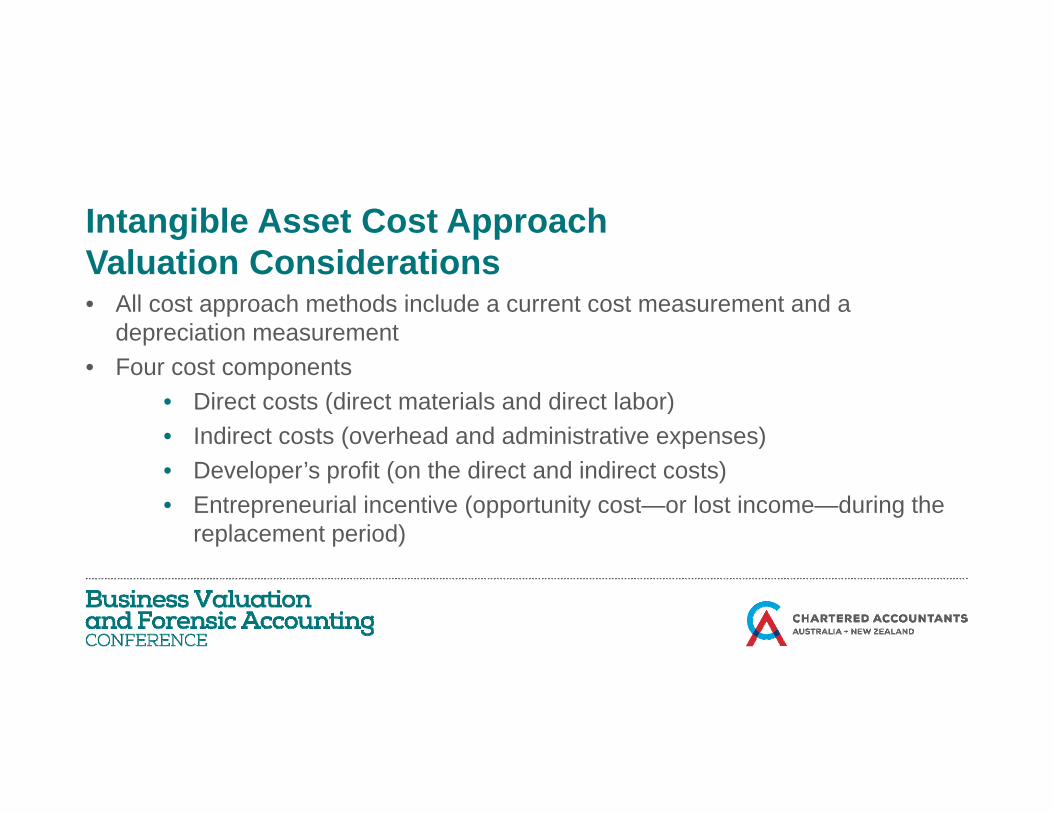
Intangible Asset Cost ApproachIntangible Asset Cost ApproachValuation Considerations• All cost approach methods include a current cost measurement and a
depreciation measurement• Four cost components
• Direct costs (direct materials and direct labor)Direct costs (direct materials and direct labor)• Indirect costs (overhead and administrative expenses)• Developer’s profit (on the direct and indirect costs)
E t i l i ti ( t it t l t i d i th• Entrepreneurial incentive (opportunity cost—or lost income—during the replacement period)
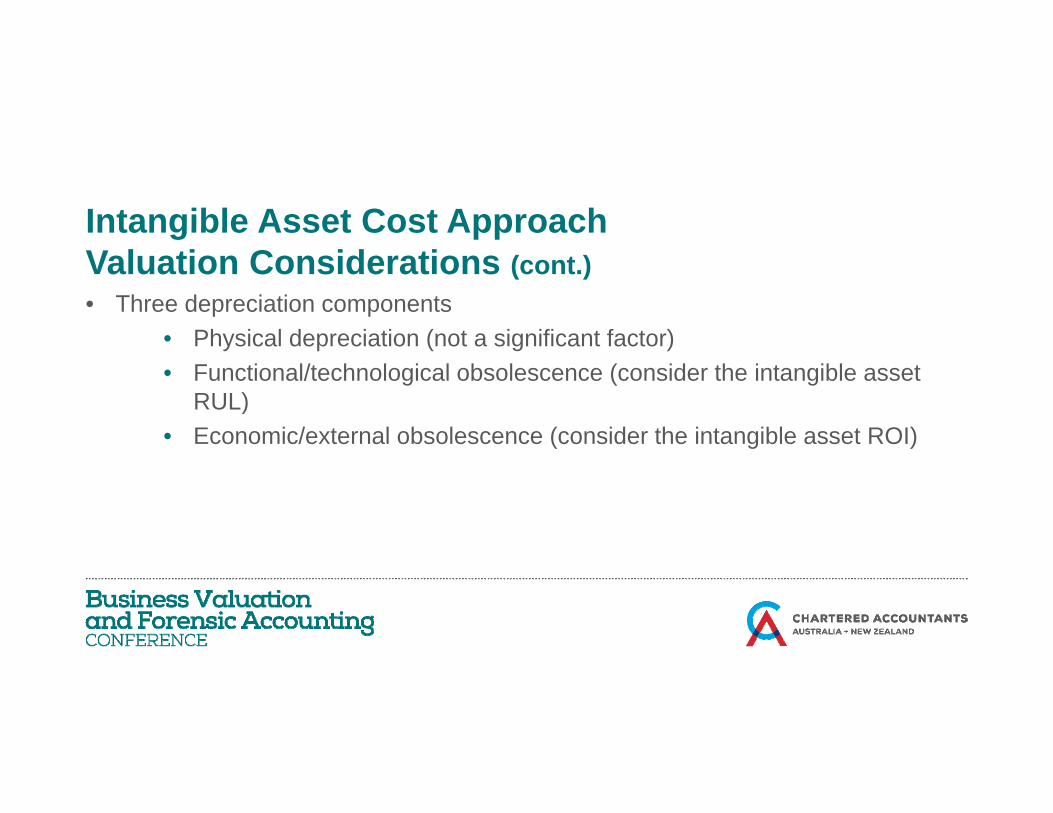
Intangible Asset Cost ApproachIntangible Asset Cost ApproachValuation Considerations (cont.)• Three depreciation components
• Physical depreciation (not a significant factor)• Functional/technological obsolescence (consider the intangible asset
RUL)RUL)• Economic/external obsolescence (consider the intangible asset ROI)
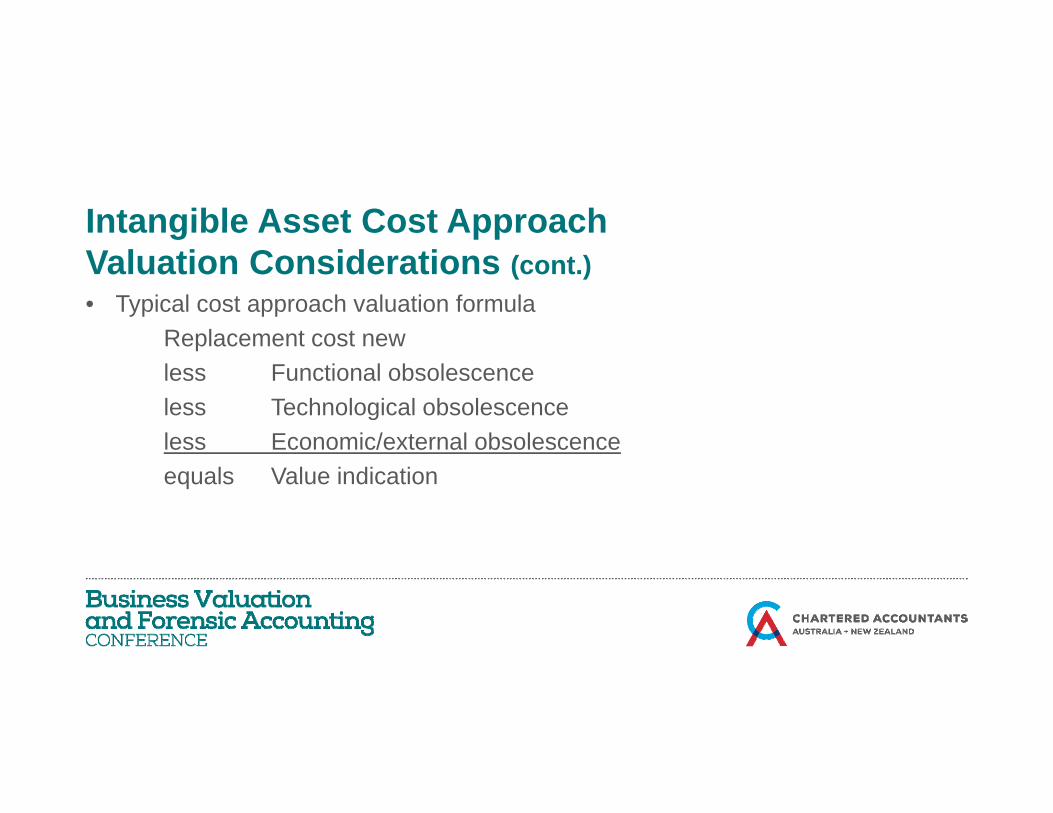
Intangible Asset Cost ApproachIntangible Asset Cost ApproachValuation Considerations (cont.)• Typical cost approach valuation formula
Replacement cost newless Functional obsolescenceless Technological obsolescenceless Technological obsolescenceless Economic/external obsolescenceequals Value indication
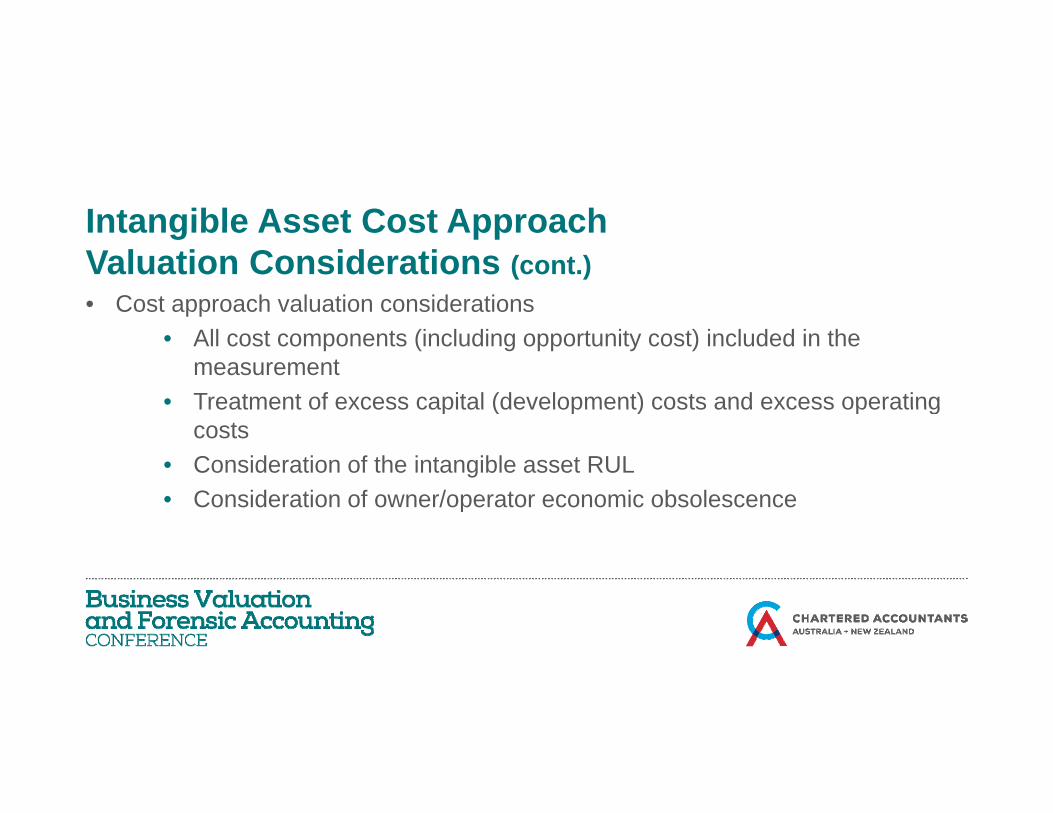
Intangible Asset Cost ApproachIntangible Asset Cost ApproachValuation Considerations (cont.)• Cost approach valuation considerations
• All cost components (including opportunity cost) included in the measurement
• Treatment of excess capital (development) costs and excess operatingTreatment of excess capital (development) costs and excess operating costs
• Consideration of the intangible asset RUL• Consideration of owner/operator economic obsolescence• Consideration of owner/operator economic obsolescence
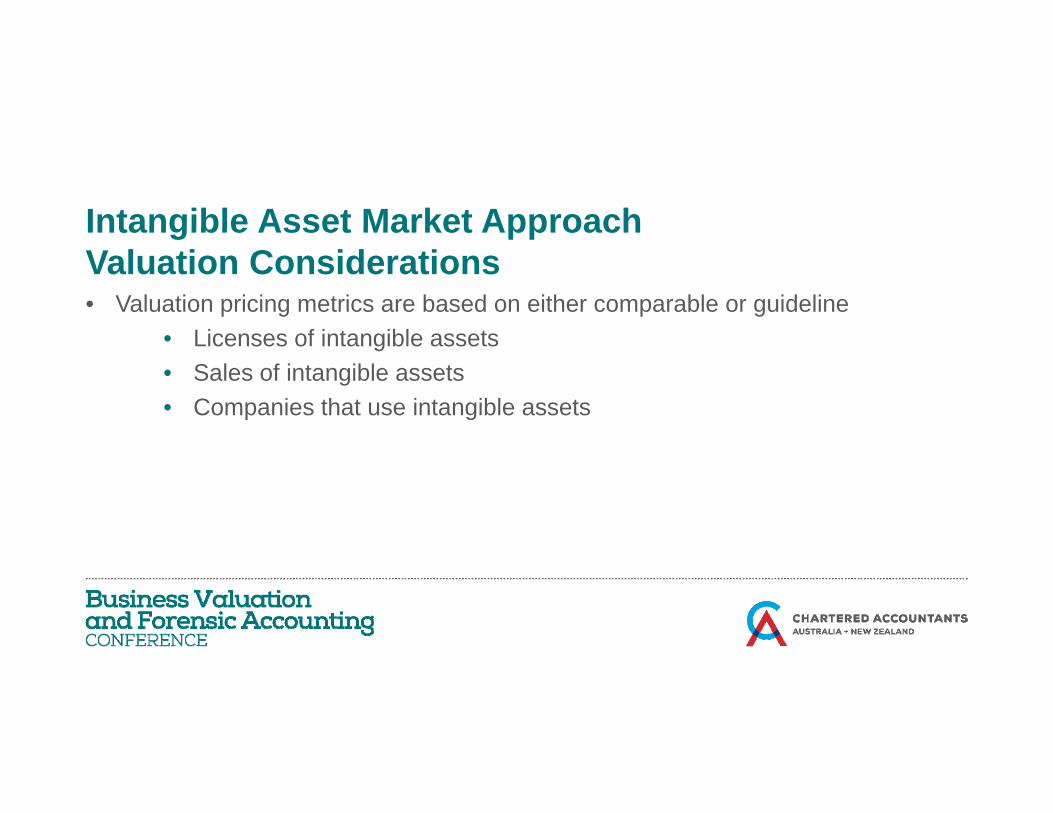
Intangible Asset Market ApproachIntangible Asset Market Approach Valuation Considerations• Valuation pricing metrics are based on either comparable or guideline
• Licenses of intangible assets• Sales of intangible assets• Companies that use intangible assets• Companies that use intangible assets
Intangible Asset Market ApproachIntangible Asset Market Approach Valuation Considerations (cont.)• Valuation variables and procedures
• Quantitative/qualitative analysis of the subject intangible asset• Guideline license/sale/company selection criteria• Guideline license/sale/company selection• Verification of the selected transactional data• Analysis of the selected transactional data• Selection of the appropriate pricing metrics• Selection of the pricing multiples specific to the subject intangible asset• Application of the selected pricing multiples to the subject intangible assets metrics
Intangible Asset Market ApproachIntangible Asset Market Approach Valuation Considerations (cont.)• Market approach valuation considerations
• Seasoned guideline intangible assets/development stage subject intangible asset
• Development stage guideline intangible assets/seasoned subject i iblintangible asset
• State of the competition in the owner/operator industry• Comparable profit margins—is the subject intangible asset the only
f th diff i fit i b t th / treason for the difference in profit margins between the owner/operator company and the selected CPM companies?
Intangible Asset Income ApproachIntangible Asset Income ApproachValuation Considerations• Common intangible asset income concepts include:
• Incremental (or differential) owner/operator revenue• Decremental owner/operator expense• Decremental owner/operator investment• Decremental owner/operator investment• Decremental risk to the owner/operator
Intangible Asset Income ApproachIntangible Asset Income ApproachValuation Considerations (cont.)• Common income measures (related to the subject intangible asset) include:
• EBITDA• EBIT• NOI (EBITDA less income taxes)• NOI (EBITDA less income taxes)• Net income• Net cash flow
Intangible Asset Income ApproachIntangible Asset Income ApproachValuation Considerations (cont.)• Income approach valuation formula
• Yield capitalization methods, based on a nonconstant growth income projection
• over a finite RUL projection periodp j p• over a finite RUL projection period with a terminal value
• Direct capitalization methods, based on a constant growth income projection• over a finite RUL projection periodover a finite RUL projection period• over a perpetuity projection period
Intangible Asset Income ApproachIntangible Asset Income ApproachValuation Considerations (cont.)• Income approach valuation considerations
• Match the selected discount/capitalization rate with the selected income measure• Match the selected discount/capitalization rate with the subject intangible asset risk• Consider the state of the competition in the owner/operator industry• Consider all subsequent (to the valuation date) capx R&D expenses marketingConsider all subsequent (to the valuation date) capx, R&D expenses, marketing
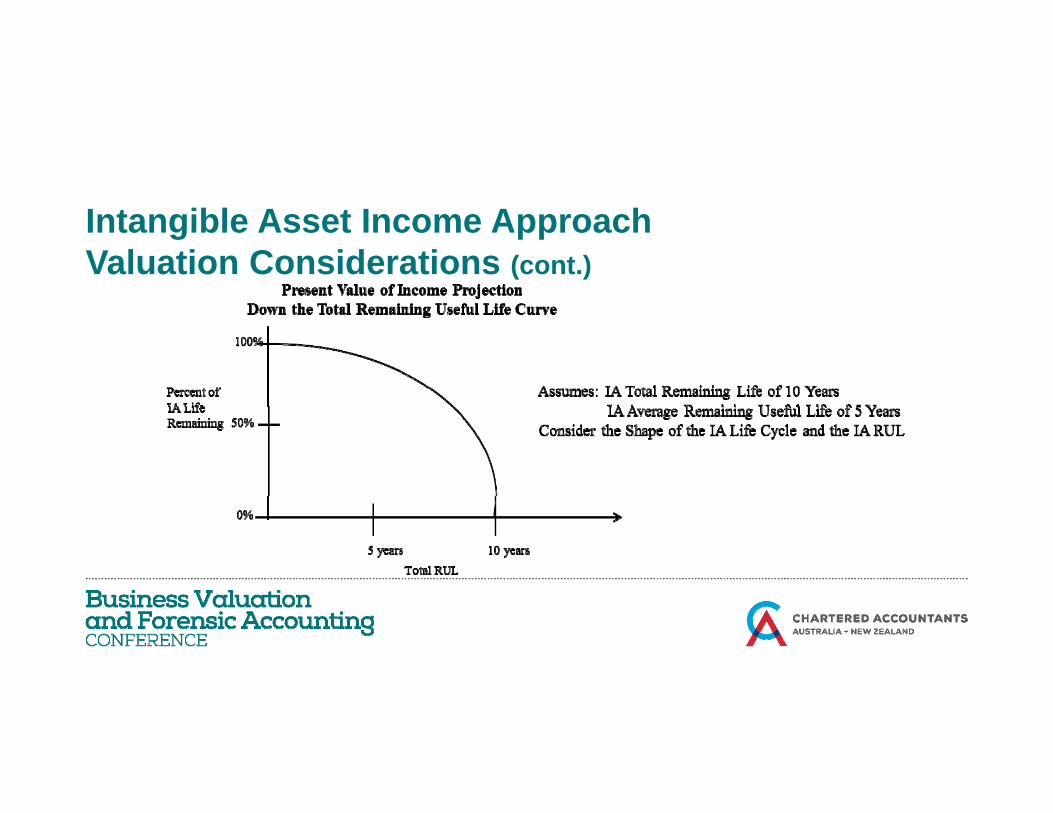
expenditures, etc.• Analyze only the income that is directly related to the subject intangible asset• Present value the projected income over either:
• the intangible asset average RUL• down the intangible asset RUL decay curve
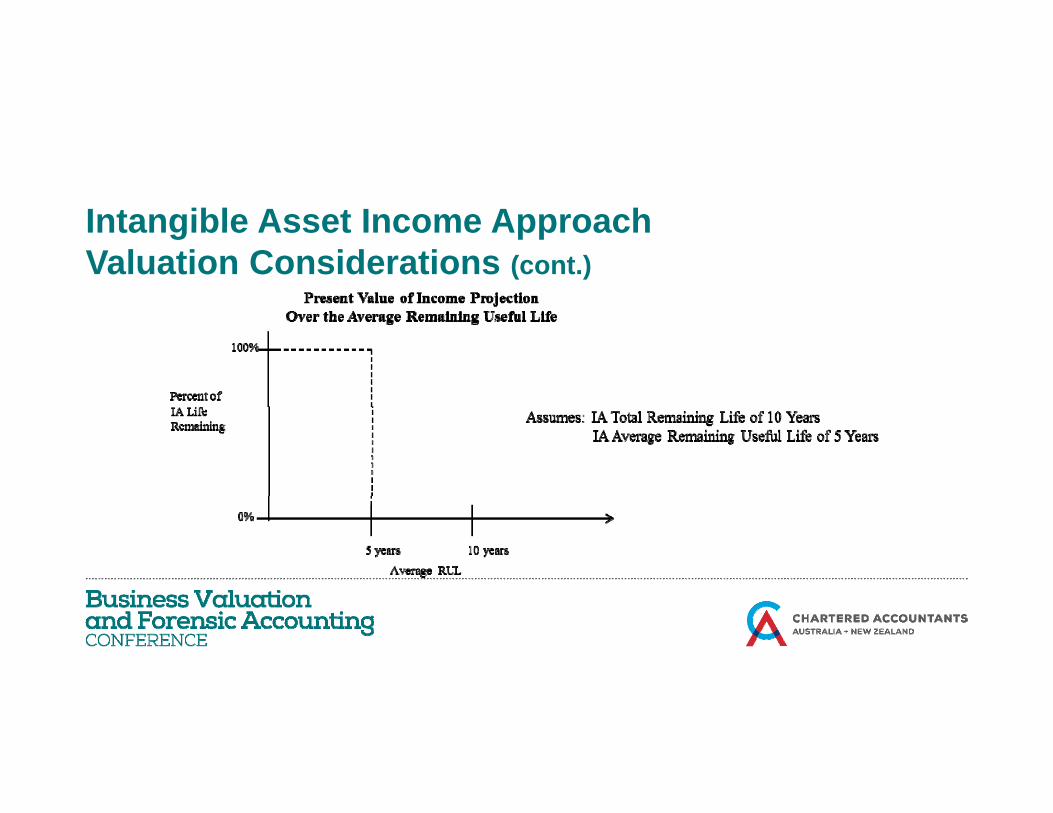
Intangible Asset Income ApproachIntangible Asset Income ApproachValuation Considerations (cont.)
Intangible Asset Income ApproachIntangible Asset Income ApproachValuation Considerations (cont.)
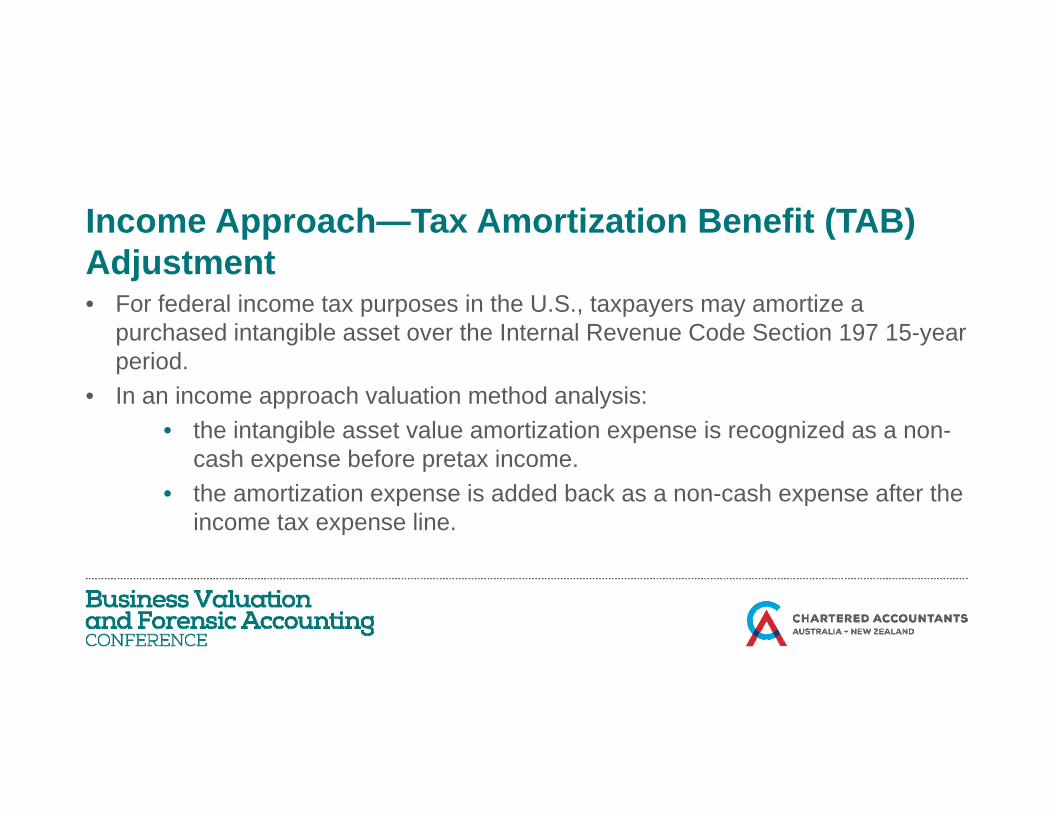
Income Approach—Tax Amortization Benefit (TAB)Income Approach Tax Amortization Benefit (TAB)Adjustment• For federal income tax purposes in the U.S., taxpayers may amortize a
purchased intangible asset over the Internal Revenue Code Section 197 15-year period.
• In an income approach valuation method analysis:pp y• the intangible asset value amortization expense is recognized as a non-
cash expense before pretax income.• the amortization expense is added back as a non-cash expense after thethe amortization expense is added back as a non cash expense after the
income tax expense line.
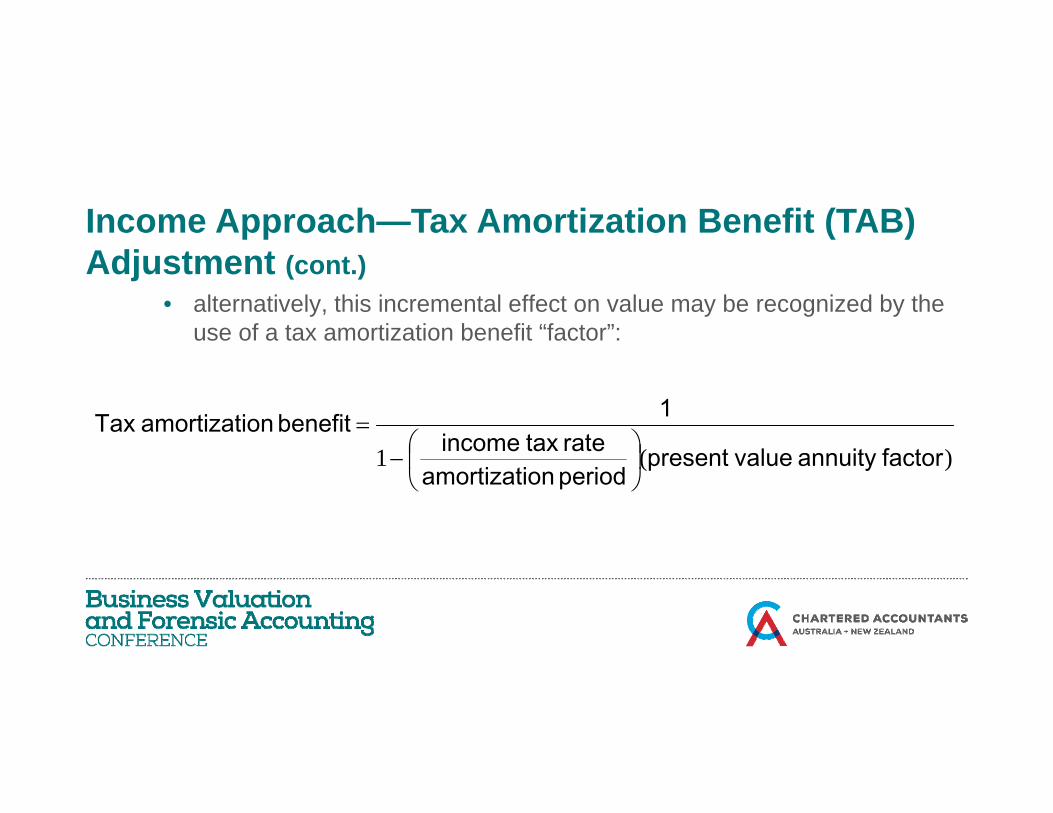
Income Approach—Tax Amortization Benefit (TAB)Income Approach Tax Amortization Benefit (TAB)Adjustment (cont.)
• alternatively, this incremental effect on value may be recognized by the use of a tax amortization benefit “factor”:
1
)(1 factor annuity value presentperiod onamortizatirate tax income
1 benefit onamortizati Tax
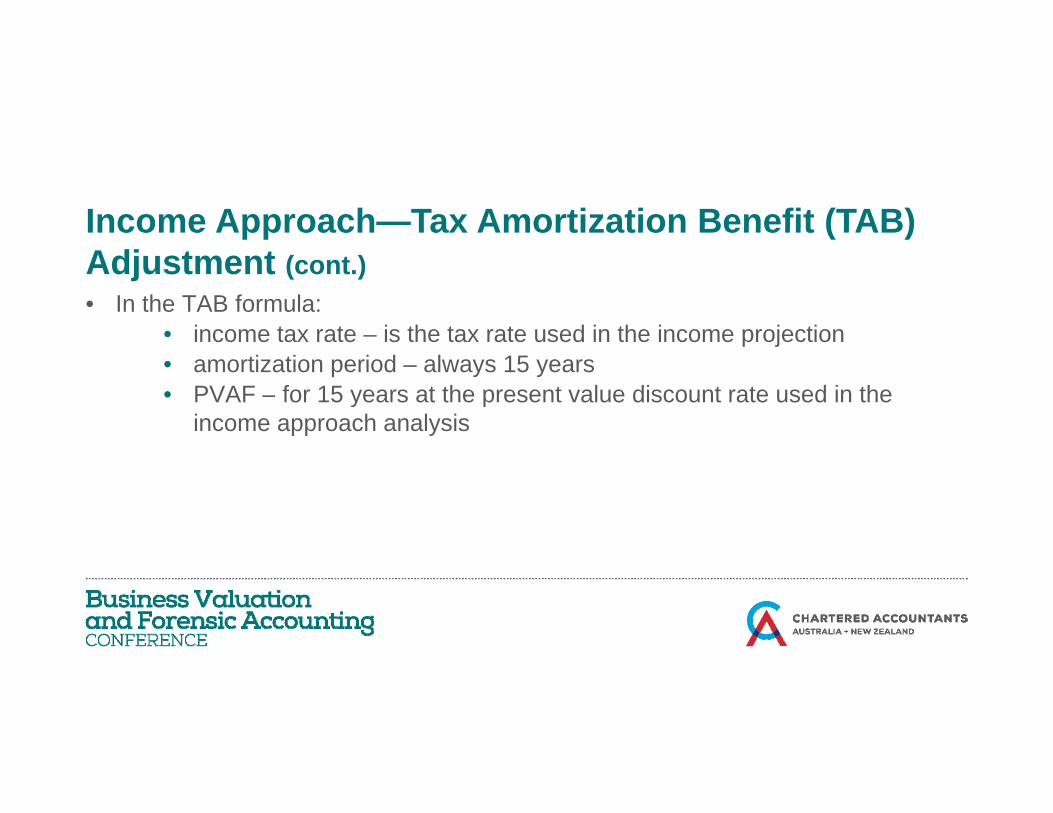
Income Approach—Tax Amortization Benefit (TAB)Income Approach Tax Amortization Benefit (TAB)Adjustment (cont.)• In the TAB formula:
• income tax rate – is the tax rate used in the income projection• amortization period – always 15 years• PVAF – for 15 years at the present value discount rate used in the y p
income approach analysis
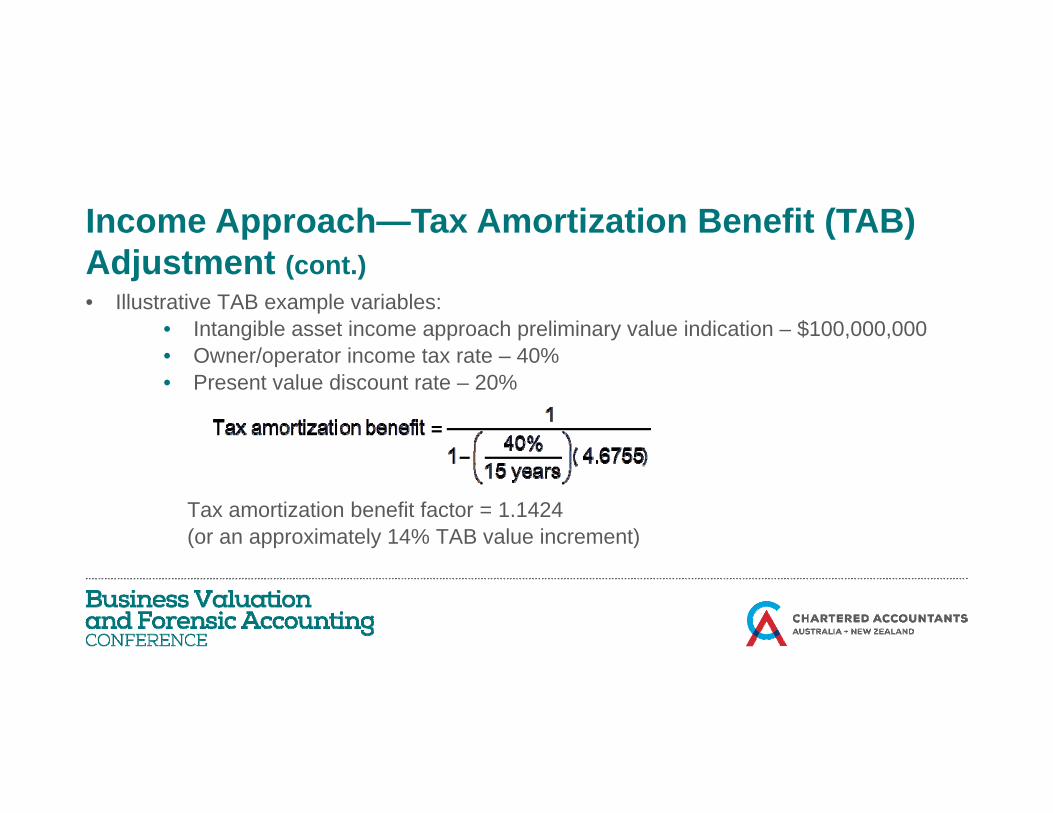
Income Approach—Tax Amortization Benefit (TAB)Income Approach Tax Amortization Benefit (TAB)Adjustment (cont.)• Illustrative TAB example variables:
• Intangible asset income approach preliminary value indication – $100,000,000• Owner/operator income tax rate – 40%• Present value discount rate – 20%
Tax amortization benefit factor = 1.1424(or an approximately 14% TAB value increment)
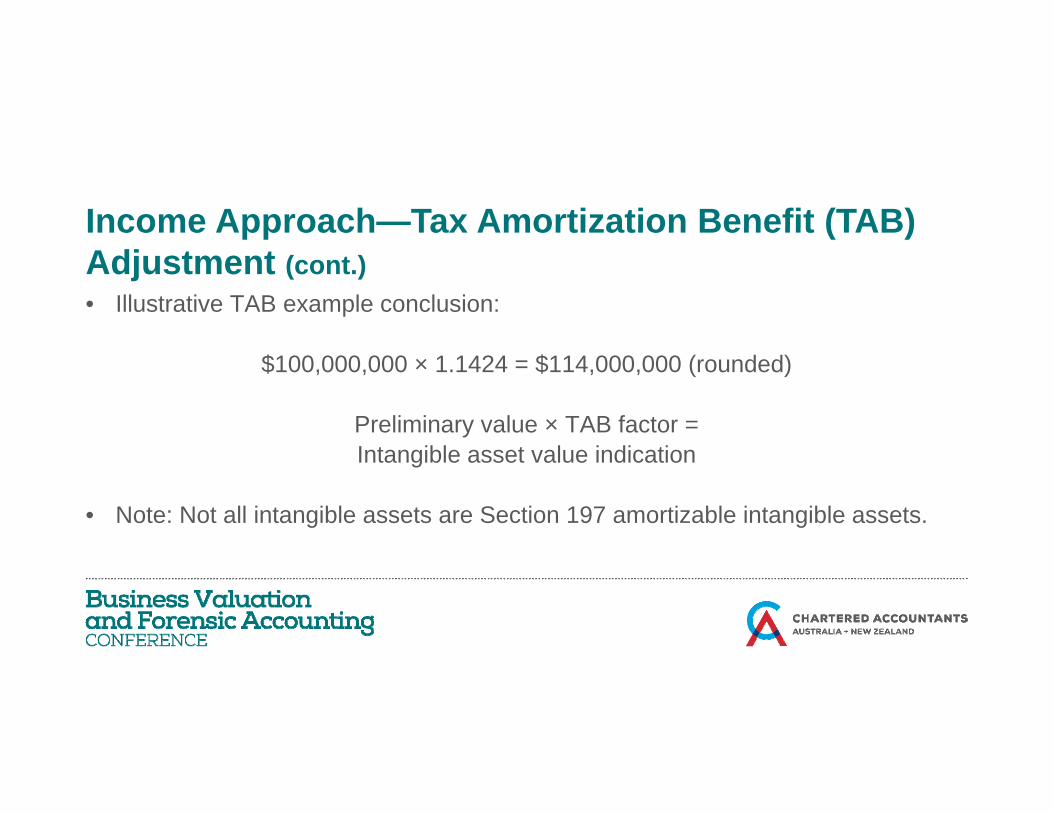
Income Approach—Tax Amortization Benefit (TAB)Income Approach Tax Amortization Benefit (TAB)Adjustment (cont.)• Illustrative TAB example conclusion:
$100,000,000 × 1.1424 = $114,000,000 (rounded)
Preliminary value × TAB factor = Intangible asset value indication
• Note: Not all intangible assets are Section 197 amortizable intangible assets.
Intangible Asset ValuationIntangible Asset ValuationSynthesis and Conclusion Questions• The synthesis and conclusion is the last procedure in the valuation process
• The analyst typically performs a procedure that is referred to as the valuation reconciliation
Intangible Asset ValuationIntangible Asset ValuationSynthesis and Conclusion Questions (cont.)• The analyst typically answers the following questions:
• Did I value the right thing? That is, did I analyze the correct intangible asset?• Did I value the right thing the right way? That is, did I apply the appropriate
valuation approaches, methods, and procedures?• Did I reach the right valuation conclusion? That is, did I correctly apply the
valuation procedures that I performed in order to reach a reasonable and supportable value estimate?Did I d h t I i t d d t d ? Th t i did I f th i t th t I• Did I do what I intended to do? That is, did I perform the assignment that I set out to perform? Did I achieve the purpose and objective of the assignment?
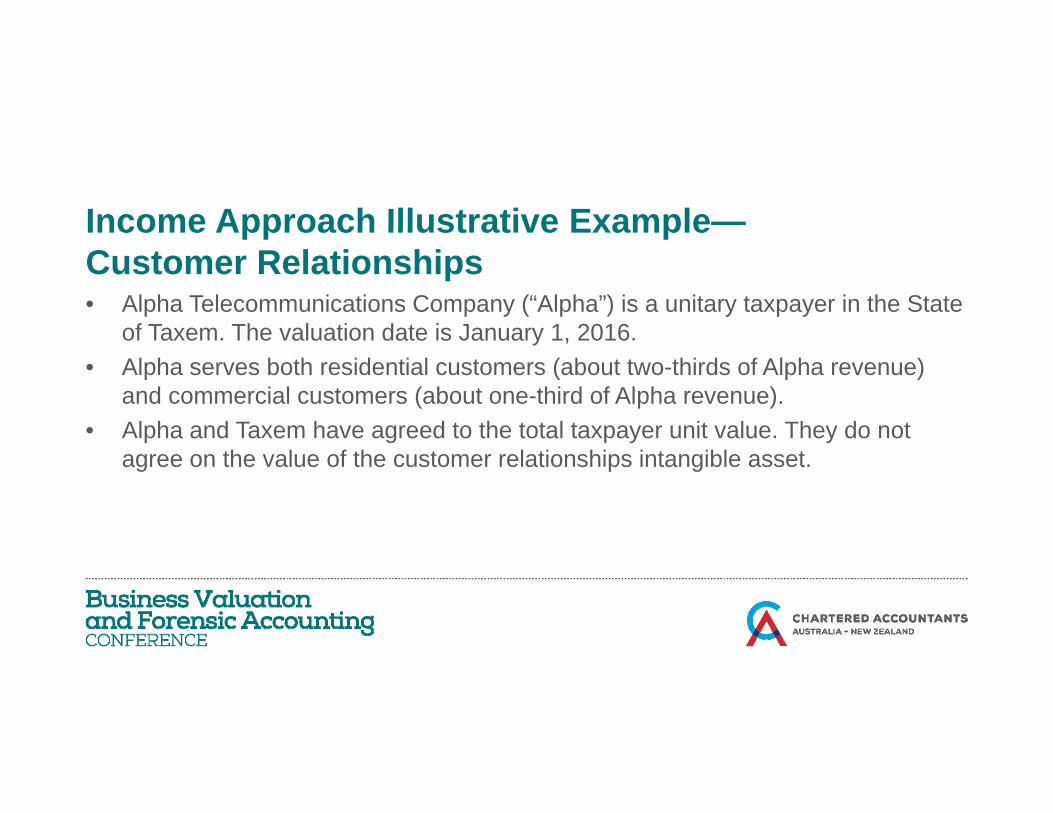
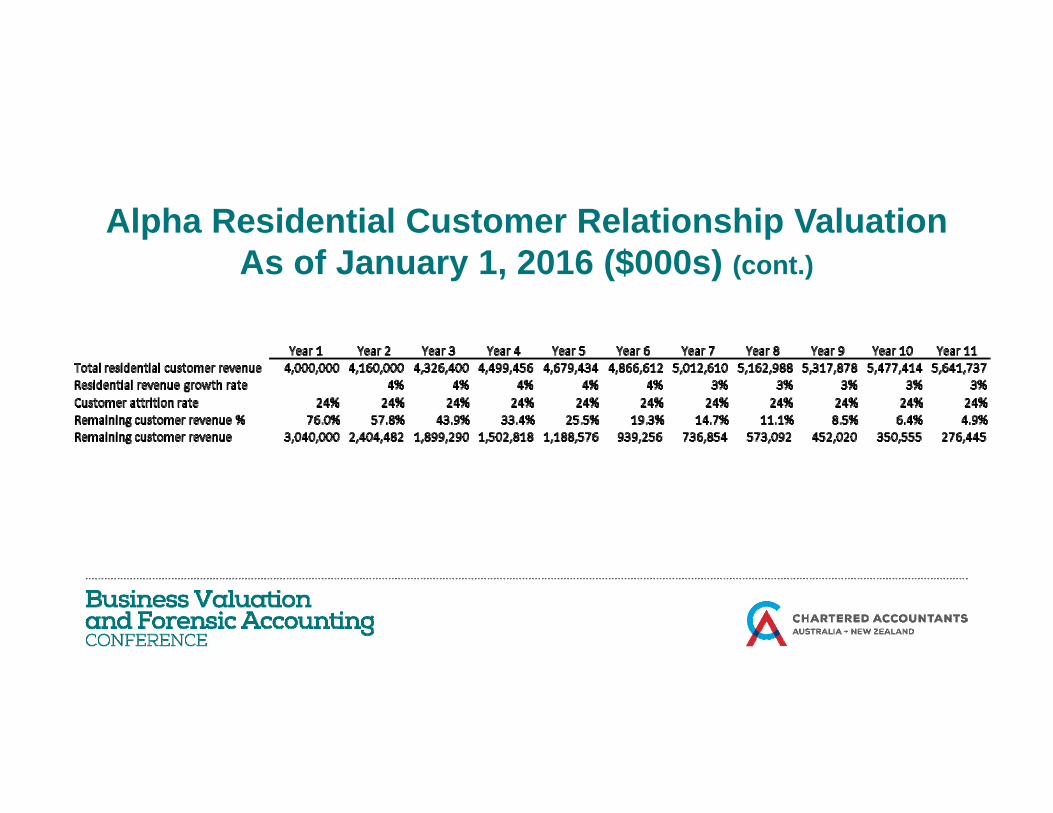
Income Approach Illustrative Example—Income Approach Illustrative ExampleCustomer Relationships• Alpha Telecommunications Company (“Alpha”) is a unitary taxpayer in the State
of Taxem. The valuation date is January 1, 2016.• Alpha serves both residential customers (about two-thirds of Alpha revenue)
and commercial customers (about one-third of Alpha revenue).( p )• Alpha and Taxem have agreed to the total taxpayer unit value. They do not
agree on the value of the customer relationships intangible asset.
Income Approach Illustrative Example—Income Approach Illustrative ExampleCustomer Relationships (cont.)• Alpha retains an analyst to value its exempt intangible asset as of January 1,
2016.• The analyst decides to use the income approach and the multiperiod excess
earnings method (MEEM) to value the customer relationships.g ( ) p• The analyst has already valued the Alpha contributory intangible assets:
computer software, proprietary technology, trademarks and trade names, and assembled workforce.
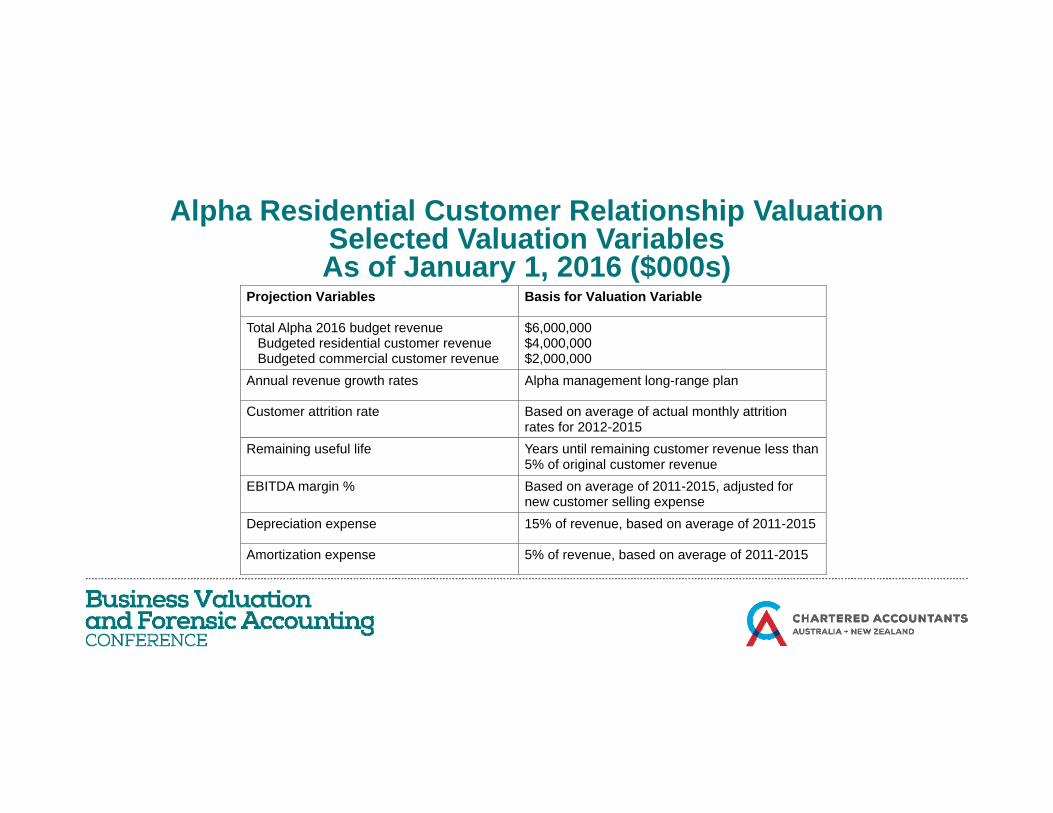
Alpha Residential Customer Relationship ValuationSSelected Valuation VariablesAs of January 1, 2016 ($000s)
Projection Variables Basis for Valuation Variable
Total Alpha 2016 budget revenue Budgeted residential customer revenue Budgeted commercial customer revenue
$6,000,000 $4,000,000 $2,000,000
Annual revenue growth rates Alpha management long-range plan
C t tt iti t B d f t l thl tt iti Customer attrition rate Based on average of actual monthly attrition rates for 2012-2015
Remaining useful life Years until remaining customer revenue less than 5% of original customer revenue
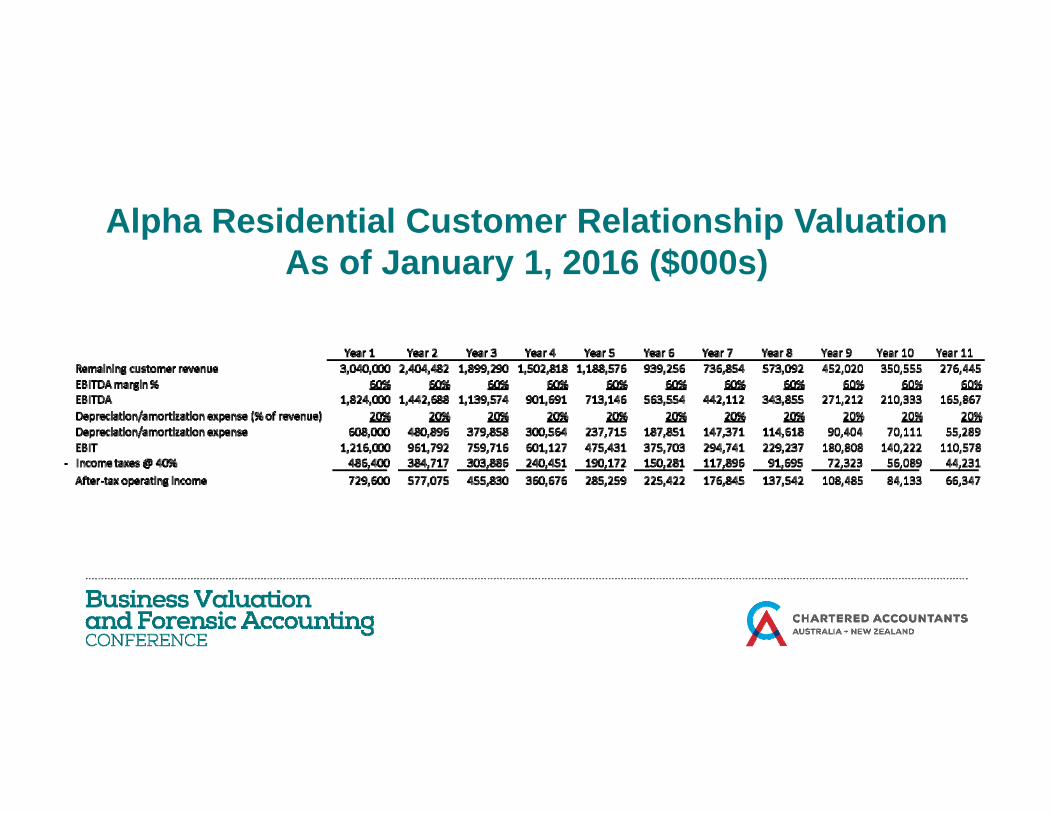
EBITDA margin % Based on average of 2011-2015, adjusted for lli new customer selling expense
Depreciation expense 15% of revenue, based on average of 2011-2015
Amortization expense 5% of revenue, based on average of 2011-2015
Alpha Residential Customer Relationship ValuationSSelected Valuation Variables
As of January 1, 2016 ($000s) (cont.)
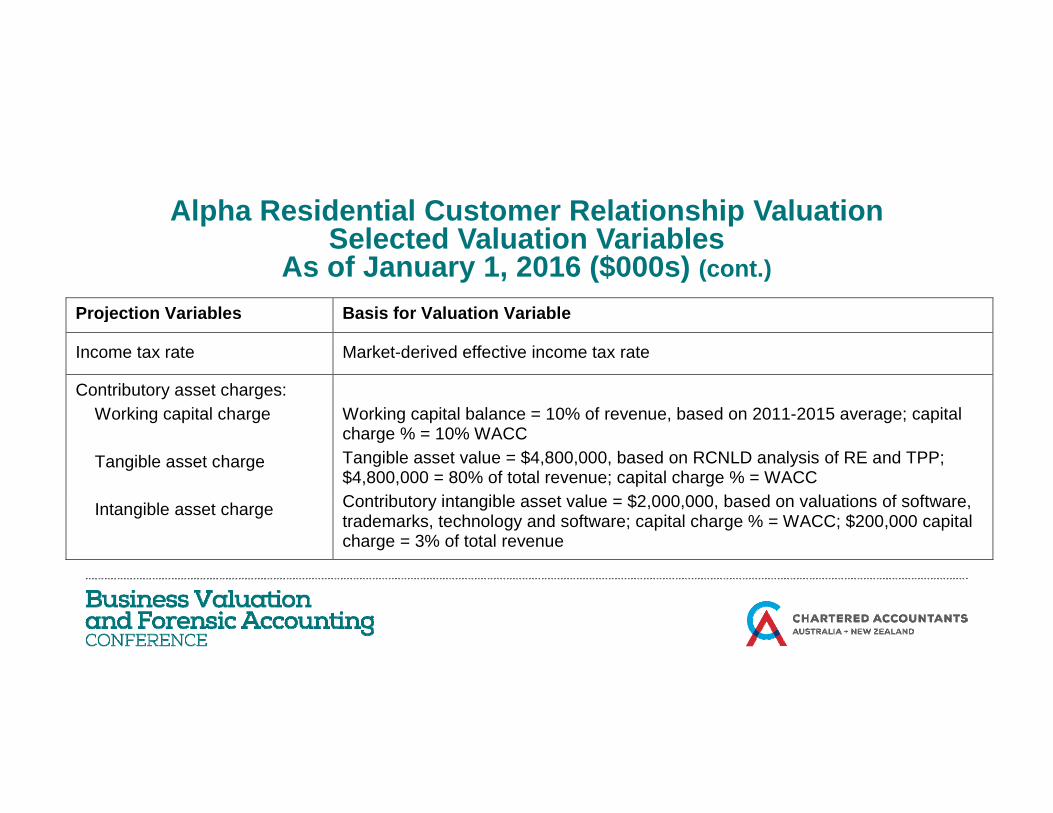
Projection Variables Basis for Valuation VariableProjection Variables Basis for Valuation Variable
Income tax rate Market-derived effective income tax rate
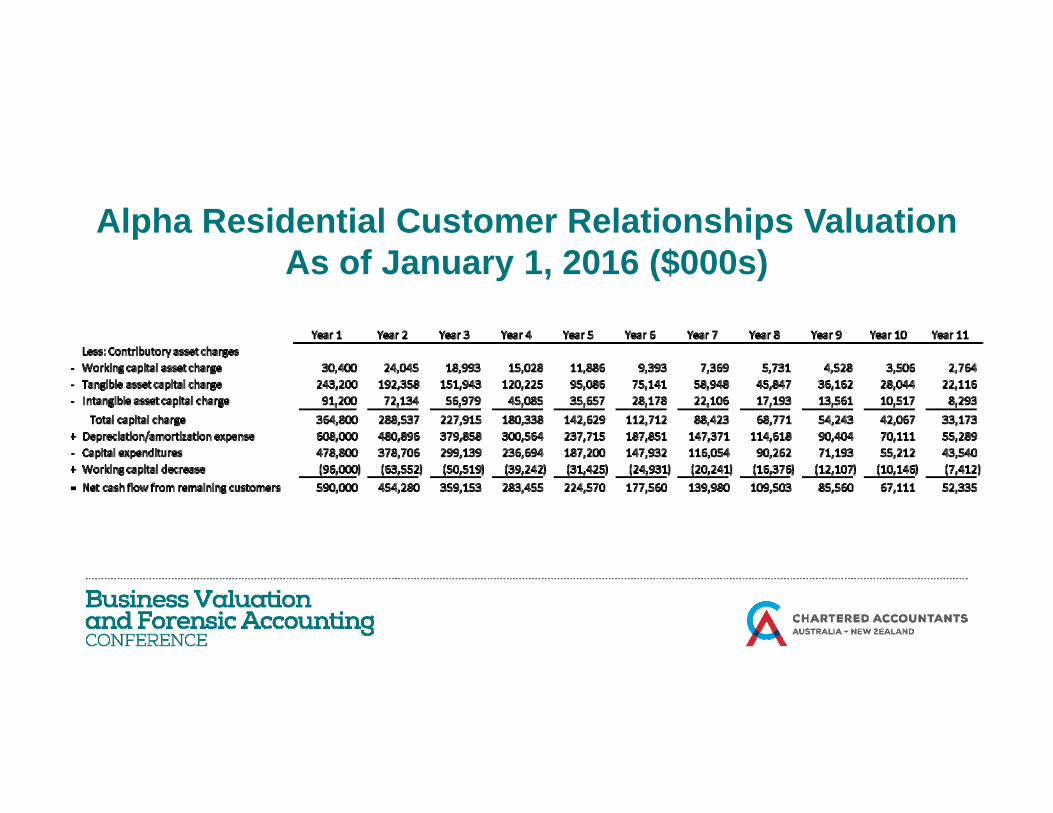
Contributory asset charges: Working capital charge Tangible asset charge
Working capital balance = 10% of revenue, based on 2011-2015 average; capital charge % = 10% WACC Tangible asset value = $4,800,000, based on RCNLD analysis of RE and TPP; $4,800,000 = 80% of total revenue; capital charge % = WACC C t ib t i t ibl t l $2 000 000 b d l ti f ft Intangible asset charge Contributory intangible asset value = $2,000,000, based on valuations of software, trademarks, technology and software; capital charge % = WACC; $200,000 capital charge = 3% of total revenue
Alpha Residential Customer Relationship ValuationSSelected Valuation Variables
As of January 1, 2016 ($000s) (cont.)
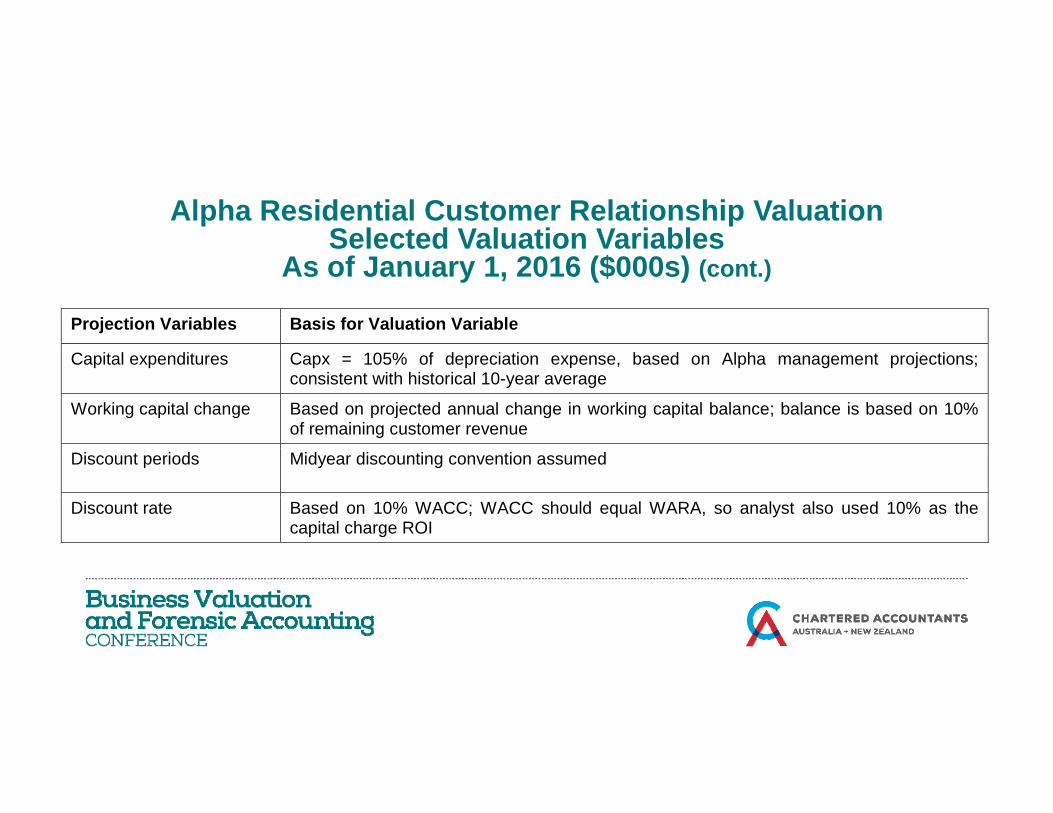
fProjection Variables Basis for Valuation Variable
Capital expenditures Capx = 105% of depreciation expense, based on Alpha management projections; consistent with historical 10-year average
Working capital change Based on projected annual change in working capital balance; balance is based on 10%Working capital change Based on projected annual change in working capital balance; balance is based on 10% of remaining customer revenue
Discount periods Midyear discounting convention assumed
Discount rate Based on 10% WACC; WACC should equal WARA, so analyst also used 10% as the capital charge ROI
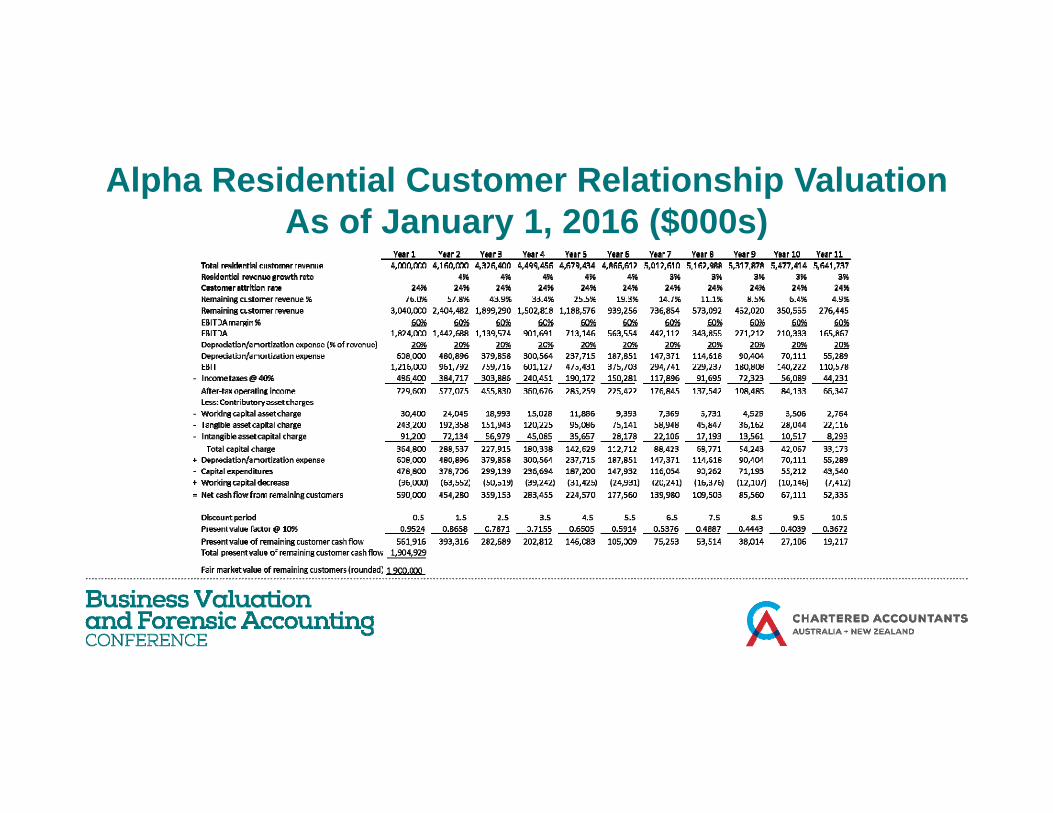
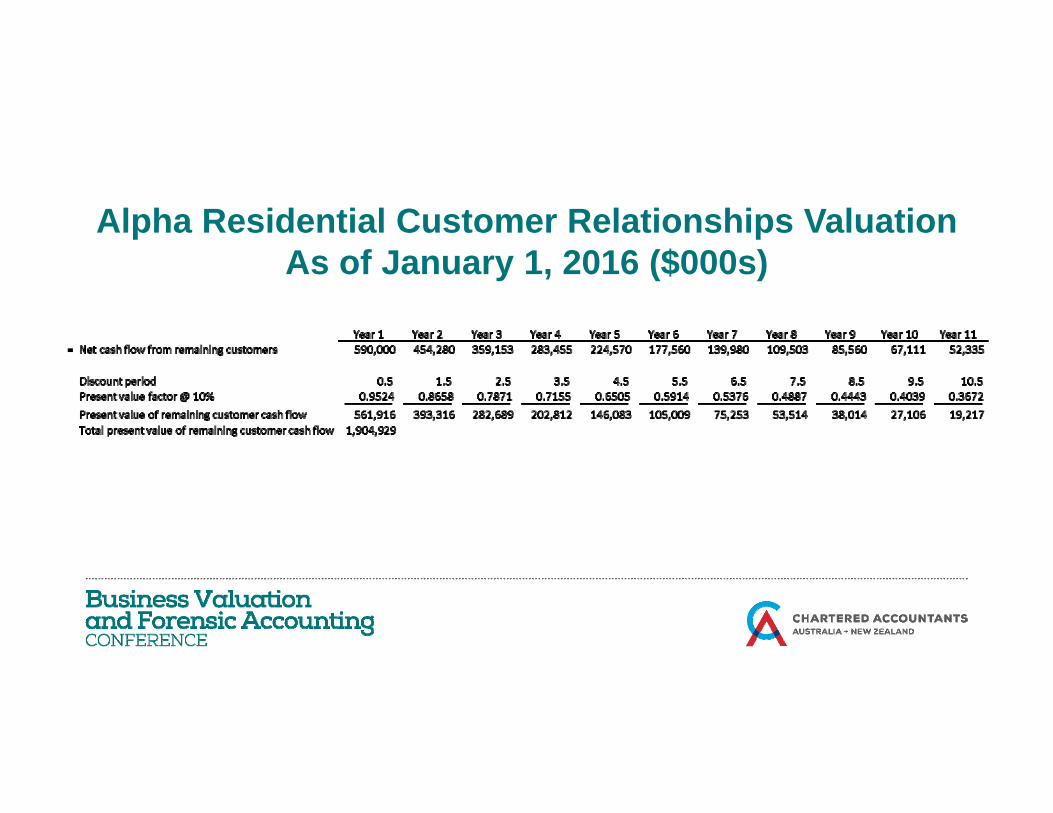
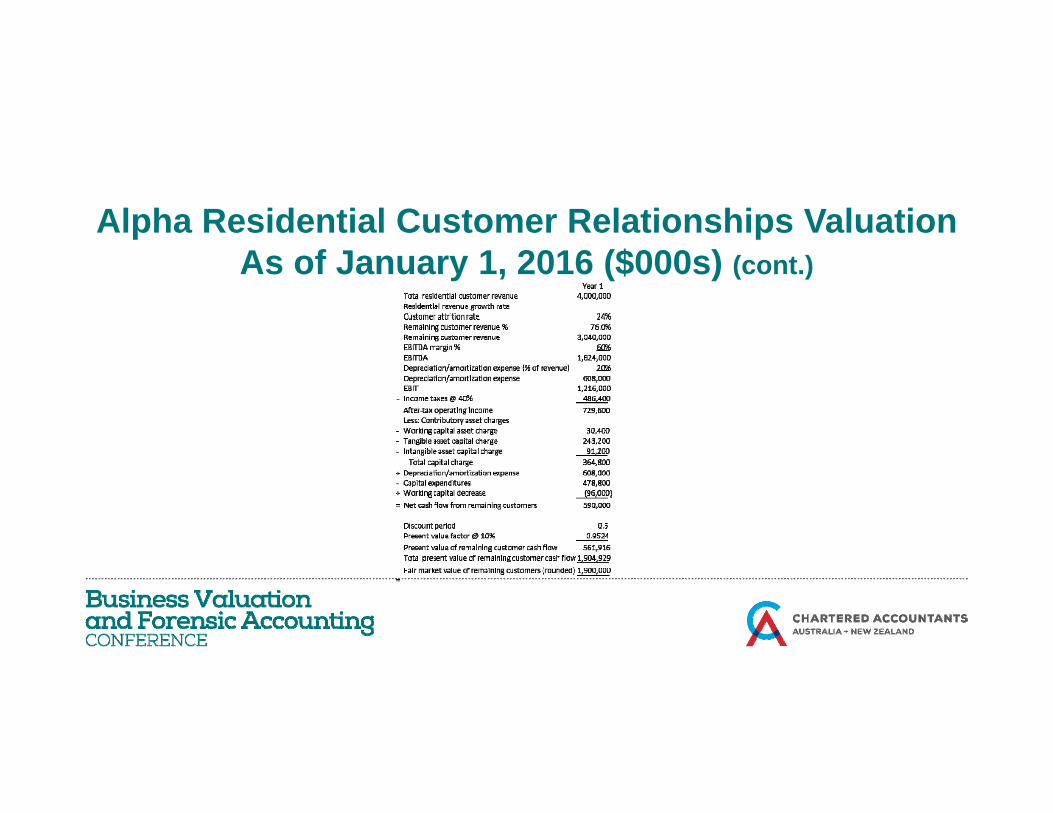
Alpha Residential Customer Relationship ValuationAs of January 1 2016 ($000s)As of January 1, 2016 ($000s)
Alpha Residential Customer Relationship ValuationAlpha Residential Customer Relationship ValuationAs of January 1, 2016 ($000s) (cont.)

Alpha Residential Customer Relationship ValuationAlpha Residential Customer Relationship ValuationResidential Customer Turnover Rates
Month 2012 2013 2014 2015 January 2.46% 2.08% 2.00% 2.10% yFebruary 1.76% 1.93% 2.02% 1.94% March 2.05% 2.04% 2.05% 2.08% April 1.91% 2.01% 2.01% 2.08% May 2.06% 1.98% 2/1-% 1.95% June 1.95% 1.99% 2.09% 2.00% July 1.92% 2.00% 2.00% 1.78% August 2.26% 2.05% 2.03% 2.00% September 1.96% 2.02% 2.09% 2.11% O t b 2 20% 2 10% 2 01% 2 03%October 2.20% 2.10% 2.01% 2.03% November 1.87% 2.00% 1.93% 1.86% December 1.56% 2.01% 1.90% 1.85%
Annual Customer Turnover Rate 24.0% 24.2% 24.2% 23.8%
Alpha Residential Customer Relationship ValuationAlpha Residential Customer Relationship ValuationAs of January 1, 2016 ($000s)
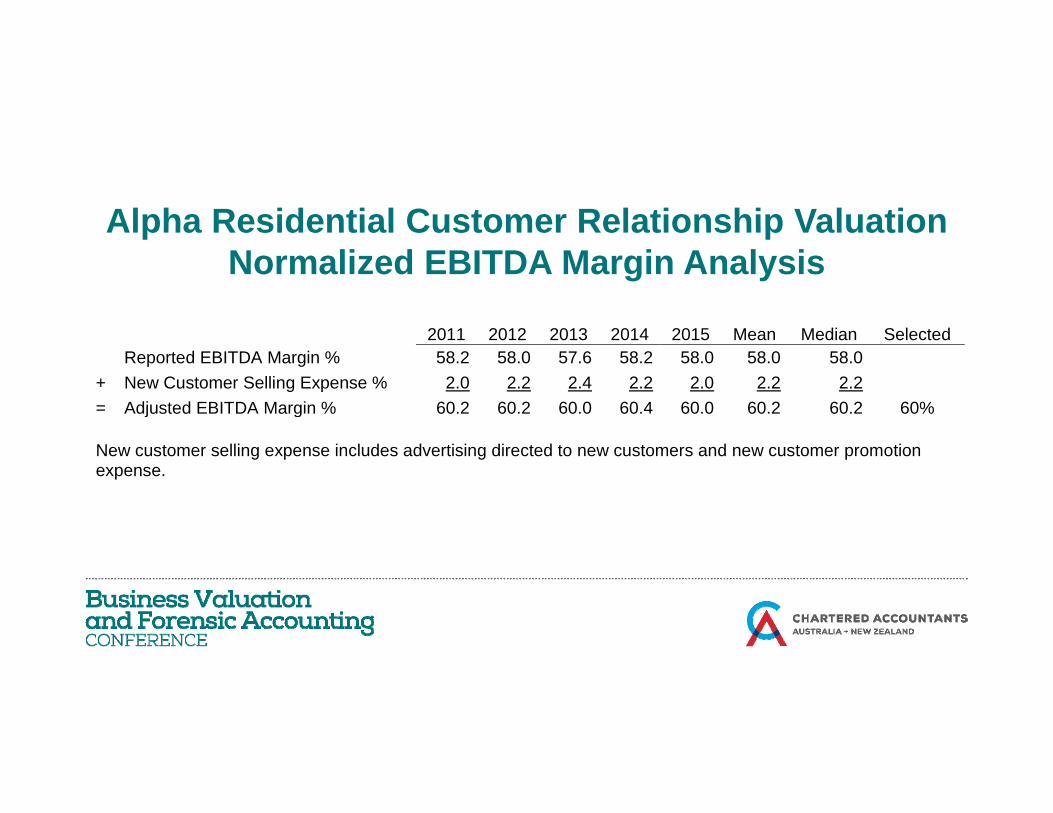
Alpha Residential Customer Relationship ValuationAlpha Residential Customer Relationship ValuationNormalized EBITDA Margin Analysis
2011 2012 2013 2014 2015 Mean Median Selected Reported EBITDA Margin % 58.2 58.0 57.6 58.2 58.0 58.0 58.0 + New Customer Selling Expense % 2.0 2.2 2.4 2.2 2.0 2.2 2.2 = Adjusted EBITDA Margin % 60 2 60 2 60 0 60 4 60 0 60 2 60 2 60%= Adjusted EBITDA Margin % 60.2 60.2 60.0 60.4 60.0 60.2 60.2 60% New customer selling expense includes advertising directed to new customers and new customer promotion expense.
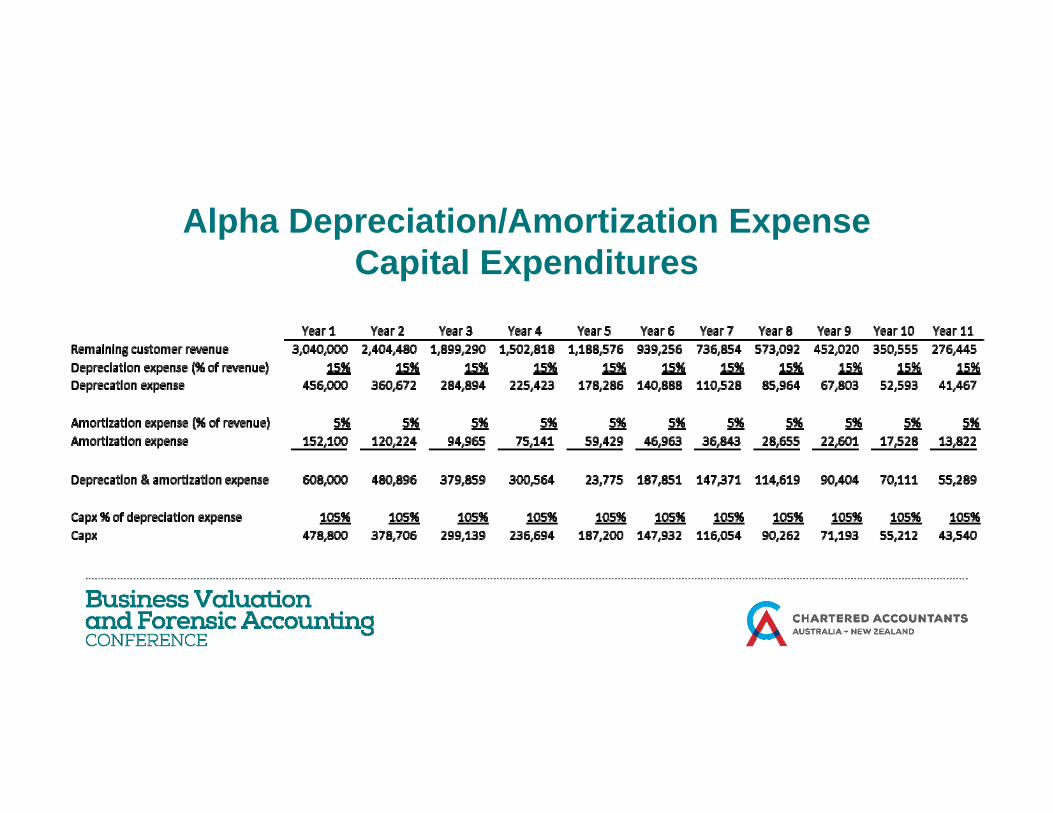
Alpha Depreciation/Amortization ExpenseAlpha Depreciation/Amortization ExpenseCapital Expenditures
Alpha Residential Customer Relationships ValuationAlpha Residential Customer Relationships ValuationAs of January 1, 2016 ($000s)
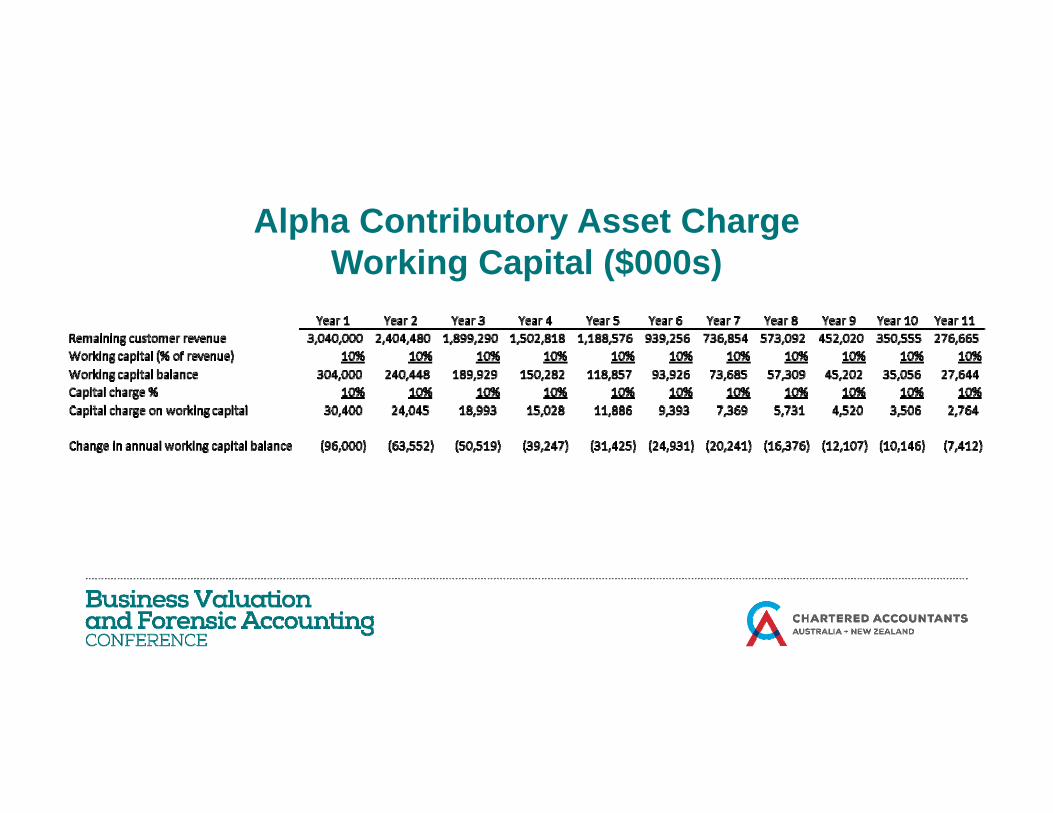
Alpha Contributory Asset ChargeAlpha Contributory Asset ChargeWorking Capital ($000s)

Alpha Contributory Asset ChargeAlpha Contributory Asset ChargeTangible Assets ($000s)
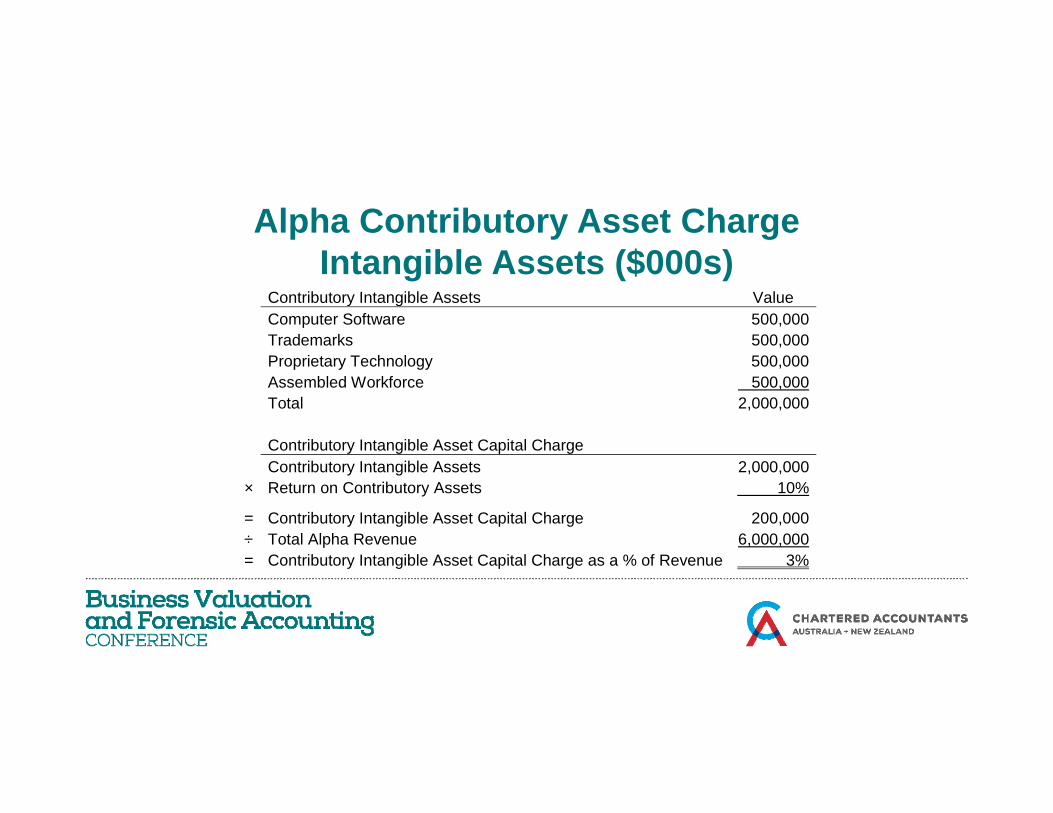
Alpha Contributory Asset ChargeAlpha Contributory Asset ChargeIntangible Assets ($000s)
Contributory Intangible Assets Value Computer Software 500 000 Computer Software 500,000
Trademarks 500,000 Proprietary Technology 500,000 Assembled Workforce 500,000
Total 2,000,000 Total 2,000,000 Contributory Intangible Asset Capital Charge Contributory Intangible Assets 2,000,000 × Return on Contributory Assets 10%
= Contributory Intangible Asset Capital Charge 200,000 ÷ Total Alpha Revenue 6,000,000 = Contributory Intangible Asset Capital Charge as a % of Revenue 3%
Alpha Residential Customer Relationships ValuationAlpha Residential Customer Relationships ValuationAs of January 1, 2016 ($000s)
Alpha Residential Customer Relationships ValuationAlpha Residential Customer Relationships ValuationAs of January 1, 2016 ($000s) (cont.)
Cost Approach Illustrative ExampleCost Approach Illustrative ExampleAssembled Workforce• Beta Electric Company (“Beta”) owns an electric generating plant.• The valuation date is January 1, 2015.• The property operates with 50 employees.• There are 3 principal staff levels; let’s call them executives technicians and• There are 3 principal staff levels; let s call them executives, technicians, and
administrative staff.• Beta and the State of Taxem have agreed to the total taxpayer unit value. They
do not agree on the value of the assembled workforce intangible assetdo not agree on the value of the assembled workforce intangible asset.
Cost Approach Illustrative ExampleCost Approach Illustrative ExampleAssembled Workforce (cont.)• Beta retains an analyst to value its exempt assembled workforce.• The analyst decides to use the cost approach and the replacement cost new
less depreciation (RCNLD) method to value the Beta workforce.
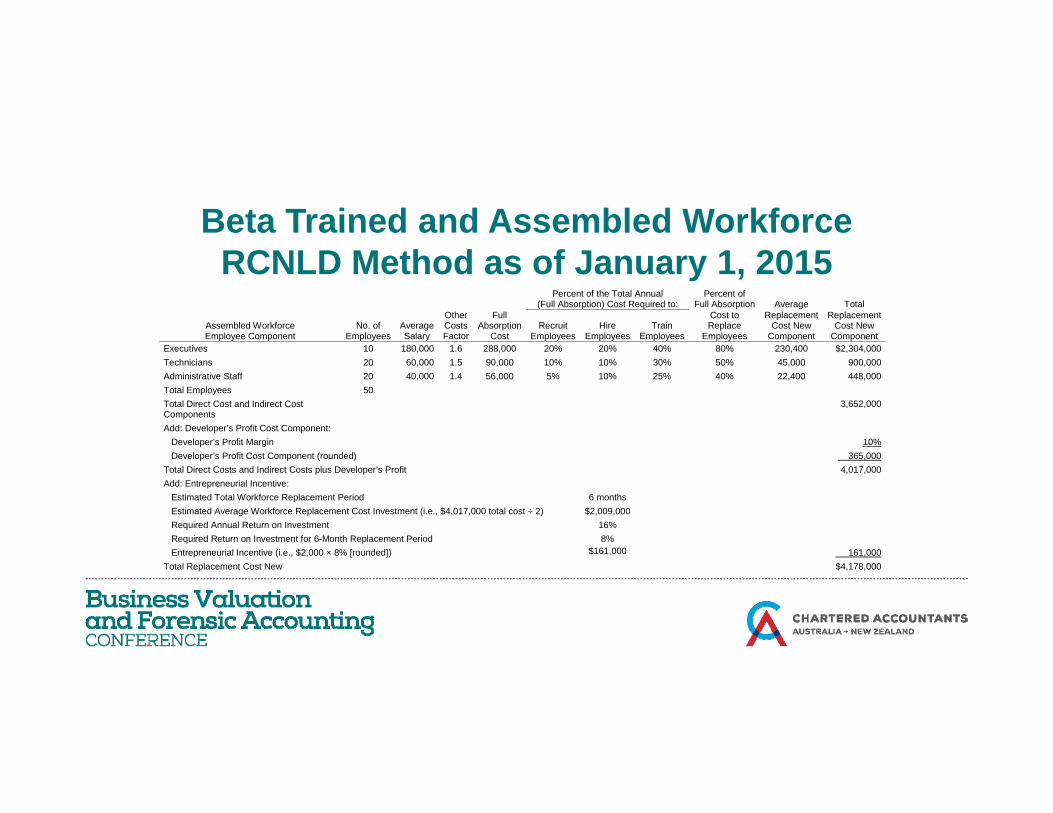
Beta Trained and Assembled WorkforceBeta Trained and Assembled WorkforceRCNLD Method as of January 1, 2015
Percent of the Total Annual (Full Absorption) Cost Required to:
Percent of Full Absorption
Average
Total
Other Full Cost to Replacement Replacement Assembled Workforce Employee Component
No. of
Employees
Average Salary
Other Costs Factor
Full Absorption
Cost
Recruit
Employees
Hire
Employees
Train
Employees
Cost to Replace
Employees
Replacement Cost New
Component
Replacement Cost New
Component Executives 10 180,000 1.6 288,000 20% 20% 40% 80% 230,400 $2,304,000 Technicians 20 60,000 1.5 90,000 10% 10% 30% 50% 45,000 900,000 Administrative Staff 20 40,000 1.4 56,000 5% 10% 25% 40% 22,400 448,000 Total Employees 50 Total Direct Cost and Indirect Cost 3,652,000 Total Direct Cost and Indirect Cost Components
3,65 ,000
Add: Developer’s Profit Cost Component: Developer’s Profit Margin 10% Developer’s Profit Cost Component (rounded) 365,000 Total Direct Costs and Indirect Costs plus Developer’s Profit 4,017,000 Add: Entrepreneurial Incentive:
Estimated Total Workforce Replacement Period 6 months Estimated Total Workforce Replacement Period 6 months Estimated Average Workforce Replacement Cost Investment (i.e., $4,017,000 total cost ÷ 2) $2,009,000 Required Annual Return on Investment 16% Required Return on Investment for 6-Month Replacement Period 8% Entrepreneurial Incentive (i.e., $2,000 × 8% [rounded]) $161,000 161,000 Total Replacement Cost New $4,178,000
Replacement Cost New –Replacement Cost New Direct Costs and Indirect Costs• The RCN estimate considers the total compensation paid to each employee,
labelled as “average salary.” These costs are direct costs.• The RCN estimate considers all of the other expenses that the entity incurs
related to each employee. These costs are indirect costs, including:p y , g1. payroll taxes 4. annual license and credential fees2. employee benefits 5. uniforms and lab coats3 continuing professional education 6 employee parties gifts etc3. continuing professional education 6. employee parties, gifts, etc.
Replacement Cost New –Replacement Cost New Direct Costs and Indirect Costs (cont.)• The total annual cost that the entity pays for an employee is called the full
absorption cost. This full absorption cost includes:1. the compensation paid by the employer to the employee and2 the expenses paid by the employer to others so that the employee can2. the expenses paid by the employer to others so that the employee can
perform his or her job.
Replacement Cost New –Replacement Cost New Direct Costs and Indirect Costs (cont.)• The RCN includes all of the costs that the employer would incur to replace the
current workforce with a brand new (but comparable) workforce. These costs may include:
1. advertising for recruiting potential new employees to apply for each position2. interviewing expenses, background checks and other pre-employment tests,
and placement fees incurred to have the new employee show up on day one3. on-the-job training in the particular position including first month training, first
year training, and accumulated continuing education for long-term employee
Replacement Cost New –Replacement Cost New Direct Costs and Indirect Costs (cont.)• There are two additional cost components to consider:
1. Developer’s profit2. Entrepreneurial incentive
Replacement Cost New –Replacement Cost New Developer’s Profit and Entrepreneurial Incentive• The developer’s profit considers the profit margin that a management consulting,
human resources outsourcing, or professional staffing firm would earn if a willing buyer retained such a firm to create the assembled workforce.
• Likewise, the operating business owners would expect to earn a profit on the sale of their internally developed assets to the willing buyer.
• There are several alternative procedures for estimating entrepreneurial incentive.
Replacement Cost New –Replacement Cost New Developer’s Profit and Entrepreneurial Incentive (cont.)• A common procedure is to estimate the lost profits opportunity cost that the entity
would experience during the intangible asset replacement period.• When using this procedure, the analyst should appropriately allocate the entity’s
overall profit to all of the intangible assets.• Let’s assume that the subject operating business has five intangible assets. The
entrepreneurial incentive should be allocated among the five intangible assets.

Replacement Cost New –Replacement Cost New Developer’s Profit and Entrepreneurial Incentive (cont.)• Another common entrepreneurial profit measurement procedure is to calculate a fair
rate of return on the total intangible asset cost components (i.e., direct costs, indirect costs, and developer’s profit).
• The assembled workforce RCN is the sum of all four cost components.
Illustrative Depreciation ConsiderationsIllustrative Depreciation Considerations
• In order to reach a value conclusion, the analyst estimates the workforce RCNLD. As in any cost approach analysis, the analyst considers if there is any deterioration or obsolescence related to this intangible asset.
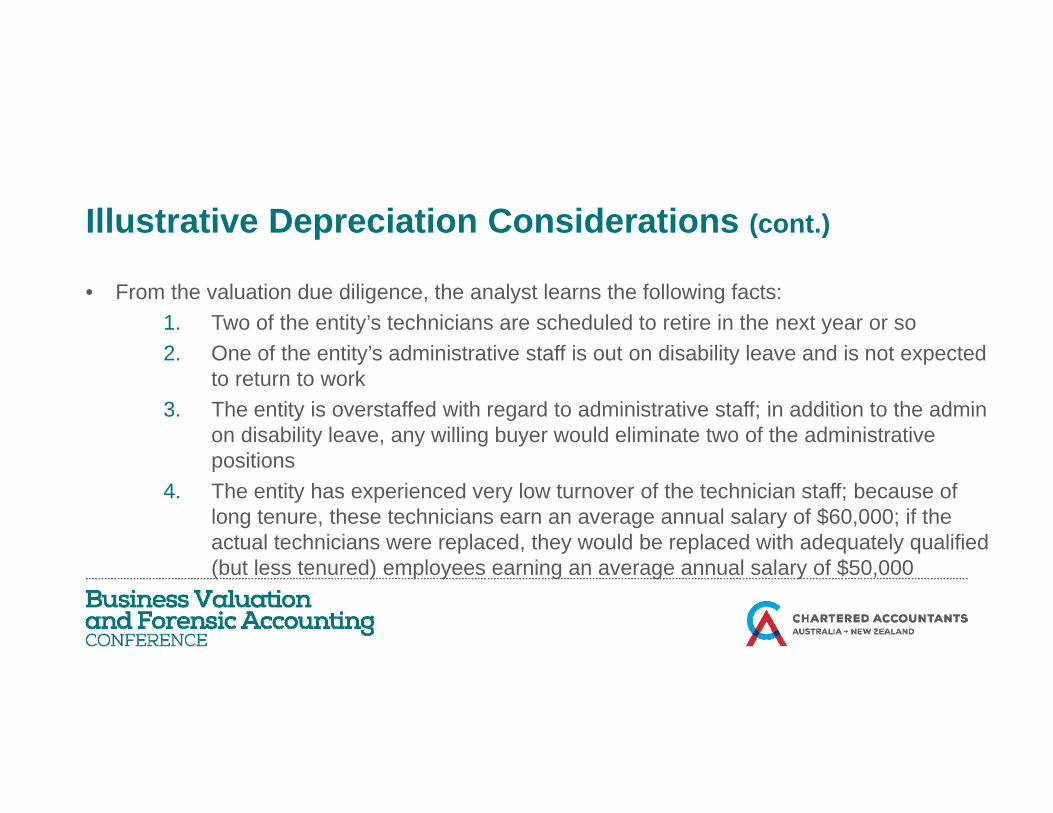
Illustrative Depreciation Considerations (cont )Illustrative Depreciation Considerations (cont.)
• From the valuation due diligence, the analyst learns the following facts:1 T f th tit ’ t h i i h d l d t ti i th t1. Two of the entity’s technicians are scheduled to retire in the next year or so2. One of the entity’s administrative staff is out on disability leave and is not expected
to return to work3 The entity is overstaffed with regard to administrative staff; in addition to the admin3. The entity is overstaffed with regard to administrative staff; in addition to the admin
on disability leave, any willing buyer would eliminate two of the administrative positions
4. The entity has experienced very low turnover of the technician staff; because of4. The entity has experienced very low turnover of the technician staff; because of long tenure, these technicians earn an average annual salary of $60,000; if the actual technicians were replaced, they would be replaced with adequately qualified (but less tenured) employees earning an average annual salary of $50,000
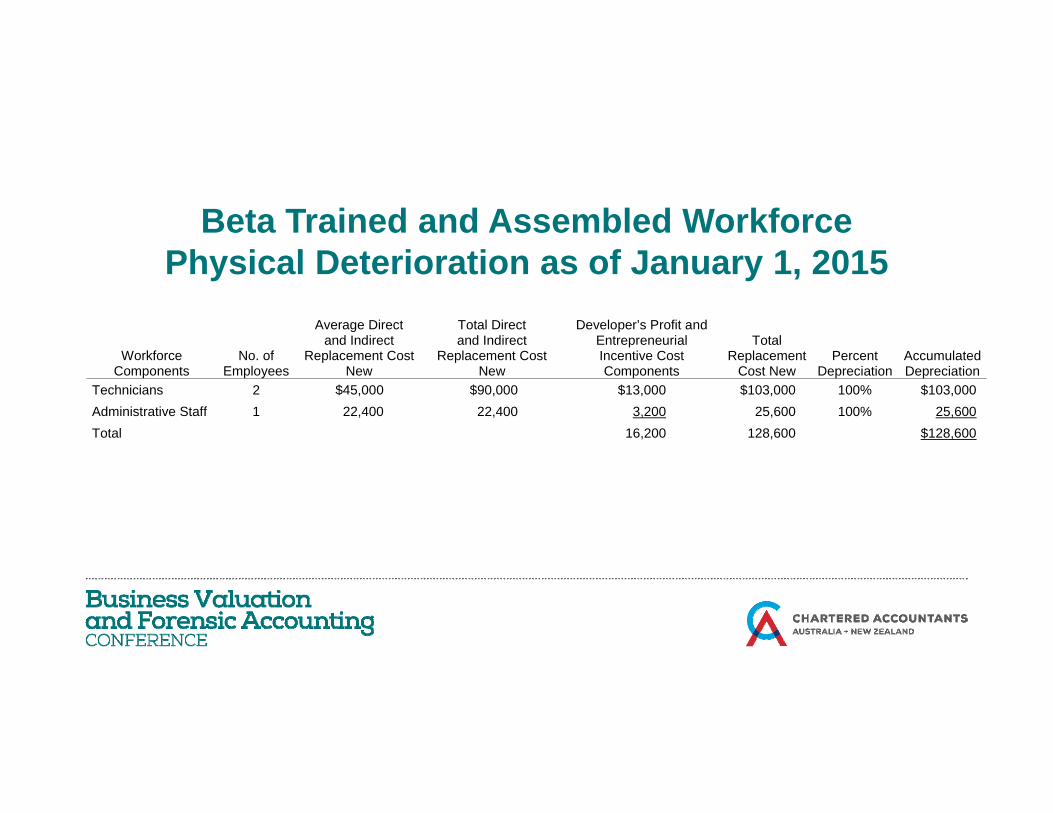
Beta Trained and Assembled WorkforceBeta Trained and Assembled WorkforcePhysical Deterioration as of January 1, 2015
Workforce Components
No. of Employees
Average Direct and Indirect
Replacement Cost New
Total Direct and Indirect
Replacement Cost New
Developer’s Profit and Entrepreneurial Incentive Cost Components
Total
Replacement Cost New
Percent Depreciation
Accumulated Depreciation
Technicians 2 $45,000 $90,000 $13,000 $103,000 100% $103,000 Ad i i t ti St ff 1 22 400 22 400 3 200 25 600 100% 25 600Administrative Staff 1 22,400 22,400 3,200 25,600 100% 25,600 Total 16,200 128,600 $128,600
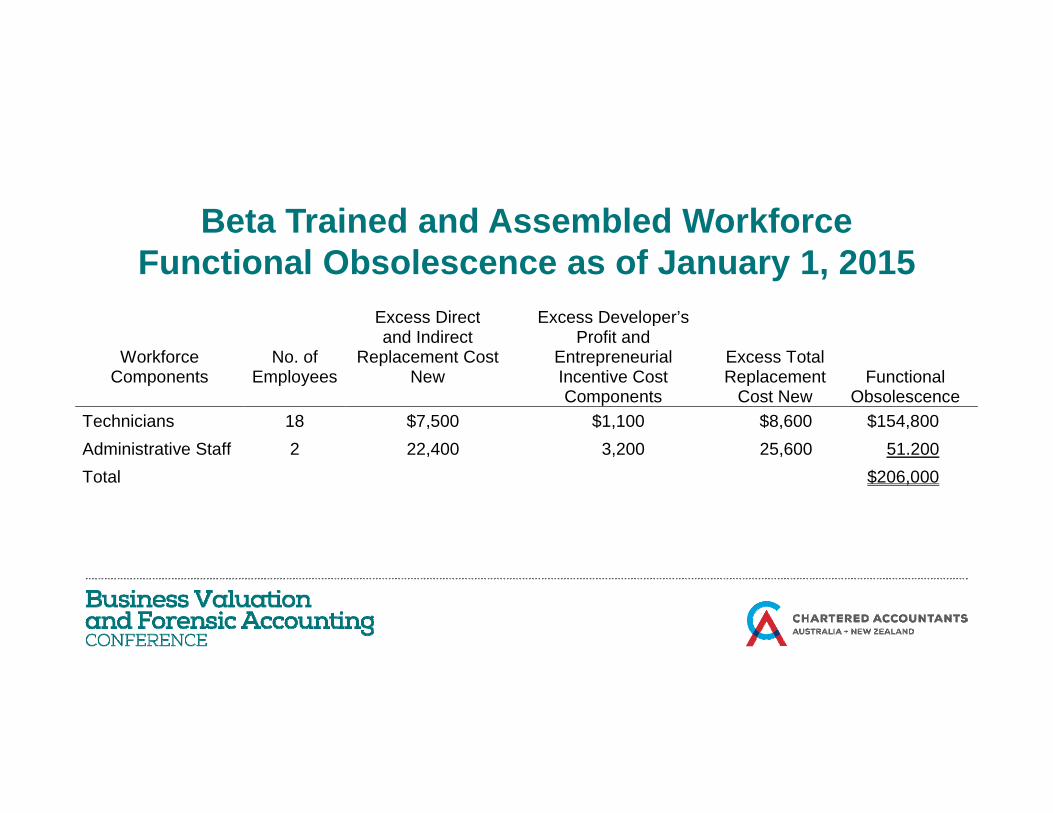
Beta Trained and Assembled WorkforceBeta Trained and Assembled WorkforceFunctional Obsolescence as of January 1, 2015
Excess Direct Excess Developer’s
Workforce Components
No. of Employees
Excess Direct and Indirect
Replacement Cost New
Excess Developer s Profit and
Entrepreneurial Incentive Cost Components
Excess Total Replacement
Cost New
Functional Obsolescence
Technicians 18 $7,500 $1,100 $8,600 $154,800 Administrative Staff 2 22,400 3,200 25,600 51.200 Total $206,000
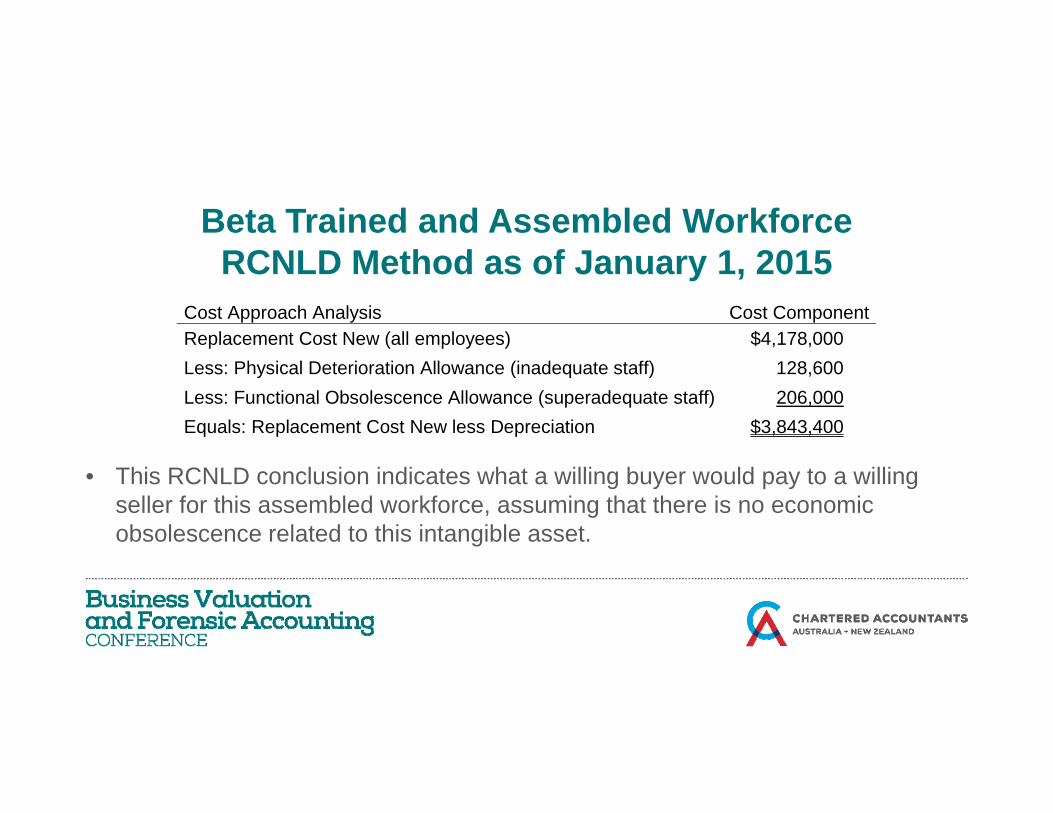
Beta Trained and Assembled WorkforceBeta Trained and Assembled WorkforceRCNLD Method as of January 1, 2015
Cost Approach Analysis Cost ComponentCost Approach Analysis Cost Component Replacement Cost New (all employees) $4,178,000 Less: Physical Deterioration Allowance (inadequate staff) 128,600 Less: Functional Obsolescence Allowance (superadequate staff) 206,000
• This RCNLD conclusion indicates what a willing buyer would pay to a willing ll f thi bl d kf i th t th i i
( p q )Equals: Replacement Cost New less Depreciation $3,843,400
seller for this assembled workforce, assuming that there is no economic obsolescence related to this intangible asset.
Beta Trained and Assembled WorkforceBeta Trained and Assembled WorkforceEconomic Obsolescence as of January 1, 2015
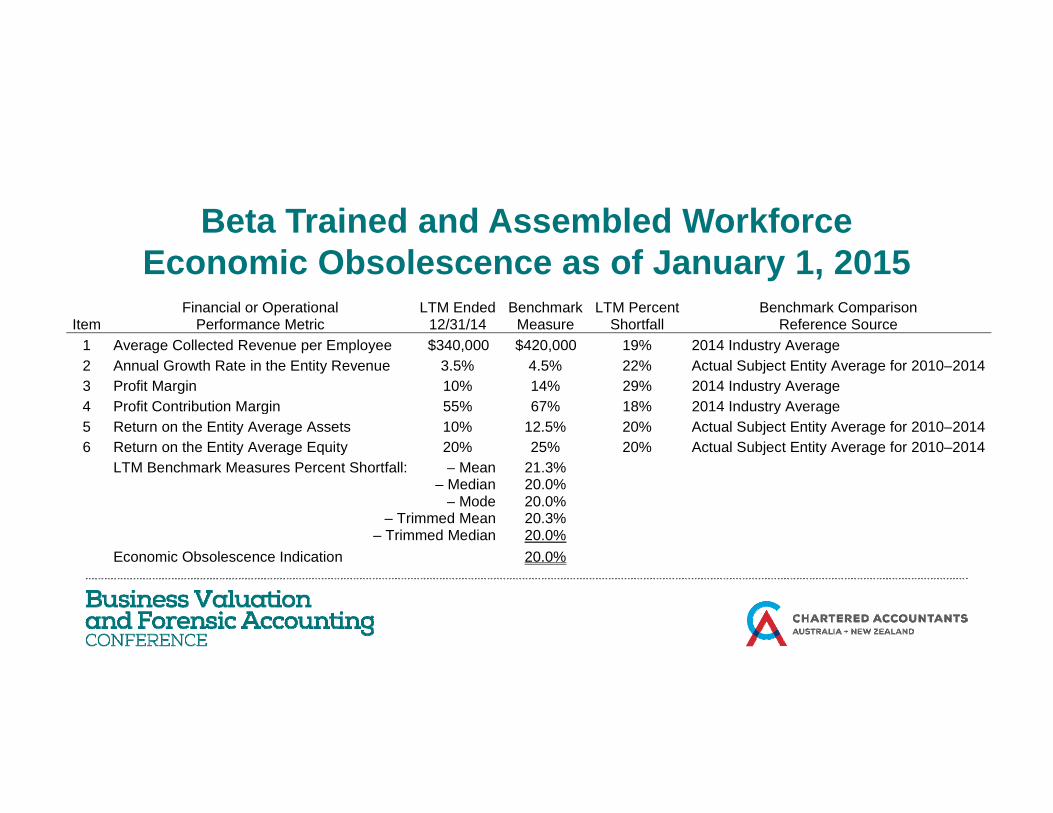
Financial or Operational LTM Ended Benchmark LTM Percent Benchmark Comparison Item Performance Metric 12/31/14 Measure Shortfall Reference Source
1 Average Collected Revenue per Employee $340,000 $420,000 19% 2014 Industry Average 2 Annual Growth Rate in the Entity Revenue 3.5% 4.5% 22% Actual Subject Entity Average for 2010–2014 3 Profit Margin 10% 14% 29% 2014 Industry Average 4 Profit Contribution Margin 55% 67% 18% 2014 Industry Average4 Profit Contribution Margin 55% 67% 18% 2014 Industry Average 5 Return on the Entity Average Assets 10% 12.5% 20% Actual Subject Entity Average for 2010–2014 6 Return on the Entity Average Equity 20% 25% 20% Actual Subject Entity Average for 2010–2014
LTM Benchmark Measures Percent Shortfall: – Mean 21.3% – Median 20.0%
M d 20 0% – Mode 20.0% – Trimmed Mean 20.3% – Trimmed Median 20.0% Economic Obsolescence Indication 20.0%
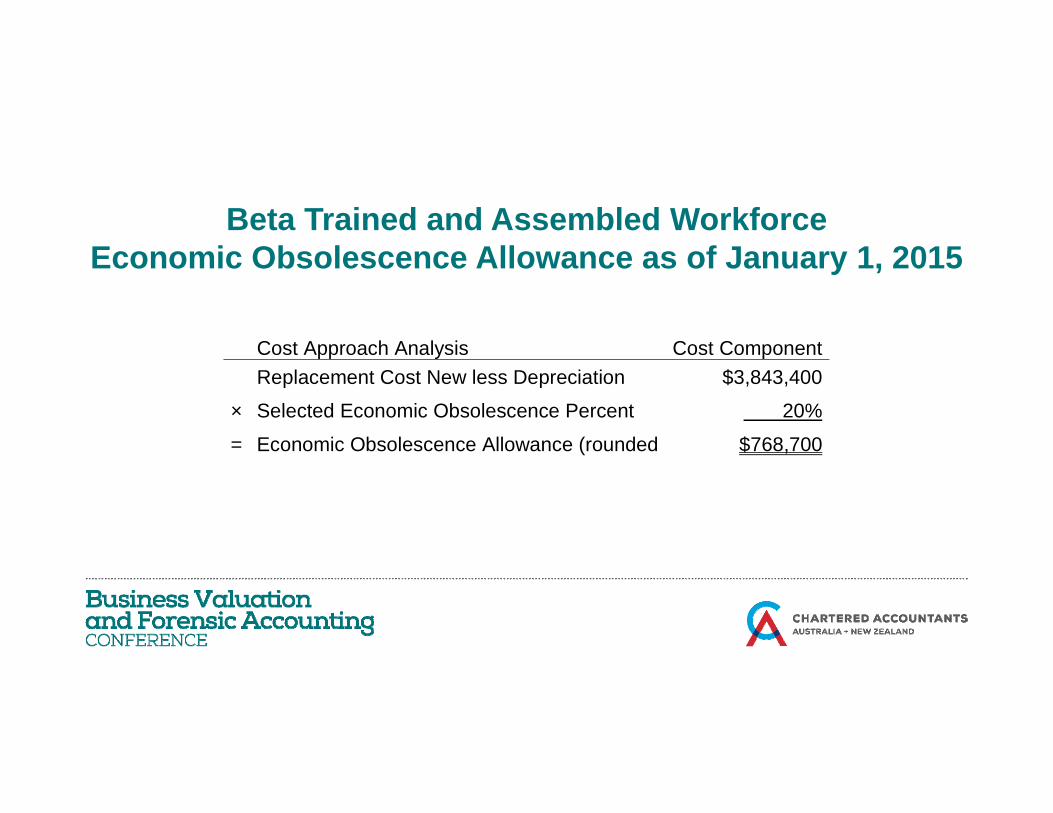
Beta Trained and Assembled WorkforceBeta Trained and Assembled WorkforceEconomic Obsolescence Allowance as of January 1, 2015
Cost Approach Analysis Cost Component Replacement Cost New less Depreciation $3,843,400
× Selected Economic Obsolescence Percent 20%× Selected Economic Obsolescence Percent 20%
= Economic Obsolescence Allowance (rounded $768,700
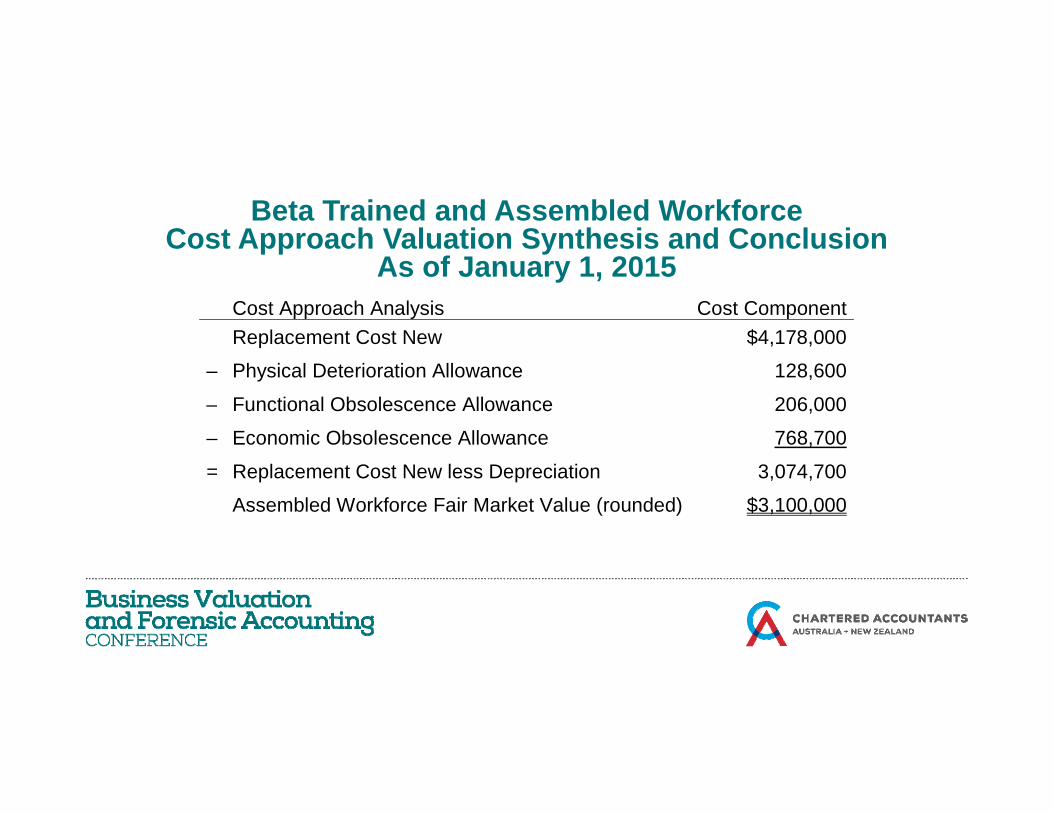
Beta Trained and Assembled WorkforceC S CCost Approach Valuation Synthesis and Conclusion
As of January 1, 2015 Cost Approach Analysis Cost Component pp y p Replacement Cost New $4,178,000
– Physical Deterioration Allowance 128,600
– Functional Obsolescence Allowance 206 000 Functional Obsolescence Allowance 206,000
– Economic Obsolescence Allowance 768,700
= Replacement Cost New less Depreciation 3,074,700
$ Assembled Workforce Fair Market Value (rounded) $3,100,000
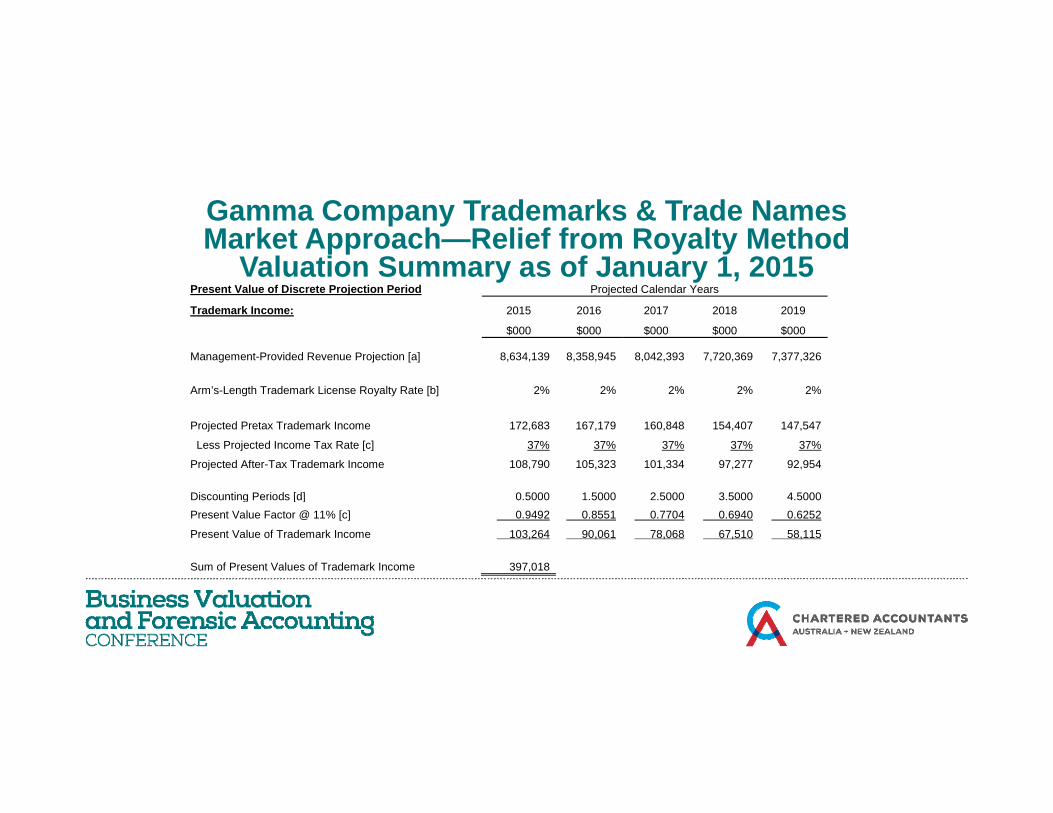
Market Approach Illustrative Example –Market Approach Illustrative Example Trademarks• Gamma Company is a telecommunications company and unitary taxpayer in
the State of Taxem. The valuation date is January 1, 2015.• Gamma and the State of Taxem have agreed to the total taxpayer unit value.
They do not agree on the value of the trademarks and trade names intangible y g gasset.
Market Approach Illustrative Example –Market Approach Illustrative Example Trademarks (cont.)• Gamma retains an analyst to value the exempt trademarks.• The analyst decides to use the market approach and the relief from royalty
(RFR) method.• Management provided the analyst with a long-term financial forecast. The
analyst conferred with management and concluded that the trademark RUL is 20 years.
• The Gamma WACC is 11%.
Common Intellectual Property License TransactionCommon Intellectual Property License Transaction DatabasesRoyaltySourcewww.royaltysource.com—The AUS Consultants database provides license transaction royalty rates. The database can be searched by industry, technology, and/or keyword. The information includes royalty rates, name of the licensee and y y y ,the licensor, a description of property licensed (or sold), the transaction terms, and the original information sources.
Common Intellectual Property License TransactionCommon Intellectual Property License Transaction Databases (cont.)RoyaltyStat, LLCwww.royaltystat.com—RoyaltyStat is a subscription-based database of license royalty rates and license agreements, compiled from Securities and Exchange Commission documents. It is searchable by SIC code or by full text.y y
Common Intellectual Property License TransactionCommon Intellectual Property License Transaction Databases (cont.)Royalty Connectionwww.royaltyconnection.com—Royalty ConnectionTM provides online access to license royalty rate and other license information on all types of technology, patents, trade secrets, and know-how. Users can search by industry, product p , , y y, pcategory, or keyword.
Common Intellectual Property License TransactionCommon Intellectual Property License Transaction Databases (cont.)ktMINEwww.bvmarketdata.com—ktMINE is an interactive database that provides direct access to license royalty rates, actual license agreements, and detailed agreement summaries. License agreements are searchable by industry, keyword, and various g y y, y ,other parameters.
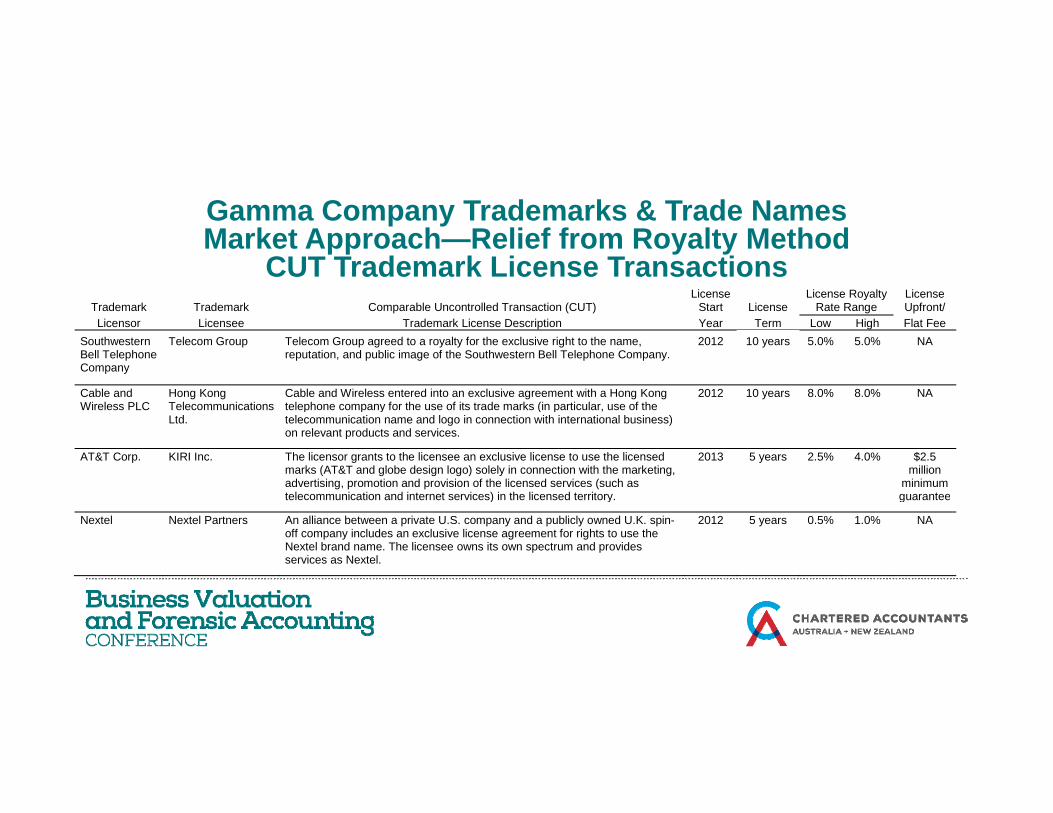
Gamma Company Trademarks & Trade Namesf fMarket Approach—Relief from Royalty Method
CUT Trademark License Transactions
Trademark
Trademark
Comparable Uncontrolled Transaction (CUT) License
Start
License License Royalty
Rate Range License Upfront/
Licensor Licensee Trademark License Description Year Term Low High Flat Fee Southwestern Bell Telephone Company
Telecom Group Telecom Group agreed to a royalty for the exclusive right to the name, reputation, and public image of the Southwestern Bell Telephone Company.
2012 10 years 5.0% 5.0% NA
Cable and Wireless PLC
Hong Kong Telecommunications
Cable and Wireless entered into an exclusive agreement with a Hong Kong telephone company for the use of its trade marks (in particular use of the
2012 10 years 8.0% 8.0% NA Wireless PLC Telecommunications
Ltd. telephone company for the use of its trade marks (in particular, use of the telecommunication name and logo in connection with international business) on relevant products and services.
AT&T Corp. KIRI Inc. The licensor grants to the licensee an exclusive license to use the licensed marks (AT&T and globe design logo) solely in connection with the marketing, advertising, promotion and provision of the licensed services (such as telecommunication and internet services) in the licensed territory
2013 5 years 2.5% 4.0% $2.5 million
minimum guaranteetelecommunication and internet services) in the licensed territory. guarantee
Nextel Nextel Partners An alliance between a private U.S. company and a publicly owned U.K. spin-off company includes an exclusive license agreement for rights to use the Nextel brand name. The licensee owns its own spectrum and provides services as Nextel.
2012 5 years 0.5% 1.0% NA
Gamma Company Trademarks & Trade Namesf fMarket Approach—Relief from Royalty Method
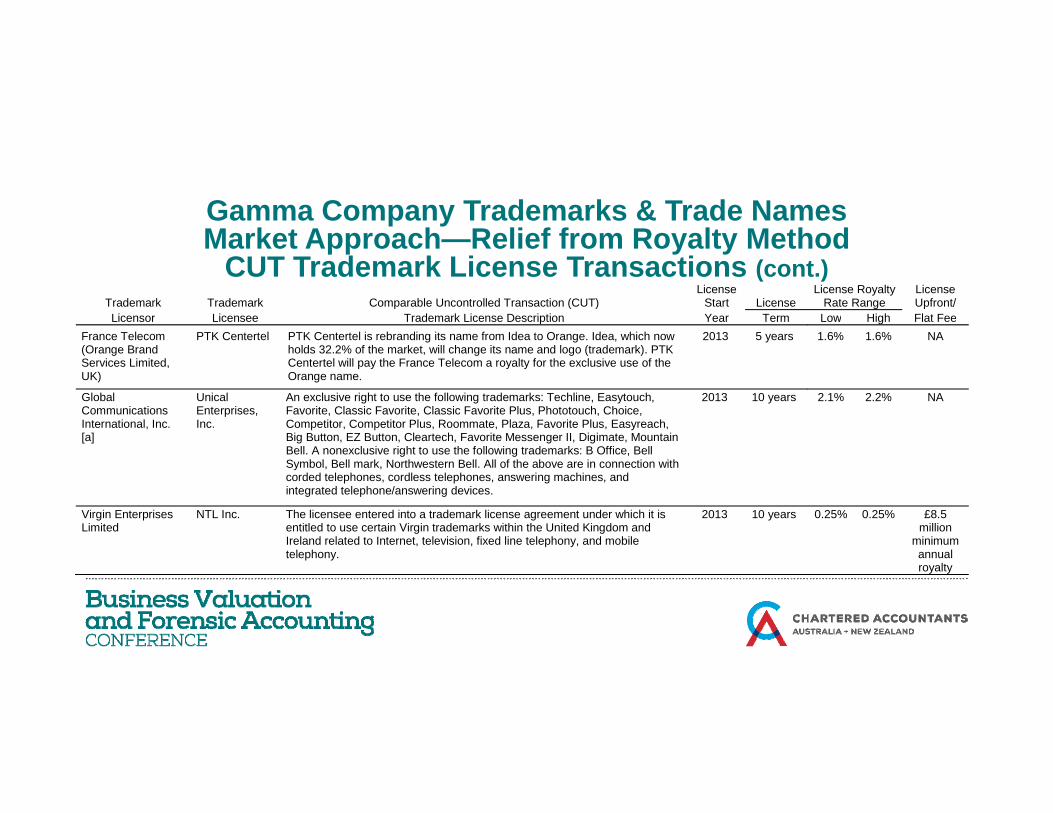
CUT Trademark License Transactions (cont.)
Trademark
Trademark
Comparable Uncontrolled Transaction (CUT) License
Start
License License Royalty
Rate Range License Upfront/
Licensor Licensee Trademark License Description Year Term Low High Flat FeeLicensor Licensee Trademark License Description Year Term Low High Flat Fee France Telecom (Orange Brand Services Limited, UK)
PTK Centertel PTK Centertel is rebranding its name from Idea to Orange. Idea, which now holds 32.2% of the market, will change its name and logo (trademark). PTK Centertel will pay the France Telecom a royalty for the exclusive use of the Orange name.
2013 5 years 1.6% 1.6% NA
Global C i ti
Unical E t i
An exclusive right to use the following trademarks: Techline, Easytouch, F it Cl i F it Cl i F it Pl Ph t t h Ch i
2013 10 years 2.1% 2.2% NA Communications International, Inc. [a]
Enterprises, Inc.
Favorite, Classic Favorite, Classic Favorite Plus, Phototouch, Choice, Competitor, Competitor Plus, Roommate, Plaza, Favorite Plus, Easyreach, Big Button, EZ Button, Cleartech, Favorite Messenger II, Digimate, Mountain Bell. A nonexclusive right to use the following trademarks: B Office, Bell Symbol, Bell mark, Northwestern Bell. All of the above are in connection with corded telephones, cordless telephones, answering machines, and integrated telephone/answering devices. g g
Virgin Enterprises Limited
NTL Inc. The licensee entered into a trademark license agreement under which it is entitled to use certain Virgin trademarks within the United Kingdom and Ireland related to Internet, television, fixed line telephony, and mobile telephony.
2013 10 years 0.25% 0.25% £8.5 million
minimum annual royalty
Gamma Company Trademarks & Trade Namesf fMarket Approach—Relief from Royalty Method
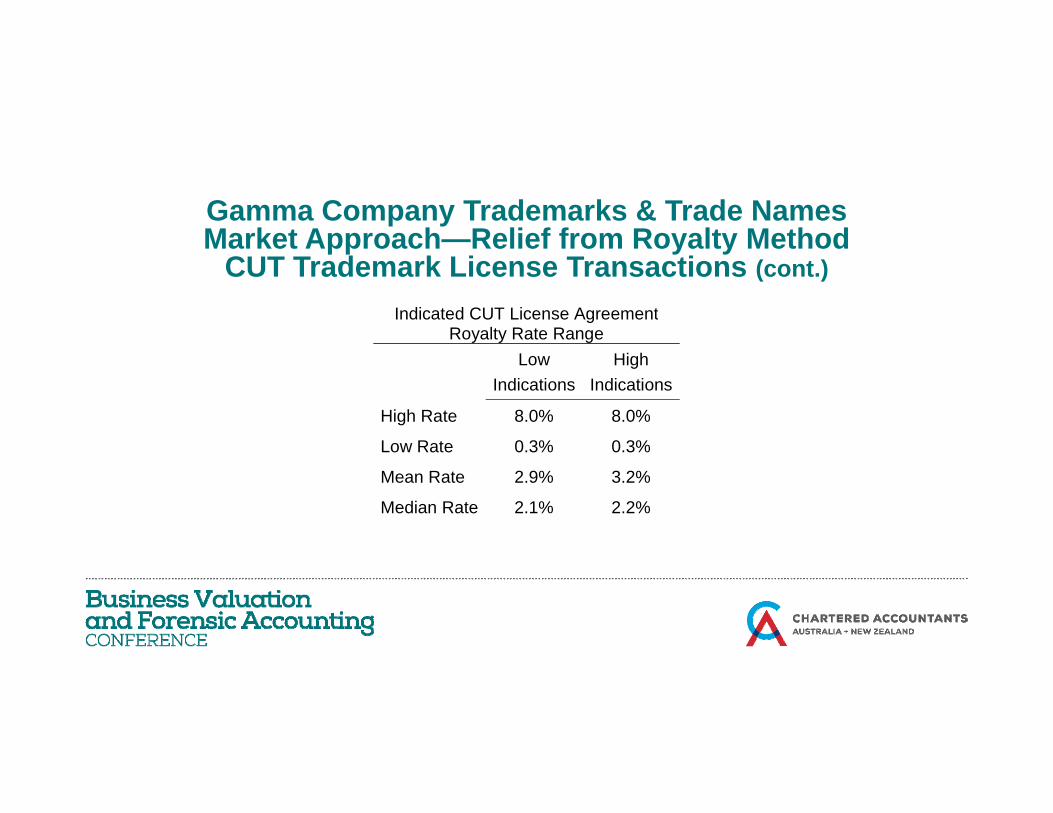
CUT Trademark License Transactions (cont.)
Indicated CUT License AgreementIndicated CUT License Agreement Royalty Rate Range
Low Indications
High Indications
High Rate 8.0% 8.0%
Low Rate 0.3% 0.3%
Mean Rate 2.9% 3.2%
Median Rate 2.1% 2.2%
Gamma Company Trademarks & Trade Namesf fMarket Approach—Relief from Royalty Method
Valuation Summary as of January 1, 2015 Present Value of Discrete Projection Period Projected Calendar Years
Trademark Income: 2015 2016 2017 2018 2019
$000 $000 $000 $000 $000
Management-Provided Revenue Projection [a] 8,634,139 8,358,945 8,042,393 7,720,369 7,377,326
Arm’s-Length Trademark License Royalty Rate [b] 2% 2% 2% 2% 2%
Projected Pretax Trademark Income 172,683 167,179 160,848 154,407 147,547
Less Projected Income Tax Rate [c] 37% 37% 37% 37% 37%
Projected After-Tax Trademark Income 108,790 105,323 101,334 97,277 92,954
Discounting Periods [d] 0 5000 1 5000 2 5000 3 5000 4 5000 Discounting Periods [d] 0.5000 1.5000 2.5000 3.5000 4.5000 Present Value Factor @ 11% [c] 0.9492 0.8551 0.7704 0.6940 0.6252
Present Value of Trademark Income 103,264 90,061 78,068 67,510 58,115
Sum of Present Values of Trademark Income 397,018
Gamma Company Trademarks & Trade Namesf fMarket Approach—Relief from Royalty Method
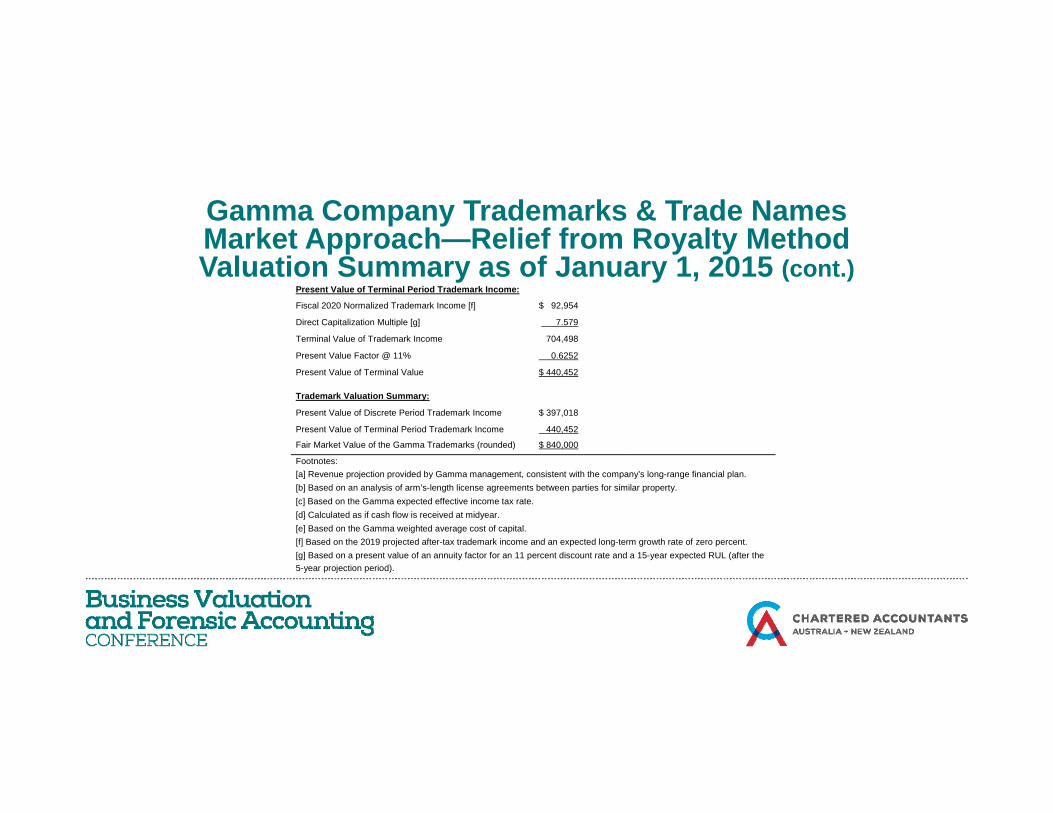
Valuation Summary as of January 1, 2015 (cont.)Present Value of Terminal Period Trademark Income: Fiscal 2020 Normalized Trademark Income [f] $ 92,954 Direct Capitalization Multiple [g] 7.579 Terminal Value of Trademark Income 704,498 Present Value Factor @ 11% 0.6252 Present Value of Terminal Value $ 440,452 Trademark Valuation Summary: Present Value of Discrete Period Trademark Income $ 397,018 Present Value of Terminal Period Trademark Income 440,452 Fair Market Value of the Gamma Trademarks (rounded) $ 840,000 Footnotes: [a] Revenue projection provided by Gamma management, consistent with the company’s long-range financial plan. [b] Based on an analysis of arm’s-length license agreements between parties for similar property. [c] Based on the Gamma expected effective income tax rate. [d] Calculated as if cash flow is received at midyear. [e] Based on the Gamma weighted average cost of capital. [f] Based on the 2019 projected after-tax trademark income and an expected long-term growth rate of zero percent. [g] Based on a present value of an annuity factor for an 11 percent discount rate and a 15-year expected RUL (after the 5-year projection period).
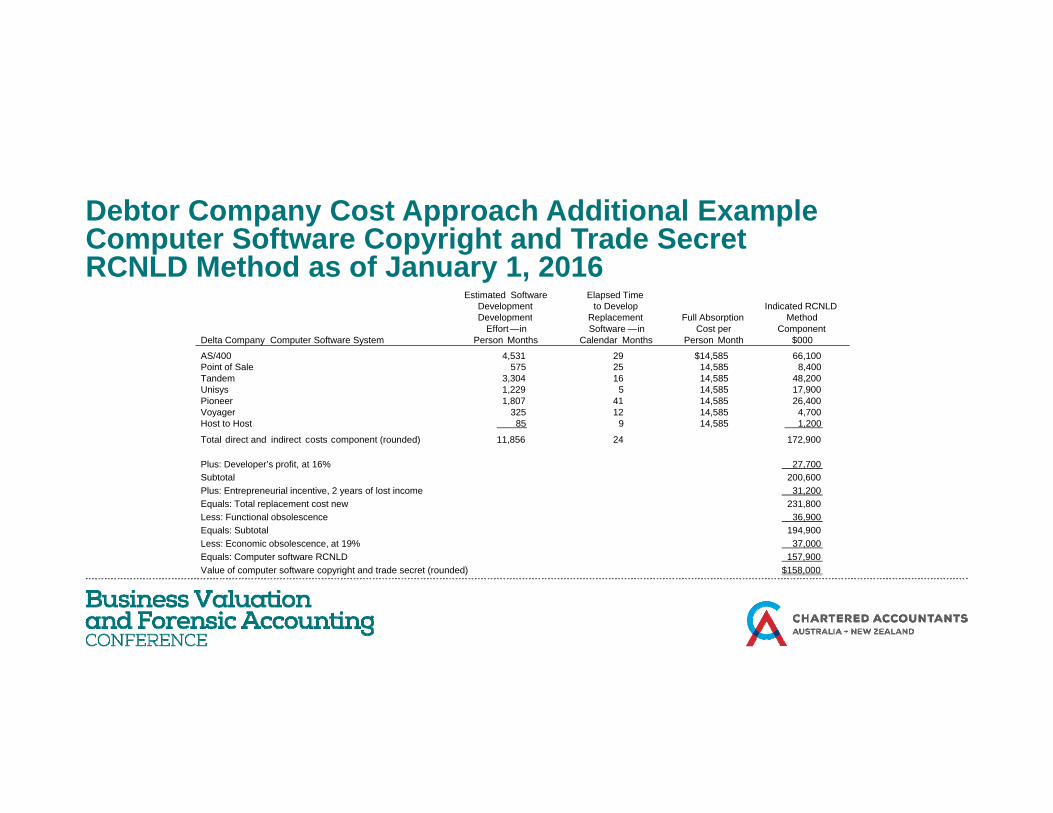
Debtor Company Cost Approach Additional ExampleC S f C SComputer Software Copyright and Trade SecretRCNLD Method as of January 1, 2016
Estimated SoftwareDevelopment Development
Elapsed Time to Develop
Replacement Full AbsorptionIndicated RCNLD
Method
Delta Company Computer Software System
DevelopmentEffort—in
Person Months
Replacement Software —in
Calendar Months
Full Absorption Cost per
Person Month
Method Component
$000
AS/400 4,531 29 $14,585 66,100Point of Sale 575 25 14,585 8,400Tandem 3,304 16 14,585 48,200Unisys 1,229 5 14,585 17,900Pioneer 1,807 41 14,585 26,400Voyager 325 12 14,585 4,700Host to Host 85 9 14,585 1,200
Total direct and indirect costs component (rounded) 11,856 24 172,900
Plus: Developer’s profit, at 16% 27,700Subtotal 200,600Plus: Entrepreneurial incentive, 2 years of lost income 31,200Equals: Total replacement cost new 231,800Less: Functional obsolescence 36,900Equals: Subtotal 194,900Less: Economic obsolescence, at 19% 37,000Equals: Computer software RCNLD 157,900Value of computer software copyright and trade secret (rounded) $158,000
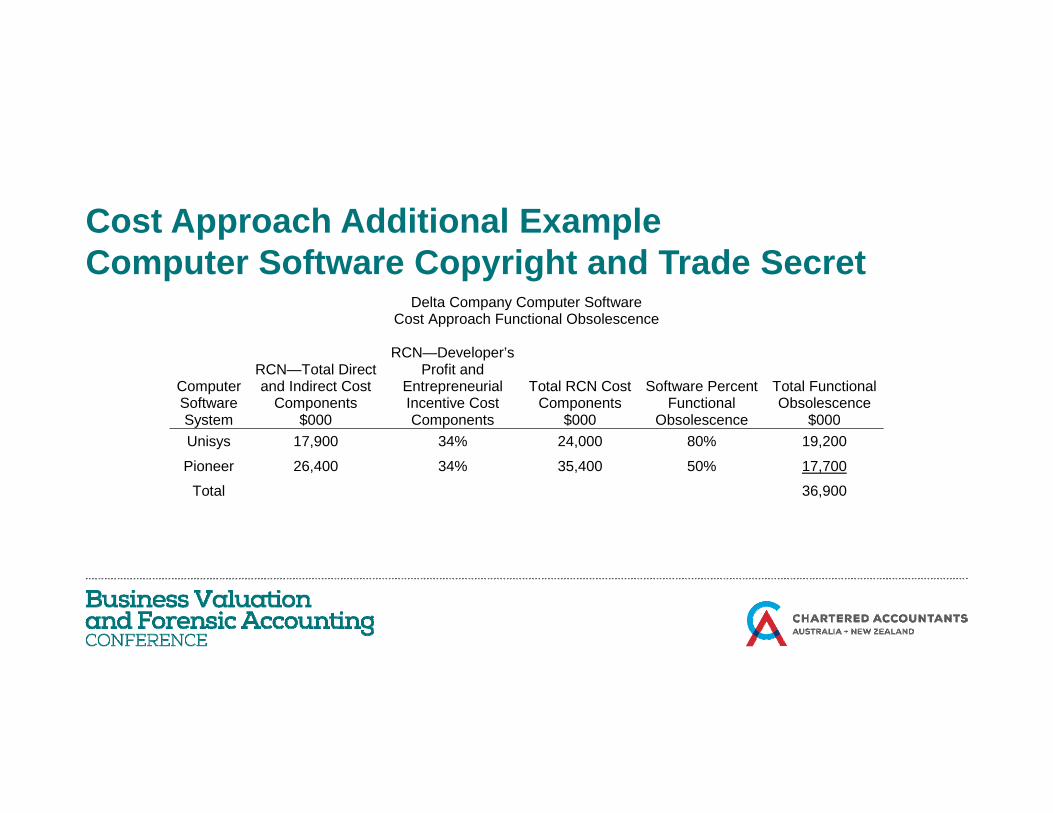
Cost Approach Additional ExampleCost Approach Additional ExampleComputer Software Copyright and Trade Secret
Delta Company Computer Software Cost Approach Functional ObsolescenceCost Approach Functional Obsolescence
Computer Software
RCN—Total Direct and Indirect Cost
Components
RCN—Developer’s Profit and
Entrepreneurial Incentive Cost
Total RCN Cost Components
Software Percent Functional
Total Functional ObsolescenceSoftware
System Components
$000 Incentive Cost Components
Components $000
Functional Obsolescence
Obsolescence $000
Unisys 17,900 34% 24,000 80% 19,200
Pioneer 26,400 34% 35,400 50% 17,700
Total 36,900 ,
Cost Approach Additional ExampleCost Approach Additional ExampleComputer Software Copyright and Trade Secret (cont.)
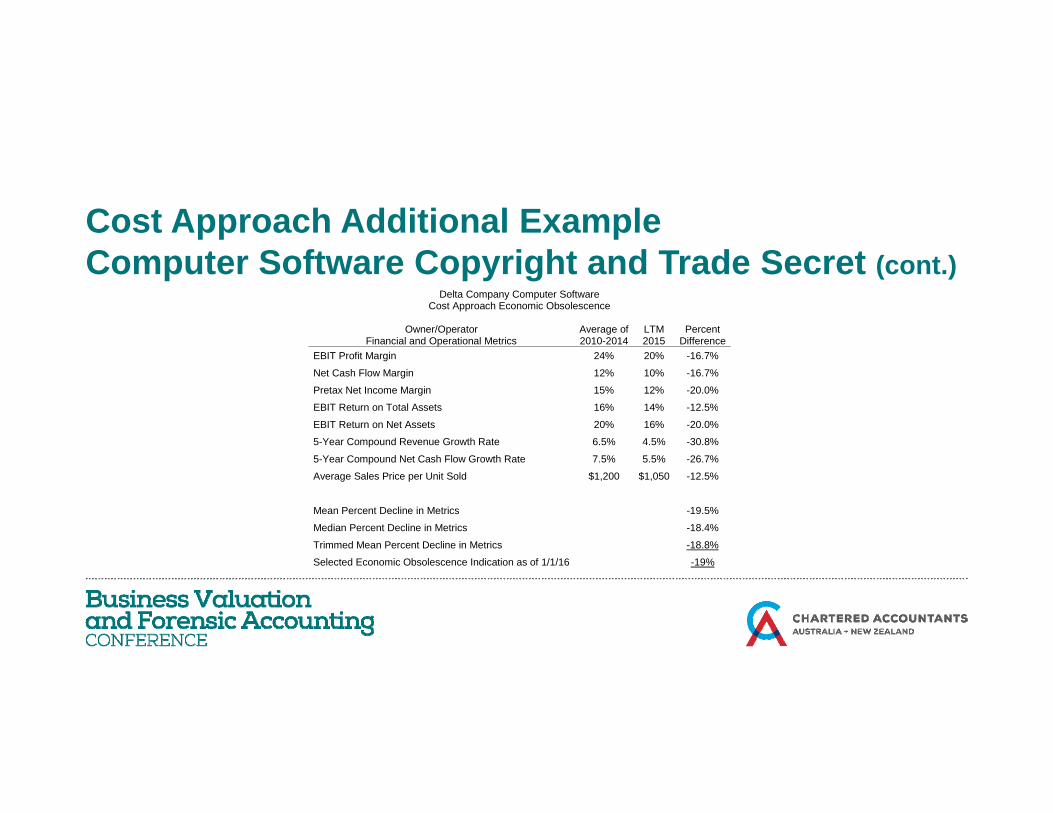
Delta Company Computer Software Cost Approach Economic Obsolescence
Owner/Operator
Financial and Operational Metrics Average of 2010-2014
LTM 2015
Percent Difference
EBIT Profit Margin 24% 20% -16.7%
Net Cash Flow Margin 12% 10% -16.7%
Pretax Net Income Margin 15% 12% -20.0%
EBIT Return on Total Assets 16% 14% 12 5%EBIT Return on Total Assets 16% 14% -12.5%
EBIT Return on Net Assets 20% 16% -20.0%
5-Year Compound Revenue Growth Rate 6.5% 4.5% -30.8%
5-Year Compound Net Cash Flow Growth Rate 7.5% 5.5% -26.7%
Average Sales Price per Unit Sold $1,200 $1,050 -12.5%
Mean Percent Decline in Metrics -19.5%
Median Percent Decline in Metrics -18.4%
Trimmed Mean Percent Decline in Metrics -18.8%
Selected Economic Obsolescence Indication as of 1/1/16 -19%
Attributes of an Effective Intangible AssetAttributes of an Effective Intangible Asset Valuation Report• In order to encourage the reader’s acceptance, the effective intangible asset
valuation report should be:• clear, convincing, and cogent• well-organized, well-written, and well-presented• free of grammar, punctuation, spelling, and mathematical errors• procedurally and mathematically replicable, without the use of any unexplained or
unsourced valuation variables
Attributes of an Effective Intangible AssetAttributes of an Effective Intangible Asset Valuation Report (cont.)• The persuasive intangible asset valuation report will tell a narrative story that:
• defines the valuation analyst’s assignment,• describes the analyst’s data gathering and due diligence procedures,• justifies the analyst’s selection of (and rejection of) the generally accepted valuation
approaches, methods, and procedures,approaches, methods, and procedures,• explains how the analyst performed the valuation synthesis and reached the final value
conclusion,• defends the analyst’s intangible asset value conclusion, and
d ib ll f th d t th t th l t li d ( d i l d i f• describes all of the data sources that the analyst relied on (and includes copies of non-public source documents)
Intangible Asset Valuation Report Errors to AvoidIntangible Asset Valuation Report Errors to Avoid
• An effective intangible asset valuation report will avoid these common errors:F il t l th d fi d t d d f l• Failure to apply the defined standard of value
• Failure to apply the defined premise of value• Analytical internal inconsistencies• Arithmetic errors in the valuation analysis• Arithmetic errors in the valuation analysis• Insufficient support for the selected valuation variables• Reliance on industry or other rules of thumb• Insufficient data and inadequate market research\q• Inadequate due diligence procedures
Attributes of an Effective Intangible Asset ValuationAttributes of an Effective Intangible Asset Valuation Expert Witness• Clients (and especially legal counsel) look for the following attributes in an
intangible asset valuation expert witness:• Experience in valuations of the subject intangible asset type• Experience in valuations in the subject industryExperience in valuations in the subject industry• Experience in valuations for the subject legal issues• Relevant professional credentials
F ili it ith th l t f i l lit t• Familiarity with the relevant professional literature• Familiarity with the relevant professional standards
Attributes of an Effective Intangible Asset ValuationAttributes of an Effective Intangible Asset Valuation Expert Witness (cont.)
• Ability to communicate effectively, both orally and in writing• Ability to work cohesively, as part of the litigation team• Experience as an expert witness (may or may not be important)• Prior client references• Prior client references• Lack of contradictory reports or testimony in prior cases• Professional writings on subject consistent with testimony
Summary and ConclusionSummary and Conclusion
• Types of properties that qualify as intangible assetsT f i t ibl t d i t ll t l t• Types of intangible assets and intellectual property
• Types of intangible asset analyses• Reasons to conduct the intangible asset valuation• Elements of the intangible asset valuation• Elements of the intangible asset valuation• Illustrative cost approach valuation analysis• Illustrative income approach valuation analysis• Illustrative market approach valuation analysispp y• Valuation synthesis and conclusion considerations• Reporting and defending the results of the intangible asset valuation