w ater co nditio nin g for the d aya ba y exp erime...
TRANSCRIPT

Water Conditioning for the Daya Bay Experiment
Jim Napolitano
June 27, 2007
Abstract
This document outlines our understanding of the specifications and proposed tech-nical design for the Daya Bay water conditioning system, as of June 2007.
In June 2007, the Daya Bay experiment has passed CD-0 and CD-1 reviews, and ispreparing for technical reviews on the way to a CD-2 panel, which is expected to convene inFall 2007. This document means to summarize the current status of the system. The overallexperiment design is still in flux, however, and some of the changes are relevant to the watersystem. This includes the inclusion of a central water storage pool within the mountain.
1 Overview
A preliminary design for the water conditioning system is shown in Fig. 1. This system, ora modification of it, needs to meet specifications for water clarity, radioactivity, long termcorrosiveness, and temperature stability. Our clarity specification is a requirement that theattenuation length for Cherenkov light be on the order of the pool dimensions or larger. Agoal is to achieve at least 30 m for all relevant wavelengths. Most radioactive backgroundswill be carried on suspended particles and removed by filters, but radon presents a particularproblem since it is dissolved in the water as a noble gas. Water can act as a corrosive agent,given certain characteristics related to its “purity” and to the materials that are submergedin the pool. Finally, the water pool will e!ectively serve as a temperature stabilizationmedium for the antineutrino detectors.
Bacterial growth in the water must also be minimized, at least for the sake of clarity. Tofirst approximation, this is accomplished using an ultraviolet sterilization stage, followed byfiltration to remove the dead organisms. Gas removal, aimed at radon, will also be used toremove dissolved oxygen, and we will aim for as low an operating temperature as possible,given other constraints.
Engineering specifications and constraints include the time to fill or drain any particularwater pool, and the need to transfer the water over large distances while maintaining anappropriate level of purity. Of course, cost needs to be minimized as well.
Water systems used in other experiments, and the specifications they achieved, are sum-marized in Table 1. (For details, see the Appendix.) Note that the only two experiments
1
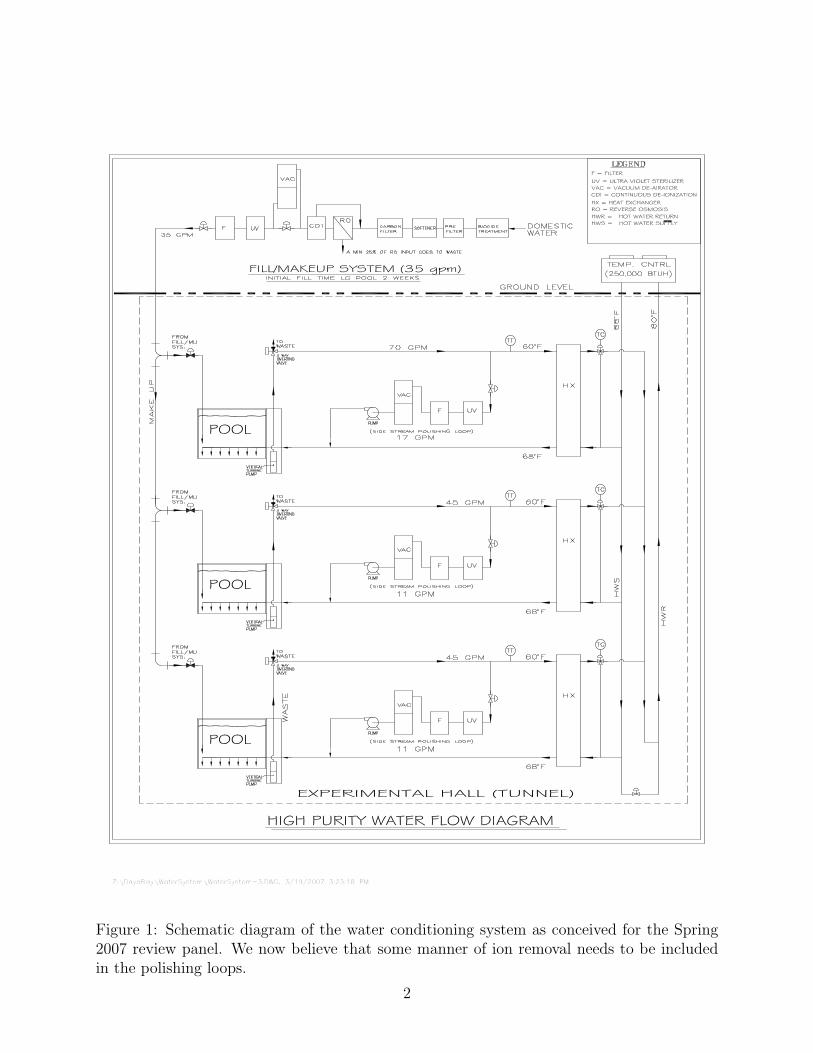
Figure 1: Schematic diagram of the water conditioning system as conceived for the Spring2007 review panel. We now believe that some manner of ion removal needs to be includedin the polishing loops.
2

Table 1: Water conditioning systems used in previous experiments. (See the Appendix.)Experiment Vol Flow Vol/Flow Att Len Resistivity Radon
(m3) (gpm) (days) (m) (M"-cm) (Bq/m3)IMB [1, 2] 8000 80 18SuperK [3] 50,000 130 71 100 > 18 < 0.002SNO [4, 5] 1700 40 7.8 ! 0.001KamLAND [6, 7] 3200 35 16.8 0.5 104
BaBar/DIRC [8] 6 4 0.28 " 50 18# 10Milagro [9] ! 4000 190 3.9 20DYB Far Pool 2560 17 28DYB Near Pools 1600 11 27
which carefully measured their attenuation lengths (SuperK and BaBar/DIRC) made use ofdeionization stages in their water conditioning and achieved extremely clear water. Mila-gro did not make use of deionization, and observes a significantly lower optical attenuationlength, albeit not determined with a particularly careful measurement.
2 Physics performance specifications
There are four specifications that directly a!ect the physical performance of the muon vetosystem. These are optical attenuation length, i.e. “water clarity”; radioactivity contamina-tion levels, mainly from radon; thermal stability, as the water pool will be the heat bathwhich stabilizes the antineutrino detector volume; and corrosiveness of the water itself withregard to the various materials that must live in the pools.
2.1 Optical attenuation length
Current simulations indicate that the muon veto performance will be satisfactory if theattenuation length for Cherenkov light in the water exceeds 30 m, that is, an absorptioncoe#cient less than 3$ 10!2/m. Note that although the Cherenkov spectrum rises for smallwavelenghts as 1/!2, the glass envelope of the photomultipler tube will cut the spectrum o!at wavelengths below 325 nm or so.
Particles at the micron size level, that is much larger than the wavelength of light, are onesource of light attenuation. Assuming a volume density n, then we need n $ "r2 < 1/30m.For r = 1 µm, n < 1010/m3. This would be a volume fraction roughly equal to 4
3"r3n !4$ 10!8, or about 0.1ppm by weight. The IMB water conditioning system [1], for example,achieved 0.3ppm for all dissolved solids, using a series of filters followed by reverse osmosis.We consequently are confident that particulate contaminants will not limit the attenuationlength, given our preliminary design for the conditioning system.
Dissolved salts present a larger problem, since the scattering and/or absorption crosssection for ions is generally much larger than for water molecules, for visible wavelengths.
3
dissolved gases, could significantly increase absorp-tion in this region.
2. Photothermal Deflection SpectroscopyA cross section illustrating the photothermal deflec-tion spectroscopy !PDS" interaction is shown in Fig.2. A high-power pulsed laser beam !the pumpbeam" produces a transient heat pulse in the inte-rior of the absorbing sample; in analogy with ourexperiment, a cylinder lens focuses the pump beamin this illustration. A low-power, continuous-wavelaser beam !the probe beam" propagates throughthis region of heating !the interaction region" atright angles to the pump beam and off center. Thedeflection of the probe beam by refraction in thedynamic temperature–index gradient is propor-tional to the absorption coefficient.
In a PDS experiment, only radiation that is ab-sorbed and promptly converted to thermal energy
deflects the probe beam; thus the absorption coeffi-cients we measure reflect only this specific absorptionprocess. For pure-water measurements, these re-sults are expected to be consistent with usual inter-pretations of the absorption coefficient, as has beendiscussed for optoacoustic spectroscopy.11 We alsoobserved no fluorescence, even at 340 nm !the firstexcited electronic state for water appears at #275nm". Net energy deposition in the sample by Bril-louin and Raman scattering is assumed to have anegligible effect on the PDS signal; specifically, theirvolume scattering coefficients are small, and eachscattered photon carries away only slightly more orless energy than the incident photon.
It should be noted that many absorbing materialsonly weakly channel absorbed energy into heat; in-stead, they convert absorbed energy into fluorescence,chemical bonds, internal rovibrational excitation, anddissociation. The interpretation of PDS absorptionspectra for these materials requires knowledge of thebranching ratio for decay into thermal channels.
Numerous applications and theoretical treatmentsof PDS are documented in the literature17,18; henceonly a brief sketch of the theoretical analysis for thedynamic refraction mechanism is provided here. Inthe absence of any mass transport !convection" fromthe region of heating, one can find the laser-inducedtemperature profile T!r, t" by solving the heat equa-tion !conservation of energy equation"19,20
$D%2T !&T&t
"q̇
'Cp, (2)
where ' is the density of the medium, Cp is the heatcapacity of the medium at constant pressure, q̇ is thethermal energy deposited in the medium per unit
Fig. 1. Selected pure-water absorption spectra representative of variability in published data. Shoulders corresponding to harmonicsof the O–H stretch are indicated by arrows.
Fig. 2. In PDS a continuous-wave laser beam !probe beam" prop-agates through a region locally heated by a pulsed laser !pumpbeam". The probe beam is refracted !deflected" by the index gra-dient produced by local heating and is positioned to pass througha region of maximum gradient. The magnitude of the probe beamdeflection depends linearly on the product aE, where a is theabsorption coefficient and E is the energy in the pump beam pulse.In our experiment, the pump beam is focused with a cylinder lensand produces a locally heated cross section that is (5 mm long atthe focal point.
20 November 1997 ! Vol. 36, No. 33 ! APPLIED OPTICS 8701
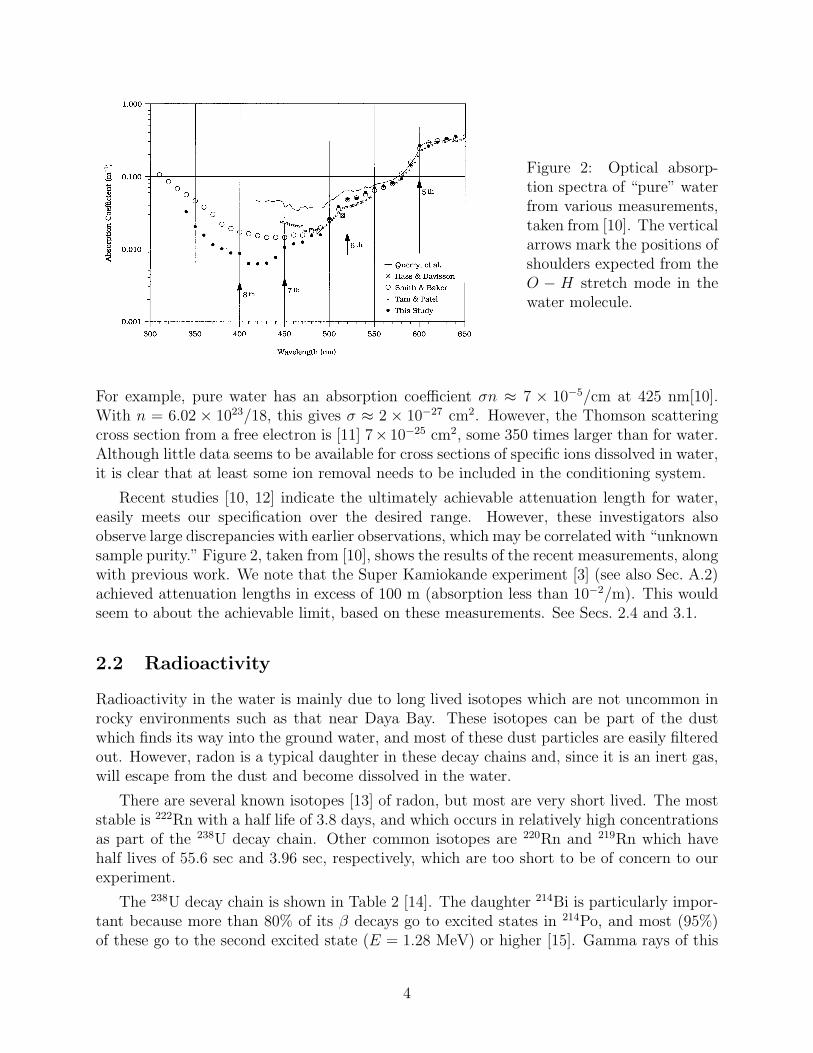
Figure 2: Optical absorp-tion spectra of “pure” waterfrom various measurements,taken from [10]. The verticalarrows mark the positions ofshoulders expected from theO % H stretch mode in thewater molecule.
For example, pure water has an absorption coe#cient #n ! 7 $ 10!5/cm at 425 nm[10].With n = 6.02 $ 1023/18, this gives # ! 2 $ 10!27 cm2. However, the Thomson scatteringcross section from a free electron is [11] 7$ 10!25 cm2, some 350 times larger than for water.Although little data seems to be available for cross sections of specific ions dissolved in water,it is clear that at least some ion removal needs to be included in the conditioning system.
Recent studies [10, 12] indicate the ultimately achievable attenuation length for water,easily meets our specification over the desired range. However, these investigators alsoobserve large discrepancies with earlier observations, which may be correlated with “unknownsample purity.” Figure 2, taken from [10], shows the results of the recent measurements, alongwith previous work. We note that the Super Kamiokande experiment [3] (see also Sec. A.2)achieved attenuation lengths in excess of 100 m (absorption less than 10!2/m). This wouldseem to about the achievable limit, based on these measurements. See Secs. 2.4 and 3.1.
2.2 Radioactivity
Radioactivity in the water is mainly due to long lived isotopes which are not uncommon inrocky environments such as that near Daya Bay. These isotopes can be part of the dustwhich finds its way into the ground water, and most of these dust particles are easily filteredout. However, radon is a typical daughter in these decay chains and, since it is an inert gas,will escape from the dust and become dissolved in the water.
There are several known isotopes [13] of radon, but most are very short lived. The moststable is 222Rn with a half life of 3.8 days, and which occurs in relatively high concentrationsas part of the 238U decay chain. Other common isotopes are 220Rn and 219Rn which havehalf lives of 55.6 sec and 3.96 sec, respectively, which are too short to be of concern to ourexperiment.
The 238U decay chain is shown in Table 2 [14]. The daughter 214Bi is particularly impor-tant because more than 80% of its $ decays go to excited states in 214Po, and most (95%)of these go to the second excited state (E = 1.28 MeV) or higher [15]. Gamma rays of this
4
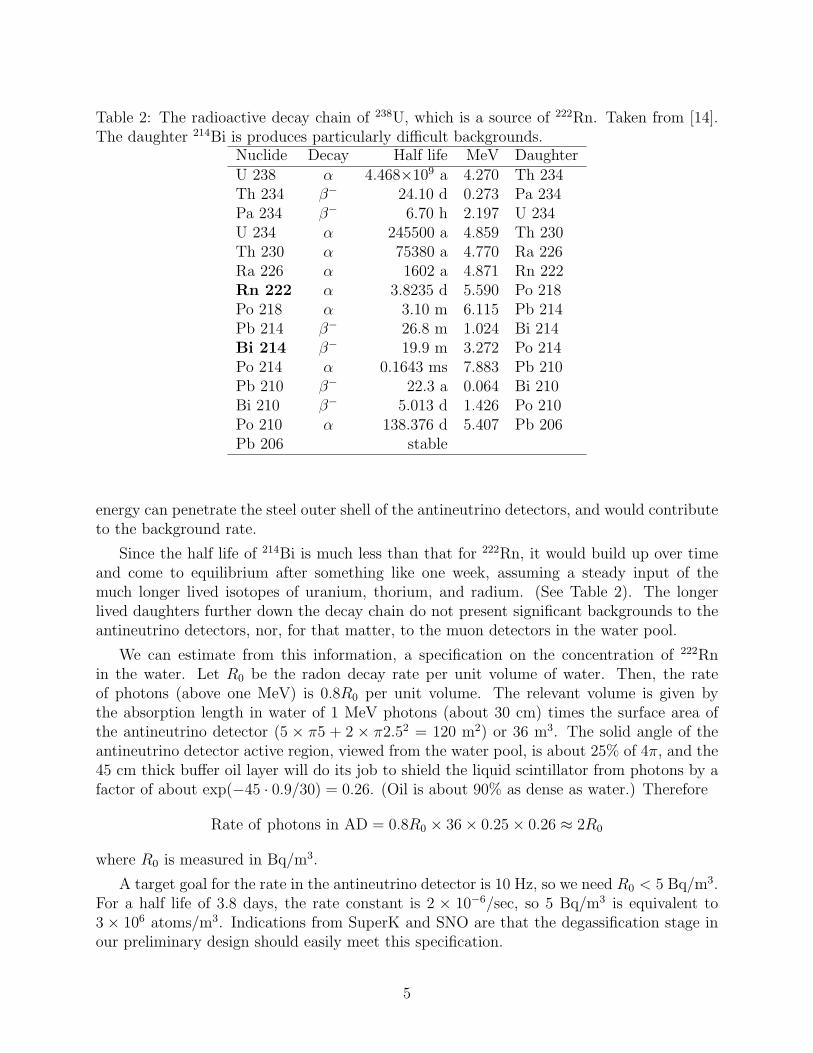
Table 2: The radioactive decay chain of 238U, which is a source of 222Rn. Taken from [14].The daughter 214Bi is produces particularly di#cult backgrounds.
Nuclide Decay Half life MeV DaughterU 238 % 4.468$109 a 4.270 Th 234Th 234 $! 24.10 d 0.273 Pa 234Pa 234 $! 6.70 h 2.197 U 234U 234 % 245500 a 4.859 Th 230Th 230 % 75380 a 4.770 Ra 226Ra 226 % 1602 a 4.871 Rn 222Rn 222 % 3.8235 d 5.590 Po 218Po 218 % 3.10 m 6.115 Pb 214Pb 214 $! 26.8 m 1.024 Bi 214Bi 214 $! 19.9 m 3.272 Po 214Po 214 % 0.1643 ms 7.883 Pb 210Pb 210 $! 22.3 a 0.064 Bi 210Bi 210 $! 5.013 d 1.426 Po 210Po 210 % 138.376 d 5.407 Pb 206Pb 206 stable
energy can penetrate the steel outer shell of the antineutrino detectors, and would contributeto the background rate.
Since the half life of 214Bi is much less than that for 222Rn, it would build up over timeand come to equilibrium after something like one week, assuming a steady input of themuch longer lived isotopes of uranium, thorium, and radium. (See Table 2). The longerlived daughters further down the decay chain do not present significant backgrounds to theantineutrino detectors, nor, for that matter, to the muon detectors in the water pool.
We can estimate from this information, a specification on the concentration of 222Rnin the water. Let R0 be the radon decay rate per unit volume of water. Then, the rateof photons (above one MeV) is 0.8R0 per unit volume. The relevant volume is given bythe absorption length in water of 1 MeV photons (about 30 cm) times the surface area ofthe antineutrino detector (5 $ "5 + 2 $ "2.52 = 120 m2) or 36 m3. The solid angle of theantineutrino detector active region, viewed from the water pool, is about 25% of 4", and the45 cm thick bu!er oil layer will do its job to shield the liquid scintillator from photons by afactor of about exp(%45 · 0.9/30) = 0.26. (Oil is about 90% as dense as water.) Therefore
Rate of photons in AD = 0.8R0 $ 36$ 0.25$ 0.26 ! 2R0
where R0 is measured in Bq/m3.
A target goal for the rate in the antineutrino detector is 10 Hz, so we need R0 < 5 Bq/m3.For a half life of 3.8 days, the rate constant is 2 $ 10!6/sec, so 5 Bq/m3 is equivalent to3 $ 106 atoms/m3. Indications from SuperK and SNO are that the degassification stage inour preliminary design should easily meet this specification.
5
2.3 Thermal stability
Bob McKeown has considered the thermal properties of the water pool [16].
The temperature of the water pool will be determined by the heating/cooling capacityof the recirculating purification system and by the heat exchanged with the surroundingrock. Rock has a specific heat of 750 J/kg-"K (within about 100 J/kg-"K [17]) and a thermalconductivity of about ! 3 W/m-"K [18]. If we approximate the pool as an 8 m radius sphere,the temperature in the rock will vary as 1/r until it reaches the ambient rock temperature.This will involve about 40kTon of rock, and the heat exchange with the water (per degreeof temperature di!erence) is about 400W/K. So 1.6kW of heating/cooling can maintain atemperature di!erence of 4K, which is very reasonable from the point of view of operatingcost.
Heating the rock will require roughly 30 GJ/"K (compared to about 10 GJ/"K for thewater itself), or about 1 year if we use only 1.6 kW. So we may need to have a capacity of100 kW to reach equilibrium in a time scale of weeks. The heat exchanger in Fig. 1 specifies250,000 BTU per hour, or 73 kW. The total energy requirement is about 104 kW-hr/"Kwhich should cost less than about US$1000/"K, so this is quite reasonable from the point ofview of cost.
Note that if we are running in a stable situation with about 1 kW of energy transferredto maintain the pool temperature at 4"K temperature di!erence with the rock, this will be avery stable situation. If the 1.6 kW or recirculation system fails, the temperature will adjustwith a very long time constant of about 3 years. That is, the temperature will take about 1year to change by 1"K. (Recall that the time constant for the detector modules to respondto a change in water temperature is hours or days so the detectors will follow these veryslow changes in water temperature accurately.)
Of course, these considerations are for putting the water pool into thermal equilibriumwith the rock walls. If the ambient rock temperature at the near and far sites is di!erent,then the detectors will be at di!erent temperatures. For now, we tacitly assume that thedetector liquid scintillator temperatures will be monitored closely and the yields correctedfor any di!erence.
2.4 Corrosiveness
Materials in contact with the water for long periods of time include (phototube) glass,stainless steel, and cabling materials. Anecdotal evidence is plentiful for the e!ect of “ul-trapure” water, especially water, but technical references are limited. There is a publishedstatement [12] that “pure water is a hungry substance that leaches impurities out of nearlyeverything it contacts,” but the justification for this statement is anecdotal.
Regardless of the e!ect on instrumentation in contact with the water, it seems thatdissolved ions may seriously impact the attenuation length of the water. One piece of ev-idence [19] for this comes from Fig.10 of [12]. (See also Fig. 2 of this document.) Theabsorption coe#cients measured by Tam and Patel veer o! sharply from other measure-ments at wavelengths below & 500 nm. Unlike all the other experimenters, who use glass
6

or quartz containers, the cell used by Tam and Patel was stainless steel. This degradationof a factor of two or more in the attenuation length is attributed dissolved ions in the steel,although no detailed tests of this are available.
Some detailed tests have been carried out on the e!ect of high purity water on photo-multiplier tube glass [20, 21] in the context of the DIRC [8] apparatus for BaBar. Of the11,000 photomultiplier tubes submerged in water for ten years, only ! 50 were a!ected byrapid corrosion. There is empirical proof that corrosion in this particular borosilicate glassoccurs at high rate when the glass has no Zn content.
3 Engineering considerations
3.1 Water volume and flow rate
The far site pool is 10 $ 16 $ 16 = 2560 m3 (680,000 gallons) and the two near pools are10 $ 10 $ 16 = 1600 m3 (423,000 gallons) each. We specify that the large pool must befillable in two weeks, giving a flow rate from the central fill/makeup system of 33.5 gallonsper minute (gpm).
We can estimate a necessary recirculation rate, assuming that the main contaminant isstainless steel which contaminates the otherwise pure water by contributing dissolved ionswhich absorb in the blue [10, 12, 19]. (See Sec. 2.4.) The idea is to compare flow rates basedon the surface-to-volume ratio (SVR) of water vessels [19].1
First consider Super-K [3] (see also Sec. A.2) which achieved very large attenuationlengths despite having a water volume contained by stainless steel. The tank is 39 m indiameter and 42 m high, so SVR=0.17/m. (This is very large compared to the cell used byTam and Patel [19] which showed significant contamination, with SVR=350/m.) The watervolume in Super-K was recirculated once every 71 days. (See Table 1.)
Now consider the large pool in the far hall. The water volume is 2560 m3. Let the (four)antineutrino detectors (AD’s) be 5 m diameter cylinders, 5 m high. Then, their own volumeis 4 $ 98 ! 400 m3 and their surface area is 4 $ 118 ! 500 m2. This gives SVR! 0.2/m,about the same as Super-K, although Laur estimates an additional surface area of aboutthe same amount from 5 cm wide stainless steel bars every 2 m in both directions on boththe inner and outer liners. So, we take SVR=0.4/m for the large pool. Our current design(Fig. 1) for the water system circulates 17 gpm through the (side stream) polishing loop,thus turning over the entire water volume once every 24 days. Thus, with twice the SVR ofSuper-K, we recirculate more than twice as often.
Of course, it is worth checking to see if the a!ect contamination on the attenuation lengthcorrectly scales up from test cells to SuperK, but fortunately Ed Fry [19] has done this for us.The change in absorption coe#cient should be proportional to the change in impurity con-centration. If C is the density of impurities, and & is the rate at which impurities are suppliedto the water per unit surface area, then $C = &$t$ SVR. Pope and Fry [12] used a quartzcell with SVR=50/m, and observed a change in absorption coe#cient of 6 $ 10!6/cm·day.
1Thanks to L. Littenberg for first considering this approach.
7

Figure 3: Location and dimensions of the centralized underground water station.
Scaling by SVR imples a change of 6 $ 10!6 $ 0.17/50 = 2 $ 10!8/cm·day for Super-K, ora change by 1.4$ 10!6/cm over one turnover period. This would be imperceptible, given a100 m attenuation length, i.e. an absorption coe#cient of 10!4/cm, i.e. a &1% e!ect.
However, stainless steel is much worse than quartz. If it were 100 times as bad, thenthere would be a factor of two change for Super-K. On the other hand, the water is beingcontinuously cleaned, in fact de-ionized, so this would all appear to hang together.
Our conclusion is, therefore, that the flow rate in the straw man design (Fig. 1) will meetour specification for attenuation length, even in the face of corrosion of the stainless steel,although we likely need to include de-ionization stages in the polishing loop.
3.2 Site wide system layout
The most recent scheme for the water distribution system layout [22], which is now partof the civil construction bid package, is shown in Fig. 3. This includes a centrally locatedpool, aka “Pool Four”, which would contain a volume of water somewhat larger than whatis needed for the far hall. The hall in which it sits would also house a water polishing loop.This leads us to consider three di!erent scenarios for supplying water to the experimentalhalls, and for emptying them:
A Original. The system in Fig. 1 was designed with no “Pool Four” in mind. It supplieswater from some generic source at 35 gpm, which would fill the large pool in about twoweeks. Drawbacks are that much of the cost is borne by this pumping speed, waterneeds to be pumped to the surface for dumping the pools, and every fill will requirepurchasing (and purifying) more water.
8
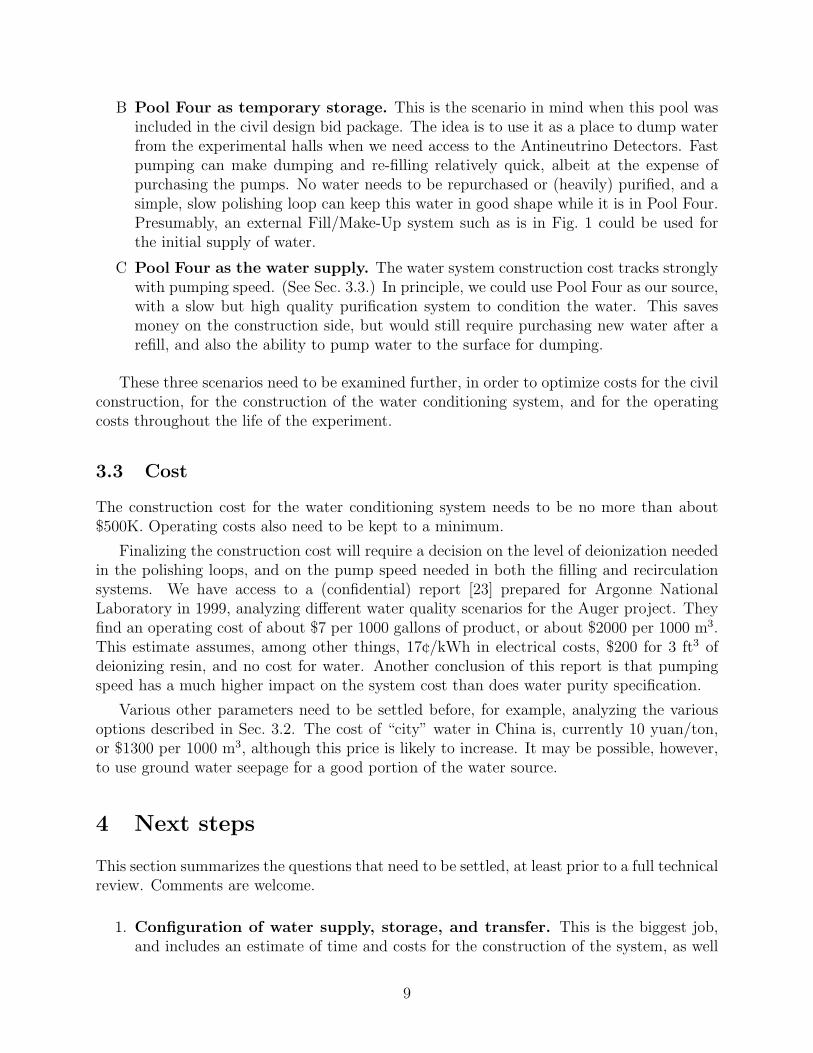
B Pool Four as temporary storage. This is the scenario in mind when this pool wasincluded in the civil design bid package. The idea is to use it as a place to dump waterfrom the experimental halls when we need access to the Antineutrino Detectors. Fastpumping can make dumping and re-filling relatively quick, albeit at the expense ofpurchasing the pumps. No water needs to be repurchased or (heavily) purified, and asimple, slow polishing loop can keep this water in good shape while it is in Pool Four.Presumably, an external Fill/Make-Up system such as is in Fig. 1 could be used forthe initial supply of water.
C Pool Four as the water supply. The water system construction cost tracks stronglywith pumping speed. (See Sec. 3.3.) In principle, we could use Pool Four as our source,with a slow but high quality purification system to condition the water. This savesmoney on the construction side, but would still require purchasing new water after arefill, and also the ability to pump water to the surface for dumping.
These three scenarios need to be examined further, in order to optimize costs for the civilconstruction, for the construction of the water conditioning system, and for the operatingcosts throughout the life of the experiment.
3.3 Cost
The construction cost for the water conditioning system needs to be no more than about$500K. Operating costs also need to be kept to a minimum.
Finalizing the construction cost will require a decision on the level of deionization neededin the polishing loops, and on the pump speed needed in both the filling and recirculationsystems. We have access to a (confidential) report [23] prepared for Argonne NationalLaboratory in 1999, analyzing di!erent water quality scenarios for the Auger project. Theyfind an operating cost of about $7 per 1000 gallons of product, or about $2000 per 1000 m3.This estimate assumes, among other things, 17¢/kWh in electrical costs, $200 for 3 ft3 ofdeionizing resin, and no cost for water. Another conclusion of this report is that pumpingspeed has a much higher impact on the system cost than does water purity specification.
Various other parameters need to be settled before, for example, analyzing the variousoptions described in Sec. 3.2. The cost of “city” water in China is, currently 10 yuan/ton,or $1300 per 1000 m3, although this price is likely to increase. It may be possible, however,to use ground water seepage for a good portion of the water source.
4 Next steps
This section summarizes the questions that need to be settled, at least prior to a full technicalreview. Comments are welcome.
1. Configuration of water supply, storage, and transfer. This is the biggest job,and includes an estimate of time and costs for the construction of the system, as well
9
as operating costs. What is the best way to use “Pool Four”, assuming that it is in factconstructed? (See Sec. 3.2.) What is the best material to use for the transfer piping?(One possibility is to use Polyvinylidene Difluoride (PVDF), a highly non-reactivepolymer, also known as KYNAR or HYLAR, although the costs and availability arenot yet known.)
2. Resistivity and attenuation length. It is becoming clear (i.e., see Table. 1 andSec. 2.1) that the water needs to be deionized to at least some level in order to achieveour specification for attenuation length. Test to establish this correspondence are goingon now at BNL and at IHEP. After this is established, suitable deionization stages needto be built into the polishing loops in Fig. 1.
3. Temperature specification between halls. We should establish some specificationfor the di!erence in detector temperatures between the near and far halls. Thereseems to be plenty of capacity for bringing the water pools into equilibrium with thesurrounding rock in a reasonable time period. (See Sec. 2.3.) However, there is likelya di!erence in the ambient rock temperature between the near and far halls, and weshould be confident that we can live with this di!erence, or prepare to otherwise heator cool one or more of the pools accordingly.
A Systems from other experiments
A.1 The IMB Experiment
The IMB proton decay experiment [1, 2] consisted of 8000 m3 of water. Figure 4 shows thewater purification system. The primary system takes municipal water an filters it down toabout 10 µm, followed by carbon filters for organics and chlorine, and then water softenersto remove magnesium and calcium salts. This is then taken through a reverse osmosis (RO)system where particles larger than 0.001 µm are removed. Next is a degassification stage,followed by a UV sterilizer, and finally a 1 µm filter. The system runs at 5 liters per second,i.e. 80 gpm, or 20 days to recirculate one complete volume. The result after recirculation isless than 0.3 ppm of dissolved solids. A parallel circulation system using only 5 µm filters,runs at 13 liters per second.
A.2 Super-Kamiokande
Super-Kamiokande [3], aka “SuperK”, is a 50,000 m3 water Cherenkov detector used for,among other things, few-MeV electron detection from solar neutrino events. This apparatusplaces extremely stringent limits on virtually all physical parameters.
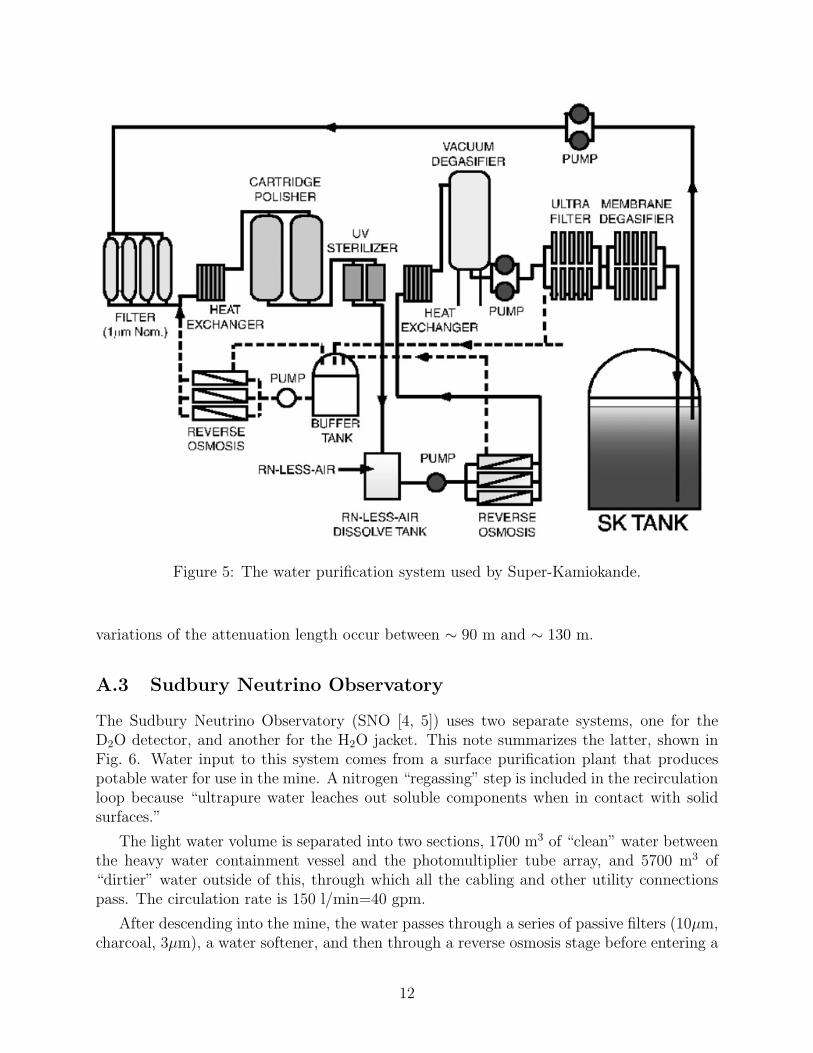
Figure 5 shows the system devised by SuperK. This apparatus circulates 30 tons ofwater per hour (132 gpm). Raw water passes through the “first step” (particulate filters andReverse Osmosis stages) before going on to a closed loop with more aggressive removal stages,which apparently have expendable but expensive components. It is the clear from their paper
10

Figure 4: The water purification system used by IMB.
that the system was augmented and upgraded over time, by adding and exchanging variouscomponents in the loop.
Water from an external supply is first passed through the 1µm filter to remove dustand particulates. Heat exchangers reduce the water temperature to about 13"C to suppressbacteria growth and phototube noise. A UV sterilizer between the heat exchangers killssurviving bacteria.
Ions are removed by a cartridge polisher. This replaced an ion exchanger which turnedout to be a source of radon. The water resistivity went from 11M"-cm before the polisher,to 18.24M"-cm afterwards. Wikipedia tells me that the theoretical maximum resistivity at25"C is 18.2M"-cm.
A series of aggressive degasification steps follow, including the introduction of radon-reduced air (from a separate air purification system) to assist in further radon removal.Radon removal e#ciency is about 83%. Residual radioactivity from radon is a few$10!3
decays/m3 or less. The “dissolved solids” fraction appears to be extremely small, namely six' 2 µm particles per cubic centimeter, or 25$ 10!9ppm.
SuperK paid careful attention to the light attenuation in the water tank. At 420 nm,they demonstrate an attenuation length of 97.9 ± 3.5 m. For di!erent wavelengths, theyobserve a dependence consistent with that shown in Fig. 2. Over years of running, steady
11
and provide a possible radon source inside theSuper-Kamiokande detector.
The heat exchanger is used to cool the water toreduce PMT dark noise levels, and suppressgrowth of bacteria, which also reduce watertransparency. Surviving bacteria are killed by theUV sterilizer stage. Typical water temperaturesbefore the first heat exchanger and after the secondheat exchanger are 14.2!C and 12.9!C, respectively.
A cartridge polisher (CP) eliminates heavy ionswhich also reduce water transparency and includeradioactive species. The amount of CP resin usedis 1500L. Originally, an ion-exchanger (IE)column was included in the water purificationsystem. However it was found that the IEresin was a significant radon source and it wasremoved.
The typical resistivity of the recirculating inputwater (i.e., water flowing from the Super-Kamio-kande tank to the water purification system) is11MO cm. After the CP module the resistivity ofthe water is 18.24MO cm, approaching the chemi-cal limit.
A RO system, and a tank to dissolve Rn-reduced air (see following Section) into the water,were installed in March 1999. The RO stepremoves additional particulates. The introductionof Rn-reduced air into the water increases radon
removal efficiency in the vacuum degasifier (VD)stage which follows.
A VD removes dissolved gases in the water. Itconsists of a cylindrical stainless steel vessel and avacuum pump (16Torr, 410m3 h"1, 11 kW). Thevessel is 1.4m in diameter and 4.5m in height.Radon gas dissolved in water is a serious back-ground event source for solar neutrinos in theMeV energy range, while dissolved oxygen en-courages growth of bacteria in the water. Thetypical concentration of the dissolved oxygen afterthe VD is 0.06mgL"1. The removal efficiency forradon gas is estimated to be about 96%.
The ultra filter (UF) consists of hollow fibermembrane filters. The minimum particle sizewhich the UF can remove corresponds to mole-cular weight approximately 10,000 (or about10 nm diameter). The typical number of particlesof size greater than 0.2 mm in the water before thepurification system is 1000 particles/cc; this isreduced to 6 particles/cc after purification.
A membrane degasifier (MD) also removesradon dissolved in water. It is made of 30 hollowfiber membrane modules and a vacuum pump. Aflow rate of 30Lmin"1 of Rn-reduced air from theair purification system is supplied to the MDsystem as purge gas. The typical pressure in theMD system is 2.6 kPa. The typical concentration
Fig. 22. A schematic view of the water purification system.
S. Fukuda et al. / Nuclear Instruments and Methods in Physics Research A 501 (2003) 418–462 443
Figure 5: The water purification system used by Super-Kamiokande.
variations of the attenuation length occur between & 90 m and & 130 m.
A.3 Sudbury Neutrino Observatory
The Sudbury Neutrino Observatory (SNO [4, 5]) uses two separate systems, one for theD2O detector, and another for the H2O jacket. This note summarizes the latter, shown inFig. 6. Water input to this system comes from a surface purification plant that producespotable water for use in the mine. A nitrogen “regassing” step is included in the recirculationloop because “ultrapure water leaches out soluble components when in contact with solidsurfaces.”
The light water volume is separated into two sections, 1700 m3 of “clean” water betweenthe heavy water containment vessel and the photomultiplier tube array, and 5700 m3 of“dirtier” water outside of this, through which all the cabling and other utility connectionspass. The circulation rate is 150 l/min=40 gpm.
After descending into the mine, the water passes through a series of passive filters (10µm,charcoal, 3µm), a water softener, and then through a reverse osmosis stage before entering a
12
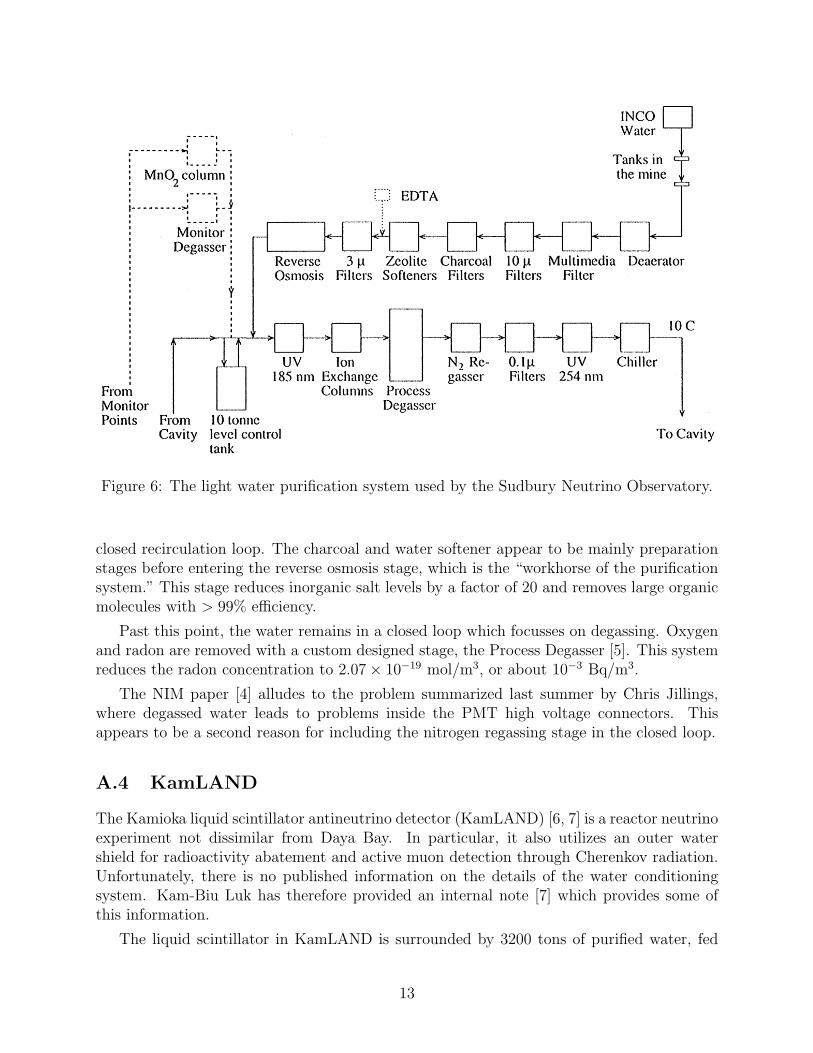
Fig. 3. The light-water system.
cooled before it is put into the detector. Ultrapurewater leaches out soluble components when in con-tact with solid surfaces. It may also support biolo-gical activity on such surfaces or on suspendedparticles. The H
!O is therefore deoxygenated and
continuously circulated to remove ions, organicsand suspended solids. Both liquids are also assayedcontinuously to monitor radioactive contaminants.
Incoming potable water contains sand and siltparticles, bacteria, algae, inorganic salts, organicmolecules and gasses (N
!, O
!, CO
!, Rn, etc.).
After falling a total of 6800 ft, the water is super-saturated with air, so "rst it enters a deaerator tank(see Fig. 3) where it spends a few minutes so thatsome of the dissolved O
!and N
!comes out. It then
passes into a multimedia "lter consisting of a bed ofsand and charcoal to remove large particles fol-lowed by a 10-!m "lter to remove "ne particles.The water then enters the laboratory water utilityroom. A charcoal "lter is used to reduce the levelsof organic contaminants and to convert free chlor-ine into chloride since chlorine would damage thereverse osmosis (RO) unit further downstream.
After the charcoal "lter, the water passes intosofteners consisting of two 0.14 m" bottles contain-ing strong-base Purolite C100-E cation exchangeresin. Here divalent ions such as Ca and Mg areexchanged for Na ions. The softeners also remove
iron and stabilize colloidal particles so theydo not coagulate when concentrated by the ROmembranes.
A 9.1% solution of sodium ethylene diaminetetraacetate (EDTA) and sodium bisulfate is in-jected at 9 ml/min to complex various ion species(e.g., Al) and to reduce O and Cl into a form thatcan be rejected by the RO. Then two "lter units,each containing twelve 25 cm long, 3 !m "lters,remove suspended particles. A silt density indextest is done at this point on the running system.
The reverse-osmosis process is the workhorse ofthe puri"cation system. Twelve spiral-wound thin"lm composite (polyamide on polysulfone) mem-branes each 5.6 m! in area reduce inorganic saltlevels by a factor of at least 20 and reduce organicsand hence the EDTA and particles larger thanmolecular weight 200 with greater than 99% e$-ciency. The RO performance is monitored onlineby percentage rejection (typically 97.5%) and con-ductivity monitors. After the detector is full the ROdoes not have to be used again unless SNO requiressubstantial amounts of make-up water in thedetector.
After the RO, the water enters a 185 nm UV unitconsisting of mercury lamps and quartz sleeveswhere any remaining organic compounds are bro-ken apart into ionic form. The water next goes to
177J. Boger et al. / Nuclear Instruments and Methods in Physics Research A 449 (2000) 172}207
Figure 6: The light water purification system used by the Sudbury Neutrino Observatory.
closed recirculation loop. The charcoal and water softener appear to be mainly preparationstages before entering the reverse osmosis stage, which is the “workhorse of the purificationsystem.” This stage reduces inorganic salt levels by a factor of 20 and removes large organicmolecules with > 99% e#ciency.
Past this point, the water remains in a closed loop which focusses on degassing. Oxygenand radon are removed with a custom designed stage, the Process Degasser [5]. This systemreduces the radon concentration to 2.07$ 10!19 mol/m3, or about 10!3 Bq/m3.
The NIM paper [4] alludes to the problem summarized last summer by Chris Jillings,where degassed water leads to problems inside the PMT high voltage connectors. Thisappears to be a second reason for including the nitrogen regassing stage in the closed loop.
A.4 KamLAND
The Kamioka liquid scintillator antineutrino detector (KamLAND) [6, 7] is a reactor neutrinoexperiment not dissimilar from Daya Bay. In particular, it also utilizes an outer watershield for radioactivity abatement and active muon detection through Cherenkov radiation.Unfortunately, there is no published information on the details of the water conditioningsystem. Kam-Biu Luk has therefore provided an internal note [7] which provides some ofthis information.
The liquid scintillator in KamLAND is surrounded by 3200 tons of purified water, fed
13
by ground water which passes through a conditioning system. The radon concentration inthe native water is 104Bq/m3, and is not removed. (The size of the active region makes itpossible to live with a rather high level of radon activity.) The circulation rate is 8000 tonsper hour, or 35 gpm.
The conditioning system consists of two filtering stages, one at 10µm and the second at1µm, followed by two reverse osmosis membranes, and then by an ultraviolet sterilizer. Theelectrical conductivity of the water is 0.5 M"cm. A cartridge polisher with ion-exchangeresins was located downstream of the reverse osmosis stage, but was not used for shieldwater purification.
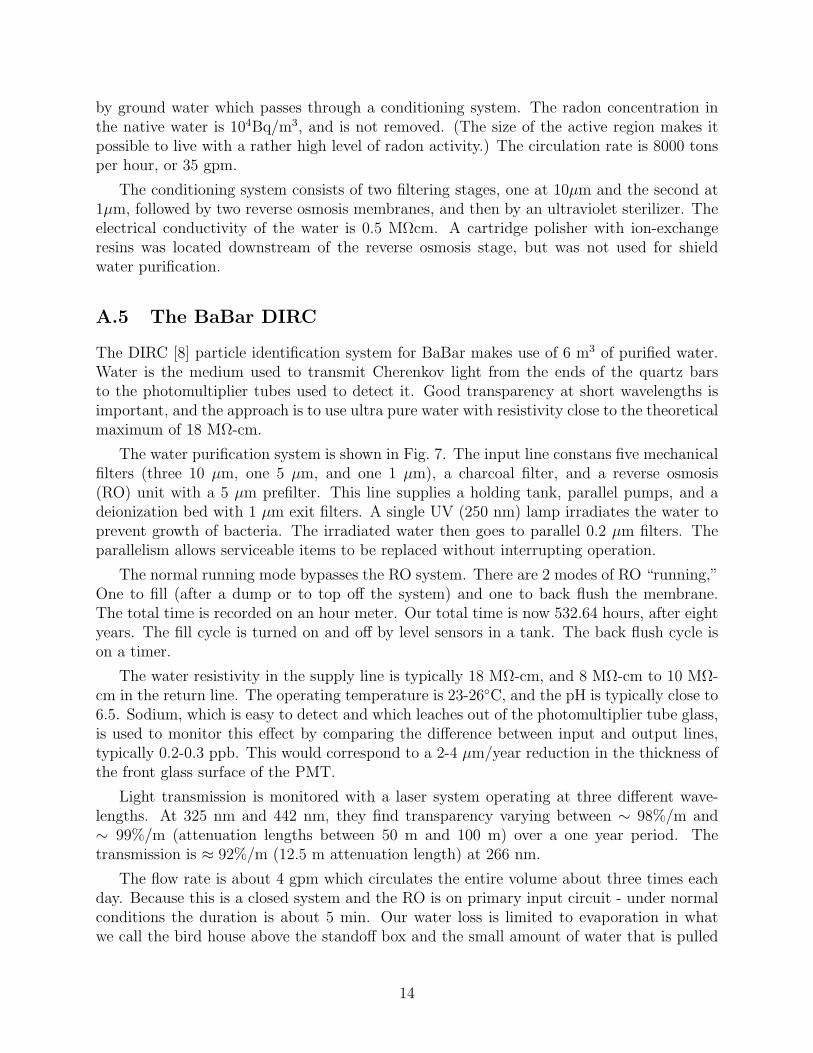
A.5 The BaBar DIRC
The DIRC [8] particle identification system for BaBar makes use of 6 m3 of purified water.Water is the medium used to transmit Cherenkov light from the ends of the quartz barsto the photomultiplier tubes used to detect it. Good transparency at short wavelengths isimportant, and the approach is to use ultra pure water with resistivity close to the theoreticalmaximum of 18 M"-cm.
The water purification system is shown in Fig. 7. The input line constans five mechanicalfilters (three 10 µm, one 5 µm, and one 1 µm), a charcoal filter, and a reverse osmosis(RO) unit with a 5 µm prefilter. This line supplies a holding tank, parallel pumps, and adeionization bed with 1 µm exit filters. A single UV (250 nm) lamp irradiates the water toprevent growth of bacteria. The irradiated water then goes to parallel 0.2 µm filters. Theparallelism allows serviceable items to be replaced without interrupting operation.
The normal running mode bypasses the RO system. There are 2 modes of RO “running,”One to fill (after a dump or to top o! the system) and one to back flush the membrane.The total time is recorded on an hour meter. Our total time is now 532.64 hours, after eightyears. The fill cycle is turned on and o! by level sensors in a tank. The back flush cycle ison a timer.
The water resistivity in the supply line is typically 18 M"-cm, and 8 M"-cm to 10 M"-cm in the return line. The operating temperature is 23-26"C, and the pH is typically close to6.5. Sodium, which is easy to detect and which leaches out of the photomultiplier tube glass,is used to monitor this e!ect by comparing the di!erence between input and output lines,typically 0.2-0.3 ppb. This would correspond to a 2-4 µm/year reduction in the thickness ofthe front glass surface of the PMT.
Light transmission is monitored with a laser system operating at three di!erent wave-lengths. At 325 nm and 442 nm, they find transparency varying between & 98%/m and& 99%/m (attenuation lengths between 50 m and 100 m) over a one year period. Thetransmission is ! 92%/m (12.5 m attenuation length) at 266 nm.
The flow rate is about 4 gpm which circulates the entire volume about three times eachday. Because this is a closed system and the RO is on primary input circuit - under normalconditions the duration is about 5 min. Our water loss is limited to evaporation in whatwe call the bird house above the stando! box and the small amount of water that is pulled
14
errors. Fig. 42 shows an example of such measure-ments at 266, 325, and 442 nm. The transmission isbetter than 92% per meter at 266 nm and exceeds98% per meter at 325 and 442nm.
Bacteria levels and water elemental analysis(using the Inductively Coupled Plasma-MassSpectrometry, ICP-MS, method) is performedperiodically by Balazs Analytical Services Com-pany [72]. Table 7 shows typical levels of majorelements among 67 tested. Sodium, which is easyto detect, is a major component of PMT glass andso is used to monitor the leaching rate from thefront glass by comparing the sodium level in thewater return and supply. The typical difference is(0.2–0.3) ppb. Assuming that the leaching occursmainly from the front glass surface, this corre-sponds to a rate of material removal from frontglass of about (2–4) mm/PMT/year. Such a rate isunlikely to lead to a PMT glass implosion duringthe lifetime of the experiment.
Leaks from the water seals between the barboxes and the SOB are detected by the systemdescribed in Section 7.1, and by the water height inthe SOB, which is monitored by measuring thehydrostatic pressure. Should a water leak bedetected, a valve in a 100mm diameter drain lineis opened, and the entire water content of the SOBis drained in about 12min.All elements inside the SOB (PMT, plastic PMT
housing, gaskets, light-catchers) were tested atnormal and elevated temperatures for their abilityto withstand the highly corrosive action of ultra-pure water and to not cause pollution.
7.3. Environmental monitoring system
The DIRC environmental monitoring system isdivided into three parts, corresponding to threeseparate tasks. The first deals with the control andmonitoring of the HV system for the PMTs. The
ARTICLE IN PRESS
Fig. 40. DIRC water purification system.
I. Adam et al. / Nuclear Instruments and Methods in Physics Research A 538 (2005) 281–357332
Figure 7: The water conditioning system for the DIRC apparatus of the BaBar experiment.
through the de-gassing membrane and the larger amounts necessary to purge the system attime of taking water samples for analysis. Depending on these factors frequency is aboutfour to eight times per year.
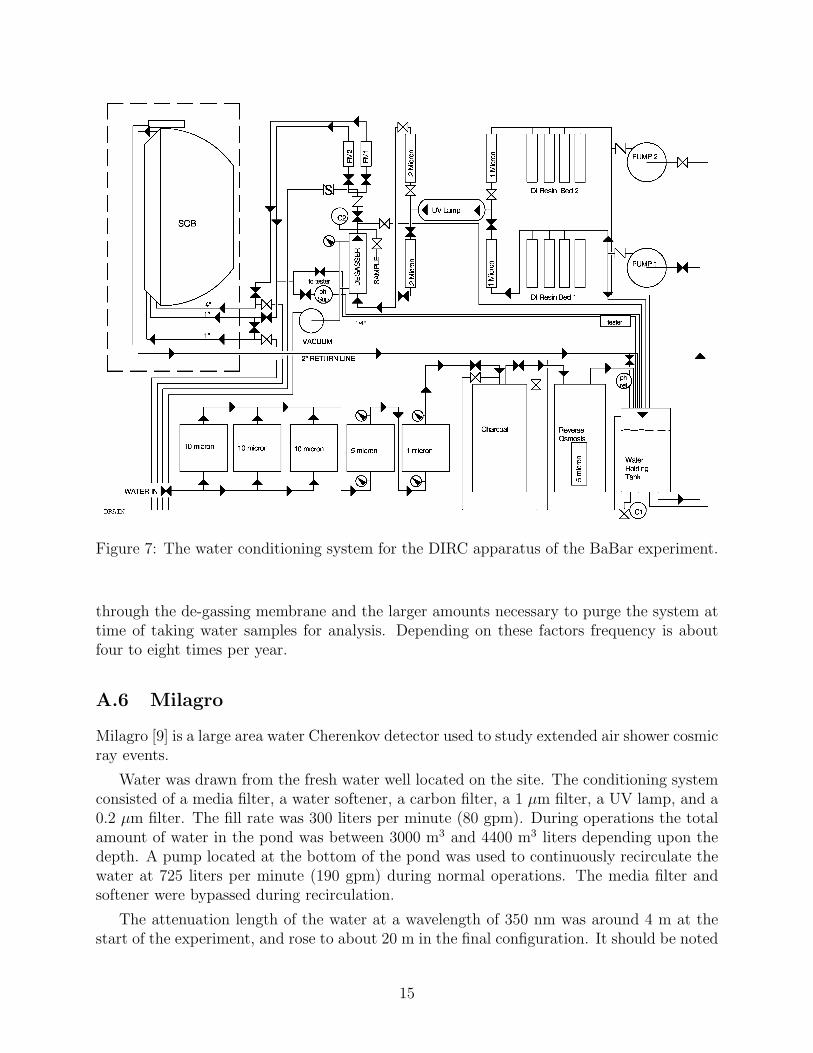
A.6 Milagro
Milagro [9] is a large area water Cherenkov detector used to study extended air shower cosmicray events.
Water was drawn from the fresh water well located on the site. The conditioning systemconsisted of a media filter, a water softener, a carbon filter, a 1 µm filter, a UV lamp, and a0.2 µm filter. The fill rate was 300 liters per minute (80 gpm). During operations the totalamount of water in the pond was between 3000 m3 and 4400 m3 liters depending upon thedepth. A pump located at the bottom of the pond was used to continuously recirculate thewater at 725 liters per minute (190 gpm) during normal operations. The media filter andsoftener were bypassed during recirculation.
The attenuation length of the water at a wavelength of 350 nm was around 4 m at thestart of the experiment, and rose to about 20 m in the final configuration. It should be noted
15
that the measured attenuation length includes both absorption and scattering of the light.
References
[1] R. Becker-Szendy et al. IMB-3: A Large water Cherenkov detector for nucleon decayand neutrino interactions. Nucl. Instrum. Meth., A324:363–382, 1993.
[2] George William Foster. An experimental limit on proton decay: p# e+"0. PhD thesis,Harvard University, 1983.
[3] Y. Fukuda et al. The Super-Kamiokande detector. Nucl. Instrum. Meth., A501:418–462,2003.
[4] J. Boger et al. The Sudbury Neutrino Observatory. Nucl. Instrum. Meth., A449:172–207, 2000.
[5] Alan Dekok. Process degassification for SNO and radon removal. MSc Thesis, CareltonUniversity (1996) and private communication.
[6] F. Suekane. KamLAND. Prog. Part. Nucl. Phys., 57:106–126, 2006.
[7] Kam-Biu Luk. A short note on the water purification system of KamLAND. DYB-doc-480-v1, 2006.
[8] I. Adam et al. The DIRC particle identification system for the BaBar experiment. Nucl.Instrum. Meth., A538:281–357, 2005.
[9] Robert W. Atkins et al. Milagrito, a TeV air-shower array. Nucl. Instrum. Meth.,A449:478–499, 2000.
[10] Frank M. Sogandares and Edward S. Fry. Absorption spectrum (340-640 nm) of purewater. I. Photothermal measurements. Applied Optics, 36:8699–8709, 1997.
[11] H.C. van de Hulst. Light Scattering by Small Particles. Dover Publications, 1981.
[12] Robin M. Pope and Edward S. Fry. Absorption spectrum (380-700 nm) of pure water.II. Integrating cavity measurements. Applied Optics, 36:8710–8723, 1997.
[13] Harald Enge. Introduction to Nuclear Physics. Addison-Wesley, 1966.
[14] Decay chain [of radioactive isotopes]. http://en.wikipedia.org/wiki/Decay chain.
[15] Lederer, Hollander, and Perlman. Table of Isotopes, Sixth Edition. John Wiley andSons, 1967.
[16] Bob McKeown. Thermal properties of water pool. DYB-doc-741-v1, 2007.
16
[17] Alexandra Navrotsky. Thermodynamic properties of minerals. In Thomas J. Ahrens,editor, AGU Reference Shelf 2: Mineral Physics and Crystallography, pages 18–28.American Geophysical Union, 1995.
[18] Christoph Clauser and Ernst Huenges. Thermal conductivity of rocks and minerals. InThomas J. Ahrens, editor, AGU Reference Shelf 3: Rock Physics and Phase Relations,pages 105–126. American Geophysical Union, 1995.
[19] Edward S. Fry. Private communication, 2007.
[20] P. Bourgeois and Jaroslav Va’vra. Corrosion of glass windows in DIRC PMTs. Unpub-lished, 2001. SLAC-PUB-8877.
[21] R. Aleksan et al. Ageing of the DIRC phototubes in ultra pure water. Unpublished,2000. DAPNIA-00-10.
[22] Changgen Yang. Water purification system arrangement. DYB-doc-1092-v1, 2007.
[23] Paul Jackowski. Purified Water Quality Study (for Hal Spinka, ANL, re Auger). Techni-cal report, Oak Grove Technologies, Inc., 975 Campus Dr., Mundelein, IL 60060, 1999.Number GAP-99-046.
17