volume 81, number 3, 2015 colorado 2015 midyear · pdf filecolorado department of labor and...
TRANSCRIPT
COLORADO BUSINESS REVIEW 1
U N I V E R S I T Y O F C O L O R A D O B O U L D E R L E E D S S C H O O L O F B U S I N E S S
A publication of the Business Research DivisionVolume 81, Number 3, 2015
IN THIS ISSUE
2015 midyear Colorado economic update
List of roundtable meeting participants
PAGE 1
PAGE 10
Colorado 2015 Midyear Economic Update Sector Highlights
Richard Wobbekind
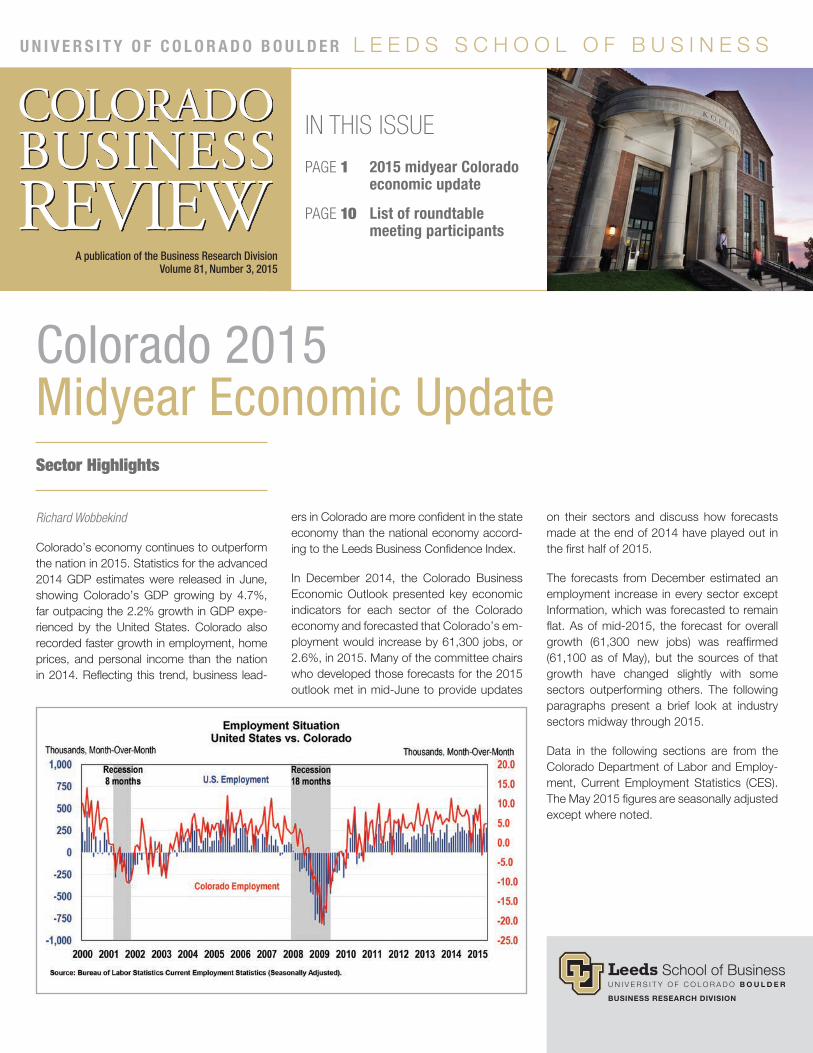
Colorado’s economy continues to outperform the nation in 2015. Statistics for the advanced 2014 GDP estimates were released in June, showing Colorado’s GDP growing by 4.7%, far outpacing the 2.2% growth in GDP expe-rienced by the United States. Colorado also recorded faster growth in employment, home prices, and personal income than the nation in 2014. Reflecting this trend, business lead-
ers in Colorado are more confident in the state economy than the national economy accord-ing to the Leeds Business Confidence Index.
In December 2014, the Colorado Business Economic Outlook presented key economic indicators for each sector of the Colorado economy and forecasted that Colorado’s em-ployment would increase by 61,300 jobs, or 2.6%, in 2015. Many of the committee chairs who developed those forecasts for the 2015 outlook met in mid-June to provide updates
on their sectors and discuss how forecasts made at the end of 2014 have played out in the first half of 2015.
The forecasts from December estimated an employment increase in every sector except Information, which was forecasted to remain flat. As of mid-2015, the forecast for overall growth (61,300 new jobs) was reaffirmed (61,100 as of May), but the sources of that growth have changed slightly with some sectors outperforming others. The following paragraphs present a brief look at industry sectors midway through 2015.
Data in the following sections are from the Colorado Department of Labor and Employ-ment, Current Employment Statistics (CES). The May 2015 figures are seasonally adjusted except where noted.

COLORADO BUSINESS REVIEW 2
The Colorado economy is reviewed
midway through the year in this
issue. The information presented
is compiled from remarks made
by Colorado Business Economic
Outlook Estimating Group chairs or
their representatives at a roundtable
meeting held in mid-June and
from follow-up correspondence.
Industry sector summaries include
comparisons of the current situation
to the forecast presented last
December. Key factors influencing
recent economic trends are
also noted.
We greatly appreciate the time
and input from the individuals who
contributed to this update; their
names are listed on page 10. I also
wish to acknowledge that the BRD
research staff collected data and
conducted additional analysis for this
issue.
FIFTY-FIRST ANNUAL COLORADO FORECAST
2016 Colorado Business Economic Outlook Forum— Save the Date
Mark your calendar to attend the
2016 Colorado Business Economic
Outlook Forum on December 7 at
the Grand Hyatt Denver. Check
leeds.colorado.edu/brd for
event updates.
We are interested in your suggestions
for topics for upcoming issues. Please
contact me directly at 303-492-1147.
—Richard Wobbekind
From the editor
Population and Employment
According to the State Demography Office, Colorado’s population reached 5.35 million in 2014, an 82,485 net gain from 2013. Natural increase (births minus deaths) was respon-sible for 31,707 persons while net migration contributed 50,778. In 2014, Colorado was the 4th-fastest growing state in terms of per-cent change, at 1.6%, and 8th in total growth. Colorado was 22nd in total population overall. Colorado’s top five fastest-growing counties in absolute terms from 2013 to 2014 were Denver, Arapahoe, Adams, Douglas, and El Paso. In percentage change, the five fast-est-growing counties were Crowley, Gilpin, Broomfield, Douglas, and San Juan. Weld and Larimer counties were still in top 10 Colo-rado counties for population growth in both percentage and absolute terms, continuing their strong population growth trends. In fact, only a few Front Range counties declined in population. From 2013 to 2014, 23 counties in the state lost population—approximately 2,900 people in total. Some of these losses can be attributed to a decline in prison popu-lations and a slow recovery from the reces-sion in the mountain counties. Thirty-nine counties experienced total net out-migration from 2010 through 2013. Deaths outweighing births in select rural counties have also con-tributed to these losses.
Colorado gained almost 33,000 households (occupied housing units) between 2013 and 2014. This compares to a gain of 19,104 hous-ing units. The total number of housing units per household is down to 1.08 from a high of 1.15 in 2007 (this includes second homes).
Total covered employment in Colorado rose 2.5% year-over-year in May 2015. According to the Bu-reau of Labor Statistics, all of the Colorado metro-politan statistical areas (MSAs) experienced employ-ment growth year-over-year in May 2015 with the largest increases in Greeley (5.1%), Denver-Aurora-Broomfield (3%), and Fort Collins (2.4%). Colorado’s unemployment rate in May 2015 was 4.3% while the civilian labor totaled 2.5 million, a 2.6% increase ac-cording to the Bureau of Labor Statistics.
According to a May press release by the Colorado Department of Labor and Employment, December 2014 estimates are expected to be revised up by seven-tenths of a percentage point, and October and November 2014 estimates are expected to be revised up by about five-tenths and four-tenths of a percentage point, respectively. Industry sectors ex-pected to undergo the greatest upward revisions to payroll jobs estimates in the fourth quarter include Government (5,700); Trade, Transportation, and Utilities (4,600); Professional and Business Services (4,200); and Other Services (1,900). The industry sectors expected to undergo a downward revision to payroll jobs estimates in the fourth quarter are Lei-sure and Hospitality (1,000) and Construction (900).

COLORADO BUSINESS REVIEW 3
Agriculture
Colorado has had a great deal of rain in the first half of 2015, and this is good news for ranchers who continue to rebuild their herds after sell-offs due to several years of drought. Pasture land for grazing will be abundant, and ranchers will not have to buy as much expensive feed to supplement grass. As projected in the Decem-ber forecast, ranchers are holding back cattle for breeding purposes, so prices for slaughter cattle and beef remain high—higher than last year—and well above the five-year average. However, feed costs are lower because of rain-fall and lower corn and wheat prices, so profits will remain high in the beef sector. Ranchers who sold off their entire herds will have to invest considerable funds to buy back breeding stock due to the high prices.
The possible wild card for the beef industry is the ongoing Country of Origin Labeling (COOL) dispute filed by Canada and Mexico with the World Trade Organization (WTO). COOL re-quires that U.S. retailers identify the origin of numerous products, including meats, and was determined to be inconsistent with U.S. obliga-tions to the WTO relating to Technical Barriers to Trade. The United States has exhausted its appeals, and Canada and Mexico have officially requested WTO permission to imple-ment retaliatory measures against the United States. This could put more than $350 million in Colorado beef exports at risk. The possible retaliation would drop demand at local meat processing facilities and soften prices paid to producers.
Although the spring rains brought benefi-cial moisture, the rain also increased disease
pressure in wheat and delayed planting corn. Wheat bushels harvested are expected to re-main about the same as last year, and farmers will receive lower prices because of increased production in the United States in both 2014 and 2015. Corn acres are anticipated to be about the same or down slightly as farmers face lower prices—lower than the cost of pro-duction in some cases. Prices have dropped to levels not seen since 2010 because of in-creased U.S. production. Continued rains have delayed and, in some cases, prevented the planting of corn. It may be too late for some farmers, so they will plant later crops, such as millet and sorghum. It was projected that corn prices would rebound slightly and that has yet to happen since the crop will not be harvested until this fall. Wheat prices are expected to con-tinue to decline.
Milk prices are well under last year’s prices, but dairy producers’ lower prices are somewhat
offset by lower feed costs due to the greater supply of corn. High milk prices drove expan-sion and herd additions, and now the milk sup-ply from the larger herd is entering the market and lowering prices.
Fruit crops on the Western Slope, such as cherries, peaches, and wine grapes, are gen-erally in better condition than in the last sev-eral years. Most areas did not experience any spring freezes.
Colorado egg producers are seeing wholesale prices nearly double those of last year because of avian flu in other states. Some Colorado eggs are being shipped to areas with shortfalls. Egg-laying hens in the United States total ap-proximately 305 million, and 35 million hens, or 12% of the flock, have been lost to avian flu this year. Colorado egg producers have increased biosecurity to protect against an outbreak.
The potato crop will be about the same as last year as prices are still somewhat depressed, which does not encourage additional planting. The San Luis Valley, where most of Colorado’s potatoes are grown, did not receive as much snow as needed to supply irrigation and rebuild aquifers, so farmers continue to work on ways to reduce water use.
Colorado ag exports were down about 1% through Q1 2015, but April numbers have ex-ports remaining steady at last year’s levels.
The majority of this industry is not covered by unemployment insurance as most farms are sole proprietorships; thus the employment data from these establishments do not show up on the Bureau of Labor Statistics and other sites due to the fact that they only represent covered employees.
Photo courtesy of Jill Lambert

COLORADO BUSINESS REVIEW 4
Natural Resources and Mining
Construction
The Natural Resources and Mining Sector comprises establishments that mine naturally occurring mineral solids, like coal; liquid min-erals, such as crude petroleum; and natural gases, for example, coalbed methane. This sector has the largest production growth and GDP growth of all industries in Colorado and has been integral to the state’s post-re-cession recovery. The sector accounted for 34,500 jobs in May 2015, which is only 1.4% of Colorado’s total employment; however, these jobs tend to pay approximately 68% above the average pay in Colorado. Natural gas and oil are currently the most significant products of this sector. This sector has loca-tion quotient of 2.1.
The Natural Resources and Mining Sector continues to experience strong growth, in-creasing 10.8% in 2014. As of May 2015, Natural Resources and Mining remains below the committee’s projection of 36,000 jobs, at 34,500 jobs. Job growth in this sector has been affected by the continued low price of oil and natural gas. Additionally, a signifi-cant potential for job loss facing the sector is the possible closure of the Colowyo Mine in Meeker, Colorado, due to a permit issue. If the mine closes, 171 miners would lose jobs, as well as administrators and others associ-ated with the facility.
According to the Colorado Oil and Gas Con-servation Commission, Colorado saw a re-cord production of 94.4 million barrels of oil in 2014. Oil’s value to the Colorado economy stayed ahead of the value of natural gas in 2014: natural gas’ production value was ap-proximately $6.9 billion, compared to oil’s production value of roughly $8.7 billion. This reversal is thought to be caused by the mo-mentous gains in total oil production, increas-ing by approximately 30 million barrels from 2013 to 2014.
In 2014, drilling permits totaled 4,190, up 165 permits from the 2013 number. However, April 2015 year-to-date permit approvals are down 17.2% from 1,175 in 2014 to 973 in 2015. The committee expects oil and natu-ral gas production to be up between 10 and 20% in 2015 despite a 41.3% year-over-year reduction in the rig count as of April 2015.
Coal production in Colorado continues to de-cline, falling to 23.0 million tons in 2014 from 24.3 million in 2013. Behind the drop in coal
production is public utilities’ movement from coal to other cleaner forms of power (i.e., nat-ural gas) in an effort to meet federal regula-tions. In particular, the Tennessee Valley Au-thority, the largest public utility in the United States, is shifting its coal supply to cheaper Wyoming and Illinois coal. It is letting its Colo-rado contracts expire while also reducing the use of coal power plants. In Colorado, the Clean Air–Clean Jobs Act limits coal use via emissions control, which makes companies hesitant to invest in coal energy so they are letting coal-sourced power purchase agree-ments expire without renewal. Additionally, continuing pressure from the EPA to further reduce coal emissions and use, and the dif-ficulty in exporting coal to other nations, have further discouraged coal mining.
Natural Resources and Mining has been a significant driver of Colorado’s growth and economic recovery since the recession. The committee expects the industry to remain stable, with potential for growth. The price of oil is the key factor to the industry’s perfor-mance, and OPEC’s recent decision to not cut production will keep prices low. OPEC listed global “price stability” as one of its goals in the June 2015 biannual meeting, meaning that low prices will persist. This could put smaller oil and gas operators out of business in Colorado.
The construction industry, which consists of firms that engage in the construction of new buildings and engineering projects, as well as subdividing land for sale as building sites, comprises three sectors: residential (e.g., houses, apartments), nonresidential (e.g., retail, medical), and nonbuilding (e.g., water treatment, highway work, infrastructure). The industry has a total of 152,800 jobs, and al-though employment has been growing since the beginning of 2012, the number of jobs still has not reached pre-recession levels. Data from Dodge Construction Analytics suggest the value of total construction fell 2.1% in 2014, weighed down by nonbuilding. How-ever, the value of construction is distorted because the permit value is recorded when the permit is pulled, and the committee sug-gests that construction activity actually grew 12–13% in 2014 when accounting for con-struction that was put in place. As of May 2015, employment is still down 13.6% from the peak construction employment in July 2007. The average weekly wage for 2015 year-to-date is $1,088, a 6.4% increase from the 2014 year-to-date value. The committee expects the industry to grow over the course of 2015 and 2016 as demand continues to rise. There is also a shortage of skilled labor following the recession, which continues to raise the price of construction.
The year-to-date value (May 2015) of total construction in Colorado is 3.6% above the 2014 value. Residential construction in 2015 year-to-date is 6.9% above 2014 levels, non-residential is 3.4% above, and nonbuilding

COLORADO BUSINESS REVIEW 5
Construction Manufacturing
construction is 3.4% below. The work on several major projects in Colorado, such as the VA Hospital in Aurora, roadwork on US 36 and C-470, and the Hines office build-ing, will contribute substantially to the value of construction this year. The committee still supports its forecast of growth in the indus-try, especially in the value of single-family and multifamily dwellings in 2014 and 2015.
The demand is currently high for for-sale homes. Inventory is at its lowest since June 2013, and the number of building permits issued for homes has stayed level in 2015, although the number of new contracts has increased. There are relatively few developed lots available for homebuilding in the Denver Metro area. Builders are finding the best use for these lots is for larger homes, rather than starter units. The change in the market com-position will drive up the value of residential construction. There are concerns regarding a potential rise in interest rates depending on how the Federal Reserve acts. The increase in home prices in 2014 is expected to ex-tend into 2015 as demand grows and supply holds steady.
Nonresidential building is still strong, continu-ing to shift to office and hospitality projects. Hospital construction has slowed in 2014 and 2015, most notably with the VA Hospital in Aurora due to budgetary challenges, but demand for smaller health care projects, such as urgent care centers, continues at a good pace. Hines, an international real estate firm, recently broke ground on its new 40-story Class A office building in downtown Denver, which the Denver Post reports as a $141.3 million project. Retail construction has contin-ued its declining trend and was lower in 2014 compared to 2013.
Colorado’s nonbuilding sector still has sev-eral major ongoing projects, including work on US 36, 6th Avenue bridges, and light rail to Denver International Airport (DIA). More growth is expected as Colorado rebounds strongly from the recession and flood recov-ery has been virtually completed, freeing up companies to work on other projects. The E-Line will soon be completed, connecting DIA to Denver via light rail. C-470 will be adding express lanes, although that project is still in its early stages. Phase I of work on US 36 is all but complete as the newest section of toll lane begins to open and work starts on Phase II. Nonbuilding continues to see new projects, and with increasing property values in Denver and therefore more property tax revenue, local governments may fund new nonbuilding projects.
Manufacturing is a broad category, compris-ing all establishments engaged in the me-chanical, physical, or chemical transformation of materials, substances, or components into new products. Employment in this sector con-tinues to make gains, increasing 2.9% in 2014 and 2.9% year-over-year in 2015 for a total of 139,800 Manufacturing employees in the state. Manufacturing employment surpassed committee estimates by 600 jobs in 2014, and is continuing the trend by adding 2,200 more jobs than projected based on growth rates through May 2015. Higher growth in the durables subsector (3.9%) is offsetting lower growth in nondurable goods (1.2%) so far in 2015 year-over-year. Gains in Manufacturing have now occurred for four and a half consec-utive years following a decade of employment losses. Despite growth in Manufacturing, Colorado has a relatively low concentration of industry employment, equal to 64% of the na-tional concentration as of May 2015.
Nondurables is growing steadily, rising more than anticipated, at 3.2%, in 2014. Growth was 1.2% year-over-year in May 2015, with employment averaging 48,500 jobs in 2015 year-to-date. The beverage manufacturing subsector is outperforming the broader non-durables subsector—employment in 2014 grew 6.8%, and as of May 2015 grew 6.3% year-over-year. Craft spirits and beer have remained in high demand and buoy this seg-ment of the sector.
Employment in durable goods manufacturing increased 2.7% in 2014 and is growing faster than projected in 2015. In the first five months
of 2015, employment has averaged 90,800 jobs. Employment growth is faster than ex-pected in 2015 due to expansion in all du-rable goods subsectors. The transportation subsector was expected to contract in 2015 but instead has increased by 6.9% year-over-year. Employment in computer and electron-ics has posted an unexpected small increase to 21,500 jobs for the first five months of 2015 compared to the same period in 2014. This sector recorded two years of declines that were partially due to the reclassification of some software companies from Manufac-turing to Professional and Business Services.

COLORADO BUSINESS REVIEW 6
Information
Trade, Transportation, and Utilities
Trade, Transportation, and Utilities (TTU) is part of the services-providing supersector and consists of three subsectors: Wholesale Trade, and Transportation and Warehousing, and Utilities. It covers many services, includ-ing rendering services incidental to the sale of merchandise, establishments engaged in retailing merchandise, industries provid-ing transportation of passengers and cargo, warehousing and storage for goods, and es-tablishments engaged in the provision of the following utility services. TTU added 10,800 jobs in 2014 and grew 2.8%. As of May 2015, employment in this sector was up 0.1% year-over-year.
The Wholesale Trade Sector consists two subsectors: Merchant Wholesalers – Durable Goods and Merchant Wholesalers – Nondu-rable Goods. These sectors include the out-puts of agriculture, mining, manufacturing, and certain information industries, such as publishing. Wholesale Trade has grown each year since 2010, and continued the trend in 2014, growing 3.3%. Of the two subsec-tors within Wholesale Trade, durable goods has performed better, posting 5% growth in 2014 and 1.8% year-over-year growth in May 2015. Nondurable goods employment increased 3.9% in 2014 and declined 1.2% year-over-year in May 2015.
Transportation and Warehousing employ-ment rose 4.2% in 2014, a 2,800 job increase; however, May 2015 year-over-year shows a 2.2% decrease. With the hotel, plaza, and transit center nearing completion at DIA, the Transportation Sector has something to be optimistic about in the coming year. In addi-tion, the FasTracks line that connects DIA to Denver is set to debut in 2016.
Although Utilities grew 2.5% in 2014, this sector has remained largely stagnant for the last decade, with roughly 8,000 jobs. While the industry is not expected to add many jobs, an aging workforce will necessitate hiring. The EPA has set a 35% reduction in carbon intensity emissions by 2030, although Colorado’s energy providers appear to be on pace to achieve this goal. Colorado’s Re-newable Energy Standard requires that 30% of retail electricity be renewably sourced in Colorado by 2020.
The Information Sector has grown extensively in Colorado in terms of output over the past decade. Real GDP growth for the Information Sector rose 2.3% in the state in 2014 and was revised up, to 3.5%, in 2015. Industry GDP grew 34% over the past 10 years. In 2013 (most recent data available at the sec-tor level), motion picture and sound recording grew 11.5%; broadcasting and telecommu-nications grew 3.4%; data processing, inter-net publishing, and other information services grew 3.3%; and publishing grew 3% in terms of real GDP in the state. Information GDP per employee was $310,000 in 2013, an increase of 4.2%.
This growth, however, has not translated to additional employment. Information employ-ment peaked at 113,300 jobs in 2001 and has declined in 10 of the last 14 years. Total employment in May 2015 was 68,200 jobs, or 39.8% below peak. Employment in May 2015 was down 2.7% year-over-year. While the Colorado Department of Labor has indicated that Information Sector employment may be revised up, it has recorded job losses in 6 of the last 9 months. A few local companies, like Zayo and Rally Software, have added jobs, but larger companies (e.g., CenturyLink) have shed jobs, outweighing the smaller gains. Na-tionally, employment in the Information indus-try grew slightly in 2014 and has increased 2.2% in May 2015 year-over-year, with gains in all subsectors except Publishing.
The publishing industry has recorded 14 years of annual employment declines, standing 44% below peak levels recorded in 2000—the last year the sector added jobs. All other Information sectors added jobs in 2014—the greatest number of new jobs are in broad-casting. In May 2015, all Information sectors are recording year-over-year job losses.
Software publishing often attracts the largest share of VC funding in the state. A Pricewa-terhouseCoopers Money Tree report indi-cated that software received $6 billion in VC investment in Q4 2014 and $5.6 billion in Q1 2015, 40% and 42%, respectively, of total VC investment in the nation. In Colorado, soft-ware received $81.5 million in VC investment in Q4 2014 and $81.4 million in Q1 2015, representing 32% and 70%, respectively, of VC activity. More broadly, when including software, IT services, and media and enter-tainment, a majority of VC activity is targeting information-related sectors in Colorado (51% in Q4 2014, 77% in Q1 2015).

COLORADO BUSINESS REVIEW 7
Financial Activities
Professional and Business Services
The Financial Activities Sector includes estab-lishments primarily engaged in financial trans-actions, as well as establishments engaged in renting, leasing, or otherwise allowing the use of tangible or intangible assets. The sec-tor continues to post modest gains in employ-ment, growing 1.5% in 2014 and as of May 2015 adding 4,900 jobs year-over-year.
Real Estate, Rental, and Leasing employment grew 5.5% year-over-year in May 2015, indi-cating growth in the housing industry. More people are entering the housing market, which has caused construction to pick up as shown in the 6.9% increase in the value of residential construction year-to-date compared to 2014. The available months of supply in terms of re-sale is decreasing, which has increased both rent and home prices. The purchase of new units may be tempered by the difficulty of get-ting approved for a mortgage.
After the recession, many banks laid off mort-gage divisions. Nationwide, banks currently struggle to lend due to tight regulatory re-strictions focused on consumer protection. In Colorado, this is an issue as the already-high demand for housing continues to increase as it is challenging for people entering the market to find financing. The number of rental units increased in 2014 as the number of lots for real estate development decreased. This has contributed to increasing home prices, mak-ing it more difficult to attain homeownership. Going forward, home prices in Colorado are expected to rise along with demand as Colo-rado’s population continues to grow.
Quantitative easing essentially ended in 2014, and following that, the Federal Reserve is looking to address concerns related to in-flation and a growing labor market. There is uncertainty surrounding how and when the Fed will act and the potential slowing impact on the economy should it tighten the mon-etary supply too much. This would result in higher interest rates, and has the potential to bring the inflation rate even lower (possible negative). While Fed policy does not explic-itly impact long-term rates, they are indirectly affected by short-term interest rates. Rising mortgage rates pose a risk to the thriving housing market in Colorado.
In 2014, the stock market had a slower year than in 2013. Large-cap companies grew, while small and mid-cap companies grew
relatively little after struggling throughout much of 2014. That relationship has reversed in 2015 with small and mid-cap companies leading the S&P 500. As of July 13, 2015, the S&P 500, NASDAQ, and Dow Jones have increased 2%, 7.1%, and 0.9%, respec-tively, year-to date, while the Russell 2000 has grown 5%. A slower rate of growth is expected to continue into 2015. Stock vola-tility is a key characteristic of the markets in 2015, and the uncertainty of the economy as the GDP growth rate begins to slow will influ-ence how the markets perform over the next six months.
The Professional and Business Services Sec-tor (PBS) is one of the services-providing sectors. PBS consists of three subsectors: Professional, Scientific, and Technical Ser-vices; Administrative and Support and Waste Management and Remediation Services; and Management of Companies and Enterprises. Colorado’s PBS Sector expanded 1.0% and added 3,700 jobs year-over-year in May 2015 for a total of 387,500.
Professional, Scientific, and Technical Ser-vices (PST) accounted for 52% of total PBS employment in May 2015, up from 50% in 2014. Within PST, employment in legal ser-vices increased slightly from May 2014 to May 2015, perhaps due to an increase in law firm mergers, adding 500 jobs. The best-per-forming subsector in PST is computer sys-tems, which has grown 5.8% year-over-year
from May 2014. The Architectural, Engineer-ing, and Related Services subsector showed sustained growth year-over-year in May 2015 (2.1%). Some of this growth can be attrib-uted to flood damage repairs, and growth in this subsector may increase in 2015 as more projects move from design to construction.
Administrative and Support and Waste Man-agement and Remediation Services accounts for 39% of total PBS employment. Overall, this sector lost 3,000 jobs year-over-year in May 2015. Specifically, the Services to Build-ings and Dwellings subsector was the best-performing subsector, adding 1,800 jobs year-over-year in May 2015. This is likely a result of the increase in occupied units and thus more demand for services to buildings. Growth is expected to continue in this cat-egory, but may level off when vacancy rates flatten. Little growth is expected in the condo supply. According to the S&P/Case-Shiller Home Price Index, home prices in April in-creased year-over-year by 10.3% in the Den-ver area, followed by San Francisco, at 10%. The other sectors, Employment Services and Business Support Services, showed flat and negative growth, respectively, over the same period.
The final subsector of PBS, Management of Companies and Enterprises, lost 100 jobs year-over-year in May 2015, and continues to show little to no employment growth in 2015.

COLORADO BUSINESS REVIEW 8
Education and Health Services
Leisure and Hospitality
The Education and Health Services (EHS) sector includes establishments that provide instruction and training by private schools and universities, as well as establishments that provide health care and social assistance to individuals. This sector did not suffer ma-jor employment losses in the recession; both Health Care and Social Assistance, and Edu-cational Services have grown steadily since a slight four-month dip in 2009. In 2014, the average annual wage for this industry was $45,879, 1.7% higher than the average wage in 2013. Colorado has a lower concentration of EHS employment compared to the nation (82% of the national average).
Health Care and Social Assistance consti-tutes the vast majority of the sector’s employ-ment. The sector grew by 14,500 jobs (5.6%) year-over-year in May 2015, continuing its trend of steady growth. Although Colorado’s uninsured rate has dropped from 17% to 11%, barriers to enrollment include confusion about Medicaid and private insurance subsi-dies, lack of compelling consumer messag-ing, unaffordable coverage, and continuing technical issues on Connect for Heath Colo-rado, the state’s health insurance exchange, that make website navigation difficult.
The long-term economic impacts of the Af-fordable Care Act remain to be seen, but the health care exchange and pent-up demand for health care is credited for a 10% jump in national health care spending. This increase added $43.3 billion in nationwide consumer spending during Q1 2014.
The private education subsector is growing slowly in 2015. The University of Phoenix has closed brick-and-mortar locations in Colo-rado, and Corinthians College has closed two schools in the state at the behest of the federal government. These closings caused a drop in employment that was barely offset by increases in other private education services. Employment in private educational services has grown 1.2% year-over-year in May 2015, a rate that is almost identical to public state educational employment, but lower than lo-cal education employment, which has grown 1.3% and 2.3%, respectively.
The Leisure and Hospitality Industry covers establishments in the tourism, travel, and rec-reational industries.
Leisure and Hospitality employment in Colo-rado increased 4.5% year-over-year in May 2015, and had an absolute growth of 13,500 jobs.
Colorado TourismAccording to the Longwoods International Tourism report and the Dean Runyan report, Colorado continued to set new records in terms of both trip volume and visitor expen-ditures in 2014. The report states that 33.6 million visitors came to Colorado on overnight trips in 2014, 8% more than in 2013. In ad-dition, business trips increased by 7%, to 4.2 million—the highest number over the past decade. Not only has the number of visitors to Colorado increased, but so has spending. People on leisure trips spent $6.7 billion, 17% more than in 2013, and those visiting friends and relatives increased their spending by 20%, to $4 billion. Total direct travel spend-ing in Colorado was approximately $18.6 bil-lion during 2014 and generated 155,000 jobs with earnings of $5.1 billion according to the study. In the Travel USA survey, the most popular activities for Colorado leisure visitors were: shopping (32%), fine dining (23%), and
hiking/backpacking (21%). Colorado signifi-cantly outpaced the nation in travel and tour-ism growth during 2014.
The same trends can be seen looking at Den-ver’s Leisure and Hospitality Sector, which captured about 50% of all overnight travel spending in Colorado. Denver welcomed 15.4 million overnight visitors in 2014, up 10% over 2013. Nationally, total overnight trips increased 3%. Overnight visitors spent a record $4.6 billion in 2014, 15% more than 2013, with $3.6 billion spent by leisure visitors (up 12% over 2013) and $1 million spent by business travelers (up 20% over 2013). Addi-tionally, Denver’s image (what visitors thought of the city) improved year-over-year. Nearly 8 in 10 visitors agreed strongly that Denver is a place they would “really enjoy visiting again” compared to 7 in 10 in 2013.
DIA remains the fifth-busiest airport in the na-tion, despite slipping 0.7% year-over-year in May 2015 in total passengers. The Colorado Springs Airport had a loss of approximately 3,200 total passengers, or 3.4%, year-over-year in April 2015. Three hub airlines and in-creased service from low-cost carriers have helped rank Denver as a destination offering competitive airfare pricing. Recent business decisions by Frontier Airlines have decreased its total passengers by 41.1% year-over-year
Photo courtesy of Jerry Neal—CPW

COLORADO BUSINESS REVIEW 9
Continued on page 10
Other Services Government
in May 2015, while many other airlines have increased their passenger totals, making up the ground that was lost by Frontier. Air travel to Colorado destinations on domestic flights was up 6% from the preceding year accord-ing to the Dean Runyan Report.
State park visitation reached a record 12 million visitors in 2014, an increase of 4% from 2013. National park visitors in Colorado reached 6.1 million in 2014, up 11.6% from 2013. Rocky Mountain National Park visits have been strong in the first half of 2015, around 982,000 visitors through June. All national parks are expected to see continued strong visitation as the National Park Service celebrates its 100th anniversary this year. This celebration should increase tourism and visits to both national and state parks.
Colorado Ski IndustryAccording to the Longwoods Report, in 2014 Colorado retained its substantial lead among states as a destination for ski travel, garnering 21% share of all overnight ski trips nationwide. Colorado ski trips averaged 5.1 nights away from home in 2014, up from 4.4 nights in 2013 and 4.0 nights the year before. Typical Colorado ski parties (3.2 individuals) remain larger than typical Colorado visitor parties (2.9 individuals). Colorado’s ski in-dustry experienced a stagnant ski year in the 2014–2015, with only 1% fewer visits com-pared to 2013–2014. Colorado Ski Coun-try announced visitation to its 21 member resorts reached 7.1 million skier visits. Vail Resorts report total skier visits were up 2.3% for 2014-2015. “Overall Colorado Ski Coun-try had a very strong season, which is great news for the Colorado ski industry. We’re buoyed by this season’s strong numbers and are hopeful this momentum continues,” Ski Country President Melanie Mills said.
The Other Services Sector comprises estab-lishments that provide services not specifical-ly categorized elsewhere in the classification system. As a result, the three subsectors un-der this category are highly fragmented and diverse. Car washes, beauty salons, religious organizations, funeral homes, grantmaking foundations, and labor unions are some ex-amples of the type of industries in the Other Services Supersector. Industry growth is mainly influenced by the demographics of the population and disposable income.
In May 2015, the sector had 1,000 more jobs compared with the same month one year ago, a 1% increase. Growth came from the repair and maintenance subsector, adding 1,500 employees, a 6.5% increase from May 2014. Continual demand for the repair and mainte-nance of cars purchased during the past few years have contributed to the increase in new jobs for this subsector. The other two subsec-tors declined from May 2014 to May 2015. The largest subsector, the religious, grantmaking, civic professional and similar organizations, fell by 400 employees, a 0.8% decrease from one year ago. In general, this subsector tends to decline in years with no general elections. Fi-nally, the personal laundry services subsector declined by 0.4%, or 100 employees, from the same month one year ago.
The Government Sector comprises federal, state, and local government employees, in-cluding state university and school employ-ees. This sector employs 413,500 people in Colorado, making up approximately 16.4% of all Colorado jobs. Federal program budget cuts and consolidations have limited employ-ment growth in the Government Sector, but with consistent gains beginning in 2011, the sector has surpassed and remains above pre-recession levels.
Despite annual gains at the state and local level, the Government Sector was below pro-jections for 2014. This was due to the slower-than-predicted growth at state and local gov-ernment levels, which could be perpetuated by the slowing of the oil and gas industry as it weighs on future growth. Additionally, as Colorado approaches its TABOR limit, sus-taining the current level of employment and spending growth will become increasingly dif-ficult. Government is trending slightly below (0.4%) committee estimates as of May 2015, and the increases at the state and local level should outweigh the loss in jobs at the federal level.
Employment at the federal level continues its recent slide, and the trend is expected to persist into 2015. Overall, federal government employment was roughly 400 jobs above the 2014 forecast.

COLORADO BUSINESS REVIEW 10
Continued from page 9
Midyear Economic Roundtable ContributorsAgricultureGlenda MostekColorado Department of Agriculture
ConstructionPenn PfiffnerConstruction Economics, LLC
Education and Health ServicesMichele AlmendarezKaiser Foundation Health Plan
Financial ActivitiesRichard MorganMutual of Omaha Bank
Ron NewGHP Investment Advisors, Inc.
GovernmentLarson SilbaughColorado Legislative Council
InformationBrian LewandowskiLeeds School of Business
Kate WatkinsColorado Legislative Council
International TradeSandi MoilanenColorado Office of Economic Development and International Trade
Leisure and HospitalityTony Gurzick Colorado Parks and Wildlife
ManufacturingPatty SilversteinDevelopment Research Partners
Natural Resources and MiningChris Eisinger Colorado Geological Survey
Other ServicesLouis PinoColorado Legislative Council
Population and EmploymentElizabeth GarnerColorado Department of Local Affairs
Jason SchrockGovernor’s Office of State Planning and Budgeting
Joe WinterColorado Department of Labor and Employment
Professional and Business ServicesSteve FisherEconomist
Mark HamouzAlfred Benesch & Company
David KingNorth Highland
Brian PoolNorth Highland
Trade, Transportation, and UtilitiesTim SheesleyXcel Energy
State employment is currently 0.7% be-low 2015 estimates, though it grew 1.5% in 2014 and climbed 1.7% year-over-year as of May 2015. The majority of this growth was generated in the state educational services subsector, which added 1,100 jobs in 2014 (1.7%) and 1,300 jobs year-over-year as of May 2015. Enrollment numbers in public institutions (community, and two-year and four-year colleges) in 2013 (most recent data available) dropped by 2,047 students (0.8%), while state educational services employment grew by 1,500 jobs (2.4%). State government general employment also grew by 500 jobs in 2014 (1.2%) and 100 jobs year-over-year in May 2015.
Local government employment grew 1.5% in 2014. Local government general employment has grown 1.7% year-over-year as of May 2015. Local education employment has also remained steady, increasing 1.7% year-over-year in May 2015. School enrollment in Colo-rado, prekindergarten through 12th grade, climbed by 12,007 students in 2014, a 1.4% gain, outpacing local education employment growth. Overall, local government has added 4,000 jobs year-over-year.
The June 2015 economic report by the Of-fice of State Budget and Planning (OSPB) re-vised its Colorado general fund projections, estimating that compared to the March 2015 forecast, general fund revenue will increase $48.2 million for FY 2014–15. The OSPB lowered its projection of general fund revenue for FY 2015–16 by $6.6 million compared to the March 2015 estimate. The first estimate for FY 2016–17 is also out, forecasting $10.9 billion in general fund revenue.
Colorado home values boomed in 2014 and in early 2015, and demand for housing con-tinues to rise. Higher value and increased construction activity will be the source of additional revenue for many local govern-ments. However, not all local governments will experience the increase in property valu-ation as the housing price boom is focused in urban areas.

COLORADO BUSINESS REVIEW 11
International Tradethe seventh to the fifth top export market spot, with $90.7 million.
Colorado’s top export commodity is indus-trial machinery, including computers, despite dropping 17.8%, to $1.2 billion, in 2014. Optic, photo, medical, and surgical devices remained the state’s second-largest export commodity, even though it also experienced a steep decline of 10.9% in 2014. Colorado’s most promising export is the pharmaceutical product category, ranking eighth on the ex-port list and growing 156.7% in March 2015 compared to this same period in 2014. Rub-ber and rubber articles have risen 134.5% in the same period and rank 26th on Colorado’s list of top exports.
Colorado’s top three import markets are Canada ($4.3 billion), followed by China ($2.3 billion) and Mexico ($1.7 billion). In 2014, im-ports jumped 11.2%, an approximately $1.4 billion increase. Colorado’s top import com-modity is still mineral fuel, oil, etc.; bitumen substitutes; mineral wax, which grew 5.1% in 2014. Industrial machinery (including com-puters) and electric machinery are Colorado’s
As of March 2015, exports from the United States decreased 2.6% year-over-year, though net exports grew 7.7%, likely due to lower imports. Colorado’s exports declined $180 million in 2014 (2.1%), though exports are up 5.6% year-over-year as of March 2015.
The top five export markets for Colorado in 2014 were (in order): Canada, Mexico, Chi-na, Japan, and the Netherlands according to WISERTrade. Trade with the state’s top export market, Canada, dropped 18.7% in 2014 due to a severe decline in the price of oil and gas beginning in June. However, Colo-rado’s other top export markets have grown in 2014—exports to Mexico were up 16.4%, China remained stable (-0.4%), Japan grew 15.3%, and the Netherlands (now one of the state’s top five export markets) grew 12%. However, based on year-to-date March 2015 data, the Republic of Korea has moved from
second- and third-largest imports, and have grown 26.3% and 2.6%, respectively.
Several significant factors will determine the performance of Colorado’s International Trade Sector, including Europe’s recovery from a recession; the real estate bubble in China, which could cause greater global in-stability should it burst; the outcome of fiscal policy on the federal level; and slowing post-recessionary economic growth. International Trade is poised to remain a positive force for Colorado, driving further economic develop-ment, though, the strengthening dollar will weigh on export growth.
Richard Wobbekind ([email protected]) is the Executive Director of the BRD and Senior Associate Dean for Academic Programs in the Leeds School of Business. Student research assistants Cullen Aulwurm and Jackson Rueter contributed to the summary, along with BRD As-sociate Director Brian Lewandowski.
Colorado MSA Metrics

The CBR is a quarterly publication of the Business Research Division at CU-Boulder. Opinions and conclusions expressed in the CBR are those of the authors and are not endorsed by the BRD, the Leeds School of Business faculty, or the officials of CU.
View our website: leeds.colorado.edu/brd/
Richard L. Wobbekind, editor; Cindy DiPersio, assistant editor; Brian Lewandowski, technical advisor; Samantha Davies, design.
This report is not produced at taxpayer expense. The University of Colorado Boulder is an equal opportunity/nondiscrimination institution.
For information/address change:
Business Research Division 420 UCB, University of Colorado Boulder Boulder, CO 80309-0420 • 303-492-8227
Save the date and watch for more information!
F i f t y - F i r s t A n n u a l
2016C O L O R A D O
B U S I N E S S E C O N O M I C O U T LO O K
December 7, 2015Grand Hyatt Denver, 1750 Welton Street
Brought to you byLeeds School of Business, University of Colorado Boulder
www.colorado.edu/leeds/brd