volume 2 - section 3 - scope of eia - alberta.ca · volume 2 – environmental ... 3.4.4 cumulative...
TRANSCRIPT

Devon NEC Corporation Pike 1 Project Volume 2 – Environmental Impact Assessment June 2012
Table of Contents – Page i
SECTION 3.0 – SCOPE OF ENVIRONMENTAL IMPACT ASSESSMENT TABLE OF CONTENTS
PAGE
3.0 SCOPE OF ENVIRONMENTAL IMPACT ASSESSMENT ............................................ 3-1 3.1 Approach ............................................................................................................ 3-2 3.2 Spatial and Temporal Boundaries ...................................................................... 3-2
3.2.1 Spatial Boundaries ............................................................................. 3-2 3.2.2 Temporal Boundaries ......................................................................... 3-4
3.3 Public Consultation and Issue Identification ....................................................... 3-5 3.4 Application of Constraints Planning Approach as Mitigation .............................. 3-5
3.4.1 Cumulative Constraints Mapping ....................................................... 3-6 3.4.2 Spatial Constraints Identification ........................................................ 3-7 3.4.3 Spatial Constraint Scoring ................................................................. 3-8 3.4.4 Cumulative Constraints Map Production ............................................ 3-9 3.4.5 Project Layout Planning ..................................................................... 3-9
3.5 Identification and Evaluation of Impacts ........................................................... 3-11 3.5.1 Direction of the Impact ..................................................................... 3-13 3.5.2 Geographic Extent of the Impact ..................................................... 3-13 3.5.3 Magnitude of the Impact .................................................................. 3-13 3.5.4 Duration of the Impact ...................................................................... 3-14 3.5.5 Reversibility ...................................................................................... 3-14 3.5.6 Confidence ....................................................................................... 3-15 3.5.7 Final Impact Rating .......................................................................... 3-15
3.6 Assessment Cases ........................................................................................... 3-15 3.6.1 Baseline Case .................................................................................. 3-16 3.6.2 Application Case .............................................................................. 3-19 3.6.3 Planned Development Case ............................................................ 3-19
3.7 References ....................................................................................................... 3-19

Devon NEC Corporation Pike 1 Project Volume 2 – Environmental Impact Assessment June 2012
Table of Contents – Page ii
TABLE OF CONTENTS (cont) PAGE
LIST OF TABLES
Table 3.4-1: Preferred Development Areas and Constraints ................................................ 3-10 Table 3.6-1: Projects Included in the Air Quality Assessment .............................................. 3-16 Table 3.6-2: Projects Encompassed Within the TRSA ......................................................... 3-17 Table 3.6-3: Projects Encompassed Within the ARSA ......................................................... 3-17
LIST OF FIGURES
Figure 3.4-1: Cumulative Environmental Constraints Map .................................................... 3-12 Figure 3.6-1: Baseline Disturbance ....................................................................................... 3-18

Devon NEC Corporation Pike 1 Project Volume 2 – Environmental Impact Assessment June 2012
Page 3-1
3.0 SCOPE OF ENVIRONMENTAL IMPACT ASSESSMENT The purpose of this environmental impact assessment (EIA) is to identify, evaluate and report the potential environmental and socio-economic effects of the proposed Pike 1 Project (the Project). This process includes identification of mitigative measures that will be used to reduce or eliminate potential adverse effects, as well as monitoring to be conducted for ongoing adaptive management. The scope of the EIA was set out in the Terms of Reference for the Project, and the Guide to Preparing Environmental Impact Assessment Reports in Alberta (AENV 2011). The EIA will address the following:
• provide information on the environmental and socio-economic resources and resource uses that could be affected by the construction, operation, and reclamation of the Project.
• provide a sufficient base for the prediction of positive and negative impacts and the extent to which negative impacts may be mitigated by planning, project design, construction techniques, operational practices, and reclamation techniques;
• quantify and assess impacts, taking into consideration spatial, temporal and cumulative aspects. Information sources used in the EIA will include literature, previous baseline reports and environmental studies, operating experience from current oil sands operations, industry study groups, traditional knowledge and government sources.
• undertake studies and investigations, where required, to obtain additional information for establishing a sound baseline in the study area(s); identify limitations or deficiencies that the available information may place on the analysis or conclusions in the EIA report;
• from a broad-based examination of all ecosystem components including previous environmental baseline work, describe and rationalize the selection of key components and indicators examined, and for each environmental parameter:
describe baseline conditions (includes existing and approved projects and activities); comment on whether the available data are sufficient to assess impacts and mitigation measures; and identify environmental disturbance from previous activities that have now become part of baseline conditions;
describe the nature and significance of the environmental effects and impacts associated with the development activities; discuss the impacts of the Baseline Case as well as the Application Case (includes baseline conditions and the Project);
describe measures and/or plans to minimize, mitigate, or eliminate negative effects and impacts and discuss the key elements of these plans;
identify residual impacts and comment on their significance where possible; present plans to monitor environmental impacts and manage environmental
changes to demonstrate the Project is operating in an environmentally-sound manner; and
• describe the stakeholder consultation process (including, but not limited to, the public, Aboriginal people, industry, and regulatory representatives).

Devon NEC Corporation Pike 1 Project Volume 2 – Environmental Impact Assessment June 2012
Page 3-2
Assessment of cumulative effects is based on the Information Letter ‘Cumulative Effects Assessment in Environmental Impact Assessment Reports Required Under the Alberta Environmental Protection and Enhancement Act’ (AENV, EUB and NRCB 2000).
3.1 Approach
The EIA was undertaken using an approach consistent with guidelines set out by the Energy Resources Conservation Board and the Alberta Environmental Protection and Enhancement Act regarding the preparation of environmental and socio-economic impact assessments in Alberta.
Scoping
• Identify environmental and socio-economic issues.
• Establish spatial and temporal study area boundaries.
• Describe existing environmental and socio-economic conditions.
Analysis
• Determine potential interactions between Project activities and identified issues.
• Evaluate potential environmental and socio-economic effects.
• Develop appropriate mitigation strategies.
• Identify residual Project impacts and cumulative effects.
• Determine the magnitude of residual Project impacts and cumulative effects.
Reporting
• Document impact assessment and conclusions.
3.2 Spatial and Temporal Boundaries
3.2.1 Spatial Boundaries
The production facilities for the Project will be developed within the Project Area, which is contained by the terrestrial local study area (TLSA) (Volume 2, Figure 2.1-1). Project developments that will result in direct surface disturbances include the central processing facility (CPF), surface well pads, source and disposal water wells, borrow pits, well pad access roads, and aboveground and underground pipeline and utility corridors (Volume 2, Figure 2.2-1).

Devon NEC Corporation Pike 1 Project Volume 2 – Environmental Impact Assessment June 2012
Page 3-3
3.2.1.1 Local Study Area
For each discipline component in the EIA, the boundaries of the local study area vary and are described within the respective sections. Some study areas are used by multiple disciplines, such as the TLSA (used in assessments of soils, vegetation and wetlands, wildlife, land and resource use, historical resources) and the aquatics local study area (ALSA; used in assessments of water quality, hydrology and aquatic resources). Boundaries were defined based on the distribution of specific receptors or key resources that were of importance to each discipline, and that had the potential to be affected by the Project. In general, the TLSA comprises a nominal half-section (800 m) buffer around the Project footprint to capture direct and indirect effects of the Project on terrestrial receptors, including sensory disturbance to wildlife. The ALSA includes the Hay and Kirby lakes catchment, the Monday Creek catchment, and the Sandy River catchment. These catchments are nearest the Project area and hence, have the greatest potential to experience water quality impacts as a result of the Project.
3.2.1.2 Regional Study Area
The regional study area for each discipline component is larger than the local study area. As with the local study area, the boundaries vary among EIA disciplines. Boundaries were defined to provide a regional context where potential cumulative effects may occur due to the Project in combination with other existing, approved and planned projects (Volume 2, Section 3.6.3). Similar to the TLSA and ALSA, the terrestrial regional study area (TRSA) and aquatics regional study area (ARSA) are used by multiple disciplines. The TRSA is generally centred on the TLSA and was defined by overlaying ecodistrict, sub-watershed and wildlife management area boundaries (including caribou zones and the proposed Dillon Conservation Area) onto a base map surrounding the TLSA. The TRSA incorporates a combination of these spatial elements, and represents an area within which Project effects could act cumulatively with other developments. The TRSA is defined by a combination of ecological and hydrological divisions, and is bounded to the north by the border between the Mostoos Upland and Stony Mountain Upland Ecodistricts, and to the east and south by the height of land between the Athabasca and Churchill River watersheds. These boundaries are considered to encompass all or portions of relevant regional receptors that could potentially be affected by cumulative regional terrestrial effects that include the Project. The ARSA includes the ALSA as well as the Sunday Creek catchment, Christina Lake and Winefred Lake. It was delineated to determine the potential of the Project to contribute to cumulative impacts on aquatic resources, focusing on water quality, in combination with other existing, approved and planned projects.

Devon NEC Corporation Pike 1 Project Volume 2 – Environmental Impact Assessment June 2012
Page 3-4
3.2.2 Temporal Boundaries
The Project will proceed with overlapping construction, operation, and reclamation activities at any given time. Project impacts are examined using a maximum disturbance approach that assumes all development would occur at the same time over the entire footprint. This method provides for the maximum disturbance impact scenario and provides assurance that actual impacts will be less than those predicted. This approach also provides for flexibility in the timing of construction, operation and reclamation activities as detailed engineering for the Project moves forward and in response to actual conditions experienced. In this manner, changes to the Project development plan will not result in an impact greater than that predicted in this assessment.
3.2.2.1 Construction
Construction of the Project is scheduled to begin in 2014 pending corporate and regulatory project approvals. Initial steam assisted gravity drainage wellpair drilling and facility construction will take place from 2014 through to 2018. Initial production is scheduled to commence in 2016, ramping up to full production by 2020. Additional well pad, road and pipeline construction activities will be ongoing as sustaining capital development throughout the life of the project (Volume 1, Section 1.4). Progressive reclamation will occur concurrently.
3.2.2.2 Operations
The operations phase will encompass the period required to maximize bitumen extraction from the available resource. First production of oil is targeted to take place in 2016, with full production reached in 2020. With the currently defined resources of the Project, Devon expects final production to take place after 25 to 30 years of operation. However, additional resource delineation or technology improvements that result in improved recovery of the resource may extend the operational life of the facility. After cessation of operations, Devon will undertake facility decommissioning and final reclamation.
3.2.2.3 Reclamation
The reclamation phase involves reclaiming well pads, access roads, borrow pits, plant facilities, and associated infrastructure. Once the wellpairs within a well pad are depleted, the well pad and associated facilities will be reclaimed. To maintain production capacity through the life of the Project, well pads will be added and depleted wells reclaimed concurrently. The life of a well pad is estimated at seven to eight years, and reclamation will begin promptly for each well pad following decommissioning of the wells. As the Project nears the end of its production life, substantial reclamation will have been completed and the final well pads and associated infrastructure and the plant site will remain for reclamation. Final reclamation work is expected to be completed within five years of the end of operations.

Devon NEC Corporation Pike 1 Project Volume 2 – Environmental Impact Assessment June 2012
Page 3-5
3.3 Public Consultation and Issue Identification
Potential impacts arising from the development of the Project were identified by Devon and stakeholders through the consultation process. Stakeholders include local citizens, communities in the oil sands area, Aboriginal communities, regulators, other industrial operators in the region and other identified stakeholders. Devon’s public consultation program is described in Volume 1, Section 5.0. Public consultation will continue through to the conclusion of the operations and reclamation phases of the Project.
3.4 Application of Constraints Planning Approach as Mitigation
Constraints planning is a form of design-level mitigation that identifies and maps areas of potential constraint for incorporation into certain aspects of Project planning, such as in the design and layout of facilities. A constraint can generally be defined as that which poses an actual or potential limitation to Project design or development. Constraints may be associated with various types of limitations, including:
• physical conditions (e.g., deep organic soils, steep slopes); • environmental sensitivities (e.g., erosion-sensitive soils, rare plants); • land use sensitivities or restrictions (e.g., existing development, traditional use area); • regulatory and policy requirements or restrictions (e.g., Class A waterbody, permitting
requirements, instream restricted activity periods); • relevant standards, guidelines, objectives and/or criteria (e.g., ambient air quality
objectives); and • engineering design limitations (e.g., steam reach). Constraints planning involves selecting key environmental constraints, mapping those constraints, and then locating Project facilities to optimize placement relative to the constraints (i.e., away from areas of higher constraint and preferentially in areas of lower constraint). Areas of relatively high constraint represent a greater potential for environmental impact and associated regulatory requirements that could require extensive mitigation, compensation and/or monitoring. Environmental risks associated with high constraints may be reduced by avoidance; however geological and engineering constraints may limit avoidance and therefore, other mitigation including reducing disturbance, timing activities during periods of low ecological sensitivity, and implementing best management practices and reclamation may be necessary reduce risk. Devon applied a constraints planning approach to the Project to identify potential environmental impacts prior to completion of engineering design (facility and subsurface) and for continued application during Project development, subsequent to approval. This approach is beneficial as a planning tool in that it:
• provides a visual reference to the locations of environmental features in relation to planned developments;
• identifies and prioritizes environmental considerations during early planning to prevent or minimize disturbance to specific areas;

Devon NEC Corporation Pike 1 Project Volume 2 – Environmental Impact Assessment June 2012
Page 3-6
• minimizes the likelihood of re-design (and associated costs and schedule delays) to address site-specific sensitivities that may not have been identified until later;
• reduces the need for mitigation during construction and operations;
• allows for regular updating as new environmental data is collected; and
• provides a useful tool to encourage discussion and feedback during community consultation.
The following three types of constraints were identified:
• temporal: limits the timing of an activity (e.g., restricted activity period, nesting window);
• threshold: limits the activity up to a defined numerical value or rate (e.g., air emissions); and
• spatial: limits the location of an activity. Cumulative constraints planning for the Project focused on spatial constraints that could be mapped, and this approach is described below. Temporal and threshold constraints were identified and considered in the context of the environmental impact assessment for the Project (Volume 2, Sections 4.0 through 17.0).
3.4.1 Cumulative Constraints Mapping
Constraints planning for the Project incorporated the development and application of cumulative constraints mapping within the TLSA. Cumulative constraints mapping involves the development of individual map layers for a variety of spatial constraints identified within an area (i.e., the TLSA). A risk-based, weighted score is determined for each constraint on the basis of key attributes (Section 3.4.3) and then constraints are overlain in ArcGIS to produce a map illustrating areas of low to high cumulative constraint on the landscape. A cumulative constraint is mapped as a polygon comprising the sum of the constraint scores for a specific location. This approach identifies areas on the landscape that may pose a relatively high sensitivity to development due to the presence of multiple different constraints or a few highly-ranked constraints. Such areas would be priorities for avoidance or would require a higher level of mitigation if disturbed. This mapping approach also allows for peeling away of constraint layers at a location to understand the individual constraints present and to allow for development of focused or integrated mitigation or management strategies. GIS-based cumulative constraints mapping provides several benefits:
• overlays all spatial constraints to identify areas for avoidance or higher level of mitigation;
• provides a snapshot that allows for evaluating sensitivities/valued environmental components (VECs) at a landscape level, as opposed to evaluating sensitivities or potential impacts for a single resource/VEC;

Devon NEC Corporation Pike 1 Project Volume 2 – Environmental Impact Assessment June 2012
Page 3-7
• facilitates an enhanced understanding and visual representation of the interrelationship of VECs on the landscape;
• provides for mapping and baseline data updates with new data collected over life of Project; and
• allows for peeling away of constraint layers at a location to understand individual constraints.
Application of cumulative constraints mapping as part of Project planning is a continuous exercise, as the data used to generate the mapping will be updated as new information is available. For example, the distribution of soil, vegetation and wetland constraints will be updated based on collection of detailed pre-disturbance assessment surveys conducted for new facilities, and mapping of existing disturbances will be updated regularly to facilitate use of these areas for Project facilities, thereby minimizing new disturbance and associated fragmentation.
3.4.2 Spatial Constraints Identification
Many spatial constraints mapped within the TLSA represent VECs or key indicator resources for which baseline spatial data were collected. Other mapped constraints were defined as buffers or areas within which an identified VEC is likely to occur, such that avoidance would minimize or prevent disturbance to the VEC. A total of 41 spatial environmental and land use constraints were defined for cumulative constraint map development. Examples of spatial constraints mapped within the TLSA included:
Discipline ConstraintsHydrology • Waterbody (100 m buffer)
• Navigable waterway (screening level) Fisheries • Riparian zone/Waterbody (100 m buffer)
• Fish bearing stream (known and high potential) • Water Act Stream Classification
Soils • Highly erosion-sensitive soils Vegetation • Documented rare plant occurrences
• Rare ecological communities (per ACIMS listings) • Ecological Land Classification of high plant species richness • Wetlands
Wildlife • Recorded nest/residence sites • Habitat types for key indicator species/guilds (e.g., woodland
caribou, moose and fisher guild) Land and Resource Use • Cabin sites
• Protective Notations • Forestry Industry Sample Plots
Historical Resources • Documented sites (HRV 1-4) • High archaeological potential areas
A complete listing of spatial constraints developed for cumulative constraints mapping is provided in Volume 3, Appendix B, Table B-1.

Devon NEC Corporation Pike 1 Project Volume 2 – Environmental Impact Assessment June 2012
Page 3-8
3.4.3 Spatial Constraint Scoring
3.4.3.1 Attribute Identification and Scoring
Five constraint attributes were defined that reflect potential risks to the Project, the environment and stakeholders. The constraint attributes comprised:
1) Regulatory Interest Have regulators demonstrated a direction/intention towards management of the
constraint? Legislation, Policy and/or Conservation status related to the constraint/VEC
(includes supporting government regulations, guidelines, codes of practice, objectives, standards).
2) Sensitivity (Biophysical) Is the constraint sensitive to change? Constraint/VEC’s susceptibility to disturbance, impact reversibility.
3) Mitigability Can impacts to the constraint be mitigated? Potential and difficulty for successfully mitigating impacts to the constraint/VEC.
4) Duration for Recovery How long before the resource recovers following impact? Anticipated timeframe for restoration of equivalent function or capability of the
constraint/VEC.
5) Stakeholders Do non-governmental stakeholders have concerns regarding the constraint? Degree of known stakeholder concern regarding the constraint/VEC.
For each of the above attributes, scores from zero to five were defined based on the level of risk each one may present for a given constraint; a score of zero represents a low relative risk while a score of five represents the highest relative risk. A description of the score definitions for each attribute is provided in Volume 3, Appendix B. Each spatial constraint was then scored out of five for each of the attribute categories.
3.4.3.2 Weighted Constraint Scoring
Through a set of workshops with Devon and EIA team representatives, the five constraint attributes were assigned weightings of relative importance in terms of environmental risks and likelihood of influencing Project design. A pair-wise comparison method was employed to develop relative weightings for each of the five attributes, with weightings described as eigenvectors or “e” values.

Devon NEC Corporation Pike 1 Project Volume 2 – Environmental Impact Assessment June 2012
Page 3-9
Pairwise comparison is an established mathematical method for comparing entities in discrete pairs to judge which of each pair is preferred. Use of this method generates reliable relative weightings of evaluation factors used in multivariate comparison and decision making. This method involves the development of a matrix expressing the relative values of a set of attributes (i.e., the Saaty Rating Scale; see Volume 3, Appendix B), with the basic but reasonable assumption that if attribute A is absolutely more important than attribute B and is rated at 9, then B must be absolutely less important than A and is valued at 1/9. After all pair-wise comparisons of attributes were completed, Eigenvector scores were calculated for each attribute that reflect the relative weighting of each. A consistency ratio was calculated to measure how consistent the pair-wise determinations were relative to large samples of purely random judgements. The results of the pair-wise comparison of attributes are provided in Volume 3, Appendix B. Finally, for each constraint, the non-weighted attribute scores were multiplied by the respective attributes’ Eigenvector (relative weight) and then the attribute values were summed to give a final weighted score for that constraint.
3.4.4 Cumulative Constraints Map Production
To produce the final cumulative constraints map for use in Project planning, a map layer for each spatial constraint was created using the weighted score for that constraint where it occurred within the study area. All constraint map layers were overlain using ArcGIS to produce a colour-graded map. Using this mapping tool, the degree of cumulative constraint shown in an area reflects the sum of the component constraints’ weighted scores present in that area.
3.4.5 Project Layout Planning
The primary objective of Project development planning is to ensure that recovery of the bitumen resource is optimized. Project facilities must, therefore, be located within specified geological parameters (e.g., location of bitumen net pay zones). For the initial step in Project footprint development, ArcGIS was used to display bitumen trend mapping within the TLSA and Project surface facilities were placed in locations considered optimal for resource recovery. It was recognized that there are spatial features within the Project area that would be particularly favourable for development, as development in these areas could minimize potential environmental impacts and/or minimize construction costs and challenges. Where such features could be mapped, they were defined as preferred development areas. Identification of these areas allows for planning to use existing clearings to minimize new disturbance, parallel existing linear disturbances to minimize habitat fragmentation, and shift facilities towards upland areas where possible. Conversely, development constraints were identified that would preclude or pose substantial challenges to safely constructing surface facilities. Such constraints included steeply sloping areas, existing active infrastructure and specific drainage areas identified in wet areas mapping. These layers are not scored with environmental constraints but represent requirements to assist in construction and operations for resource recovery.

Devon NEC Corporation Pike 1 Project Volume 2 – Environmental Impact Assessment June 2012
Page 3-10
As the second step of footprint development, the initial footprint was adjusted to optimize utilization of the preferred development areas and avoidance of development constraints. Examples of these areas and constraints are provided in Table 3.4-1.
Table 3.4-1: Preferred Development Areas and Constraints
Preferred Development Areas Development Constraints Existing clearings (strat wells, seismic, cutblocks) – updated annually
Active infrastructure, dispositions
Adjacent to existing infrastructure – to minimize new disturbance/fragmentation
Steep slopes (e.g., >10%)
Uplands/mineral soils (peat < 40cm) Wet areas mapping
Third, the cumulative environmental constraints map was overlain with the revised footprint to optimize disturbance relative to the areas of constraint and the footprint was shifted further to minimize environmental impacts. Application of the cumulative constraints map to the Project footprint development process can be summarized in the following six steps:
• Step 1: Place Project facilities in ideal locations based on optimal resource recovery (bitumen net pay);
• Step 2: Overlay with ArcGIS layer of preferred development areas and development constraints and adjust footprint to optimize placement to the extent feasible;
• Step 3: Overlay with ArcGIS layer of cumulative constraints mapping;
• Step 4: If areas of higher constraint are encountered adjust footprint to the extent possible and optimize footprint on areas of lower constraint;
• Step 5: Review individual layers to understand remaining underlying constraints and adjust footprint to avoid specific remaining constraints, if required; and
• Step 6: For constraints that cannot be avoided, develop mitigation and/or management and/or monitoring to address potential residual impact to constraint.
The above process was implemented for the Project during footprint development sessions that included representatives from Devon’s project development, facilities, operations, environment/regulatory groups, and Devon’s environmental consultants. Shifts were made to the locations of individual facilities to optimize use of existing disturbances and to avoid areas of high constraint and sensitive features. Examples of adjustments made to Project facility locations in response to constraints included:
• shifting well pads outside of 100 m waterbody buffer;
• shifting well pads off of existing infrastructure;
• aligning roads and pipelines to parallel existing corridors and use seismic corridors where feasible;

Devon NEC Corporation Pike 1 Project Volume 2 – Environmental Impact Assessment June 2012
Page 3-11
• shifting well pads to minimize encroachment on caribou habitat and patterned fen;
• shifting well pads to minimize encroachment on drainage channels identified in wet areas mapping;
• avoiding extensive deep peatland; and
• shifting well pads to minimize encroachment on steep slopes. The Project footprint is mapped in the context of the cumulative constraints process in Figure 3.4-1.
3.5 Identification and Evaluation of Impacts
Impact assessments are based upon measured, estimated, or reasonably expected changes in attributes of a selected receptor. These receptors or key resources are considered representative of the larger environment, with the assumption that if little to no impact to the receptor is identified, the broader environment will not be impacted. The identification of receptors is dependent upon scientific understanding of the ecological components and their interactions in the environment with the Project. EIA content is guided both by issues identified during the course of impact assessment and in response to Terms of Reference for the Project. For each identified receptor, an assessment of the potential impact is made using the attributes of direction, geographic extent, magnitude, duration, likelihood, reversibility, and confidence in the relationships between cause and effect. An overall impact assessment rating for each receptor is derived based upon the individual attributes. Attributes may be defined on a discipline-specific basis, where appropriate, to reflect specific regulatory or industry standard assessment methodology. Attribute modifications are described in the specific discipline section where applicable. A residual project impact is defined as an effect that cannot be fully reversed. Thus, the quantification and description of a residual project impact, by definition, includes consideration of available mitigation procedures and opportunities. Impacts discussed in this EIA include those occurring due to the maximum disturbance scenario (e.g., all project components developed and operating at one time) and those impacts remaining after mitigation and reclamation activities have been completed (i.e., the residual project impacts).

Kirby Road
Monday
HayLake
KirbyLake
Sandy
River
Cre
ek
T73
T74
T75
R5W4R6W4R7W4
LegendTerrestrial LSA
Pike Project Footprint
Open Water
Watercourse
Road
Weighted Cumulative Constraint Value0.00 - 3.00
3.12 - 6.00
6.07 - 9.00
9.07 - 12.00
12.01 - 15.00
15.04 - 18.00
18.01 - 21.00
21.01 - 24.00
24.02 - 27.00
27.24 - 32.00
Cumulative EnvironmentalConstraints Map
Pike Project
June 01, 2012
Figure3.4-1
PROVIDED BY:
DEVON CANADAFINAL MAPPING BY:
AMEC
Fig3.4-1 Cumulative Constraints.mxd
±
Source: Devon, GeoBase®, Spatial Data Warehouse.
Map
Pat
h: S
:\Gis
\Pro
ject
s\C
E\D
evon
\040
50_P
ike\
Arc
GIS
Pro
ject
s\Vo
lum
e 02
- Se
ctio
n 03
Sco
pe o
f EIA
\Fig
3.4-
1 C
umul
ativ
e C
onst
rain
ts.m
xd
Ana
lyst
- Ja
y B
outin
1 0 1 20.5
Kilometres1:75000

Devon NEC Corporation Pike 1 Project Volume 2 – Environmental Impact Assessment June 2012
Page 3-13
3.5.1 Direction of the Impact The direction of impact may be described as positive (beneficial), negative (detrimental) or neutral.
Positive: Measured or estimated impact represents a real or potential increase in abundance, quality or other attribute of the receptor. For socio-economic receptors, the effect is desirable.
Negative: Measured or estimated impact represents a real or potential decrease in abundance, quality or other attribute of the receptor. For socio-economic receptors, the effect is undesirable.
Neutral: No measurable or estimated effect on the receptor. A neutral direction indicates that there is no impact to quantify; therefore, no quantitative assessment (extent, magnitude, duration, frequency, reversibility) is possible.
3.5.2 Geographic Extent of the Impact Impacts may be confined to small areas or may occur over a large geographic extent. Generally, impacts may be local or regional:
Local: Measured or estimated impact occurs only within the boundaries of the local study area. For socio-economic receptors, the effect will be limited to specific persons or communities.
Regional: Measured or estimated impact occurs beyond the boundaries of the local study area and mainly within the boundaries of the regional study area. The socio-economic assessment may also include impacts at a provincial level within Alberta, or effects that extend nationally.
3.5.3 Magnitude of the Impact Three levels of magnitude of the impact have been selected:
Low: Measured or estimated impact represents less than 1% change in the receptor (quality, quantity, or other attribute) from baseline conditions, and is within the range of normal variability.
Moderate: Measured or estimated impact represents a 1% to 10% change in the receptor (quality, quantity, or other attribute) from baseline conditions, and is unlikely to pose a serious risk to a receptor.
High: Measured or estimated impact represents a greater than 10% change in the receptor (quality, quantity, or other attribute) from baseline conditions, and may require greater mitigation or management.

Devon NEC Corporation Pike 1 Project Volume 2 – Environmental Impact Assessment June 2012
Page 3-14
By this definition, a magnitude rating of low (<1% change in the receptor) is applied even when no or minimal impact is predicted. While a rating of negligible could have been included in this system, there is often little distinction between a negligible rating and a rating of less than 1% impact (i.e., low). Within the limits and precision of impact assessment methodology, negligible and low ratings can be considered synonymous. A 10% cutoff for the definition of a high magnitude impact was selected since it has been used in other recent EIAs for oil sands projects and because of stakeholder concerns that use of a higher cutoff may result in the downgrading of impacts.
3.5.4 Duration of the Impact
Some impacts may persist for short periods of time, others may be permanent. The following designations for duration of impact are used:
Short-term: Measured or estimated impact persists for no longer than five years.
Mid-term: Measured or estimated impact persists to the end of the operational life of Project.
Long-term: Measured or estimated impact is measurable beyond the end of the operational life of the Project.
3.5.4.1 Frequency of Impact
Impacts can occur with various frequencies. Some impacts, such as upsets, may never occur or occur very infrequently. Some impacts may occur during a specific season, and recur annually. Some occur continuously, such as continuous air emissions.
Infrequent: Measured or estimated impact occurs only a few times during the life of the Project.
Seasonal: Measured or estimated impact occurs during a clearly defined season(s) and recurs annually.
Continuous: Measured or estimated impact occurs on an ongoing basis.
3.5.5 Reversibility
Reversibility is the capability of the environment to return to a capacity or condition equivalent to the baseline after the impact ceases. Many impacts of development can be reversed (e.g., air emissions cease when Project operations cease). Others may not be reversed. The recovery time is described by the impact duration.
Reversible: Impacts can be reversed over time.
Irreversible: Impacts cannot be reversed.

Devon NEC Corporation Pike 1 Project Volume 2 – Environmental Impact Assessment June 2012
Page 3-15
3.5.6 Confidence
All estimations or judgments of direction, geographic extent, magnitude, duration, likelihood, and reversibility of an impact are made on the basis of available data and information. While every attempt is made to collect and interpret data and information, there remain instances where the understanding of the data remains weak, or where the quantity of data may be insufficient. To account for this, an expression of confidence is made for each impact assessment:
Low: No clear understanding of cause and effect because of lack of relevant information base and/or limited opportunity for rigorous data collection.
Moderate: Moderate understanding of cause and effect from existing knowledge base, but potential for site and time-specific variability, and/or moderate site-specific data available. Limited predictive ability due to variability over time and/or space.
High: High understanding of cause and effect from existing knowledge base and/or high quality site-specific data available. Limited potential for site and/or time-specific variability.
The confidence attribute is based upon the amount and adequacy of data, as well as an understanding of the relationship(s) between the potential cause(s) of the residual Project impact(s).
3.5.7 Final Impact Rating
In all attributes there are both objective and subjective considerations. Objective considerations include quantitative comparisons between predicted residual Project impacts and established quantitative limits such as ambient air objectives and water quality guidelines, regional environmental objectives, and forestry harvest quotas. Subjective considerations, or professional judgments, are required when impacts cannot be predicted quantitatively due to limited data availability or when there are no benchmarks against which to compare predicted quantitative impacts. For each individual impact assessment, a final impact rating of low, moderate, or high is stated. This is based upon the integration of quantitative analysis (where possible) and professional judgment that takes into account the various rankings for each attribute (direction, magnitude, geographic extent, duration, likelihood, reversibility, and confidence). This is applied to both the Project-specific impact and cumulative effects assessments.
3.6 Assessment Cases
The Project is assessed on the basis of three development cases: Baseline, Application, and Planned Development.
Devon NEC Corporation Pike 1 Project Volume 2 – Environmental Impact Assessment June 2012
Page 3-16
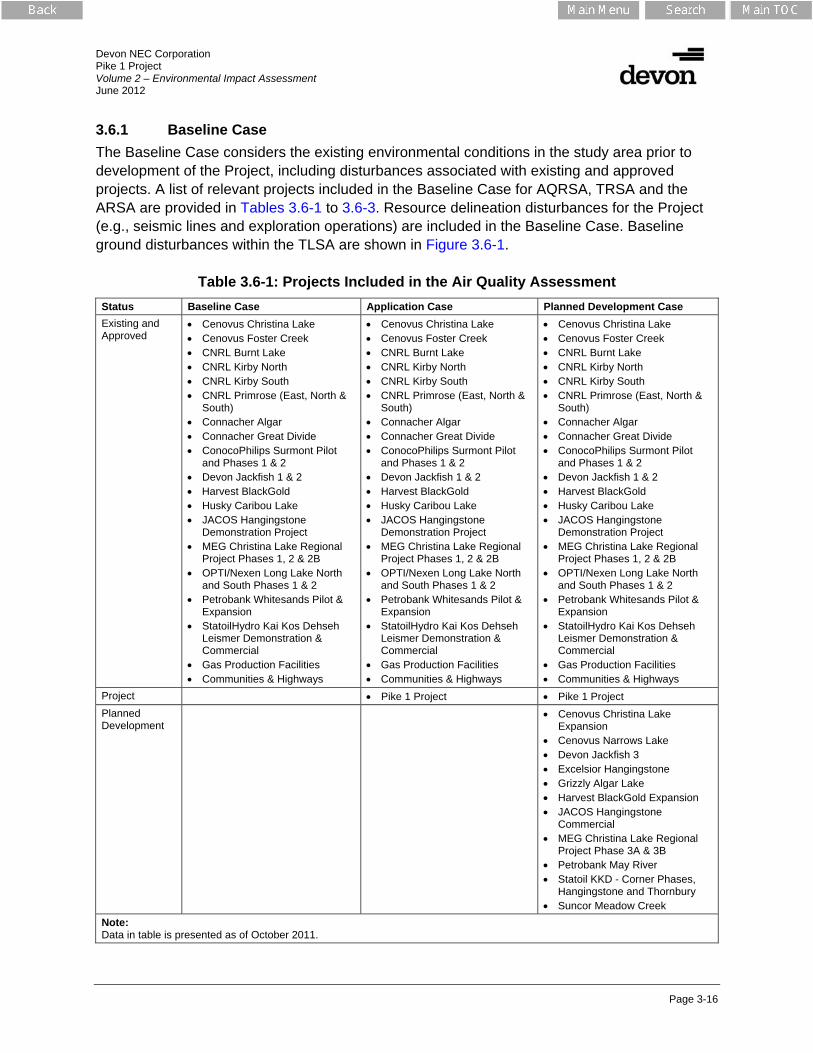
3.6.1 Baseline Case The Baseline Case considers the existing environmental conditions in the study area prior to development of the Project, including disturbances associated with existing and approved projects. A list of relevant projects included in the Baseline Case for AQRSA, TRSA and the ARSA are provided in Tables 3.6-1 to 3.6-3. Resource delineation disturbances for the Project (e.g., seismic lines and exploration operations) are included in the Baseline Case. Baseline ground disturbances within the TLSA are shown in Figure 3.6-1.
Table 3.6-1: Projects Included in the Air Quality Assessment Status Baseline Case Application Case Planned Development Case Existing and Approved
• Cenovus Christina Lake • Cenovus Foster Creek • CNRL Burnt Lake • CNRL Kirby North • CNRL Kirby South • CNRL Primrose (East, North &
South) • Connacher Algar • Connacher Great Divide • ConocoPhilips Surmont Pilot
and Phases 1 & 2 • Devon Jackfish 1 & 2 • Harvest BlackGold • Husky Caribou Lake • JACOS Hangingstone
Demonstration Project • MEG Christina Lake Regional
Project Phases 1, 2 & 2B • OPTI/Nexen Long Lake North
and South Phases 1 & 2 • Petrobank Whitesands Pilot &
Expansion • StatoilHydro Kai Kos Dehseh
Leismer Demonstration & Commercial
• Gas Production Facilities • Communities & Highways
Project • Pike 1 Project • Pike 1 Project Planned Development
• Cenovus Christina Lake Expansion
• Cenovus Narrows Lake • Devon Jackfish 3 • Excelsior Hangingstone • Grizzly Algar Lake • Harvest BlackGold Expansion • JACOS Hangingstone
Commercial • MEG Christina Lake Regional
Project Phase 3A & 3B • Petrobank May River • Statoil KKD - Corner Phases,
Hangingstone and Thornbury • Suncor Meadow Creek
Note: Data in table is presented as of October 2011.

Devon NEC Corporation Pike 1 Project Volume 2 – Environmental Impact Assessment June 2012
Page 3-17
Table 3.6-2: Projects Encompassed Within the TRSA Status Baseline Case Application Case Planned Development Case
Existing and Approved
• Cenovus Christina Lake • CNRL Kirby North • CNRL Kirby South • Devon Jackfish 1 & 2 • Harvest BlackGold
• Cenovus Christina Lake • CNRL Kirby North • CNRL Kirby South • Devon Jackfish 1 & 2 • Harvest BlackGold
• Cenovus Christina Lake • CNRL Kirby North • CNRL Kirby South • Devon Jackfish 1 & 2 • Harvest BlackGold
Project • Pike 1 Project • Pike 1 Project
Planned Development
• Cenovus Christina Lake Expansion
• Cenovus Narrows Lake • Devon Jackfish 3 • Harvest BlackGold Expansion • MEG Christina Lake Regional
Project Phase 3A
Note: Data in table is presented as of November 2011.
Table 3.6-3: Projects Encompassed Within the ARSA Status Baseline Case Application Case Planned Development Case
Existing and Approved
• Cenovus Christina Lake • CNRL Kirby North • CNRL Kirby South • Devon Jackfish 1 & 2 • Harvest BlackGold
• Cenovus Christina Lake • CNRL Kirby North • CNRL Kirby South • Devon Jackfish 1 & 2 • Harvest BlackGold
• Cenovus Christina Lake • CNRL Kirby North • CNRL Kirby South • Devon Jackfish 1 & 2 • Harvest BlackGold
Project • Pike 1 Project • Pike 1 Project
Planned Development
• Cenovus Christina Lake Expansion
• Cenovus Narrows Lake • Devon Jackfish 3 • Harvest BlackGold Expansion
Note: Data in table is presented as of November 2011.

Kirby Road
Monda
y
HayLake
KirbyLake
Paul'
s Roa
d
Sandy
River
Cree
k
T73
T74
T72
T75
R5W4R6W4R7W4Legend
Terrestrial LSA
Cold Lake Air Weapons Range
Open Water
Watercourse
Road
Baseline Disturbance
Pike 1 Project
May 24, 2012
Figure3.6-1
PROVIDED BY:
AMECFINAL MAPPING BY:
AMEC
Fig3.6-1 Baseline Disturbance.mxd
±
1 0 1 20.5
Kilometres1:125000M
ap P
ath:
S:\G
is\P
roje
cts\
CE
\Dev
on\0
4050
_Pik
e\A
rcG
IS P
roje
cts\
Volu
me
02 -
Sec
tion
03 S
cope
of E
IA\F
ig3.
6-1
Bas
elin
e D
istu
rban
ce.m
xd
Ana
lyst
- C
laud
ia F
uent
es
Source: Devon, © Department of Natural Resources Canada.All rights Reserved, GeoBase®, Spatial Data Warehouse Ltd.
Baseline Disturbance
Borrow Pit
Industrial/Clearing
Powerline
ROW
Road
Seismic
Trail
Wellsite

Devon NEC Corporation Pike 1 Project Volume 2 – Environmental Impact Assessment June 2012
Page 3-19
3.6.2 Application Case The Application Case considers the baseline conditions with the effects of the Project added (Tables 3.6-1 to 3.6-3). The Project contribution is also documented alone where applicable. Where local or regional environmental limits have been set (e.g., air emissions or water use) the Application Case will show if the Project can operate within these limits.
3.6.3 Planned Development Case Assessment of the Planned Development Case (PDC) is applied to evaluate cumulative effects that result from the interaction of several projects or activities within a region. These impacts may occur as a result of simultaneous activities within the same geographic boundaries and/or activities that occur over time. The PDC considers existing, approved and planned (i.e., publicly disclosed) activities (Tables 3.6-1 to 3.6-3). Although the impacts associated with each individual activity may be acceptable, the combined effects may be deemed unacceptable. A PDC assessment was completed for those Project receptors where measurable incremental impacts could act cumulatively in the regional study area with other land use pressures. For those receptors where incremental impacts from the Project cannot be measured at the regional scale, or where effects of other planned projects do not overlap within those of the Project, a PDC assessment was not conducted. The list of projects included for the assessment cases in the Air Quality assessment are listed in Table 3.6-1. This list includes all projects whose emissions have the potential to interact with and contribute to air emissions and deposition from the Project. Tables 3.6-2 and 3.6-3 list those projects whose terrestrial footprints occur in whole or in part within the boundaries of the terrestrial and aquatics local study areas (TRSA and ARSA) respectively, for assessment of cumulative impacts. Information used in the PDC for each of these facilities was obtained from publicly available documents (e.g., applications for regulatory approval, monitoring reports submitted to AENV) or from contacting the company directly.
3.7 References
Alberta Environment (AENV). 2011. Guide to Preparing Environmental Impact Assessment Reports in Alberta – Updated February 9, 2011. Alberta Environment, Environmental Assessment Team, Edmonton, Alberta. EA Guide 2009-2. 26 pp.
Alberta Environment, Alberta Energy and Utilities Board, and Natural Resources Conservation Board (AENV, EUB and NRCB). 2000. Cumulative Effects Assessment in Environmental Impact Assessment Reports Required Under the Alberta Environmental Protection and Enhancement Act. Alberta Environment. Edmonton, Alberta. 6 pp.