voltage-based limits on pv hosting capacity of … the ansi c84.1 requirements apply. range a...
TRANSCRIPT

Voltage-based limits on PV hosting capacity of distribution circuitsMichael Ropp, Ph.D., P.E.Northern Plains Power
TechnologiesBrookings, SD 57006 USA

Brief description of NPPTWhat we do
• Simulation studies for design, planning, compliance, analysis, characterization, owner’s engineer
• Controls design, testing, diagnosis• Protection/arc flash• Testing (simulation and HIL)• Event/root-cause analysis• “Traditional” EMT-type studies
Application areas• Energy storage systems• Distribution automation/FLISR• Low-inertia systems (island, remote
community, military, microgrids)• Distributed generation• Utility scale PV/wind• Overvoltage mitigation• Harmonics/power quality• Protection and arc flash, especially
with DC and current-limited sources
2

Distributed energy resources (DERs) and circuit voltage profiles
3

Avoiding voltage problems caused by DERs
• Ideally, we’d do a time-domain simulation of the circuit. Best physical fidelity, but a) need irradiance data, and b) expensive and time-consuming.
• Can study the situation. CYME/Synergi/WindMil and other distribution circuit simulators provide pretty good tools for this. However, a) not a true simulation, b) still need irradiance data, and c) still relatively time-consuming to do an 8760-type simulation.
• We need quick, simple design guidelines that can be used at the planning stage as compliance screens. Situations not resolved by this screen can still be studied further.
4
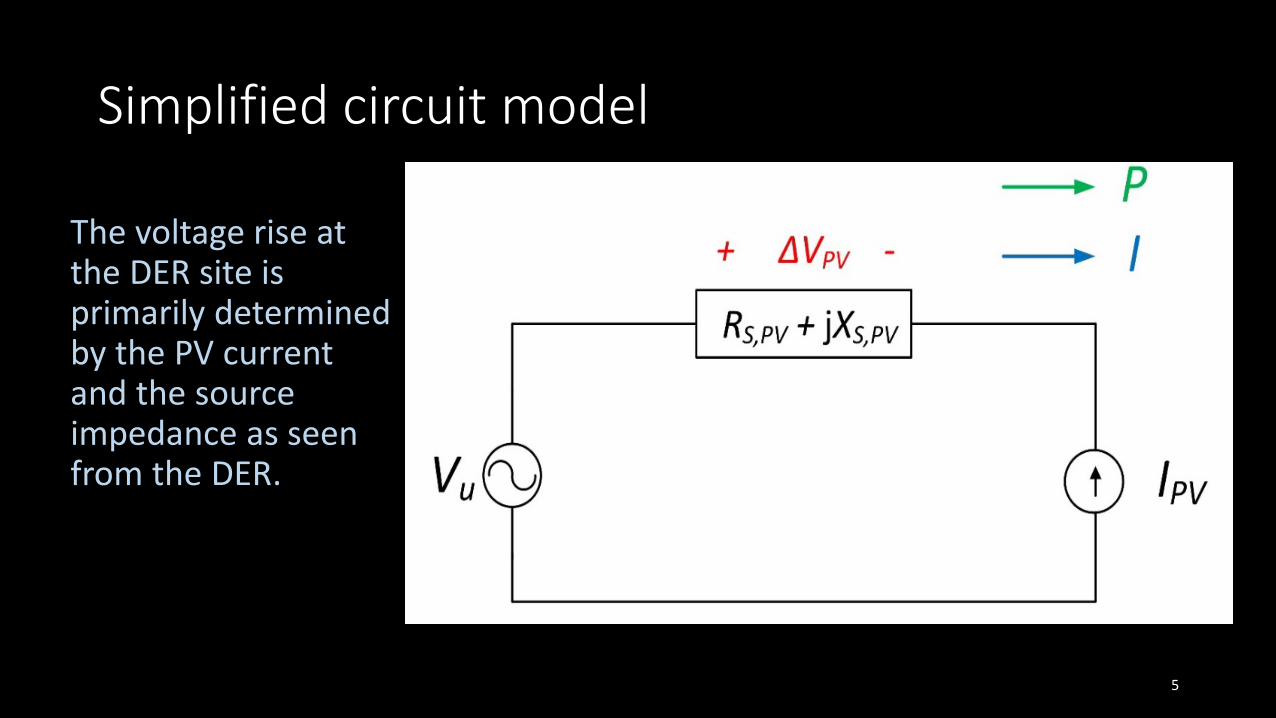
Simplified circuit model
The voltage rise at the DER site is primarily determined by the PV current and the source impedance as seen from the DER.
5

Circuit analysis
From the basic circuit model we can derive an equation that gives the voltage change at the PV PCC:
• ∆VPV is the fractional change in voltage at the PV POI caused by the change in PV output;• RS,PV and XS,PV are the real and reactive source impedance as seen from the POI of the PV plant in question
looking back up toward the utility source;• PPV and QPV are the change in injected real and reactive power per phase at the POI, using the load sign
convention noted in Figure 1 (i.e., power injected by the PV plant is negative); and• Vr is the nominal voltage at the PCC.
6
∆𝑉𝑉𝑃𝑃𝑃𝑃𝑉𝑉𝑟𝑟
≈𝑅𝑅𝑆𝑆,𝑃𝑃𝑃𝑃 × 𝑃𝑃𝑃𝑃𝑃𝑃 + 𝑋𝑋𝑆𝑆,𝑃𝑃𝑃𝑃 × 𝑄𝑄𝑃𝑃𝑃𝑃
𝑉𝑉𝑟𝑟2+ 𝑗𝑗
𝑋𝑋𝑆𝑆,𝑃𝑃𝑃𝑃 × 𝑃𝑃𝑃𝑃𝑃𝑃 − 𝑅𝑅𝑆𝑆,𝑃𝑃𝑃𝑃 × 𝑄𝑄𝑃𝑃𝑃𝑃𝑉𝑉𝑟𝑟2

Simplify it
• If the PV is operating at unity power factor we can set the reactive output to zero.
• Also assume X/R is < 4.5.• Then:
7
𝑃𝑃𝑃𝑃𝑃𝑃,𝑎𝑎𝑎𝑎𝑎𝑎𝑎𝑎𝑎𝑎𝑎𝑎𝑎𝑎 ≈∆𝑉𝑉′𝑎𝑎𝑎𝑎𝑎𝑎𝑎𝑎𝑎𝑎𝑎𝑎𝑎𝑎,𝑃𝑃𝑃𝑃 × 𝑉𝑉𝑟𝑟2
𝑅𝑅𝑆𝑆,𝑃𝑃𝑃𝑃

What should ∆Vallowed be?
8
For steady-state voltages, the ANSI C84.1 requirements apply. Range A applies at the PCC.

Another consideration: EMVR operations
9
Must also ensure that electromechanical voltage regulators (EMVRs) like line regulators and voltage-switched caps do not operate excessively when PV is added.

Minimizing the impact on EMVRs
• We need to minimize the ∆V caused by the PV plant at the EMVR location. The equation that gives this is essentially the same as that which gives the ∆V at the PCC:
• This is the same equation as from the PCC, but with the source impedances as seen from the EMVR.
10
∆𝑉𝑉𝐸𝐸𝐸𝐸𝑃𝑃𝐸𝐸𝑉𝑉𝑟𝑟 ,𝐸𝐸𝐸𝐸𝑉𝑉𝑅𝑅
≈𝑅𝑅𝑆𝑆,𝐸𝐸𝐸𝐸𝑃𝑃𝐸𝐸 × ∆𝑃𝑃𝐸𝐸𝐸𝐸𝑃𝑃𝐸𝐸 + 𝑋𝑋𝑆𝑆,𝐸𝐸𝐸𝐸𝑃𝑃𝐸𝐸 × ∆𝑄𝑄𝐸𝐸𝐸𝐸𝑃𝑃𝐸𝐸
𝑉𝑉𝑟𝑟2+ 𝑗𝑗
𝑋𝑋𝑆𝑆,𝐸𝐸𝐸𝐸𝑃𝑃𝐸𝐸 × ∆𝑃𝑃𝐸𝐸𝐸𝐸𝑃𝑃𝐸𝐸 − 𝑅𝑅𝑆𝑆,𝐸𝐸𝐸𝐸𝑃𝑃𝐸𝐸 × ∆𝑄𝑄𝐸𝐸𝐸𝐸𝑃𝑃𝐸𝐸𝑉𝑉𝑟𝑟2

Recommended procedure: step 1
First, calculate the allowable PV plant size that keeps ∆VEMVR within the control bandwidth of EMVRs upstream from the PV plant:
𝑷𝑷𝑷𝑷𝑷𝑷,𝒂𝒂𝒂𝒂𝒂𝒂𝒂𝒂𝒂𝒂𝒂𝒂𝒂𝒂 ≈∆𝑷𝑷′𝒂𝒂𝒂𝒂𝒂𝒂𝒂𝒂𝒂𝒂𝒂𝒂𝒂𝒂,𝑬𝑬𝑬𝑬𝑷𝑷𝑬𝑬 × 𝑷𝑷𝒓𝒓𝟐𝟐
𝑬𝑬𝑺𝑺,𝑬𝑬𝑬𝑬𝑷𝑷𝑬𝑬
where ∆V’allowed,EMVR is a unitless fraction and is set equal to one-half of the control bandwidth of the affected EMVR. The control bandwidth is usually taken to be 0.0125 but may be as large as 0.03 in some cases. If the EMVR is using line drop compensation, that must also be considered.
11

Recommended procedure: step 2
Then, calculate the allowable PV plant size ensure that ∆VPV does not lead to ANSI A violations using Equation (3) (repeated here for convenience):
𝑷𝑷𝑷𝑷𝑷𝑷,𝒂𝒂𝒂𝒂𝒂𝒂𝒂𝒂𝒂𝒂𝒂𝒂𝒂𝒂 ≈∆𝑷𝑷′𝒂𝒂𝒂𝒂𝒂𝒂𝒂𝒂𝒂𝒂𝒂𝒂𝒂𝒂,𝑷𝑷𝑷𝑷 × 𝑷𝑷𝒓𝒓𝟐𝟐
𝑬𝑬𝑺𝑺,𝑷𝑷𝑷𝑷with the value of ∆V’allowed,PV as determined by:
∆𝑉𝑉′𝑎𝑎𝑎𝑎𝑎𝑎𝑎𝑎𝑎𝑎𝑎𝑎𝑎𝑎,𝑃𝑃𝑃𝑃 = 1.05 − 𝑉𝑉𝑞𝑞𝑞𝑞𝑎𝑎𝑎𝑎 − 𝑉𝑉𝑃𝑃𝑃𝑃𝑃𝑃𝑎𝑎𝑃𝑃𝑎𝑎
where VPVbase is the steady-state voltage at the PV POI after the PV reaches 0% power in the 100% to 0% power “trip test”, and Vquad accounts for the neglect of the quadrature term.
12

That “Vquad” term
Vquad is intended to compensate for the neglect of the quadrature term in Equation (1). It depends on the ratio of XS,PV to RS,PV as follows:
13
XS,PV/RS,PV Vquad2 0.005
2.5 0.013 0.01
3.5 0.0154 0.02
4.5 0.025

Step 3
The allowable PV plant size, assuming unity power factor operation, is the lesser of the values calculated in Steps 1 and 2. The PPV,allowedcalculated in this way will be per-phase (multiply by 3 to get rated plant size).
14

Cases with EMVRs downstream from the PV
• For all locations downstream from the PV, the applicable ∆V is that seen at the PV PCC.
• However, if there are EMVRs downstream from the PV, the value of ∆Vallowed will be that associated with the EMVR (1/2 of the BW).
• In this case, the value of PPV,allowed can end up being quite small.• Nonunity pf operation should definitely be considered in this case.
15

Mitigation of ∆V issues
• Constant nonunity power factor operation works very well, IF it can be done without violating a substation var flow constraint.
• For constant power factor, QPV = k × PPV where k is a constant. Then we can rewrite Equation (1) this way:
16
∆𝑉𝑉𝑃𝑃𝑃𝑃𝑉𝑉𝑟𝑟
≈𝑅𝑅𝑆𝑆,𝑃𝑃𝑃𝑃𝑃𝑃𝑃𝑃𝑃𝑃 − 𝑘𝑘𝑋𝑋𝑆𝑆,𝑃𝑃𝑃𝑃𝑃𝑃𝑃𝑃𝑃𝑃
𝑉𝑉𝑟𝑟2
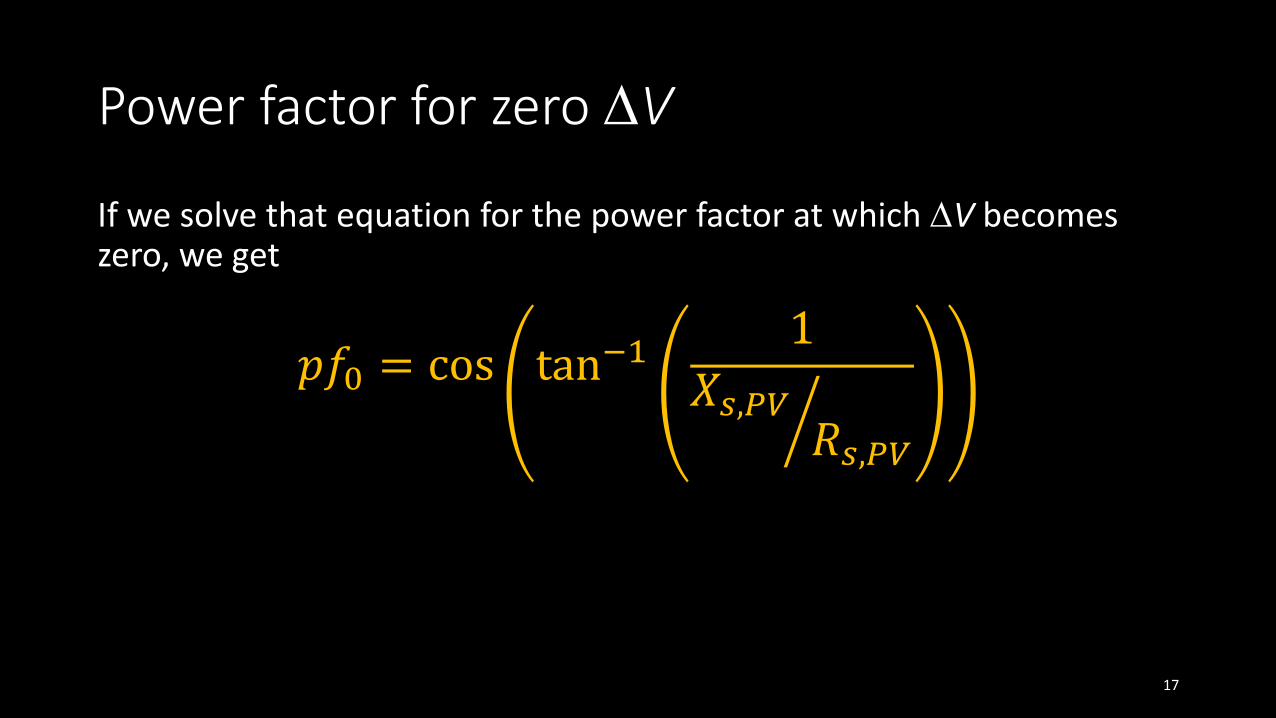
Power factor for zero ∆V
If we solve that equation for the power factor at which ∆V becomes zero, we get
17
𝑝𝑝𝑝𝑝0 = cos tan−11
�𝑋𝑋𝑃𝑃,𝑃𝑃𝑃𝑃𝑅𝑅𝑃𝑃,𝑃𝑃𝑃𝑃

Power factor to obtain ∆V’allowed
We don’t actually have to obtain ∆V = 0, so in practice we could use
where
18
𝑝𝑝𝑝𝑝0 = cos tan−1 𝜑𝜑
𝜑𝜑 =𝑅𝑅𝑆𝑆,𝑃𝑃𝑃𝑃𝑃𝑃𝑃𝑃𝑃𝑃 − ∆𝑉𝑉′𝑎𝑎𝑎𝑎𝑎𝑎𝑎𝑎𝑎𝑎𝑎𝑎𝑎𝑎,𝑃𝑃𝑃𝑃𝑉𝑉𝑟𝑟2
𝑋𝑋𝑆𝑆,𝑃𝑃𝑃𝑃𝑃𝑃𝑃𝑃𝑃𝑃

What about using “smart inverter” volt-varcontrols?• IEEE P1547 will require all
inverters to have the capability to implement a volt-var droop function like this one.
• Could we use this instead of fixed power factor? Yes.
• One challenge: ensuring that volt-var functions in multiple inverter plants do not oscillate with each other.
19

Inverters on the same circuit
• It is well known at this point that it is possible for multiple volt-varcontrolling inverters on the same circuit to “chase” each other and oscillate. Factors:
• Circuit impedance• Droop slope• Controller speed/response time
• Mitigation• Slow functions down• “Dynamic reactive current” or similar
concepts
20https://www.researchgate.net/publication/308822645_Evaluation_of_multiple_inverter_volt-VAR_control_interactions_with_realistic_grid_impedances

Flicker?
• The appropriate flicker standard is IEEE 1453-2015, which is based on IEC standards.
• The old “GE curve” assumed a rectangular modulation (top), but from cloud passages we’ll have more of a “double ramp” (bottom).
• Bottom line: when you run this wave shape through the flicker meter, you find that the ∆Vallowed from flicker is larger than the ANSI C84.1 limits.
• Conclusion: flicker is not a limiting factor in PV plant hosting capacity.
21

What about RVCs?
• RVCs = Rapid Voltage Changes. Basically, a change in the RMS fundamental-frequency voltage that occurs very quickly, over only a few cycles (approximating a step change), while the system is in its normal operating ranges.
• Tripping• Transformer energization
• IEEE 1453.1-2012 says:
22

What about RVCs?
• For PV plants:• RVCs would be caused by tripping or transformer re-energization.• The n ≤ 4/day is the most appropriate value for that event. A PV plant
producing more RVCs/day than that is malfunctioning.
• The suggested ∆Vallowed at an MV PCC would thus be 5-6%. IEEE P1547 adopted 5%.
• One should apply this value to PV plants one at a time, not in aggregate. The reason is that synchronized tripping would be expected only during abnormal system conditions, and that is outside of the scope/definition of RVCs.
23