vol i, final report mar-97 - united states environmental ... · vol i, final report mar-97 . ......
TRANSCRIPT
I AP42 Section:
I Related:
4.4
13
Evaluation of Pollution Prevention Techniques to Reduce Styrene Emissions from Open Contact Molding Processes. Vol I, Final Report
Mar-97

United States Environmental Protection
Agency March 199'7
GEPA Research and
'..,
,
Develop men t
EVALUATION C F POLLUTION PREVENTION
TECHNIQUES TO REDUCE STYRENE EMISSICNS
FROM OPEN CONTACT MOLDING PROCESSES
Volume I . F i n a l Repor t
Prepared for
Office of A i r Qual i ty Planning and Standards
Prepared by National Risk Management Research Laboratory Research Triangle Park, NC 2771 1
I r
FOREWORD
d
T h e U. S. Envi ronmenta l Protect ion Agency is cha rged by Congres s with pro- tect ing the Nation's land. air, and wa te r r e s o u r c e s . Under a mandate of national env i ronmen ta l laws, the Agency s t r i v e s to f o r m u l a t e and implement act ions lead- i ng to a compat ible balance between human ac t iv i t ies and the abil i ty of na tu ra l s y s t e m s to support and nu r tu re life. To meet th is mandate , EPAIs r e s e a r c h p r o g r a m is providing da ta and technical suppor t for solving envi ronmenta l pro- b l e m s today and building a sc ience knowledge b a s e n e c e s s a r y to manage our eco- log ica l r e s o u r c e s wisely, unders tand how pollutants affect our health, and pre- vent or r e d u c e envi ronmenta l r i s k s in the future .
'The Nat ional 'Risk Management R e s e a r c h L a b o r a t o r y is the Agency's c e n t e r for invest igat ion of technological and management approaches fo r reducing r i s k s f r o m t h r e a t s to human health and the environment . T h e focus of the Labora to ry ' s r e s e a r c h p r o g r a m is on methods for the prevent ion and cont ro l of pollution to air, l and , wa te r , and s u b s u r f a c e resources; protect ion of w a t e r quali ty in public wa te r s y s t e m s ; r emed ia t ion of contaminated sites and groundwater; and prevent ion and con t ro l of indoor air pollution..,The goal of this r e s e a r c h e f for t is to ca ta lyze deve lopment and implementa t ion of innovative, &st- effective envi ronmenta l technologies; develop scientific and e n g i n e e r i n g h f o r m a t i o n needed by EPA to s u p p o r t regula tory and policy decis ions; and provide technical support and infor mat ion transfer to e n s u r e effective implementa t ion of en i r i ronmen td regula t ions and s t r a t eg ie s .
T h i s publication h a s been produced as p a r t of the L a b o r a t o r y ' s s t r a t e g i c long- t e r m r e s e a r c h plan. I t is published'and m a d e available by EPA's 0ff ice .of Re- s e a r c h and Development to a s s i s t the user community and to. link r e s e a r c h e r s with the i r c l ients .
E. Timothy Oppelt. Director National R i sk Management R e s e a r c h Labora to ry
EPA REVIEW NOTICE
This report has been peer and administratively reviewed by the U.S. Environmental Protection Agency, and approved for publication. Mention of trade n f ime~ of commercial products does not constitute endorsement or recommendation for use.
This document is available to the public through the National Technical Information Service. Springfield, Virginia 22161.
Evaluation Techniques to
EPA-600 / R- 97-018a March 1997
of Pollution Prevention Reduce Styrene Emissions
from Open Contact Molding Processes
Volume I, Final Report
BY
Emery J. Kong, Mark A. Bahner, Robert S. Wright, and C. Andrew Clayton Research Triangle Institute
P.O. Box 12194 Research Triangle Park, NC 27709
EPA Cooperative Agreement CR 8 184 19-03
EPA Project Officer: Geddes Ramsey Air Pollution Prevention and Control Division
National Risk Management Research Laboratory U.S. Environmental Protection Agency
Research Triangle Park, NC 2771 1
Prepared for U.S. Environmental Protection Agency Office of Research and Development
Washington, DC 20460

Abstract
Pollution prevention options to, reduce styrene emissions, such as new materials and application equipment, are commercially available to the operators of open molding processes. However, information is needed about the percent reduction in emissions that is achievable with these options.
To meet this need, several of these pollution prevention options were examined. Options examined were operator techniques, air flow velocities in the spraying area, gel coat and resin formulations, and application equipment. Styrene emission factors calculated from this test result were compared with the existing AP-42 emission factors for gel coat sprayup and resin applications.
The study found that using controlled spraying (Le., reducing overspray), low-styrene and styrene-suppressed materials, and nonatomizing application equipment can reduce styrene emissions from I 1 to 52 percent. Facilities should investigate the applicability and feasibility of these pollution prevention options to reduce their styrene emissions. The calculated emission factors were from 1.6 to 2.5 times the mid-range AP-42 emission factors for the corresponding gel coat and resin application. These results indicate that facilities using existing AP-42 emission factors to estimate emissions in open molding processes are likely to underestimate actual emissions.
i i
Contents
Section Page
Abstract . . . . . . . . . . . . . . . . . . . . . . . . . . . . . . . . . . . . . . . . . . . . . . . . . . . . . . . . . . . . . . . . . . . . . I I
Figures . . . . . . . . . . . . . . . . . . . . . . . . . . . . . . . . . . . . . . . . . . . . . . . . . . . . . . . . . . . . . . . . . . . . . . v Tables . . . . . . . . . . . . . . . . . . . . . . . . . . . . . . . . . . . . . . . . . . . . . . . . . . . . . . . . . . . . . . . . . . . . . . . . vi Acronyms and Abbreviations . . . . . . . . . . . . . . . . . . . . . . . . . . . . . . . . . . . . . . . . . . . . . . . . . . . . vii ConversionTable . . . . . . . . . . . . . . . . . . . . . . . . . . . . . . . . . . . . . . . . . . . . . . . . . . . . . . . . . . . . viii Acknowledgments . . . . . . . . . . . . . . . . . . . . . . . . . . . . . . . . . . . . . . . . . . . . . . . . . . . . . . . . . . . . ix
..
Chapter 1 1 . 1 1.2 1.3 I . 4
Chapter 2 2.1 2.2 2.3
Chapter 3 3.1 3.2 3.3
3.4
Chapter 4 . 4.1 4.2 4.3
Chapter 5 5.1
5.2
Introduction . . . . . . . . . . . . . . . . . . . . . . . . . . . . . . . . . . . . . . . . . . . . . . . . . . . . . . i Background . . . . . . . . . . . . . . . . . . . . . . . . . . . . . . . . . . . . . . . . . . . . . . . . . . . . . . i Objectives . . . . . . . . . . . . . . . . . . . . . . . . . . . . . . . . . . . . . . . . . . . . . . . . . . . . . . . 2 Approach . . . . . . . . . . . . . . . . . . . . . . . . . . . . . . . . . . . . . . . . . . . . . . . . . . . . . . . . 2 Report Outline . . . . . . . . . . . . . . . . . . . . . . . . . . . . . . . . . . . . . . . . . . . . . . . . . . . . . 2 References . . . . . . . . . . . . . . . . . . . . . . . . . . . . . . . . . . . . . . . . . . . . . . . . . . . . . . . 3
Experimental Test Design . . . . . . . . . . . . . . . . . . . . . . . . . . . . . . . . . . . . . . . . . . . 4 Pilot Experiment . . . . . . . . . . . . . . . . . . . . . . . . . . . . . . . . . . . . . . . . . . . . . . . . . . 4
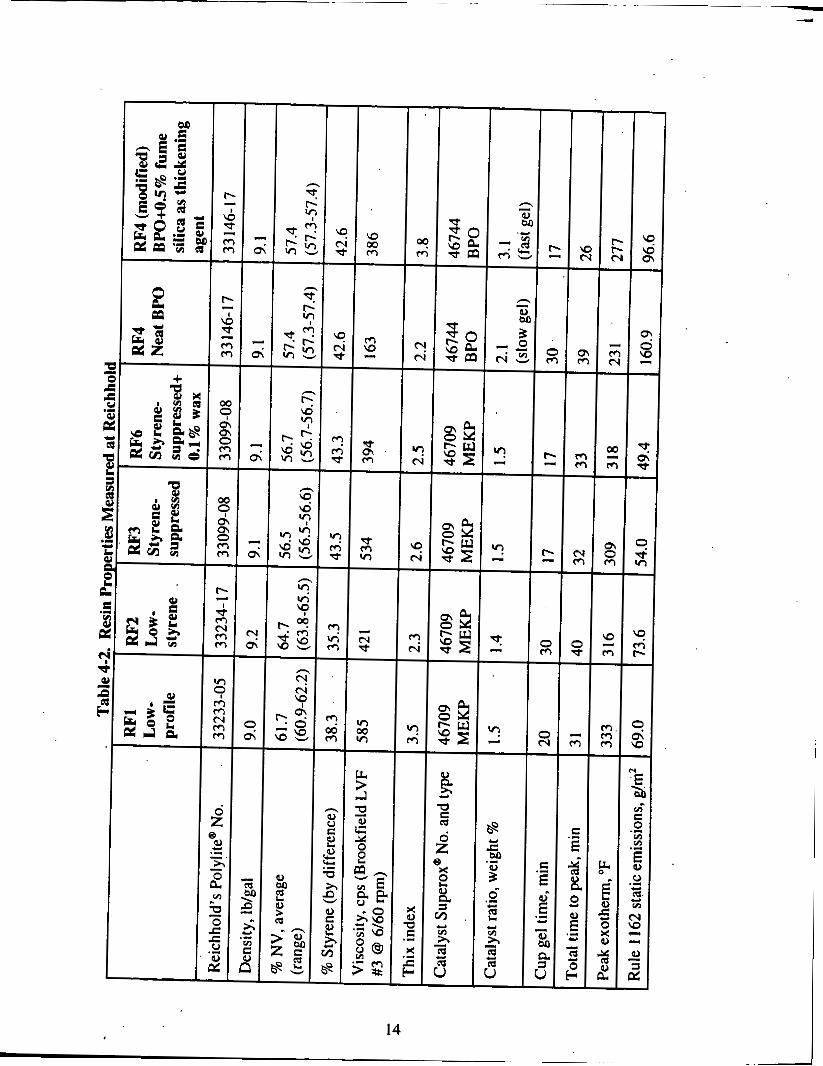
ResinExperiment . . . . . . . . . . . . . . . . . . . . . . . . . . . . . . . . . . . . . . . . . . . . . . . . . . 6
Facility and Experimental Setup . . . . . . . . . . . . . . . . . . . . . . . . . . . . . . . . . . . . . . 8 Total Enclosure System . . . . . . . . . . . . . . . . . . . . . . . . . . . . . . . . . . . . . . . . . . . . . 8 Emission Sampling Location . . . . . . . . . . . . . . . . . . . . . . . . . . . . . . . . . . . . . . . . . 8 Experimental Setup . . . . . . . . . . . . . . . . . . . . . . . . . . . . . . . . . . . . . . . . . . . . . . . . I O 3.3.1 FRPMold . . . . . . . . . . . . . . . . . . . . . . . . . . . . . . . . . . . . . . . . . . . . . . . . . I O 3.3.2 Air Flow Baffle . . . . . . . . . . . . . . . . . . . . . . . . . . . . . . . . . . . . . . . . . . . . IO 3.3.3 Glass Veil and Kraft Paper to Capture Overspray . . . . . . . . . . . . . . . . . . I O 3.3.4 Protective Equipment and Clothing for Operator . . . . . . . . . . . . . . . . . . 12 Resin Property Testing Laboratory . . . . . . . . . . . . . . . . . . . . . . . . . . . . . . . . . . . 12
Materials and Equipment . . . . . . . . . . . . . . . . . . . . . . . . . . . . . . . 1 . . . . . . . . . . . 13 Properties of Gel Coat and Resin Materials . . . . . . . . . . . . . . . . . . . . . . . . . . . . . 13
Reinforcements . . . . . . . . . . . . . . . . . . . . . . . . . . . . . . . . . . . . . . . . . . . . . . . . . . . 17
Gel CoatExperiment . . . . . . . . . . . . . . . . . . . . . . . . . . . . . . . . . . . . . . . . . . . . . . . 5
Setting of Gel Coat and Resin Application Equipment . . . . . . . . . . . . . . . . . . . . 15
Determination of Emission Quantities . . . . . . . . . . . . . . . . . . . . . . . . . . . . . . . . . 18 Emission Measurement Method . . . . . . . . . . . . . . . . . . . . . . . . . . . . . . . . . . . . . 18 5.1.1 5.1.2 Exhaust Air Flow Rate Measurement . . . . . . . . . . . . . . . . . . . . . . . . . . . . 21
Determination of Styrene Concentrations in Exhausted Air . . . . . . . . . . 18
5.1.3 Emissions Determined by Emission Measurement Method . . . . . . . . . . 22 Mass Balance Calculation Method Using Gravimetric Measurements . . . . . . . . 23
i i i

Section
Chapter 6 6.1 6.2 6.3 6.4 6.5 6.6
Chapter 7 7.1 1.2 1.3
Chapter 8 8.1 8.2
Contents (continued)
Test Results and Discussion . . . . . . . . . . . . . . . . . . . . . . . . . . . . . . . . . . . Distribution of Total Emissions During Application and Curing Stages , Pilot Experiment Results . . . . . . . . . . . . . . . . . .'. . . . . . . . . . . . . . . . . , . Gel Coat Experiment Results . . . . . . . . . . . . . . . . . . . . . . . . , . . . . . . . . , Resin Experiment Results . . . . . . . . . . ... . . . . . . . . . . ;. . . , . . . , . . . . . Comparison of Test Results with EPA AP-42 Emission Factors . . . . . . Comparison of Emission Measurement Method and Mass Balance Calculation Method . . . . . . . . . . . . . . . . . . . . . . . . . . . . . . . . . . . . . . . . . 6.6.1 Pure Styrene Evaporation Test . . . . . . . . . . . . . . . . . . . . . . . . . . . 6.6.2 Comparison of Emissions Measured by Two Test Methods . . , ,
Page
. . . . . .
. . . . . .
. . . . . .
. . . . . .
. . . . . .
. . . . . .
. . . . . .
. . . . . .
. . . . . .
21 32 36 39 43 49
52 52 52
Data Quality Issues . . . . . . . . . . . . . . . . . . . . . . . . . . . . . . . . . . . . . . . . . . . . . , .58 Summation of Project QA Activities . . . . . . . . . . . . . . . . . . . . . . . . . . . . . . . , . .58 RTI Internal Technical System Audit (TSA) Results . . . . . . . . . . . . . . . . . . , . . 5 8 EPA Performance Evaluation . . . . . . . . . . . . . . . . . . . . . . . . . . . . . . . . . . . . . , . 59
Conclusions and Recommendations . . . . . . . . . . . . . . . . . . . . . . . . . . . . . . . . . . 6 0 Conclusions . . . . . . . . . . . . . . . . . . . . . . . . . . . . . . . . . . . . . . . . . . . . . . . . . . . . . 60 Recommendations . . . . . . . . . . . . . . . . . . . . . . . . . . . . . . . . . . . . . . . . . . . . . . . . 61
Appendixes.(in Volume 2)
A.
B. C. D. E.
F. G. H. I.
A Category III Quality. Assurance Project Plan for the Evaluation of Pollution Prevention Techniques to Reduce Styrene Emissions from Open Contact Molding Processes Reichhold Standard Test Methods Verification and Intercomparison of Compressed Gas Calibration Standards Summary of Calibration Data, Calibration Error Tests, and Drift Checks A Summary of Emission Measurements, Gravimetric Measurements, and Calculated Emission Quantities and Emission Factors for the Test Statistical Analyses of Test Results THC Analyzer Evaluation: Sampling Line Loss and Pressure Effect An RTI Technical System Audit Report EPA Performance Evaluation of Total Hydrocarbon Analyzer
iv

Figures
d No m 3-1
3-2
Side view of the Reichhold Chemicals spray booth and the experimental setup in a permanent total enclosure . . . : , . , , , , . . . . . . . . . . . . . . . . . . . . . . . . . . . . . . . . . . , . . . 9 Sketch of a male mold . . . . . . . . . . . . . , . . . . . . . . . . . . . . . . . . . . . . . . . . . . . . . , . . , , . 11
5-1 Data recording sheet for mass balance calculation . . . . . . . . . .. . . . . . . . . . . . . . . . . . . , 26
6- 1 6-2 6-3 6-4 6- 5 6-6 6-7 6-8
6-9 6-10
6-1 I
6-12
6-13
6-14
Distribution of emissions in the pilot and gel coat experiments . . . . . . . . . . . . . , . . . . . 34 Distribution of emissions in the resin experiment . . . . . . . . . .. . . . . . . . . . . . . . . . . . . . . 35 Typical emission concentration profiles for normal and controlled gel coat spraying . , 37 Emission reductions observed in the pilot experiment . . . . . . . . . . . . . . . . . . . . . . . . . . 38 Typical emission concentration profiles for regular and low-VOC gel coats . , , . . , , , . 4 0 Typical emission concentration profiles for three types of gel coat spray guns . , . . . . , . 4 I Emission reductions observed in the gel.coat experiment . . . . . . . . . . . . . . . . . . , . . . . .42 Emission concentration prafiles observed for different resin application techniques andequipment . . . . . . . . . . . . . . . . . . . . . . . . . . . . . . . . . . . . . . . . . . . . . . . . . . . . . . . . . . . Typical emission concentration profiles for various resin formulations . . . . . . . . . . . . . 4 6 Typical emission concentration profiles for low-profile, neat BPO, and modified BPOresins . . . . . . . . . . . . . . . . . . . . . . . . . . . . . . . . . . . . . . . . . . . . . . . . . . . . . . . . . . . . 47 Emission reductions observed in the resin experiment: “controlled spraying” technique baseline . . . . . . . . . . . . . . . . . . . . . . . . . . .’. . . . . . . . . . . . . . . . . . . . . . . . . . . 50 Emission reductions observed in the resin experiment: “normal spraying” technique baseline . . . . . . . . . . . . . . . . . . . . . . . . . . . . . . . . . . . . . . . . . . . . . . . . . . . . . . . . Compari.son of mass balance with EPA Method 25A emissions measurements, during pure (100 percent) styrene evaporation tests . . . . . . . . . . . . . . . . . . . . . . . . . . . , 54 Comparison of emission measurement methods . . . . . . . . . . . . . . . . . . . . . . . . . . . . . . . 56
. .
V
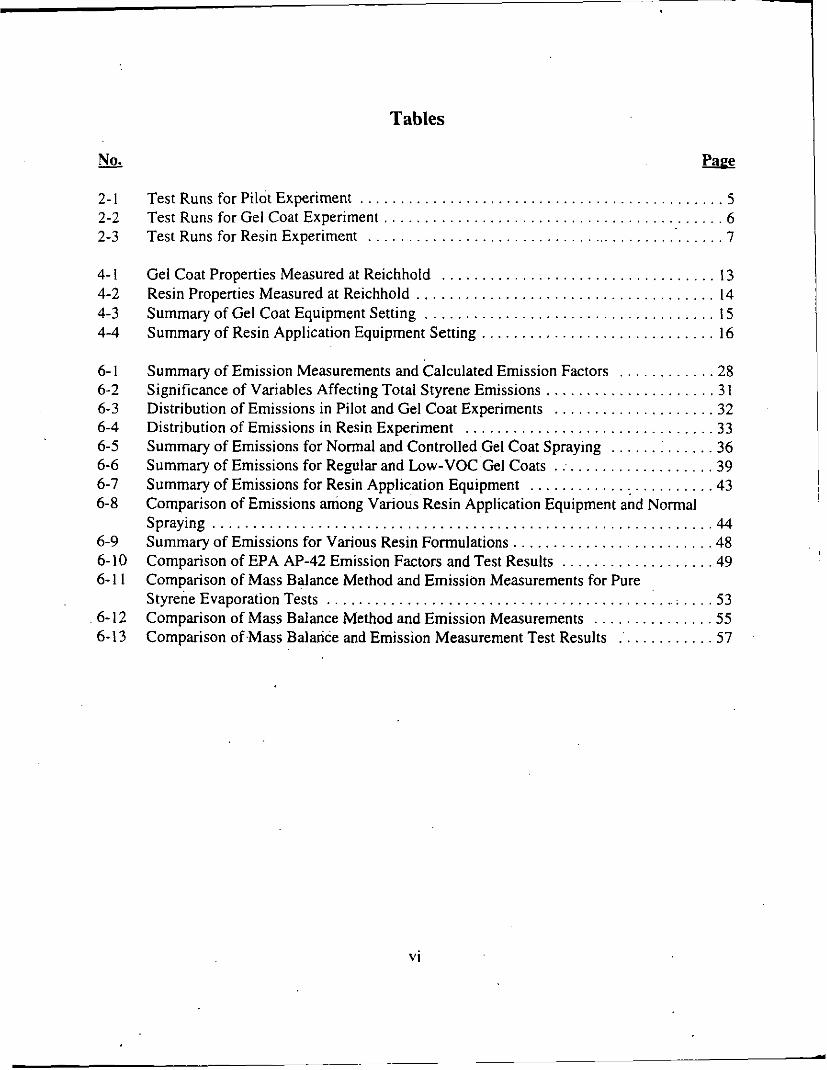
Tables
- No . 2- I 2-2 2-3
4- 1 4-2 4-3 4-4
6- I 6-2 6-3 6-4 6-5 6-6 6-7 6-8
6-9 6-10 6-1 1
6-12 6-13
Test Runs for Pilot Experiment . . . . . . . . . . . . . . . . . . . . . . . . . . . . . . . . . . . . . . . Test Runs for Gel Coat Experiment . . . . . . . . . . . . . . . . . . . . . . . . . . . . . . . . . . . . Test Runs for Resin Experiment . . . . . . . . . . . . . . . . . . . . . . . . . . . . . . . . . . . . . .
Gel Coat Properties Measured at Reichhold . . . . . . . . . . . . . . . . . . . . . . . . . . . . . Resin Properties Measured at Reichhold . . . . . . . . . . . . . . . . . . . . . . . . . . . . . . . . Summary of Gel Coat Equipment Setting . . . . . . . . . . . . . . . . . . . . . . . . . . . . . . . Summary of Resin Application Equipment Setting . . . . . . . . . . . . . . . . . . . . . . . .
Summary of Emission Measurements and Calculated Emission Factors . . . . . . . Significance of Variables Affecting Total Styrene Emissions . . . . . . . . . . . . . . . . Distribution of Emissions in Pilot and Gel Coat Experiments . . . . . . . . . . . . . . . Distribution of Emissions in Resin Experiment . . . . . . . . . . . . . . . . . . . . . . . . . . Summary of Emissions for Normal and Controlled Gel Coat Spraying . . . . . . . . Summary of Emissions for Regular and Low-VOC Gel Coats . . . . . . . . . . . . . . .
. .
. .
. .
. .
. .
. .
. .
. .
. .
. .
. .
. .
. . . . 5
. . . . 6
. . . . 7
. . . 13
. . . 14
. . . 15
. . . 16
. . . 28
. . . 31
. . . 32
. . . 33
. . . 36
. . . 39
. . . 43 Summary of Emissions for Resin Application Equipment . . . . . . . . . . . . . . . . . . . . Comparison of Emissions among Various Resin Application Equipment and Normal Spraying . . . . . . . . . . . . . . . . . . . . . . . . . . . . . . . . . . . . . . . . . . . . . . . . . . . . . . . . . . . . . . 44 Summary of Emissions for Various Resin Formulations . . . . . . . . . . . . . . . . . . . . . . . . . 48 Comparison of EPA AP-42 Emission Factors and Test Results . . . . . . . . . . . . . . . . . . . 49 Comparison of Mass Balance Method and Emission Measurements for Pure Styrene Evaporation Tests . . . . . . . . . . . . . . . . . . . . . . . . . . . . . . . . . . . . . . . . . . . ; . . . . 53
. . . . . . . . . . . . . 57 Comparison of Mass Balance Method and Emission Measurements . . . . . . . . . . . . . . . 55 Comparison ofMass Balance and Emission Measurement Test Results
vi

Acronyms and Abbreviations
AAA ANOVA
APPCD AS BPO CCP DCPD EPA m FRPK FS HVLP IS0 MACT M E W MMA MnTAP NDO NRMRL NV NVS ORTHO OSHA PFA QA QAPP THC TRI TSA voc vs
AP-42
air-assisted airless analysis of variance EPA’s Compilation of Air Pollutant Emissions Facrors Air Pollution Prevention and Control Division available styrene benzoyl peroxide Cook Composites and Polymers dic yclopentadiene Environmental Protection Agency flame ionization detector fiberglass-reinforced plasticskomposites full scale high volume, low pressure isophthalic acid maximum achievable control technology methyl ethyl ketone peroxide methyl methacrylate Minnesota Technical Assistance Program natural draft opening National Risk Management Research Laboratory nonvolatile non-vapor-suppressed orthophthalic Occupational Safety and Health Administration peffluoroalkoxy quality assurance Quality Assurance Project Plan total hydrocarbon Toxics Release Inventory technical system audit volatile organic compound vapor-suppressed
vii
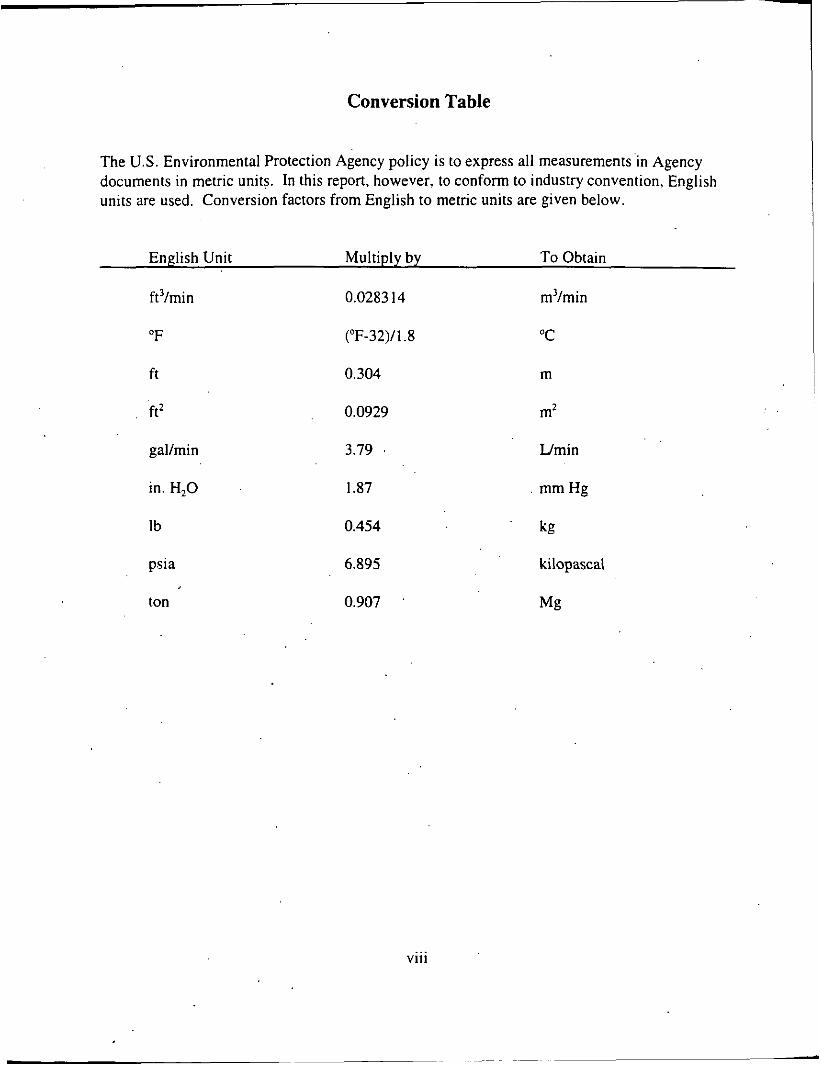
Conversion Table
The U S . Environmental Protection Agency policy is to express all measurements in Agency documents in metric units. In this report, however, to conform to industry convention, English units are used. Conversion factors from English to metric units are given below.
English Unit Multiply by To Obtain
ft’lmin 0.0283 14 m’/min
“F (“F-32)/1.8 “C
ft 0.304 m
ftZ 0.0929 m2
gallmin 3.79 U n i n
in. H,O 1.87 . mmHg
Ib 0.454 kg
psia 6.895 kilopascal
ton 0.907 Mg
viii

Acknowledgments
During the research period, the.authors received valuable information from Bob Lacovara of the Composites Fabricators Association and many representatives in the fiberglass-reinforced plasticskomposites industry. The information helped the authors to design a focused test.
The authors would like to acknowledge the invaluable support and assistance of the following organizations:
Reichhold Chemicals for providing a spray booth and all resin materials for the test and the laboratory support for gel coat and resin properties determination
Magnum Industries for providing equipment and .an experienced operator (Charles Stard) to conduct the actual gel coat and resin application during the entire test period
Cook Composites and Polymers for providing all gel coat materials
PPG Industries, Inc., for providing all the fiberglass materials for the test.
Without their generous support, the testing described in this report would not have been possible.
ix
Chapter 1 Introduction
1.1 Background
The open contact molding process is one of the most common production processes used by the fiberglass reinforced piastics/cornposites (FRP/C) and FRP boat'building industry. This process is used to manufacture boats, bathtubs, shower stalls, truck cabs, body panels for recreational vehicles and trucks, swimming pools, etc. It is one of the FRP/C processes that consumes the most polyester resins. It also has the greatest potential of emitting styrene due to the spraying equipment used and the openness of the process. According to the 1990 Toxics Release Inventory (TIU) database, 10,600 tons of styrene were emitted from the FRP/C and boat building industries. More than 50 percent of the total styrene emissions was emitted from the open molding process.
Styrene is emitted during the application stage when a catalyzed gel coat or resin is applied to the surface of an open mold. Styrene continues to be emitted from wet gel coat or resin during gelation and curing. The open contact molding process usually is conducted in a facility with ample ventilation to maintain the ambient styrene concentrations under the current Occupational Safety and Health Administration (OSHA) standard of 100 ppm. Therefore, styrene emissions from the open contact molding process are difficult to capture and control.
The maximum achievable control technology (MACT) standards for the reinforced plastics/composites source category and boat building source category are scheduled to be promulgated by November 15, 1997, and November 15,2000, respectively. For some open contact molding processes, pollution prevention techniques could be used to reduce styrene emissions. These pollution prevention techniques include changing application equipment and environment and using different gel coat or resin formulations. Existing information indicates that using nonspraying equipment or low-emittinghigh-transfer efficiency spray guns, such as air-assisted airless (AAA) or high-volume, low-pressure (HVLP) spray guns, can reduce emissions from the application stage. Gel coat and resin manufacturers also have developed different gel coat and resin formulations to reduce emissions. The effects of these pollution prevention techniques have not been compared systematically.
Limited studies provide some indications that low-styrene resins can reduce emissions when compared to regular general-purpose'resin. A demonstration project entitled Reducing Styrene Emissions in Fiber Reinforced Plastics Operations' was conducted by the Minnesota Technical Assistance Program in the early 1990s. The study found that styrene emissions from low-styrene resins were reduced by 25 to 45 percent compared to a conventional orthophthalic (ORTHO)-based general-purpose resin. However, the emissions measured from the simulated production trials were not a typical open molding process, and the emissions quantified may not directly apply to actual operations to estimate styrene emissions. A Finland research group' reports that low-styrene resin reduced total styrene evaporation by 30 to 60 percent compared to
1
standard resin. However, their test was conducted for hand layup operation under a laboratory hood, and the results cannot be applied to sprayup operations.
1.2 Objectives
This research project has three objectives. The first objective is to quantify and validate the effectiveness of several pollution prevention techniques, specifically operator techniques, air flow velocity in the spraying zone, different gel coat and resin formulations, and application equipment, on styrene emissions from the open contact molding process. The second objective is to compare a mass balance calculation method with an emission measurement method to quantify emissions. The third objective is to compare emission factors calculated from this test with the emission factors for gel coat sprayup and resin applications reported in the US. Environmental Protection Agency (EPA) AP-42 document3 to determine the accuracy of the AP-42 emission factors. The results of this study are to be presented to the FRP/C and boat building industries so that individual facilities can identify the most effective and practical pollution prevention techniques to reduce their styrene. emissions.
1.3 Approach
This test determined the styrene emission reduction from baseline conditions for several pollution prevention techniques on open contact molding processes. The baseline emissions were determined for a typical gel coat and a general purpose resin using a AAA spray gun under typical environmental and operating conditions. Pollution prevention techniques were evaluated for gel coat and resin applications under the same environmental conditions. The effectiveness of these pollution prevention techniques is determined by comparing total styrene emissions (in grams) and styrene emission factors, expressed as the weight percent of available styrene (% AS) and as mass per unit mold surface area (g/m2). The former unit (%AS) is the unit used in EPA’ s AP-42 emission factors. The EPA Air Pollution Prevention and Control Division (APPCD) Category lIl quality assurance (QA) procedures were followed to ensure that the data quality is sufficient to evaluate the effectiveness of these materials and equipment. The QA project plan (QAPP) for this testing is included in Appendix A (Volume E).
1.4 Report Outline
This report in divided into two volumes. Volume I documents the planning, execution, and findings of the pollution prevention technique evaluation test. Chapter 2 presents the experimental design. Chapter 3 describes the facility and the setup for the testing. Chapter 4 describes the testing procedures used to quantify emissions from the operation. Chapter 5 presents the materials and equipment used in the testing. Chapters 6 and 7 present the results of the testing and the associated data quality issues, respectively. Chapter 8 summarizes the conclusions from the research and presents the recommendations to the industry. Volume II contains the appendixes to this report detailed supporting documents that are related to data quality and emission measurement issues.
L

Acknowledgments
During the research period, thqauthors received valuable information from Bob Lacovara of the Composites Fabricators Association and many representatives in the fiberglass-reinforced plasticskomposites industry, The information helped the authors to design a focused test.
The authors would like to acknowledge the invaluable support and assistance of the following organizations:
Reichhold Chemicals for providing a spray booth and all resin materials for the test and the laboratory support for gel coat and resin properties determination
Magnum Industries for providing equipment and'an e'xperienced operator (Charles Stard) to conduct the actual gel coat and resin application during the entire test period
Cook Composites and Polymers for providing all gel coat materials
PPG Industries, Inc.. for providing all the fiberglass materials for the test.
Without their generous support, the testing described in this report would not have been possible.
ix

Chapter 1 Introduction
1.1 Background
The open contact molding process is one of the most common production processes used ' by the fiberglass reinforced plastics/composites (FRP/C) and FRP boat building industry. This
process is used to manufacture boats, bathtubs, shower stalls, truck cabs, body panels for recreational vehicles and trucks, swimming pools, etc. It is one of the FRP/C processes that consumes the most polyester resins. It also has the greatest potential of emitting styrene due to the spraying equipment used and the openness of the process. According to the 1990 Toxics Release Inventory ( T U database, 10,600 tons of styrene were emitted from the FRPK and boat building industries. More than 50 percent of the total styrene emissions was emitted from the open molding process.
Styrene is emitted during the application stage when a catalyzed gel coat or resin is applied to the surface of an open mold. Styrene continues to be emitted from wet gel coat or resin during gelation and curing. The open contact molding process usually is conducted in a facility with ample ventilation to maintain the ambient styrene concentrations under the current Occupational Safety and Health Administration (OSHA) standard of 100 ppm. Therefore, styrene emissions from the open contact molding process are difficult to capture and control.
The maximum achievable control technology (MACl') standards for the reinforced plasticskomposites source category and boat building source category are scheduled to be promulgated by November 15, 1997, and November 15,2000, respectively. For some open contact molding processes, pollution prevention techniques could be used to reduce styrene emissions. These pollution prevention techniques include changing application equipment and environment and using different gel coat or resin formulations. Existing information indicates that using nonspraying equipment or low-emitting/high-transfer efficiency spray guns, such as air-assisted airless (AAA) or high-volume, Idw-pressure (HVLP) spray guns, can reduce emissions from the application stage. Gel coat and resin manufacturers also have developed different gel coat and resin formulations to reduce emissions. The effects of these pollution prevention techniques have not been compared systematically.
Limited studies provide some indications that low-styrene resins can reduce emissions when compared to regular general-purpose resin. A demonstration project entitled Reducing Styrene Emissions in Fiber Reinforced Plastics Operations' was conducted by the Minnesota Technical Assistance Program in the early 1990s. The study found that styrene emissions from low-styrene resins were reduced by 25 to 45 percent compared to a conventional orthophthalic (ORTHO)-based general-purpose resin. However, the emissions measured from the simulated production trials were not a typical open molding process, and the emissions quantified may not directly apply to actual operations to estimate styrene emissions. A Finland research group* reports that low-styrene resin reduced total styrene evaporation by 30 to 60 percent compared to

standard resin. However, their test was conducted for hand layup operation under a laboratory hood, and the results cannot be applied to sprayup operations.
1.2 Objectives
This research project has three objectives. The first objective is to quantify and validate the effectiveness of several pollution prevention techniques, specifically operator techniques, air flow velocity in the spraying zone, different gel coat and resin formulations, and application equipment, on styrene emissions from the open contact molding process. The second objective is to compare a mass balance calculation method with an emission measurement method to quantify emissions. The third objective is to compare emission factors calculated from this test with the emission factors for gel coat sprayup and resin applications reported in the U.S. Environmental Protection Agency (EPA) AP-42 document’ to determine the accuracy of the AP-42 emission factors. The results of this study are to be presented to the FFWC and boat building industries so that individual facilities can identify the most effective and practical pollution prevention techniques to reduce their styrene. emissions.
1.3 Approach
This test determined the styrene emission reduction from baseline conditions for several pollution prevention techniques on open contact molding processes. The baseline emissions’. were determined for a typical gel coat and a general purpose resin using a AAA spray gun under typical environmental and operating conditions. Pollution prevention techniques were evaluated for gel coat and resin applications under the same environmental conditions. The effectiveness of these pollution prevention techniques is determined by comparing total styrene emissions (in grams) and styrene emission factors, expressed as the weight percent of available styrene (% AS) and as mass per unit mold surface area (g/m2). The former unit (%AS) is the unit used in EPA’ s AP-42 emission factors. The EPA Air Pollution Prevention and Control Division (APPCD) Category III quality assurance (QA) procedures were followed to ensure that the data quality is sufficient to evaluate the effectiveness of these materials and equipment. The QA project plan (QAPP) for this testing is included in Appendix A (Volume ll).
1.4 Report Outline
This report in divided into two volumes. Volume I documents the planning, execution, and findings of the pollution prevention technique evaluation test. Chapter 2 presents the experimental design. Chapter 3 describes the facility and the setup for the testing. Chapter 4 describes the testing procedures used to quantify emissions from the operation. Chapter 5 presents the materials and equipment used in the testing. Chapters 6 and 7 present the results of the testing and the associated data quality issues, respectively. Chapter 8 summarizes the conclusions from the research and presents the recommendations to the industry. Volume II contains the appendixes to this report detailed supporting documents that are related to data quality and emission measurement issues.
2

References
I . Minnesota Office of Waste Management. Reducing Styrene Emissions in Fiber Reinforced Plastics Operations. Minnesota Technical Assistance Program (MnTAP), Minneapolis, Minnesota, 1993.
2. Saamamen, A.J., R.I. Miemela, T.K. Blomqvist, and E.M. Nikander. Emission of Styrene During the Hand Lay-up Molding of Reinforced Polyester. Applied Occupation Environmental H.vgiene, 6(9): 790-793, September 199 I .
U.S. Environmental Protection Agency, Office of Air Quality Planning and Standards. Compilation of Air Pollutant Emission Factors (AP-42). Research Triangle Park, NC. p. 4.12-1, September 1988.
3.
3

Chapter 2 Experimental Test Design
This testing included a pilot experiment. a gel coat experiment, and a resin experiment. From the pilot experiment, the linear air flow velocity in the spraying zone and the spraying technique were evaluated and a set of conditions was selected.for the subsequent gel coat and resin experiments. The gel coat experiment examined two gel coat formulations with three pieces of gel coating equipment (Le., spray guns). The resin experiment examined five resin formulations and three pieces of resin application equipment. Except for a styrene-suppressed resin with additional wax, the rest of the gel coat and resin formulations and application equipment selected for the testing are commercially available to the FRP/C and boat building industries. Each of the experiments is described in the following subsections.
2.1 Pilot Experiment
Before these formulations and equipment were examined, the effects on styrene emission of the air flow velocity in the spray zone and the spraying technique of the operator w e e evaluated in the pilot experiment. The pilot experiment was conducted by spraying a regular isophthalic acid (EO)-based gel coat using a AAA spray gun. The gel coat was catalyzed with methyl ethyl ketone peroxide (MEKP). A low (40 to 50 ft/min) and a high (100 f t h i n ) air flow velocity in the spray zone were examined. Air velocities were measured by a hot-wire anemometer at several locations across the spraying zone. This range represents the low and high ends of air flow velocity found in an open molding area or in a spray booth. The spraying technique of the operator was evaluated by asking the operator to spray normally (without consciously controlling the spray fan beyond the mold surface and flange) and in a controlled pattern. Controlled spraying was done by consciously minimizing overspray beyond the flange of the mold. The effects of spraying techniques were quantified by transfer efficiency, which is the percentage of gel coat material deposited on the mold right after application. Spraying ',
techniques, shape of mold (male or female), and size of mold all affect the transfer efficiency of the material applied.
The number of test runs for air flow velocity and spraying method are summarized as follows'and presented in Table 2-1.
A. Air flow velocity (as measured by a hot-wire anemometer across the spraying zone) Al . Low air flow velocity (30 to 50 Wmin) A2. High air flow velocity (90 to 120 ft/min)
B. Spraying method MI. Normal technique without conscious control of overspray from flanges M2. Controlled spraying technique with more conscious control to reduce overspray
A

MI-Normal technique
M2-Controlled technique
The results were analyzed to determine whether there are any differences in styrene emissions resulting from different air flow velocities and spraying techniques. Following the pilot experiment, the low air flow velocity and controlled spraying technique were selected for the subsequent gel coat and resin experiments.
2.2 Gel Coat Experiment
Al-Low air flow velocity AZ-High air flow velocity
3 3 '
3 3
The gel coat formulations selected were one regular ISO-based gel coat and a low-volatile organic chemical (VOC), isophthalic acidheopentyl glycol (ISO/NPG')-based gel coat. Cook Composites and Polymers (CCP) provided these two gel coats: For the purpose of this testing, both gel coats contained straight.styrene without any methyl m&~acrylate (MMA). Typical gel coats contain only a low percentage of MMA while the styrene content may range from 35 to 50 percent. This minor modification allowed the assumption that total emissions quantified were styrene emissions. A Reichhold Superox' 46709 M E W catalyst was used and the catalyst ratios followed those suggested by CCP.
The gel coat spraying equipment selected included: one AAA spray gun with external catalyst mixing, one HVLP spray gun with internal catalyst mixing, and one HVLP spray gun with external catalyst mixing. According to the Composites 'Fabricators Association's industry survey, the AAA external mixing spray gun is the major spray gun used by the industry; therefore, it is treated as the baseline condition. The AAA spray gun was compared with the HVLP spray gun. The effects of internal and external catalyst mixing were evaluated for the HVLP spray guns. Magnum provided all three spray guns. A pump ratio of 2 0 1 was selected 'for the gel coat pump systems. The spray gqns were compared at similar gel coat thicknesses (about 18 to 24 mil) sprayed on an FRP mold.
The gel coat formulations and application equipment are denoted as follows:
A. Formulations . .
GFI. GF2. Low-VOC, ISO/NPG'-based gel coat
Regular ISO-based gel coat (baseline condition)
B. Equipment GEl, AAA spray gun with external catalyst mixing (baseline condition) GE2. HVLP spray gun with internal catalyst.mixing GE3. HVLP spray gun with external catalyst mixing.
Table 2-2 shows the number of test runs for each of the gel coat formulation and equipment combinations in the gel coat experiment.
5
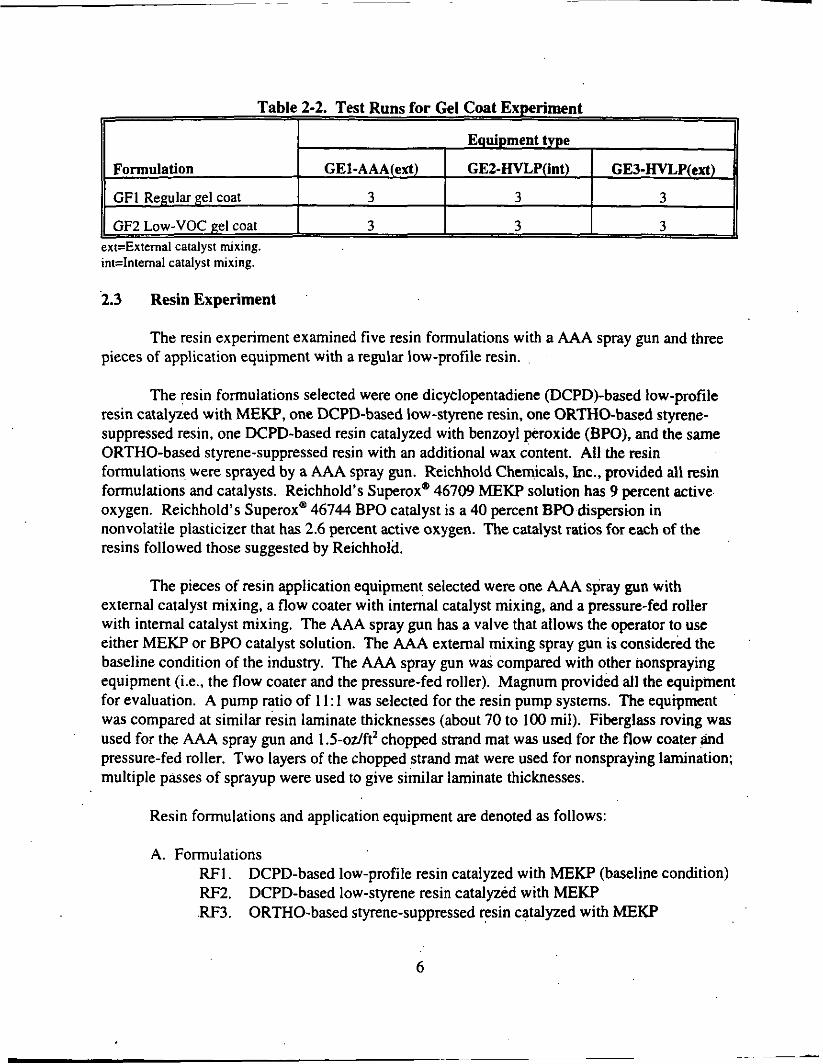
Table 2-2. Test Runs for Gel Coat Experiment II I 11
Equipment type
Formulation GEl-AAA(ext) GE2-HVLP(int) GE3-€IVLP(ext)
GFI Regular gel coat 3 3 3
, GF2 Low-VOC gel coat 3 3 3
6

RF4. RF5.
RF6.
DCPD-based resin catalyzed with BPO Water-emulsified resin (included in the test plan but the manufacturer withdrew from the test) Same ORTHO-based styrene-suppressed resin (RF3) with an additional 0. I percent wax
B. Equipment REI. RE2. RE3. RE4.
AAA spray gun with external catalyst mixing (baseline condition) Flow coater with internal catalyst mixing Pressure-fed roller with internal catalyst mixing Same AAA with external BPO catalyst mixing for the resin catalyzed with BPO
Formulation
R F I DCPD-based low-profile resin with MEKP catalyst
RF2 DCPD-based low-styrene resin with M E W catalyst
RF3 ORTHO-based styrene- suppressed resin with MEKP
ll
Table 2-3 shows the number of test runs for the resin formulation and equipment examined in the resin experiment.
REl-AAA(ext) REZ-flow RE3-pressure- RE4-AAA (ext) coater(int) fed roller(int) for BPO resin
6 3 3 NA
3 NA NA NA
3 NA NA NA
Table 2-3. Test Runs for Resin Experiment k 11
RF4. DCPD-based low-profile resin with BPO catalyst
II
~
NA NA NA 3
I
I I II Equipment type
I I NA I NA I NA II RF6. ORTHO-based styrene- suppressed resin + 0.190 of wax
ext=External catalyst mixing. int=lnternal catalyst mixing. NA = Not included in the experiment. Note: RF5 is a water-emulsified resin h a t wain01 tested because the manufacturer withdrew from the test.
7

Chapter 3 Facility and Experimental Setup
The evaluation test was conducted in an isolated spray booth in Reichhold Chemicals' physical testing laboratory, located in Research Triangle Park, North Carolina. This type of spray booth is commonly used in an FRPK facility. Reichhold Chemicals' physical testing laboratory is used to perform testing for their resin users. It is not a production facility; therefore, the background VOC concentration can be minimized.
3.1 Total Enclosure System
The spray booth is situated in an enclosed room with a double door leading to the physical testing laboratory. The laboratory is air-conditioned; therefore, the room temperature and humidity were very.stable during the entire period of testing. The stable conditions reduced the variability of temperature effect. Most facilities are not air-conditioned in the summer, however, they do have winter heating to maintain product quality.
Figure 3-1 shows the side view of the spray booth. Theroom is 12 feet wide, 19 feet high, and 15 feet deep, which can be considered a permanent total enclosure. The double door measures 6 feet wide by 7 feet high, which can be considered the natural draft opening (NDO) to the enclosure. Inward linear air flow velocity at the door (i.e., NDO) during the testing was always above 200 ftlmin. The spray booth and the enclosed room meet the criteria for a total enclosure as prescribed in EPA Method 204--Criteria for and Verification of a Permanent or Temporary Total Enclosure. Therefore, the emissions from the operations in the spray booth can be assumed 100 percent captured.
The spray booth is 7 feet high, 11.5 feet wide, and 7.5 feet deep from the front edge to the filter bank. The filter bank is 6 feet high by I I feet wide. The distance between the front edge of the spray booth to the double door is 4 feet 10 inches. The air-conditioned makeup air flows through the double door. The exhaust air flows through the filter bank at the end of the spray booth and is exhausted upward by a duct 34 inches in diameter. The exhaust flow rate from the spray booth averaged 8,670 ft'lmin during the testing.
3.2 Emission Sampling Location
Emission measurements and exhaust air flow rate were monitored from the exhaust duct. The sampling location is 6 diameters downstream of the last bend as shown in Figure 3- I . EPA Methods 1 and 2 were used to determine the exhaust gas velocity and volumetric flow rate. EPA Method 25A was used to determine total gaseous organic emissions. The emission sampling procedures are outlined in Section 5.1.
8

7’
0 c Emission and air flow rate monitoring location
2nd floor
Baffle
7 x 6 (W) Double door
k t Floor scale
Application equipment (placed outside the enclosure
on a floor scale)
Figure 3-1. Side view of the Reichhold Chemicals spray booth and the experimental setup in a permanent total enclosure (19” x 12‘W x 15’L).
9

3.3 Experimental Setup
3.3.1 FRPMold
Three identical FRP molds were used for this evaluation test. Figure 3-2 shows a sketch of the male FRP mold. The male mold has five exposed smooth surfaces similar to a rectangular box. The mold measures 2 feet high, 2.S feet long, and 2 feet wide. A 2-inch wide flange surrounds the bottom of the mold for ease of part removal. The total surface area, including flange, equals 24.5 ft2 (2.28 m’). The mold is constructed of traditional reinforced plastics material to represent actual tooling material used by the industry. These empty molds weighed about 34 kg. The mold was placed on a turntable mounted on a cart with casters. The turntable allows the operator to spray on all mold surfaces by turning the mold and without moving his position to the downwind location. The cart allows easy transfer of the mold from a preparation area to the spray booth.
3.3.2 Air Flow Baffle
The exhaust flow rate from the spray booth could not be adjusted because the spray booth had a constant speed exhaust fan. Therefore, a baffle was used between the double door and the spraying zone to divert the air flow to the sides of the spray booth so that the air flow velocity in the spraying zone could be reduced. The 6.5-foot by 4-foot baffle was constructed from lattice board on a frame built from 2-inch by 4-inch studs. It has two additional pieces measuring 6.5 feet by 2 feet on either side of the baffle. These two side pieces can swing open like a screen. Two layers of 15-mil-thick glass veil were attached to the centerpiece of the baffle to reduce the air flow velocity through the baffle. In the pilot experiment, the baffle was used to maintain the low air flow, velocity and was removed for the high air flow velocity. Using this baffle, the linear air flow velocity in the spraying zone can be reduced from more than 100 ft/min to 40 ftlmin. The baffle was used throughout the gel coat and resin experiments to maintain a low air velocity in the spraying zone.
3.3.3 Gloss Veil and Krafr Paper to Capture Overspray
Gel coat and resin sprayup generate overspray. To account for the materials not adhered to the mold, glass veil was used on the filter bank and kraft paper was used on the ground surface and si& walls to capture overspray. The veil is 15 mils thick of A-type glass with non-styrene- soluble binder. Two layers of the veil were used on the filter bank. The test results showed that almost all &borne droplets were trapped on the first layer of veil. The kraft paper used for ground cover was 5W weight. These veil and kraft papers were replaced every test run so that overspray for each test run could be accounted for accurately.

.. .. .. .. 2" flange surrounding the bonom of the mold to ease part removal
.. .. ..
Figure 3-2. Sketch of a male mold.

3.3.4 Protective Equipment and Clothing for Operator
The operator wore a respirator with activated carbon cartridges to protect him from exposure to styrene during the application stage of a test run. The operator also wore safety glasses at all times. In order to account for any materials that might come into contact with the operator, clean disposable gloves, coveralls, and shoecovers were used in each test run. This protective gear was weighed before and after the test run to determine the amount of materials on them.
3.4 Resin Property Testing Laboratory
Reichhold Chemicals has a resin property testing laboratory located in the same building as the spray booth. The laboratory has all the instrument and equipment necessary to determine the styrene contents and curing characteristics for the gel coat and resin formulations. Reichhold personnel followed their standard procedures to measure properties for every gel coat and resin formulation examined in the test. These Reichhold Standard Test Procedures are No. 18-001, Determination of Non-Volatile Content of Polyester Resins; No. 18-021, Determination of Brookfield Viscosity & Thixotropic Index of Polyester Resins; No. 18-501, Determination of Room Temperature Gel, Time to Peak, and Peak Exotherm Characteristics of Polymer Resin; and No. 18-152, Determination of Static Styrene Emissions for Compliance with SCAQMD Rule 1162. Copies of these Reichhold standard test procedures are provided in Appendix B (Volume Il).
12

Chapter 4 Materials and Equipment
CCP product code (color)
Density, Ib/gal
9% NV, average (range)
4.1 Properties of Gel Coat and Resin Materials
GF1 Regular gel coat
944-W-005SP (base white) 962-WA-196SP (pink)
10.6-10.9 11.3-11.6
61.3 (61.1-61.4) 74.6 (74.6-74.7)
GF2 Low-VOC gel coat
The properties of the gel coats and resins were analyzed by Reichhold personnel in their laboratory using Reichhold standard test methods. These properties are shown in Table 4-1 for gel coats and Table 4-2 for resins. A large sample (about 200 g) was collected for each material when it was first used and a smaller sample (about 20 g) was collected when the material was last used. At the end of the testing, the large samples were analyzed for the listed properties and the small samples for percent nonvolatile (%NV). The final %NV measurement was to verify whether the material lost styrene over the test period or not. The results indicated that no noticeable styrene was lost from the container because proper procedures were used to minimize styrene evaporation loss.
Generally, the measured properties were in agreement with the properties listed in the manufacturers’ data sheets. However, major differences were found for the low-VOC gel coat, the low-styrene resin, and the BPO resin. At the same catalyst ratio, the measured cup gel time for the low-VOC gel coat (27 min) is longer than CCP’s listed gel time (14-17 min). Measured gel time for low-styrene resin (30 min) is also longer than a typical gel time (15 min) listed in the Reichhold data sheet. The longer gel time might have an effect on total emissions because the wet surface had a longer time to emit styrene.
Viscosity. cps (LVF #4 C3 60 rpm)
Thix index
Catalyst Superox’ No. and type
~ ~~
3.040 2.970
6. I 3.9
46709 MEW 46709 MEKP
I 9’0 Styrene (by difference) 1 38.7 I 25.4 ~~~ I
Peak exothenn. ”F 353 25 1
1 Catalyst ratio, weizht% I 1.8 I 1.8 I I CUD eel time. min I27 I
13
I 14
1
Equipment type
Magnum model No.
When the neat (unfilled) BPO resin was first used, it had a much longer gel time (30 min) than the listed gel time (12 min). Its viscosity was also low, so the resin did not stay on the mold until it cured. After two test runs on the neat BPO resin, a 0.5 weight percent of fume silica was added to thicken the resin and the BPO catalyst ratio was increased from 2.1 to 3.1 percent to shorten the gel time. Two additional test runs were conducted for the modified BPO resin. The test results for neat BPO resin and modified BPO resin were analyzed separately.
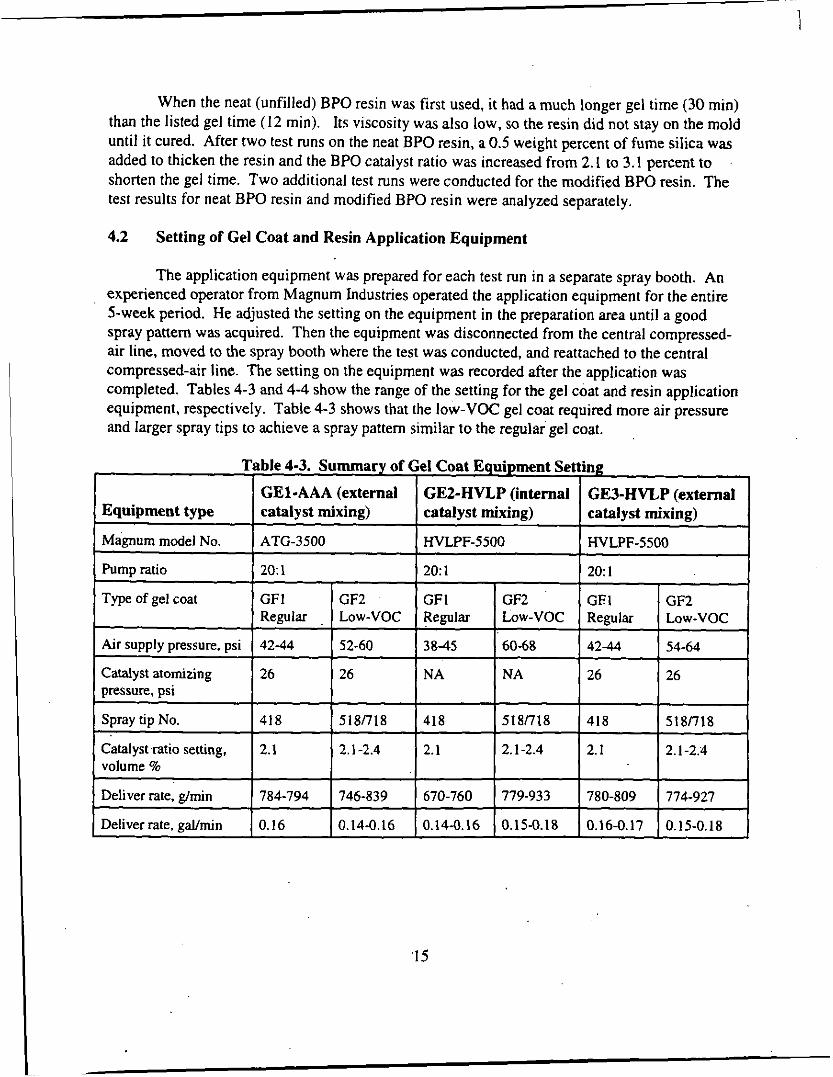
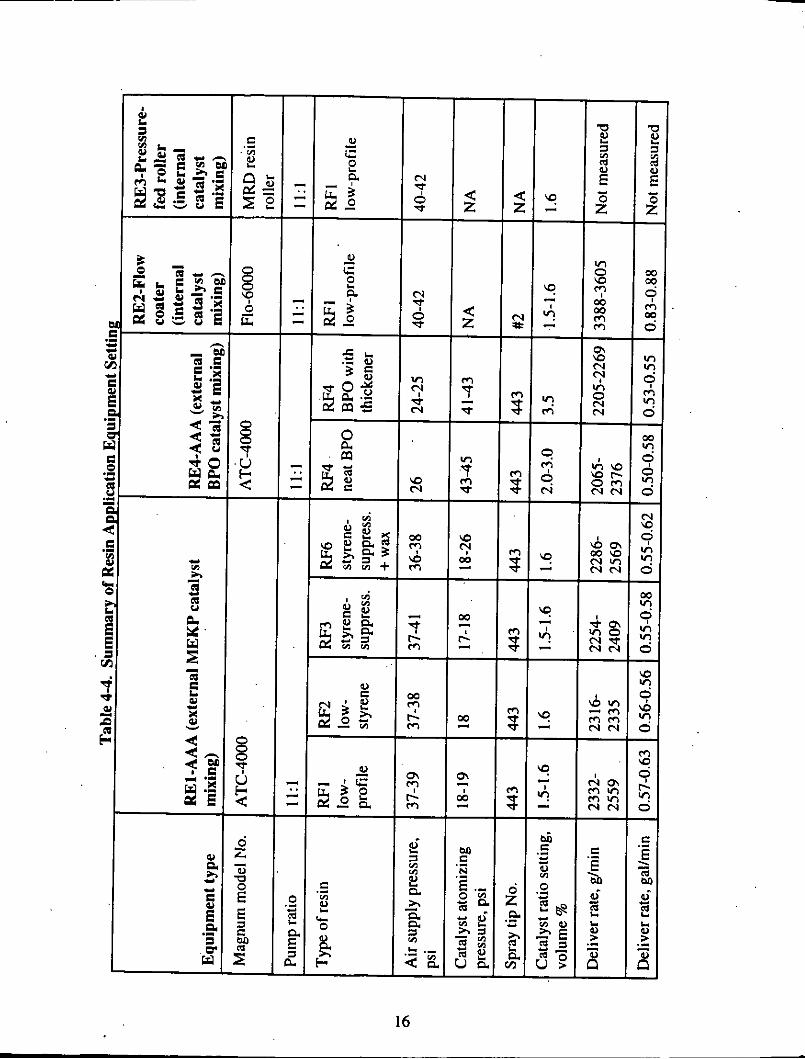
4.2 Setting of Gel Coat and Resin Application Equipment
GE1-AAA (external GEZ-HVLP (internal GE3-HVLP (external catalyst mixing) catalyst mixing) catalyst mixing)
ATG-3500 HVLPF-5500 HVLPF-5500
Pump ratio
Type of gel coat
~ ~~
20: 1 20: 1 20: I
GF 1 I GF2 GFI I GF2 GE 1 1 GF2 .. - Regular
_. - Low-VOC Regular Low-VOC Regular Low-VOC
Air supply pressure, psi
Catalyst atomizing pressure, psi
42-44 52-60 3845 60-68 42-44 54-64
26 26 NA NA 26 26
'1 5
Spray tip No.
Catalyst ratio setting, volume 70
418 5 1 8 n i 8 418 518R18 418 518n18
2.1 2.1-2.4 2.1 2.1-2.4 2.1 2.1-2.4
Deliver rate, g/min
Deliver rate, gaYmin
784-794 746-839 670-760 779-933 780-809 774-927
0.16 0.14-0.16 0.14-0.16 0.15-0.18 0.16-0.17 0.15-0.18
I
I
e, E 5 2 5
r ? m
c 0 e,
R -
N P 3
e4
0 w P -
vl
d N
9
\o N - m T z
- P
A m r n m m v l N N
16

4.3 Reinforcements
PPG Industries, Inc., provided all the reinforcements for the testing. The HYBON" 700 HTX roving material was used for resin sprayup and a GPM chopped strand mat (1.5 odft') was used for nonspraying resin lamination. The chopped strand mat was cut into proper sizes before the test so that the operator could apply the mat, piece by piece, on the mold surface.
17

Chapter 5 Determination of Emission Quantities
Two separate test methods were used to quantify emissions from the test. The first test method was an emission measurement method that uses EPA Method 25A to determine a real- time, continuous emission concentration in the stack and EPA Methods 1 through 4 to determine the exhaust flow rate. Because the enclosed room with the spray booth met the criteria for a total enclosure, the emissions within the enclosed room could be assumed 100 percent captured. The emission quantities were calculated from the product of an average emission concentration and an average exhaust flow rate during a test run.
The second test method was a mass balance calculation method using gravimetric measurements. This method measures the weights of all materials, overspray, mold, and part at the beginning and end of each test run. The difference between the total initial weight and the total final weight is considered the weight loss due to emissions.
Before and during the test campaign, pure styrene evaporation tests were used to compare the emission quantities determined by these two test methods. This involved measuring weight loss due to evaporation from terry clbth towels soaked in pure styrene using a high- precision scale. The measured weight loss was compared with emissions determined by the emission measurement method. If the results are close, it implies that the emission measurement method was accurate.
Both test methods determine total emissions. Because these gel coat and resin materials contained only styrene monomer, the total emissions measured could be considered styrene emissions. Other VOC emissions were excluded from the surrounding environment. The background (i.e., baseline) VOC concentration in the laboratory was measured before each test run and subtracted from the average emission concentration so the net increase in concentration could be attributed to the test. A test run began when gel coat or resin application started and ended when curing was complete and the monitored concentration returned to the baseline concentration. Most of the test runs lasted from 60 to 90 minutes, depending on the time required for complete curing. Two test runs for the neat BPO resin were longer than 100 minutes because of unusually long curing time.
5.1 Emission Measurement Method
The emission measurement method determines styrene concentrations in the exhaust air and exhaust air flow rate, then uses these results to calculate total emissions during the test run.
5.1.1 Determination of Styrene Concentrations in Exhausted Air
Styrene emissions in the exhaust stack of the total enclosure were measured according to EPA Method 25A as given in Code of Federal Regulations, Chapter 40, Part 60. The
18

measurements were made using a Ratfisch Instruments model RS55CA total hydrocarbon (THC) analyzer. This analyzer has a flame ionization detector (FID) that responds to hydrocarbons approximately in proportion to the number of carbon atoms entering the detector. The total hydrocarbon measurements can be attributed to the styrene emissions because the only hydrocarbon emission source was the gel coat or resin application and styrene is the only monomer used in the formulations. Measurements were made immediately before gel coat or resin application started to determine the levels of background hydrocarbons (e.g., natural methane and other trace VOCs) in ambient air. These background levels were subtracted from the levels measured during the test run.
The THC analyzer was connected to the exhaust stack by a sampling line fabricated from a 12-foot length of 1/4-inch ID peffluoroalkoxy (PFA) Teflon tubing. The tubing was capped inside the exhaust stack. Eight holes were drilled in the tubing at various points across the 34- inch diameter of the exhaust stack to obtain a representative sample of its contents. Sample was drawn through the sampling line into the analyzer at a flow rate of 7 Umin. Most of the sample was vented to the atmosphere, but a small portion of the sample entered the FlD through a capillary. A backpressure regulator maintained a constant sample pressure, which maintained a constant sample flow rate in the capillary. The sample was oxidized by a hydrogedair flame and the ionized carbon atoms produced in the flame were detected by an electrometer.
The output signal (0 to I O V dc full scale [FS]) from the analyzer was recorded by an Omega Engineering model OM- 170 microprocessor-based portable data logger and a Hewlett- Packard model 7 132A strip chart recorder. Both instruments were operated on their 0- to IO-V FS ranges. The data logger recorded the voltages at 2-second intervals throughout each test run. At the end of each day, the voltage measurements were transferred to a laptop computer containing a spreadsheet program. The strip chart recorder provided a visual indication of the styrene emissions measurements during each test run and provided physical documentation for each test run.
The THC analyzer was operated on Range 2 (0 to 200 ppm styrene) for most of the test runs, but was operated on Range I (0 to 20 ppm styrene) for three resin experiment runs in which low styrene concentrations were expected. These ranges are also equivalent to 0 to 53 ppm propane and 0 to 533 ppm propane. The THC analyzer was calibrated prior to each test run using compressed gas calibration standards. A calibration drift check was done at the end of each test run. Styrene calibration standards could not be used directly for routine calibrations during test runs because of cylinder pressure limitations associated with styrene's dewpoint. Instead, propane in air calibration standards without such pressure limitations were used for the routine calibrations. The calibration gases were 16,27,45, 160,267, and 453 ppm propane. These calibration gases corresponded to 30 percent, 50 percent, and 85 percent of the two full- scale ranges, as called for in EPA Method 25A.
Calibration data obtained from measurements of propane calibration standards could be used for the styrene emissions determination because RTI developed a correction factor for
19

converting propane concentrations into the equivalent styrene concentrations prior to the testing. A styrene molecule has eight carbon atoms and a propane molecule has three carbon atoms. As a first approximation, one would expect the propane-to-styrene correction factor to q u a l the ratio of the carbon atoms (Le., 813 = 2.667): The measured propane-to-styrene correction factor was; 2.686 for the 0- to 200-ppm styrene range on the THC analyzer. This measured correction factor was used in emission calculations. .
The propane calibration standards were verified by RTI using propane analytical reference standards. They were intercompared with styrene calibration standards to obtain the propane-to-styrene correction factor. The styrene calibration standards were verified by RTI using styrene analytical reference standards. The details of these measurements are presented in Appendix C (Volume E).
In general, six propane calibration standards, including the high-level, mid-level, and low-level calibration standards for the selected analyzer range, and zero air were measured during the calibration for the first test run of each day. The three propane calibration standards for the selected analyzer range and zero air were measured during the calibrations for'subsequent test runs. Calibration data for o k test run were used for the preceding test run's drift check, except for the last test run of the day when a separate drift check was conducted. The analyzer's zero and span pots were not adjusted during the entire 5-week testing period. The details of these calibrations are presented in Appendix D (Volume II).
The propane calibration standards were connected to the analyzer's calibration port via an 8-foot length of 1W-inch ID PFA Teflon tubing. An in-line pressure regulator set to 5 psig and a needle valve maintained a constant flow rate in the tubing. Quickconnect fittings were used to switch from.one calibration standard to the next. The analyzer required IS ininutes or more.to yield a stable analyzer response for the first standard to be analyzed during a calibration. However, the stabilization period for subsequent calibration standards was only a few minutes. The cause for this long initial stabilization period was never determined, but it represented only a minor impediment to the calibrations.
After the voltage readings from the styrene emissions measurements were transferred to the computer-based spreadsheet, they were converted into an average voltage for the test run. The voltage associated with the background air measurement from the start of the test run was subtracted to yield a net average voltage. An average styrene concentration for the test run was obtained by multiplying the net average voltage by a styrene calibration factor. This calibration factor was obtained by dividing the equivalent styrene concentration for the high-level calibration standard by the difference between the voltages from the measurements of the high-level calibration standard and zero air.
RTI checked for concentration stratification inside the exhaust stack during a pure styrene evaporation test by sampling the exhaust stream across two perpendicular traverses. These measurements. were made at 10 points on each traverse at distances corresponding to equal
20

subdivisions of the exhaust stack's area. The sampling line was modified so that sample was collected from a single point in the exhaust stack. The styrene concentration was not stable during this pure styrene evaporation test, and the analyzer response declined from 2. I7 to 1.32 V. Least squares regression was used to fit these data to an exponential decay curve with a coefficient of determination (i.e., r-squared) equal to 0.98. Individual measurements deviated from the regression curve by an average of I .6 percent of the predicted value. The maximum deviation was 5.2 percent. This statistical analysis suggests that there is little concentration stratification in the exhaust stack.
5.1.2 Exhaust Air Flow Rate Measurement
Air velocity in the 34-inch diameter circular exhaust stack of the total enclosure was measured according to EPA Methods 1 and.2 as given in Code of Federal Regulations, Chapter 40, Part 60. The measurements were made using a Dwyer series 160 stainless steel pitot tube (standard type) and a Dwyer series 2000 Magnehelic differential pressure gauge. The Magnehelic gauge was compared to an inclined manometer (a primary standard). Magnehelic readings were 95 percent (0.95) of manometer readings. This 0.95 correction factor was used in air flow rate calculations. The velocity was measured at a distance of approximately five to six stack diameters downstream of two right-angle bends in the exhaust stack.
Velocity across two perpendicular traverses was measured weekly. These measurements were made at 12 points on each traverse at distances corresponding to equal subdivisions of the exhaust stack's area. These data were recorded in a data sheet and were transcribed into a computer-based spreadsheet for data reduction. In general, the weekly velocity measurements indicated that the exhaust air flow rate remained relatively constant for the entire 5-week testing period. The average exhaust air flow rate was 8,685 ft3/min for the entire testing period and individual weekly measurements varied from 8,358 to 9,034 f t h i n . The Reynolds number for the air flow in the 34-inch diameter exhaust stack was 3.97x1OS, which places the flow in the turbulent regime. Therefore, any concentration stratifications were not likely to persist for long distances inside the exhaust stack. This conclusion is consistent with the negative results of,the concentration stratificatiop measurements.
RTI checked for off-axis flow on one occasion by rotating the pitot tube inside the exhaust stack and recording the velocity head at various angles. The results of these measurements indicate that off-axis flow was not a problem in the exhaust stack.
Velocity head (Ap) measurements at the centerline of the exhaust stack were usually performed at 15-minute intervals during each test run. The Magnehelic differential pressure gauge was used to obtain these measurements. h'general, the centerline Ap remained relatively constant throughout each test run although there were short-term fluctuations on the Ap. The 15- minute data were recorded in a data sheet and in a laboratory notebook during each test run and were transcribed into a computer-based spreadsheet for data reduction. The average centerline Ap for a test run was used as a scaling factor for calculating an estimated average exhaust air
21

flow rate for that test run. In general, the average centerline Ap remained relatively constant for the entire testing period. Individual values ranged from 0.109 to 0. I33 inch of water with an overall average value of 0.120 inch of water.
The exhaust flow rate during the test run was calculated according to the following formula:
Q run = [avg (Ap run)'.'/(Ap weekly)''] x Q weekly (5- I )
where
Q run Q weekly avg (Ap run)'.' = average square root of 15-minute Aps recorded at centerline
(Ap weekly)'.' = square root of Aps recorded during weekly velocity traverse.
The relative humidity and temperature of the air in the spray booth were measured by a
= exhaust flow rate during a test run (acfm) = exhaust flow rate determined by weekly velocity traverse (acfm).
during the test run
sling psychrometer during each test,run. The measurements showed that the ambient air temperature and relative humidity were very stable at 73*1 "F and 58k2 percent, respectively.
5.1.3 Emissions Determined by Emission Measurement Method
Styrene emission quantity (Em) for each test run was calculated by the following equation:
Em, Ib = 2 . 6 ~ 1 0 ~ x Q x MW x C x T Em, g = 1 . 1 8 ~ IO6 x Q x MW x C x T
. . where
2 . 6 ~ 1 . 1 8 ~ IO6. = conversion factors to standard conditions (68°F and 29.92 inches
= average exhaust air flow rate.(actual cubic feet per minute) = molecular weight of styrene (104) = average styrene emission concentration during the entire test run
= duration of test run (minutes).
mercury) in English and metric units, respectively Q MW C
T
Using the emission'concentration profile and the exact duration of the application stage
(ppmv actual)
(Ta), an average emission concentration (Ca) could be calculated for the application stage in each test run. The total emissions during the application stage (Ea) could be calculated from the same equation:
22

Ea, Ib = 2 . 6 ~ 1 0 ~ x Q x MW x Cax Ta Ea,g = 1 .18x106xQxMWxCaxTa
(5-4) (5 -5)
The difference between total emissions and emissions during the application stage is the emissions from the wet-out stage (for resin lamination), stagnant (curing) stage, and overspray.
5.2 Mass Balance Calculation Method Using Gravimetric Measurements
The mass balance calculation method involves weighing all materials, overspray, mold, and part in the beginning and at the end of a test run. The difference between the total initial weight and the total final weight is the weight loss due to emissions.
Weight losses due to styrene emissions were determined using two floor-type, high- precision scales (Sartorius Corporation, Model F150S). The scales have a 150,OOO-g capacity and I-g readability. These two scales were calibrated with subsequent additions of standard weights - 1 g, 5. g, IO g, 20 g, 50 g, 100 g. 500 g, 1 ,ooO g, and 2,000 g -daily. The calibration procedures were performed on an empty scale and with a heavy object (i.e., an empty mold) on the scale. This dual calibration procedure ensured that the scales had the same sensitivity in the range of weights encountered in the tests. These calibration procedures showed that the scales precisely indicate the standard weights added. Scale drift was checked periodically by leaving a 1 ,OOO-g or.2.000-g standard weight on the scale overnight. The drift check showed that these two scales were very stable and the overnight drifts were within d g.
The first scale was used to measure the initial and final weights of gel coat or resin materials, catalyst, fiberglass reinforcement, glass veil, protective clothing, and kraft paper for ground cover. A second scale was specifically used for the mold and cart. The mold and cart were left on the second scale for the entire test run.
The gravimetric measurement procedures for the mass balance calculation method are outlined as follows:
A. Before Application
I . Determine the initial weight of ground cover (e.g., kraft paper) and thin glass veil (used to capture overspray droplets on filter bank) - W1.
Determine the initial weight of tools and other items (e.g., wet-out rollers, gloves, booties, coverall) that will come into contact with the materials during the application - W2.
Determine the initial weights of materials (i.e., gel coat, resin, catalyst, fiberglass roving, or chopped strand mat) to be used for part production. Weigh the pump
2.
3.
23
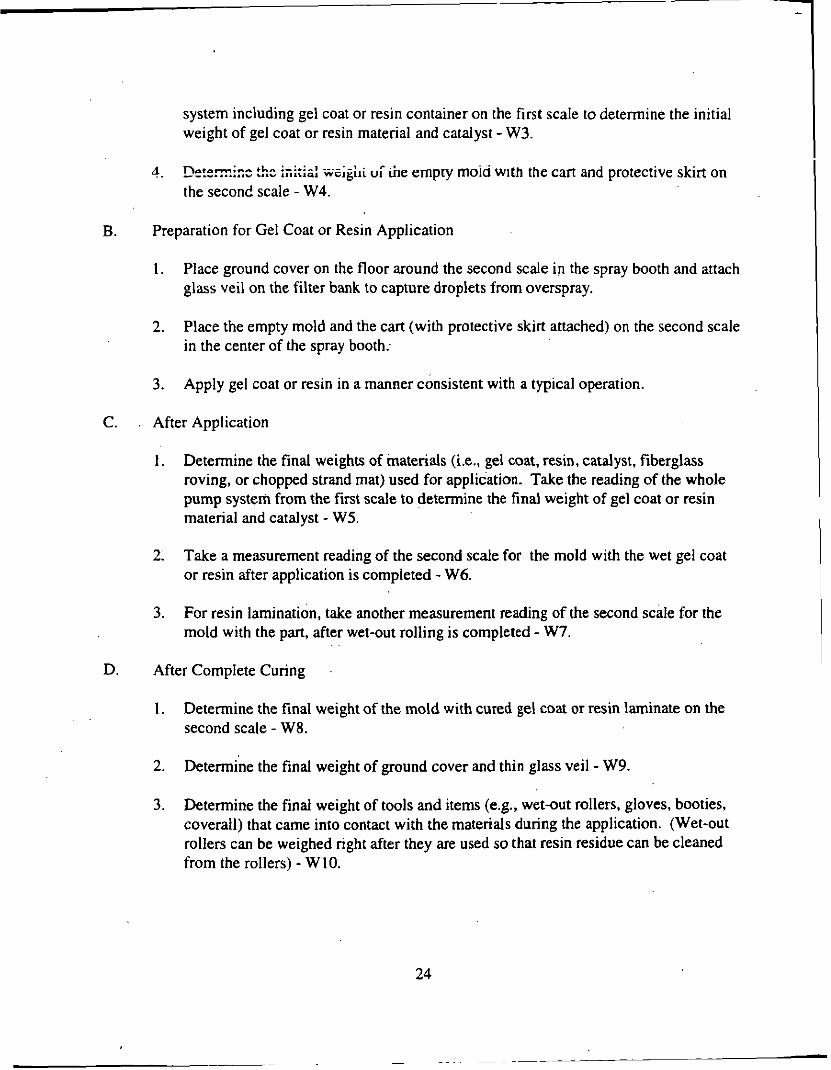
system including gel coat or resin container on the first scale to determine the initial weight of gel coat or resin material and catalyst - W3.
__._...... .- ...- llllL1al WGI~I IL U: i k empry moici With the cart and protective skirt on the second scale - W4.
4. nntarm;ne rh,. :-:A:-, n t
B. Preparation for Gel Coat or Resin Application
1. Place ground cover on the floor around the second scale in the spray booth and attach glass veil on the filter bank to capture droplets from overspray.
Place the empty mold and the cart (with protective skirt attached) on the second scale in the center of the spray booth.
Apply gel coat or resin in a manner consistent with a typical operation.
2.
3.
C. After Application
1. Determine the final weights of materials (i.e., gel coat, resin, catalyst, fiberglass roving, or chopped strand mat) used for application. Take the reading of the whole pump system from the first scale to determine the final weight of gel coat or resin material and catalyst - W5.
Take a measurement reading of the second scale for the mold with the wet gel coat or resin after application is completed - W6.
For resin lamination, take another measurement reading of the second scale for the mold with the part, after wet-out rolling is completed - W7.
2.
3.
D. After Complete Curing
1. Determine the final weight of the mold with cured gel coat or resin laminate on the second scale - W8.
2. Determine the final weight of ground cover and thin glass veil - W9.
3. Determine the final weight of tools and items (e.& wet-out rollers, gloves, booties, coverall) that came into contact with the materials during the application. (Wet-out rollers can be weighed right after they are used so that resin residue can be cleaned from the rollers) - W 10.
24

E. Transfer Efficiency
From the weights of materials used and materials applied on the mold, calculate the transfer efficiency for each test run. Transfer efficiency = (W6-W4)/(W3-W5).
Emissions from Part During Stagnant (Curing) Period
Emissions from the gel coat on the mold during the stagnant (curing) period can be determined from the weight loss after the spraying and complete curing = W6-W8.
Emissions from the resin laminate during the stagnant (curing) period can be determined from the weight loss between when the wet-out rolling was completed and curing was completed. During this period the mold remained on the second scale. Emissions from the resin laminate only during the stagnant period = W7-W8.
F.
G. Total Emissions
Total emissions (including emissions from the application stage, the wet-out rolling stage, the stagnant [curing] period, and overspray) = Materials used (W3-W5) - Materials on the mold (W8-W4) - Materials not on the mold (W9+WIO-Wl-W2).
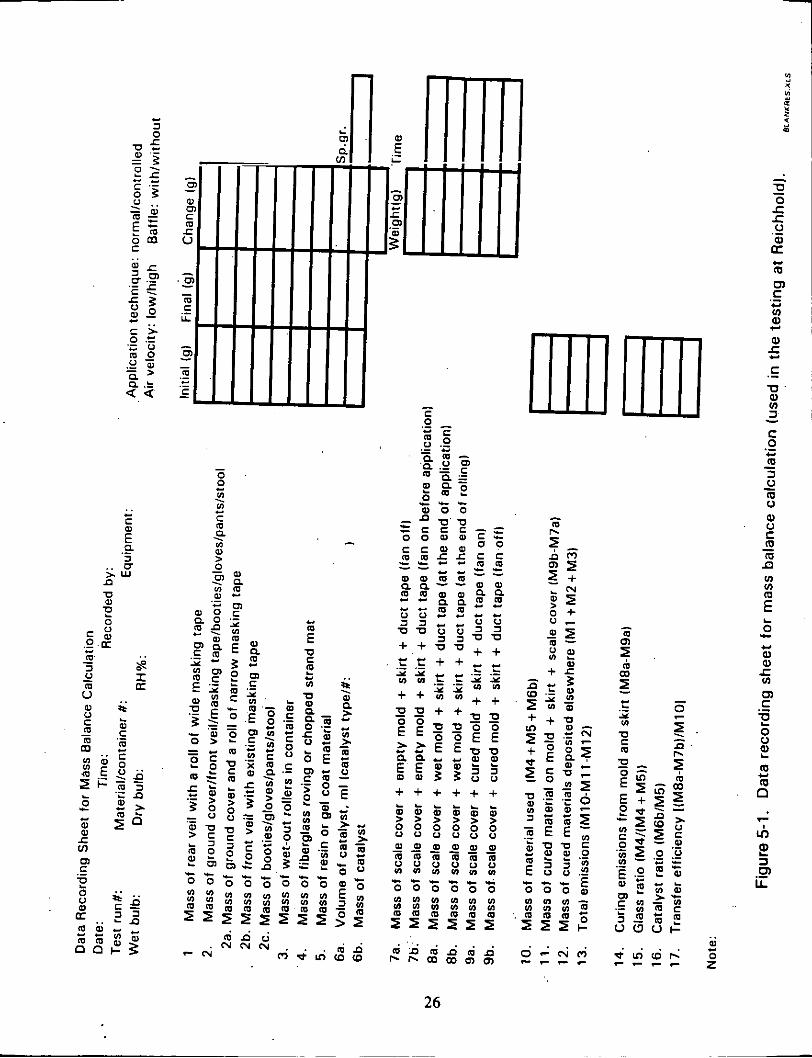
A data recording sheet used for the testing is shown in Figure 5-1. This data recording sheet records more detailed measurements so that glass ratio and catalyst ratio can also be calculated.
25
+ + + + + + $ $ Z $ $ $ > > > > > > 0 0 0 0 0 0 0 0 0 0 0 0 m m m m m m T T T T = = 0 0 0 0 0 0 M M M M Y I M
26

Chapter 6 Test Results and Discussions
A spreadsheet containing the emission measurements, gravimetric measurements, and calculated emission quantities and emission factors is provided in Appendix E (Volume II). Table 6-1 summarizes the emission measurements and calculated emission factors for three experiments. The test results were subject to analysis of variance (ANOVA) to determine the significance of variables on styrene emissions. The detailed results of this statistical analysis are included in Appendix F (Volume II). Table 6-2 compares variables that affect total emissions as measured by THC. Information in Table 6-2 is extracted from Table 17 in Appendix F.
The level of significance of the comparison is presented by the number of asterisks -- the more asterisks, the more confidence that there is a significant difference in the comparison. The majority of the comparisons are significant at the 0.001 level (or 99.9 percent confidence interval), noted by ***. This means that if the test is repeated 100 times, 99.9 percent of the test results will show a difference between the two variables compared. A few variables are significant at 0.01 or 0.05 levek(99 or 95 percent confidence intervals). noted by ** and *, respectively. If the comparison is not statistically significant at the 0.05 level, it is noted by "ns."
Table 6-2 shows that, in the pilot experiment, normal and controlled spraying techniques caused a difference in total emissions and the difference is significant at the 0.001 level. The high and low air velocity in the spray booth did not make a difference in total emission and the difference was not significant at the 0.05 level.
The gel coat experiment shows that the regular and low-VOC gel coat made a difference in total emissions and the difference is significant at the &OOl level. The total emissions from three gel coat spray guns are not significantly different at the 0.05 level.
In the resin experiment;the difference in total emissions from low-profile (general purpose) resin and low-styrene resin is significant at the 0.01 level. The differences between low-profile resin and styrene-suppressed resin or styrene-suppressed resin with additional wax are significant at the 0.001 level. This implies that emission reductions achieved by using low- styrene resin, styrene-suppressed resin, and styrene-suppressed resin with additional wax are statistically significant. However, total emissions between styrene-suppressed resin and styrene- suppressed resin with additional wax are not significantly different. This implies that the emission reduction achieved by adding wax to the styrene-suppressed resin is not statistically significant at the 0.05 level.
Similarly, emissions generated from the flow coater and pressure-fed roller are significantly different from those from the AAA spray gun at the 0.001 level. However, the emissions generated from the flow coater and the pressure-fed roller are not significantly different.
27

I
- ZCS, run rlMracqulp.
I I I 1 I I I . I I I I RFI-EXPlRFlIREI ! N o d I High1 6311 3281 8861 92871 90.11 38.331 17.71 2771 0.068 GFI-FXPIGFI!GEI ! N o d I High1 4 % 2281 4781 I5641 75.51 38.751 75.21 2001 o . ? ~
I I I
I I Tatall Emirtionri Tea I ! Emission Facton i Applicnlion[ Air( crnirrionrl during] emissions Masrid/ Tnnrfcrl S m n c %AS1 g m 7 l ZI:
eff .51 content. 46 by THCi by THCl by THC M C V l c a i Ve1.i by 'IHC. gl applicntion. gl by ME. g urcd. g/
i I I I I I I I I I 1 I
PILOTEXPERIMENT I I I I I I I I I I 1 I I I
I Iconmincr I I I I (byTHC)I
I I I I I I I I I I I Notc THC=THC ermrs~on - m m c n ~ M B = m s balance mearurcmcnt. EF=cmsrlon fulor. %AS='% avulablc rlyrrnc. 1
g=g of cnurrion per g of wend urcd I I I I I I I I
I I I I
(con.)
28 SUMSUhl.Xl.5
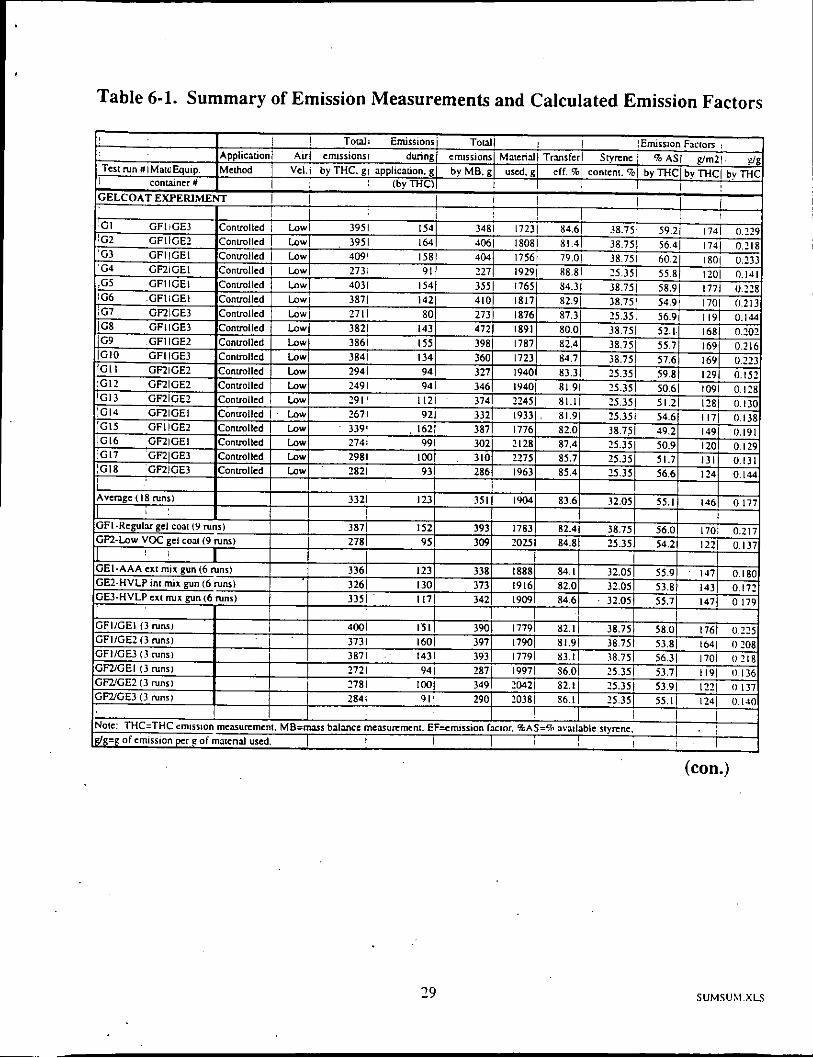
Table 6-1. Summary of Emission iMeasurements and Calculated Emission Factors
(con.)
19 SUMSULl.XLS

Table 6-1. Summary of Emission Measurements and Calculated Emission Factors (con.)
30 . SUMSUM.XLS
~~

Normal vs Controlled spraying
High vs Low a r velocity
***
ns
The emissions from the BPO-catalyzed resin (either neat resin with slow gel or modified resin with fast gel) are different from the regular resin under controlled spraying. The emissions from the neat BPO-catalyzed resin are also significantly different from those from the modified BPO-catalyzed resin.
The following results and discussions are based on total emissions quantified by the. emission measurement method. The percent reduction is based on the averages of total emissions for the number of test runs conducted under the same conditions. The same
Regular vs. Low-VOC
AAA (ext) vs HVLP (int) AAA (ext) vs. HVLP (ext) HVLP (int) vs HVLP (ext)
31
***
ns ns ns
Low-profile vs. Low-styrene Low-profile vs. Styrene-suppressed Low-protile vs. Styrene-suppressed+wax Low-styrene vs. Styrene-suppressed Low-styrene vs. Styrene-suppressed+wax Styrene-suppressed vs. Styrene-suppressed+wax
AAA vs. Flow coater AAA vs. Pressure-fed roller Flow coater vs. Pressure-fed roller
Regular vs. BPO-catalyzed (fast gelj Regular vs. BPO-catalyzed (slow gel)
BPO-catalyzed slow gel vs..fast gel
* ***' *** *** *** ns
*** *** ns
** a**
***
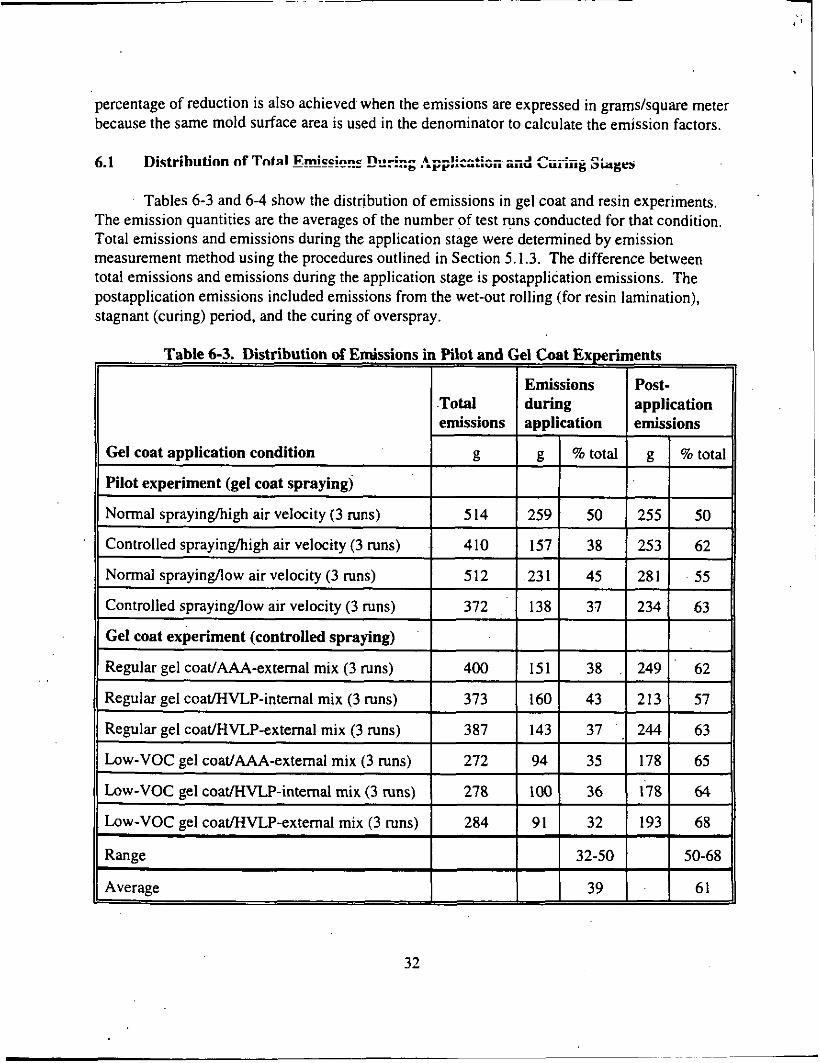
percentage of reduction is also achieved when the emissions are expressed in gramslsquare meter because the same mold surface area is used in the denominator to calculate the emission factors.
6.1 Distrihutinn of Tntd E.ilssIcr?s "r?rizg .'.pp!ica:ic; ziii CuArrg &,g:rs
Tables 6-3 and 6-4 show the distribution of emissions in gel coat and resin experiments. The emission quantities are the averages of the number of test runs conducted for that condition. Total emissions and emissions during the application stage were determined by emission measurement method using the procedures outlined in Section 5.1.3. The difference between total emissions and emissions during the application stage is postapplication emissions. The postapplication emissions included emissions from the wet-out rolling (for resin lamination), stagnant (curing) period, and the curing of overspray.
Gel coat application condition
Pilot experiment (gel coat spraying)
Normal sprayinghigh air velocity (3 runs)
Controlled sprayinghigh air velocity (3 runs)
Normal sprayingllow air velocity (3 runs)
Controlled sprayingllow air velocity (3 runs)
Gel coat experiment (controlled spraying)
Table 6-3. Distribution of Emissions in Pilot and Gel Coat Experiments I I I il
emissions application
g g 9% total
514 259 50
410 157 38
512 23 1 45
372 138 37
Post- I application Emissions 1 Total I during
Regular gel coaVAAA-extemal mix (3 runs) 400 151 38 . 249 62
234
Regular gel coat/HVLP-internal mix (3 runs) 373 160 43
Low-VOC gel coat/HVLP-external mix (3 runs)
Range
Regular gel coat/HVLP-external mix (3 runs) 1 387 I 143 I 37
284 91 32 193 68
32-50 50-68
Low-VOCgelcoat/AAA-externalmix(3runs) I 272 I 94 I 35 I 178 I 65 11
Average
Low-VOC gel coat/HVLP-internal mix (3 runs) I 278 I 100 I 36 I 178 I 64 11
39 61

Table 6-3 shows that 32 to 50 percent (average 39 percent) of total emissions was emitted during the gel coat spraying stage and the remainder was emitted during the postapplication (curing) stage. Figure 6-1 shows the amount of styrene emitted for each of the gel coat application conditions. It is apparent that controlled spraying emitted less styrene than normal spraying, and the low-VOC gel coat emitted less styrene than the regular gel coat. The pilot experiment also showed that low and high linear air velocities in the spray booth (between 40 and 100 ft/min) did not have an effect on emissions. Figure 6-1 also shows that there is no significant difference in total emissions for three different spray guns (Le., AAA spray gun with external catalyst mixing and HVLP spray gun with internal and external catalyst mixing). More detailed discussion is presented in Section 6.3.
Total emissions
Table 64 shows that 38 to 63 percent (average 50 percent) of total emissions was emitted during the resin application stage and the remainder was emitted during the postapplication stage. The postapplication stage included wet-out rolling and stagnant (curing) periods. Figure 6-2 shows the styrene emissions quantified for each of the resin application conditions. It is apparent that the flow coater and the pressure-fed roller resulted in less emissions than normal or controlled resin sprayup. Low-styrene and styrene-suppressed resins also emitted less styrene than the low-profile resin. More detailed discussions for the resin experiment are presented in Section 6.4.
Emissions during Postapplication auulication emissions
Resin application condition
AAA-noma1 spraying (1 run)
~ -~ ~~~
g g 9% total g ?6 total
636 310 49 326 51
AAA-controlled spraying (5 runs)
Flow coater (3 runs)
Pressure-fed roller (3 runs)
~~~
445 214 48 23 1 52
306 143 47 I63 53
299 166 56 133 44
Low-styrene resin (3 runs)
Styrene-suppressed resin (3 runs)
~
Range
395 192 49 203 51
286 180 63 106 37
Styrene-suppressed resin +wax (3 runs)
Neat BPO resin - slow gel (2 runs)
BPO resin + thickener - fast gel (2 runs)
~ ~
266 I49 56 1 I7 44
752 311 41 441 59
512 193 38 319 62

1

.I
t
. '
C In .- E a, 5 C .- In C 0 In u)
a,
.-
.- E
35
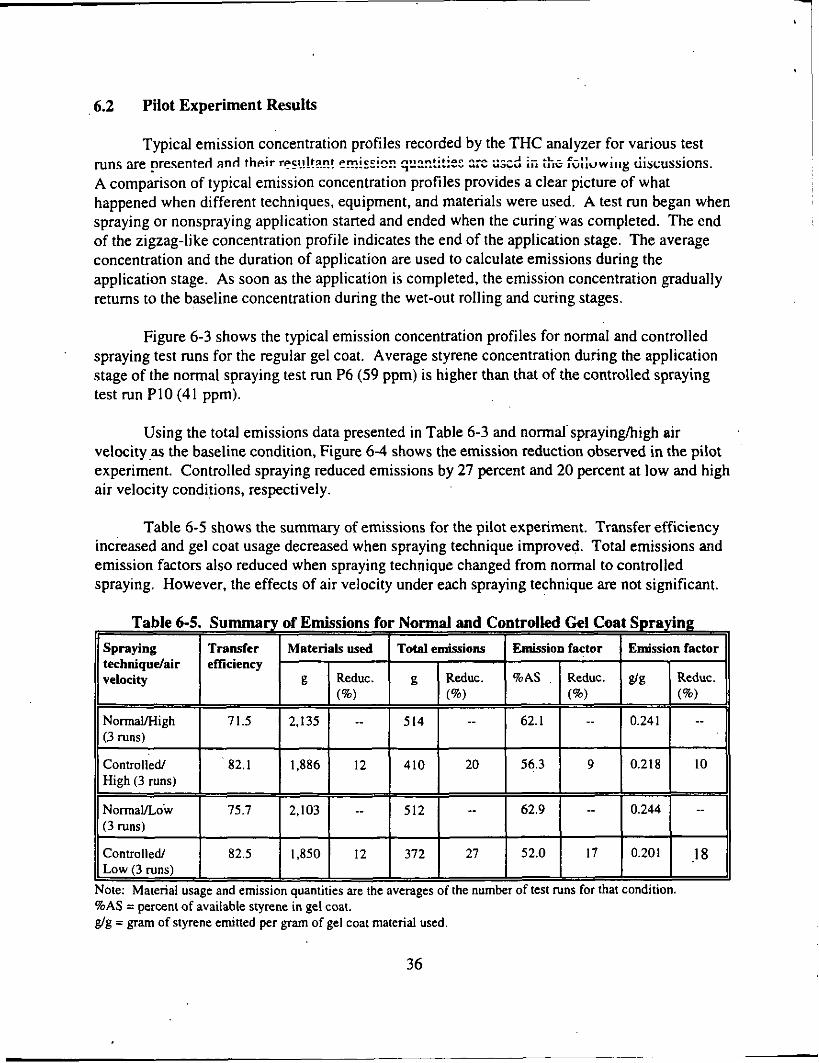
6.2 Pilot Experiment Results
Typical emission concentration profiles recorded by the THC analyzer for various test runs are presented and their rp!?!!!?:! ~r?i::icr. y?~! i ! i : : 2:: C Z C ~ i i i :he fc:iuwiiig iiscussions. A comparison of typical emission concentration profiles provides a clear picture of what happened when different techniques, equipment, and materials were used. A test run began when spraying or nonspraying application started and ended when the curing'was completed. The end of the zigzag-like concentration profile indicates the end of the application stage. The average concentration and the duration of application are used to calculate emissions during the application stage. As soon as the application is completed, the emission concentration gradually returns to the baseline concentration during the wet-out rolling and curing stages.
Figure 6-3 shows the typical emission concentration profiles for normal and controlled spraying test runs for the regular gel coat. Average styrene concentration during the application stage of the normal spraying test run P6 (59 ppm) is higher than that of the controlled spraying test run P10 (41 ppm).
Using the total emissions data presented in Table 6-3 and normalsprayinghigh air velocity as the baseline condition, Figure 64 shows the emission reduction observed in the pilot experiment. Controlled spraying reduced emissions by 27 percent and 20 percent at low and high air velocity conditions, respectively.
Table 6-5 shows the summary of emissions for the pilot experiment. Transfer efficiency increased and gel coat usage decreased when spraying technique improved. Total emissions and emission factors also reduced when spraying technique changed from normal to controlled spraying. However, the effects of air velocity under each spraying technique are not significant.
Table 6-5. Summary of Emissions for Normal and Controlled Gel Coat Spraying 1,
Note: Material usage and emission quantities are the averages of the number of test runs for that condition. %AS = percent of available styrene in gel coat. p/s = gram of styrene emitted per gram of gel coat material used.
36

Normal spraying of gel coat (run P61 ' I 90
I
l o 0 'w I
90
I 80 ~
Controlled spraying of gelcoat (run P101
E 70
10 I 0 l.
0 10 20 30 40 5 0 60
Elapsed time. minutes
Figure 6-3. Typical emission concentration profiles for normal and controlled gel coat spraying.
3 1

I !
I
! I
I i
I I
I i I
1 i I I
! 1 I
I
I r
38

Materials used
.Type of gel g coat
Regular (9 Nns)
1 1,783 1 387 I -- 1 56.0 1 -- 10.217 I -- 1 133 1 -- 1
Total Rule 1162 static emissions Emission factor Emission factor emissions
g Reduc. %AS Reduc. g/g Reduc. g/m’ Reduc. (%) (%) (%) (%)
Low-voc (9 runs)
Note: Material usage and emission quantities are the averages of the number of test runs for that material. %AS = percent of available styrene in gel coat. g/g = gram of styrene emitted per gram of gel coat material used.
2,025 278 28 54.2 3 0.137 37 83 37
39

Controlled spraying of regular gel coat (run G61 i
80 ~
Controlled spraying of low-VOC gelcoat (run G16) I
20 H I 10
0' T
90 , I I
0 10 20 30 40
Elapsed time, minutes
50 60
Figure 6-5. Typical emission concentration profiles for regular and low-VOC gel coats.
40
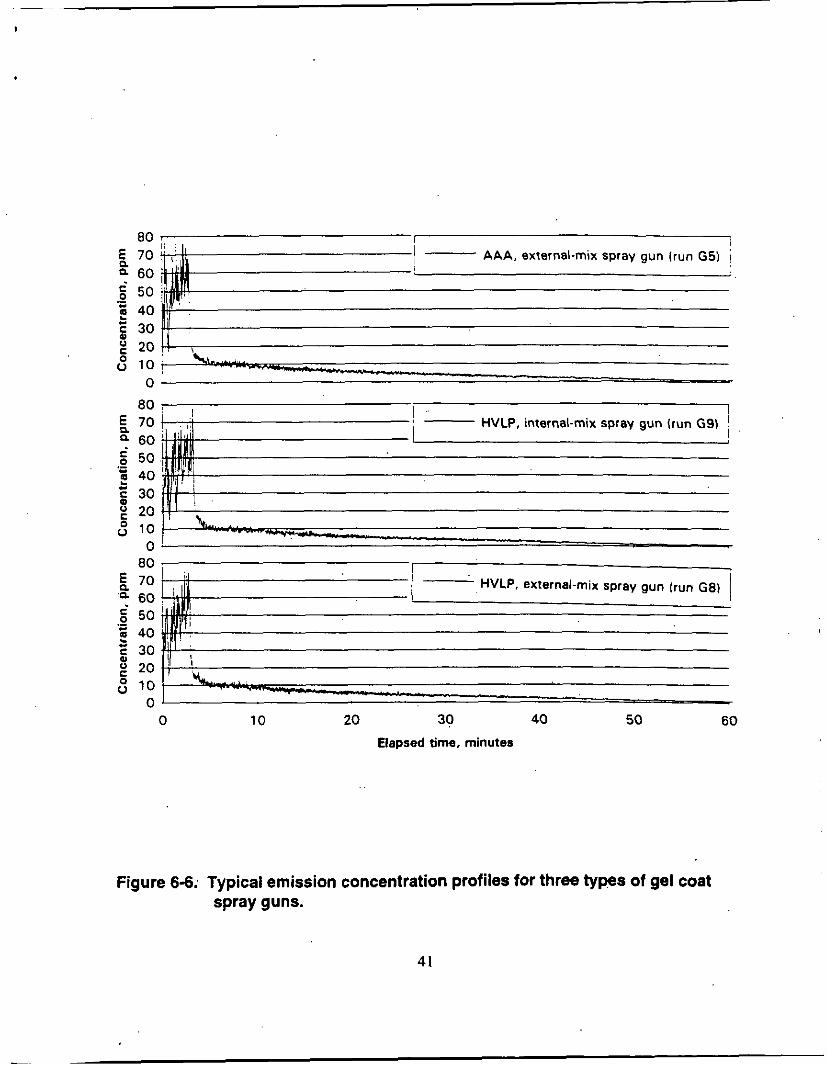
1 AAA, external-mix spray gun lrun G5) i I
E 20 I! $
80 70 60 5 0 40 30 20 10 0
I '
, HVLP, external-mix spray gun (run GEI I I
10 0 - 0 i o 20 30 40 50 60
Elapsed time, minutes
Figure 6-6; Typical emission concentration profiles for three types of gel coat spray guns.
41

,
I !
I i
i i i
I i I i
I I I 1 i i I 1 I I I
I ~
! i
I i i i I 1 i
i !
I I I
i i
i i I j !
~
I T
42

6.4 Resin Experiment Results
Emission quantities for different resin application equipment are summarized and presented in Table 6-7: Nonspraying equipment (Le., flow coater and pressure-fed roller) ..
reduced total emissions by 3 1 to 33 percent when cornpared to controlled resin sprayup. As '
shown in Table 6-1, the statistical analysis indicates that total emissions between the flow coater and pressure-fed roller are not statistically significant at the 95 percent confidence level.
Table 6-7. Summary of Emissions for Resin Application Equipment I,
Emission factor Emission factor
Note: Material usaze and emission auantities are the averazes of the number of test runs for that eauioment. . . - BL = Baseline condition for emission reduction calculation. %AS = Percent of available styrene in resin. glg = Gram of styrene emitted per gram of resin material used.
The test plan originally called for six runs of controlled spraying. Accidentally, one of the six test runs was conducted in normal spraying. Table 6-8 compares the emission quantities for three types of application equipment to the normal spraying test run. Controlled resin sprayup reduced total emissions by 30 percent when compared to normal (uncontrolled) resin sprayup. Flow coater and pressure-fed roller achieved 52 to 53 percent total emission reduction when compared to normal resin sprayup.
Figure 6-8 shows the typical emission concentration profiles for various resin application techniques and equipment. Average styrene concentration during the application stage of the normal spraying test run RIU was 88 pprn, which is higher than the 60 ppm of the controlled spraying test run R15. The flow coater and the pressure-fed roller took longer to complete the lamination but the magnitude of concentration profiles (less than 10 ppm) is much lower than that of resin sprayup.

Table 6-8. Comparison of Emissions among Various Resin Application Equipment and
Figure 6-9 shows the typical emission concentration profiles for various resin formulation test runs. The magnitude of the emission profiles decreases as the styrene content in the resin decreases or the styrene-suppressant content increases. Figure 6- 10 compares emission profiles of the low-profile resin, neat BPO-catalyzed resin, and modified BPO-catalyzed resin. The neat and modified BPO resins had higher and longer concentration profiles than the low-profile resin because of higher styrene content or longer gel time. The BPO-caralyzed resin was formulated for filled application, but it was used in this testing without any filler. Fume silica was added to the BPO resin to keep the resin materia! on the mold until it was cured.
Emission quantities for different resin formulations are summarized and presented in Table 6-9. Low-styrene resin reduced total emissions by 1 1 percent when compared to controlled resin sprayup. Styrene-suppressed resin with or without additional wax reduced total emissions from controlled resin sprayup by 36 to 40 percent. Emission reductions are even higher when the comparison is based on the normal spraying test run. Statistical analysis indicates that total emissions from styrene-suppressed resin with and without additional wax are not significantly different at the 95 percent confidence interval. The neat and modified BPO-catalyzed resins
1
44

1 3
160
140
120
100
80
60
40
20
0 0 10 20 30 ' 40 50 60
I 160 , 140
! - - A M spray gun, controlled spraying technique (run R15) I . .- ,
Application ends
0 10 20 30 40 50 60 Application ends'
E 2o ; &/ -Flow water (run R2) : n n 0-
0 i 0 10 20 30 40 50 60
E 2 0 , ~ - Pressure-fed roller (run R3)
0 0 10 20 30 40 50 60
I 0.
Elapsed time. minutes
Figure 6-8. Emission concentration profiles observed for different resin application techniques and equipment.
45

140 120
Figure 6-9. Typical emission concentration profiles for various resin formulations (applied by AAA spray gun).
i
46

160 7- Low profile resin, controlled spraying technique frun R15)
r
160 E 140 Neat-BPO resin, slow gel time frun R17)
. . : 120 g 100 5 80 Q 60 * 40 5 0 20
0
.-
E . ;::-I BPO resin with thickener; fast gel time (run R25) I ; 2 120
10 20 30 40 50 60 0
Elapsed time. minutes
Figure 6-1 0. Typical emission concentration profiles for low-profile, neat-BPO, and modifled BPO resins (applied by AAA spray gun).
41
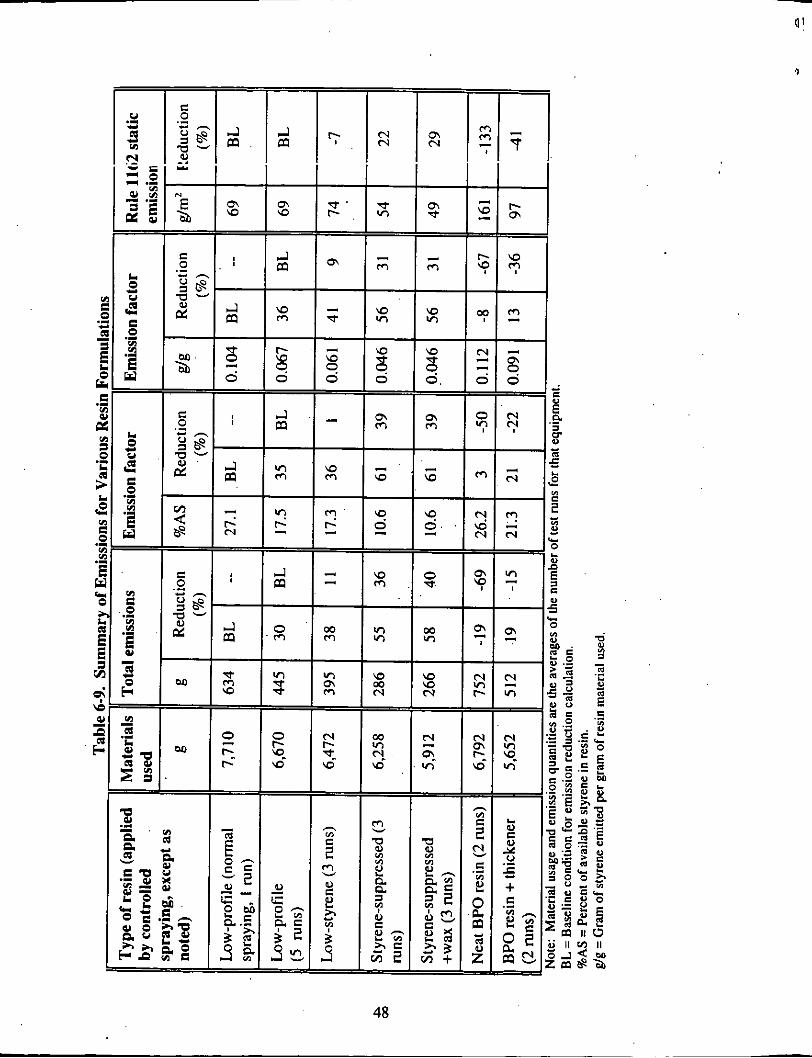
I
r
M - M
-
m W
- -
- el m
el m -$$ m VI
IA W m 00 rn N N
48

D
Resin sprayup (VS)
Resin hand layup ( N V S )
I
emitted more styrene than the low-profile resin. These results contradict the original assumption that resin catalyzed by BPO might reduce styrene emissions. Possible explanation for this situation is that the BPO resin was developed for filler application, not for neat resin sprayup and the gel time for BPO resin was longer than that of the low-profile resin.
3-9 6 10.6 (styrene-suppressed 1.8 resin, controlled spraying)
5-10 7.5 15.3 (pressure-fed roller) 2.0
Figure 6-1 1 shows the overall emission reductions or increases observed in the resin experiment. The reductions or increases are calculated based on the total emission quantities presented in Tables 6-6.6-7, and 6-8 for each of the conditions. Using low-profile resin and controlled spraying as the baseline, emission reductions or increases for various equipment and materials are presented. Except for the BPO-catalyzed resin, all other resin formulations resulted in emission reduction when compared to the low-profile resin.
Figure 6-12 shows the emission reductions or increases when using low-profile resin and normal spraying as the baseline. Higher emission reductions were achieved by flow coater, pressure-fed roller, low-styrene resin, and styrene-suppressed resin. If the normal spraying technique represents actual practices in the industry, Figure 6-12 shows the potential reduction that could be achieved by changing to flow-coater and pressure-fed roller and other low-styrene or styrene-suppressed resins.
6 5 Comparison of Test Results with EPA AP-42 Emission Factors
Emission factors derived from the test results are compared to relevant EPA AP-42 emission factors in Table 6-10. These emissions factors are 1.6 to 2.5 times the respective midpoints of AP-42 emission factors. The implication of this finding is that current EPA Ap-42 emission factors for gel coat and resin sprayup and hand layup operations may underrepresent actual emissions for these operations.
Gel coat sprayup ( N V S ) 26-35
4 Resin sprayup ( N V S )
62.5 (normal soravinel ~
56 (controlled spraying) 1.8
54.2 (low-VOC gel coat, 1.8 controlled spraying)
1 1 27.1 (normal spraying) 2.5
17.5 (controlled spraying) 1.6
49
I -

! I I
, ,
I
0 N
I j i i ! I
! ! I 1
I
I
L
0 p!
1 I I
i
I i I
I
i ! L
I
I ! I
I i
i
! !
i -
I
I i 1
! I ! L
j
i
I
i I
I
! i
-
I I L
0 P
0 Y)
0 9
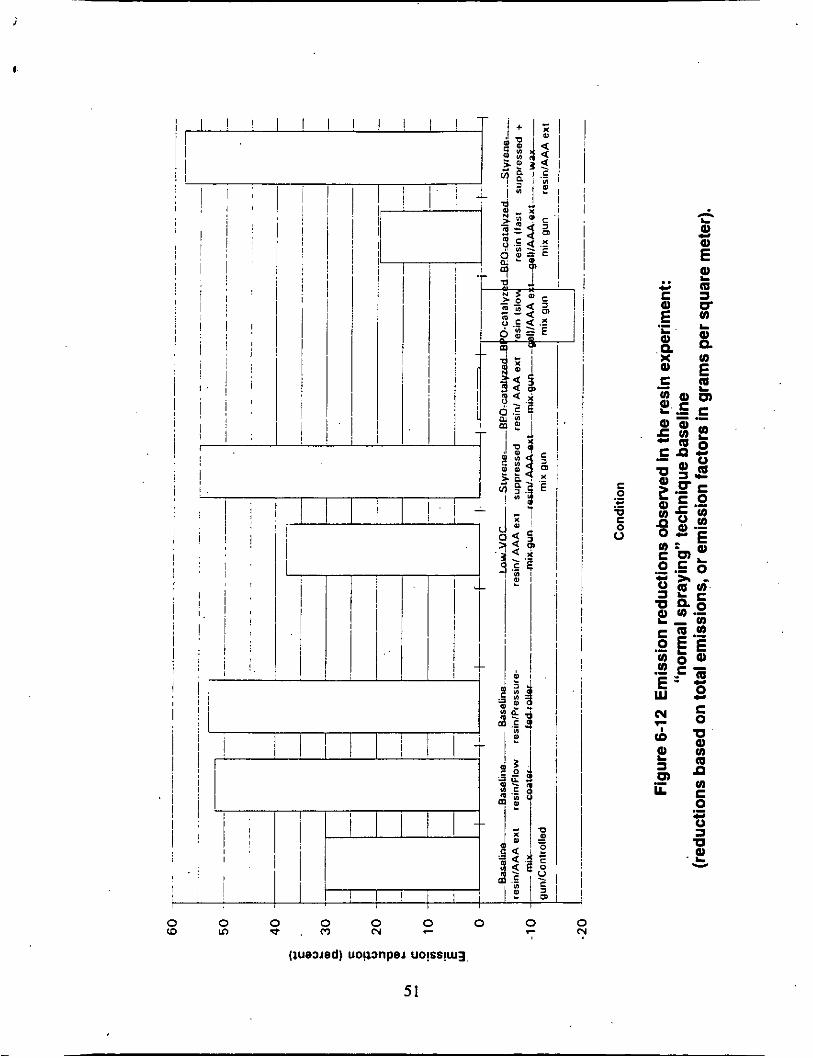
~' i j I
r 0 (0
UL- I I
I i A
I . i I I
i ,
0 0 p! r
a
P
6.6 Comparison of Emission Measurement Method and Mass Balance Calculation Method
6.6.1 Pure Styrene Evaporation Test
Three sets of pure styrene evaporation tests were conducted at Reichhold in June 1995. One set was conducted on June 5, the second set on June 7, and a final set on June 29. Within each set, there were several periods that different styrene evaporation rates were generated. The results of these different test runs are shown in Table 6-1 1 and Figure 6-13. The agreement between the emission measurements and the mass balance calculation method during the pure styrene evaporation runs was good. Table 6-1 1 shows that the average ratio of mass balance calculation method to emission measurements for these 15 runs was 0.99. Figure 6-13 indicates that the agreement between the mass balance calculation method and emission measurement method was within i10 percent for 12 out of 15 runs.
6.6.2 Comparison of Emissions Measured by Two Test Methods
Mass balance measurements were compared with emission measurements during four experimental test runs and 55 official test runs at the Reichhold Chemicals facility. These 59 test runs can be separated into:
4 Experimental runs 12 18 Gel coat application runs 25 59 Total runs
Pilot test runs (involving gel coat spraying)
These two methods for these 59 test runs are compared in Table 6-12 and Figure 6-14. Prior to June 22, the pilot and gel coat application test runs were made with only the 5-gallon gel coat supply container on the scale. The amount of material used in each test run was calculated from the weight loss from the 5-gallon container. It was found that the pump system is a single- action pump that withdraws material from the container only during the upstroke action. Therefore, there was a potential error in estimating the exact amount of material dispensed from the spray gun when the piston pump starts and ends at different positions. In this case, the amount of material in the pump system could not be accounted for by weighing the container only. Beginning in run G16. the project team member made sure that the pump started and ended at the same position, so that the amount of material in the pump system remained the same at the beginning and the end of a test run. This approach improved the accuracy of the mass balance calculation method. Table 6-12 indicates that the ratio between the mass balance calculation method and emission measurement method came close to 1.0 (indicating perfect agreement) much more consistently between test runs GI6 and R2.
52
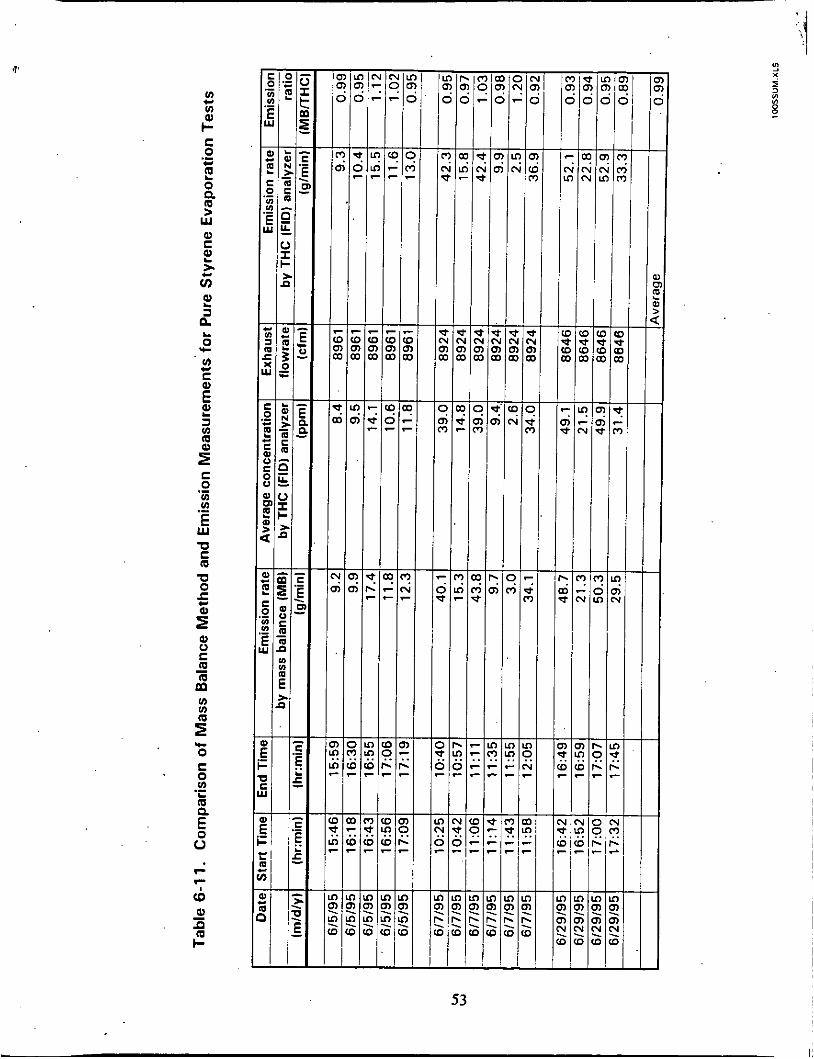
ln
ln c,
C 0 .- c 2 0 P m >
W m C
E z ?! a n E
C 0 In ln
W U C m U 0
.-
.- E
5 s m u C m -
m" ln ln
2 c 0 C 0 VI .- L m ? 0 0
53

~
i i I
!
!
1 I I ! i
I i ' .
i
I
!
1 ~
i
i !
i I . I I I .9p:91 ! ! I i i i
54


I !
I
I
I
I ! I !
i j
I
I ~ I
I
1 I I
!
1 I I i ! i
I
! I
I I I
! i I 1 -
I
t , ! SZM 1 I I I VZM
I I I J ZZM I I I I ~ LZM
I I 1 OZU
C 61M ' 8lM I I I I LLM
. I I I 1 9 L M
, ^_.. I C L O
1 1 I
I I I I L I L L )
I I I 2 913 I I I ,t L l 3
, . r - - - I I I I + 63
! I I i 83
ZLd L Ld O ld 6d 8d Ld 9d Sd Vd Ed I d l d
i LdX3 I dX3.143 I dX314M
8 7
1 , I
56

Beginning in run R3, resin usage was measured by placing both the 5-gallon container and the entire piece of application equipment on the scale. This procedure avoided the need to make sure that the pump was returned to its initial position at the end of the run. With the pump and the gun on the scale, all material exiting the gun was directly measured. Figure 6-14 shows. that the ratio between mass balance measurements was within +5 percent and -10 percent of 1.0 for runs R3 through R25.
Overall, the mass balance method and emission measurement method were within 210 percent for 4 3 out of 59 runs &e., 73 percent of the runs) and the two methods agreed to within *IO percent for all 25 resin runs (the last 25 runs). Table 6-12 shows that the average ratio between mass balance calculation measurements and emission measurements was 1.02. These results show that, on average, the two methods agreed to within 2 percent.
Table 6-13 also shows that the mass balance/emission measurement ratio for the resin runs had a smaller standard deviation than the previous pilot and gel coat test runs. This comparison shows that correct measurement of the amount of material used in a test run improved the accuracy of the mass balance calculation method. These test results indicate that, when proper procedures are carefully .followed, the mass balance calculation method can provide calculated emissions that are in good agreement with emission measurement using EPA Method 25A and a total enclosure.
Weighted average I 1 02 0.10

Chapter 7 Data Quality Issues
C-<Ci&; diia yuaiiiy iiict or exceeaed tne ObJeCtiVeS outlined in the Category I l l quality assurance project plan (QAPP). Specific QA activities are presented in the following sections More detailed analyses or evaluations are provided in Appendixes D, G, and H (Volume II).
7.1 Summation of Project QA Activities
A quality assurance project plan, Pollution Prevention Technology Demonstration, Evaluation of Pollution Prevention Techniques to Reduce Styrene Emissions from 0pen.Contact Molding Processes, Categon, III Quality Assurance Project Plan, was prepared by the. RTI project team and submitted to EPA on April 28. 1995, for approval prior to the start of the proposed testing. Responses to comments from EPA were summarized in a memorandum from Emery Kong to Carlos Nunez dated May 25, 1995, which is considered an addendum to the QAPP. Both the QAPP and the addendum are included in Appendix A (Volume n).
As described in the QAPP, the following QA activities were conducted as part of the project. The RTI project QA manager, Cynthia Salmons, and William Yeager conducted an internal technical system audit (TSA) of the project on June 9, 1995.
No formal corrective action requests were necessary for this project. Minor deviations from the QAPP were documented in laboratory notebooks and data sheets, when necessary. Two major deviations were (1) the modification of BPO resin after it was found to have a long gel time and low viscosity and (2) the withdrawal of a water-emulsified resin from the test by the manufacturer .
Other QA and QC activities during the course of this project included daily calibration of the high-precision scale with standard weights ranging from 1 g to 2,000 g (described in Section 5.2). periodic checks for scale drift by leaving a standard weight on the scale overnight, styrene evaporation experiments (described in Section 6.6.1). comparison of the total hydrocarbon analyzer's response to styrene cylinders with its response to the propane calibration cylinders (described in Appendix C), and a comparison of direct injection to the THC analyzer with delivery through the sampling line, as described in Appendix I (Volume n).
7.2 RTI Internal Technical System Audit (TSA) Results
The internal TSA found that the project activities were generally conducted in accordance with the QAPP and that results were carefully documented. More extensive calibrations of the THC analyzer were performed than were described in the QAPP or the EPA method. The . measurement point for the exhaust flow rate was approximately five or six diameters downstream of a bend, instead of the eight diameters recommended by the EPA method, but there was no reasonable way of correcting this. The maximum number of traverse points
58

suggested in EPA Method 1 for this type of situation was used. Checks for off-axis flow did not indicate a problem. The records for the total enclosure test indicated that there was considerable fluctuation in the hot wire anemometer readings and that a few of the flow velocity readings at the natural draft opening were slightly less than 200 ft/min, but this did not seem to present a problem, judging from the results of the styrene evaporation experiments. Due to the audit schedule, several aspects of the project were not observed during the TSA. These included sampling and analysis of the gel coat and resin, the styrene evaporation experiment, the demonstration that the spray booth meets the criteria for a total enclosure, the weekly traverse measurements, and the measurement of equipment delivery rate. Records of these activities were reviewed when possible. A memorandum documenting the TSA activities is included in Appendix H (Volume II).
7.3 EPA Performance Evaluation
EPA supplied RTI with a performance evaluation styrene standard gas cylinder, which RTI analyzed on July 7, 1995. The results of this EPA performance evaluation are presented in Appendix I (Volume Il). Using the THC analyzer and calibration standards, RTI predicted the styrene concentration in the EPA performance evaluation standard to be 30.4 ppm. The Certified value of the styrene standard was 3 1 .O ppm by the Scott Specialty Gases. There was only a 2 percent difference between the predicted and certified values. Therefore, the data quality objective for emission concentration measurement was met.
59

Chapter 8 Conclusions and Recommendations
The results from the pilot experiment indicated that:
.
.
.
.
.
.
.
.
.
.
.
.
. . .
Over the velocity range examined, 12 vs. 30 d m i n (40 vs. 100 ft/min) linear air velocity had no significant effect on styrene emissions. Controlled gel coat spraying technique reduced total styrene emissions by 24 percent compared to normal spraying technique. Controlled spraying on the male mold reduced gel coat usage by 12 percent due to less overspray. Under normal spraying, 48 percent of total emissions was emitted during gel coat spraying; the remainder was emitted during curing. Under controlled spraying, 38 percent of total. emissions was emitted during gel coat spraying; the remainder was emitted during curing.
The results of the gel coat experiment indicated that:
The low-VOC gel coat reduced total emissions by 28 percent when compared to the regular gel coat. The low-VOC gel coat required a higher air supply pressure and larger spray tip to achieve the same spray fan as the regular gel coat. The AAA and HVLP (internal and external catalyst mixing) gel coat spray guns made no difference in terms of total emissions.
The results of the resin experiment indicated that:
Controlled resin spraying emitted 30 percent less styrene than normal spraying technique. Flow coater and pressure-fed roller equipment resulted in 3 1 to 33 percent less styrene than controlled resin sprayup. Flow coater and pressure-fed roller equipment resulted in 52 to 53 percent less styrene than normal resin sprayup. Thicty-eight to 63 percent (average 50 percent) of total emissions was emitted during the resin application stage; the remainder was emitted during the wet-out rolling and curing stages. The low-styrene resin emitted 1 1 percent less styrene than the low-profile resin. The styrene-suppressed resin emitted 36 percent less styrene than the low-profile resin. The styrene-suppressed resin with 0.1 percent additional wax emitted 40 percent less styrene than the low-profile resin.
60

. The BPO-catalyzed resin emitted more styrene than the low-profile resin because of
For the BPO-catalyzed resin, ashorter gel time reduced total emissions. higher styrene content andor longer gel time. . Other observations made from this testing were:
. On an average of 55 official test runs and 4 experimental test runs, total emissions
The mass balance calculation method could potentially be used to determine emissions
Emission factors derived from the test results are 1.6 to 2.5 times the respective mid-
determined by emission measurements and the mass balance calculation method are in good agreement within 5 percent.
from open molding processes.
range EPA AP-42 emission factors; this implies that AP-42 emission factors for resin and gel coat sprayup may underrepresent actual emissions for these processes.
.
.
8.2 Recommendations
Based on the findings of'this testing, the following recommendations are made to facilities using the open molding process: ,
. Train operators to improve their spraying technique to reduce overspray, material wasted,
Use nonspraying equipment when feasible to reduce emissions. Use low-styrene or styrene-suppressed materials when feasible. Reduce gel time when feasible to curtail emissions. Combine the effects of operator technique, materials, and application equipment to
The mass balance cahlation method and in-house personnel can be used to determine
and emissions. . . . . achieve the maximum emission reduction.
emission factors for materials and equipment. .
61

1. REPORT NO. 2.
EPA-600iR-97-018a
Evaluation of Pollution Prevention Techniques to 4. TITLE A N 0 SUQTITLE
Reduce Styrene Emissions f rom Open Contact
3. RECIPIENT'S ACCESSION NO.
5. REPORT DATE March 1997
6. PERFORMING ORGANIZATION CODE
Andrew Clayton 9. PERFORMING OROANIZATION NAME AND ADORES 110. PROGRAM ELEMENT NO.
7 . AUTHORIS) Emery Kong, M a r k Bahner, Robert Wright, and
8. PERFORMINO ORGANIZATION REPORT NO.
Research Triangle Institute
Research Triangle P a r k , North Carolina .27709 P. 0. Box 12194
12. SPONSORING PGENCY NAME A N 0 ADDRESS
EPA, Office of Research and Development A i r Pollution Prevention and Control Division Research Triangle Park, NC 277ll
Release to Public I
11. CONTRACT/GRANT NO.
CR 818419-03
Final; 4/94 - 9/95
E PA/600/13
13. TYPE OF REPORT A N 0 PERIOD COVERED
14. SPONSORING AGENCY CODE
a. OESCAIPTORS
Pollution Styrene Resins Emission Molding Techniques Fiberglass- reinforced Plastics Boats
I . . I Unclassified
b.lOENTIFIERS/OPEN ENDED TERMS C. COSATI Fkld/CrOUp
Pollution Prevention 13 B Stationary Sources llI, llJ Boat Building 14G
13 H 11D 135
1 I , EPA Ferm 2220.1 (9.71) ' 62
. . Unclassified 71
m 00
0 I
E- a I
M
p: . 0 0 (0
I a n W
0 2