visus: an interactive system for automatic machine ... · automatic machine learning (automl)...
TRANSCRIPT

Visus: An Interactive System for Automatic Machine LearningModel Building and Curation
Aécio SantosNew York [email protected]
Sonia CasteloNew York [email protected]
Cristian FelixNew York [email protected]
Jorge Piazentin OnoNew York [email protected]
Bowen YuNew York [email protected]
Sungsoo (Ray) HongNew York [email protected]
Cláudio T. SilvaNew York University
Enrico BertiniNew York University
Juliana [email protected] York University
ABSTRACTWhile the demand for machine learning (ML) applications is boom-ing, there is a scarcity of data scientists capable of building suchmodels. Automatic machine learning (AutoML) approaches havebeen proposed that help with this problem by synthesizing end-to-end ML data processing pipelines. However, these follow a best-effort approach and a user in the loop is necessary to curate andrefine the derived pipelines. Since domain experts often have littleor no expertise in machine learning, easy-to-use interactive inter-faces that guide them throughout the model building process arenecessary. In this paper, we present Visus, a system designed tosupport the model building process and curation of ML data pro-cessing pipelines generated by AutoML systems. We describe theframework used to ground our design choices and a usage scenarioenabled by Visus. Finally, we discuss the feedback received in usertesting sessions with domain experts.
CCS CONCEPTS• Information systems→ Data analytics; •Human-centeredcomputing → Visualization systems and tools.
KEYWORDSData analytics, Data visualization, Automatic machine learning
ACM Reference Format:Aécio Santos, Sonia Castelo, Cristian Felix, Jorge Piazentin Ono, Bowen Yu,Sungsoo (Ray) Hong, Cláudio T. Silva, Enrico Bertini, and Juliana Freire.2019. Visus: An Interactive System for Automatic Machine Learning ModelBuilding and Curation. InWorkshop on Human-In-the-Loop Data Analytics(HILDA’19), July 5, 2019, Amsterdam, Netherlands. ACM, New York, NY, USA,7 pages. https://doi.org/10.1145/3328519.3329134
Permission to make digital or hard copies of all or part of this work for personal orclassroom use is granted without fee provided that copies are not made or distributedfor profit or commercial advantage and that copies bear this notice and the full citationon the first page. Copyrights for components of this work owned by others than theauthor(s) must be honored. Abstracting with credit is permitted. To copy otherwise, orrepublish, to post on servers or to redistribute to lists, requires prior specific permissionand/or a fee. Request permissions from [email protected]’19, July 5, 2019, Amsterdam, Netherlands© 2019 Copyright held by the owner/author(s). Publication rights licensed to ACM.ACM ISBN 978-1-4503-6791-2/19/07. . . $15.00https://doi.org/10.1145/3328519.3329134
1 INTRODUCTIONMachine Learning (ML) models are increasingly being adopted inmany applications. However the supply of data scientists capable ofbuilding such models has not kept up with the demand [3]. Recentapproaches to automatic machine learning (AutoML) help addressthis problem by automating not only model fitting, but also thesynthesis of end-to-end ML data processing pipelines, from dataloading, data cleaning, and feature engineering to model fitting andselection, and hyper-parameter tuning [4, 7, 17]. Commercial solu-tions such as Google’s Cloud AutoML [13] and Microsoft’s AzureMachine Learning Studio [14] are also available. AutoML systemsrequire as input only the training data and a well-defined problemspecification that describes the target variables to be predicted, thedata attributes to be used as features, and the performance metricto be optimized. By automating many of the steps of the ML modelbuilding process, AutoML systems allow data scientists to solveproblems more efficiently.
However, AutoML systems are not sufficient to democratize MLto wider audiences. To empower domain experts, who have little orno expertise in ML, to develop ML pipelines easy-to-use interactiveinterfaces are needed that guide them throughout the model build-ing process [1, 6]. Additionally, AutoML systems put their best effortto generate pipelines that optimize a given performance metric,which often result in black-box models that cannot easily be under-stood by humans. This, coupled with the ever-increasing concernsabout the societal impact of data-driven decision making [8, 18, 19],underscores the importance of bringing the human in the loop ofthe model building process. Enabling domain-experts to build MLmodels not only has the potential to lessen the demand for data sci-entists, but it also enables experts that possess domain knowledgeto assess, validate, and potentially improve model outcomes.
Prior research in the field of visual analytics — which has beenregarded as a grand challenge [12] — has proposed multiple frame-works and systems that integrate ML models and interactive visualinterfaces to facilitate analytical reasoning [1]. However, these sys-tems typically have to integrate tightly with the model they use toprovide insights about the model behavior. With the inclusion ofan AutoML system, we cannot assume any prior knowledge about
arX
iv:1
907.
0288
9v1
[cs
.LG
] 5
Jul
201
9

inner-workings of the returned models because of the large varietyof components present in the derived ML pipelines.
In this work, we propose a new framework to support the modelbuilding process and curation of automatically generated predictivedata processing pipelines. Similar to prior work [1], our frame-work is iterative and includes multiple components that supportexploratory data analysis (EDA), problem specification, model gen-eration and selection, and confirmatory data analysis (CDA). Addi-tionally, we propose new components that allow users to 1) searchthe Web for new relevant datasets to augment the input data, and2) summarize, compare, and explain models generated by AutoMLsystems. The first component enhances the original data by addingnew records (through union operations) or new attributes (throughjoins) that can potentially improve the model performance. Thesecond component allows users to better understand the automati-cally generated pipelines and to select the one that best fulfills theirintent. Finally, we present Visus, a system that implements ourproposed framework and integrates visual analytics techniques inthe model building and curation process. We also describe a usagescenario that illustrates the use of Visus to support data analysisand decision-making processes and discuss the feedback receivedin user testing sessions.
Our contributions can be summarized as follows:• We propose a new visual analytics framework to support theprocess of building and curating ML pipelines automaticallygenerated by AutoML systems;
• We propose new components for 1) searching datasets on theWeb to augment the original dataset, and 2) support modelselection through model summarization, comparison, andexplanation;
• We present Visus, an interactive system that implementsour proposed framework. We describe usage scenarios en-abled by Visus that show how a domain-expert can build aregression model to support decision-making.
Outline. The remainder of this paper is structured as follows. Wediscuss related work in Section 2. In Section 3, we describe our pro-posed visual analytics framework. In Section 4, we describe Visusand our design choices. We present a usage scenario in Section 5,discuss the user feedback in Section 6, and conclude in Section 7,where we outline directions for future work.
2 RELATEDWORKThis paper explores a problem that lies at the intersection of Auto-matic Machine Learning (AutoML) and Human Guided MachineLearning (HGML). In what follows, we briefly describe the stateof the art in these two fields and how they can be connected toachieve our goal. For a comprehensive literature review, see Hutteret al. [11] and Gil et al. [6].
Creating machine learning pipelines is a time consuming taskthat demands domain expertise and machine learning knowledge.These pipelines usually contain many steps, including data pre-processing, algorithm selection and hyper-parameter tuning. Au-toML aims to automate the design and implementation of MLpipelines, reducing the time and level of expertise necessary to de-ploy solutions for real world problems [11]. Some examples of stateof the art AutoMLmethods include Autosklearn [5], TPOT [17], and
AlphaD3M [4]. Autosklearn and TPOT are able to automaticallygenerate pipelines for classification, and AlphaD3M can tackle bothclassification and regression problems. As for the pipeline searchstrategies, Autosklearn uses Bayesian optimization combined withmeta-learning, TPOT uses genetic programming and tree-basedpipelines, and AlphaD3M uses reinforcement learning togetherwith Monte-Carlo Tree Search and self play.
While AutoML speeds up the pipeline generation process andhelps to democratize machine learning, humans still have an impor-tant role to play: by interacting with the AutoML system, humanscan provide additional knowledge to the algorithm and constrainthe space of possible models so that they are more suitable for a spe-cific problem. For example, experts can specify important featuresor pre-processing steps that need to be applied in the data [6, 11].To this end, HGML systems combine AutoML with specializedVisual Analytics (VA) systems, enabling humans to interact withthe pipeline search and improve the model prediction results. Gilet al. [6] presented a task analysis and desiderata for HGML and as-sessed how current AutoML and VA systems attempt to solve thesetasks. The authors grouped desired features for HGML systemsunder three major categories: data use, specifying how featuresand samples should be used, and augmenting the data with newfeatures, model development, constraining the search space of pos-sible models, and model interpretation, interpretation, diagnosisand comparison of machine learning models. Implementing theHGML desired features individually is possible, and described bythe authors. However, implementing a VA system that combines allrequirements remain a challenge, given the iterative and nonlinearnature of the interactions.
Two recent implementations of HGML systems are Snowcat [1]and Two Ravens [6, 10]. Both systems enable data exploration andvisualization. Furthermore, they allow the basic data use specifi-cation, such as setting which features to use to solve a problem,and a rudimentary comparison of the generated ML models usingtraditional metrics and visualizations, such as accuracy and confu-sion matrix. Comparing the capabilities of these systems with thedesiderata proposed by Gil et al. [6], we note two major gaps. First,neither system supports the augmentation of data, a feature thatcan increase the amount of information the models have access toand potentially improve the performance of the generated pipelines.Second, they lack support for model interpretation beyond simpleML metrics. Our system, Visus, aims to fill this gap in the currentHGML systems. In the next session, we describe how we integrateddata search and automatic joins in our framework [2], as well asmodel interpretation based on rule visualization [15].
3 PROPOSED FRAMEWORKFigure 1 shows the main components of our visual analytics frame-work. Each rounded box denotes a task and the connecting arrowsdenote the user workflow. In what follows, we describe each of thecomponents in detail.Problem Specification. The first challenge we address in ourframework is the translation of a problem in the user domain (e.g.,What are the important factors that lead to traffic accidents?, orWhatgenes or environmental conditions influence a plant’s growth?) toa machine-readable problem specification that can be fed to an

AutoML system. A problem specification consists of a set of well-defined properties that describe the users’ analysis goal: a problemtype (e.g., classification, regression, clustering, time series fore-casting, etc.), a target attribute to be predicted (e.g., a categoricalattribute containing classes, a numerical attribute with values), aperformance metric to be optimized (e.g., precision, recall, F1, meansquared error, etc.), and a list of data attributes to be used as fea-tures. Additionally, it may contain other parameters such as timeconstraints (i.e., for how long the pipeline search should run), themaximum number of pipelines to be generated, the performancemetrics to be reported and the evaluation method for computingthem (e.g., k-fold cross-validation, hold-out test set).Data Selection. In order to create a problem specification, theuser first needs to select the data required to solve the problem.There are three data-related components that support the prob-lem specification task: data exploration, data preparation, and dataaugmentation. We arrange them in a group, namely “Data Selec-tion”, because they are intertwined, in the sense that not only theysupport the problem specification task, but also are influenced byproblem specification. For example, consider the data explorationand preparation components. In order to specify a problem, a usermight need to first perform an exploratory data analysis to betterunderstand the data. During the course of exploration, the usermay realize that an attribute contains outliers which need to beremoved, or that an attribute contains missing data that should befilled out with a default value. The user may also decide to updatethe problem specification to indicate that some attributes shouldbe excluded from the model.
The data augmentation component allows the user to search forrelevant datasets that could potentially supplement the originaldata with new records or attributes and, thus, improve the modelperformance. Describing in details the inner-workings of the datasetsearch engine we use to support augmentation is out of the scope ofthis paper. However, it is important to note that it is critical that thesearch results returned by the dataset search engine should not onlybe relevant to the domain of interest, but also should be appropriatefor integration (via join or union operations) with the originaldataset. Themain role of the visual interface is then to allow the userto interact with the search results and facilitate dataset relevanceprediction (i.e., the search interface should display effective datasetsummaries that allow for the user to decide whether the datasetdiscovered is relevant and should be merged to the original dataset).Model Search. After the data is selected and the problem is speci-fied, the AutoML system can be invoked to carry out the pipelinesearch phase. Note that this is the only task in our framework whichthere is no human engagement.Model Selection. AutoML systems aim to generate a model thatoptimizes a given performance metric in the training dataset. How-ever, the best-scoring model learned using the training set is notalways the best model. When the training examples are not diverseand are not good representatives of the real sample distribution,the learned models may not generalize well for samples observedin real-world, and thus the performance might drop in a held-outvalidation set. Additionally, some evaluation metrics may havetrade-offs. For instance, consider the pipelines generated for a bi-nary classification problem. The best pipeline in terms of precision
Model Selection
ModelSummarization
ModelExplanation
ModelComparison
Model Search(AutoML System) Data
AugmentationData
Exploration
Data Preparation
Problem Specification
Data Selection
Text
Driven by System only Driven by Human + System
Figure 1: Our proposed framework encompasses problemdefinition, model generation, and model selection.
may have a low recall score. Instead of blindly selecting only thebest performing pipeline — and given that often a large numberof models is evaluated during the optimization process — a betterapproach for model selection could be to collect a sample of the best-performing pipelines and then present them to a domain-expert topick the best one. Unlike traditional visual analytics approaches, asystem that includes an AutoML component must be able to handlea large number of ML pipelines. Therefore, in order to supportmodel selection, the user interface should provide visualizationsto facilitate exploration, comparison, and explanation of multiplemodels. Our framework includes three components to assist in thistask as detailed next.Model summarization. Since AutoML systems create many pipelines,the end goal of model summarization should be to facilitate theselection of a smaller set of pipelines for further inspection. Visual-izations should aim to provide concise representations of a set ofpipelines and the ability to easily select the best-performing ones.Model comparison. Once a sample of the best-performing pipelinesis selected, the user is able to compare them in detail. Visualizationsshould highlight the commonalities and differences between two ormore pipelines. More specifically, pipelines may differ not only inperformance metric scores but also in their data processing steps,and how they make correct or wrong predictions.Model explanation. The user might also want to gain a better insightinto howmodels make predictions and how the prediction accuracyis distributed conditioned to specific attributes or the target variable.For instance, one might be interested in understanding what is theimpact of certain feature combinations to a prediction outcome.Therefore, explanations might help not only to validate whetherthe model is making correct predictions for the right reasons butalso to learn about data relationships that were not known a priori.
4 THE VISUS SYSTEMWith Visus, we aim to aid domain experts to interactively formu-late prediction problems, build models, and select a suitable modelamong a set of automatically generated models. Visus provides aneasy-to-use interface where users can 1) define a problem, 2) exploresummaries of their input dataset, 3) perform data augmentation,4) explore and compare models with respect to their performancescores and prediction outputs.

Figure 2: Visus’s data selection and problem definition screens: (A) select or load dataset view, (B) select task view (create anew problem, or load an previously created problem), (C) define problem view (displays data summaries and allows selectionof problem parameters), (D) configure search view (allows setup of additional model search parameters).
Define Problem and Explore Dataset. As Figure 2 illustrates,the operations for problem specification and data selection areimplemented in four screens (views) in Visus: Select Dataset, SelectTask, Define Problem, and Configure Search.Select Dataset. Allows the user to select or load a dataset (Fig-ure 2(A)).Select Task. Users can either create a new problem specification orselect one of the existing problems specifications that have beencreated previously (Figure 2(B)).Define Problem. To construct good predictive models, it is importantto identify data attributes (features) that lead to accurate predictions.For this, Visus profiles the data and displays visualizations thatsummarize the information, helping users to obtain insights aboutthe features. Visus supports multiple types of datasets, includingtabular data, time series, audio, and images (see Figure 2(C1)). For allof them, Visus provides a select input control for adding/removingdata on demand with auto-complete and multi-select functionalitiesto help users to easily find data attributes or files.
For tabular data, Visus generates visualizations that adapt todifferent attribute data types. For instance, for numerical and cate-gorical attributes, Visus generates descriptive statistics and sum-marizes data values using a histogram.When visualizing time seriesdatasets, Visus provides a stacked time series plots along with aninteractive brushing tool to help users to explore and visualize dif-ferent time ranges. For audio, Visus lets users reproduce the audioand display its waveform, and for images, it uses thumbnails toshow a sample of the images present in the dataset.
Configure Search. In this screen, users set up additional parame-ters of the model search such as a maximum number of solutions(pipelines) to be generated by the AutoML system, a maximum waittime to conclude the model search. Furthermore, users can alsospecify the performance metrics they want to use for evaluatingthe solutions generated.Inspect Model Summaries. To allow exploration of the pipelinesgenerated by the Model Search, Visus displays them in a solutiontable as shown in Figure 3(E2). In this table, users can see the differ-ent solutions and their associated performance metrics. Users canalso sort solutions by metric, allowing them to quickly identify thebest solutions according to each metric. Additionally, Visus pro-vides a histogram of the scores associated with each performancemetric, which allows the users to visualize the distribution of scoresof all generated solutions (see Figure 3(E1)). When the user hoversover a solution in the table, the bin associated with the score ofthe hovered solution changes its color, allowing quick comparisonof its performance against all other solutions. Furthermore, Visusprovides a parallel coordinates chart, as shown in Figure 3(E3). Eachvertical line corresponds to a performance metric and each hori-zontal line corresponds to a pipeline. Such a visualization allowsfor quick identification of metric trade-offs. If the user hovers overa pipeline, he/she can see how its performance measures compareto those of other pipelines. Finally, users can also inspect the ac-tual data processing steps of each pipeline, including their learningalgorithms and pre-processing primitives (see Figure 3(E4)).
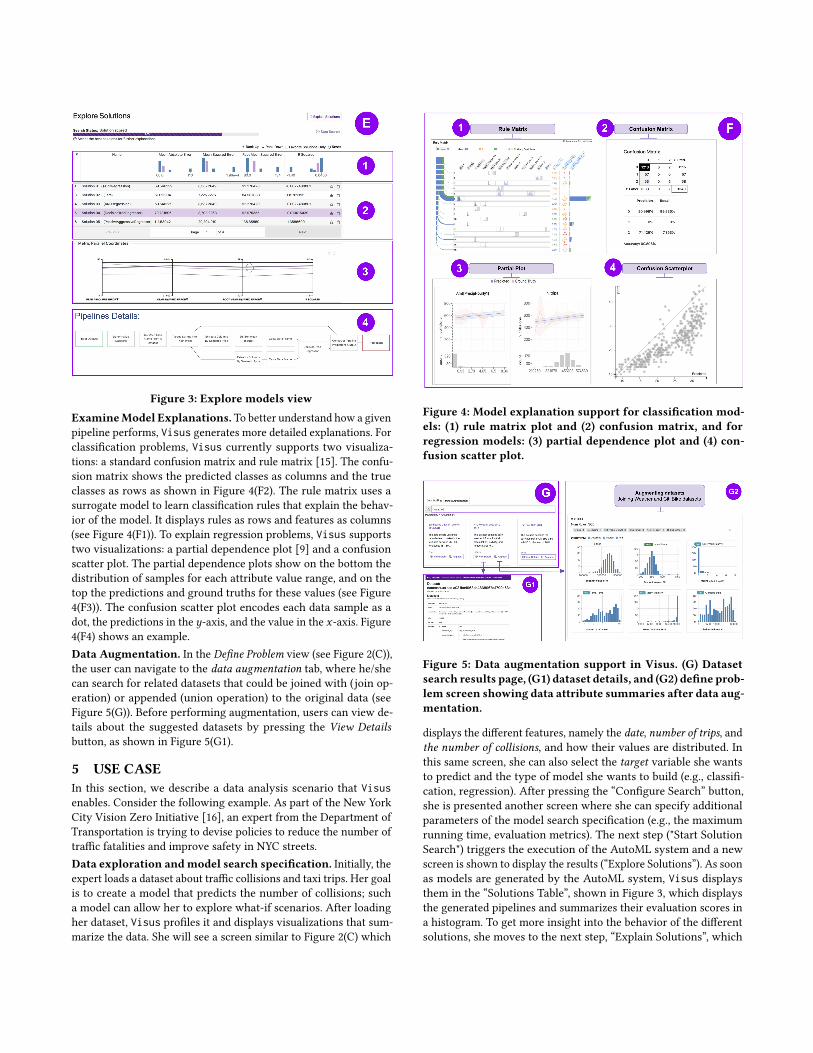
Figure 3: Explore models view
ExamineModel Explanations. To better understand how a givenpipeline performs, Visus generates more detailed explanations. Forclassification problems, Visus currently supports two visualiza-tions: a standard confusion matrix and rule matrix [15]. The confu-sion matrix shows the predicted classes as columns and the trueclasses as rows as shown in Figure 4(F2). The rule matrix uses asurrogate model to learn classification rules that explain the behav-ior of the model. It displays rules as rows and features as columns(see Figure 4(F1)). To explain regression problems, Visus supportstwo visualizations: a partial dependence plot [9] and a confusionscatter plot. The partial dependence plots show on the bottom thedistribution of samples for each attribute value range, and on thetop the predictions and ground truths for these values (see Figure4(F3)). The confusion scatter plot encodes each data sample as adot, the predictions in the y-axis, and the value in the x-axis. Figure4(F4) shows an example.Data Augmentation. In the Define Problem view (see Figure 2(C)),the user can navigate to the data augmentation tab, where he/shecan search for related datasets that could be joined with (join op-eration) or appended (union operation) to the original data (seeFigure 5(G)). Before performing augmentation, users can view de-tails about the suggested datasets by pressing the View Detailsbutton, as shown in Figure 5(G1).
5 USE CASEIn this section, we describe a data analysis scenario that Visusenables. Consider the following example. As part of the New YorkCity Vision Zero Initiative [16], an expert from the Department ofTransportation is trying to devise policies to reduce the number oftraffic fatalities and improve safety in NYC streets.Data exploration andmodel search specification. Initially, theexpert loads a dataset about traffic collisions and taxi trips. Her goalis to create a model that predicts the number of collisions; sucha model can allow her to explore what-if scenarios. After loadingher dataset, Visus profiles it and displays visualizations that sum-marize the data. She will see a screen similar to Figure 2(C) which
Figure 4: Model explanation support for classification mod-els: (1) rule matrix plot and (2) confusion matrix, and forregression models: (3) partial dependence plot and (4) con-fusion scatter plot.
Figure 5: Data augmentation support in Visus. (G) Datasetsearch results page, (G1) dataset details, and (G2) define prob-lem screen showing data attribute summaries after data aug-mentation.
displays the different features, namely the date, number of trips, andthe number of collisions, and how their values are distributed. Inthis same screen, she can also select the target variable she wantsto predict and the type of model she wants to build (e.g., classifi-cation, regression). After pressing the “Configure Search” button,she is presented another screen where she can specify additionalparameters of the model search specification (e.g., the maximumrunning time, evaluation metrics). The next step ("Start SolutionSearch") triggers the execution of the AutoML system and a newscreen is shown to display the results (“Explore Solutions”). As soonas models are generated by the AutoML system, Visus displaysthem in the “Solutions Table”, shown in Figure 3, which displaysthe generated pipelines and summarizes their evaluation scores ina histogram. To get more insight into the behavior of the differentsolutions, she moves to the next step, “Explain Solutions”, which

1 2 3
Figure 6: User-generated visualizations: (1) initial confusionscatter plot, (2) partial dependency plot for temperaturefrom model A, (3) partial dependency plot for temperaturefrom model B.
produces explanatory visualizations such as the confusion scatterplot as seen in Figure 6(1). Analyzing the confusion scatter plot shenotices that, for the pipeline with the smallest error, all instancesare being predicted with the same values (all are in the same po-sition on the x-axis). Clearly, this model is not very useful. Thus,she takes a step back and returns to the “Define Problem” screen torefine the problem.Augmenting the data to increase performance. Now she hy-pothesizes that the unsatisfactory performance may be a resultof insufficient predictive power of her data attributes. She thenclicks on the tab “Data Augmentation”, to search for additionaldata. Intuitively, weather information, such as bad weather condi-tions can potentially increase the number of collisions. She usesthe search form to find datasets that have the keyword “weather”and that are related to her input data, i.e., that can be joined withit, and then selects a matching dataset. Because many collisionsalso involve cyclists, she also searches for datasets related to herinput data using the keyword “citi bike”, hoping to find a datasetcontaining information about the number of cyclists in the streets.Because both weather and citi bike datasets contain temporal at-tributes, as has her original data, Visus is able to automaticallyperform a temporal join of these datasets. After doing the augmen-tations with weather and Citi Bike data, her data increased from3 to 7 features. She now re-runs the solution search to generatesolutions using the augmented data and finds that the best pipelinehas now improved from 71.29 to 61 in terms of mean absolute error,a significant improvement.
After picking her new favorite pipelines on the “Explore Solution”screen, she inspects them in more detail. She notices that now herbest pipeline’s predictions improved and the confusion scatter plotshows a more diagonal pattern (see Figure 4(F4)), which is thedesired behavior. By using the partial dependency plot, she inspectsthe impact of the features in different models. She notices that,for pipeline A, the temperature has a strong negative correlationwith the number of collisions (Figure 6(2)), while the pipeline Bseems not to use temperature, as indicated by a flat line (Figure 6(3))showing no correlation. Both pipelines use different versions of theLasso algorithm and have similar performance in terms of error,she uses her domain knowledge, and decides to choose the modelB which does not take temperature into account, even thoughits performance according to evaluation metrics is inferior whencompared to A.
6 USER FEEDBACKAll our design decisions discussed previously have been groundedon feedback from domain-experts — with little or no data scienceknowledge — who interacted with earlier versions of our system. Inthis section, we discuss the feedback received from users in morerecent sessions. All users interacted with the system using datathat comes from their area of expertise and that they were alreadyfamiliar with. For instance, one of the users has a Ph.D. in Biologywho is interested in plant genetics and phenotyping and anotheris a manager at a U.S. agency who works with forward operators,soldiers, and analysts who want to analyze their data.
Users were generally satisfied with the system design, and werekeen to start making connections to additional augmented data,wanted to overlay weather, add genetic information, and even ge-olocation. However, we noticed that there is still a gap in the com-munication of machine learning concepts to domain experts. Forinstance, it may not be clear for the users the meaning of evaluationmetrics. What is the difference between R2, mean absolute error, andmean squared error? When should one choose one over the other?
Users also had some difficulty to understand and read the classifi-cationmodel explanations. For example, visual explanations like theRule Matrix [15] summarize complex Bayesian classification rulesderived from a surrogate model in a single visualization. In orderto understand them properly, details had to be explained, includingthe meaning of a rule and statistical concepts such as fidelity andevidence. Although users claimed to understand the visualizationafter verbal explanations from an expert, it was not intuitive forthem at first glance. This suggests that while such visualizationsmay be suitable for data scientists with machine learning knowl-edge, further research is necessary towards visual explanationsgeared towards non-expert audiences.
7 CONCLUSIONIn this paper, we presented Visus, an interactive system that allowsusers to build and curate end-to-end machine learning pipelines.We described the framework and design choices that ground ourstep-by-step interface design and system workflow. We also intro-duced new components that allow users to perform interactive dataaugmentation and visual model selection. Finally, we conducteduser testing sessions with domain experts with little machine learn-ing expertise to evaluate our system. The results suggest that whileusers were satisfied with the overall system design, more researchis necessary towards bridging the communication gap betweenmachine learning concepts and users with little knowledge of ma-chine learning. As future work, we plan to explore new, intuitivevisual explanations that are able to explain how ML models makepredictions to wider audiences. Additionally, there are many openquestions that need to be investigated to design interfaces for dataaugmentation that support users in deciding which datasets arerelevant for their problem.
Acknowledgments. This work was partially supported by theDARPA D3M program, and NSF award CNS-1229185. Any opinions,findings, and conclusions or recommendations expressed in thismaterial are those of the authors and do not necessarily reflect theviews of NSF and DARPA.

REFERENCES[1] Dylan Cashman, Shah Rukh Humayoun, Florian Heimerl, Kendall Park, Subhajit
Das, John Thompson, Bahador Saket, Abigail Mosca, John T. Stasko, Alex Endert,Michael Gleicher, and Remco Chang. 2018. Visual Analytics for Automated ModelDiscovery. CoRR abs/1809.10782 (2018). arXiv:1809.10782 http://arxiv.org/abs/1809.10782
[2] Adriane Chapman, Elena Simperl, Laura Koesten, George Konstantinidis,Luis Daniel Ibáñez-Gonzalez, Emilia Kacprzak, and Paul T. Groth. 2019. Datasetsearch: a survey. CoRR abs/1901.00735 (2019). arXiv:1901.00735 http://arxiv.org/abs/1901.00735
[3] Louis Columbus. [n. d.]. IBM Predicts Demand For Data Scientists WillSoar 28% By 2020. https://www.forbes.com/sites/louiscolumbus/2017/05/13/ibm-predicts-demand-for-data-scientists-will-soar-28-by-2020/.
[4] Iddo Drori, Yamuna Krishnamurthy, Remi Rampin, Raoni Lourenço, Jorge Ono,Kyunghyun Cho, Claudio Silva, and Juliana Freire. 2018. AlphaD3M: MachineLearning Pipeline Synthesis. In Proceedings of Machine Learning Research, ICML2018 AutoML Workshop.
[5] Matthias Feurer, Aaron Klein, Katharina Eggensperger, Jost Springenberg, ManuelBlum, and Frank Hutter. 2015. Efficient and robust automated machine learning.In Advances in neural information processing systems. 2962–2970.
[6] Yolanda Gil, James Honaker, Shikhar Gupta, Yibo Ma, Vito D’Orazio, DanielGarijo, Shruti Gadewar, Qifan Yang, and Neda Jahanshad. 2019. Towards Human-guided Machine Learning. In Proceedings of the 24th International Conference onIntelligent User Interfaces (IUI ’19). ACM, New York, NY, USA, 614–624. https://doi.org/10.1145/3301275.3302324
[7] Yolanda Gil, Ke-Thia Yao, Varun Ratnakar, Daniel Garijo, Greg Ver Steeg, RobBrekelmans, Mayank Kejriwal, Fanghao Luo, and I-De Huang. 2018. P4ML: APhased Performance-Based Pipeline Planner for Automated Machine Learning.In Proceedings of Machine Learning Research, ICML 2018 AutoML Workshop.
[8] Moritz Hardt, Eric Price, , and Nati Srebro. 2016. Equality of Opportu-nity in Supervised Learning. In Advances in Neural Information ProcessingSystems 29, D. D. Lee, M. Sugiyama, U. V. Luxburg, I. Guyon, and R. Gar-nett (Eds.). Curran Associates, Inc., 3315–3323. http://papers.nips.cc/paper/6374-equality-of-opportunity-in-supervised-learning.pdf
[9] T. Hastie, R. Tibshirani, and J.H. Friedman. 2009. The Elements of StatisticalLearning: Data Mining, Inference, and Prediction. Springer. https://books.google.com/books?id=eBSgoAEACAAJ
[10] James Honaker and Vito D’Orazio. 2014. Statistical Modeling by Gesture: A graph-ical, Browser-based Statistical Interface for Data Repositories.. In HT (DoctoralConsortium/Late-breaking Results/Workshops).
[11] Frank Hutter, Lars Kotthoff, and Joaquin Vanschoren. 2019. Automatic machinelearning: methods, systems, challenges. Challenges in Machine Learning (2019).
[12] J J Thomas, K A Cook, Institute Electrical, and Electronics Engineers. 2005.Illuminating the path: The research and development agenda for visual analytics.
[13] Fei-Fei Li and Jia Li. [n. d.]. Cloud AutoML: Making AI accessi-ble to every business. https://www.blog.google/products/google-cloud/cloud-automl-making-ai-accessible-every-business/.
[14] Microsoft. [n. d.]. Microsoft Azure Machine Learning Studio. https://studio.azureml.net/.
[15] Y. Ming, H. Qu, and E. Bertini. 2019. RuleMatrix: Visualizing and UnderstandingClassifiers with Rules. IEEE Transactions on Visualization and Computer Graphics25, 1 (Jan 2019), 342–352. https://doi.org/10.1109/TVCG.2018.2864812
[16] nyc-vision-zero [n. d.]. NYC Vision Zero. https://www1.nyc.gov/site/visionzero/index.page.
[17] Randal S. Olson, Nathan Bartley, Ryan J. Urbanowicz, and Jason H. Moore. 2016.Evaluation of a Tree-based Pipeline Optimization Tool for Automating DataScience. In Proceedings of the Genetic and Evolutionary Computation Conference2016 (GECCO ’16). ACM, New York, NY, USA, 485–492. https://doi.org/10.1145/2908812.2908918
[18] Muhammad Bilal Zafar, Isabel Valera, Manuel Gomez Rodriguez, and Krishna P.Gummadi. 2017. Fairness Beyond Disparate Treatment & Disparate Impact:Learning Classification Without Disparate Mistreatment. In Proceedings of the26th International Conference onWorldWideWeb (WWW ’17). InternationalWorldWide Web Conferences Steering Committee, Republic and Canton of Geneva,Switzerland, 1171–1180. https://doi.org/10.1145/3038912.3052660
[19] Indre Zliobaite. 2015. A survey on measuring indirect discrimination in machinelearning. CoRR abs/1511.00148 (2015). arXiv:1511.00148 http://arxiv.org/abs/1511.00148