visualizing the wave: how pacific northwest...
TRANSCRIPT

VISUALIZING THE WAVE: HOW PACIFIC NORTHWEST COMMUNITIES USE
TSUNAMI HAZARD ASSESSMENT INFORMATION TO DESIGN EVACUATION MAPS FOR PUBLIC EDUCATION
by
Maciej (Matt) J. Kurowski Bachelor of Engineering Science,
University of Western Ontario, 2003
THESIS SUBMITTED IN PARTIAL FULFILLMENT OF THE REQUIREMENTS FOR THE DEGREE OF
MASTER OF SCIENCE
in the Department Geography
© Maciej (Matt) J. Kurowski 2011
SIMON FRASER UNIVERSITY
Spring 2011
All rights reserved. However, in accordance with the Copyright Act of Canada, this work may be reproduced, without authorization, under the conditions for Fair Dealing. Therefore, limited reproduction of this work for the purposes of private
study, research, criticism, review and news reporting is likely to be in accordance with the law, particularly if cited appropriately.
ii
Approval
Name: Maciej (Matt) Kurowski
Degree: Master of Science
Title of Thesis: Visualizing the Wave: How Pacific Northwest Communities Use Tsunami Hazard Assessment Information to Design Evacuation Maps for Public Education
Examining Committee:
Chair: Paul Kingsbury Assistant Professor, Department of Geography
______________________________________
Nick Hedley, Senior Supervisor Associate Professor, Department of Geography
______________________________________
John Clague, Supervisory Committee Member Professor, Department of Earth Sciences
______________________________________
Scott Miles, External Examiner Assistant Professor, Department of Environmental Studies, Huxley College of Environment, Western Washington University
Date Defended/Approved: ______________________________________

Last revision: Spring 09
Declaration of Partial Copyright Licence
The author, whose copyright is declared on the title page of this work, has granted to Simon Fraser University the right to lend this thesis, project or extended essay to users of the Simon Fraser University Library, and to make partial or single copies only for such users or in response to a request from the library of any other university, or other educational institution, on its own behalf or for one of its users.
The author has further granted permission to Simon Fraser University to keep or make a digital copy for use in its circulating collection (currently available to the public at the “Institutional Repository” link of the SFU Library website <www.lib.sfu.ca> at: <http://ir.lib.sfu.ca/handle/1892/112>) and, without changing the content, to translate the thesis/project or extended essays, if technically possible, to any medium or format for the purpose of preservation of the digital work.
The author has further agreed that permission for multiple copying of this work for scholarly purposes may be granted by either the author or the Dean of Graduate Studies.
It is understood that copying or publication of this work for financial gain shall not be allowed without the author’s written permission.
Permission for public performance, or limited permission for private scholarly use, of any multimedia materials forming part of this work, may have been granted by the author. This information may be found on the separately catalogued multimedia material and in the signed Partial Copyright Licence.
While licensing SFU to permit the above uses, the author retains copyright in the thesis, project or extended essays, including the right to change the work for subsequent purposes, including editing and publishing the work in whole or in part, and licensing other parties, as the author may desire.
The original Partial Copyright Licence attesting to these terms, and signed by this author, may be found in the original bound copy of this work, retained in the Simon Fraser University Archive.
Simon Fraser University Library Burnaby, BC, Canada
iii
Abstract
Local officials in the Pacific Northwest of Canada and the United States influence
how tsunami hazard assessments guide production of community evacuation
map brochures. In both countries, cartographic decisions about brochures‟
tsunami hazard representation have been inconsistent and not based on user
evaluations. This thesis uses cartographic abstraction principles to interrogate
the similarities, differences, and limitations of tsunami hazard representations in
38 tsunami brochures for Washington and Oregon communities, and a State-
developed interactive map in Oregon. Based on an assessment of tsunami
hazard in Ucluelet, British Columbia, this research demonstrates how decisions
limit hazard representations and identifies critical tsunami hazard education
information that remains unrepresented. Although the literature reveals a need
for improved public access to information, Pacific Northwest evacuation maps
retain significant information limitations, primarily due the existing „one map‟
tsunami brochure paradigm. This research provides a foundation for future
evaluation and development of socially situated evacuation map characteristics.
Keywords: tsunami education; cartographic abstraction; tsunami hazard
assessment; cartography

iv
Dedication
For my parents, who inspired my interest in geography through our
many shared travels, and taught me the value of adventure and perseverance.

v
Acknowledgements
I would like to express my gratitude for the Geomatics for Informed Decisions SII research funding that helped create a place for this thesis within a larger project – Canada‟s first community-scale tsunami hazard assessment in Ucluelet, British Columbia. Many people in the project contributed information and advice for this thesis. Specifically, I would like to thank Kelli Kryzanowski and Maiclaire Bolton from the British Columbia Provincial Emergency Program, Bill Johnstone and Barbara Lence from the University of British Columbia Civil Engineering Department, Jeff Clark and David Alexander from Spatial Vision Group, and Fletcher Chrisholm from the District of Ucluelet.
I would like to thank my senior supervisor Nick Hedley, who gave me insight into theories within cartography and supported my turn from empirical to theoretical research. Thanks to John Clague, my supervisory committee member, for his encouragement and writing expertise that helped me to better articulate my ideas. I am also grateful to my external examiner, Scott Miles, who provided valuable suggestions to improve this thesis.
From within the Simon Fraser University Geography Department, I am indebted to Dr. Nadine Schuurman, who offered me valuable mentorship about how to structure research papers. For technical GIS issues, I could always count on Justin Song to give me suggestions that always resulted in solutions. Also, many thanks to all my friends I met in the Geography Department. In particular, I wish to thank Dawn Hoogeveen and Annamarie Sasagawa who both took an interest in my research and helped me to refine my thoughts and writing.
Finally, I wish to thank all my wonderful friends and family who made my completion of this thesis possible through their encouragement and support.

vi
Table of Contents
Approval .......................................................................................................................... ii Abstract .......................................................................................................................... iii Dedication ...................................................................................................................... iv Acknowledgements ......................................................................................................... v Table of Contents ........................................................................................................... vi List of Figures................................................................................................................ viii
Chapter 1: Introduction ............................................................................................ 1 1.1 Overview ................................................................................................................. 1 1.2 The research problem ............................................................................................. 4 1.3 Conceptual framework ............................................................................................ 6 1.4 Research objectives ................................................................................................ 7 1.5 Thesis organization ................................................................................................. 8 1.6 References .............................................................................................................. 9
Chapter 2: An Assessment of Educational Tsunami Evacuation Map Designs in Washington and Oregon ................................................... 12
2.1 Abstract ................................................................................................................. 12 2.2 Introduction ........................................................................................................... 13 2.3 Types of tsunami hazard information in evacuation maps of Washington and
Oregon communities ............................................................................................. 15 2.4 Comparing and contrasting tsunami hazard information in six evacuation
map brochures ...................................................................................................... 17 2.4.1 Tsunami hazard zone information .............................................................. 25 2.4.2 Road network information .......................................................................... 26 2.4.3 Assembly area information ........................................................................ 27 2.4.4 Evacuation guidance information ............................................................... 29 2.4.5 Infrastructure information ........................................................................... 31 2.4.6 Terrain information .................................................................................... 31
2.5 A cartographic perspective on tsunami evacuation map design issues ................. 33 2.5.1 Cartographic abstraction ............................................................................ 33 2.5.2 Using cartographic abstraction to summarize the previous
assessment of six maps ............................................................................ 34 2.5.3 Using cartographic abstraction to summarize design differences in
all 38 maps ................................................................................................ 36 2.5.4 Using cartographic abstraction to situate a new evacuation map
design ........................................................................................................ 38 2.6 Discussion ............................................................................................................. 41 2.7 Conclusion ............................................................................................................ 42 2.8 References ............................................................................................................ 43

vii
Chapter 3: The Transformation of Tsunami Hazard Information into an Educational Evacuation Map Strategy: A Case Study in Ucluelet, British Columbia ................................................................... 46
3.1 Abstract ................................................................................................................. 46 3.2 Introduction ........................................................................................................... 47 3.3 The development of a tsunami evacuation map strategy in Ucluelet ..................... 50
3.3.1 Communication of tsunami hazard assessment results in a public forum ......................................................................................................... 52 3.3.1.1 Communicating results of tsunami inundation ............................. 52 3.3.1.2 Communicating loss estimation and evacuation mitigation
strategies .................................................................................... 54 3.3.2 Use of results to develop an educational evacuation map strategy ............ 55
3.3.2.1 Scientifically recommended educational evacuation map strategy....................................................................................... 56
3.3.2.2 Implemented evacuation map ..................................................... 58 3.4 Discussion ............................................................................................................. 61
3.4.1 Educational evacuation map practices and tsunami resilience ................... 63 3.4.2 The need to research supplementary maps ............................................... 65 3.4.3 Current focus in community-developed tsunami evacuation maps ............. 66 3.4.4 Opportunities in the use of tsunami hazard information with
evacuation maps ....................................................................................... 68 3.4.4.1 Using inundation results from stage 2 ......................................... 69 3.4.4.2 Including safe-haven results from stage 4 and decreased
terrain generalization from stage 1.............................................. 71 3.4.4.3 Visualizing evacuation results from stage 4 ................................ 73
3.4.5 Designing and disseminating supplementary map tools ............................. 75 3.5 Conclusion ............................................................................................................ 76 3.6 References ............................................................................................................ 78
Chapter 4: Conclusions ......................................................................................... 81 4.1 Summary............................................................................................................... 81 4.2 Research contributions.......................................................................................... 83 4.3 Future directions ................................................................................................... 85 4.4 References ............................................................................................................ 88

viii
List of Figures
Figure 1-1 – List of community evacuation map brochures in our sample. ..................... 16
Figure 1-2 – Types of tsunami hazard information in all 38 Washington and Oregon brochures, classified according to their primary purpose to provide vulnerability or resilience information. ............................................... 17
Figure 1-3 – Tsunami map for La Push, Washington (map 1 in the subsample of six maps). The Washington Military Department Emergency Management Division and the Quileute Tribal Council were involved in producing the brochure, but their roles are not explicit. ................................. 19
Figure 1-4 – Tsunami map for Westport, Washington (map 2 in the subsample of six maps). The brochure states “This map was produced by the Washington State Department of Natural Resources, Division of Geology and Earth Resources, in cooperation with local emergency management officials.” .................................................................................. 20
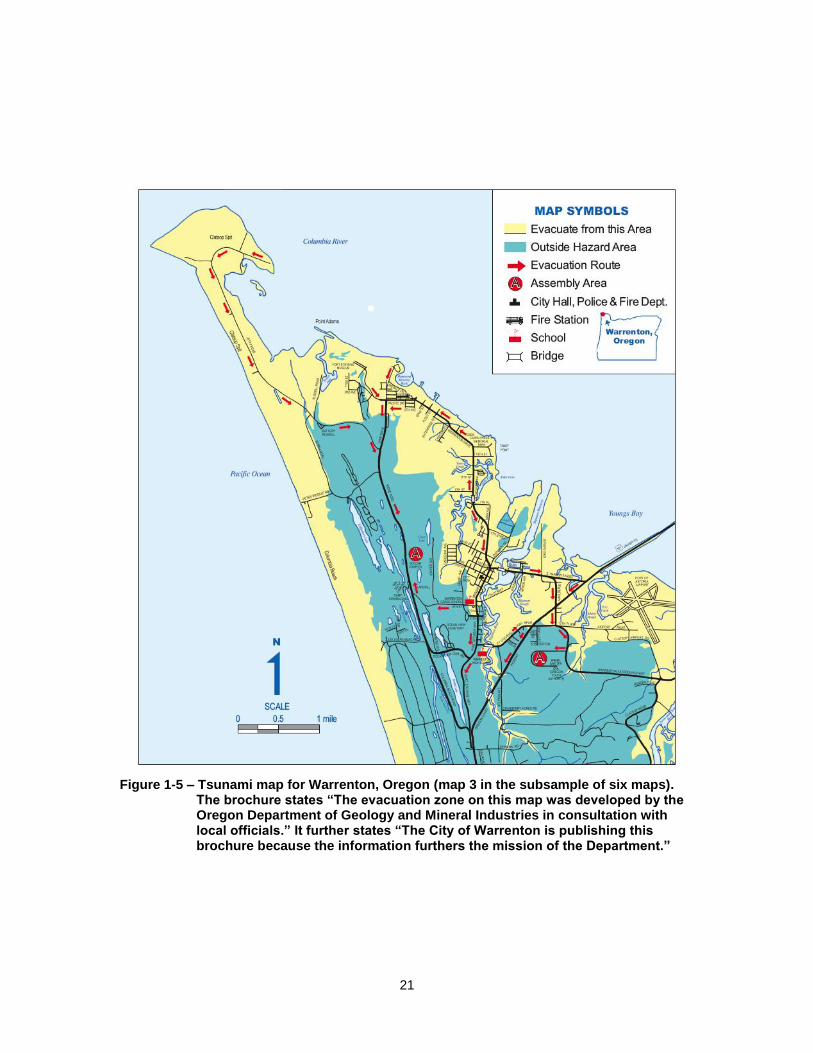
Figure 1-5 – Tsunami map for Warrenton, Oregon (map 3 in the subsample of six maps). The brochure states “The evacuation zone on this map was developed by the Oregon Department of Geology and Mineral Industries in consultation with local officials.” It further states “The City of Warrenton is publishing this brochure because the information furthers the mission of the Department.” ....................................................... 21
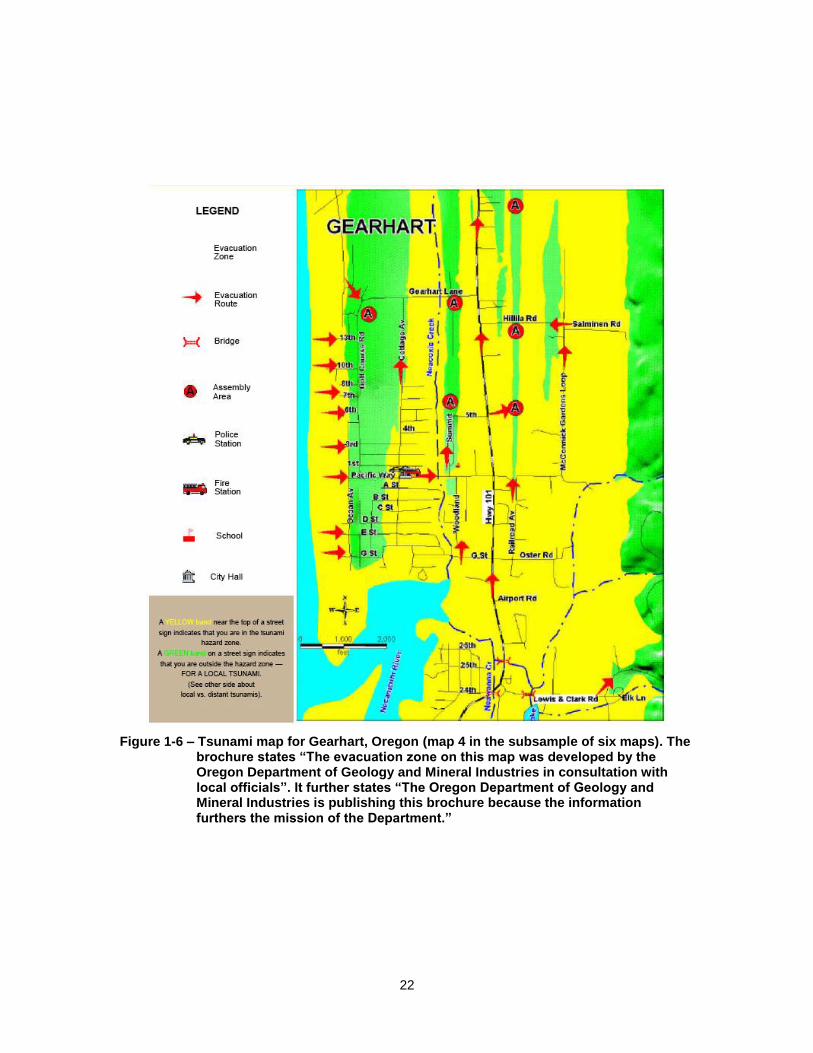
Figure 1-6 – Tsunami map for Gearhart, Oregon (map 4 in the subsample of six maps). The brochure states “The evacuation zone on this map was developed by the Oregon Department of Geology and Mineral Industries in consultation with local officials”. It further states “The Oregon Department of Geology and Mineral Industries is publishing this brochure because the information furthers the mission of the Department.” ................................................................................................. 22
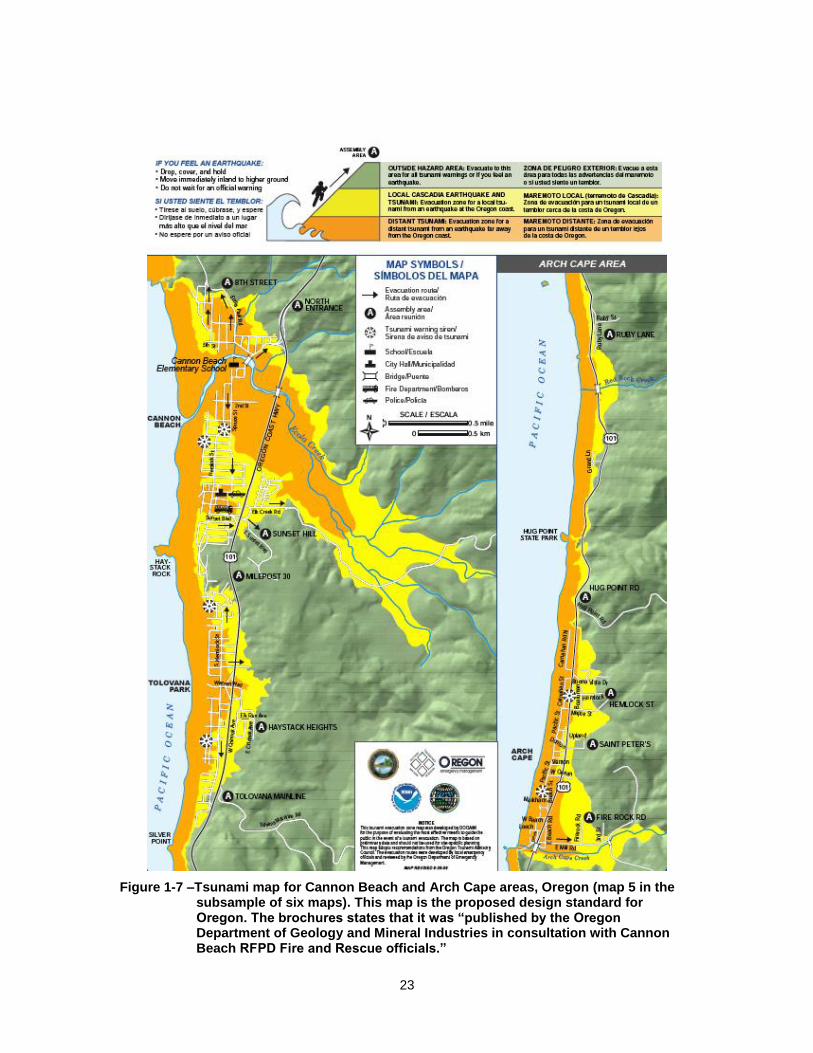
Figure 1-7 –Tsunami map for Cannon Beach and Arch Cape areas, Oregon (map 5 in the subsample of six maps). This map is the proposed design standard for Oregon. The brochures states that it was “published by the Oregon Department of Geology and Mineral Industries in consultation with Cannon Beach RFPD Fire and Rescue officials.” ............... 23
Figure 1-8 –Tsunami map for Newport, Oregon (map 6 in the subsample of six maps). The map of the north section of Newport is on the reverse side of the brochure. The brochure states that is was “published by the Oregon Department of Geology and Mineral Industries with assistance by Shoreland Solutions, Newport, Oregon, and in cooperation with Oregon Emergency Management and Lincoln County.” ................................ 24

ix
Figure 1-9 – Cartographic abstraction in tsunami evacuation map design involves selecting, generalizing, and symbolizing types of information. Cartographic abstraction is repeated for each selected type of information. Cumulatively, the symbolizations in a brochure result in a representation of tsunami hazard. ................................................................. 36
Figure 1-10 – Objective differences in cartographic abstraction of tsunami information types in 38 map brochures in Washington and Oregon. The numbers correspond to the communities listed in Figure 1-1. Black squares indicate the type of generalized and symbolized information contained within the community‟s evacuation map. Information on road networks is not included because generalization differences are unknown and all maps symbolize roads using lines. ..................................... 37
Figure 1-11 – Interface for the new Google Maps tsunami evacuation map in Oregon. This figure shows how the interface appears when a user looks for evacuation information for Cannon Beach. Residents can search for their address to see whether they live in the hazard area. The tsunami hazard zone information is symbolized by a transparent pink area overlay and is labelled “tsunami evacuation zones” in the legend (the legend is not shown). .................................................................. 38
Figure 1-12 – The Google Maps tool provides satellite imagery not found in brochures, but it does not show assembly areas or provide evacuation guidance or terrain information. Its zoom capability eliminates generalization issues caused by fixed scales in brochures. ........................... 40
Figure 2-1 – A frame from TsunamiCLAW animation visualization showing the tsunami simulation 40 minutes after the tsunami is triggered. The tsunami wave height is shown in meters using hypsometric tint. Terrain is shown in green. The majority of Ucluelet‟s residents live along the inside of the peninsula, the centre of the frame. Wave height is shown in meters. ...................................................................................................... 53
Figure 2-2 – Graph of a daytime evacuation simulation results for a summer population scenario, based on research by Johnstone and Lence (2009). The evacuation time window refers to the time period when the tsunami is inundating Ucluelet. ................................................................ 55
Figure 2-3 – Scientist-recommended tsunami map with three assembly areas. This map was produced by Jeff Clark at Spatial Vision Group, using information from the tsunami hazard assessment. The colour scheme is similar to evacuation map brochures in Washington and Oregon. ............. 57
Figure 2-4 – Final published educational tsunami evacuation map for Ucluelet and Tofino. Ucluelet did not adopt all assembly areas recommended by scientists (see Figure 2-3). ....................................................................... 59
Figure 2-5 – Close-up of part of the published map that covers the area between Ucluelet and Tofino. The “tsunami refuge zone” corresponds to a nearby recommended location assembly area “A” in Figure 2-3. ................... 60
Figure 2-6 – The front of the proposed brochure standard in Oregon. This development that took place in Cannon Beach occurred after Ucluelet‟s implementation of an educational evacuation map brochure. ........ 67
x
Figure 2-7 – Visualization showing different arrival times of arrival of a near-field tsunami communicated in an animation in the public forum in Ucluelet. The visualization was made by post-processing results derived from the TsunamiCLAW animation using ArcGIS, Excel, and Python. ................... 70
Figure 2-8 – Locations of safe havens used in evacuation simulations. The detailed elevation in safe areas can help explain why one of the islands of refuge is not recommended as an official assembly area. Including information about terrain in the hazard area may be useful in other communities where high ground is distant and the public must make choices between evacuating to high points of marginally safe areas. ............................................................................................................ 72
Figure 2-9 – Visualization showing walking times in minutes along roads to the nearest high ground, defined by the 20-m contour. Areas above 20 m elevation are green. ArcGIS network analyst extension was used to create the visualization. ................................................................................. 74
Do NOT delete this reminder until just before printing final document. DO delete these paragraphs of instructional text from your final document.
1
Chapter 1: Introduction
1.1 Overview
A tsunami is a series of ocean waves that result in any large, sudden
disturbance of the sea surface (Bernard et al., 2006). Earthquakes that displace
the sea floor are the most common cause of tsunami in the Pacific Ocean
(Bernard et al., 2006). When undersea earthquakes occur near shore, they can
produce a near-source tsunami that inundates proximal coastal areas on the
order of minutes (Darienzo et al., 2005). Great undersea earthquakes can cause
significantly larger near-source tsunami that also propagate to the coasts of other
regions to produce distant (tele-) tsunami on the order of hours (Darienzo et al.,
2005).
Many Pacific Northwest coastal communities in the Province of British
Columbia (BC) and the Pacific states of Washington and Oregon in the United
States (US) are vulnerable to tele-tsunami, and to near-source tsunami
earthquakes at the Cascadia Subduction Zone (CSZ) (Clague et al., 2000). To
reduce tsunami vulnerability of these communities, there is a strong emphasis on
tsunami mitigation in BC (British Columbia Provincial Emergency Program, 2001)
and in all United States (US) Pacific states (Dengler, 2005; Bernard, 2005).
Mitigation, in its broadest sense, refers to the implementation of actions well in
advance of hazard events that aim to reduce potential disaster losses (Newton,
1997; Haque and Burton, 2005).
2
Public education is an important mitigation strategy for reducing loss of life
in tele-tsunami and near-source tsunami (Dengler, 2005). The West
Coast/Alaska Tsunami Warning Centre issues warnings of detected tele-tsunami
to BC, Washington, and Oregon (Darienzo et al., 2005). Once local governments
receive and issue a tele-tsunami warning, the public must have the knowledge to
react accordingly and, in the absence of local media communication, must be
able to take action upon recognizing signs of an impeding tele-tsunami
(Anderson and Gow, 2004). A CSZ earthquake that triggers a near-source
tsunami poses a significantly higher risk because the earthquake may largely
destroy the infrastructures of communities before the tsunami strikes (British
Columbia Provincial Emergency Program, 2001). After the ground stops shaking,
the public must immediately evacuate to safe areas with no guidance from
authorities.
Tsunami evacuation maps are one of several types of community-specific
tsunami education tools. Examples of other tools include evacuation signage on
roads, education programs in schools, and community tsunami evacuation drills.
In Washington and Oregon, educational evacuation maps are designed based on
tsunami hazard assessments and are the result of state and local officials
working together in a community to interpret state-developed community-scale
tsunami inundation maps (Gonzalez et al., 2001, 2005). This process results in
an evacuation map brochure that is made available to the public in print and
online. Evacuation map production in BC is a much more recent development
compared to Washington and Oregon. BC organized its first tsunami hazard

3
assessment in Ucluelet, on the west coast of Vancouver Island, in response to
increased tsunami awareness caused by the massive 2004 tsunami in the Indian
Ocean.
The Ucluelet pilot project brought together local government officials and
tsunami modelling experts from the private and academic sectors. Project goals
included modelling the effects of a CSZ tsunami in Ucluelet in order to assess
community vulnerability and mitigation measures, and to publish an educational
evacuation map. BC‟s close collaboration with Pacific states in tsunami mitigation
efforts (British Columbia Provincial Emergency Program, 2001) provided a
template for Ucluelet‟s tsunami hazard assessment and educational evacuation
map strategy. Ucluelet‟s resulting educational evacuation map strategy was
influenced by practices in communities of its closest neighbouring States of
Washington and Oregon. The practices of Washington and Oregon influencing
those in Ucluelet reflected existing guidelines in the US that encourage
communities to adopt neighbouring tsunami education tools (Dengler, 2005;
Jonientz-Trisler et al., 2005).
This thesis resulted from joining the Ucluelet project to research
cartographic communication of the tsunami hazard assessment results. The
development of an educational evacuation map in Ucluelet was already in
progress – a project goal that most directly involved tsunami scientists and local
government emergency management officials. A literature review conducted as
part of this thesis revealed that, although numerous scientific approaches to
tsunami hazard assessments have been published, no research has explicitly

4
considered how community stakeholders responsible for evacuation map design
utilize available tsunami hazard information. This thesis addresses this existing
gap in research through a focus on practices in BC, Washington, and Oregon.
1.2 The research problem
Communities in BC, Washington, and Oregon are similar in that they
disseminate a single tsunami evacuation map brochure based on available
scientific tsunami hazard assessment information. However, these brochures
have been developed locally, resulting in mapmakers using and communicating
hazard information differently. For example, some community evacuation maps
include information about terrain, whereas others do not; some include two types
of tsunami hazard zones, others include only one.
The efficacy of particular evacuation map designs remains unknown.
Evacuation maps have, however, been evaluated as part of communities‟
tsunami education toolsets. Studies in Washington (Johnston et al., 2002) and
Oregon (Karel, 1998) used survey methodologies to measure the effectiveness
of communities‟ public educational tools. These researchers found that tools
were able to influence tsunami awareness, but failed to create citizens with
adequate perceptions of the tsunami hazard.
Efforts to improve tsunami mitigation in the US are overseen by the
National Hazard Tsunami Mitigation Program (NTHMP) (Bernard, 2005;
Gonzalez et al., 2005). The NTHMP‟s mitigation efforts are encouraging
communities to view mitigation in terms of resilience through a set of broad
5
guidelines that, in part, encourage communities to adopt existing educational
tools in neighbouring communities (Dengler, 2005; Jonientz-Trisler et al., 2005).
The NTHMP summarizes a tsunami-resilient community as one that:
…may suffer some inevitable damage, but will have planned, exercised, and educated its citizens and its leaders in ways to save lives, protected as much property as possible, tried to ensure safe locations for critical functions the community needs, and will use lessons from a tsunami event suffered by their community or other communities to improve their level of resilience for future events. (Jonientz-Trisler et al., 2005)
Although focus on tsunami resilience provides a guiding vision, it does not
offer any specific advice about how to improve educational evacuation maps.
Currently, the leading evacuation map developments in the Pacific Northwest are
in Oregon. Oregon has proposed a standard evacuation map design for its
communities and has also recently introduced a State-wide Google Maps
evacuation map tool. These efforts may be helpful in education, but a significant
gap remains between scientifically known and publicly accessible tsunami hazard
information. Some recent pilot studies in Indonesia (Goto et al., 2010) and
Australia (Dall‟Osso and Dominey-Howes, 2010) indicate that providing the
public maps with detailed tsunami hazard information is beneficial to public
education. The information that these two studies provided was considerably
more detailed than information found in the evacuation maps of BC, Washington,
and Oregon.
Enhancing tsunami hazard information in evacuation map tools may be an
important factor in increasing resilience in communities. The lack of progress by
governments on this issue reflects challenges common in all tsunami mitigation,
6
and more broadly, all natural hazards mitigation. As many social scientists have
stated, there exist competing social, political, and economic interests that
undermine implementation of successful natural hazard mitigation (Wolensky and
Wolensky, 1990; Newton, 1997; Quarantelli, 1997; Morrow, 1999; White et al.,
2001; Pearce, 2003; Somers and Svara, 2009). For natural hazard mitigation to
improve, greater acknowledgement of how natural hazard vulnerabilities result
from social choices is required – especially at the community planning level
(Morrow, 1999; Pearce, 2003; Haque and Burton, 2005).
Determining how evacuation maps can better contribute to tsunami
mitigation requires a more organized effort by many stakeholders at a variety of
scales included scientists, policy makers, regional governments, local
governments, and the public. An essential first step is the assessment of how
officials in communities currently use available information to design evacuation
maps. A productive approach to this problem must relate the goals of community-
scale tsunami education to evacuation mapping practices in a way that is useful
for the stakeholders and that supports future development.
1.3 Conceptual framework
This thesis uses cartographic abstraction principles to describe how
community evacuation mapping practices in BC, Washington, and Oregon
contribute to the complex relationship between tsunami science and the public‟s
ability to perceive tsunami science.
7
The principles of cartographic abstraction describe the process of how
mapmakers select, generalize, and symbolize information in order to define
representation (Robinson et al., 1995). Selection refers to information that is
included in order to contribute to the purpose of the map. Generalization refers to
the preparation of the selected information for symbolization through operations
that eliminate unnecessary details while considering limitations of the quality of
underlying data, map scale, and medium. Symbolization refers to the use of
cartographic variables to visually represent generalized information (Robinson et
al., 1995).
Abstraction is an intrinsic concept of maps and to the Geographic
Information Systems (GIS) that produce them (Schuurman, 2006). Principles of
cartographic abstraction have grown in sophistication since their first expressions
in the early 20th century – more recently for the intent of structuring GIS
functions (McMaster and Shea, 1992). For the purposes of describing evacuation
map practices, it is appropriate to apply a simple version of a recent cartographic
abstraction articulation in the 6th edition of Elements of Cartography (Robinson
et al., 1995) (the first edition being published in 1953). The use of only basic
cartographic abstraction principles can still capture the essence of how
communities use GIS to produce public evacuation maps, while maintaining
readability for those who are not cartography experts.
1.4 Research objectives
The goal of this research is to express how social decisions affect tsunami
hazard information in evacuation maps. The research focuses on how BC could
8
improve recent approaches to evacuation maps by first describing evacuation
map design practices and developments in the neighbouring states of
Washington and Oregon, then describing an evacuation map production process
in Ucluelet, BC.
The goal of this research is achieved through two research components:
1) Application of cartographic abstraction principles to:
a) compare and contrast a sample of 38 Washington and Oregon tsunami evacuation map, including a new proposed design standard in Oregon, in order to reveal their similarities, differences, and limitations in tsunami hazard information.
b) assess the design of tsunami hazard information in the new state-developed Google Maps tsunami evacuation map in Oregon.
2) Using a case study of the tsunami hazard assessment in Ucluelet to:
a) describe how scientists and local government officials utilized tsunami hazard assessment information to develop a tsunami evacuation map through the application of cartographic abstraction principles.
b) illustrate how non-utilized assessment information may drive the design of additional, more advanced tsunami evacuation map tools for interested citizens.
1.5 Thesis organization
This thesis has two main chapters written as stand-alone papers for
journal publication. Both papers introduce cartographic concepts into tsunami
science literature in order to reach the tsunami scientists and policy makers who
will oversee future evacuation map developments. The two papers, Chapters 2
and 3, address, respectively, the above first and second components of the
research.
Chapter 2 assesses current evacuation map practices in Washington and
Oregon. The purposes of this chapter are to increase awareness about how
9
social decisions have created differences in information content of evacuation
map brochures, and to respond to the lack of attention about how social
decisions are affecting current educational evacuation map developments that
are taking place in Oregon.
Chapter 3 describes an evacuation map development process in Ucluelet,
BC. The purposes of this chapter are to point out the potential of currently
unused scientific and citizen knowledge in BC, Washington, and Oregon, and to
propose community-developed evacuation map strategies that respond to a need
for increased public access to information that both empirical evidence and
resilience goals support.
Chapter 4 is the conclusion and identifies the significance of the research
in Chapters 2 and 3 and further identifies future needs of evacuation map
developments in BC, Washington, and Oregon.
1.6 References
Anderson P., and Gow G.A. (2004). Tsunamis and coastal communities in British Columbia: an assessment of the B.C. tsunami warning system and related risk reduction practices. Retrieved from Government of Canada Publications website: http://publications.gc.ca/site/eng/267201/ publication.html
Bernard E. (2005). The U.S. National Tsunami Hazard Mitigation Program – a successful State–Federal partnership. Natural Hazards, 35, 5–24.
Bernard, E.N., Mofjeld, H.O., Titov, V.V., Synolakis, C.E., and Gonzalez, F.I. (2006). Tsunami: scientific frontiers, mitigation, forecasting, and policy implications. Phil. Trans. Roy. Soc. A, 364(1845), 1989–2007.

10
British Columbia Provincial Emergency Program (2001). British Columbia tsunami warning and alerting plan. Retrieved from Ministry of Public Safety and Solicitor General website: http://209.87.31.75/hazard_plans/ tsunami2001/Tsunami_Warning_and_Alerting_Plan-2001.pdf
Clague, J. J., Bobrowsky, P. T., and Hutchinson, I. (2000). A review of geological records of large tsunamis at Vancouver Island, British Columbia, and implications for hazard. Quaternary Science Reviews, 19, 849–863.
Darienzo, M., Aray A.L., Crawford G.L., Gibbs, D., Whistmore, P.M., Wilde T., and Yanagi B.S. (2005). Local tsunami warning in the Pacific coastal United States. Natural Hazards, 35,111–119.
Dall‟Osso, F., and Dominey-Howes, D. (2010). Public assessment of the usefulness of “draft” tsunami evacuation maps from Sydney, Australia – implications for the establishment of formal evacuation plans. Natural Hazards and Earth Systems Science,10,1739–1750. doi:10.5194/nhess-10-1739-2010.
Dengler L. (2005). The role of education in the National Tsunami Hazard Mitigation Program. Natural Hazards, 35, 141–153.
Gonzalez F.I., Titov V.V., Mofjeld H.O., Venturato A.J., and Newman J.C. (2001).The NTHMP inundation mapping program. In Proceedings of the International Tsunami Symposium 2001. National Tsunami Hazard Mapping Program Review Session, R-2, Seattle, WA, 7–10 August 2001, 29–54.
Gonzalez F.I., Titov V.V., Mofjeld H.O., Venturato A.J., Simmons R.S., Hansen R., Combellick R., Eisner R.K., Hoirup D.F., Yanagi B.S., Yong S., Darienzo M., Priest G.R., Crawford G.L., and Walsh T.J. (2005). Progress in NTHMP hazard assessment. Natural Hazards, 35, 89–110.
Goto Y., Ogawa Y., and Komura T. (2010). Tsunami disaster reduction education using town watching and moving tsunami evacuation animation – trial in Banda Aceh. Journal of Earthquake and Tsunami, 4(2), 115-126.
Haque, C. E., and Burton, I. (2005). Adaptation options strategies for hazards and vulnerability mitigation. An international perspective, Mitigation and Adaption Strategies for Global Change, 10(3), 335–353.
Johnson D., Paton D., Houghton B., Becker J., and Crumbie G. (2002). Results of the August-September 2001 Washington State tsunami survey. New Zealand Institute of Geological and Nuclear Sciences, Science Report 2002/17, Lower Hutt, New Zealand.
Jonientz-Trisler C., Simmons R.S., Yanag B.S., Crawford G.L., Darienzo M., Eisner R.K., Petty E., and Priest G.R. (2005). Planning for tsunami-resilient communities. Natural Hazards, 35, 121–139.
Karel A. (1998). Oregonians need more information about tsunamis to save lives. Oregon Geology, 60(3), 56.
11
McMaster R.B., and Shea K.S. (1992). Generalization in digital cartography. Washington, DC: Association of American Geographers.
Morrow B.H. (1999). Identifying and mapping community vulnerability. Disasters, 23(1), 1–18.
Newton J. (1997). Federal legislation for disaster mitigation: A comparative assessment between Canada and the United States. Natural Hazards, 16, 219–241.
Pearce L. (2003). Disaster management and community planning, and public participation: How to achieve sustainable hazard mitigation. Natural Hazards, 28, 211–228.
Quarantelli, E.L. (1997). Problematic aspects of the information/communication revolution for disaster planning and research: Ten non-technical issues and questions. Disaster Prevention and Management Journal, 6(2), 94–116.
Robinson A.H., Morrison J.L., Muehrcke P.C., Kimerling A.J., and Guptill S.C. (1995). Elements of cartography (6th edition). New York: Wiley.
Schuurman N. (2006). Why formalization matters: critical GIS and ontology research. Annals of the Association of American Geographers, 96(4), 726–739.
Somers S., and Svara J.H. (2009). Assessing and managing environmental risk: Connecting local government management with emergency management. Public Administration Review, 69(2), 181–193.
White G.F., Kates R.W., and Burton I. (2001). Knowing better and losing even more: The use of knowledge in hazards management. Environmental Hazards, 3, 81–92.
Wolensky R.P., and Wolensky K.C. (1990). Local government‟s problem with disaster management: a literature review and structural analysis. Policy Studies Review, 9(4), 703–725.
12
Chapter 2: An Assessment of Educational Tsunami Evacuation Map Designs in Washington and Oregon
1
2.1 Abstract
Educational tsunami evacuation map brochures in Washington and Oregon have
been developed locally, resulting in significant differences between the types of
tsunami hazard information they include. This paper identifies six tsunami hazard
information types present in 38 brochures in Washington and Oregon: (1)
tsunami hazard zone, (2) road network, (3) assembly areas, (4) evacuation
guidance, (5) infrastructure, and (6) terrain. It compares and contrasts these
information types in the maps and text of six of the brochures, including a
proposed design standard in Oregon. Design differences of all 38 brochure maps
are then organized using principles of cartographic abstraction, which describe
mapmaker decisions about selection, generalization, and symbolization of
information. We further use this framework to situate the information content of a
new interactive Google Maps tool in Oregon. Our assessment identifies
limitations of current tsunami hazard information that may be relevant to
improving tsunami education. In theory, more advanced evacuation map tools
can play an important role in reducing the limitations of tsunami hazard
information relevant to the public. The new Google Maps tool addresses few of
these limitations. Recognizing how map-making decisions define the underlying
1 A version of this Chapter has been accepted in Natural Hazards under the co-authorship of
Nick Hedley and John Clague.
13
information content of evacuation maps can facilitate much needed future
evaluations and developments in evacuation map design.
2.2 Introduction
The National Tsunami Hazard Mitigation Program (NTHMP) is a United
States initiative led by a steering committee with representatives from the
National Science Foundation, three federal agencies, and five Pacific states
(Bernard, 2005). Its principal aim is to mitigate the tsunami hazard to all
vulnerable US communities (Bernard, 2005; Gonzalez et al., 2005). The NTHMP
has three components: warning guidance, hazard assessment, and mitigation
(Jonientz-Trisler et al., 2005). The last two components, hazard assessment and
mitigation, play essential roles in the NTHMP‟s efforts to produce evacuation
maps for tsunami education.
The NTHMP‟s hazard assessment component produces scientific
community-scale inundation maps that are used to develop evacuation maps
(Gonzalez et al., 2001, 2005). Evacuation maps then become important
mitigation tools for both planning and public education (Gonzales et al., 2001).
These applications of evacuation maps are facilitated by the NTHMP‟s mitigation
component, which oversees the translation of tsunami science into planning and
education products (Jonientz-Trisler et al., 2005).
All stages in the development of evacuation maps involve significant
interpretation of tsunami science. The interpretation involved in using inundation
maps to guide the development of evacuation maps has received some
14
commentary (Eisner et al., 2001; Gonzalez et al., 2001, 2005, Priest et al., 2001;
Chowdhury et al. 2005; Dengler 2005); however, to our knowledge, no research
has considered cartographic design choices that are necessary to produce
educational evacuation maps. This paper situates cartographic design issues by
focusing on educational tsunami evacuation map designs in Washington and
Oregon.
State agencies in both Washington and Oregon are the leads in NTHMP
evacuation mapping efforts, which are based on inundation maps of a credible
worst-case, local, Cascadia Subduction Zone tsunami (Gonzalez et al., 2005).
These agencies and local officials use state-developed inundation maps to
identify evacuation routes (Gonzalez et al. 2001, 2005). In many instances,
states have hosted community meeting to present developed evacuation plans
(Dengler, 2005). At these meetings, members of communities have had
opportunities to ask tsunami experts about inundation modelling and to influence
decisions about evacuation routes (Dengler, 2005). State, county, and local
governments then work together to produce an educational tsunami evacuation
map brochure (Gonzalez et al., 2001, 2005). A final brochure is published and
made available in print and online. The brochure includes an evacuation map
and accompanying explanatory text, as well as valuable tsunami information on
the back of the brochure. Local community involvement is critical to the success
of evacuation maps (Gonzalez et al., 2001), but the involvement and input of
local officials in the production of evacuation map brochures has led to
inconsistencies in evacuation map designs between communities. Cartographic
15
design choices made in designing and producing evacuation maps include style,
for example layout and colour choices, and, more fundamentally, information
content.
This paper compares and contrasts the design of cartographic information
in Washington and Oregon evacuation maps. We first identify six types of
tsunami hazard information that appear in a sample of 38 evacuation map
brochures (Fig. 1-1). We then assess the design of each information type by
comparing and contrasting the maps and texts of a subsample of six
representative brochures. One of these six brochures is a proposed design
standard for Oregon coastal communities. Finally, we use basic cartographic
principles to summarize (1) information differences between the maps in the six
brochures, (2) information differences between the maps of all 38 brochures, and
(3) information limitations in the map brochures compared with those of a new
Oregon-wide interactive educational evacuation map tool.
2.3 Types of tsunami hazard information in evacuation maps of Washington and Oregon communities
Our assessment is based on 16 Washington and 22 Oregon map
brochures available at http://www.dnr.wa.gov/ResearchScience/Topics/
GeologyPublicationsLibrary/Pages/tsuevac.aspx and http://www.
oregongeology.org/sub/earthquakes/Coastal/Tsubrochures.htm.

16
Figure 1-1 – List of community evacuation map brochures in our sample.
17
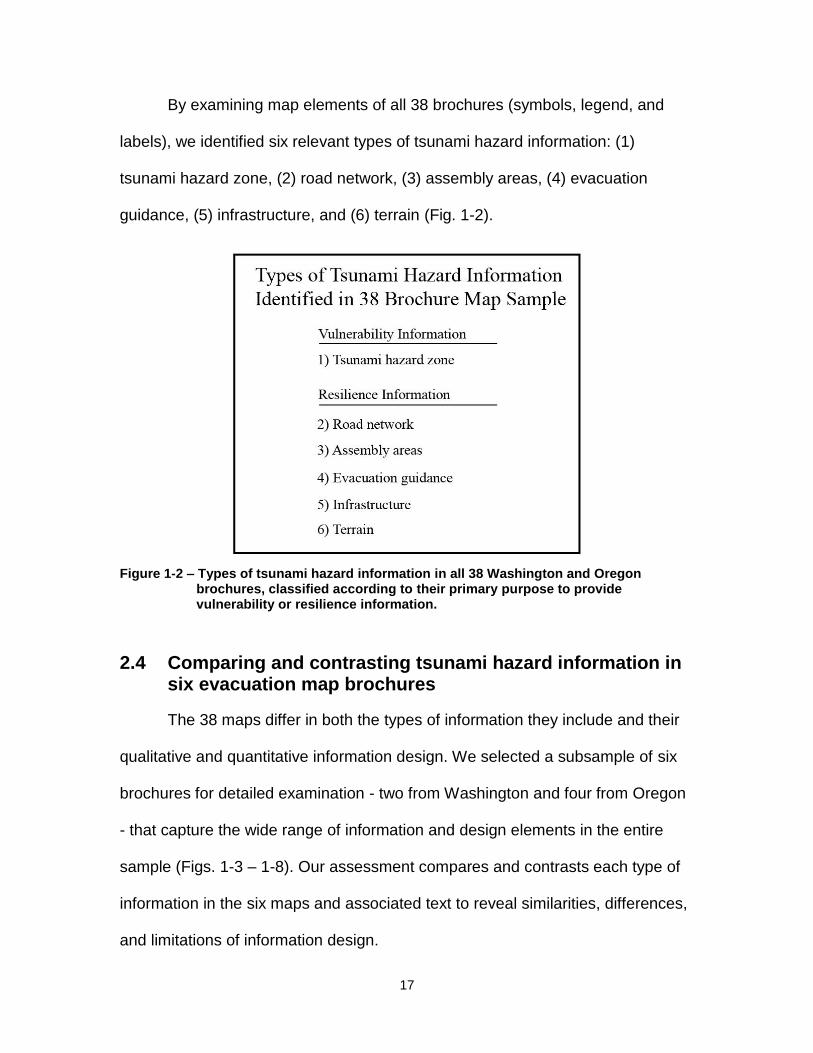
By examining map elements of all 38 brochures (symbols, legend, and
labels), we identified six relevant types of tsunami hazard information: (1)
tsunami hazard zone, (2) road network, (3) assembly areas, (4) evacuation
guidance, (5) infrastructure, and (6) terrain (Fig. 1-2).
Figure 1-2 – Types of tsunami hazard information in all 38 Washington and Oregon brochures, classified according to their primary purpose to provide vulnerability or resilience information.
2.4 Comparing and contrasting tsunami hazard information in six evacuation map brochures
The 38 maps differ in both the types of information they include and their
qualitative and quantitative information design. We selected a subsample of six
brochures for detailed examination - two from Washington and four from Oregon
- that capture the wide range of information and design elements in the entire
sample (Figs. 1-3 – 1-8). Our assessment compares and contrasts each type of
information in the six maps and associated text to reveal similarities, differences,
and limitations of information design.

18
Our assessment has four main limitations. First, we only consider the text
in the brochures that is directly relevant to information types. Second, we do not
consider information limitations caused by scale, because this issue is inherent to
any map brochure. Third, we do not focus on differences in cartographic style
unless they significantly affect interpretation of information. Fourth, we do not
reference other external sources, such as inundation maps that are not designed
for tsunami education or tsunami science publications. This last limitation means
that we are assessing the information in the same way as a capable map user
who is able to read accompanying brochure text but is unfamiliar with the
community.
Our six map subsample includes brochure maps for the following
communities, from north to south: La Push, Washington (Washington Military
Department Emergency Management Division, 2004); Westport, Washington
(Washington State Department of Natural Resources, Division of Geology and
Earth Resources, 2007); Warrenton, Oregon (The City of Warrington, 2005);
Gearhart, Oregon (Oregon Department of Geology and Mineral Industries,
2005a); Cannon Beach, Oregon (Oregon Department of Geology and Mineral
Industries, 2008); and Newport, Oregon (Oregon Department of Geology and
Mineral Industries, 2005b). Hereafter, we reference the six maps in this
geographical order. Map 5 (Cannon Beach) is especially noteworthy because it
has been recently proposed as a design standard for Oregon (Western States
Seismic Policy Council, 2008).

19
Figure 1-3 – Tsunami map for La Push, Washington (map 1 in the subsample of six maps). The Washington Military Department Emergency Management Division and the Quileute Tribal Council were involved in producing the brochure, but their roles are not explicit.

20
Figure 1-4 – Tsunami map for Westport, Washington (map 2 in the subsample of six maps). The brochure states “This map was produced by the Washington State Department of Natural Resources, Division of Geology and Earth Resources, in cooperation with local emergency management officials.”
21
Figure 1-5 – Tsunami map for Warrenton, Oregon (map 3 in the subsample of six maps). The brochure states “The evacuation zone on this map was developed by the Oregon Department of Geology and Mineral Industries in consultation with local officials.” It further states “The City of Warrenton is publishing this brochure because the information furthers the mission of the Department.”
22
Figure 1-6 – Tsunami map for Gearhart, Oregon (map 4 in the subsample of six maps). The brochure states “The evacuation zone on this map was developed by the Oregon Department of Geology and Mineral Industries in consultation with local officials”. It further states “The Oregon Department of Geology and Mineral Industries is publishing this brochure because the information furthers the mission of the Department.”
23
Figure 1-7 –Tsunami map for Cannon Beach and Arch Cape areas, Oregon (map 5 in the subsample of six maps). This map is the proposed design standard for Oregon. The brochures states that it was “published by the Oregon Department of Geology and Mineral Industries in consultation with Cannon Beach RFPD Fire and Rescue officials.”

24
Figure 1-8 –Tsunami map for Newport, Oregon (map 6 in the subsample of six maps). The map of the north section of Newport is on the reverse side of the brochure. The brochure states that is was “published by the Oregon Department of Geology and Mineral Industries with assistance by Shoreland Solutions, Newport, Oregon, and in cooperation with Oregon Emergency Management and Lincoln County.”
25
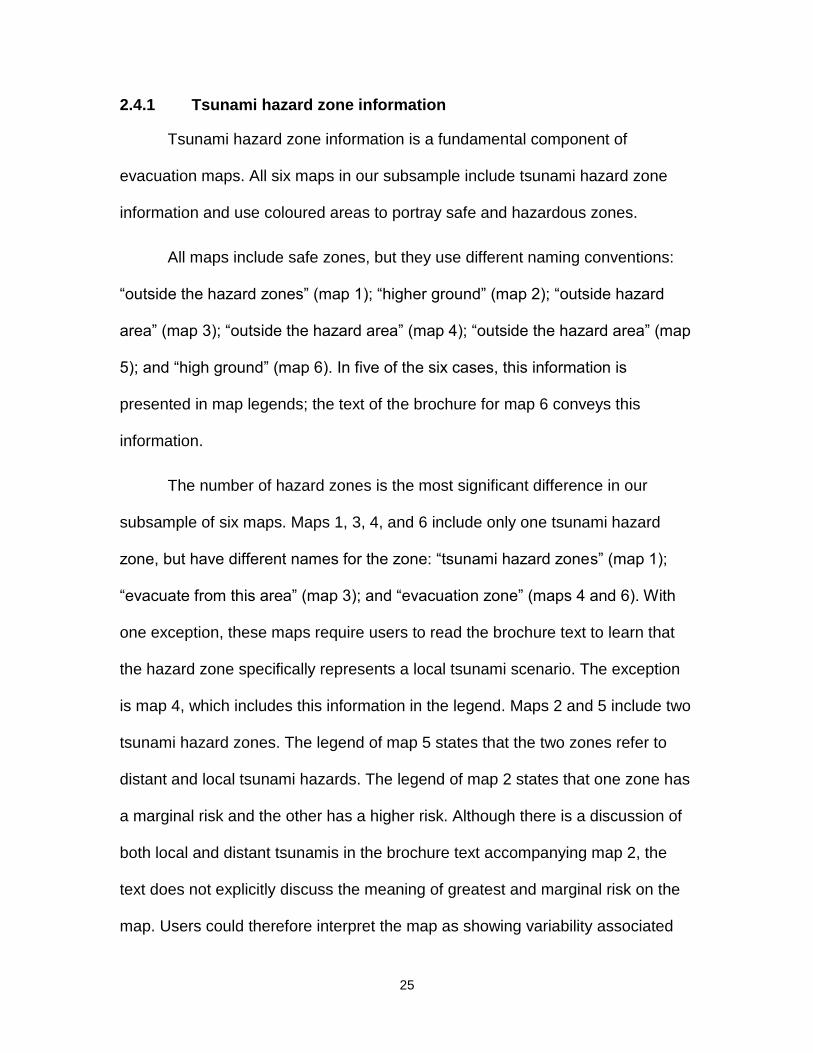
2.4.1 Tsunami hazard zone information
Tsunami hazard zone information is a fundamental component of
evacuation maps. All six maps in our subsample include tsunami hazard zone
information and use coloured areas to portray safe and hazardous zones.
All maps include safe zones, but they use different naming conventions:
“outside the hazard zones” (map 1); “higher ground” (map 2); “outside hazard
area” (map 3); “outside the hazard area” (map 4); “outside the hazard area” (map
5); and “high ground” (map 6). In five of the six cases, this information is
presented in map legends; the text of the brochure for map 6 conveys this
information.
The number of hazard zones is the most significant difference in our
subsample of six maps. Maps 1, 3, 4, and 6 include only one tsunami hazard
zone, but have different names for the zone: “tsunami hazard zones” (map 1);
“evacuate from this area” (map 3); and “evacuation zone” (maps 4 and 6). With
one exception, these maps require users to read the brochure text to learn that
the hazard zone specifically represents a local tsunami scenario. The exception
is map 4, which includes this information in the legend. Maps 2 and 5 include two
tsunami hazard zones. The legend of map 5 states that the two zones refer to
distant and local tsunami hazards. The legend of map 2 states that one zone has
a marginal risk and the other has a higher risk. Although there is a discussion of
both local and distant tsunamis in the brochure text accompanying map 2, the
text does not explicitly discuss the meaning of greatest and marginal risk on the
map. Users could therefore interpret the map as showing variability associated
26
with risk of local tsunami or possibly the difference between the risk of local and
distant tsunamis. None of the brochures states the method used to derive the
tsunami hazard zone boundaries.
2.4.2 Road network information
Road network information is an important element of evacuation maps.
Intersections of roads and hazard areas are sites of vulnerability. Road networks
also provide critical resilience information for evacuation planning. All six maps
show road network information using lines and also name some roads.
The number of labelled roads differs among the maps. Maps 1 and 2 have
two and four named roads, respectively, whereas map 3 labels over 60 roads.
The scale of the map limits the number of roads than can be labelled and how
much road network information can be depicted, but the producers of map 2
clearly chose to label only a few roads. Maps 1 and 2 could also have provided
more road detail if an enlarged inset map had been included in available space
where there is no useful information.
It is not possible to draw conclusions about the limitations of road network
information based on our evacuation map assessment. Choice of scale may
necessitate selective labelling of roads and the exclusion of smaller roads or
paths that may be important in evacuation. Map users familiar with the
community‟s geography may be able to identify omitted roads, but others will be
unaware of those roads.

27
2.4.3 Assembly area information
Assembly area information depends on tsunami hazard zone information,
road networks, availability of assembly areas, and decisions made during the
tsunami assessment stage of developing evacuation maps. Circles with the letter
“A” are used to visualize assembly areas where that information is included.
All maps, except 6, include assembly area locations, but labelling differs
among the maps. Map 5 labels each assembly area by its road location or place
name; maps 1 and 4 do not explicitly name the assembly areas, although they do
label roads close to them; map 3 labels assembly areas as a structure and
another as a soccer field complex; and map 2 labels a school, a community
centre, and a road.
The amount of information about assembly areas in the brochure text
differs significantly. The text of maps 3, 4, and 5 does not provide significant
additional information, whereas the text of brochures 1 and 2 state that if
residents do not live close to an assembly area, they should establish their own
plan for assembling and make sure that the plan takes into account evacuation
routes, the number of people expected to arrive at the assembly point, and
private property access rights. The text of map 2 further states that its outdoor
assembly areas will have emergency services.
All maps only implicitly state the significance of assembly areas. The text
in all brochures advises that the public should evacuate inland and to high
ground in case of an earthquake, with minor differences in terminology, but does
not explicitly state that assembly areas are most useful for distant tsunamis.

28
Other than map 2, which states that one of the assembly areas will have
emergency services, no maps communicate the advantages of evacuating to an
official assembly area.
Locations of assembly areas differ as a function of community
geographies. Maps 2, 3, 4, and 6 show temporary islands of safety that will exist
during a tsunami; in the case of map 2, the islands apply to both “greatest risk”
hazard areas and “marginal risk” areas. Maps 2, 3, and 6 do not include
assembly areas on these islands, whereas map 4 includes assembly areas on
some, but not all, of the islands.
Much other potentially useful assembly area information, which is unique
to community geographies, is not provided. In the case of map 2, for example,
the user has a choice of evacuating to the high school, which is the official
assembly in the marginal risk zone, or to the unofficial small island of safety on
the peninsula. Which is the better option? Is the island of safety not included as
an official assembly area due to issues of land ownership, as the accompanying
text of brochure broadly discusses, the number of people that the island can
accommodate, or is the high school a safer assembly area with its additional
building elevation? Similarly, are some islands of safety on map 3 not identified
as official assembly areas because they provide little additional protection in
terms of elevation, because of private land access issues, because of the
capacity of the islands, or some combination of these issues? Why are some
roads that lead to safety on map 5 not identified as assembly areas, whereas
others are? What was the rationale for the choice of the number of assembly

29
areas? Was this decision arbitrary or was there a good reason to preclude some
locations for a distant or local evacuation event?
2.4.4 Evacuation guidance information
Evacuation guidance is intended to provide users with information that will
aid their decisions about the best route to take to higher ground. It depends on
the location and extent of the tsunami hazard zone, road network information,
and decisions made about assembly areas during the tsunami assessment stage
of evacuation map development. Unlike other types of information, evacuation
guidance visualizes an action rather than a physical location.
With one exception, the text of all brochures advises that people should
evacuate on foot if possible in the event of an earthquake. The exception is the
text accompanying map 1, which recommends evacuation on foot if necessary.
The text of brochures 3, 4, and 5 explicitly advise evacuation on foot for both
local and distant tsunamis. The other brochure texts do not recommend a
particular evacuation method for a distant tsunami event.
All maps, except no. 2, visualize evacuation guidance by using arrows, but
there are five differences in the design of the arrows. First, the thickness of the
arrows differs from map to map. Map 6, for example, has much thicker arrows
than maps 3, 4, and 5. Thicker arrows provide more general information, but they
obstruct road network information. Second, the spacing between arrows differs.
Maps 3, 4, 5, and 6 have more arrows than map 1. Third, the locations of arrows
in relation to road networks are different. Map 1, for example, does not include an
30
arrow for an alternative evacuation route from the main populated area. In
contrast, map 3 has arrows for many roads but not others for no apparent
reason. Fourth, the locations of arrows in relation to hazard zones differ from
map to map. For example, map 3 includes arrows in the hazard zone and in the
safe zone, whereas map 1 only includes arrows in safe areas. Fifth, arrow
orientation differs. Arrows on maps 1, 4, 5, and 6 point toward the closest safe
area, but some do not direct the user to an assembly area. Conversely, arrows
on map 3 point toward assembly areas and avoid islands of safety. No map that
uses arrows has a legend or accompanying text explicitly stating that it is
guidance for evacuation during a local or distant tsunami, or for both scenarios.
Tsunami evacuation guidance is related to evacuation signage. The text in
all brochures, except nos. 4 and 6, discuss evacuation signage. The producers of
maps 4 and 6 may have chosen not to mention signs or, alternatively, the signs
may not exist. The text for maps 1 and 2 specifically mentions that signs provide
additional information at locations where there is more than one evacuation
route. The small amount of evacuation guidance provided in maps 1 and 2
implies that, at least in these two communities, signage offers much more
guidance than the maps.
Arrows do not provide clear evacuation guidance for certain areas of the
community. In the case of map 1, for example, where is the boundary that
defines equal time for a resident in the populated area of the hazard zone to
reach alternative safe areas? Signage may address this issue, but the maps do
not.

31
2.4.5 Infrastructure information
Infrastructure information can provide landmarks to plan evacuation and
may help identify safe areas. Icons display infrastructure information, but different
icon styles are employed where that information is included.
Deducing differences in types of infrastructure featured on maps is not
possible in our assessment because some communities may not have certain
types of infrastructures and others may have chosen not to include them on the
map. Nevertheless maps 4 and 5 include and identify several types of
infrastructures, whereas map 2 shows none.
The reason for including particular infrastructure is not clear. If buildings
are in safe zones, they presumably represent areas of refuge, as for example on
map 6, which may explain why this map does not show explicit assembly areas.
In addition, these buildings may serve as landmarks. Buildings in tsunami hazard
areas may also serve as landmarks, or alternatively represent locations for
vertical evacuation. Only maps 1 and 2, however, mention vertical evacuation,
and they do not emphasize evacuation toward buildings. The texts of these
brochures state that if you are in a multi-story building during the earthquake, you
should move to the top of the building after the ground stops shaking.
2.4.6 Terrain information
Terrain information, like infrastructure location, can provide orientation for
map users. It may also provide information about the relative safety of areas
inside and outside of the tsunami hazard zone. Maps visualize terrain information
using either hillshading or topographic contours.
32
Map 3 does not include terrain information. Map 2 arguably includes some
terrain information but, if so, it is extremely faint and may be unnoticed by users.
The other four maps include terrain information only for safe areas. A variety of
cartographic methods are used to provide this information. Maps 1 and 6 use
contours; map 1 includes only two contour lines; and map 6 includes four. Map 5
provides terrain information using hillshading. Map 4 appears to use a
combination of hillshading and contours, but the quality and style of the contour
lines make it difficult to determine how many contours are present. It is possible
that what appear to be contours on map 4 are instead artifacts of the hillshading
technique.
The educational value of terrain information on maps is questionable.
Maps that use contours provide no text or legend to explain the meaning of the
contours. Few contour lines may improve user orientation but provide only very
general information. Hillshading in map 5 is of higher quality than that in map 4,
but still adds little information other than providing orientation. Although the
hillshading in map 4 is of marginal quality, it seems to include contours and
therefore may offer the greatest overall educational value in terms of terrain.
For certain communities, it would be beneficial to provide more information
about terrain. People in areas distant from a safe haven may have to choose
between evacuating to different areas within the tsunami hazard zone. Because
maps do not provide detailed terrain information, individuals would have to make
decisions based only on their geographic perceptions of the elevation of their
community in tsunami hazard areas and not on educational map tools.

33
2.5 A cartographic perspective on tsunami evacuation map design issues
The preceding assessment has highlighted many cartographic information
design issues from the map-user‟s perspective. Map design issues can
alternatively be viewed in the context of map-making decisions. In this section,
we introduce the principles of cartographic abstraction - an implicit and critical
part of governments‟ role as mapmakers. Cartographic abstraction provides a
useful framework for summarizing information on (1) design differences in the six
map brochures discussed in this paper, (2) design differences in the maps of the
entire brochure sample, and (3) a new Google Maps evacuation map tool used in
Oregon.
2.5.1 Cartographic abstraction
Cartographic abstraction principles reveal how mapmakers chose to
select, generalize, and symbolize information to make a cartographic
representation (Robinson et al., 1995). Selection refers to the choice as to
whether or not to include a type of information on the map. Generalization is the
preparation of the selected information for symbolization. Generalization
eliminates unnecessary details for the purpose of enhancing the clarity of
information while considering limitations of the quality of the underlying data,
scale, and map medium. Symbolization refers to the use of cartographic
variables to visually represent generalized information (McMaster and Shea,
1992; Robinson et al., 1995). The symbolizations of all types of information
together create a cartographic representation.
34
Although generalization decisions precede those involving symbolization,
choices about symbolization also can produce generalization effects (McMaster
and Shea, 1992; Robinson et al., 1995). For example, the thickness of line used
to symbolize a road can exaggerate the road‟s width, or the use of a point to
locate a feature creates a circular area. Generalization stemming from
symbolization is most significant when symbols take up a relatively large space
on a map and the map scale is small.
2.5.2 Using cartographic abstraction to summarize the previous assessment of six maps
Selection decisions describe what types of information are portrayed on
the six maps. The tsunami hazard zone and road networks are the only
information types included to all six maps.
Generalization decisions result in most of the cartographic design
differences in information types. Several information types involve more than one
generalization method. Tsunami hazard zone information was generalized into
either one or two hazard zones, by categorizing local and distant tsunamis and
greatest and marginal risk. The hazard zone boundary was also generalized on
all six maps by an unknown method. Road network information was generalized
largely due to considerations of map scale; roads may have eliminated for this
reason. Assembly area information was generalized to points during the hazard
assessment process. Evacuation guidance information was generalized by
decisions about arrow locations in relation to roads and hazard zones, and arrow
orientation and spacing. Infrastructure information was generalized by decisions
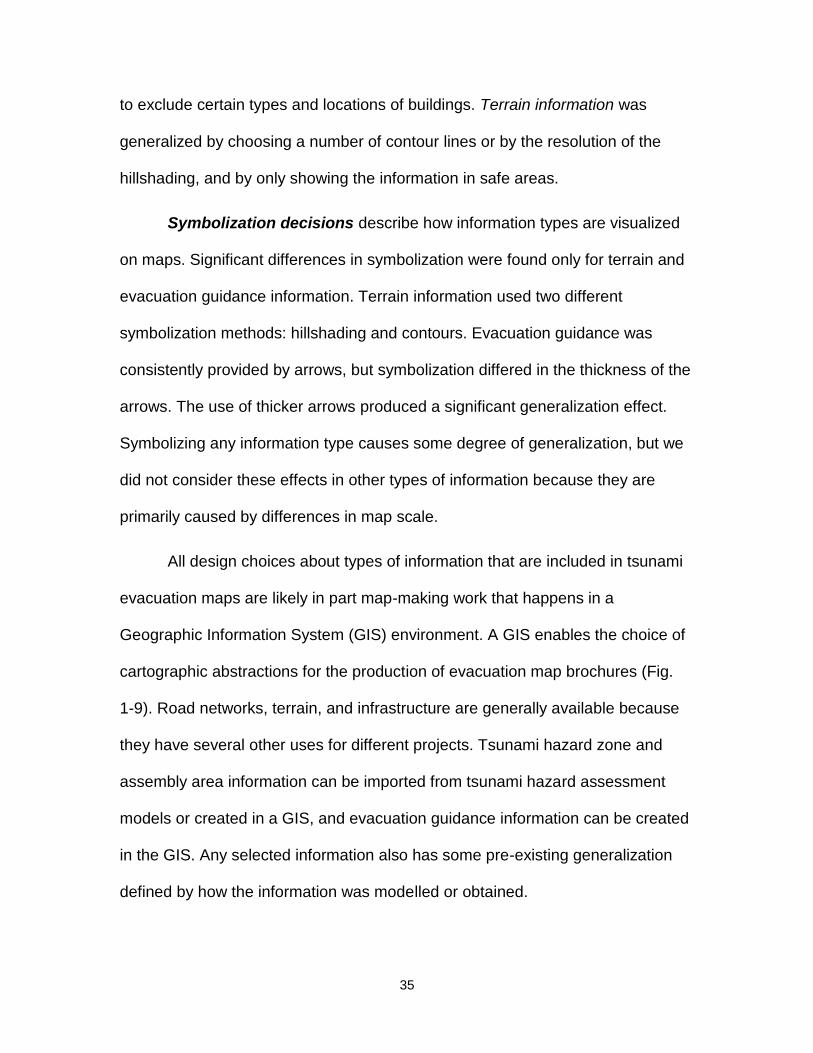
35
to exclude certain types and locations of buildings. Terrain information was
generalized by choosing a number of contour lines or by the resolution of the
hillshading, and by only showing the information in safe areas.
Symbolization decisions describe how information types are visualized
on maps. Significant differences in symbolization were found only for terrain and
evacuation guidance information. Terrain information used two different
symbolization methods: hillshading and contours. Evacuation guidance was
consistently provided by arrows, but symbolization differed in the thickness of the
arrows. The use of thicker arrows produced a significant generalization effect.
Symbolizing any information type causes some degree of generalization, but we
did not consider these effects in other types of information because they are
primarily caused by differences in map scale.
All design choices about types of information that are included in tsunami
evacuation maps are likely in part map-making work that happens in a
Geographic Information System (GIS) environment. A GIS enables the choice of
cartographic abstractions for the production of evacuation map brochures (Fig.
1-9). Road networks, terrain, and infrastructure are generally available because
they have several other uses for different projects. Tsunami hazard zone and
assembly area information can be imported from tsunami hazard assessment
models or created in a GIS, and evacuation guidance information can be created
in the GIS. Any selected information also has some pre-existing generalization
defined by how the information was modelled or obtained.
36
Figure 1-9 – Cartographic abstraction in tsunami evacuation map design involves selecting, generalizing, and symbolizing types of information. Cartographic abstraction is repeated for each selected type of information. Cumulatively, the symbolizations in a brochure result in a representation of tsunami hazard.
2.5.3 Using cartographic abstraction to summarize design differences in all 38 maps
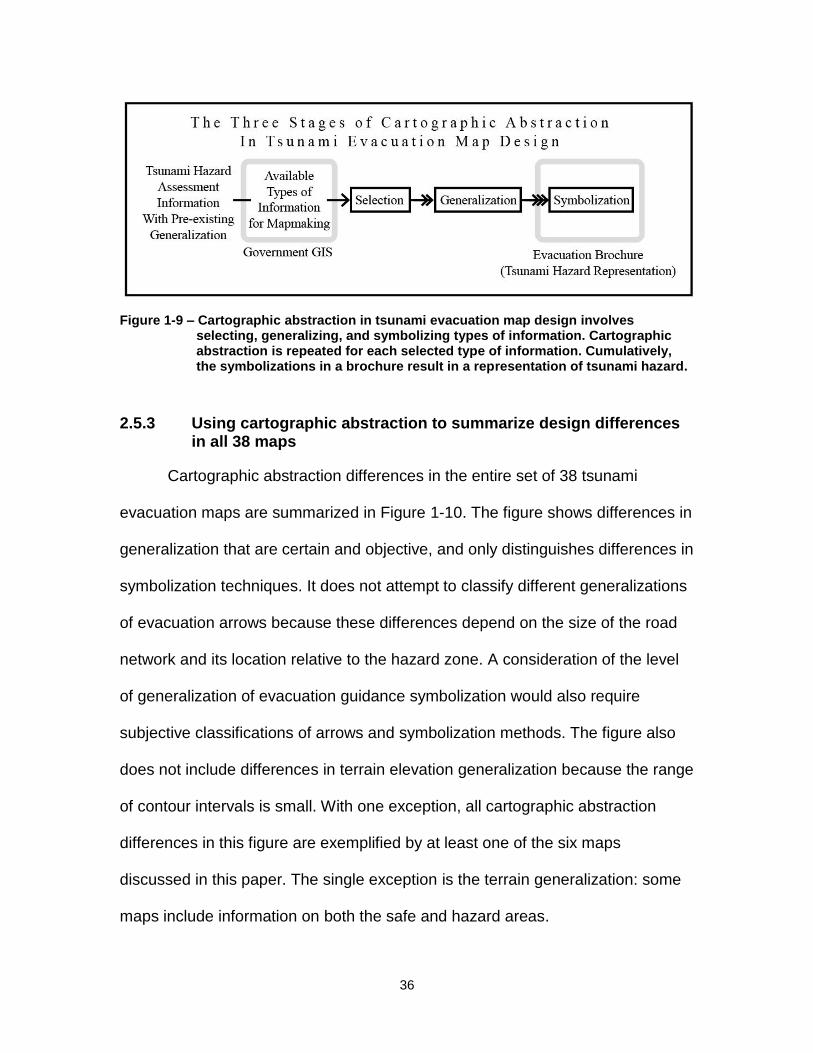
Cartographic abstraction differences in the entire set of 38 tsunami
evacuation maps are summarized in Figure 1-10. The figure shows differences in
generalization that are certain and objective, and only distinguishes differences in
symbolization techniques. It does not attempt to classify different generalizations
of evacuation arrows because these differences depend on the size of the road
network and its location relative to the hazard zone. A consideration of the level
of generalization of evacuation guidance symbolization would also require
subjective classifications of arrows and symbolization methods. The figure also
does not include differences in terrain elevation generalization because the range
of contour intervals is small. With one exception, all cartographic abstraction
differences in this figure are exemplified by at least one of the six maps
discussed in this paper. The single exception is the terrain generalization: some
maps include information on both the safe and hazard areas.
37
Figure 1-10 – Objective differences in cartographic abstraction of tsunami information types in 38 map brochures in Washington and Oregon. The numbers correspond to the communities listed in Figure 1-1. Black squares indicate the type of generalized and symbolized information contained within the community’s evacuation map. Information on road networks is not included because generalization differences are unknown and all maps symbolize roads using lines.
38
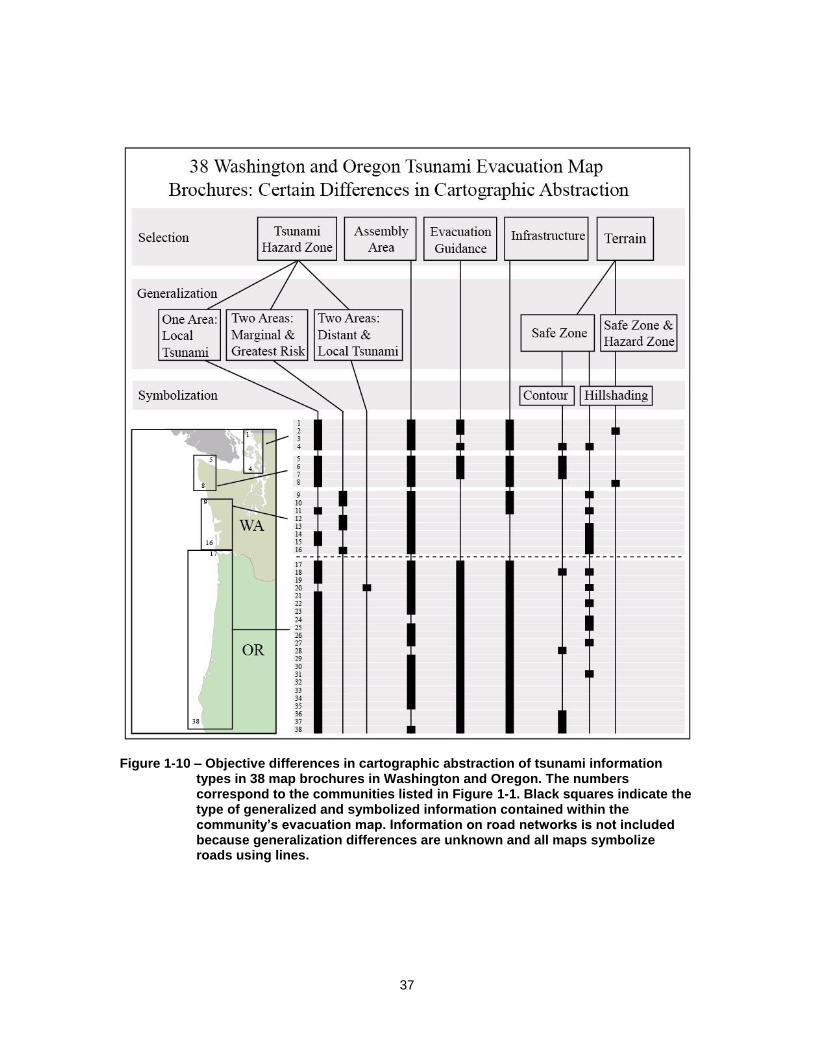
2.5.4 Using cartographic abstraction to situate a new evacuation map design
A recently introduced interactive Google Maps tool in Oregon (Oregon
Department of Geology and Mineral Industries, 2009) is currently the only other
educational tsunami evacuation map tool available in Washington and Oregon.
The State of Oregon developed the tool, which can be found athttp://www.
nanoos.org/data/products/oregon_tsunami_evacuation_zones/index.php. The
tool provides tsunami hazard information for most Oregon communities, but not
all parts of the coastline are covered because inundation mapping is still being
completed in Oregon. Figure 1-11 is a screenshot of the Google Maps interface
for the community of Cannon Beach.
Figure 1-11 – Interface for the new Google Maps tsunami evacuation map in Oregon. This figure shows how the interface appears when a user looks for evacuation information for Cannon Beach. Residents can search for their address to see whether they live in the hazard area. The tsunami hazard zone information is symbolized by a transparent pink area overlay and is labelled “tsunami evacuation zones” in the legend (the legend is not shown).
39
Oregon citizens will probably find this tool useful. It introduces interactivity
that is not possible with a brochure. Notably, users can zoom as well as search
for the location of their residence or workplace within the local tsunami hazard
zone. The tool also provides satellite image information and generalization of all
included information types is not restricted by scale.
By zooming in, the user can acquire additional information on road and
infrastructure and increased detail in the satellite image. Zooming in does not
provide, however, additional detail on tsunami hazard zones because, as in
brochures, accompanying text does not provide the generalization method used
to delineate the area.
Although the Google Maps tool offers significant advantages over
brochures, it has several limitations. The associated text is not significantly
different from that in the map brochures. In fact, in many ways it is less detailed
because it is not customized for communities. In addition, the cartographic
abstraction of tsunami hazard information has many limitations compared with
that of brochures. For example, the Google Maps interface, unlike the Cannon
Beach brochure, generalizes tsunami hazard information to one area and does
not show assembly areas or provide evacuation guidance or terrain information.
It also does not emphasize important infrastructure relevant to evacuation; rather
it depends on Google‟s GIS generalization algorithms. Given these limitations,
the Google Maps tool does not eliminate the need for community tsunami
evacuation brochures.

40
Figure 1-12 shows the cartographic abstraction of tsunami hazard
information found in the Google Maps tool. The only information unique to the
interface compared with the standard Google Maps interface is the tsunami
hazard zone information. All other information types are directly dependent on
Google‟s GIS.
Figure 1-12 – The Google Maps tool provides satellite imagery not found in brochures, but it does not show assembly areas or provide evacuation guidance or terrain information. Its zoom capability eliminates generalization issues caused by fixed scales in brochures.
41
2.6 Discussion
We have compared and contrasted tsunami hazard map information
included in 38 Washington and Oregon evacuation brochures. Recent efforts in
Oregon to standardize brochures and introduce new technologies are important
steps in improving evacuation maps, but they have not been evaluated for their
educational efficacy. It is debatable whether these developments will improve
tsunami education.
Previous work that used public surveys to evaluate the cumulative efficacy
of all educational tools in communities of Oregon (Karel, 1998) and Washington
(Johnson et al., 2002) suggests that the tools provide the public with only limited
perceptions of tsunami hazards. As a follow-up to the Washington study,
Johnston et al. (2005) conducted interviews to learn why existing tools did not
have the desired effects. Some residents responded that the tools generally do
not provide adequate detailed information.
Washington and Oregon evacuation maps do not provide the public
detailed tsunami hazard information. As our study has revealed, there are many
important questions that current evacuation maps do not answer. More
advanced, supplementary evacuation maps could provide this information by
including more types of information, decreasing information generalization, and
offering more types of information symbology than are available with current
cartographic products. The Google Maps tool supplements information content in
brochures mainly through its satellite image information and reduced
generalization of road network information. On the other hand, it reduces
42
information by excluding assembly areas and evacuation guidance, and provides
a more generalized tsunami hazard zone. Improving evacuation maps requires
the development and evaluation of new tools to supplement existing tsunami
hazard information.
Provision of supplementary tsunami information may improve tsunami
mitigation by enhancing long-term experiential learning in communities. Creating
supplementary evacuation map products, however, involves more than adopting
new interactive technologies; new technologies do not directly address the issue
of information content, which is socially, not technologically, defined. Considering
evacuation maps as cartographic abstractions helps to situate the importance of
these social decisions.
2.7 Conclusion
Design of tsunami evacuation maps involves an interpretation of hazard
assessment information. It also involves cartographic choices that may limit the
public‟s access to scientific tsunami hazard information. In response to a lack of
attention to the choices that mapmakers make when producing tsunami
evacuation maps, we assessed the map and text of six tsunami brochures in
Washington and Oregon. We introduce cartographic abstraction to situate the
map information content of the brochures. Cartographic abstraction involves
decisions in the selection, generalization, and symbolization of information. Using
this framework, we summarize design differences in the information content of
the six maps and more generally that of the maps in all 38 brochures. We also

43
situate the information content of an interactive Google Maps tsunami evacuation
map tool.
State and local officials collaborate to design tsunami evacuation maps in
Washington and Oregon, but they must recognize the importance of cartographic
abstraction of information that happens when designing evacuation map tools.
Significant opportunities exist to improve tsunami evacuation maps, but social
variables that define their design and production must be explicitly recognized.
Our assessment provides both a summary and examples of how
mapmakers represent and limit community-scale tsunami hazard information, as
well as insight into how we may describe and explore socially influenced aspects
of tsunami evacuation map-making. In theory, mapmakers are free to develop
many supplementary cartographic products that enhance existing hazard
information provided by brochures. New interactive mapping technologies may
have an important role in preparing citizens for tsunamis, but the social decisions
about cartographic abstraction that define underlying tsunami hazard information
content may be equally or more important.
2.8 References
Bernard E. (2005). The U.S. National Tsunami Hazard Mitigation Program – a successful State–Federal partnership. Natural Hazards, 35, 5–24.
Chowdhury S., Geist E., Gonzalez F., MacArthur R., and Synolakis C. (2005).Tsunami hazards, FEMA coastal flood hazard analysis and mapping guidelines, focused study report. Retrieved from the Federal Emergency Management Agency website: https://www.floodmaps.fema. gov/pdf/fhm/frm_p1zones.pdf.
44
Dengler L. (2005). The role of education in the National Tsunami Hazard Mitigation Program. Natural Hazards, 35, 141–153.
Eisner R.K., Borrero J.C., and Synolakis C.E. (2001). Inundation maps for the State of California. In Proceedings of the International Tsunami Symposium 2001. National Tsunami Hazard Mapping Program Review Session, R-4, Seattle WA 7–10 August 2001, 67–81.
Gonzalez F.I., Titov V.V., Mofjeld H.O., Venturato A.J., and Newman J.C. (2001).The NTHMP inundation mapping program. In Proceedings of the International Tsunami Symposium 2001. National Tsunami Hazard Mapping Program Review Session, R-2, Seattle, WA, 7–10 August 2001, 29–54.
Gonzalez F.I., Titov V.V., Mofjeld H.O., Venturato A.J., Simmons R.S., Hansen R., Combellick R., Eisner R.K., Hoirup D.F., Yanagi B.S., Yong S., Darienzo M., Priest G.R., Crawford G.L., and Walsh T.J. (2005). Progress in NTHMP hazard assessment. Natural Hazards, 35, 89–110.
Johnson D., Paton D., Houghton B., Becker J., and Crumbie G. (2002). Results of the August-September 2001 Washington State tsunami survey. New Zealand Institute of Geological and Nuclear Sciences, Science Report 2002/17, Lower Hutt, New Zealand.
Johnson D., Paton D., Crawford G., Ronan K., Houghton B., and Buergelt P. (2005). Measuring tsunami preparedness in coastal Washington, United States. Natural Hazards, 35,173–184.
Jonientz-Trisler C., Simmons R.S., Yanag B.S., Crawford G.L., Darienzo M., Eisner R.K., Petty E., and Priest G.R. (2005). Planning for tsunami-resilient communities. Natural Hazards, 35, 121–139.
Karel A. (1998). Oregonians need more information about tsunamis to save lives. Oregon Geology, 60(3), 56.
McMaster R.B., and Shea K.S. (1992). Generalization in digital cartography. Washington, DC: Association of American Geographers.
Oregon Department of Geology and Mineral Industries (2005a). Tsunami evacuation brochure for Gearhart, Oregon, 2 pp.
Oregon Department of Geology and Mineral Industries (2005b). Tsunami evacuation brochure for Newport, Oregon, 2 pp.
Oregon Department of Geology and Mineral Industries (2008). Tsunami evacuation brochure for Cannon Beach/Arch Cape, Oregon, 2 pp.
Oregon Department of Geology and Mineral Industries (2009). Oregon Coast tsunami hazards program tsunami map viewer. http://www.nanoos.org/ data/products/oregon_tsunami_evacuation_zones/index.php Accessed March 2 2011.
45
Priest R., Baptista A.M., Myers E.P. III, and Kamphaus R.A. (2001). Tsunami hazard assessment in Oregon. In Proceedings of the International Tsunami Symposium 2001. NTHMP Review Session, R-3, Seattle, WA, 7–10 August 2001, pp. 55–65. http://nthmp-history.pmel.noaa.gov /its2001/Separate_Papers/R-03_Priest.pdf Accessed January 20 2011.
Robinson A.H., Morrison J.L., Muehrcke P.C., Kimerling A.J., and Guptill S.C. (1995). Elements of cartography (6th edition). New York: Wiley.
The City of Warrington (2005). Tsunami evacuation brochure for Warrington, Oregon, 2 pp.
Washington Military Department Emergency Management Division (2004). Evacuation map for La Push and Vicinity, Washington, 2 pp.
Washington State Department of Natural Resources, Division of Geology and Earth Resources (2007). Evacuation map for Westport, Grayland, and Ocosta, Washington, 2 pp.
Western States Seismic Policy Council (2008). 2008 Annual Report. Retrieved from the Western States Seismic Policy Council website: http://www.wsspc.org/resources/Annual%20Reports/08_AR_FINAL.pdf

46
Chapter 3: The Transformation of Tsunami Hazard Information into an Educational Evacuation Map Strategy: A Case Study in Ucluelet, British Columbia
2
3.1 Abstract
The development of educational tsunami evacuation maps in the Pacific
Northwest of Canada and the United States is based on decisions about how to
use available tsunami hazard information. This paper considers, on the one
hand, how cartographic decisions influence tsunami hazard information of an
educational evacuation map strategy and, on the other, the need for decisions to
make more information publicly accessible. A case study of tsunami hazard
assessment and evacuation map development is presented in Ucluelet, a small
community on the west coast of Vancouver Island, Canada. We describe how
scientific and government decisions influenced the transformation of tsunami
hazard information into an educational evacuation map by applying cartographic
abstraction principles, which consider the selection, generalization, and
symbolization of information in maps. We argue that the development of
Ucluelet‟s evacuation map involved many decisions and other factors that
cumulatively marginalized potentially valuable educational information. The most
significant decision was to produce only one educational tsunami evacuation
map. This practice is common in Pacific Northwest communities in the United
States. The goals of tsunami resilience and empirical tsunami education studies
2 A version of this Chapter has been submitted to Environmental Hazards: Human and Policy
Dimensions under the co-authorship of Nick Hedley.

47
challenge this longstanding one map paradigm. We illustrate examples of unused
tsunami hazard information that could play a role in more advanced evacuation
maps intended for public who seek the information.
3.2 Introduction
Coastal communities on Vancouver Island, British Columbia (BC) are
vulnerable to both distant tele-tsunamis and near-source tsunamis generated by
great earthquakes at the Cascadia Subduction Zone (CSZ) (Clague et al., 2003).
BC‟s Provincial Emergency Program (PEP), now a division of Emergency
Management BC, provides all vulnerable communities with tele-tsunami
warnings, along with tsunami preparedness and mitigation guidance (British
Columbia Provincial Emergency Program, 2001). In an assessment of BC‟s
tsunami program, Anderson and Gow (2004) made a number of
recommendations for improving tsunami monitoring and detection, emergency
management, and public response. The recommendations included a need for
increased inundation mapping efforts. At the time of Anderson and Gow‟s
assessment, the Canadian Hydrological Service was conducting research on
CSZ tsunami scenarios (2004), but had not yet developed any community-
specific two-dimensional inundation maps.
The devastating 2004 Indian Ocean tsunami accelerated BC‟s tsunami
preparedness efforts. In 2005, with funding from the Government of Canada,
PEP initiated the Tsunami Integrated Preparedness (TIP) project (Kryzanowski,
2006). TIP funded many tsunami preparedness initiatives, mainly through
community grants. As part of TIP, PEP coordinated a pilot study tsunami hazard
48
assessment in Ucluelet. This initiative brought together Ucluelet‟s local
government officials with tsunami modelling experts from the private and
academic sectors. The goals of the project included developing a two-
dimensional tsunami inundation model to assess Ucluelet‟s CSZ tsunami
vulnerabilities, developing and assessing strategies for planning and evacuation,
sharing results with the public, and applying the findings and methods to other
communities. We joined this project with a broad aim of researching cartographic
methods to communicate the assessment‟s results. As part of our research, we
observed how the tsunami hazard assessment influenced the resulting
educational evacuation map strategy – a process that involved tsunami scientists
and local government emergency management officials.
The development of an educational evacuation map in Ucluelet was
significantly influenced by developments in the United States (US). Ucluelet not
only faces similar distant and CSZ tsunami vulnerabilities as US Pacific
Northwest communities (Clague et al., 2000), but BC PEP also has a continuing
relationship with all Pacific states in improving tsunami mitigation strategies
(British Columbia Provincial Emergency Program, 2001). Pacific states, in turn,
have a partnership with US federal government agencies that together constitute
the National Tsunami Hazard Mitigation Program (NTHMP) (Bernard, 2005). The
NTHMP oversees tsunami warning guidance, hazard assessment, and mitigation
for all vulnerable US communities (Jonientz-Trisler et al., 2005). Anderson and
Gow (2004) identified the potential benefit of BC drawing on experience from
NTHMP developments, but the NTHMP offers no explicit guidance about

49
educational evacuation map design and development. Instead, it broadly defines
tsunami education as a form of mitigation able to create tsunami-resilient
communities (Dengler, 2005).
The NTHMP defines tsunami-resilient communities as ones that: “(1)
understand the nature of the tsunami hazard, (2) have the tools they need to
mitigate the tsunami risk, (3) disseminate information about the tsunami hazard,
(4) exchange information with other at-risk areas, and (5) institutionalize planning
for a tsunami disaster” (Dengler, 2005; Jonientz-Trisler et al., 2005). The first and
third points relate to educational tools, and the fourth point emphasizes adoption
of tools used in neighbouring communities to encourage tool consistency and
cost-effectiveness (Jonientz-Trisler et al., 2005). Ucluelet‟s closest neighbouring
states are Washington and Oregon, where State and local government officials
develop educational evacuation maps by interpreting results of State-developed
tsunami inundation maps (Gonzalez et al., 2001, 2005). Although communities in
Washington and Oregon consistently disseminate one evacuation map brochure
in print and online, these brochures have variable tsunami hazard information
(Kurowski et al., in press), making adoption by Ucluelet not straightforward.
Oregon has recently proposed a standard evacuation map brochure design and
also has developed a state-wide Google Maps evacuation map application, but it
has not rationalized why certain information is included or excluded (Kurowski et
al., in press). Although all Washington and Oregon educational evacuation maps
are based on scientific information, their designs have been socially defined. To

50
our knowledge, this social process has not received explicit attention in the
tsunami science literature.
This paper describes how social factors influenced the development of an
educational evacuation map strategy in Ucluelet. We first provide an overview of
Ucluelet‟s tsunami hazard assessment and how scientists communicated the
results in a public forum. Using cartographic abstraction principles, we then
describe a scientifically recommended evacuation map design, and a different,
final evacuation map implemented by local officials. Most importantly, evacuation
map decisions in Ucluelet generally followed those developed by communities in
Washington and Oregon; in doing so, Ucluelet significantly simplified available
and potentially relevant information for education. We argue that existing tsunami
resilience principles and empirical evidence suggest a need for greater utilization
of tsunami hazard assessment information in cartographic tsunami education
efforts. We use Ucluelet as an example to illustrate evacuation map education
strategies that may be able to communicate more information to the public.
3.3 The development of a tsunami evacuation map strategy in Ucluelet
Before the pilot project tsunami hazard assessment process began,
Ucluelet had a simple draft plan. This plan used an elevation contour to define
maximum tsunami run-up based on plans adopted by US Pacific coastal
communities. Local officials had identified one central assembly area in the
population centre, but had not yet implemented an evacuation map or any other
tsunami education products such as tsunami evacuation signage on roads. The
51
scientific tsunami hazard assessment aimed to more accurately define the
community‟s vulnerabilities and to inform mitigation actions.
The methodology for Ucluelet‟s tsunami hazard assessment consisted of
five stages: (1) characterizing the community; (2) characterizing and simulating
the hazard; (3) assessing community vulnerabilities; (4) loss modelling and
evacuation as a mitigation measure; and (5) review and public communication.
Each of the first four stages included a review component of stage (5). Review by
the local government was limited to qualitative components of community
characterization (stage 1) and assessment of community vulnerabilities (stage 3),
which were also the basis for the tsunami plan that was drafted before the
scientific assessment began. The feedback from the local government enhanced
information gathered by scientists, such as building characteristics and
population information. This information was entered into the scientists‟
Geographic Information System (GIS) to later inform quantitative human and
infrastructure estimates of loss. Review of simulation modelling (stage 2) and
loss modelling (stage 4) were highly technical and required input from external
scientists.
Public communication (stage 5) was the last stage of the methodology and
consisted of a public forum presentation and provision of a recommended an
educational evacuation map strategy to local officials. Considering all
communicated information, local officials produced the final evacuation map
strategy for the public.
52
3.3.1 Communication of tsunami hazard assessment results in a public forum
A public forum was arranged and attended by approximately 80 people,
many of whom were emergency personnel, for example fire department and
ambulance workers. Some local officials responsible for mitigation and
preparedness had seen the results of the assessment before the public forum
due to the iterative methodology of the scientific tsunami hazard assessment.
The public meeting was filmed by the Canadian Broadcasting Corporation (CBC)
as part of a documentary about tsunamis in the Pacific Northwest (http://www.
cbc.ca/documentaries/doczone/2009/shockwave/). At the forum, scientists
summarized new quantitative information gained from stages 2 and 4 of the
assessment and answered questions. These two stages were most relevant to
providing new scientifically derived information for the development of an
educational evacuation map strategy.
3.3.1.1 Communicating results of tsunami inundation
The inundation modelling from stage 2 assumed a worst-case magnitude-
9.1 Cascadia earthquake based upon geological assumptions made in a
Washington study by Walsh et al. (2000) and simulated the tsunami using the
TsunamiCLAW software developed by George and Leveque (2006). The
modelling indicated that Ucluelet residents and visitors would have approximately
20 minutes before the first tsunami wave arrived and 40 minutes before the
maximum run-up (Johnstone and Lence, 2009).
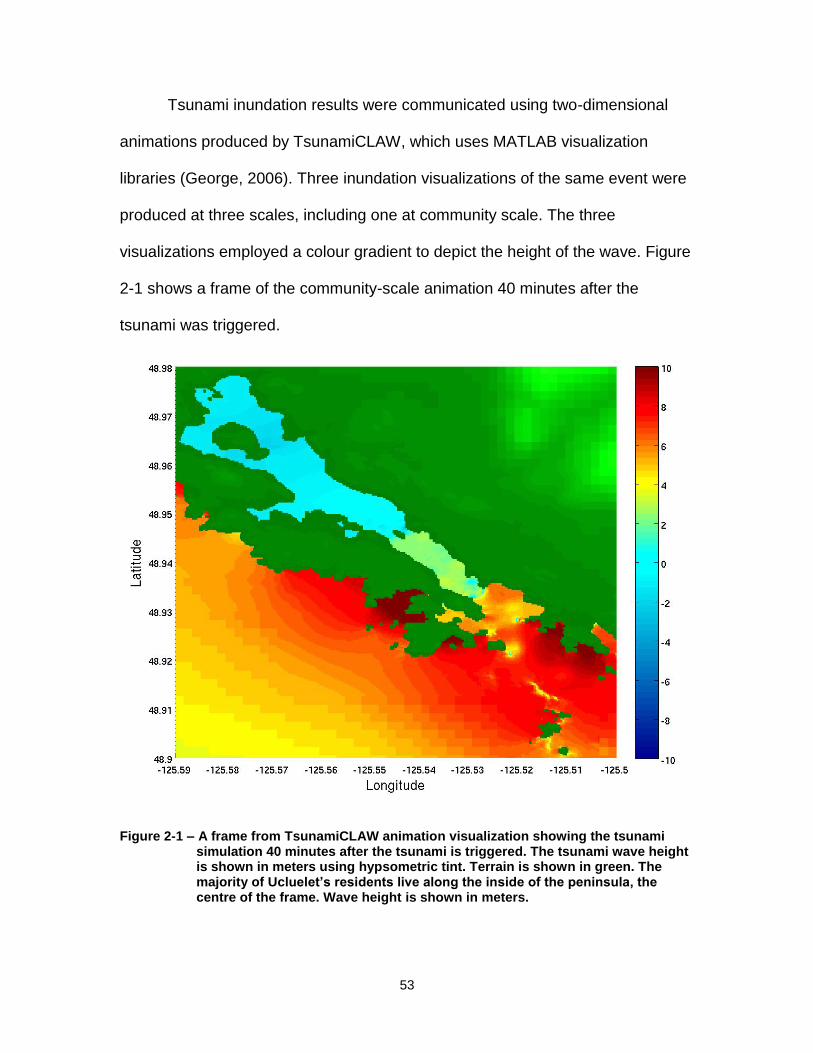
53
Tsunami inundation results were communicated using two-dimensional
animations produced by TsunamiCLAW, which uses MATLAB visualization
libraries (George, 2006). Three inundation visualizations of the same event were
produced at three scales, including one at community scale. The three
visualizations employed a colour gradient to depict the height of the wave. Figure
2-1 shows a frame of the community-scale animation 40 minutes after the
tsunami was triggered.
Figure 2-1 – A frame from TsunamiCLAW animation visualization showing the tsunami simulation 40 minutes after the tsunami is triggered. The tsunami wave height is shown in meters using hypsometric tint. Terrain is shown in green. The majority of Ucluelet’s residents live along the inside of the peninsula, the centre of the frame. Wave height is shown in meters.

54
3.3.1.2 Communicating loss estimation and evacuation mitigation strategies
Loss estimation modelling used the inundation scenario from stage 2 to
simulate different evacuation scenarios for stage 4. Different simulations in stage
4 were made by changing the time of day, season, mode of travel, the choice to
evacuate or shelter in place, and the number of assembly areas. The simulations
represented people evacuating and included many characteristics of behaviour
such as time for mobilization. The quantitative comparison of alternative
evacuation strategies was a principal contribution of the technical tsunami hazard
assessment‟s methodology to the tsunami science literature (Johnstone and
Lence, 2009). The simulations were made using the BC Hydro Life Safety Model
(LSM) software package (Johnstone and Lence, 2009). In the best-case
scenario, with multiple evacuation areas, 93% of people in the hazard area were
able to survive the simulation by evacuating on foot.
Results of loss modelling and evacuation were communicated using
several animated visualizations produced by LSM that represented people as
moving points on roads, along with charts and graphs. Unlike inundation
visualizations, the evacuation visualizations did not show exact spatial and
temporal information; instead they visualized how quantitative results shown in
charts and graphs were obtained. Figure 2-2 illustrates an example of a graph
similar to some of those used in the public forum to communicate how many
people reach safety under different choices about evacuation modes and
assembly areas.

55
Figure 2-2 – Graph of a daytime evacuation simulation results for a summer population scenario, based on research by Johnstone and Lence (2009). The evacuation time window refers to the time period when the tsunami is inundating Ucluelet.
3.3.2 Use of results to develop an educational evacuation map strategy
Both evacuation map strategies recommended by scientists and local
government involved cartographic design choices. These choices included
symbolization, layout, legend, and text, all of which contribute to tsunami hazard
representation. Cartographic abstraction principles reveal mapmakers‟ choices in
selection, generalization, and symbolization of using available types of
information that result in a representation (Robinson et al., 1995). Selection
refers to the inclusion of information for the purpose of the map. Generalization
refers the simplification of information to enhance communication. Symbolization
refers to the use of cartographic design principles and graphic variables to
visually communicate information. Characteristics of the map medium also affect
56
representation (Slocum et al., 2003). In the case of tsunami brochure maps, all
selected information is inherently generalized as a function of scale and the
space considerations of paper map and brochure dimensions. Both the scientist-
recommended and local government implemented brochure in Ucluelet used
tsunami hazard information in a GIS to make decisions about cartographic
abstraction.
3.3.2.1 Scientifically recommended educational evacuation map strategy
The first four stages of the scientific tsunami hazard assessment was in a
GIS and provided information for potential selection. Following practices used in
Washington and Oregon communities, the scientist-recommended evacuation
map strategy for public education displayed all relevant information in a single
map brochure. This one map solution also was part of the goals set out by the
Ucluelet project.
Scientists working on the Ucluelet tsunami hazard assessment project
used available information to design several possible versions of a tsunami
evacuation map brochure. We participated in reviewing these maps. The map
shown in Figure 2-3 was recommended by the team of scientists from both
private and academic sectors who conducted the tsunami hazard assessment.
This map was provided to local officials before the public forum and was not
shown publicly. It did not include a design for educational text, which is on the
back of brochures in Washington and Oregon, and therefore was not a complete
product. The brochure also had a similar colour scheme to brochures of
Washington and Oregon communities.
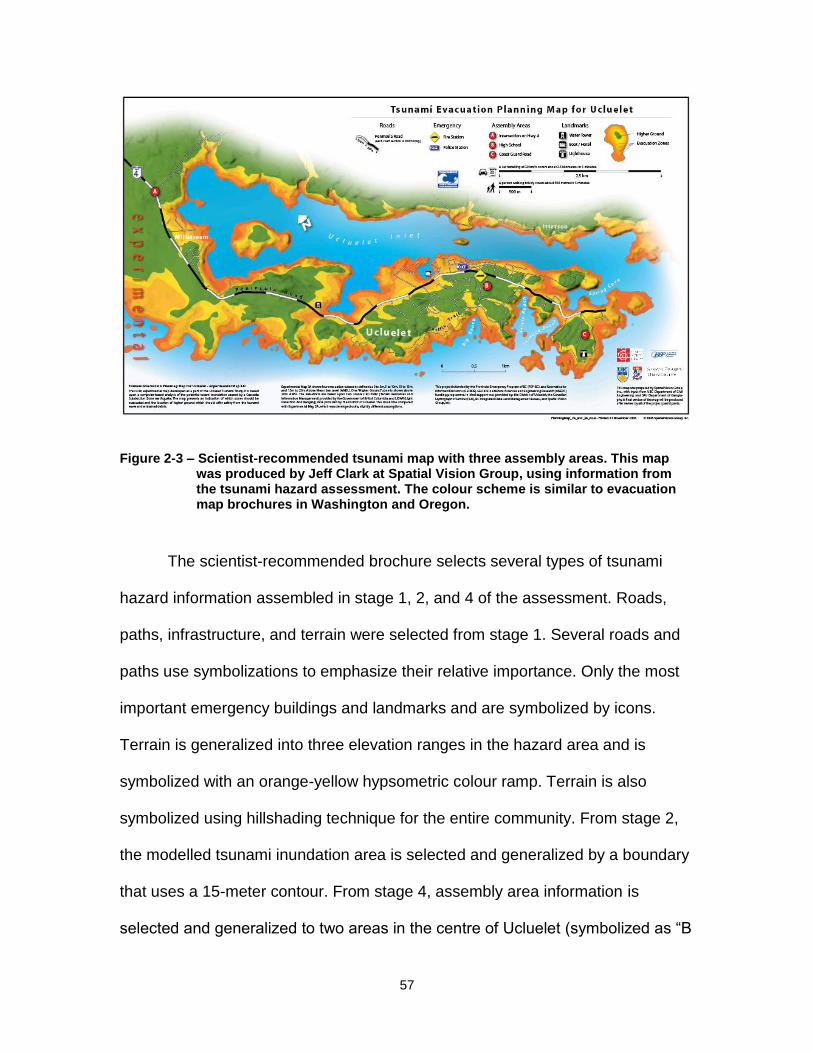
57
Figure 2-3 – Scientist-recommended tsunami map with three assembly areas. This map was produced by Jeff Clark at Spatial Vision Group, using information from the tsunami hazard assessment. The colour scheme is similar to evacuation map brochures in Washington and Oregon.
The scientist-recommended brochure selects several types of tsunami
hazard information assembled in stage 1, 2, and 4 of the assessment. Roads,
paths, infrastructure, and terrain were selected from stage 1. Several roads and
paths use symbolizations to emphasize their relative importance. Only the most
important emergency buildings and landmarks and are symbolized by icons.
Terrain is generalized into three elevation ranges in the hazard area and is
symbolized with an orange-yellow hypsometric colour ramp. Terrain is also
symbolized using hillshading technique for the entire community. From stage 2,
the modelled tsunami inundation area is selected and generalized by a boundary
that uses a 15-meter contour. From stage 4, assembly area information is
selected and generalized to two areas in the centre of Ucluelet (symbolized as “B

58
“and “C”), and a third assembly area outside Ucluelet‟s populated area on the
peninsula (symbolized as “A”, on the left side of the map). The recommended
two assembly areas in the Ucluelet peninsula were reduced from six used to
obtain the best-case evacuation simulations from stage 4. This simplification was
appropriate from a scientific view and less complex form a practical point of view.
Although this map brochure communicates the worst case near-source
tsunami, it also visualizes information aimed for communicating a tele-tsunami
event, because it has a legend that visualizes driving time – an action that would
likely be impossible in the case of a near-source tsunami; in a CSZ event, the
earthquake preceding a tsunami would largely destroy all infrastructure (British
Columbia Provincial Emergency Program, 2001).
3.3.2.2 Implemented evacuation map
Following the completion of the scientist-recommended brochure and
communication of results in the public forum, all components of the scientific
tsunami hazard assessment were complete. The implementation of a final
evacuation map strategy was the responsibility of the local government. Ucluelet
waited to publish an evacuation map until its neighbouring community of Tofino
completed its tsunami hazard assessment, so the two communities could jointly
publish a brochure. The Tofino tsunami hazard assessment followed a similar
scientific methodology as Ucluelet, except that no academic institutions were
involved, and the methodology did not provide a recommended brochure design.
The final implemented map is shown in Figure 2-4.

59
Figure 2-4 – Final published educational tsunami evacuation map for Ucluelet and Tofino. Ucluelet did not adopt all assembly areas recommended by scientists (see Figure 2-3).
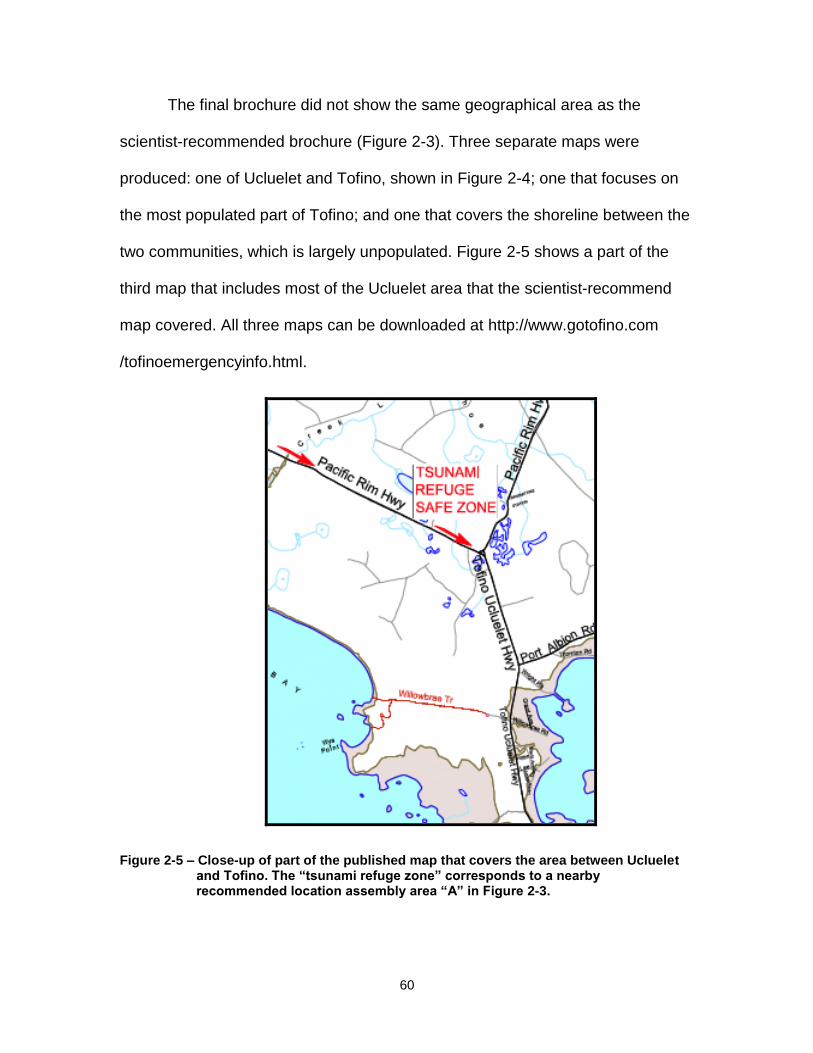
60
The final brochure did not show the same geographical area as the
scientist-recommended brochure (Figure 2-3). Three separate maps were
produced: one of Ucluelet and Tofino, shown in Figure 2-4; one that focuses on
the most populated part of Tofino; and one that covers the shoreline between the
two communities, which is largely unpopulated. Figure 2-5 shows a part of the
third map that includes most of the Ucluelet area that the scientist-recommend
map covered. All three maps can be downloaded at http://www.gotofino.com
/tofinoemergencyinfo.html.
Figure 2-5 – Close-up of part of the published map that covers the area between Ucluelet and Tofino. The “tsunami refuge zone” corresponds to a nearby recommended location assembly area “A” in Figure 2-3.

61
The tsunami hazard representation of the Ucluelet portion of the final
evacuation map brochure differs significantly from the scientist-recommended
design in Figure 2-3, perhaps in part because local officials used their own GIS
and cartographic software to produce the map. Terrain was not selected; roads
were selected and are less generalization compared to those on the
recommended map (all roads are labelled); infrastructure is generalized to two
buildings at the central assembly area. As recommended, the tsunami hazard
zone was selected and generalized by a 15-meter contour. The most interesting
and relevant difference in the Ucluelet example is the change in the assembly
areas from two locations in the centre of Ucluelet (locations B and C in Figure 2-
3) to one location, which corresponds to B in Figure 2-3. Evacuation guidance
was also symbolized with arrows all of which point toward the one assembly
area, a decision that may have been influenced by the inclusion of arrows in
some Washington and Oregon brochures.
The choice of one central assembly area and of evacuation guidance
pointing to it emphasizes actions appropriate for a tele-tsunami scenario.
Ucluelet‟s brochure communicates change the evacuation strategy of the lower
probability Cascadia tsunami by stating, “If you feel an earthquake, assume a
tsunami has been generated. If you are in a low lying coastal area, quickly move
to higher ground as a precaution”.
3.4 Discussion
Our description of the development of an educational evacuation map in
Ucluelet provides an entry point to discuss issues common to all educational

62
evacuation map strategies in the Pacific Northwest. All brochures in Washington
and Oregon along with Ucluelet‟s involve the transformation of scientific
information through conscious and/or inadvertent use of available information by
mapmakers. This process implicitly involves cartographic abstraction.
The Ucluelet case study included a scientist-recommended brochure
design that used the results of models to select an inundation area generalized
by an elevation contour and qualitatively generalized assembly areas by the
reduction of the number of assembly areas. Many decisions, such as inclusion of
terrain information, were not based on scientific evidence that shows the
information to be most effective for education. Much potentially relevant
information presented at the public forum was not included. The map
implemented by local officials also involved similar, but unique types of
cartographic abstractions.
In the Ucluelet case study, a novel scientific methodology that
quantitatively compared evacuation scenarios to arrive at recommended
assembly area locations, played no role in the final educational evacuation map
design; instead, local officials used the assembly area that was defined in their
original draft evacuation plan. The scientific methodology only played a role in
defining the inundation area (stage 2), which the local government draft plan
assumed on the basis of previous studies in US communities.
The case study suggests that Ucluelet‟s local officials favoured their
qualitative knowledge of the social and physical geography of Ucluelet over
scientific evidence, prioritized simplicity as an overall hazard communication

63
strategy, and visually emphasized actions appropriate for a tele-tsunami. This
last choice may have been influenced by the fact that since the Indian Ocean
tsunami of 2004, Ucluelet has experienced two tsunami alerts without a
subsequent tsunami. Furthermore, unlike some other Pacific Northwest
communities, Ucluelet has no tsunami sirens. Therefore, a brochure that visually
emphasizes actions for a tele-tsunami is perhaps more appropriate. Choosing to
include the second assembly area in the centre of the town, as the
recommended brochure proposed, would create an undesirable logistical
challenge in future tele-tsunami scenarios. The chosen assembly area is the
community‟s high school, where the other recommended assembly area is a
remote road, with the nearest public building a small lighthouse that is close to
the hazard zone. It is interesting to consider that the local officials‟ decision not to
use the scientist-recommended assembly areas may have in fact been the better
solution.
3.4.1 Educational evacuation map practices and tsunami resilience
According to the NTHMP‟s five points that define the characteristics of a
resilient community (see Introduction), Ucluelet‟s scientifically informed tsunami
assessment information helped local officials to “have the tools they need to
mitigate the tsunami risk”. Ucluelet‟s adoption of the brochure evacuation map
tool reflected the “exchange [of ways to communicate] information [to the public]
with other [tsunami vulnerable communities in Washington and Oregon]”.
However it is difficult to make the case that the brochure “[disseminates]
information about the tsunami hazard”, while maximizing the public‟s ability to

64
“understand the nature of the hazard”. The brochure provides some essential
information, but does it provide enough?
The public may have many questions that are not answered by Ucluelet‟s
evacuation map brochure, the scientifically recommended brochure, or any other
community brochures in Washington and Oregon. Some examples of these
questions are: how quickly must a person move to avoid the tsunami? Are there
certain areas that require running versus walking? Is there time to help others
along the way to reaching safe haven? If a person is in a low-lying area is too far
from a safe area, are certain areas within the hazard zone safer than others? Will
the tsunami arrive at significantly different times in different parts of the hazard
zone? Some of the answers are possible to deduce, but with what accuracy?
Providing clear answers may increase the resilience of a community, but require
moving beyond the current „one map‟ solution and providing supplementary
maps.
Government strategies and regional contexts have defined the current one
map paradigm in Pacific Northwest communities. The adoption of a one map
brochure solution across the Pacific Northwest represents a degree of tsunami
resilience, but is often a result of neighbouring communities adopting similar
methods. This strategy seems to reinforce single visual depictions of the hazard.
It does not maximize the public‟s ability to learn about the “nature of the hazard”.

65
3.4.2 The need to research supplementary maps
Widely disseminating a single tsunami evacuation map may be an
appropriate approach for tsunami education, but having not other community-
developed maps is not supported by research, which suggests that at least some
public would like additional tsunami hazard information.
Educational tsunami evacuation maps have not been investigated in
detail, but studies suggest that evacuation maps, along with other tools, may not
be fully effective. Studies in Washington (Johnson et al., 2002) and Oregon
(Karel, 1998) used survey methodologies to gain insight into how tsunami
education tools affected public tsunami education. Both found that existing tools
led to limited perceptions about tsunami hazards. The Washington study was
followed by citizen interviews to learn more about why tools did not have desired
effects (Johnston et al., 2005). Some respondents stated that information
disseminated about tsunami hazards was too general and in a too difficult format
to understand. One of the conclusions of the research was that information
should be better tailored to different individual needs.
Recent research in Indonesia measured the benefits of showing
evacuation scenarios similar to those presented in the public forum in Ucluelet, to
volunteers, teachers and the public. Goto et al. (2010) surveyed 40 participants
and found that they all considered the additional information to be extremely
useful. Dall‟Osso and Dominey-Howes (2010) developed a draft tsunami
evacuation map for a community in Australia where no map yet existed. They
showed 500 residents a tsunami evacuation map that included information about
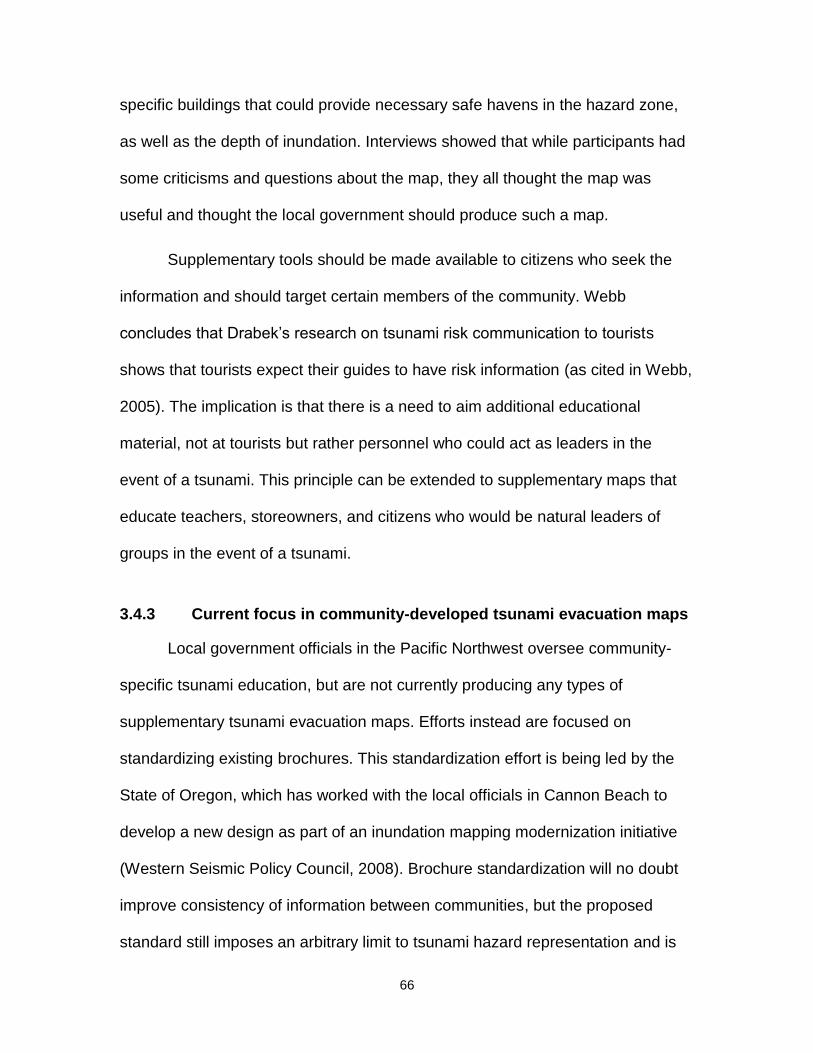
66
specific buildings that could provide necessary safe havens in the hazard zone,
as well as the depth of inundation. Interviews showed that while participants had
some criticisms and questions about the map, they all thought the map was
useful and thought the local government should produce such a map.
Supplementary tools should be made available to citizens who seek the
information and should target certain members of the community. Webb
concludes that Drabek‟s research on tsunami risk communication to tourists
shows that tourists expect their guides to have risk information (as cited in Webb,
2005). The implication is that there is a need to aim additional educational
material, not at tourists but rather personnel who could act as leaders in the
event of a tsunami. This principle can be extended to supplementary maps that
educate teachers, storeowners, and citizens who would be natural leaders of
groups in the event of a tsunami.
3.4.3 Current focus in community-developed tsunami evacuation maps
Local government officials in the Pacific Northwest oversee community-
specific tsunami education, but are not currently producing any types of
supplementary tsunami evacuation maps. Efforts instead are focused on
standardizing existing brochures. This standardization effort is being led by the
State of Oregon, which has worked with the local officials in Cannon Beach to
develop a new design as part of an inundation mapping modernization initiative
(Western Seismic Policy Council, 2008). Brochure standardization will no doubt
improve consistency of information between communities, but the proposed
standard still imposes an arbitrary limit to tsunami hazard representation and is
67
not based on empirical testing. Figure 2-6 shows a proposed brochure design
standard design for Oregon.
Figure 2-6 – The front of the proposed brochure standard in Oregon. This development that took place in Cannon Beach occurred after Ucluelet’s implementation of an educational evacuation map brochure.
68
The Cannon Beach brochure includes a worst-case tele-tsunami hazard
area, making use of the more detailed tsunami modelling that is part of Oregon‟s
inundation mapping effort. But from an educational point of view, is the inclusion
of the tele-tsunami inundation area the most important type of new information to
include in a standardized map design? Does this design complicate the message
by including too much information in a widely disseminated tool? Is this standard
the most important element on which to invest the most time and resources?
What about all the other tsunami hazard information that remains unrepresented
because only one map is produced?
3.4.4 Opportunities in the use of tsunami hazard information with evacuation maps
In BC, Washington, and Oregon, insufficient attention is devoted to
enhancing tsunami hazard representation of educational evacuation maps. The
problem is exacerbated by the lack of research on the design of even existing
evacuation maps. It is therefore necessary to clarify how supplementary
cartographic tsunami education tools might utilize available, but unrepresented
information.
We refer to Ucluelet‟s available tsunami hazard information, provided
during each stage of the tsunami hazard assessment, to identify what information
may be particularly useful and what types of cartographic abstractions may make
the information more user-friendly. Our goal is to illustrate what kinds of
information a supplementary map product may communicate for a Cascadia
tsunami scenario. The ideas are also applicable to communicating a tele-tsunami
69
scenario, as well as alternative local and tele-tsunami scenarios that were not
modelled in the case study. We limit suggested cartographic representation to
static methods, which do not rely on animations, in an effort to identify design
elements that could be part of supplementary tools independent of any particular
medium.
3.4.4.1 Using inundation results from stage 2
Inundation results from stage 2 of the tsunami hazard assessment were
only utilized in the final evacuation map brochure in confirming a generalized
worst-case inundation boundary. The animations of the inundation shown in the
public forum hold valuable temporal information, as well as information about the
height of the wave. Although the wave height information may be useful, its
temporal movement is more fundamental and arguably more important for
understanding the nature of the hazard. If citizens have no access to temporal
information, they must infer it from non-local visualizations, tsunami video
footage, or simply use their imagination, all of which could lead to
misconceptions.
Figure 2-7 is a draft of a static visualization that communicates when the
tsunami will reach the hazard area in Ucluelet. There is at least a 25-minute
difference between when tsunami first reaches the outer coast and Ucluelet
Harbour. The visualization was created by post-processing 173 frames of the
animation shown at the public forum (one of these frames is shown in Figure 2-
1). The visualization also shows the predicted affected area rather than the
generalized 15-meter contour in the brochure.
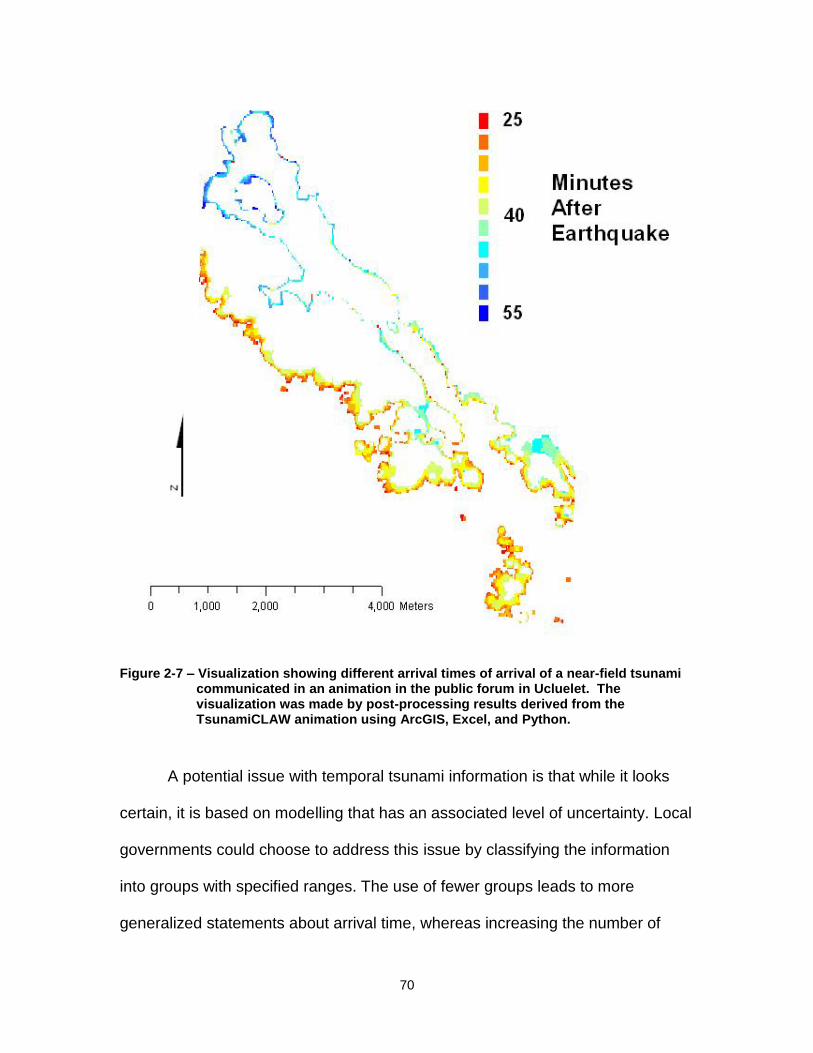
70
Figure 2-7 – Visualization showing different arrival times of arrival of a near-field tsunami communicated in an animation in the public forum in Ucluelet. The visualization was made by post-processing results derived from the TsunamiCLAW animation using ArcGIS, Excel, and Python.
A potential issue with temporal tsunami information is that while it looks
certain, it is based on modelling that has an associated level of uncertainty. Local
governments could choose to address this issue by classifying the information
into groups with specified ranges. The use of fewer groups leads to more
generalized statements about arrival time, whereas increasing the number of

71
groups provides more detailed temporal information. Figure 2-7 is an example
showing ten groups symbolized by a colour gradient.
More detail does not necessarily improve the representation. A balance
must be struck between the value of the additional information for public
education and the considerable uncertainties inherent in tsunami modelling.
Alternate scenarios could also be visualized to emphasize the uncertain nature of
the modelling.
3.4.4.2 Including safe-haven results from stage 4 and decreased terrain generalization from stage 1
Evacuation modelling in stage 4 of the tsunami hazard assessment
identified optimal assembly areas in Ucluelet in a Cascadia tsunami. The safe
havens in the final brochure are not as simple as the text implies. One particular
safe haven was not used in simulations because, although is it an island of
safety, it in fact has relatively low elevation, and does not have adequate
sheltering space for evacuees. Without explicit explanations, citizens are left to
themselves to assess the situation either before or during the event and are
unlikely to come to the same conclusions as the scientists.
Figure 2-8 shows these distinctions between assembly areas used in
simulations and further visualizes detailed terrain elevation using a colour
gradient in the safe areas. By visualizing more detail about terrain, this figure
clarifies the issue of why one of the islands of safety was not scientifically
recommended: the island of safety above the most southern assembly area has
no assembly area because of its relatively low factor of safety in elevation. The
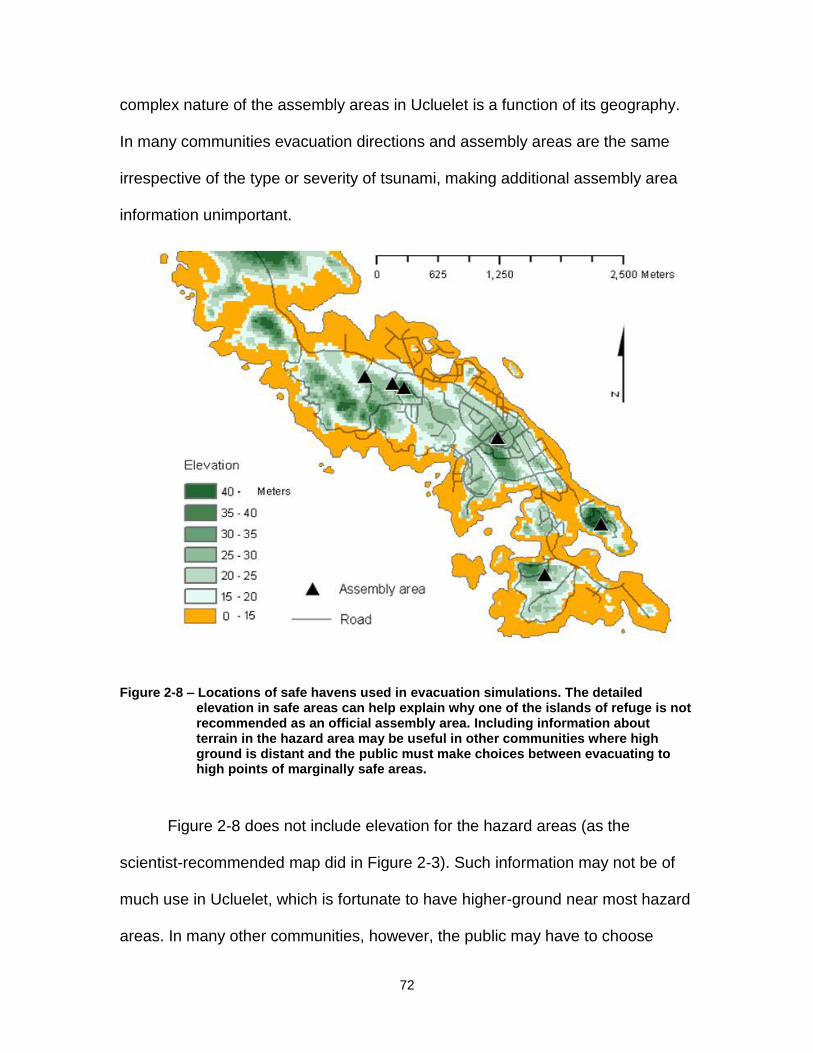
72
complex nature of the assembly areas in Ucluelet is a function of its geography.
In many communities evacuation directions and assembly areas are the same
irrespective of the type or severity of tsunami, making additional assembly area
information unimportant.
Figure 2-8 – Locations of safe havens used in evacuation simulations. The detailed elevation in safe areas can help explain why one of the islands of refuge is not recommended as an official assembly area. Including information about terrain in the hazard area may be useful in other communities where high ground is distant and the public must make choices between evacuating to high points of marginally safe areas.
Figure 2-8 does not include elevation for the hazard areas (as the
scientist-recommended map did in Figure 2-3). Such information may not be of
much use in Ucluelet, which is fortunate to have higher-ground near most hazard
areas. In many other communities, however, the public may have to choose

73
between safe haven options, none of which is optimal, but some may be safer
than others based on elevation. For such communities, a supplementary map
may also include buildings suitable for vertical evacuation. In Ucluelet, however,
there are no high buildings that are closer or safer than high evacuation points.
3.4.4.3 Visualizing evacuation results from stage 4
Evacuation information from stage 4 of the tsunami hazard assessment
was only shown during the public forum using animated outputs from the LSM
software package (moving points along roads). The final brochure symbolizes
evacuation guidance with arrows, but the arrows are not completely clear for all
locations and only apply for a tele-tsunami scenario. If more than one assembly
area were chosen in Ucluelet‟s peninsula, the directions would become
questionable. Additionally, appropriate evacuation actions not only require
knowledge of direction but also temporal information. Although users can derive
both guidance and temporal information by dividing a distance by an assumed
travel speed, or on experience, a more direct visualization reduces chances of
error and in addition, emphasizes the importance of the information.
Figure 2-9 provides an example, assuming an average walking speed of 5
km/hour to the nearest high ground via a road. Unlike the previous temporal
inundation visualization in Figure 2-7, this visualization adds no new information;
rather it makes information visible that would otherwise have to be derived. While
it is temporal information, it can also provide precise guidance information about
direction. As with temporal inundation, this visualization can also use

74
classifications to make more general statements about time. Other cartographic
options exist to express this temporal variable, such as line width.
Figure 2-9 – Visualization showing walking times in minutes along roads to the nearest high ground, defined by the 20-m contour. Areas above 20 m elevation are green. ArcGIS network analyst extension was used to create the visualization.
Similar temporal evacuation visualizations can be used to compare travel
speeds and destinations. In Ucluelet, it is possible to escape by walking to the
nearest high ground, but other communities are not as fortunate. In other
communities, temporal evacuation visualization may play a larger role in
emphasizing that in some areas, citizens must run to make it to safety, or
perhaps show temporal evacuation to non-optimal areas of safety.
75
3.4.5 Designing and disseminating supplementary map tools
Communicating all potentially relevant types of information requires more
than a single extra map. Supplementary maps could potentially be combined with
increasing levels of sophistication. Although interactive solutions might be most
suitable to communicate many types of information, static maps are also an
option. As we have shown, much relevant information can be communicated
using static maps; perhaps supplementary brochures could be produced.
Although more expensive than online maps, static brochure maps may be more
appropriate for remote communities such as Ucluelet where many citizens may
not have access to computers compared to more urban areas. Furthermore,
because community geographies are unique, standardized tsunami hazard
representation may be inappropriate for supplementary evacuation map tools.
The visualizations that we have shown are not difficult to implement. The
temporal visualization in Figure 2-7 required use of ArcGIS, Excel, and Python
scripting for temporal inundation visualization, and that in Figure 2-9 was made
with ArcGIS Network Analyst, but the same results could be produced by hand in
both cases. The scientific methodologies that create the base information could
produce these visualizations, but unless local governments embrace the value of
such information for educational purposes, it would be a waste of effort to
produce them.
Much of the tsunami hazard information we have discussed is
independent of scientific tsunami hazard information. If local officials use an
elevation contour to define a hazard area, many other types of relevant
76
information can be presented, such as information about terrain, roads, and
assembly areas, all of which can be derived from local governments‟ GIS. There
is also a wealth of qualitative geographical information known by the public that
could contribute to more advanced evacuation map tools.
3.5 Conclusion
This paper has presented a case study tsunami hazard assessment in the
context of its effect on an educational evacuation map. It has shown that both
scientific and community knowledge played only partial roles in the educational
evacuation map strategy. The totality of scientific tsunami hazard assessment
information was only shown in the public forum and not in particularly user-
friendly way. It was then simplified into a scientist-recommended brochure, and
finally, further simplified by local officials.
We argue that the resulting lack of publicly available information on
tsunami hazards can mostly be attributed to the long-standing practice of
communities in the Pacific Northwest producing just one map. The NTHMP
guidelines that define a resilient community do not support or defend the lack of
supplementary maps; rather they require local communities to innovate.
Empirical evidence suggests that supplementary evacuation maps can improve
tsunami education. Supplementary educational evacuation maps therefore
should receive more attention, not just from governments, but also from
researchers. Scientists have not yet attempted to compare the efficacy of existing
map brochures, let alone compare the educational effects of providing more
advanced evacuation maps. Generally, there seems to be no emphasis on
77
methods that evaluate tsunami education efficacy in terms of geographical
preparedness.
This paper attempts to provide an entry point for much-needed progress
and discussion of issues in educational evacuation map design. In this regard,
the local government in Ucluelet, BC Provincial Emergency Program, and the
tsunami scientists who conducted the hazard assessment, should be
commended for supporting a place for our critical cartography perspective. The
result of this cooperation is that we were able to identify relevant issues and
opportunities of evacuation map design for tsunami education in a specific
context. As we have previously emphasized, the issues raised in this case study
apply to the entire Pacific Northwest, and even more generally to the United
States and countries where communities constrain how tsunami hazard
information is presented in educational evacuation maps.
Many communities in the Pacific Northwest have scientific, and
community-based information about tsunami hazards that is un-utilized for
education. As tsunami science becomes more sophisticated, further
experimenting must be undertaken in how it is represented to the public.
Innovations in tsunami education require simultaneous support from tsunami
scientists, governments, and local communities. If one community successfully
implements one of more supplementary tsunami evacuation map tools, other
communities might adopt this strategy. Such a course of action would represent
the true essence and power of tsunami-resilient communities.
78
3.6 References
Anderson P., and Gow G.A. (2004). Tsunamis and coastal communities in British Columbia: an assessment of the B.C. tsunami warning system and related risk reduction practices. Retrieved from Government of Canada Publications website: http://publications.gc.ca/site/eng/267201/ publication.html
Bernard E. (2005). The U.S. National Tsunami Hazard Mitigation Program – a successful State–Federal partnership. Natural Hazards, 35, 5–24.
British Columbia Provincial Emergency Program (2001). British Columbia tsunami warning and alerting plan. Retrieved from Ministry of Public Safety and Solicitor General website: http://209.87.31.75/hazard_plans/ tsunami2001/Tsunami_Warning_and_Alerting_Plan-2001.pdf
CBC. Shock wave: surviving North America’s biggest disaster (2008). Vancouver, BC: Canadian Broadcasting Corporation and Omni Film Productions Ltd.
Clague J. J., Bobrowsky P. T., and Hutchinson I. (2000). A review of geological records of large tsunamis at Vancouver Island, British Columbia, and implications for hazard. Quaternary Science Reviews, 19, 849–863.
Clague J.J., Munro A., and Murty T. (2003). Tsunami hazard and risk in Canada. Natural Hazards, 28, 435–463.
Dall‟Osso, F.,and Dominey-Howes, D. (2010). Public assessment of the usefulness of ”draft” tsunami evacuation maps from Sydney, Australia – implications for the establishment of formal evacuation plans. Natural Hazards and Earth System Sciences, 10, 1739–1750 doi:10.5194/nhess-10-1739-2010.
Dengler L. (2005). The role of education in the National Tsunami Hazard Mitigation Program. Natural Hazards, 35, 141–153.
George D.L., and LeVeque R.J. (2006). Finite volume methods and adaptive refinement for global tsunami propagation and inundation. Science of Tsunami Hazards, 24(5), 319–328.
George D.L. (2006). Introduction TsunamiClaw user’s guide. Available at http://www.amath.washington.edu/~rjl/pubs/icm06/TsunamiClawDoc.pdf
Gonzalez F.I., Titov V.V., Mofjeld H.O., Venturato A.J., and Newman J.C. (2001).The NTHMP inundation mapping program. In Proceedings of the International Tsunami Symposium 2001. National Tsunami Hazard Mapping Program Review Session, R-2, Seattle, WA, 7–10 August 2001, 29–54.
79
Gonzalez F.I., Titov V.V., Mofjeld H.O., Venturato A.J., Simmons R.S., Hansen R., Combellick R., Eisner R.K., Hoirup D.F., Yanagi B.S., Yong S., Darienzo M., Priest G.R., Crawford G.L., and Walsh T.J. (2005). Progress in NTHMP hazard assessment. Natural Hazards, 35, 89–110.
Goto Y., Ogawa Y., and Komura T. (2010). Tsunami disaster reduction education using town watching and moving tsunami evacuation animation – trial in Banda Aceh. Journal of Earthquake and Tsunami, 4(2), 115-126.
Jonientz-Trisler C., Simmons R.S., Yanag B.S., Crawford G.L., Darienzo M., Eisner R.K., Petty E., and Priest G.R. (2005). Planning for tsunami-resilient communities. Natural Hazards, 35, 121–139.
Johnson D., Paton D., Houghton B., Becker J., and Crumbie G. (2002).Results of the August-September 2001 Washington State tsunami survey. New Zealand Institute of Geological and Nuclear Sciences, Science Report 2002/17, Lower Hutt, New Zealand.
Johnson D., Paton D., Crawford G., Ronan K., Houghton B., and Buergelt P. (2005). Measuring tsunami preparedness in coastal Washington, United States. Natural Hazards, 35, 173–184.
Johnstone W.M., and Lence B.J. (2009). Assessing the value of mitigation strategies in reducing the impacts of rapid-onset, catastrophic floods. Journal of Flood Risk Management, 2, 209–221.
Karel A. (1998). Oregonians need more information about tsunamis to save lives. Oregon Geology, 60(3), 56.
Kryzanowski K. (2006).Tsunami Integrated Preparedness (TIP) Project. 19th Annual Emergency Preparedness Conference, Pacific Northwest Preparedness Society, Vancouver, BC.
Kurowski M.J., Hedley N., and Clague J.J. (in press). An Assessment of Educational Evacuation Map Designs in Washington and Oregon. Natural Hazards.
Oregon Department of Geology and Mineral Industries (2008). Tsunami evacuation brochure for Cannon Beach/Arch Cape, Oregon, 2 pp.
Robinson A.H., Morrison J.L., Muehrcke P.C., Kimerling A.J., and Guptill S.C. (1995). Elements of cartography (6th edition). New York: Wiley.
Slocum T.A., McMaster R.B., Kessler F.C., and Howard, H.H. (2003). Thematic Cartography and Visualization. Upper Saddle River, New Jersey: Prentice Hall.
80
Walsh T.J., Caruthers C.G., Heinitz A.C. III., Myers E.P., Baptista A.M., Erdakos G.B., Kamphaus R.A. (2000).Tsunami hazard map of the Southern Washington coast: modeled tsunami inundation from a Cascadia subduction zone earthquake. Washington Department of Natural Resources, Seattle, WA.
Webb T. (2005). Review of New Zealand‟s preparedness for tsunami hazard, comparison to risk and recommendations for treatment. Client Report 2005/162, Institute of Geological and Nuclear Sciences Limited, 119 pp.
Western States Seismic Policy Council (2008). 2008 Annual Report. Retrieved from the Western States Seismic Policy Council website: http://www.wsspc.org/resources/Annual%20Reports/08_AR_FINAL.pdf

81
Chapter 4: Conclusions
4.1 Summary
The goal of this thesis was to examine the social influences in current
educational tsunami evacuation maps in BC, Washington, and Oregon. The
thesis has successfully accomplished this goal through its two research
components.
Chapter 2 addressed the lack of a prevailing structure in current
evacuation map practices. Cartographic abstraction principles were applied to
compare and contrast the information content of 38 evacuation map brochures in
Washington and Oregon. Six types of tsunami hazard information were identified
and compared: (1) tsunami hazard zone, (2) road network, (3) assembly areas,
(4) evacuation guidance, (5) infrastructure and, (6) terrain. Cartographic
abstraction principles were further used to situate the design of a new Google
Maps evacuation map developed by Oregon. Satellite information was identified
as an additional information type within the Google Maps tool. The cartographic
abstraction of the Google Maps tool was compared to the brochures.
The research component assessed the limitations of current and
developing evacuation map strategies in Washington and Oregon. The
assessment provided a framework to discuss how socially based cartographic
decisions affect evacuation map designs. It argued that, while evacuation map
developments focusing on standardization and new interactive solutions may be

82
helpful, they avoid focus on socially guided information content design. Current
efforts are therefore not explicitly investigating the increase of public access to
community-scale tsunami hazard information. Previous studies in Washington
and Oregon suggest the need to provide the public more detailed information.
Through the process of the evacuation map assessment, many opportunities for
increasing information in future evacuation map developments were identified.
Chapter 3 focused on the evacuation map development process. It used
the case study of Ucluelet to describe how tsunami assessment information was
incorporated into an educational evacuation map strategy. This process involved
scientists presenting tsunami hazard assessment results in a public forum,
recommending an evacuation map design to the local officials, and, finally, local
officials using this information to implement an alternative evacuation map
design. Cartographic abstraction principles were applied to describe the tsunami
hazard information of scientist-recommend and local government implemented
evacuation map designs in relation to available tsunami hazard assessment
information.
The research provided insight into the how social factors affect evacuation
map design during development. It argued that the concept of resilience, which
encourages communities to borrow existing types of tools from neighbours,
depends on innovation at the community level. In the case of evacuation maps,
communities must think beyond the current „one map‟ brochure solution. Growing
evidence in tsunami education studies and, more recently, tsunami evacuation
map studies supports the approach of developing more than one evacuation
83
map. To illustrate potential uses of more advanced evacuation maps, this
research identified the potential educational benefits of information that remain
unused in Ucluelet and communities of Washington and Oregon.
4.2 Research contributions
This thesis is a first assessment of how social decisions influence the
design of educational tsunami evacuation maps. Further, the thesis provides a
first study of how social decisions of community mapmakers influence the use of
available tsunami hazard information in an evacuation map production process.
These research contributions were accomplished by using cartographic
abstraction principles (long-established concepts within cartographic literature)
and demonstrating how they are embedded within tsunami evacuation maps in
current use.
Both the assessment and case study components of the thesis introduce
cartographic abstraction principles as both a conceptual framework and basis for
tsunami hazard communication design. Cartographic abstraction principles are
implicit within mapping practices. A better understanding of their role, and how
they might be leveraged opens up new territory for discussion of how social
decisions of communities‟ mapmakers mediate the use of tsunami science to
produce evacuation maps. The resulting framework is specific to tsunami
evacuation map design and may be useful to both governments and researchers
because these two groups must work together to advance research about
tsunami evacuation maps.
84
This thesis argues that recognizing the social nature of evacuation maps
is an important part of addressing socially determined issues in tsunami
mitigation. Progress in tsunami evacuation mapping that aims at tsunami
resilience must bring together the combined resources of science, governments,
communities and citizens. In practice, the most influential stakeholders are the
local government officials who oversee tsunami evacuation map development.
Local governments need to better understand information design issues that are
specific to evacuation maps if they are also to develop other novel ways of
delivering tsunami hazard information in educational tsunami evacuation maps.
Improving any type of hazard maps requires challenging the status quo
and choices of organizations that produce them (such as governments and
mapping agencies); hazard maps are rhetorical and can serve the producers‟
ulterior agendas (Monmonier, 1997). By critiquing current practices in
educational tsunami evacuation map design, this thesis has emphasized that
issues do not stem from a lack of scientific information. There needs to be a
desire to better understand the use of this information by a range of stakeholders
(citizens, planners, and others), matched by sustained effort to pursue these
challenges.
This thesis began with a BC government response to the Indian Ocean
tsunami of December 26, 2004. It now ends with another devastating tsunami in
Japan on March 11, 2011. The findings and recommendations of this research
aim to enable a deeper understanding of the nature of tsunami maps, and inspire

85
innovation in their future design in Canada, the US, and other tsunami-vulnerable
regions.
4.3 Future directions
This thesis provides theoretical foundations for applied research on the
socially situated and cartographically transformed information design of tsunami
evacuation maps. Many important questions exist about how current and
alternative choices in educational tsunami evacuation maps designs specifically
contribute to tsunami education.
Interviewing citizens about evacuation maps would be useful in
establishing citizens‟ perceptions of existing evacuation map designs, current
developments, and the future role of maps in tsunami education. It is likely that
many citizens do not understand current evacuation maps, (and possibly any
type of maps). It is also likely that a significant number of citizens would find
more advanced, supplementary evacuation maps useful. Acquiring detailed
information about citizen perceptions and „usability‟ data for tsunami maps would
help inform refinement of existing maps, and the development of supplementary
maps.
Adding interaction to natural hazards mapping may afford users the ability
to interactively explore the effects of specific circumstances (Monmonier, 1997),
but to date, interactive tsunami evacuation maps in the Pacific Northwest have
only been applied through a Google Maps application. This use of Google
technology relies on modifying a tool normally designed for different purposes –
86
an approach that does not specifically tailor cartographic representation or
interaction to the unique needs of tsunami education. Extending on the
cartographic concepts operationalized in this thesis, future research will be
required to evaluate the influence of the many possible combinations of tsunami
representation, visual communication and interaction with tsunami hazard
information.
Moving beyond the existing single-map paradigm with supplementary
maps will likely reveal new challenges and questions. Once a supplementary
map is ready for deployment, are there any issues with making it too accessible
to anyone? Is it more effective to advertise it as available to those citizens who
are interested, or should certain target citizens that have specified roles in
communities be recruited? If there are multiple maps produced, will citizens need
to see all of them? If so, how can we ensure this happens in communities?
Supplementary evacuation maps not only benefit from unused scientific
tsunami hazard information, but also from existing geographical knowledge of
citizens in tsunami-prone communities. Research on creating evacuation maps
based on public knowledge could borrow methodologies from participatory
methods of socio-behavioural decision-making with maps and Geographic
Information Systems (for example Miles, 2011; Nyerges et al., 2002). It is
possible that the act of making an evacuation map that involves citizens will be of
greater value than the resulting map product. This might be the case if, for
example, the resulting map product does not provide much new useful
87
information, but the process of creating the map establishes greater trust
between citizens and their local government.
Utilizing scientific and public geographical knowledge about tsunami
hazards also requires researching tools that can communicate the breadth of
available knowledge through information structures that do not depend so much
on citizens‟ abilities to understand the cartographic abstractions. New efforts are
currently underway at the Spatial Interface Research Lab at Simon Fraser
University to create mobile augmented reality interfaces. These interfaces may
improve tsunami evacuation education with the ability to directly overlay tsunami
hazard information, evacuation information and risk maps onto views of the real
world using everyday mobile devices (such as smartphones and tablets). By
enabling citizens to draw upon these types of maps in situ, it may be possible to
facilitate an unprecedented new level of connection between spatial analysis and
real geographic environments, and in doing so, reduce the cognitive demands on
citizens to transpose tsunami information from 2D paper maps into everyday first-
person situational awareness. Less technologically dependent approaches might
involve directly marking information onto the community (such as „hazard
contours‟ or colour-coded evacuation routes). Any strategies that rely on less
abstraction could be especially relevant for citizens who would like more
information, but are not capable map-readers.
All future developments in tsunami evacuation mapping require the
support of local governments and the implementation of collaborative research
initiatives. The role of tsunami education researchers will be to propose and

88
structure these developments, and evaluate new tools and strategies. This must
be done in a context that is defined by the characteristics of tsunami hazards, the
needs and venues of citizens using tsunami hazard information, and through
partnerships between stakeholders.
4.4 References
Miles, S.B. (2011) Participatory model assessment of earthquake-induced landslide hazard models. Natural Hazards, 56, 749–766.
Monmonier, M. (1997) Cartographies of Danger: Mapping Hazard in America. Chicago: University of Chicago Press.
Nyerges, T., Jankowski, P., and Drew, C. (2002). Data-gathering strategies for social-behavioural research about participatory geographic information system use. International Journal of Geographical Information Science, 16, 1–22.