visualizing the value of service-based offerings ...547103/fulltext01.pdf · 1 abstract purpose –...
TRANSCRIPT

This is a so-called personal version (author's manuscript as accepted for publishing after the review process but prior to final layout and copy editing) of the article. Kindström, D., Kowalkowski, C. & Nordin, F., 2012, ' Visualizing the Value of Service-based Offerings – Empirical Findings from the Manufacturing Industry ', Journal of Business & Industrial Marketing, vol. 27, no. 7, pp. 538-546. Readers are kindly asked to use the official publication in references.
Visualizing the value of service-based offerings – Empirical findings from the manufacturing industry
Daniel Kindström, Corresponding author Department of Management and Engineering, Linköping University Email: [email protected] Christian Kowalkowski Department of Marketing, Hanken School of Economics Email: [email protected] Fredrik Nordin Department of Business Administration, Stockholm University Email: [email protected]

1
Abstract
Purpose – The purpose of this paper is to explore strategies for visualizing the value of
service-based offerings in a B2B context. By taking a process perspective on the offering
life cycle, this paper also aims at distinguishing which visualization strategies are most
appropriate using at which life-cycle stages.
Design/methodology/approach – The study employed a qualitative, multiple-case study
research design involving five manufacturing firms.
Findings – Primary findings are that firms need to make use of several different
visualization strategies depending on, among other things, the key stakeholders and also
where the firm’s offering currently is positioned in the service-based offering life cycle.
Research limitations/implications – While the empirical data is from only one sector -
manufacturing - managers from other B2B sectors should have an interest in the results
and the key aspects identified. Further research could also establish linkages to
performance metrics.
Originality/value – Visualization strategies have been relatively little studied from a
B2B perspective, and the process dimension, especially, is novel.
Key words – Visualization, Value, Services, Offerings, Tangibilization, Manufacturing
Paper type – Research paper

2
1. Introduction
Many manufacturing firms, as well as firms in other industries, are currently extending
their traditional product-based offerings by adding service elements (e.g., Kowalkowski
et al., 2011; Raddats and Easingwood, 2010; Fang et al., 2008), but creating offerings
with high service content is only one part of moving towards a service-oriented business.
Another significant factor is communicating the value of the new offerings to the
customers successfully to convince them of the benefits of the new service-based
offerings as compared to old product-based offerings (Anderson et al., 2007).
Traditionally, firms have been proficient in communicating and illustrating the value of
their product-based offerings while, for their part, customers are also competent in
receiving such messages, and understanding the value of physical products. But both
sides often run into problems as they enter the service domain, since communicating the
value of services is often more difficult and complex due to, among other things, the
intangibility of the service performance (Mittal 1999; Berry and Clark, 1986).
Furthermore, the dimension of the supplier-customer relationship, in which the two have
established the value interactively, is difficult to measure and visualize in monetary terms
(cf. Ramírez 1999). Interest in how to communicate the value of services has been
growing and several scholars have raised calls for more research in this area (e.g.,
Stafford and Stafford, 2000; Tripp, 1997).
As firms change their value propositions by enhancing their product offerings with high-
value services (Gebauer and Kowalkowski 2011; Jacob and Ulaga 2008; Matthyssens and
Vandenbempt, 2010), they need the capability to communicate the value of these new
service-based offerings, a capability which this research labels visualization.
Visualization enables firms to illustrate, demonstrate and communicate the value of their

3
offerings, and involves utilizing various so-called visualization strategies to form an
understanding of the value before, during, and after the service interaction/process.
Porter (1985) argues that firms that are better at signaling - or visualizing - the value of
their value propositions can command higher prices in the market, confirming
visualization as an important capability for firms. Managing these market signals, or
evidence (Shostack, 1982), requires specific skills, actors and methods, and is considered
as being included within the concept of visualization (Berry and Clark, 1986).
In this paper visualization is forwarded as an approach to understanding how firms can
develop ways to address customers and show on the value of their offerings. Existing
research in the area tends to focus on traditional service firms (e.g., Hill et al., 2004;
Mittal, 1999) and there is a research gap in the area of B2B marketing (e.g., Caceres and
Paparoidamis, 2007). Visualization in B2B marketing tends to be limited to what Berry
and Clark (1986) call documentation strategies, and has an external focus, geared mainly
towards selling (cf. Anderson et al., 2007). But visualization as a whole is a broader
concept, and includes how firms visualize the value of their offerings not only to
prospective and existing customers during a sales process, but also both internally and to
other actors in the extended business network. Firms furthermore need to address the
visualization of an offering in all stages of an offering’s life cycle (Kindström and
Kowalkowski, 2009) and not just the sales stage.
Using in-depth case studies from five manufacturing firms, we explore the concept of
visualization and how firms could use it more than they do today to facilitate the
implementation and marketing of new service-based offerings. The purpose of this paper
is two-fold. First, it promotes the concept of visualization in the context of the service-
based offering’s life cycle; second, it explores how firms use visualization strategies
when attempting to establish service-based offerings on the market.

4
2. Theoretical framework
Value from services is often perceived to be more difficult to visualize than for products
due to the intangibility of service performance, especially prior to purchase (Anderson et
al., 2007; Hill et al., 2004; Mittal, 1999). This is accentuated by the relative immaturity
of traditional product suppliers and buyers in providing and using services (Lindberg and
Nordin, 2008). Similarly, the actual interaction during service delivery is often crucial for
service performance (Normann, 2001) but visualizing a future interaction and its value
creation potential for a prospective buyer is not straightforward. This intangibility makes
it difficult for customers to understand the service at both the pre-purchase and also the
post-purchase stage (Legg and Baker, 1987) and it can make it difficult for customers to
differentiate between services. As the balance of firms’ offerings changes towards
increased service content, the visualization of service value is becoming increasingly
important.
2.1 Visualizing the value of service-based offerings
Trying to understand what value different offerings contribute, what customers expect
from these offerings, and ultimately what value they should visualize it is possible to
identify three broad value-categories; Product-based, Service-based, and Relationship-
based value (Ulaga and Eggert, 2006; Lapierre, 2000). Product-based value is what most
suppliers have traditionally focused on, and are good at visualizing: typical value
parameters include product performance, quality and price, which have a history of being
order winners and are where many firms still tend to put heavy emphases. Service-based
values are more difficult to evaluate and quantify, due to among other things their
intangibility, which makes them harder to visualize. Since many firms have traditionally
regarded services as add-ons, and even given them away to close product deals
(Anderson and Narus, 1995; Mathieu, 2001), customers have often been able to gain
5
these values - whose typical parameters include operation costs, customization and
performance consistency - free of charge. Finally, relationship-based value is based on
how the supplier and customer maintain their relationship over time (Grönroos, 1997).
Wilson and Jantrania (1994) for example define relationship value as the outcomes of a
collaboration that enhance competitiveness. As in service-based value, relationship-based
value is often idiosyncratic and process-oriented, which makes it more difficult to
visualize, and is therefore often neglected in (for example) formal contracts: its typical
value parameters include pro-activity, trust and long-term commitment (Wilson and
Jantrania, 1993).
Szmigin (1993), in the research on service quality, revealed that different service quality
elements come into play at different times in the supplier-customer relationship
suggesting that so-called process and outcome related elements are emphasized in mature
relationships. This implies that more traditional, product-based, visualizations may be
more important in winning new customers than in retaining existing customers, thus
implying that service- and relationship-based visualizations may be central for cultivating
and further developing existing relationships, where established customers perceive
offerings as part a relational process (Tuli et al., 2008).
The creation and communication of value has been the focus in a number of studies
(Anderson et al., 2007; Lapierre, 2000; Grönroos, 1998; Woodruff, 1997). Anderson et
al. (2007) in particular discuss how to convey value to customers in B2B markets. They
propose three different strategies suppliers can use: All benefits where the supplier simply
list all potential benefits they believe their offering can deliver to the customer,
Favorable points-of-difference where the supplier explicitly recognizes that the customer
has alternatives and tries to list those points-of-difference between their own and
competitors’ offerings, and Resonating focus where the supplier tries to communicate

6
those benefits the customer really appreciates and needs: although this is the most
difficult strategy to manage - due to the customer and competitor knowledge required -
the resonating focus value proposition has the greatest potential. In the context of an
offering, simply listing all potential benefits is not sufficient when service content is
increased and offerings are becoming more complex. Instead, firms need to align their
communication with their customers’ actual needs. Similarly, the move from internally
focused, all benefits value propositions to a more resonating focus requires more and
better customer knowledge, since the value proposition becomes more and more
customized and includes a higher service content.
2.2 Visualization strategies and intangibility
Previous research has emphasized the fact that services need to be made more tangible
and product-like as deserving special attention when visualizing their value (Berry and
Clark, 1986; Berry and Parasuraman, 1991; George and Berry, 1981). Studies of service
advertising have also found that service marketers often provide more factual
information, or cues, than for products, and that this tendency is emphasized the more
intangible a service is (Tripp, 1997; Grove et al., 1995). In addition, visualization must
not be limited to advertising and promotional activities, as tends to be the case in B2C
marketing, but (in line with Grönroos’ (2009) views on marketing) should involve all
marketing activities and support value creation for both customer and supplier.
To understand how to visualize the value of services to different actors and in different
situations, firms can make use of so-called ‘tangibilization strategies’ (Berry and Clark,
1986; Hill et al., 2004; Mittal, 1999): four general strategies have been proposed for
conveying the value of a services; Envisioning, Association, Documentation and
Representation (see Table 1). Although Berry and Clark (1986) use the term visualization
for a specific strategy, this research gives the term a broader compass covering all four

7
strategies, with Envisioning equating to what Berry and Clark, in their research, label
visualization.
Table 1. Four tangibilization strategies (Berry and Clark, 1986; Hill et al., 2004).
Tangibilization strategy
Meaning
Envisioning (Visualization)
Using vivid cues in order to persuade customers and to make them experience the service mentally. It evokes a clear and vivid mental image of the positive outcomes associated with the service.
Documentation Providing relevant information about key attributes, features and benefits of the service in three types: 1) Consumption (concerning the activity of customers in consumption the service), 2) System (including facts and statistics pertain to the service delivery system), and 3) Performance documentation (e.g., reference cases and cost calculations).
Association Linking an object, place or a person to the service (e.g., John Deere’s deer and Scania’s griffin).
Physical representation
Focusing on core attributes that are direct or peripheral parts of the service (e.g., buildings, vans, and employees).
In addition to the above - but also implicitly part of both Envisioning and Documentation
- two other strategies have been proposed that take the interactive nature of services into
account; Performance episode strategy and (from a customer perspective) Service
consumption episode strategy (George and Berry, 1981; Mittal, 2002). These two
explicitly put focus on the delivery and consumption interactions that are pivotal for most
services. Furthermore, George and Berry (1981) argue that it is also important that
visualization activities are focused both internally and externally (i.e., address employees
as well as customers).
2.3 Visualization strategies in the service-based offering life cycle
Using a generic service-based offering life cycle framework based on four stages -
market sensing, development, sales, and delivery (Kindström and Kowalkowski, 2009) -
this research attempts to widen the scope of visualization to include all stages of a
service-based offering life cycle. This adds a process dimension to the research on

8
visualization strategies, which has hitherto predominantly been externally oriented, and
with a focus on sales activities. Table 2 offers a brief description of the different stages.
Table 2. A stage model for the service-based offering life cycle (Kindström and
Kowalkowski, 2009).
Stage Description/rationale 1. Market sensing A continuous process taking place within the firm and in dialogue with customers.
Although the customer is in focus, sensing developments in internal business units and the wider business network is also needed.
2. Development Development requires the involvement of customers and several functions, notably both front- and back-end, including more cross-functional and intra-organizational elements and coordination aspects than for product development. It should involve the local organization and its front-line employees during all steps of this stage (e.g., idea generation, concept development, and pilot study).
3. Sales It is essential to help customers appreciate the distinctiveness and benefits of the new offering, so front-line employees must have sufficient knowledge to sell the service convincingly. Firms often emphasize design and definition of new services, but seldom put much effort into developing tangible actions for how to commercialize, and to scale up, new services.
4. Delivery It is in the delivery stage that the difference between products and services become most evident. Services are created interactively with the customer during the delivery process, and are often highly localized. If services are to be delivered effectively and efficiently, a service infrastructure needs to be in place, which will often be very different from a product delivery infrastructure
By combining research on visualization strategies and the offering life cycle this research
aims to increase understanding in how and where in that life cycle firms can use which
visualization strategy(ies).
3. Methodology
Since the purpose of this research is explorative and context-bound, a qualitative case
study approach was adopted (Eisenhardt and Graebner, 2007). Case study research,
including interviews, is a suitable method for identifying patterns and achieving a
methodological fit for nascent theory (Edmonson and McManus, 2007).
The empirical data in this research is based on five market-leading capital equipment
manufacturers (see Table 3). Choosing manufacturing firms allowed us increased
construct validity, but at the same time may limit the possibilities of generalizing our

9
results to other contexts, although a strategy of replication in multiple empirical settings
was adopted in order to increase external validity.
Table 3. The case firms, their industries and typical service-based offerings.
Case firm Industry Typical service-based offerings Alpha Gas supply Automatic gas supply, liquid management, process
management services and solutions Beta Garden and forestry
equipment Extensive service and support contracts with uptime guarantee
Gamma Fluid handling Customized service level agreements, systems engineering, rental
Delta Mining equipment Lifecycle services, capacity-related and gain-sharing agreements
Epsilon Buses and bus chassis Vehicle and transportation management, extended coverage contracts, uptime contracts
The empirical data comes primarily from two sources; individual interviews with
managers from both case firms and their customers, and focus groups (discussion based
interviews with several respondents simultaneously) with representatives from all case
firms. Purposive sampling was used for each of the cases in order to access highly
knowledgeable respondents (cf. Eisenhardt and Graebner, 2007) and the interview
questions were open-ended and allowed the respondents to formulate their answers in
their own words. Using respondents form different firm functions and at different
hierarchical levels (including customers), as well as external and internal documents,
allowed us to triangulate our empirical data and thus increase validity and the reliability
of our results. Iterating between several rounds of interviews and focus group sessions
enabled the research to be firmly grounded in the managers’ problems, and also enabled
researchers to discuss the cases and preliminary results continuously. Most interviews
and focus group sessions were taped and transcribed and selected respondents validated
the case descriptions to ensure accuracy and avoid misinterpretations.
In the analysis process data was grouped into themes and regrouped following a
systematic combining process (Dubois and Gadde, 2002) based on the theoretical frame

10
of reference. Pattern matching with the theoretical constructs (Gibbert et al., 2008), based
on the offering life cycle and the visualization concept, was conducted for each case
before making cross-case comparisons. This was done to ensure internal validity (Yin,
2003).
4. Discussion – Visualization strategies in practice
It was evident in all the firms that the value of traditional product offerings have been
relatively easy to communicate, both internally and towards customers, because the focus
was on product-related and essentially factual values, using (primarily) a Documentation
strategy. However, as firms move towards increased service provision it becomes
difficult to determine not only what value to communicate but how to visualize it. Having
the capability to visualize new service-based value, and adopt multiple visualization
strategies, is regarded as central for succeeding with service-based offerings – but is
something that all firms, to various degrees, find challenging.
Since services are inherently seen as intangible - except for the often tangible results and
customer experiences (Lovelock and Gummesson, 2004) - it becomes difficult to produce
‘product-like’, all-benefits fact sheets that convey the full meaning of offering with high
degrees of services before use. Similarly, it is more difficult to demonstrate potential
customers of the value of a service than of a product, both because a service is likely to
have a significant interactive element, but also because of the inexperience of many
buying organizations in evaluating services (Lindberg and Nordin, 2008).
So suppliers need to find new and persuasive ways to translate intangible arguments into
unique selling points, to establish a resonating focus with their customers (cf. Anderson
et al, 2007), and to demonstrate the value of long-term commitment and trust.
Mechanisms such as role plays, simulations, stories, interviews and case studies are all
11
used by the firms in this research, reinforcing the view that a traditional single focus on
Documentation strategies is insufficient.
4.1. Visualization strategies throughout the offering life cycle
The visualization strategies used by the firms differ depending on the life cycle stage of
the offerings. The following sections elaborate and discuss each stage in detail, as well as
referring to the literature to further develop and explain our findings.
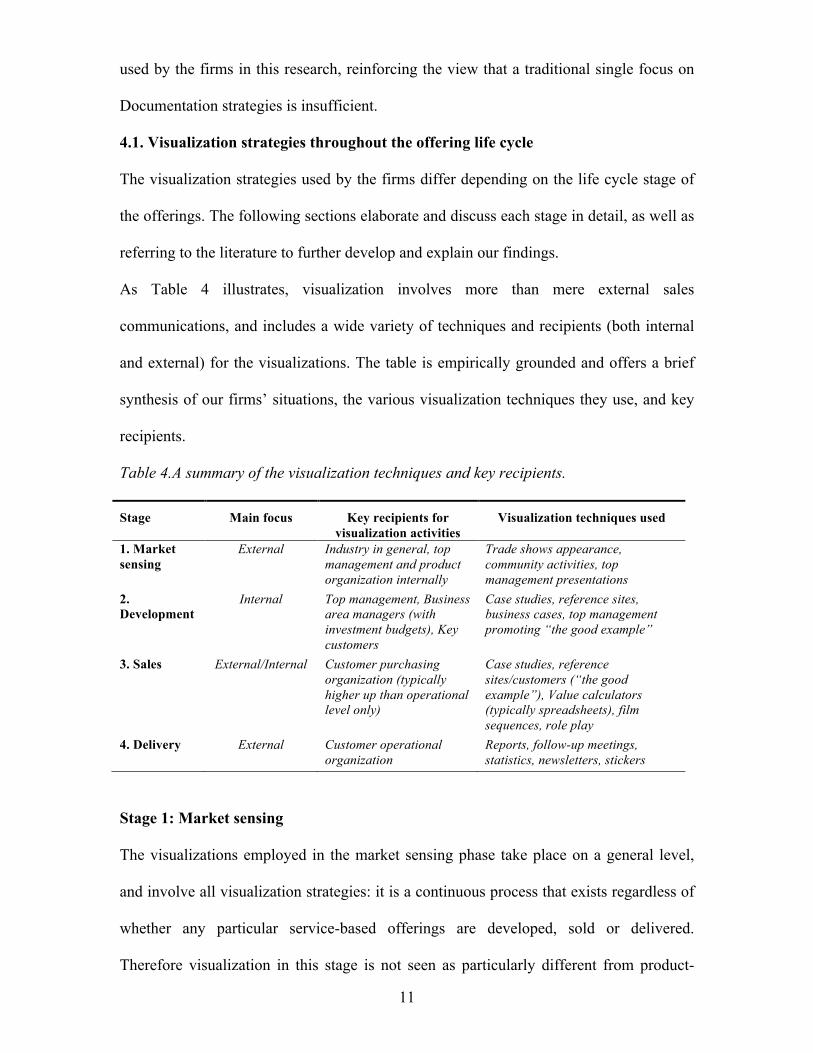
As Table 4 illustrates, visualization involves more than mere external sales
communications, and includes a wide variety of techniques and recipients (both internal
and external) for the visualizations. The table is empirically grounded and offers a brief
synthesis of our firms’ situations, the various visualization techniques they use, and key
recipients.
Table 4.A summary of the visualization techniques and key recipients.
Stage Main focus Key recipients for visualization activities
Visualization techniques used
1. Market sensing
External Industry in general, top management and product organization internally
Trade shows appearance, community activities, top management presentations
2. Development
Internal Top management, Business area managers (with investment budgets), Key customers
Case studies, reference sites, business cases, top management promoting “the good example”
3. Sales External/Internal Customer purchasing organization (typically higher up than operational level only)
Case studies, reference sites/customers (“the good example”), Value calculators (typically spreadsheets), film sequences, role play
4. Delivery External Customer operational organization
Reports, follow-up meetings, statistics, newsletters, stickers
Stage 1: Market sensing
The visualizations employed in the market sensing phase take place on a general level,
and involve all visualization strategies: it is a continuous process that exists regardless of
whether any particular service-based offerings are developed, sold or delivered.
Therefore visualization in this stage is not seen as particularly different from product-

12
based offerings, so this research only treats it relatively little and does not elaborate on it.
Key aspects of visualizations in this stage include the creation of internal leverage
through for example, service-oriented change champions, and building a brand that can
be associated with service values, thus involving not only ‘passive’ market sensing but
also opportunity shaping (cf. Normann, 2001; Teece, 2007). Epsilon for example uses top
level managers to visualize, through Association and Envisioning strategies, their focus
on service-based offerings and the importance of these offerings not only for the future
brand but for the entire industry. Furthermore, they visualize, through a Documentation
strategy, their commitment publicly in their annual reports and in their vision statements.
Stage 2: Development
The development stage has a tendency to revolve primarily around internal visualizations
in an attempt to find support for the development of new services within the firm. This
focus is based on the fact that most firms operate in a rather product-oriented culture, and
support for services is still difficult to gather. The firms that offer services as part of an
offering often supply them for free in order to secure product sales. They tend to use
visualizations in attempts to expand service related sales, to convince internal sales staff
to focus on services during the coming sales process (cf. George and Berry, 1981) and to
get the go-ahead and investment decisions for various service initiatives. On the other
hand, firms developing new-to-the-firm services tend to focus their visualizations
towards external actors (primarily customers) in order to create a market pull that can be
used in turn to get internal support.
The firms are all used to discussing product-based benefits via a Documentation strategy,
but are inexperienced in terms of relationship-based and service-based benefits. They are
also relatively inexperienced in new service development (NSD), and often need to
visualize how the actual NSD process works. The Delta firm, for example, employs an

13
external advertising agency to aid in illustrating and to communicating internally how the
actual NSD process works.
An interesting approach used is storytelling; that is, developing stories around services to
increase understanding and enlist management commitment, which essentially means
combining three tangibilization strategies – Envisioning, Association and Representation.
Alpha uses storytelling internally, with stories around what can happen if the service does
not work as a way to visualize the service and its inherent interactions. Managers also use
illustrations (e.g., cartoons) – essentially combining Documentation and Envisioning – to
illustrate a sequence of activities to allow employees to gain understanding of what the
service involves without crunching numbers. But such narratives can also be used to
make the service experience more concrete for external stakeholders. Other common
visualizations seen in the firms are quotes and active promotion from top management,
translating into Association and Documentation strategies – for example, through annual
reports, firm magazines, and the communication of the ‘good example’ of a customer
using a service-based offering successfully.
Stage 3: Sales
The sales stage can be divided into two parts – pre-sales/pre-contractual part as well as
the contract negotiation part – as the visualizations used differ from the early to the later
part of the sales process. In the early part, visualization mainly consists of using cases
and reference customers to communicate the intangible aspects, primarily through a
Documentation strategy. Some of the firms also use Envisioning strategies, using feelings
and mental images in their visualizations.
During the latter part of the sales stage, visualizations tend to become more factual and
product-like, as product-based values and actual costs become more important. The focus
also shifts more towards such technicalities as delivery details, whereas early in the sales

14
stage the relationship dimension and values such as trust and long-term commitment are
emphasized, although still primarily through a Documentation strategy.
Customers often have problems understanding service-based offerings both before and
after purchase. There is the risk that customers struggle both to understand intangible
benefits, and to compare offerings from different suppliers. Addressing these issues
implies a need to develop several visualization strategies (Legg and Baker, 1987): as
noted above, a pure Documentation strategy is often not enough.
Overall, however, visualization strategies during the sales stage are still rather traditional,
and include slides, data sheets and spreadsheet applications with examples (sometimes
called demonstrators), usually centered on quantifying potential process improvements
and cost reductions in customers’ operations. While these examples can be more or less
sophisticated, they all focus on finding monetary reasons, primarily through efficiency-
focused parameters, why customers should buy an offering. Thus Gamma works with key
indicators that influence prices, such as energy consumption, wear and tear material,
capital, and output. Although they also attempt to include more intangible aspects - such
as trust - these are usually based on the nature of personal relationships. Beta uses a
number of complex spreadsheet applications to show the value creating potential of their
new service-based offerings to reduce total costs and increase total revenues for
customers. However, these are often sophisticated and difficult to comprehend.
Therefore, Beta has also developed ‘stripped down’ versions which illustrate key points,
such as customer profitability, in diagrams and graphs, and are often interactive, thus
moving beyond a pure Documentation strategy.
Findings highlight the importance of simplifying visualizations and using ‘dashboard’-
like presentations and applications where the amount of actual data is kept at a minimum
level (e.g., showing only such end-results as profitability and revenue) in line with

15
Anderson et al.’s (2007) resonating focus value proposition. This becomes even more
important when approaching financial staff and higher-level managers who do not
necessarily have detailed knowledge of their firms operating processes. More complex
visualization strategies in the sales stage include in-depth case studies from reference
customers, and advanced scenarios. Scenario discussions are becoming increasingly
widely used, particularly since computers and virtual simulations become more readily
available for almost all industries, opening the way for more advanced visualizations
covering ‘softer’ aspects such as service interactions, closing in on so-called episode
strategies (George and Berry, 1981; Mittal, 2002). As scenarios become more advanced
they also move from being Documentation towards Envisioning strategies, incorporating
more intangible aspects and being able to convey feeling, such as trust that an illustrated
solution actually will work.
Stage 4: Delivery
For a supplier, the problem with delivering many service-based offerings is to show that
they have done a good job: many of these offerings – for example, contracts for
preventive maintenance or for continuously supplying production inputs – usually tend to
go unnoticed unless something goes wrong. Suppliers need to be able to visualize the
value their offerings deliver if customers are to understand what it is they are getting.
Similarly, it is important to reinforce customers’ buying decision during the delivery
stage as well as afterwards, to confirm that they made the right decision. This becomes
even more important since service-based offerings entail a higher degree of intangible
benefits, such as trust (cf. Legg and Baker, 1987). But visualization techniques can be
comparatively straightforward: the Alpha firm use stickers that the service technicians
put up at the customer’s site to remind buyers of their presence and the value they
deliver. Two firms, Alpha and Beta, also hold regular meetings with customers where

16
they present contract summaries and usage statistics reports (i.e., using primarily
Documentation and Representation strategies) set out in ways that reinforce their position
as a long-term value partner.
Although in the delivery stage visualization is often difficult, there are many
opportunities to reinforce the relationship and to visualize relationship-based value to
increase customer retention. Beta, for example, uses reports to show actions taken and
how they provide added value during the delivery phase, and reinforce relationship-based
value via a web-based system that delivers real-time information on customer operations
and processes, for example, vehicle fleet information and spare parts management.
In this stage, Representation strategies in the firms are well developed, and include firm
brand reinforcement in service technicians’ uniforms and paintjobs on service vehicles,
which also carry specified sets of tools and spare parts. Alpha has also started to develop
guidelines for service interactions with customers, stipulating what should be done and,
to an extent, how. All this effort contributes to reinforcing the supplier’s image as being
clean, tidy, well-organized and consistent in performance.
5. Managerial implications
First, firms moving towards developing and marketing service-based offerings cannot
merely extrapolate the traditional visualization strategies they use for product-based
offerings. Managers need not only to design new visualization strategies, but also to
understand new sets of underlying values - notably relationship-oriented and outcome-
based - that build up the customer’s perceived value of the service-based offerings. Firms
too often employ methods and techniques for visualizing the benefits and values of
service-based offerings that are based on predefined templates developed for products,
but which (for the most part) are poorly suited for visualizing the value from these new
offerings.

17
Secondly, by taking the entire offering life cycle as its starting point, this research has not
only identified that several visualization strategies are necessary, but also that the focus
of visualization changes throughout the life cycle. A further implication is that it is not
enough to rely on just one specific visualization strategy for successful service
development, sales and delivery, but rather, firms should utilize several strategies to
maximize their chances of success. Here a trend is observed, in the firms, towards an
increased use of Envisioning strategies to create mental models to inspire customers and
capture their attention, and particularly to communicate intangible benefits and convey
relationship-based value early on in the relationship. However, since many buyers focus
on low-priced offerings and product-based values (Anderson et al., 2000), tangible
elements also need to be included, most notably product-like facts and various
demonstrators showing for example evidence of cost savings potentials; that is, a
Documentation strategy.
Thirdly, visualization seems to be becoming a key capability, both for winning new
customers and retaining existing ones, and is therefore a strategic resource which
managers need to pay attention to and to continuously develop if their offerings are to
compete successfully.
Although firms’ offerings change their inherent characteristics as more and more services
are included, firms still use their core product as the main leverage. It can be suggested
that visualizations that show how the service components interacts with the core product
(for example, via a video sequence or a virtual simulation) will find more resonance with
customers, since it will be easier for customers to understand intangible service value if
suppliers associate them with tangible (e.g., product) aspects (cf. Shostack, 1977).
18
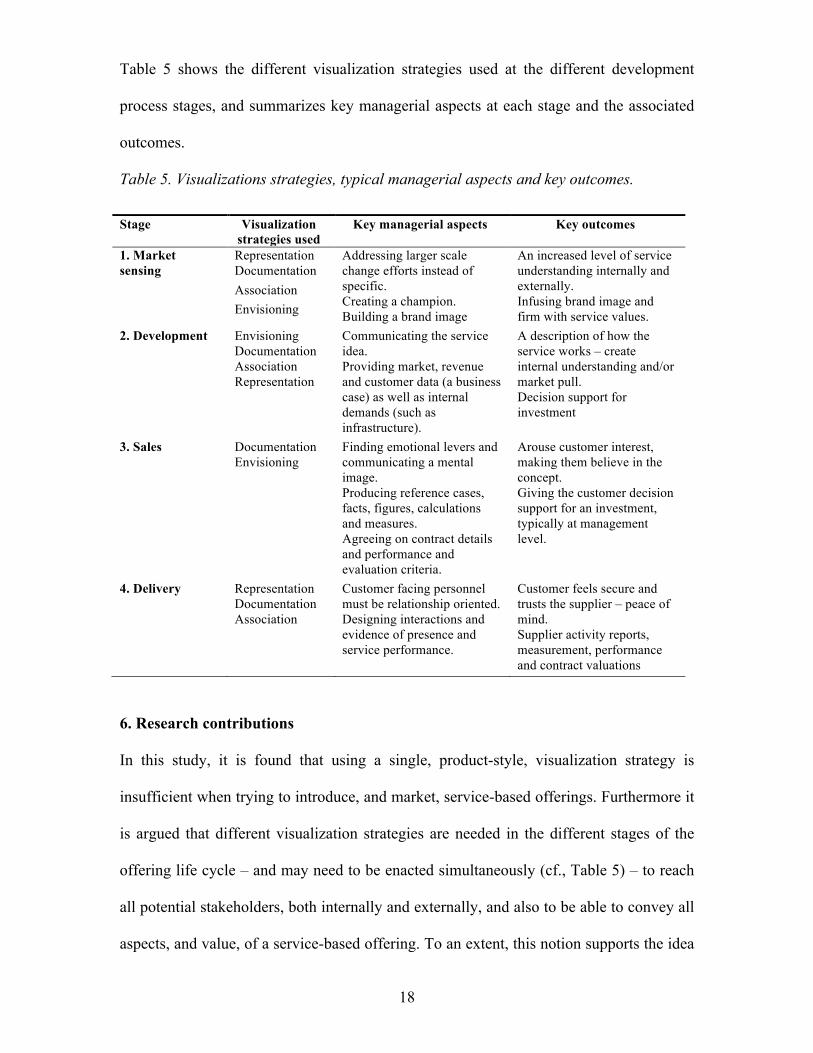
Table 5 shows the different visualization strategies used at the different development
process stages, and summarizes key managerial aspects at each stage and the associated
outcomes.
Table 5. Visualizations strategies, typical managerial aspects and key outcomes.
Stage Visualization strategies used
Key managerial aspects Key outcomes
1. Market sensing
Representation Documentation Association Envisioning
Addressing larger scale change efforts instead of specific. Creating a champion. Building a brand image
An increased level of service understanding internally and externally. Infusing brand image and firm with service values.
2. Development Envisioning Documentation Association Representation
Communicating the service idea. Providing market, revenue and customer data (a business case) as well as internal demands (such as infrastructure).
A description of how the service works – create internal understanding and/or market pull. Decision support for investment
3. Sales Documentation Envisioning
Finding emotional levers and communicating a mental image. Producing reference cases, facts, figures, calculations and measures. Agreeing on contract details and performance and evaluation criteria.
Arouse customer interest, making them believe in the concept. Giving the customer decision support for an investment, typically at management level.
4. Delivery Representation Documentation Association
Customer facing personnel must be relationship oriented. Designing interactions and evidence of presence and service performance.
Customer feels secure and trusts the supplier – peace of mind. Supplier activity reports, measurement, performance and contract valuations
6. Research contributions
In this study, it is found that using a single, product-style, visualization strategy is
insufficient when trying to introduce, and market, service-based offerings. Furthermore it
is argued that different visualization strategies are needed in the different stages of the
offering life cycle – and may need to be enacted simultaneously (cf., Table 5) – to reach
all potential stakeholders, both internally and externally, and also to be able to convey all
aspects, and value, of a service-based offering. To an extent, this notion supports the idea

19
of integrating various forms of evidence in order to create a total impression (Shostack,
1977).
The process approach presented here offers a complementary perspective to existing
frameworks on visualization which tend to focus either on external documentation
strategies in the sales stage (e.g., case histories and value calculators) (Anderson et al.,
2007), or on one-way market communication that does not take the offering life cycle
into account (Hill et al., 2004; Mittal, 1999; Berry and Clark, 1986). Discussion about
offerings in B2B settings often imply a singular focus on a Documentation strategy, but,
since many B2B settings of reasonably complexity often require relatively pronounced
interaction dimensions, service providers need to use a more dynamic and multifaceted
approach to visualization, which means that a wider array of visualization strategies and
techniques are needed.
This study also extends existing theory by recognizing the need for internal visualizations
in order to manage a product-service transition, and by emphasizing the need to visualize
intangible benefits during the delivery stage. Firms with long product lifecycles and long-
term contracts, in particular, can build relationships and trust with their customers during
the delivery stage so as to facilitate future renegotiations and secure sales.
References
Anderson, J C., Thomson, J. B. and Wynstra, F. (2000), "Combining value and price to
make purchase decisions in business markets", International Journal of Research in
Marketing, Vol. 17 No. 4, pp. 307-29.
Anderson, J. C. and Narus, J.A. (1995), "Capturing the Value of Supplementary
Services", Harvard Business Review, Vol. 73 No. 1, pp. 75-83.
Anderson, J. C., Kumar, N. and Narus, J. A. (2007), Value Merchants: Demonstrating
and documenting superior value in business markets, HBS Press, Boston, MA.
Ballantyne, D. (2004), "Dialogue and its role in the development of relationship specific
knowledge", Journal of Business & Industrial Marketing, Vol. 19 No. 2, pp. 114-23.

20
Berry, L. L. and Clark, T. (1986) “Four ways to make services more tangible”, Business,
Vol. 36, pp. 53-54.
Berry, L. L. and Parasuraman, A., (1991), Marketing Services: Competing through
Quality, Free Press, New York.
Caceres, R. C. and Paparoidamis, N. G., (2007), “Service quality, relationship
satisfaction, trust, commitment and business-to-business loyalty”, European Journal of
Marketing, Vol. 41 No. 7/8, pp. 836-867.
Dubois, A. and Gadde, L-E. (2002), "Systematic combining: an abductive approach to
case research", Journal of Business Research, Vol. 55 No. 7, pp. 553-60.
Edmonson, A.C. and McManus, S.E. (2007), “Methodological fit in management field
research”, Academy of Mangement Review, Vol. 32 No. 4, pp. 1155–1179.
Eisenhardt, K.M. and Graebner, M.E. (2007), “Theory building from cases: Opportunities
and challenges”, Academy of Management Journal, Vol. 50 No. 1, pp. 25–32.
Fang, E., Palmatier, R.W. and Steenkamp, J-B. (2008), “Effect of Service Transition
Strategies on Firm Value”, Journal of Marketing, Vol. 72, pp. 1–14.
Gebauer, H. and Kowalkowski, C. (2011), "Customer-focused and service-focused
orientation in organizational structures", Journal of Business & Industrial Marketing,
Vol. 23.
George, W. R. and Berry, L. L. (1981), “Guidelines for the Advertising of Services”,
Business Horizons, Vol. 24, pp. 52-56.
Gibbert, M., Ruigrok, W. and Wicki, B. (2008), “What passes as a rigorous case study?”,
Strategic Management Journal, Vol. 29 No. 13, pp. 1465–1474.
Grönroos, C. (1997), "Value-driven Relational Marketing: from Products to Resources
and Competencies", Journal of Marketing Management, Vol. 13, pp. 407-19.
Grönroos, C. (1998), "Marketing services: the case of a missing product", Journal of
Business & Industrial Marketing, Vol. 13 No. 4/5, pp. 322-38.

21
Grönroos, C. (2009), “Marketing as promise management: regaining customer
management for marketing”, Journal of Business & Industrial Marketing, Vol. 24 No.
5/6, pp. 351-359.
Grove, S. J., Pickett, G. M. and LaBand, D. N. (1995), “An Empirical Examination of
Factual Information Content among Service Advertisements”, Service Industries Journal,
Vol. 15, pp. 216-233.
Hill, D., Blodgett, J., Baer, R. and Wakefield, K. (2004) “An investigation of
Visualization and Documentation Strategies in Services Advertising”, Journal of Service
Research, Vol. 7 No. 2, pp. 155-166.
Jacob, F. and Ulaga, W. (2008), "The transition from product to service in business
markets: An agenda for academic inquiry", Industrial Marketing Management, Vol. 37
No. 3, pp. 247-53.
Kindström, D. and Kowalkowski, C. (2009), "Development of industrial service offerings
– A process framework", Journal of Service Management, Vol. 20 No. 2, pp. 156-172.
Kowalkowski, C., Kindström, D. and Brehmer, P-O. (2011), “Managing industrial
service offerings in global business markets”, Journal of Business & Industrial
Marketing, Vol. 23 No. 3, pp. 181–192.
Lapierre, J. (2000), "Customer-perceived value in industrial contexts", Journal of
Business & Industrial Marketing, Vol. 15 No. 2/3, pp. 122-40.
Legg, D. and Baker, J. (1987), ”Advertising Strategies for Services Firms”, Suprenant, C.
(Ed.), Add Value to Your Service, AMA, Chicago, pp. 163-168.
Lindberg, N. and Nordin, F. (2008), "From products to services and back again: Towards
a new service procurement logic", Industrial Marketing Management, Vol. 37 No. 3, pp.
292-300.
Lovelock, C. and Gummesson, E. (2004), "Whither Services Marketing? In Search of a
New Paradigm and Fresh Perspectives", Journal of Service Research, Vol. 7 No. 1, pp.
20-41.
Mathieu, V. (2001), “Service strategies within the manufacturing sector: benefits, costs
and partnership”, International Journal of Service Industry Management, Vol. 12 No. 5,
pp. 451–475.

22
Matthyssens, P. and Vandenbempt, K. (2010), "Service addition as business market
strategy: identification of transition trajectories", Journal of Service Management, Vol.
21 No. 5, pp. 693–714.
Mittal, B .(2002), “Services communications: from mindless tangibilization to
meaningful messages”, Journal of Services Marketing, Vol. 16 No. 5, pp. 424-431.
Mittal, B. (1999), “The Advertising of Services: Meeting the Challenge of Intangibility”,
Journal of Service Research, Vol. 2 No. 1, pp. 98-116.
Normann, R. (2001), Reframing Business - When the Map Changes the Landscape, John
Wiley & Sons Ltd, Chichester, UK.
Porter, M. E. (1985), Competitive advantage: creating and sustaining superior
performance, Free Press, New York.
Raddats, C. and Easingwood C. (2010), “Services growth options for B2B product-
centric businesses”, Industrial Marketing Management, Vol. 39 No. 8, pp. 1334–1345.
Ramírez, R. (1999), "Value co-production: intellectual origins and implications for
practice and research", Strategic Management Journal, Vol. 20 No. 1, pp. 49-65.
Shostack, G. L. (1977), "Breaking Free from Product Marketing", Journal of Marketing,
Vol. 41, pp. 73-80.
Shostack, G. L. (1982), "How to Design a Service", European Journal of Marketing, Vol.
16 No. 1, pp. 49-63.
Stafford, M. R. and Stafford, T. F. (2000), “The effectiveness of tensile pricing tactics in
the advertising of services”, Journal of Advertising, Vol. 20 No. 2, pp. 45-60.
Szmigin, I. (1993), “Managing Quality in Business to Business Services”, European
Journal of Marketing, Vol. 27 No. 1, pp. 5-21.
Teece, D. J. (2007), "Explicating dynamic capabilities: the nature and microfoundations
of (sustainable) enterprise performance", Strategic Management Journal, Vol. 28 No. 13,
pp. 1319-50.
Tripp, C. (1997), “Services Advertising: An Overview and Summary of Research, 1980-
1995”, Journal of Advertising, Vol. 26 No. 4, pp. 21-38.
Tuli, K. R., Kohli, A. K. and Bharadwaj, S. G. (2007), "Rethinking Customer Solutions:
From Product Bundles to Relational Processes", Journal of Marketing, Vol. 71, pp. 1-17.

23
Ulaga, W. and Eggert, A. (2006), "Value-Based Differentiation in Business
Relationships: Gaining and Sustaining Key Supplier Status", Journal of Marketing, Vol.
70 No. 1, pp. 119-36.
Wilson, D.T. and Jantrania, S. (1994), “Understanding the value of a relationship”, Asia-
Australia Marketing Journal, Vol. 2 No. 1, pp. 55-66.
Woodruff, R. B. (1997), "Customer value: the next source for competitive advantage",
Journal of the Academy of Marketing Science, Vol. 25 No. 2, pp. 139-52.
Yin, R. K. (2003), Case Study Research: Design and Methods, Sage Publications,
Thousand Oaks, CA.
Author biographies
Daniel Kindström is an associate professor of industrial marketing at Linköping
University. His current research focuses on service selling, development of industrial
offerings, and the value-creation potential of increased service content in traditionally
product-focused companies. He has published articles in such journals as European
Management Journal, Journal of Business & Industrial Marketing and Journal of Service
Management.
Christian Kowalkowski
Christian Kowalkowski is an Assistant Professor of Marketing at the CERS – Centre for
Relationship Marketing and Service Management at Hanken School of Economics in
Helsinki, Finland. He also holds a position as Associate Professor of Industrial Marketing
at Linköping University. His research focuses on service infusion in manufacturing firms,
service logic, dynamic capabilities and value-creation strategies. He has published
articles in such journals as European Journal of Marketing, Industrial Marketing
Management, Journal of Business & Industrial Marketing and Journal of Service
Management.

24
Fredrik Nordin is an associate professor at Stockholm University in Sweden. Before
joining academia he held a series of positions in the high-tech industry, focusing on
purchasing management and service development. The same areas are now the focus of
his research. He serves as an Editorial Board Member of Industrial Marketing
Management and has previously published in such journals as Industrial Marketing
Management, Journal of Service Management, Journal of Purchasing and Supply
Management, and International Journal of Production Economics.