visualizing the pan genome - australian society for microbiology - tue 8 jul 2014
TRANSCRIPT
Visualizing the pan-genome
ASM Meeting - Melbourne - Tuesday 8 July 2014
Dr Torsten Seemann

Introduction

The “genome”
Two historical definitions:
● The set of “genes” in an organism○ traditionally just protein coding genes○ (should) now include non-coding RNAs
● The DNA sequence of all replicons○ ignore epigenetic decorations

The “pan-genome”
For a given set of strains:
● The full complement of genes○ orthologous genes only count once○ ignoring paralogs with identical function
● The set of unique DNA segments○ ignore epigenetic decorations○ will include intergenic regions like promoters etc.
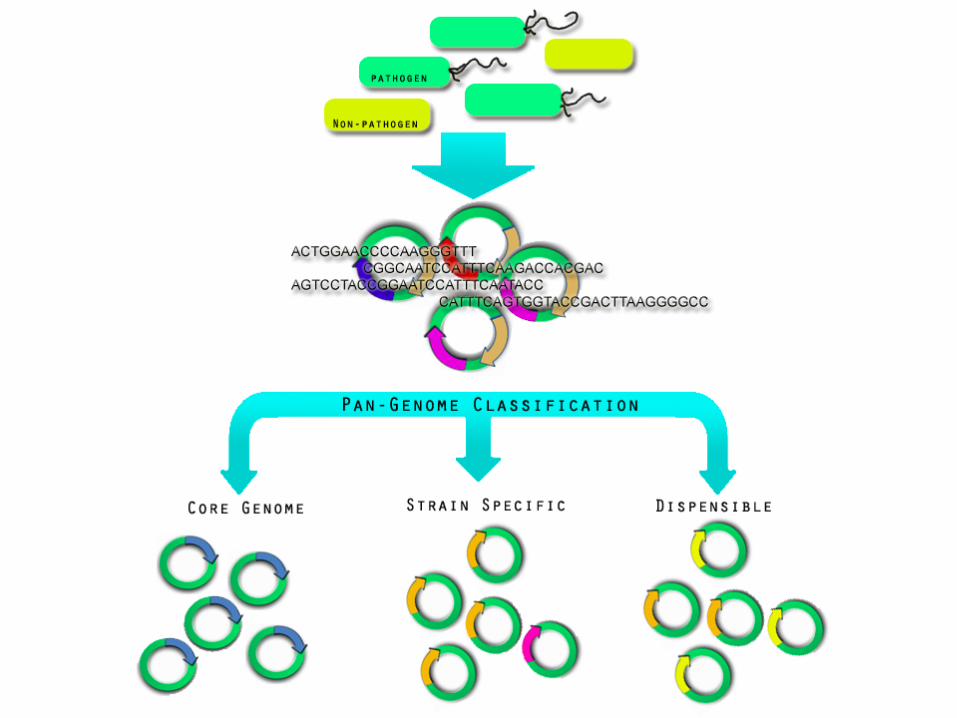

Core
Disp.
Disp.Disp.
UniqueUnique
Unique
Three genomesCoreIn all 3 strains (∈ N strains)
DispensableIn 2 strains(∈ [2,N-1] strains)
UniqueIn only 1 strain(∈ 1 strain)
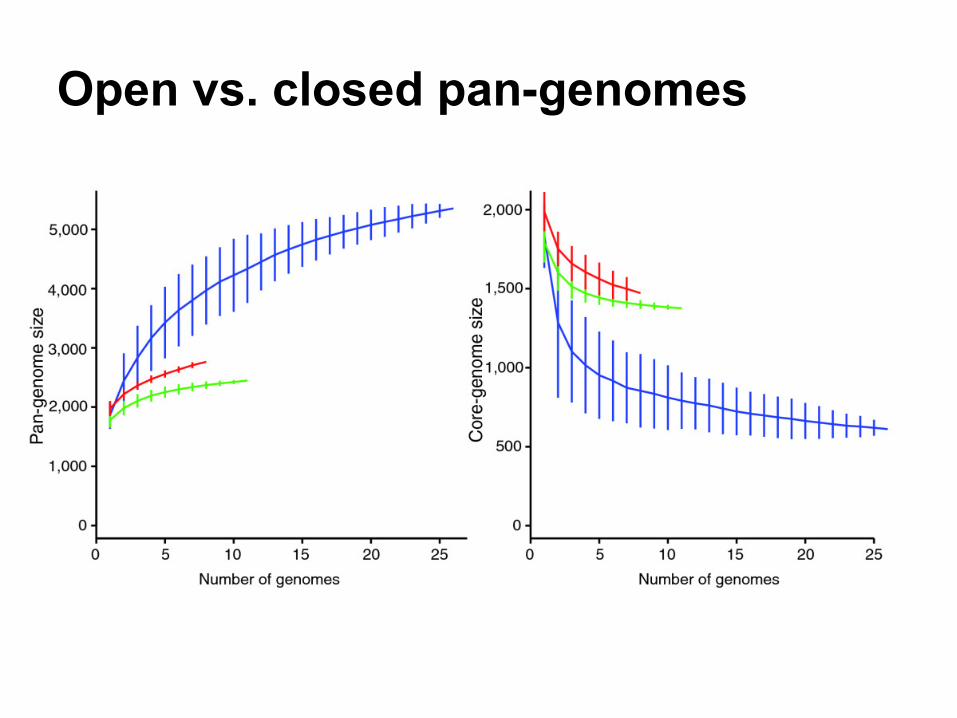
Open vs. closed pan-genomes

How to compute it

Whole genome alignment
● Align whole genomes○ typically at DNA level○ can use AA level if genomes are divergent
● Software○ Mauve, MuMmer, ...
A ================================ ==== ==== B ======== =================== ================ ====C ========================== ============ =====
Pan ======================================================Core ===== =================== ===== = Uniq ====

Ortholog clustering
● Group orthologous proteins together○ all versus all protein comparison (not scalable)
○ information used: sequence similarity, synteny
○ difficulty increases with taxa distance
○ depends on annotation quality!
● Software○ ProteinOrtho5, OrthoMCL, cd-hit, uclust, blastclust
● Databases○ COG, NOG, EggNOG, ... mostly uncurated
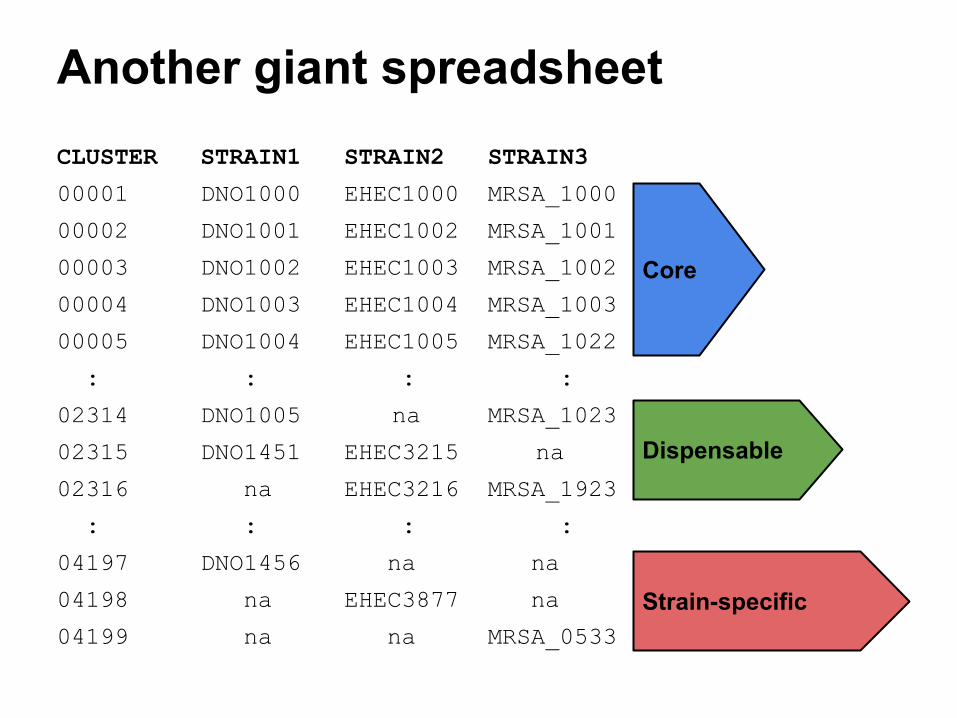
Another giant spreadsheet CLUSTER STRAIN1 STRAIN2 STRAIN3
00001 DNO1000 EHEC1000 MRSA_1000
00002 DNO1001 EHEC1002 MRSA_1001
00003 DNO1002 EHEC1003 MRSA_1002
00004 DNO1003 EHEC1004 MRSA_1003
00005 DNO1004 EHEC1005 MRSA_1022
: : : :
02314 DNO1005 na MRSA_1023
02315 DNO1451 EHEC3215 na
02316 na EHEC3216 MRSA_1923
: : : :
04197 DNO1456 na na
04198 na EHEC3877 na
04199 na na MRSA_0533
Core
Dispensable
Strain-specific
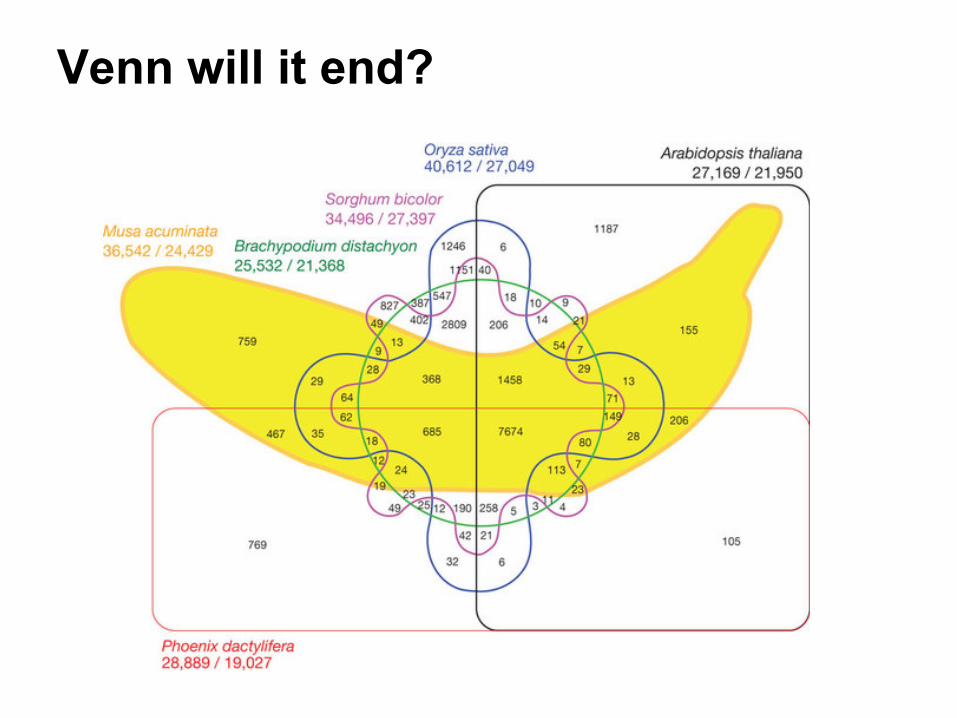
Venn will it end?

But we want to explore!

FriPan

Pan-genome map
One row per strain
Mini-map of whole pan-genome
One column per geneGrey means not present

Zooming: brush along the mini-map
Where we are in within whole pan-genome
Each block is a gene:Green=presentGrey=absent
Strains

Dendrogram
This uses gene absence and presence.This is not a SNP based phylogeny.
Dendrogram: Horizontal

Radial phylogram
Radial dendrograms work well for >100 taxa
Dendrogram: Radial
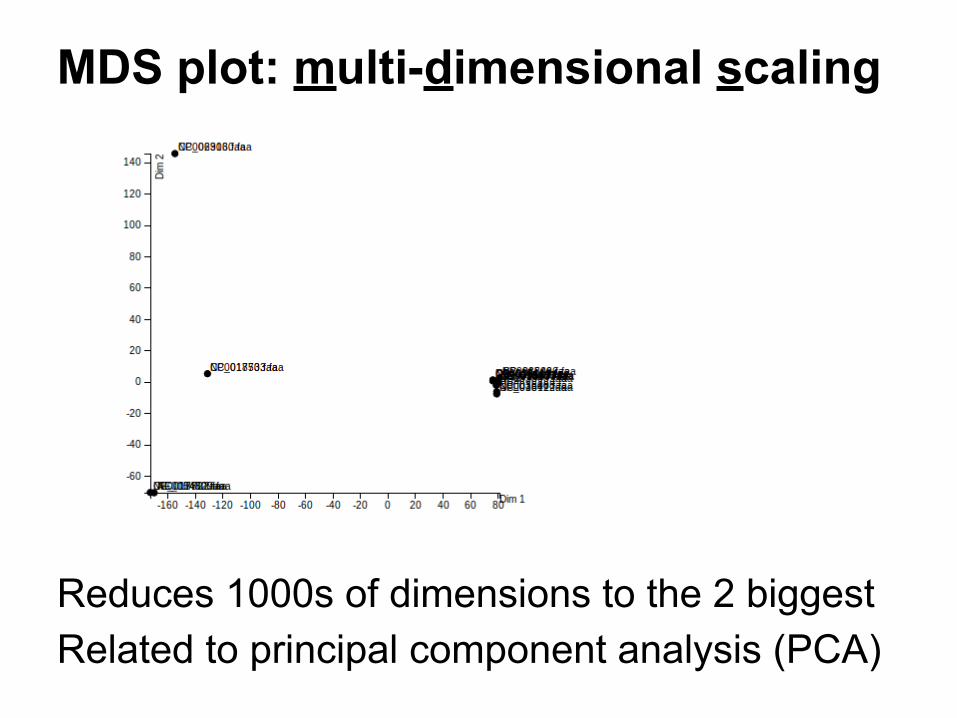
MDS plot: multi-dimensional scaling
Reduces 1000s of dimensions to the 2 biggestRelated to principal component analysis (PCA)
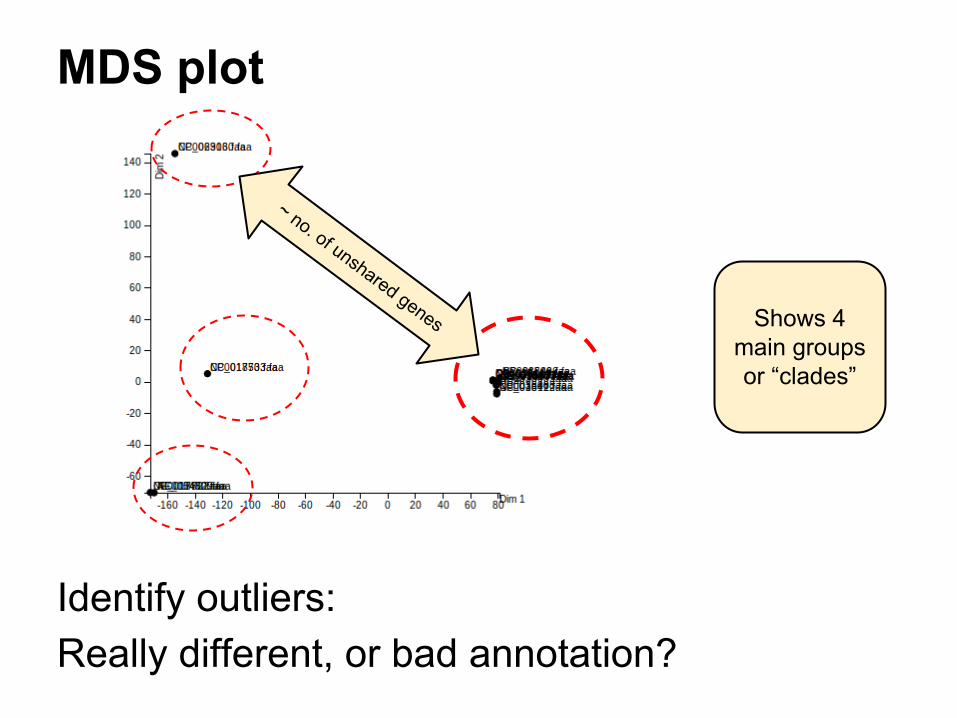
MDS plot
Shows 4 main groups or “clades”
~ no. of unshared genes
Identify outliers: Really different, or bad annotation?
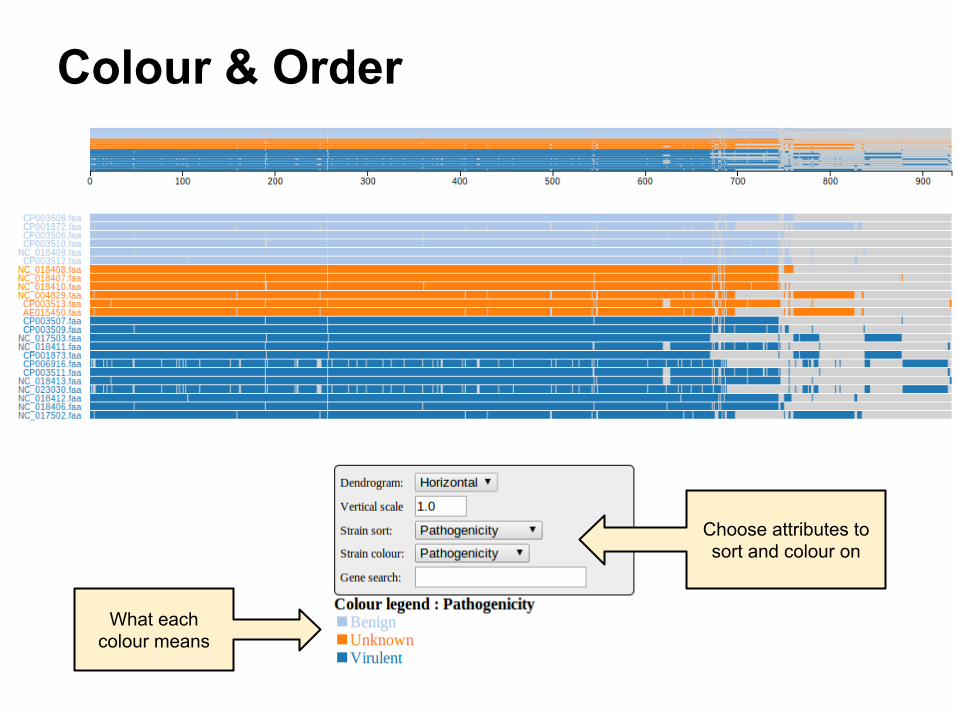
Colour & Order
What each colour means
Choose attributes to sort and colour on
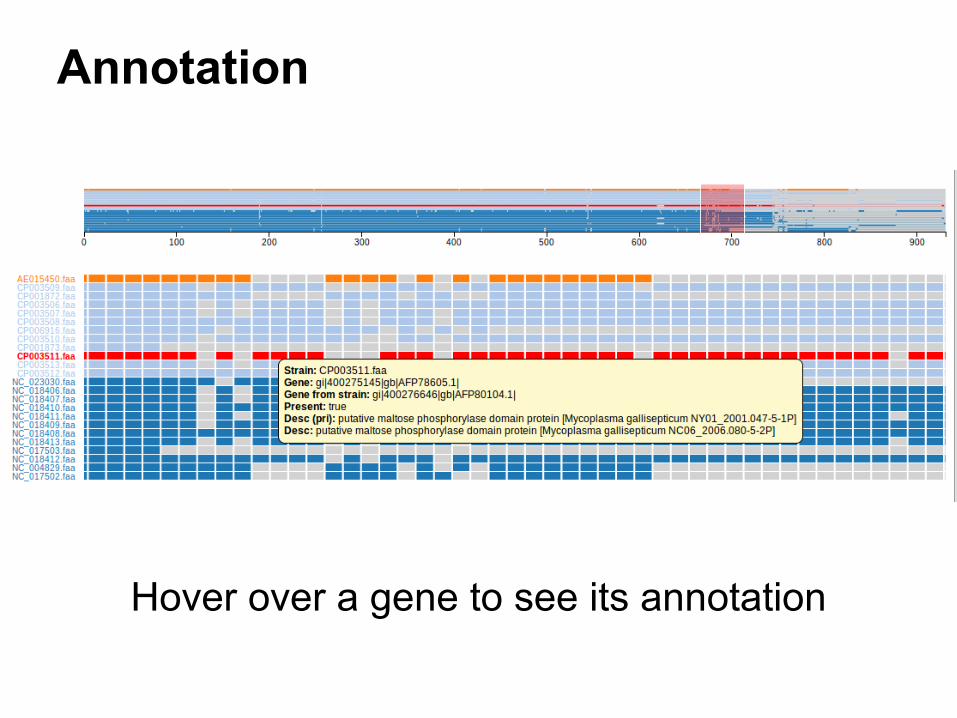
Annotation
Hover over a gene to see its annotation

Key features
● Interactive
○ can select, re-arrange, zoom
● Dynamic○ pan-genome chart, MDS plot, dendrogram
○ update/change depending on current selection

What’s next?
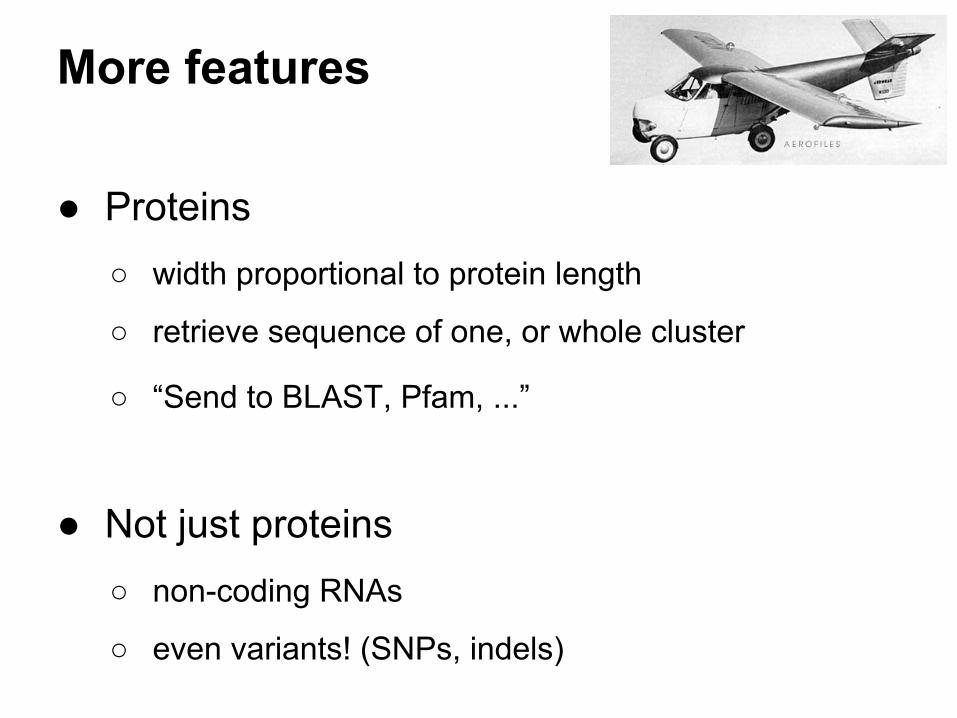
More features
● Proteins○ width proportional to protein length
○ retrieve sequence of one, or whole cluster
○ “Send to BLAST, Pfam, ...”
● Not just proteins○ non-coding RNAs
○ even variants! (SNPs, indels)

More features
● Customise○ colours at the gene level (AbR, PaLOC, COG)
○ add/remove taxa
● Export○ save diagram as SVG for publication
○ deploy as a single HTML file for offline viewing
● Suggestions○ happy to hear ideas from the audience!
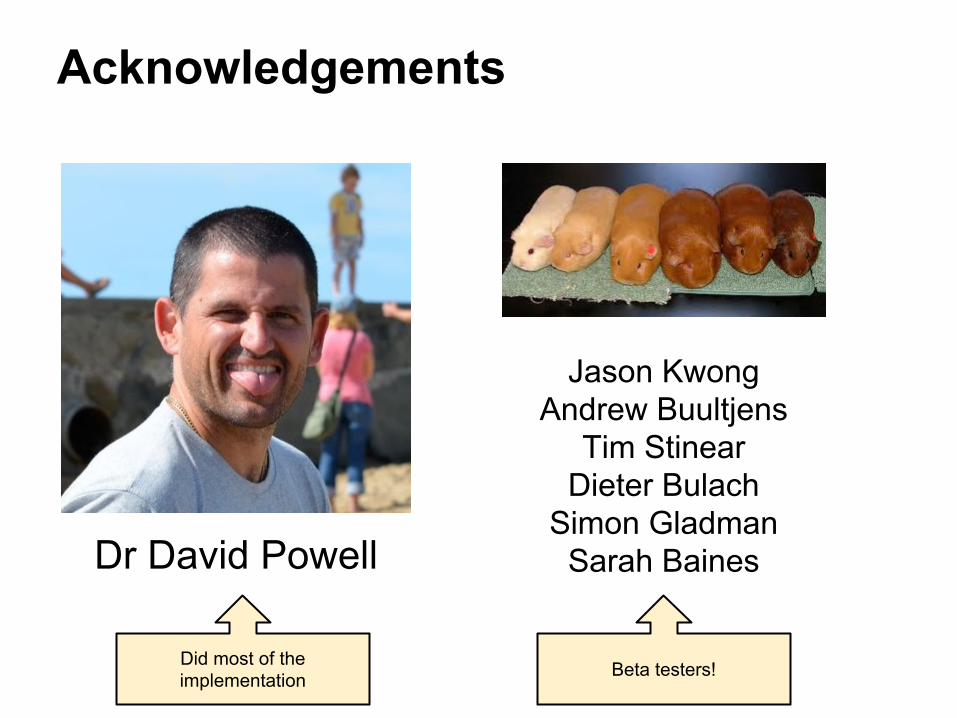
Acknowledgements
Dr David Powell
Jason KwongAndrew Buultjens
Tim StinearDieter Bulach
Simon GladmanSarah Baines
Did most of the implementation Beta testers!

1. Go to: http://bioinformatics.net.au
2. Click on the left menu bar:
3. Click on FriPan:
FriPan is open-source