visualizing a convolutional neural networktmm/courses/547-17/projects/hooman-mahdi/... · this...
TRANSCRIPT
VisualizingaConvolutionalNeuralNetworkMahdiGhodsi,[email protected]
HoomanShariati,[email protected]
Recently,DeepNeuralNetwork(DNN)hasgainedmuchattentionduetoitssuccessinimproving
taskssuchasimageclassificationandspeechrecognition.AmongstdifferentDNNapproaches
ConvolutionNeuralNetworks(CNNs)isextremelypopularinparticularduetotheiroutstanding
capacitytoutilizespatialinformation.Wehavetakenacourse(EECE592)thatcoversDNNs.
Currently,therehasbeenashiftonapplyingbioinformaticsdatatoCNNs[1].Whilemuchsuccess
havebeenachievedinthebiomedicalimagingdomain[2]usingCNNs,thereiscurrentlyongoing
researchinotherbioinformaticsdomainssuchashavebeensuccessfulinmanyapplicationand
havebeenappliedtomanyfieldssuchasgenomicsequence[3]motifsandEEG[4].
DespitetheencouragingsuccessofCNNs,manystillseeCNNsasapromisingblackboxwithlittle
insightintothebehaviorofinternalcomponentsofCNNs.Thisfactleavesmanyresearchersto
relyingontry-anderrortoachievebetterperformanceandfine-tunethehyperparameters
involved.Largemodernneuralnetworksareevenhardertostudybecauseoftheirsize;for
example,understandingthewidelyusedAlexNetDNNinvolvesmakingsenseofthevaluestaken
bythe60milliontrainednetworkparameters[5,6].
Recently,visualizingDNNsinparticularCNNshasresultedinmanypublications.Themostcited
andbasisofrecentapproachesarebasedonapaperbyZeilerandFerfusetal.inwhichthey
proposeamulti-layereddeconvolutionalNetwork(deconvnet)toprojectthefeatureactivations
backtotheinputpixelspaceforatrainednetwork.Thistechniquerevealstheinputstimulithat
exciteindividualfeaturemapsatanylayerinthemodel[5].Thesecondmostcitedpaperby
Yosinskietal.improvesthismethodbyproposingseveralnewregularizationmethodsthat
combinetoproducemorehumaninterpretablevisualizations[6].Recently,Google’sTensorflow
(anopensourcesoftwarelibraryformachinelearning)iscomplementedbyavisualizationtool
calledTensorboard[7].Inadditiontotheabovetoolsandmanymorescholarlypublished
papers,therearemanypubliclyavailableonlinetoolsthatareworthinvestigating[8].

Thisproject’smaingoalistocombinethepreviousworksinacompleteinteractivevisualization
toolthatfocusesonvisualizingtheoperationofinternalcomponentsofagivenneuralnetwork.
ThisprojectasrequestedbyMahdi’ssupervisor,focusesondeliveringatoolthatresemblesthe
familiararchitecturethatisshowninfigure1.Therequirementsforthistoolarederivedfroma
studythatsurveyedresearchersandidentifiedthemaintasksforavisualizationtool[9].Afew
ofthesetaskscombinedwithwhatMahdi’ssupervisor’srequestsareselectedandweaimto
deliverthemwithinourfinalsolution.Thesetasksare:
1. Overallviewofthearchitectureandnetworkdepth
2. Overviewoflearnedfeaturesofneurons
3. Interactivelyexploringmultiplefacetsofneurons(learnedfeatures,activation,numerical
values)
4. Theinputtothenetworkandtheeffectofapplyingconvolutionthroughoutthesystem
Inordertodeliveratoolthatfocusesontheabovetasks,wearehopingtouseaCNN,possibly
fedbyMNISThandwrittendigitaldatabase,thatispublicallyavailableandproducetherequired
databymodifying/addingtotheavailablecode.Thedataproducedwillbeasetofweightsfor
eachneuronwithineachlayerofthenetwork.Thenetworkisconsistedofdifferentlayersand
dependingonthelayerandtheneuronthenumberoflearnableweightsdiffer.Forinstancea
fullyconnectedlayerforatypicalMNISTfedCNNhasatotalapproximately128neurons.Eachof
theseneuronstakestheoutputofpreviouslayerthatinthiscaseare1764values.Thesevalues
arethenprocessedandasingleoutputisproducedbyeachneuron.Ourtaskwillbeinvestigating
previouspublicationstorealizethestateofartmethodsinproducingameaningfulvisualization.
Thisisslightlydifferentforvisualizingconvolutionallayers,aseachlayerwillconsistofasetof
convolutionalfilters(forinstance5x5filters)thatallowsustovisualizeasetofweightsasone
filter.Forinstanceaconvolutionallayermayconsistsof16filtersof5x5sized,allowingusto
visualize16boxesratherthan16x5x5=375values.
Belowisascenarioforuser“X”,whohasjusttrainedaCNNandwantstovisualizethenetwork:
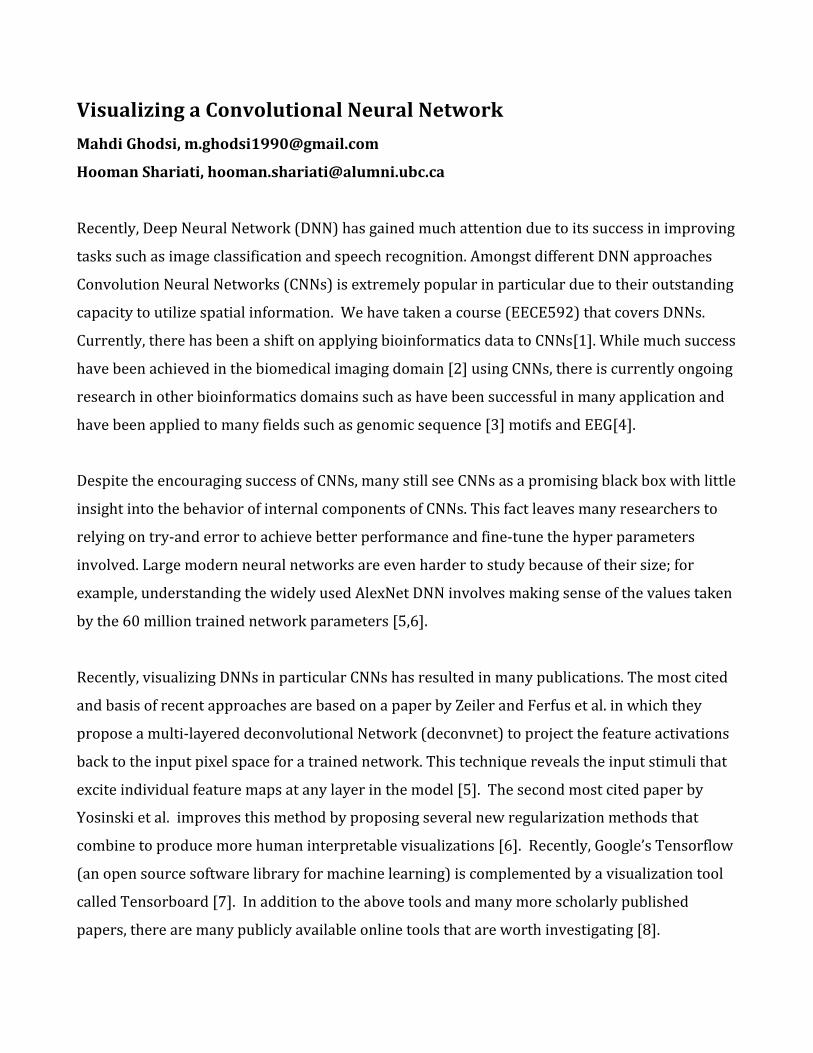
Xhastorunaforwardpropagationofoneinputsampleandincludetheinstructionsgivenbyus
forhowtodosoandthenthetoolwillbereadytouse.Thetoolaggregatesallthedetailed
informationandillustratesanoverviewofthearchitecturesuchastheonegiveninfigure1.
ThenXcanchoosetoexplorethefiltersinfirstconvolutionallayer.Xneedstoclickonthe
appropriatelayertoseemoredetails.Thedetailscouldbefiltersshown.IftheXwantstoseethe
effectofthatfilterontheinputimage,therewillbeabutton/slidertochangethedetailshownon
demand.Theconnectionbetweenthatfilterandalltheothernodes/filtersareshown.Forany
otherinformationabouteachlayerXneedstofollowthesamelogicofclicktoviewmoredetails.
Thistoolwillhelpresearcherstogetsomeinsightabouthoweachindividualneuronisactivated
orinformationinregardstotheoutputofasetofneuronsthatconstructonefulllayerofthe
NeuralNetworkarchitecture.ThescopeofthisprojectislimitedtoatrainedCNNtoavoid
complexityofrunningdynamicanalysisofthenetworkwhichrequiresheavycomputationand
ontheotherhanditisnotaseasytointerpretforahumanusersinceeachtrainingsetcontains
thousandsofdatapoints.VisualizingatrainedCNNmaygiveadomainexpertenoughintuition
toanalyzeandimprovetheperformanceoforiginalnetwork.
ThefinalproductwillbedeliveredbytheendofAprilasatoolthatcouldvisualizeatrainedCNN
ofourchoice.However,itwillbecomplementedwithenoughdocumentationusableforother
researcherswhowhishtovisualizeagivenCNN.
Figure1-OverviewofCNNtovisualize
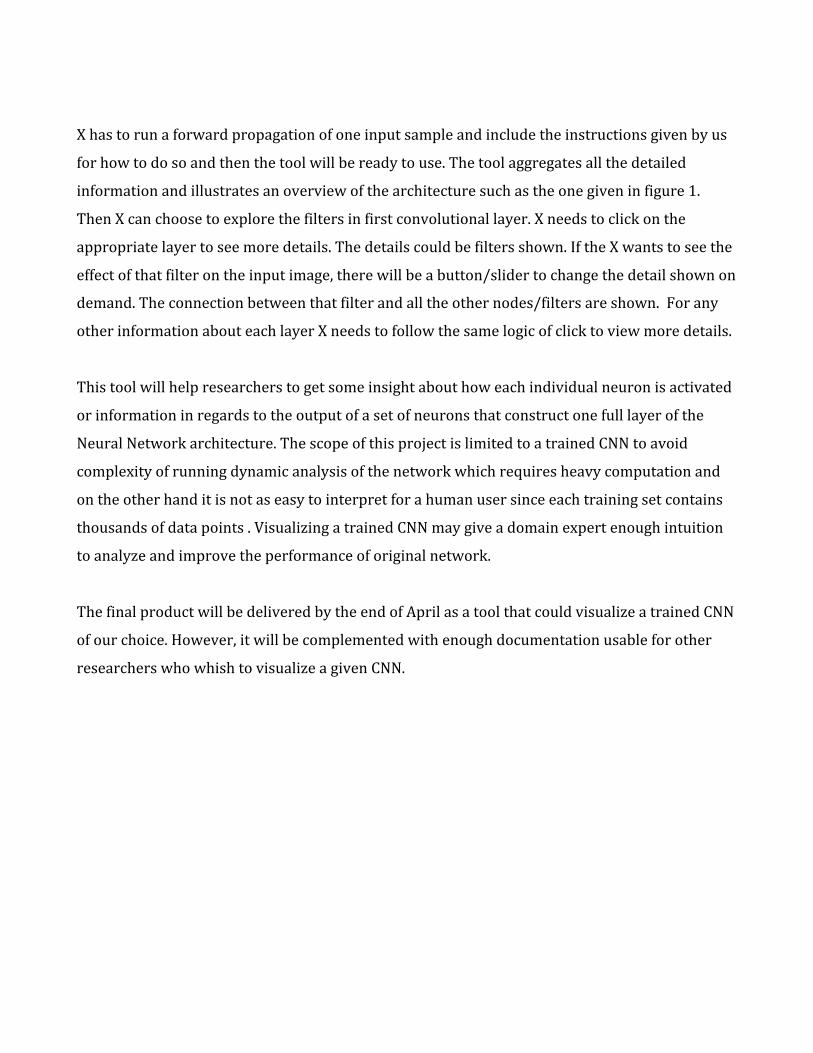
Figure2-ProjectMilestone

References:
[1]S.Min,B.Lee,andS.Yoon,“Deeplearninginbioinformatics,”BriefingsinBioinformatics,
2016.
[2]Roth,HolgerR.,LeLu,AmalFarag,Hoo-ChangShin,JiaminLiu,EvrimB.Turkbey,andRonald
M.Summers."DeepOrgan:Multi-levelDeepConvolutionalNetworksforAutomatedPancreas
Segmentation."LectureNotesinComputerScienceMedicalImageComputingandComputer-
AssistedIntervention--MICCAI2015(2015):556-64.Web.
[3]J.Lanchantin,R.Singh,B.Wang,andY.Qi,“DeepMotifDashboard:VisualizingAnd
UnderstandingGenomicSequencesUsingDeepNeuralNetworks,”Biocomputing2017,2016.
[4]P.Bashivan,I.Rish,M.Yeasin,N.Codella,“LearningRepresentationFromEEGWithDeep
Recurrent-ConvolutionNeuralNetwokrs,”Preceding5thInternationalConferenceonLearning
Representations(ICLR),2016.
[5]Zeiler,MatthewD.,andRobFergus."Visualizingandunderstandingconvolutionalnetworks."
Europeanconferenceoncomputervision.SpringerInternationalPublishing,2014.
[6]Yosinski,Jason,etal."Understandingneuralnetworksthroughdeepvisualization."arXiv
preprintarXiv:1506.06579(2015).
[7]https://www.tensorflow.org/get_started/summaries_and_tensorboard
[8]https://handong1587.github.io/deep_learning/2015/10/09/visulize-cnn.html
[9]Liu, Mengchen, et al. "Towards better analysis of deep convolutional neural
networks." IEEE Transactions on Visualization and Computer Graphics 23.1 (2017):
91-100.