visualization to support the discovery of prosodic
TRANSCRIPT
University of Texas at El Paso University of Texas at El Paso
ScholarWorks@UTEP ScholarWorks@UTEP
Departmental Technical Reports (CS) Computer Science
9-2010
Visualization to Support the Discovery of Prosodic Contours Visualization to Support the Discovery of Prosodic Contours
Related to Turn-Taking Related to Turn-Taking
Nigel Ward The University of Texas at El Paso, [email protected]
Joshua L. McCartney The University of Texas at El Paso, [email protected]
Follow this and additional works at: https://scholarworks.utep.edu/cs_techrep
Part of the Computer Engineering Commons
Comments:
Technical Report: UTEP-CS-10-24
Recommended Citation Recommended Citation Ward, Nigel and McCartney, Joshua L., "Visualization to Support the Discovery of Prosodic Contours Related to Turn-Taking" (2010). Departmental Technical Reports (CS). 24. https://scholarworks.utep.edu/cs_techrep/24
This Article is brought to you for free and open access by the Computer Science at ScholarWorks@UTEP. It has been accepted for inclusion in Departmental Technical Reports (CS) by an authorized administrator of ScholarWorks@UTEP. For more information, please contact [email protected].
UTEP Technical Report UTEP-CS-10-24
Visualization to Support the Discovery of
Prosodic Contours Related to Turn-Taking
Nigel G. Ward, Joshua L. McCartney
Department of Computer ScienceUniversity of Texas at El Paso500 West University AvenueEl Paso, TX 79968-0518
email: [email protected], [email protected]
August 25, 2010
Some meaningful prosodic patterns can be usefully represented with pitch contours,however the development of such descriptions is a labor-intensive process. To assistin the discovery of contours, visualization tools may be helpful. [Edlund et al., 2009]presented the idea of superimposing hundreds of pitch curves from a corpus as a way tosee the overall patterns. In this paper we refine and extend this method and illustrateits utility in the discovery of a prosodic cue to back-channels in Chinese. We alsodiscuss issues in relating a contour-based description to one in terms of a conjunctionof featues, and illustrate this with a prosodic cue to back-channels in Spanish.
Index Terms: prosodic cue, tune, turn-taking, back-channel, bitmap cluster, overlay, superim-pose, Chinese, Spanish
1 Why Contours?
In human dialog, turn-taking is largely managed by means of prosodic signals, or cues, ex-changed by the participants. If a dialog system can correctly recognize and respond to thesecues, it can make the user experience more efficient and more comfortable [Gratch et al., 2007,Raux and Eskenazi, 2009, Skantze and Schlangen, 2009].
A salient aspect of these cues is that they often seem to involve pitch contours, sometimesalso called tunes: specific patterns of ups and downs over time. Such contours can can be drawnin various forms (Figure 1).
However, in the spoken dialog systems community, those working on turn-taking gen-erally do not use contours, either explicitly or implicitly. Rather the “direct approach”

DRAFT 2
Figure 1: Examples of pitch contours: a contradiction contour (after [Bolinger, 1986] pg 246),a nonfinal contour followed by a final contour (after [Cohen et al., 2004], pg 183), and a back-channel cuing contour for Spanish (original work, building on [Rivera and Ward, 2008], see alsoFigure 6).
[Shriberg and Stolcke, 2004] has become mainstream. In this method, numerous low-levelprosodic features are computed and fed into a classifier trained on the decision of interest, forexample, whether to initiate a turn or wait. This method has been quite successful, not only forturn-taking, but also more generally.
However contours also have their merits. A description in terms of a contour can be conciseand may possess more explanatory power than a complex classifier. A contour-based descriptionmay apply more generally to other dialog types and other domains of discourse, whereas a complexclassifier may perform well only for the corpus it was trained on. In some ways a contour maybe a more natural description of a prosodic pattern. For one thing, describing a pattern in termsof low-level features presents some choices which may lack real significance: for example the twodescriptions “pitch rise” and “low pitch followed by a high pitch”, although referring to differentmid-level features, may not actually differ in fact; but if drawn as contours the similarity oridentity will be obvious. As another example, when describing a pattern in terms of features thetemporal dependencies may not be immediately apparent, as in a rule which requires “low at t –700” and “high at t – 400.” but with contours, the sequencing and timing of the components isclear.
Another advantage of contours is that people who need to know the effective prosodic pat-terns of a language, for example second language learners, can understand such diagrams fairlyquickly. It is even conceivable that contours approximate the true nature of these prosodic pat-terns as they exist in the human mind. The notion of cue strength [Gravano and Hirschberg, 2009,Huang et al., 2010] may have a natural implementation in terms of contours: the similarity be-

DRAFT 3
tween an input pitch curve and the cue contour may be an easy way to estimate cue strength.Contour-based descriptions can be used equally well for recognition and production. Finally,contours and the parameters describing them may serve as useful higher-level features forclassifiers, and so contour discovery may also help those using the direct modeling method[Morency et al., 2010].
However contours currently have one great disadvantage: the difficulty of finding them. Incontrast to the direct method, where, as long as one has the necessary resources and properlyprepared data, the hard work can be entrusted to the machine learning algorithm, the discoveryof a new prosodic contour can be a time-consuming process. Although there are helpful tools andmethods [Ward and Al Bayyari, 2006, Hollingsed and Ward, 2007, Rosenberg, 2010], it is still noteasy. Elicitation and instrumental techniques that work for monolog are hard to apply to prosodicpatterns that relate to dialog-specific phenomena such as the prosody of attitude, information-state, speaker and interlocutor cognitive state, and turn-taking. Of course any single utterancehas a clear pitch contour, but going from examples to a general rule is not straightforward.
This paper addresses this problem by presenting and illustrating a visualization method tosupport the discovery of meaningful pitch contours.
2 Visualization with Bitmap Clusters
Our visualization method is a refinement of Edlund, Heldner and Pelce’s “bitmap clusters”[Edlund et al., 2009]. Their innovation was to superimpose many individual pitch contours toreveal a general pattern:
by plotting the contours with partially transparent dots, the visualizations give anindication of the distribution of different patterns, with darker bands for concentrationsof patterns
Figure 2: from Figure 6 of Edlund et al. [Edlund et al., 2009], by permission
They used this method to see what sort of contexts preceded various utterance types in theSwedish Map Task Corpus. Figure 2, taken from their paper, shows the contexts preceding 859talkspurts which were tagged as ‘very short utterances” and as having “low propositional content”;these were probably mostly acknowledgments. The possibly visible red rectangle was added byhand to mark the frequent occurrence of a region of low pitch found “860 to 700ms prior to thetalkspurts”, which they identified with a back-channel cue previously noted in the literature.

DRAFT 4
3 Extensions and Refinements
We made a few improvements.
First, we chose the pitch regions to overlap in a different way. Edlund et al. aligned the endsof the talkspurts with the right edge of the display. This presumably reflects the assumption thatthe prosodic cues of interest occur at, and are aligned with, the utterance ends. While possiblyvalid for some dialog types, this is not suitable for, say, back-channels in dialog, which oftenoverlap the continuing speech of the interlocutor. We therefore aligned based on the start of theresponse of interest. Thus our right edge, the 0 point, is always the onset of the response.
Second, we normalized the pitch differently. Edlund et al. vertically aligned the contoursso that the “median of the first three voice frames in each contour fell on the midpoint of they-axis,” providing a form of per-utterance normalization. We chose instead to normalize per-speaker, based on our experience that normalization with respect to longer time spans can improveidentification of cues [Ward and Tsukahara, 2000], probably because turn-taking signals, unlikesome other prosodic phenomena, are not tightly bound to utterances, but are relative to thespeaker’s overall behavior. Among the various possible normalization schemes, we chose a non-parametric approach, representing each pitch point as a percentile of the overall distribution forthat speaker. Compared to approaches which explicitly estimate parameters, such as pitch rangeor standard deviation, this does not require assumptions about the distribution, and thus may bemore robust.
Third, we also chose to display an additional feature, energy, again normalized by speaker andexpressed in percentiles. This was for two reasons. First, the pattern of speaking versus silence isalso important for turn-taking, and we wanted to represent and model this explicitly, rather thanpass it off to some generic pre-processing phase that arbitrarily chops the input into utterances.Second, energy is important in identifying stressed syllables, fillers and so on.
Fourth, we included the deltas: delta pitch and delta energy. Delta pitch may reveal upslopes,downslopes, and flat regions, and delta energy may reveal lengthened syllables or slow speakingrate. For pitch of course, the deltas are not always defined, so only when two adjacent pitchpoints are valid do we plot this. For both pitch and energy, what we plot is the difference betweenprevious value, as a percentile, and the current pitch value, as a percentile.
Fifth, we extended the displays out to 2 seconds of past context, to look for longer-termpatterns and to make it easier to see how the pitch contours in the cue region differ from theoverall distributions.
Sixth, we did without pitch smoothing, not wanting to risk losing information. This is probablywhy the shading in our diagrams turned out more continuous and less blotchy than those of Edlundet al.
Seventh, since what we really want to see is not the distributions before the events of inter-est, but how those distributions differ from the general distributions seen across the dialogs, wesubtracted out the global average distribution, as estimated from a fairly random sample over thedialogs. (Specifically, the average value for each percentile in the leftmost 100ms of each displaywere calculated. Then these values were subtracted out from their respective percentiles over theentire display.) Before doing this the diagrams were blurry and hard to confidently interpret;

DRAFT 5
Figure 3: Overlaid Pitch, Energy, Delta Pitch and Delta Energy for Japanese
afterward they were much sharper, although somewhat more blotchy. Examples appear in theAppendix.
Henceforth we will refer to diagrams made in this way as “overlaid prosodic displays”. Eachpoint represents the count of occurrences of that value at that time, normalized so that thehighest-count point is pure black.
4 An Example
We developed these refinements in the course of trying visualizations for the contexts precedingback-channels in several languages. We chose to look at back-channeling because it is a well-studied issue in turn-taking, and because previous research suggests that, among all turn-takingphenomena, back-channeling may be the one where the behavior of one speaker is most stronglyinfluenced by the immediately preceding prosody of the other. The result for Japanese is seen inFigure 3, showing the overlaid prosodic displays for the speech of the interlocutor in the contextsimmediately preceding 873 back-channels in casual conversation [Ward and Tsukahara, 2000].
While our hope was that these refinements to the visualization method would lead directly toclear diagrams with the prosodic cue immediately visible, sadly this was not the case. However itis possible to see useful information. For example: in the second or so preceding the back-channel,the interlocutor’s pitch tends to be low, around the 25th percentile, starting around 200ms beforethe back-channel, and stable; and the energy tends to be high starting about 1000ms before the
DRAFT 6
back-channel, but never very loud in the final 200ms. This roughly matches what we know fromprevious research: the primary cue to back-channels in Japanese is a region of low pitch, with theinterlocutor usually continuing speaking at least until the back-channel response starts. While theoptimal prediction rule found earlier looks somewhat different (requiring a region of pitch lowerthan the 26th percentile 460 to 350 ms before the back-channel onset [Ward and Tsukahara, 2000])this visualization could clearly be a useful clue to the discovery of such a rule. Applying thismethod to English, Egyptian Arabic, and Iraqi Arabic data also revealed patterns which matchedwhat we know from previous work, as illustrated in the Appendix.
5 Utility for Cue Discovery
Of course, interpreting a diagram is easy when you already know what you expect to see. Asa fairer test of the utility of this visualization, we applied it to a language which we had notpreviously examined, Chinese.
Using 18 dialogs from the Callhome corpus of telephone speech [Canavan and Zipperlen, 1996],90 minutes in total, we had two native speakers independently identify all back-channels accordingto the criteria of [Ward and Tsukahara, 2000]. One identified 528 and the other 467. We thentook the intersection of the two sets, reasoning that working with unambiguous cases would makeit easier to see the normal pattern. This gave us 404 back-channels.
Digressing briefly to comment on back-channeling in Chinese, contrary to what is sometimesreported, back-channels were quite frequent: at over 4 per minute, almost as common as inEnglish. This however may be due in part to the fact that at least one participant in each dialogwas resident in North America. Also, although not important for current purposes, we had theannotators label the back-channels. As they were not phonetically sophisticated, we let them usewhatever letter sequences they liked. The fifteen most frequent labels of one labeler were uh, oh,dui, uh-huh, em, shima, hmmm, ok, yeah, huh, duia, uhuh, shia, hmmmm, and good.
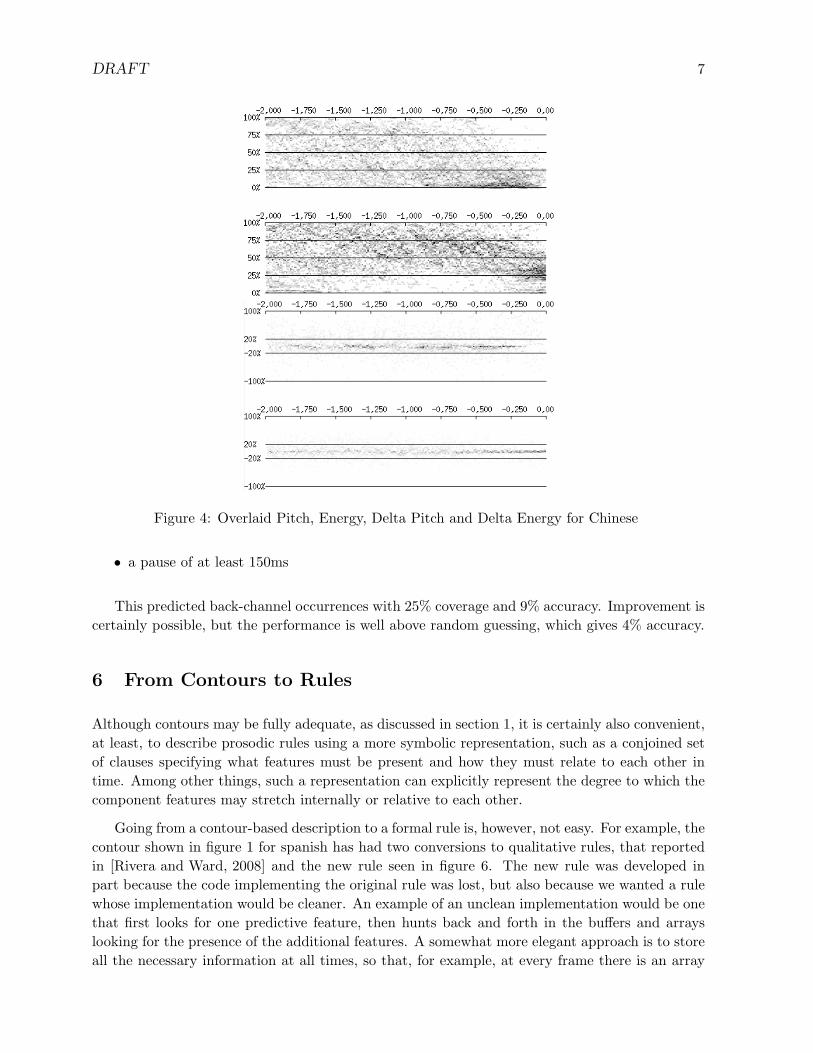
The task we set ourselves was that of discovering what prosodic pattern in the interlocu-tor’s speech was serving to cue back-channel responses. We formalized this in a standard way[Ward and Tsukahara, 2000], requiring a predictor, able to process the dialog incrementally and,every 10 milliseconds, predict whether or not a back-channel would occur in the next instant,based on information in the interlocutor’s track so far. The second author, armed with the visual-izations seen in Figure 4 and software infrastrucure previously developed for extracting prosodicfeatures and making similar decisions for other languages, but with no knowledge of Chinese, gotto work.
He immediately noted that the pitch tends to go extremely low from about –500 to –100milliseconds, and that the energy went low starting at about –200 milliseconds, although notnecessarily at the level of silence. The deltas indicated that the pitch tended to be flat from –500to –200ms, and that the energy also tended to be stable from –600 to 0. Before long he cameup with a predictive rule: in Chinese, respond with a back-channel if the interlocutor’s speechcontains:
• a low pitch region, below the 15th percentile and lasting at least 220ms, followed by
DRAFT 7
Figure 4: Overlaid Pitch, Energy, Delta Pitch and Delta Energy for Chinese
• a pause of at least 150ms
This predicted back-channel occurrences with 25% coverage and 9% accuracy. Improvement iscertainly possible, but the performance is well above random guessing, which gives 4% accuracy.
6 From Contours to Rules
Although contours may be fully adequate, as discussed in section 1, it is certainly also convenient,at least, to describe prosodic rules using a more symbolic representation, such as a conjoined setof clauses specifying what features must be present and how they must relate to each other intime. Among other things, such a representation can explicitly represent the degree to which thecomponent features may stretch internally or relative to each other.
Going from a contour-based description to a formal rule is, however, not easy. For example, thecontour shown in figure 1 for spanish has had two conversions to qualitative rules, that reportedin [Rivera and Ward, 2008] and the new rule seen in figure 6. The new rule was developed inpart because the code implementing the original rule was lost, but also because we wanted a rulewhose implementation would be cleaner. An example of an unclean implementation would be onethat first looks for one predictive feature, then hunts back and forth in the buffers and arrayslooking for the presence of the additional features. A somewhat more elegant approach is to storeall the necessary information at all times, so that, for example, at every frame there is an array

DRAFT 8
Figure 5: Overlaid Pitch, Energy, Delta Pitch and Delta Energy for Spanish
value for every possible low-level feature of interest (current-frame-is-low-pitch, currently-in-a-low-pitch-region, time-stince-start-of-low-pitch-region, etc.).
Possibly the most elegant (or at least, efficient in terms of computation and memory) is toimplement a rule as a finite state machine that operated on-line, processing the speech inputframe by frame. This new rule was relatively straightforward to implement in this way, as seenin Figure 7. This new rule gives a coverage of 26% and an accuracy of 13%.
7 Future Work
From the experience discovering the Chinese pre-backchannel pattern, we conclude that thisvisualization method has value.
However it clearly has room for improvement. Consider Figure 5, displaying the contextsof 152 back-channels in Spanish [Rivera and Ward, 2008]. Some things are evident, including adearth of high-pitch points, a clear quiet region pause in the last quarter second, and possibly atendency for flat pitches from -1500 to -1000, as seen from the deltas. However there is not muchelse to see, even knowing the pattern we expect to find.
There are several possible ways to improve these visualizations. One could explicitly displayduration or rate. One could make the features more robust, for example by computing the energydeltas over frames wider than 10 ms. One might apply a thinning algorithm to visually accentuatethe tendencies, to turn cloudy streaks into nice curves. Finally, one could improve the way the

DRAFT 9
Predict a back-channel starting 350 ms after all of the followingconditions hold:
A. a low-pitch region,< 26th percentile and 50–500ms in length
B. a high-pitch region for at least one moment,starting > 75th percentile and never < the 26th
C. a lengthened vowel of duration >= 100 msD. a pause >= 100ms
WhereB closely follows A:
30-750 ms from end of low to start of highC closely follow B:
0-100ms from start of high to start of lengthened vowelD closely follows C:
0-60ms from end of lengthened vowel to start of pause
Figure 6: A rule for predicting back-channel opportunities in Spanish
Figure 7: Finite state machine for making back-channel predictions for Spanish

DRAFT 10
horizontal alignment is done in generating the overlays. As reaction times vary, the time fromthe prosodic cue, whatever it may be, to the response will not be constant. It may be possibleto devise an expectation-maximization algorithm, where the horizontal alignments are iterativelyadjusted to make the pitch contours align better.
Although contour-based descriptions have limitations, their discovery will be easier with thisnew tool, the overlaid prosodic display, and this may also be a generally useful addition to theprosodic analysts’ toolbox.
References
[Bolinger, 1986] Bolinger, D. (1986). Intonation and Its Parts. Stanford University Press.
[Canavan and Zipperlen, 1996] Canavan, A. and Zipperlen, G. (1996). CALLHOME MandarinChinese Speech. Linguistic Data Consortium. LDC Catalog No. LDC96S34, ISBN: 1-58563-080-2.
[Cohen et al., 2004] Cohen, M. H., Giangola, J. P., and Balogh, J. (2004). Voice User InterfaceDesign. Addison-Wesley.
[Edlund et al., 2009] Edlund, J., Heldner, M., and Pelce, A. (2009). Prosodic features of veryshort utterances in dialogue. In Nordic Prosody - Proceedings of the Xth Conference, pages56–68.
[Gratch et al., 2007] Gratch, J., Wang, N., Okhmatovskaia, A., Lamothe, F., Morales, M., van derWerf, R., and Morency, L. (2007). Can Virtual Humans Be More Engaging Than Real Ones?Lecture Notes in Computer Science, 4552:286–297.
[Gravano and Hirschberg, 2009] Gravano, A. and Hirschberg, J. (2009). Backchannel-invitingcues in task-oriented dialogue. In Interspeech, pages 1019–1022.
[Hollingsed and Ward, 2007] Hollingsed, T. K. and Ward, N. G. (2007). A combined method fordiscovering short-term affect-based response rules for spoken tutorial dialog. In Workshop onSpeech and Language Technology in Education (SLaTE).
[Huang et al., 2010] Huang, L., Morency, L.-P., and Gratch, J. (2010). Parasocial consensussampling: Combining multiple perspectives to learn virtual human behavior. In 9th Int’l Conf.on Autonomous Agents and Multi-Agent Systems.
[Morency et al., 2010] Morency, L.-P., de Kok, I., and Gratch, J. (2010). A probabilistic mul-timodal approach for predicting listener backchannels. Autonomous Agents and Multi-AgentSystems, 20:70–84.
[Raux and Eskenazi, 2009] Raux, A. and Eskenazi, M. (2009). A finite-state turn-taking modelfor spoken dialog systems. In NAACL HLT.
[Rivera and Ward, 2008] Rivera, A. G. and Ward, N. (2008). Prosodic cues that lead to back-channel feedback in Northern Mexican Spanish. In Proceedings of the Seventh Annual HighDesert Linguistics Society Conference. University of New Mexico.

DRAFT 11
[Rosenberg, 2010] Rosenberg, A. (2010). Classification of prosodic events using quantized contourmodeling. In HLT-NAACL 2010, pages 721–724.
[Shriberg and Stolcke, 2004] Shriberg, E. E. and Stolcke, A. (2004). Direct modeling of prosody:An overview of applications in automatic speech processing. In Proceedings of the InternationalConference on Speech Prosody, pages 575–582.
[Skantze and Schlangen, 2009] Skantze, G. and Schlangen, D. (2009). Incremental dialogue pro-cessing in a micro-domain. In EACL, pages 745–753.
[Ward and Al Bayyari, 2006] Ward, N. and Al Bayyari, Y. (2006). A case study in the iden-tification of prosodic cues to turn-taking: Back-channeling in Arabic. In Interspeech 2006Proceedings.
[Ward and Al Bayyari, 2007] Ward, N. and Al Bayyari, Y. (2007). A prosodic feature that invitesback-channels in Egyptian Arabic. In Mughazy, M., editor, Perspectives on Arabic LinguisticsXX, pages 186–206. John Benjamins.
[Ward and Tsukahara, 2000] Ward, N. and Tsukahara, W. (2000). Prosodic features which cueback-channel responses in English and Japanese. Journal of Pragmatics, 32:1177–1207.
[Ward et al., 2006] Ward, N. G., Novick, D. G., and Salamah, S. I. (2006). The utep corpus ofiraqi arabic. Technical Report UTEP-CS-06-02, University of Texas at El Paso, Department ofComputer Science.
Appendix
Section 3 mentioned that the average distributions were subtracted out, in order to “clear up” thedisplay and reveal more patterns. This appendix shows diagrams for three additional languages,first to show the value of subtracting the means, and second to provide futher illustrations of theinformation that can be seen in such diagrams.

DRAFT 12
Figure 8: Pitch (top) and Energy (bottom) for Egyptian, without subtracting means
Figure 9: Pitch and Energy for Egyptian, after subtraction
For Egyptian Arabic, the various visualizations (Figures 8–11, based on the contexts of 393back-channels) [Ward and Al Bayyari, 2007] are informative. The pitch tends to drop off ataround –600ms and the energy also drops down below the 60th percentile at –600ms. Thereis an indication of a flat pitch region from –2500ms to –750ms in the delta pitch plot, and deltaenergy is fairly flat from –800ms up until the backchannel.

DRAFT 13
Figure 10: Delta Pitch and Energy for Egyptian, without subtraction
Figure 11: Delta Pitch and Energy for Egyptian, after subtraction

DRAFT 14
Figure 12: Iraqi Arabic, without means subtracted, Pitch and Energy
Figure 13: Iraqi Arabic, with means subtracted
For Iraqi Arabic, in Figures 12–15, based on 556 instances [Ward et al., 2006,Ward and Al Bayyari, 2006], we see an indication of a low pitch region below the 20th percentilefrom –500ms to –250ms, with fewer pitch points thereafter. The energy is fairly high around–1000ms to –500ms, but it then drops below the 25th percentile until the backchannel, indicatingthat there is typically a pause before the other person backchannels; a tendency that, incidentally,was more extreme in the Egyptian Arabic data, although that may be due to the fact that thatwas telephone data.
The delta pitch shows a consistent region of pitch from –1,300ms to –400ms and a very flatregion from –400ms to –250ms. After that, the pitch drops off. Delta energy seems to clustermostly between 10 and –10 throughout until the backchannel.

DRAFT 15
Figure 14: Iraqi Arabic Deltas, without means subtracted, Pitch and Energy
Figure 15: Iraqi Arabic Delta, with means subtracted

DRAFT 16
Figure 16: Pitch and Energy for American English, without subtracting means
Figure 17: Pitch and Energy for American English, after subtraction
For English, based on 309 back-channels, we see the expected low pitch region[Ward and Tsukahara, 2000], here below the 40th percentile, from around –1000ms to –500ms.For energy, it appears there is a high region from –1600ms to –300ms which then drops below the60th percentile around –300ms. Delta pitch seems to indicate a pitch drop around –500ms.

DRAFT 17
Figure 18: Delta Pitch and Energy for American English, without subtraction
Figure 19: Delta Pitch and Energy for American English, after subtraction
Thus it seems clear that subtracting the means helps to reduce the amount of noise in eachdisplay, revealing patterns that previous work had indicated we would find, and occasionally newones. The delta displays generally were uninformatively constantly flat until the subtractionswere done, but after subtracting the means, suggestive patterns sometimes became visible theretoo.
Acknowledgment
This work was supported in part by the NSF as Project No. 0415150 and by RDECOM via USCICT. We thank an anonymous Interspeech referee for comments.