data visualization and discovery
TRANSCRIPT
Oracle Analytics
Data Visualization and Discovery
UGF6164 – Sunday September 18th 2016

10/14/2016 2www.datavail.com
Data Visualization - Abstract
For years the ability to analyze data to discover new insights through impressive visualizations and rapid prototyping with custom, ad-hoc, or enterprise data has been out of reach for Oracle customers. Now as part of the Oracle BIEE system, Oracle BI Visual Analyzer (VA) technology has filled the gap with an integrated solution that gives business users and developers alike the power to gain insights through visual discovery. These visual discoveries can then be carried over as production-ready reports for stunning presentations and analysis using standardized Oracle BI subject areas or data mashups with custom data with Excel spreadsheets.
Attend this session to learn about Oracle Visual Analyzer and its ability to provide self service data discovery to compete with other data visualization tools on the market today like Tableau and how Visual Analyzer can be part of your next OBIEE implementation. Attendees will witness a demonstration of the Oracle BI Visual Analyzer solution taking a real-world business use case from end-to-end to learn how straightforward it is to tell a compelling story with data and prototype with greater speed of delivery, all while gaining insights to information with this new cutting-edge data visualization access.
10/14/2016 3www.datavail.com
Data Visualization - Objective
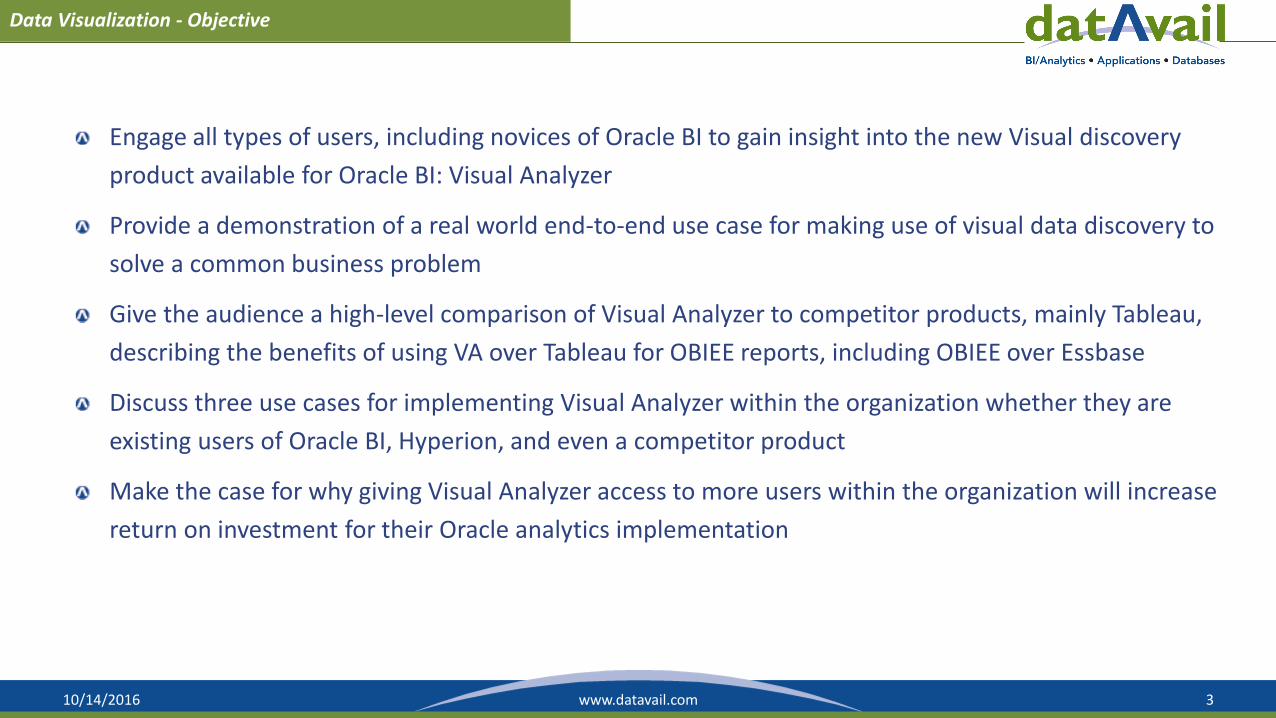
Engage all types of users, including novices of Oracle BI to gain insight into the new Visual discovery
product available for Oracle BI: Visual Analyzer
Provide a demonstration of a real world end-to-end use case for making use of visual data discovery to
solve a common business problem
Give the audience a high-level comparison of Visual Analyzer to competitor products, mainly Tableau,
describing the benefits of using VA over Tableau for OBIEE reports, including OBIEE over Essbase
Discuss three use cases for implementing Visual Analyzer within the organization whether they are
existing users of Oracle BI, Hyperion, and even a competitor product
Make the case for why giving Visual Analyzer access to more users within the organization will increase
return on investment for their Oracle analytics implementation

10/14/2016 4www.datavail.com
Introductions
Visual Analyzer
Demonstration
Desktop Visualization Tool
Data Visualization - Agenda

10/14/2016 5www.datavail.com
Data Visualization - Introduction
DataVail Oracle Analytics • Founded in 2013, the Art of BI Software has focused its efforts to data analytics, reporting, and providing organizations
across all industries with collaborative interaction with their data to make better business decisions. Now by being part of Datavail, Art of BI goes beyond project implementation providing ongoing support with Datavail’s powerful foundation of Operational support.
• Art of BI was acquired in 2016 by Datavail Corporation

10/14/2016 6www.datavail.com
Data Visualization - Introduction
Datavail Oracle Analytics
• Oracle Gold Partner
• Successfully implemented dozens of Oracle BI, Hyperion Essbase, Hyperion Planning, Oracle BI Applications, Data Warehouse and EPM Projects.
• Focused on quality to ensure continued Oracle BI Software sales and quality reference for both Art of BI Software and Oracle
• Oracle BI 12c beta test Partner
• Oracle BI/EPM Partner Council
• 24x7 Operational Support & Managed Services for Oracle Analytics (OBIEE / Hyperion)
10/14/2016 7www.datavail.com
Data Visualization - Introduction
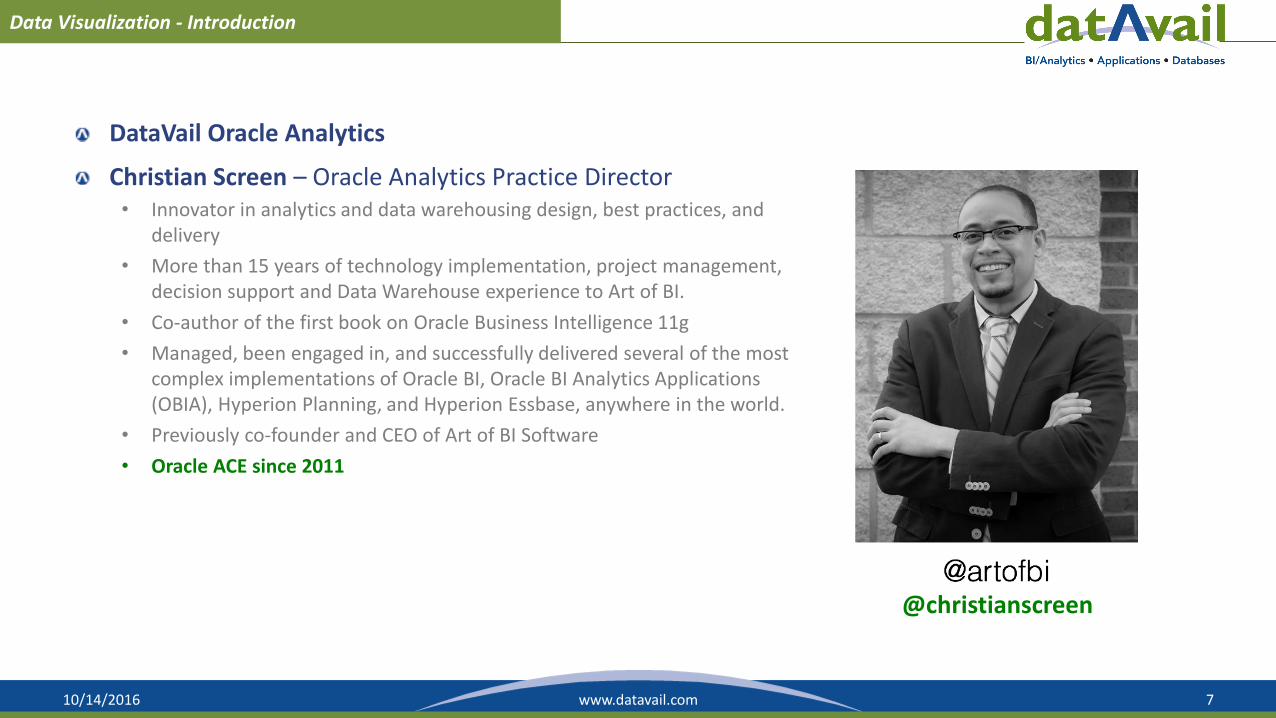
DataVail Oracle Analytics
Christian Screen – Oracle Analytics Practice Director• Innovator in analytics and data warehousing design, best practices, and
delivery
• More than 15 years of technology implementation, project management, decision support and Data Warehouse experience to Art of BI.
• Co-author of the first book on Oracle Business Intelligence 11g
• Managed, been engaged in, and successfully delivered several of the most complex implementations of Oracle BI, Oracle BI Analytics Applications (OBIA), Hyperion Planning, and Hyperion Essbase, anywhere in the world.
• Previously co-founder and CEO of Art of BI Software
• Oracle ACE since 2011
@christianscreen

Oracle Visual Analyzer
10/14/2016 9www.datavail.com
Data Visualization
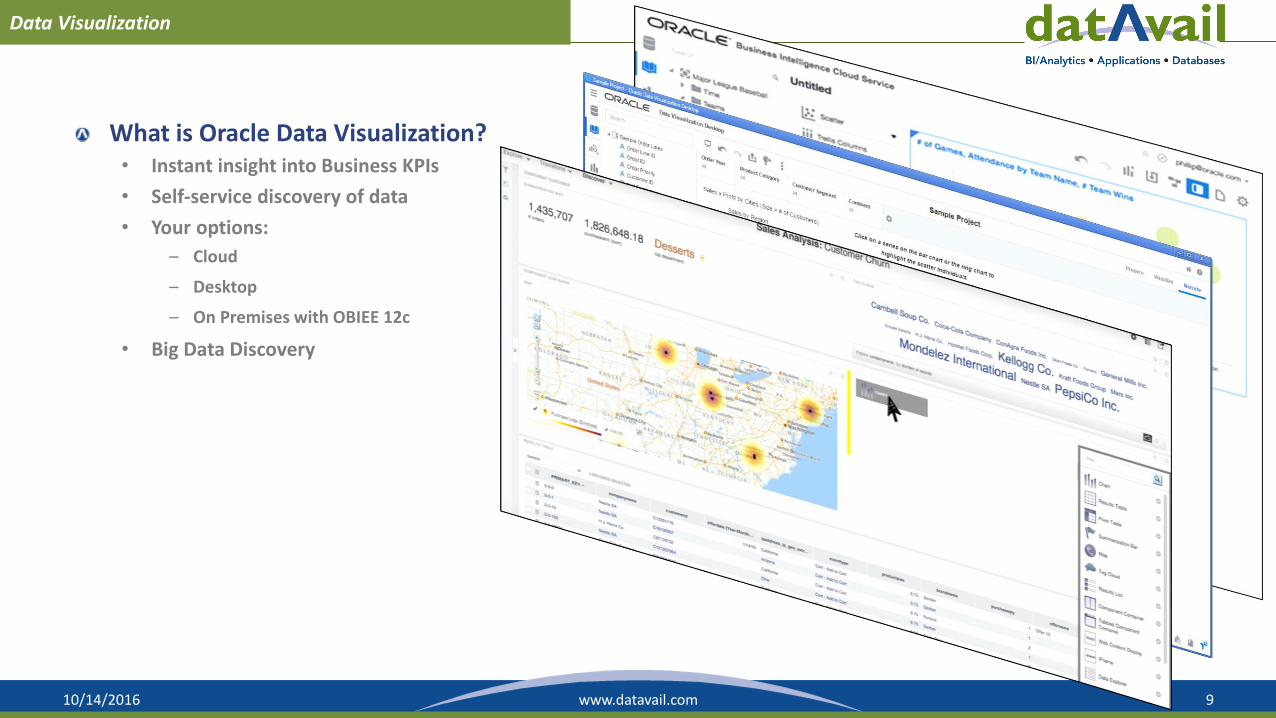
What is Oracle Data Visualization?• Instant insight into Business KPIs
• Self-service discovery of data
• Your options:
– Cloud
– Desktop
– On Premises with OBIEE 12c
• Big Data Discovery

10/14/2016 10www.datavail.com
Data Visualization – BI Cloud
What is the Oracle BI Cloud?
• On-line Analytics Service Subscription
• Oracle’s BI SaaS Offering
• Rich feature set of centrally managed analytics tool
• Perfect for a line of business or departmental analytics solution
• Off-premise integration solution accessible from anywhere with bank grade security
• Mobile ready and always-on
10/14/2016 11www.datavail.com
Data Visualization – BI Cloud
Demo – BICS Mashups• Upload Spreadsheet
• Combine with Existing Data Set
• Report against a mash-up in a Subject Area

10/14/2016 12www.datavail.com
Data Visualization – BI Cloud
Moving Data to the BI Cloud Service is fairly straightforward
Several ways to achieve data flow• BICs Data Loader
• REST API
• SQL Developer GUI
• PL/SQL Data Import
• BICS Data Sync

10/14/2016 13www.datavail.com
Data Visualization – Use Cases
Use Case 1• Merging data from combined data source and departmental BI
Use Case 2• Data visualization Desktop
Use Case 3• See potential in Big Data via Big Data Discovery

Oracle Data Visualization Desktop

10/14/2016 15www.datavail.com
Data Visualization – Data Visualization Desktop
What is the Data Visualization Desktop?
• A standalone tool similar to allow individual self-service and analytics using mash-up and data blending
• Based on similar technology as Visual Analyzer
• A clean, intuitive, client software install
• A clear departmental BI/Analytics approach to solving the need for faster data creativity and analysis
Pre-Requisites:• Seems to not install on Windows Servers, only Windows 7 and above
• Operating System: Microsoft Windows x64 (64-bit) 7 SP1+, 8.1, or 10
• CPU: Intel(R) Core(TM)2 Duo CPU E8400 @ 3.00GHz, 2992 Mhz 2 Cores, 2 Logical Processors or faster
• Memory: 4.00 GB Memory or more
• Minimum free disk space: 2GB; plus space for any uploaded data files
• User privileges - User needs Admin privileges to install
10/14/2016 16www.datavail.com
Data Visualization – BI Cloud
Demo – Data Visualization Desktop (DVD)• Quick look at interactivity
• Basic Features
• Samples Review
• Data Source Connection Wizard

10/14/2016 18www.datavail.com
Data Visualization
What makes Oracle Data Visualization Stand Out?• Oracle’s Visual Analyzer is the answer to Tableau – Drag and drop inputs to instantly create compelling graphics
• Vast data integration capabilities with multiple data sources
• Enterprise level security
• KPI / Scorecard reports
• Multiuser development support
• Cache queries
• Community Growing, https://community.oracle.com/community/business_intelligence/data-visualization

Oracle Big Data Discovery

10/14/2016 20www.datavail.com
Big Data Discovery
Why Oracle Big Data Discovery?• Perfect for “Data Wrangling”
• Great for getting a Big Data implementation delivering information – See Big Data potential fast
– A quick way to see what “Big Data” your organization has collected
• Search, Guided Navigation, and interactive Visualizations
• Means to decrease risk of a Big Data POC or project with speed-up time to value
• Functionality to apply transformations to datasets, blend and push data back to HDFS

10/14/2016 21www.datavail.com
Big Data Discovery
What is the Oracle Big Data Discovery?• Part of the Oracle Big Data Analytics suite of products

10/14/2016 22www.datavail.com
Big Data Discovery
Oracle Big Data Discovery Here to Stay• Very powerful for spanning or introducing
Big Data to users at many skill levels
• Robust Visualizations
• A great way to get started with Big Data for Data Scientist
Summary

10/14/2016 24www.datavail.com
Data Visualizations – Wrap-up
Questions?