visual discrimination andadaptationusing non-linear ... discrimination andadaptationusing non-linear...
TRANSCRIPT

Visual discrimination and adaptation using
non-linear unsupervised learning
Sandra Jimenez, Valero Laparra and Jesus Malo
Image Processing Lab, Universitat de Valencia, Spain;http://isp.uv.es
ABSTRACT
Understanding human vision not only involves empirical descriptions of how it works, but also organizationprinciples that explain why it does so.1 Identifying the guiding principles of visual phenomena requires learningalgorithms to optimize specific goals. Moreover, these algorithms have to be flexible enough to account for thenon-linear and adaptive behavior of the system.
For instance, linear redundancy reduction transforms certainly explain a wide range of visual phenomena.2–9
However, the generality of this organization principle is still in question:10 it is not only that and additionalconstraints such as energy cost may be relevant as well,11 but also, statistical independence may not be the bettersolution to make optimal inferences in squared error terms.12–14 Moreover, linear methods cannot account for thenon-uniform discrimination in different regions of the image and color space: linear learning methods necessarilydisregard the non-linear nature of the system. Therefore, in order to account for the non-linear behavior,principled approaches commonly apply the trick of using (already non-linear) parametric expressions taken fromempirical models.15–17 Therefore these approaches are not actually explaining the non-linear behavior, but justfitting it to image statistics. In summary, a proper explanation of the behavior of the system requires flexibleunsupervised learning algorithms that (1) are tunable to different, perceptually meaningful, goals; and (2) makeno assumption on the non-linearity.
Over the last years we have worked on these kind of learning algorithms based on non-linear ICA,18 Gaus-sianization,19 and principal curves.14,20 In this work we stress the fact that these methods can be tuned tooptimize different design strategies, namely statistical independence, error minimization under quantization, anderror minimization under truncation. Then, we show (1) how to apply these techniques to explain a number ofvisual phenomena, and (2) suggest the underlying organization principle in each case.
Keywords: Color discrimination, Color Adaptation, Color after-effects, Contrast Masking, Non-linear opponentchannels, Unsupervised learning, Infomax, Error minimization, Dimensionality reduction
1. NON-LINEAR TECHNIQUES SUITED TO VISION SCIENCE
Explanation of visual phenomena through unsupervised learning is based on considering the stimuli (colors,images or even sequences) as vectors, x, in a multidimensional space.8 Then, one assumes a set of sensors ormechanisms that transform the input stimulus into a set of responses (the vector r):
xR
((r
R−1
hh (1)
The idea is designing the set of sensors (or the transform R) so that it achieves certain criterion. If this procedurereproduces some empirical behavior one may conclude that the visual system behaves like that because it isoptimized for such stimuli and such goal. Nevertheless, note that a plausible organization principle is not theonly requirement in vision science applications: it is also necessary that the algorithm makes experimentallytestable predictions. To this end, invertibility and easy computation of discrimination measures in the input
corresponding author: [email protected] work has been funded by the project CICYT TIN2012-38102-C03-01

Figure 1. Learning approach 1: identifying the curvilinear features in the data. Here the 2D synthetic dis-tributions (top row) are unfolded and equalized (bottom row) using Sequential Principal Curves Analysis14 using eitherEuclidean metrics (left), PDF-dependent infomax metric (center) or error minimization metric (right). The error andMutual Information numbers below indicate the optimality according to different criteria. The same sequential strategyis used in Principal Polynomial Analysis (Fig. 4).
Original dataRBIG 1 iteration RBIG 7 iteration
RBIG 15 iterationRBIG 120 iteration
Figure 2. Learning approach 2: ignoring the relevant features to transform the data into a multivariate
Gaussian. Transform of the same synthetic data as in Fig. 1 using Rotation-Based Iterative Gaussianization.19
space is highly desirable. Note that these are unusual properties in the plethora of techniques constantly emergingfrom the machine learning community. Invertibility implies that the relevant features for a particular goal canbe analyzed in the stimulus domain, where perception experiments operate. The ability to derive discriminationmetrics is a fundamental issue since threshold measurement is a major paradigm in psychophysics.
According to the above, we developed invertible methods to learn the transform R under different optimalitycriteria (information maximization or error minimization) assuming limited resources: either limited numberof sensors (dimensionality reduction) or sensors with limited resolution (quantization). In order to adapt thetransform to the stimulus statistics one may take two different strategies:
• Identify the meaningful directions determined by the regularities of the data (Fig. 1).
• Mapping the input into a domain where the statistical properties are perfectly determined (in our casetransformed data have a Gaussian distribution). This strategy implies no restriction in the transformationthus ignoring regularities in the data (Fig. 2).
In the past years we pursued both. The first approach gave rise to sequential algorithms in which one curvilinearfeature is identified after the other, namely, our Sequential Principal Curves Analysis (SPCA),14 and our PrincipalPolynomial Analysis (PPA)20∗. The second approach gave rise to a Probability Density Estimation algorithm
∗While SPCA is non-parametric, PPA (much faster) assumes that the relevant features are flexible polynomials.

Figure 3. RBIG discrimination ellipsoids using infomax metric (left) or error minimization metric (right) for the syntheticdata in red. The metrics are computed estimating the local PDF and using the appropriate exponent.12,14 As in theSPCA case (Fig. 1) infomax leads to bigger differences in the size of discrimination ellipses.
Figure 4. PPA transform and discrimination ellipsoids. Left: input domain and samples from a curved manifold in 3Dspace. Center: PPA representation by unfolding along the identified curvilinear features (in black). Right: whitened PPAdomain. The PDF adapted metric in the input domain is computed by assuming Euclidean discrimination in the finaldomain (spheres at the right).
that is able to turn any training dataset into a multivariate Gaussian, namely our Rotation-Based IterativeGaussianization (RBIG).19
Invertibility together with basic Riemannian geometry allows to compute the discrimination metric in thestimulus domain as previously done with empirical divisive-normalization models.21,22 Moreover, using the localdensity information SPCA and RBIG can be tuned to compute discrimination metrics optimized according toeither infomax or error minimization criteria under quantization †. On the other hand, PPA is formulated tominimize the representation error under dimensionality reduction.
Figures 2-4 illustrate how these transforms work and the discrimination ellipsoids obtained according todifferent optimality criteria. The behavior illustrated here is used below to make particular predictions in visualadaptation and discrimination.
2. A GALLERY OF PREDICTIONS
Color discrimination from Gaussianization. Color discrimination is non-uniform across the color space dueto the non-linear response of the opponent color sensors.23,24 RBIG, originally developed for infomax,19 can alsobe tuned to compute discrimination metrics according to an error minimization strategy (Fig. 3). Fig. 5 showsthe MacAdam color discrimination ellipses predicted using RBIG under both criteria. In this case, in agreementwith previous literature focused on cardinal axes only,12,14 error minimization (for limited resolution sensors)seems to be a more plausible organization principle rather than component independence.
Contrast masking from Sequential Principal Curves Analysis. The response of pattern analyzers isnon-linear, and it is strongly attenuated (masked) if the test pattern is shown on top of backgrounds of similarfrequency, while it is not severely affected if the test pattern is shown on top of backgrounds of very differentfrequency.25 Fig. 6 shows that this is the case for SPCA sensors, originally tested in color vision problems,14
†It is possible to tune PPA in the same way but the algorithm has to be slightly modified.

0 0.2 0.4 0.6 0.8
0
0.1
0.2
0.3
0.4
0.5
0.6
0.7
0.8
x
y
INFOMAXFitting error = 2.61
0 0.2 0.4 0.6 0.8
0
0.1
0.2
0.3
0.4
0.5
0.6
0.7
0.8
x
y
ERRORMINFitting error = 1.25
Figure 5. Color discrimination ellipses using Infomax and Error Minimization coding strategies using Gaussianizationtransforms. Predictions (in black) have to be compared with experimental MacAdam ellipses (in red).
optimized either using a infomax or error minimization criteria. Nevertheless, the steepness of the non-linearityis different so this can be used to determine which is actually the principle underlying this behavior.
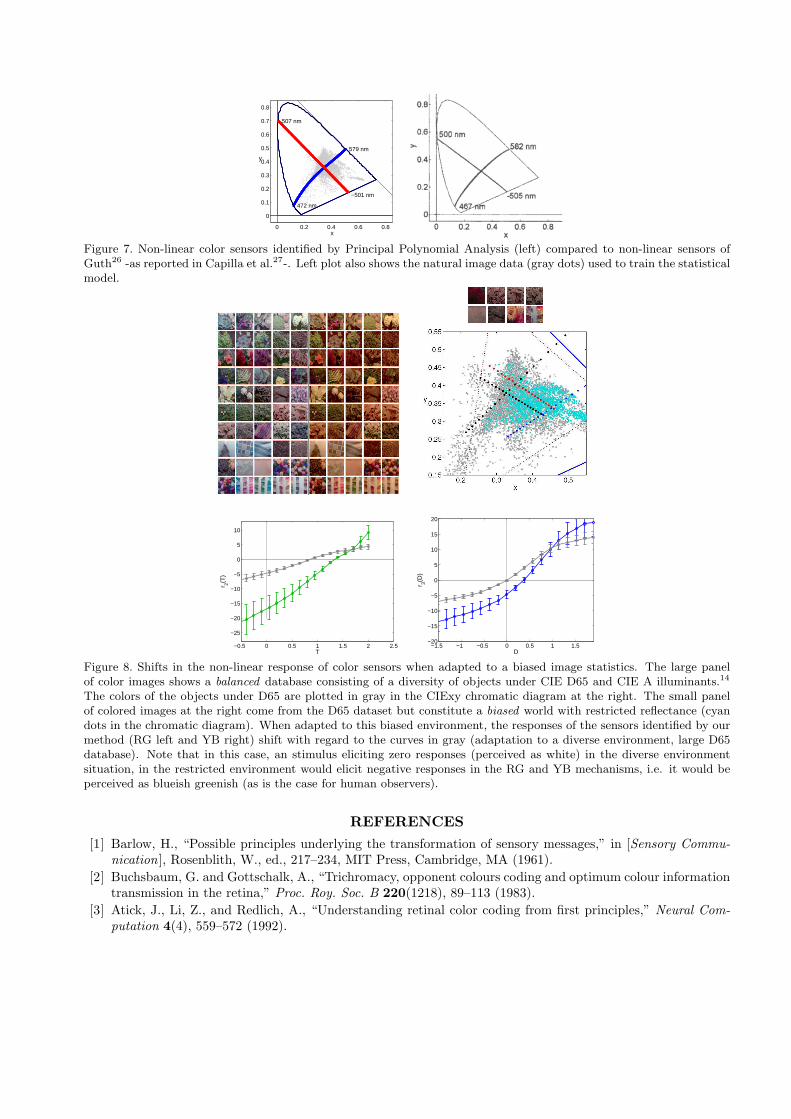
Non-linear color sensors from Principal Polynomial Analysis. Color appearance is better explainedusing sensors tuned to curves (rather than lines) in the color space.26,28 These curves can be explained accordingto an error minimization principle by using Principal Polynomial Analysis. See Fig. 7 for the predicted colorsensors using this technique.
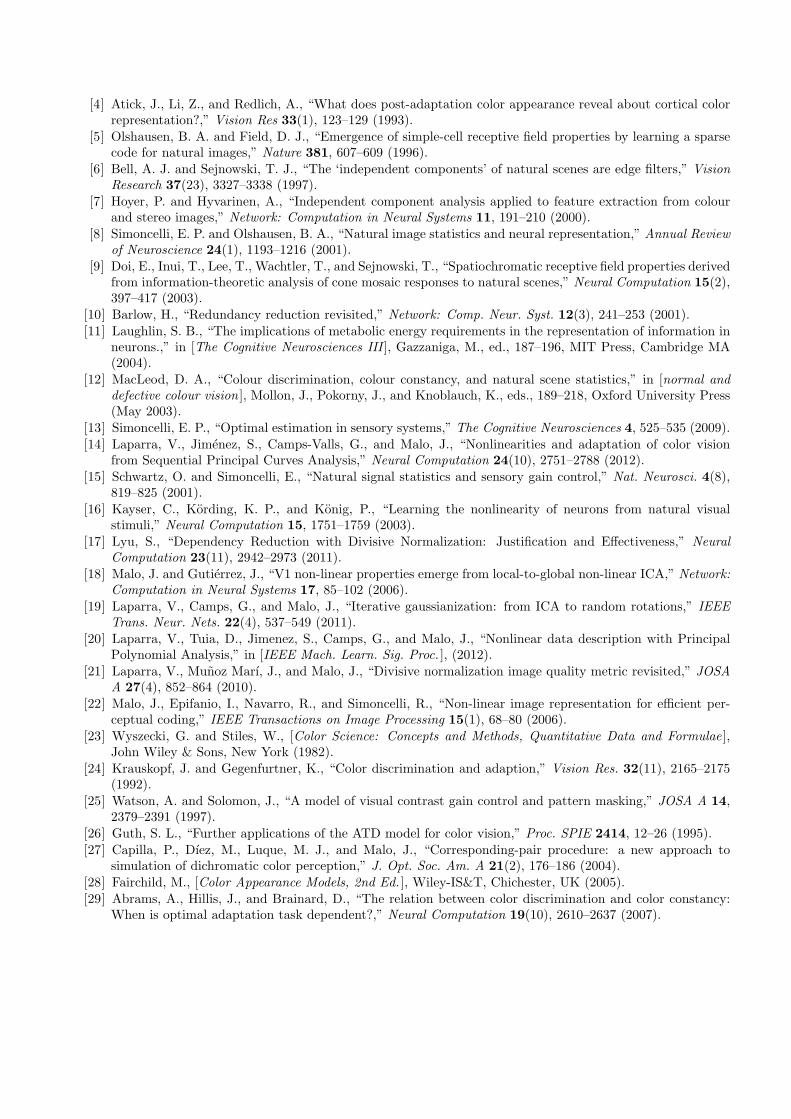
Color aftereffects from Sequential Principal Curves Analysis. It is known that adaptation to partic-ular colored backgrounds induces specific color aftereffects (wrong color judgements) when looking at somewhereelse.28 Statistical analysis based on empirical models suggest that this could come from an adaptation to abiased statistics, e.g. a restricted environment made of samples with specific reflectance.29 This effect can alsobe reproduced using non-parametric analysis (i.e. not based in the non-linear expressions of the empirical mod-els), thus showing that the behavior directly emerges from data and the appropriate goal. Fig. 8 shows thatthe non-linear responses of Red-Green and Yellow-Blue mechanisms identified by Sequential Principal CurvesAnalysis (tuned for error minimization) shift under biased statistics.
Figure 6. Non-linearities and masking of frequency sensors using Infomax (left) and Error Minimization (right) codingstrategies through Sequential Principal Curves Analysis. Plots show the response of the sensors as a function of thecontrast of the test for different masking conditions (form low contrast mask -solid line-, to high contrast mask -red line-).Top row shows the behavior when mask and test have similar frequency content. Bottom row shows the behavior whenmask and test have different frequency content.
0 0.2 0.4 0.6 0.8
0
0.1
0.2
0.3
0.4
0.5
0.6
0.7
0.8
x
y
472 nm
579 nm
−501 nm
507 nm
Figure 7. Non-linear color sensors identified by Principal Polynomial Analysis (left) compared to non-linear sensors ofGuth26 -as reported in Capilla et al.27-. Left plot also shows the natural image data (gray dots) used to train the statisticalmodel.
−0.5 0 0.5 1 1.5 2 2.5
−25
−20
−15
−10
−5
0
5
10
T
r 2(T)
−1.5 −1 −0.5 0 0.5 1 1.5−20
−15
−10
−5
0
5
10
15
20
D
r 3(D)
Figure 8. Shifts in the non-linear response of color sensors when adapted to a biased image statistics. The large panelof color images shows a balanced database consisting of a diversity of objects under CIE D65 and CIE A illuminants.14
The colors of the objects under D65 are plotted in gray in the CIExy chromatic diagram at the right. The small panelof colored images at the right come from the D65 dataset but constitute a biased world with restricted reflectance (cyandots in the chromatic diagram). When adapted to this biased environment, the responses of the sensors identified by ourmethod (RG left and YB right) shift with regard to the curves in gray (adaptation to a diverse environment, large D65database). Note that in this case, an stimulus eliciting zero responses (perceived as white) in the diverse environmentsituation, in the restricted environment would elicit negative responses in the RG and YB mechanisms, i.e. it would beperceived as blueish greenish (as is the case for human observers).
REFERENCES
[1] Barlow, H., “Possible principles underlying the transformation of sensory messages,” in [Sensory Commu-
nication ], Rosenblith, W., ed., 217–234, MIT Press, Cambridge, MA (1961).
[2] Buchsbaum, G. and Gottschalk, A., “Trichromacy, opponent colours coding and optimum colour informationtransmission in the retina,” Proc. Roy. Soc. B 220(1218), 89–113 (1983).
[3] Atick, J., Li, Z., and Redlich, A., “Understanding retinal color coding from first principles,” Neural Com-
putation 4(4), 559–572 (1992).
[4] Atick, J., Li, Z., and Redlich, A., “What does post-adaptation color appearance reveal about cortical colorrepresentation?,” Vision Res 33(1), 123–129 (1993).
[5] Olshausen, B. A. and Field, D. J., “Emergence of simple-cell receptive field properties by learning a sparsecode for natural images,” Nature 381, 607–609 (1996).
[6] Bell, A. J. and Sejnowski, T. J., “The ‘independent components’ of natural scenes are edge filters,” Vision
Research 37(23), 3327–3338 (1997).[7] Hoyer, P. and Hyvarinen, A., “Independent component analysis applied to feature extraction from colour
and stereo images,” Network: Computation in Neural Systems 11, 191–210 (2000).[8] Simoncelli, E. P. and Olshausen, B. A., “Natural image statistics and neural representation,” Annual Review
of Neuroscience 24(1), 1193–1216 (2001).[9] Doi, E., Inui, T., Lee, T., Wachtler, T., and Sejnowski, T., “Spatiochromatic receptive field properties derived
from information-theoretic analysis of cone mosaic responses to natural scenes,” Neural Computation 15(2),397–417 (2003).
[10] Barlow, H., “Redundancy reduction revisited,” Network: Comp. Neur. Syst. 12(3), 241–253 (2001).[11] Laughlin, S. B., “The implications of metabolic energy requirements in the representation of information in
neurons.,” in [The Cognitive Neurosciences III ], Gazzaniga, M., ed., 187–196, MIT Press, Cambridge MA(2004).
[12] MacLeod, D. A., “Colour discrimination, colour constancy, and natural scene statistics,” in [normal and
defective colour vision ], Mollon, J., Pokorny, J., and Knoblauch, K., eds., 189–218, Oxford University Press(May 2003).
[13] Simoncelli, E. P., “Optimal estimation in sensory systems,” The Cognitive Neurosciences 4, 525–535 (2009).[14] Laparra, V., Jimenez, S., Camps-Valls, G., and Malo, J., “Nonlinearities and adaptation of color vision
from Sequential Principal Curves Analysis,” Neural Computation 24(10), 2751–2788 (2012).[15] Schwartz, O. and Simoncelli, E., “Natural signal statistics and sensory gain control,” Nat. Neurosci. 4(8),
819–825 (2001).[16] Kayser, C., Kording, K. P., and Konig, P., “Learning the nonlinearity of neurons from natural visual
stimuli,” Neural Computation 15, 1751–1759 (2003).[17] Lyu, S., “Dependency Reduction with Divisive Normalization: Justification and Effectiveness,” Neural
Computation 23(11), 2942–2973 (2011).[18] Malo, J. and Gutierrez, J., “V1 non-linear properties emerge from local-to-global non-linear ICA,” Network:
Computation in Neural Systems 17, 85–102 (2006).[19] Laparra, V., Camps, G., and Malo, J., “Iterative gaussianization: from ICA to random rotations,” IEEE
Trans. Neur. Nets. 22(4), 537–549 (2011).[20] Laparra, V., Tuia, D., Jimenez, S., Camps, G., and Malo, J., “Nonlinear data description with Principal
Polynomial Analysis,” in [IEEE Mach. Learn. Sig. Proc. ], (2012).[21] Laparra, V., Munoz Marı, J., and Malo, J., “Divisive normalization image quality metric revisited,” JOSA
A 27(4), 852–864 (2010).[22] Malo, J., Epifanio, I., Navarro, R., and Simoncelli, R., “Non-linear image representation for efficient per-
ceptual coding,” IEEE Transactions on Image Processing 15(1), 68–80 (2006).[23] Wyszecki, G. and Stiles, W., [Color Science: Concepts and Methods, Quantitative Data and Formulae ],
John Wiley & Sons, New York (1982).[24] Krauskopf, J. and Gegenfurtner, K., “Color discrimination and adaption,” Vision Res. 32(11), 2165–2175
(1992).[25] Watson, A. and Solomon, J., “A model of visual contrast gain control and pattern masking,” JOSA A 14,
2379–2391 (1997).[26] Guth, S. L., “Further applications of the ATD model for color vision,” Proc. SPIE 2414, 12–26 (1995).[27] Capilla, P., Dıez, M., Luque, M. J., and Malo, J., “Corresponding-pair procedure: a new approach to
simulation of dichromatic color perception,” J. Opt. Soc. Am. A 21(2), 176–186 (2004).[28] Fairchild, M., [Color Appearance Models, 2nd Ed. ], Wiley-IS&T, Chichester, UK (2005).[29] Abrams, A., Hillis, J., and Brainard, D., “The relation between color discrimination and color constancy:
When is optimal adaptation task dependent?,” Neural Computation 19(10), 2610–2637 (2007).