visual detection of driving while intoxicated
TRANSCRIPT
THE VI" I ' ~ A L DETECTION OF DRIVING WHILE INTOXICATED
Field Test of Visual Cues and Detection Methods
Douglas H. Harris Robert A. Dick
Steven M. Casey Christopher J. Jarosz
ANACAPA SCIENCES, INC. P.O. Drawer Q
Santa Barbara, California 93102
_ /
Contract DOT-HS-7-1538:$271,834
,WILL
April 1980 FINAL REPORT
Document is available to the U.S. public through the National Techn ical Information Service •
Springfield, Virginia 22161
• .• prepared for
U.S. DEPARTMENT OF TRANSPORTATION.. N A T I O N A L HIGHWAY TRAFFIC S A F E T Y A D M I N I S T R A T I O N
Office of Driver and Pedestrian Research. "~
W a s h i n g t o n , D.C. 2 0 5 9 0 • "
/ '
?
• " , • J , , ' ~ h
If you have issues viewing or accessing this file contact us at NCJRS.gov.

• I t

q
NOTICE
This document is disseminated under the sponsorship of the Department of Transportation in the interest of information exchange. The United States Government assumes no liability for the contents or use thereof.
".:-!
• " " : , : I . . t . - , , " - p~b
2
AC, QU StIT ON

~S
~i~ ~ i ,~ i i ~ ~.ii ~. ~.- ~

TECHNICAL SUMMARY
CONTRACTOR
Anacapa Sciences, Inc.
REPORT Tri'hE
CONTRACT NUMBER
DOT-HS-7-1538
REPORT DATE THE VISUAL DETECTION OF DRIVING WHILE April 1980 INTOXICATED - Field Test of Visual Cues and Detection Methods
REPORT AUTHOR(S)
Douglas H. Harris, Robert A. Dick, Steven M. Casey, Christopher J. Jarosz
Onthe-road detection of driving while intoxicated (DWI) involves the observation and interpretation of visual cues by police patrol officers. The effectiveness of DWI detection depends not only on the frequency with which patrol officers see and recognize cues indicative of DWI, but on the extent to which observed cues discriminate between DWI and driving while sober (DWS). This research project was conducted to answer the following questions: What visual cues occur frequently enough to be useful for DWI detection? To what extent do different cues discriminate between DWI and DWS? How can information on cue occurrence and discriminability be used best for on-the- road detection of DWI?
In the first phase of the project, reported earlier, the literature was reviewed, DWI detection experts were interviewed, a large sample of arrest reports was analyzed, and an on-the-road study of DWI detection was conducted to obtain data on the relative discriminability and frequency of occurrence of visual detection cues. The end product of the first phase was a set of conclusions about DWI detection, and a prototype DWI detection guide designed to facilitate application of the research findings to on-the-road detection of DWI.
In the second phase of the project, reported here, a DWI Detection Guide and an explanatory booklet were developed and tested. The Guide was a small card of white plastic printed with blue.
The field test of the Guide was conducted with a sample of i0 law enforcement agencies at locations throughout the United States. The test was designed to provide both longitudinal and cross-secti0nal analyses of several measures likely to reflect the impact and utility of using the Guide, and to verify the values contained in the Guide.
(Continued)
PREPARED FOR THE DEPARTMENT OF TRANSPORTATION, NATIONAL HIGHWAY TRAFFIC SAFETY ADMINSTRATION, UNDER CONTRACT NO. DOT-HS-7-1538. THE OPINIONS, FINDINGS, AND CONCLUSIONS EXPRESSED IN-THIS PUBLICATION ARE THOSE OF THE AUTHORS AND NOT NECESSARILY THOSE OF THE NATIONAL HIGI-BVAY TRAFFIC SAFETY ADMINSTRATION.


Use of the Guide was accompanied by a statistically significant overall increase in DWI arrest rate of 12 percent• Rates during a 3-month period, in which the Guide was used, were compared to a 12-month baseline period. Five individual agencies had significant increases of up to 94 percent; four agencies had no change; and one agency had a significant decrease.
Although there were no statistically significant changes in detection practices reflected by greater use of the more discriminating cues or by arrests of drivers with lower BAC levels, trends were in those directions.
Experienced police officers who used the Guide expressed doubts about its value in improving their own DWI enforcement ability. However, they considered the Guide to be valuable for increasing patrol sensitivity to important cues, training new patrol officers, preparing DWI arrest reports, and supporting court testimony•
Field-test results led to a couple of minor modifications in the Guide and the explanatory booklet• DWI detection probabilities were based on combined data from the early detection study and from the field test, thus providing a data base of 4662 detection events. Several other minor modifications were made to further simplify and clarify the Guide• The resulting DWI Detection Guide is shown below.
DWI DETECTION GUIDE C h a n c e s in 100 of n igh t t ime dr iver wi th BAC equa l or g rea ler than .10
TURNING WITH WIDE RADIUS . . . . . . . . . . . . . . . . . . . . . . . . . . . . 65
STRADDLING CENTER OR LANE MARKER . . . . . . . . . . . . . . . . . 65
APPEARING TO BE DRUNK . . . . . . . . . . . . . . . . . . . . . . . . . . . . . . . GO
ALMOST STRIKING OBJECT OR VEHICLE . . . . . . . . . . . . . . . . . . GO
WEAVING . . . . . . . . . . . . . . . . . . . . . . . . . . . . . . . . . . . . . . . . . . . . . . . 60
DRIVING ON OTHER THAN DESIGNATED ROADWAY . . . . . . . 55
SWERVING . . . . . . . . . . . . . . . . . . . . . . . . . . . . . . . . . . . . . . . . . . . 55
SLOW SPEED (MORE THAN 10 MPH BELOW LIMIT) . . . . . . 50
STOPPING (WITHOUT CAUSE) IN TRAFFIC LANE . . . . . . . . 50
FOLLOWING TOO CLOSELY . . . . . . . . . . . . . . . . . . . . . . . . . . . . . 50
DRIFTING . . . . . . . . . . . . . . . . . . . . . . . . . . . . . . . . . . . . . . . . . . . . 50
TIRES ON CENTER OR LANE MARKER . . . . . . . . . . . . . . . . . . . . . . 45
BRAKING ERRAT CALLY 45
DRIVING INTO OPPOSING OR CROSSING TRAFFIC . . . . . . . . . . 45
SIGNALLING INCONSISTENT WITH DRIVING ACTIONS . . . . . 40
SLOW RESPONSE TO TRAFFIC SIGNALS . . . . . . . . . . . . . . . . . . 40
STOPPING INAPPROPRIATELY (OTHER THAN IN LANE) . . . ; 35
TURNING ABRUPTLY OR ILLEGALLY . . . . . . . . . . . . . . . . . . . . . . 35
ACCELERATING OR DECELERATING RAPIDLY . . . . . . . . . . . . . . 30
HEADLIGHTS OFF . . . . . . . . . . . . . . . . . . . . . . . . . . . . . . . . . . . . . . . 30
Specia~ ad ius tmen t to the cue va lues
• 2 or more cues observed: add 10 to the larger value
• BAC equal to or greater than .05: add 15 to the va lue obta ined for BAC equa] 11o or greater than .10
A short 16-mm sound film in color was produced to describe the detection cues and introduce the Guide•
2


I. I~*part No.
4. T,Ile and Subtitle
i ~. ~ovefnment Accession NO.
THE VISUAL DETECTION OF DRIVING WHILE INTOXICATED ~ield Test of Visual Cues and Detection Methods
7. A~,hor's) Douglas H. Harr is, Robert A. Dick, Steven M. Casey, and Christopher J. Jarosz
9, Pertarming Org~izet~on Name ~ d Address Anacapa Sciences, Inc. P.O. Drawer Q Santa Barbara, Ca l i fo rn ia 93102
12. Sponsoring Agency Name and Address
U.S. Department of Transportation National Highway T r a f f i c Safety Administrat ion Of f ice of Driver and Pedestrian Research Washington, DC 20590
is. s~ppl . . . . ,a,~Not., Inter im report:
Technical Report Documentation Page 3. Recipient~'s Catalog No.
5. Report Dale ;Apr i l 1980
6. Performing Organization Code
8. Performing Organization Report No.
32]-2
10. Work Unit No. (TRAIS)
| 1. Contract or Grant No.
DOT-HS-7-1 538 13. Type of Report and Period Covered
Final Report February 1979 - May 1980
]4. Sponsoring Agency Code
Harris, D. H., Howlett, J. B. and Ridgeway, R G. The visual detection of driving while intoxicated, project interim report: Identifi- cation of visual cues and development of detection methods. Anacapa Sciences, Inc. for NHTSA~ January 1979. (PB 80 108 327)
16. Abstract
A Drunk Driver Detection Guide was developed and tested at a sample of I0 law enforcement agencies at locations throughout the United States. The test was designed to provide both longi tudinal and cross-sect ional analyses of several mea- sures l i k e l y to r e f l ec t the impact and u t i l i t y of using the Guide, and to ver i fy the values contained in the Guide.
Use of the Guide was accompanied by a s t a t i s t i c a l l y s i gn i f i can t overal l increase in DWI arrest rate of 12 percent. Rates during a three-month period, in which the Guide was used, were compared to a 12-month baseline period. Five indiv idual agencies had s ign i f i can t increases of up to 94 percent; four agencies had no change; and one agency had a s i gn i f i can t decrease.
The DWI p robab i l i t y values contained in the Guide were ver i f i ed by the f i e l d - t e s t resul ts . Average values obtained during the f i e l d tes t were essent ia l l y the same as average values on the Guide, and Guide values for indiv idual cues correlated s i g n i f i c a n t l y with corresponding values calculated from f i e l d - t e s t data.
Experienced pol ice o f f i ce rs who used the Guide expressed doubts about i t s value in improving the i r own DWI enforcement a b i l i t y . However, they considered the Guide to be valuable for increasing patrol s e n s i t i v i t y to important cues, t ra in ing new patrol o f f i ce rs , preparing DWI arrest reports, and supporting court testimony.
|7% Key Words 18. Distribution Statement Detection Drinking Drivers DWI Enforcement Visual Cues
]9. Sec~rtty C|assl|. (ol this report)
UNC LASS I FI ED
Form DOT F 1700.7 (e-72)
Document is avai lable to the U.S. public through the National Technical Information Service, Spr ing f ie ld , V i rg in ia 22161
20. Security Classif. (of this page)
UNCLASSIFIED
Reproduction of completed page authorized
i l l / i v
-2|. No. of Pages 22. Price


PREFACE
This is the second of two reports prepared under Contract DOT-HS-7-
01538 on the visual detection of dr iv ing while intoxicated. The i n i t i a l
report described the iden t i f i ca t ion of visual cues and development of
detection methods that led to a Drunk Driver Detection Guide. This report
describes the Guide, and the f i e l d test conducted to evaluate and ve r i f y the Guide.
The study involved the par t i c ipa t ion of 10 d i f fe ren t pol ice agen-
cies; without the cooperation and support of these agencies the work would
not have been possible. We are grateful for the exceptional contr ibut ions
to the project of the administrat ive and patrol personnel of these agen-
cies. The agencies, along with our pr inc ipal point of contact, are l i s ted below in alphabetical order.
Albuquerque (New Mexico) Police Department: Lieutenant John Nelson
Englewood (Colorado) Police Department: Captain Allan stanley
Eugene (Oregon) Police Department: Sergeant Robert Laws
Evansvil le (Indiana) Police Department: Captain James Kleeman
Monroe County (New York) Sher i f f ' s Off ice: Captain Robert Wilsey
Pulaski County (Arkansas) Sher i f f ' s Off ice: Lieutenant Jim Kemmeling
Santa Ana (Cal i forn ia) Police Department: Lieutenant Jack Nelson
Tacoma (Washington) Police Department: Captain Phil Sessions
Topeka (Kansas) Police Department: Major Dan Mallory
Vanderburgh County (Indiana) Sher i f f ' s Off ice: Sergeant Jim Fravel
The Contract Technical Manager of th is phase of the project was Mr.
Wil l iam C. Wheeler, Jr . ; we are appreciative of the assistance and support he provided.
Data processing was designed and conducted by Mr. Curtiss Mosso,
Computer Center, University of Ca l i fo rn ia at Santa Barbara, using the
S ta t i s t i ca l Analysis System (SAS).


i t r
\
< :
A p p r o x i m a t e C o n v e r s i o n s to M e t r i c M e a s u r e s
Symbol Whxn You Know Mu l t i p l y by To Find Symbo l
[ E N G T t l
in inches "2.5 Centimelers cm f! feel 30 ee. l imeter$ cm yd yards 0.9 meters m mi miles 1.6 kilo~nelerS km
in2 sq*lare inches tt 2 Sq;lare IIJul
yd '~ equals yald$ n, 2 square mi les
acres
o l ounces Ib po . .ds
sh ot't Ions C2000 Ib}.
A R E A
6,5 sq.aro contimefore 6182 0.09 square motels nl 2 0.8 Sq~are ,~.!l(,r s m 2 2.6 Sq.a,e k i l~ .u te rs km 2
0.4 hectares ha
M A S S ( w e i g h t )
28 grams g 0.45 kdog;ame , kg O.g Ionnos I
V O t U M E
tsp teaspoons 5 mi l l i l i iees ml Tbsp tablespoons 15 m, l l i t l ters ml fl e l fluud minces 30 m i l l i l i l e l s ml c cups 0,24 l i ters I pt pmlS 0.47 l i (ers I qt . IlU~HS 0.~5 f i lets t pal ga l lo .s 3.8 l i ters I ft 3 cubic t~et 0.03 cubic n,etels m 3 Yd J cubic yards O.7G cubic meturs m 3
T E M P E I 1 A T U [ ? E ( e x a c t )
Fahrenheit 5 /9 (;~ f ler Cels ius temperature subtracting te,,~pefature
32)
~C
METRIC C0~VEilSION FACTORS
- - e t ~ S y m b o l
. - - e l
m - -
- ~ n v n . . _ m
- ~ - - k m
-Z z ~ " ' 2 ~
st, " ~ cm 2 _ _ U3 nl 2
- ~ km 2
• i, h e
_ _ e t
~ 2
-_--~_ ml -. ~ =o I
c~ - - . | i
.... : : m ]
.-..2- ~ = ~
- " - ' 2 ~
- ~-- ~" °c
. . . . . I;
A p p r o x i m a t e C o n v e r s i o n s f r o m M e t r i c M e a s u r e s
W h x n You K n o w M u l t i p l y by To Find
L E N G T H
Symbo l
mill in~Jters 0.04 inches in centimeters 0.4 i .ches in mututs 3.3 • feet ft mt~terS 1.1 yards yd kihxneters 0.6 mi les mi
A R E A .
square centimeters O.IG square inches square n~lore 1.2 squale yazds square k i l~no lors 0.~ squale mi les hectares (10,000 m 2) 2.S acres
M A S S ( w e i g h t )
grams 0.035 Ounces ki log,ame 2.2 po, md S. tonnes ( I000 kg) 1.1 short to~s
V O L U M E
m i l l i l i l e r l 0 .03 fluid ounces l l te fs 2.1 pints lilex s 1.06 • quai ls l i le lS 0.26 .: !' ' galloczs cl lblc molars 35 cubic feet C|lflic (TI~IOIS l .~ CUI}ic y~lld$
T E M P E R A T U R E ( e x a c t )
Ce ls ius 9 /5 Hhen Fahrenheit tu.lperafuro add 32) temperature
o F 32 98.6 2p2
, ! B10 0 ~0 60 IO0 3r °C
OF
- 4 0 0 ] . _ . , l ~ L ~ l i I i
--40 -?0 o C
in x yd 2 ml 2
f l os pt qt
~=gal i f ) vd z
• t ,n k 2.54 f, , . j , t l ) l . l ,~ ,,ll.., i,.,t, t c, . ,v,. l~,, . . . . i . . l .,~.,, it,,t,t,h,d t,lbu,~, ~e*, fJUS ;.t,~,l. P.bl..~Hej, .~"
u~


TABLE OF CONTENTS
Page
TECHNICAL SUMMARY . . . . . . . . . . . . . . . . . . . . . . . . . 1
INTRODUCTION . . . . . . . . . . . . . . . . - . . . . . . . . . . . 5
Background • . . . . . . . . . . . . . . . . . . . . . . . . 6 F i e l d - T e s t O b j e c t i v e s • . . . . . . . . . . . . . . . . . . . 10
METHOD . . . . . . ~ . . . . . . . . . . . . . . . . . . . . • • • 12
F i e l d - T e s t Des ign . . . . . . . . . . . . . . . . . . . • • • 12 P a r t i c i p a t i n g Agenc ies . . . . . . . . . . . . . . . . . . . 15 F i e l d - T e s t P rocedu res . . . . . . . . . . . . . . . . . . . . 15
RESULTS . . . . . . . . . . . . . . . . . . . . . . . . . . . . . . 21
I m p a c t on DWI A r r e s t Rates . . . . . . . . . . . . . . . . . 21 Changes i n DWI D e t e c t i o n P r a c t i c e s . . . . . . . . . . . . . . 24 V e r i f i c a t i o n o f the Guide . . . . . . . . . . . . . . . . . . 26 O p i n i o n s o f Guide U t i l i t y . • . . . . . . . . . . . . . . . . . 34
CONCLUSIONS AND RECOMMENDATIONS 39
APPENDIX . . . . . . . . . . . . . . . . . . . . . . . . . . . . . A-I
LIST OF FIGURES
F i g u r e Page
I FIELD STUDY EXPERIMENTAL DESIGN . . . . . . . . . . . . 14
2 FORM FOR RECORDING DETECTION EVENTS . . . . . . . . . . 17
3 QUARTERLY DWI ARREST RATES FOR ALL 10 PARTICIPATING AGENCIES DURING BASELINE AND TEST PERIODS . . . . . . .
4 COMPARISON OF AVERAGE CUE PROBABILITY VALUES OF THE GUIDE WITH THOSE CALCULATED FROM THE FIELD TEST . . . . . . . . . . . . . . . . . . . . . . .
DISPOSITION OF 4019 APPREHENSIONS RECORDED ON DRUNK DRIVER DETECTION GUIDE AND RECORD FORMS DURING THREE-MONTH TEST PERIOD
• o • • • • • • ° ° ° °
MODIFIED DRUNK DRIVER DETECTION GUIDE
22
29
33
41
v i i


Table
1
2
5
8
10
LIST OF TABLES
Page
DWI Arrests per 100 Person-Hours of Patrol During Baseline and Test Periods by Agency . . . . . . . 23
DWI Arrests per 100 Person-Hours of Patrol During Baseline and Test Periods by Patrol Type . . . . 25
Mean Number of Cues Reported per DWI Arrest During Baseline and Test Periods by Agency . . . . . . . 26
Frequency Dis t r ibut ions of Detection Cues Recorded on DWI Arrest Reports During Baseline and Test Periods . . . . . . . . . . . . . . . . . . . . . 27
Mean BAC of Persons Arrested During Baseline and Test Periods by A g e n c y . . . . . . . . . . . . . . . 28
Comparison of Cue Probabi l i ty Values of Detection Guide with Yalues Obtained from Field-Test Data for P(BAC > .10)
- • . . . . . . . . . . . . . . . . 30
Comparison of Cue Probabi l i ty Values of Detection Guide with Values Obtained from Field-Test Data for P(BAC ~ .05) . . . . . . . . . . . . . . . . . 31
Cue D~scr iminabi l i ty Values Computed from 4662 Detections Made During Detection and Field Studies: P(BAC ~ . I0) 35
Cue D isc r im inab i l i t y Values Computed from 4662 Detections Made During Detection and Field Studies: P(BAC ~ .05) . . . . . . . . . . . , . . . . . 36
Summary of the Content Analysis of Group Discussions Conducted at Each Par t ic ipat ing Agency Regarding Guide U t i l i t y ~ 37
vi ii


TECHNICAL SUMMARY
On-the-road detection of dr iv ing whi le in tox icated (DWI) involves
the observation and in te rp re ta t ion of visual cues by pol ice patro l o f f i -
cers. The effect iveness of DWI detect ion depends not only on the frequency
wi th which patrol o f f i ce rs see and recognize cues ind ica t i ve of DWI, but on
the extent to which observed cues d iscr iminate between DWI and dr iv ing
whi le sober (DWS). This research pro jec t was conducted to answer the
fo l low ing questions: What visual cues occur f requent ly enough to beusefu l
fo r DWI detection? To what extent do d i f f e r e n t cues d iscr iminate between
DWI and DWS? How can information on cue occurrence and d i s c r i m i n a b i l i t y be
used best for on-the-road detection of DWI?
In the f i r s t phase of the pro jec t , reported e a r l i e r , the l i t e r a t u r e
was reviewed, DWI detection experts were interviewed, a large sample of
arrest reports was analyzed, and an on-the-road study of DWI detect ion was
conducted to obtain data on the re l a t i ve d i s c r i m i n a b i l i t y and frequency of
occurrence of visual detect ion cues. The end product of the f i r s t phase
was a set of conclusions about DWI detect ion, and a prototype DWI detect ion
guide designed to f a c i l i t a t e app l ica t ion of the research f ind ings to on- the-road detect ion of DWI.
In the second phase of the pro jec t , reported here, a DWI Detection
Guide and an explanatory booklet were developed and tested. The Guide was
a small card of white p las t i c pr inted wi th blue.
The f i e l d test of the Guide was conducted wi th a sample of 10 law
enforcement agencies at locations throughout the United States. The test
was designed to provide both long i tud ina l and cross-sect ional analyses of
several measures l i k e l y to r e f l e c t the impact and u t i l i t y of using the
Guide, and to ve r i f y the values contained in the Guide.


L •
, L
Use of the Guide was accompanied by a s t a t i s t i c a l l y s i gn i f i can t
overal l increase in DWI arrest rate of 12 percent. Rates during a 3-
month period, in which the Guide was used, were compared to a 12-month
baseiine period. Five ind iv idual agencies had s i g n i f i c a n t increases of
up to 94 percent; four agencies had no change; and one agency had a s ig-
n i f i c a n t decrease.
Although there were no s t a t i s t i c a l l y s i g n i f i c a n t changes in de-
tec t ion pract ices re f lec ted by greater use of the more d iscr iminat ing
cues or by arrests of dr ivers wi th lower BAC leve ls , trends were in those d i rec t ions .
The DWI p robab i l i t y values contained in the Guide were ve r i f i ed
by the f i e l d - t e s t r e s u l t s . Average ~alues obtained during the f i e l d
test were essen t ia l l y the same as average values on the Guide, and Guide
values fo r ind iv idual cues corre lated s i g n i f i c a n t l y wi th corresponding
values calculated from f i e l d - t e s t data.
Experienced pol ice o f f i ce rs who used the Guide expressed doubts
about i t s value in improving t he i r own DWI enforcement a b i l i t y . However,
they considered the Guide to be valuable fo r increasing patrol s e n s i t i v i t y
to important cues, t ra in ing new patrol o f f i c e r s , preparing DWI arrest re-
p o r t s , and supporting court testimony.
F ie ld - tes t resul ts led to a couple minor modi f icat ions in the
Guide and the explanatory booklet. DWI detect ion p r o b a b i l i t i e s were based
on combined data from the ear ly detect ion study and from the f i e l d t es t ,
thus provid ing a data base of 4662 detect ion events. Several other minor
modi f icat ions were made to fu r the r s imp l i f y and c l a r i f y the Guide. The
resu l t i ng DWI Detection Guide is shown below in actual s i ze .
2


DWI DETECTION GUIDE Chances in 100 of nightt ime driver w i th BAC equal or greater than .10 -~
TURNING WITH WIDE RADIUS . . . . . . . . . . " . . . . . . . . . . . . . . . 6 5
STRADDLING CENTER OR LANE MARKER . . . . . . . . . . . . . . . . . 6 5
APPEARING TO BE DRUNK . . . . . . . . . . . . . . . . . . . . . . . . . . . . . . . GO
ALMOST STRIKING OBJECT OR VEHICLE . . . . . . . . . . . . . . . . . . GO
WEAVING . . . . . . . . . . . . . GO
DRIVING ON OTHER THAN DESIGNATED ROADWAY . . . . . . . . . 5 5
SWERVING . . . . . . . . . . . . . . . . . . . . . . . . . . . . . . . . . . . . . . . . . . . . . 5 5
SLOW SPEED (MORETHAN 10 MPH BELOW LIMIT( . . . . . . . . 5 0
STOPPING (WITHOUT CAUSE) IN TRAFFIC LANE . . . . . . . . . . 5 0
FOLLOWING TOO CLOSELY . . . . . . . . . . . . . . . . . . . . . . . . . . . . . . . 5 0
DRIFTING . . . . . . . . . . . . . . . . . . . . . . . . . . . . . . . . . . . . . . . . . . . . . . 5 0
TIRES ON CENTER OR LANE MARKER . . . . . . . . . . . . . . . . . . . . . 4 5
BRAKING ERRATICALLY., . . . . . . . . . . . . . . . . . . . . . . . . . . . . . . . 4 5
DRIVING INTO OPPOSING OR CROSSING TRAFFIC . . . . . . . . . . 4 5
SIGNALLING INCONSISTENT WITH DRIVING ACTIONS . . . . . 4 0
SLOW RESPONSE TO TRAFFIC SIGNALS . . . . . . . . . . . . . . . . . . 4 0
STOPPING INAPPROPRIATELY |OTHER THAN IN LANE) . . . . 3 5
TURNING ABRUPTLY OR I L L E G A L L Y . . . . . . . . . . . . . . . . . . . . . . 3 5
ACCELERATING OR DECELERATING RAPIDLY . . . . . . . . . . . . . . 3 0
HEADLIGHTS OFF . . . . . . . . . . . . . . . . . . . . . . . . . . . . . . . . . . . . . . . 3 0
Special adjustment to the cue values
• 2 or more cues observed: add 10 to the larger value
• BAG equal to or greater than .05: add 15 to the value obtained for BAC equal to or greater than .10
A short 16-mm sound f i l m in color was produced to describe the detect ion cues and introduce the Guide•
,:


. . . . . . . . r
4


INTRODUCTION
On-the-road detection of dr iv ing whi le intoxicated (DWI) involves
the observation and in terpretat ion of visual cues by pol ice patrol o f f i -
cers. The effectiveness of DWI detection depends not only on the frequency
with which patrol of f icers see and recognize cues ind icat ive of DWI, but on
the extent to which observed cues discr iminate between DWI and dr iv ing
while sober (DWS). This research project was conducted to answer the fo l lowing three questions:
• What visual cues occur f requent ly enough to be useful for DWI detection?
e To what extent do d i f fe rent cues discr iminate between DWI and DWS?
• How can f indings on cue occurrence and d i sc r im inab i l i t y best be incorporated into pract ical procedures f o r on-the-road detection of DWI?
\ - I
The i n i t i a l phase of the project addressed and provided prel iminary I
answers to these three questions by iden t i f y ing useful visual cues and I
developing DWI detection methods. The primary products of the ~ in i t ia l J
phase were an interim report I and a proposed DWI detection guide. In this, /
f i n a l phase of the project, a Drunk Driver Detection Guide was d e v e l o p e d , l y
and a f i e l d test was conducted to evaluate and ve r i f y the Guide. Prior t o |
describing the objectives, methodology, and resul ts of the f i e l d test , a
summary of the interim report is provided as background.
1Harris, D. H., Howlett, J. B., and Ridgeway, R. G. The visual detection of dr iv in~ while intoxicated, project inter im r e p o r t Iden t i f i ca t ion of visual cues and development of detection methods. Anacapa Sciences, Inc., fo r Department of Transportation, National Highway Tra f f i c Safety Adminis- t ra t i on , January 1979. (NHTSA Technical Reference No HS 805 051- NTIS No. PB 80 108 327). " '
5


BACKGROUND
Only a very small proportion of persons DWI are arrested for th is
offense--only about one in 2000. Reasons for a low arrest rate might
include l im i ta t ions on enforcement resources, lack of enforcement motiva-
t ion, i n a b i l i t y to detect DWI, and others. However, previous research has
also shown that even when persons DWI have been observed by police of f icers
who were highly motivated to arrest for DWI, the arrest rate was r e l a t i v e l y
lOWo
As determined from roadside breathtest ing surveys conducted through-
out the United States, about six percent of dr ivers at night have a blood
alcohol concentration (BAC) equal to or greater than .10. About 15 percent
have a BAC equal to or greater than .05. Thus, i f DWI were defined at the
BAC ~ .10 level , the probab i l i t y of detecting DWI from a random stop would
be .06; at BAC ~ .05, the p robab i l i t y would be .15. Visual cues that are
capable of d iscr iminat ing between DWI and DWS can serve to increase detec-
t ion p robab i l i t i es above these chance levels. Thus, the key to enhanced
on-the-road detection of DWI is determination of the re la t i ve discr imin-
a b i l i t y of visual cues that are l i k e l y to be observed in association with
DWI.
Previous Research
Many studies have investigated the effect of alcohol on driving
behavior. They have employed laboratory apparatus, driving simulators,
and instrumented vehicles in the f ie ld. However, results have been only
indirectly relevant to the objectives of the present project. Although
substantial evidence has been developed to indicate that alcohol-induced
driver impairment is exhibited mainly in four driving functions--steering
control, velocity control, time-sharing of attention, and information pro-
cessing--the findings have not been specific enough to permit the identi-
f ication and assessment of visual cues for on-the-road detection.
6


Lists of cues have been developed through interviews with pol ice
o f f i ce rs experienced in DWI detect ion, including a l i s t i n g developed from
a survey conducted in the present study. The resu l t ing l i s t i n g s have been
both comprehensive and l og i ca l l y organized; however, they have been of
only l imi ted use for DWI detection. Without information about the re l a t i ve
frequencies of cue occurrence and re la t i ve cue d i s c r i m i n a b i l i t y , there can
be no basis for defining useful visual cues or developing pract ica l guide-
l ines for DWI detection.
Analysis of DWI Arrests
An analysis was completed of a sample of 1288 DWI arrest reports
obtained from nine d i f fe ren t pol ice agencies throughout the United States
for arrests made during the previous year. A to ta l of 3658 visual detec-
t ion cues was reported in the sample, an average of about three cues per
arrest . Frequency d is t r ibu t ions prepared from the data, combined with the
resu l ts of previous research and cue l i s t i ngs obtained from experienced
patrol o f f i ce rs , provided a prel iminary l i s t i n g of 129 visual cues poten-
t i a l l y useful for DWI detection.
On-the-Road Detection Study
An on-the-road study of DWI detection was conducted to determine the
relative discriminability and frequency of occurrence of visual detection
cues, under conditions typically encountered by police officers. Trained
observers accompanied police officers on patrol and recorded instances of
driving behavior and, vehicle actions that deviated from normal. In each
instance, the police officer stopped the vehicle and measured the BAC of
the driver with a portable breath tester. In addition to cue descriptions
and BAC level, the observer recorded the circumstances and conditions
under which the stop was made, and driver characteristics. Since the data
collection effort required conducting pre-arrest breath tests of drivers,
the study was conducted in two states, Indiana and North Carolina, that
permitted, by statute, pre-arrest breath testing.


A tota l of 643 DWI detection events was observed and recorded. The
sample was comparable to the national sample of 1288 DWI arrests in terms
of time of day of stops, location (urban vs ru ra l ) of the stops, and sex of
the dr iver . As expected, the main way in which the detection study sample
d i f fered from the arrest report sample was in the d is t r i bu t ion of the BAC
levels of the dr ivers. In the detection study, 39 percent of the dr ivers
had a BAC ~ .05; 23 percent had a BAC in the range from .05 to 0.10; and 38
percent had a BAC ~ .10. By contrast, 96 percent of the sample of DWI
arrests reported drivers with BAC ~ .10.
Analyses of the 1681 cue occurrences recorded during the 643 detec-
t ion events included: computation of cue frequencies, calculat ion of cue
d i s c r i m a b i l i t y values, study of cue co-occurrence, assessment of cue order
of appearance, and corre lat ional analyses to determine the impact on cue
occurrence of a l ternat ive detection s t ra teg ies, charac ter is t i cs , and con-
d i t ions . As part of the analyt ical e f f o r t , cues were recombined and
redefined, u l t imate ly , into a set of 23 visual cues that accounted for 93
percent of the cue occurrences in the detection study. The fo l lowing
conclusions were developed from the resul ts of the study:
• Although the potential number of visual detection cues is very large, most detection events can be accounted for by a r e l a t i v e l y small number of cues.
• Typ ica l ly , a detection cue is observed with one or more other cues; however, there are few subsets of speci f ic cues that occur f re - quently together.
• There are large differences among visual detection cues in the frequency with which they occur with DWI, and in the i r a b i l i t y to discr iminate between DWI and DWS.
• In general, the conditions ( l i g h t i n g , time of day, distance, loca- t ion, vehicle condit ion, type of roadway, age or sex of dr iver) under whichcues are observed have r e l a t i v e l y l i t t l e influence on cue occurrence.


• Patrol strategy (general patro l vs. patrol wi th DWI emphasis) g rea t ly affects the re l a t i ve frequencies with which cues are ob- served.
DWI Detection Guide
A pre l iminary DWI detect ion guide was developed to f a c i l i t a t e the
app| icat ion of research f ind ings to on-the-road detect ion of DWI by pol ice
patro l o f f i ce r s . The extent of competing demands placed upon patrol o f f i -
cers-- the va r ie ty of s i tuat ions l i k e l y to be encountered, the s t r ingent
demands on avai lable time, the need for rapid response, and the large
amount of other law enforcement informat ion that must also be learned and
retained--suggested that the f ind ings of th is study be presented for use
simply and d i r e c t l y . Therefore, the guide was developed to transform the
research f ind ings into a pract ica l aid fo r DWI detect ion. Because the
empir ical resu l ts were not necessar i ly simple or f ree of subt le ty , extrap-
o la t ion and judgment were exercised during th is process. Guide develop-
ment was governed by the fo l lowing c r i t e r i a :
• Account for the largest number of detect ion events with the smallest number of detect ion cues.
• Enhance the d i s c r i m i n a b i l i t y of avai lab le detect ion cues.
• Employ a p robab i l i s t i c output.
• Accommodate mul t ip le cue occurrences.
m Accommodate a l te rna t ive enforcement statutes and po l i c ies .
• Emphasize s imp l i c i t y , p r a c t i c a l i t y , and ease of use.
A DWI detect ion guide was developed conceptual ly in th is i n i t i a l
phase of the pro ject . The concept was ref ined and transformed during the
f i r s t p a r t of the f i e l d - t e s t into the Drunk Driver Detection Guide shown in the Appendix.
9


FIELD-IEST OBJECTIVES
The purpose of the f ie ld test was to evaluate and verify-the Drunk
Driver Detection Guide. There were four dif ferent facets of the f ie ld
test, as reflected in the following four specific objectives:
1. Determine the potential impact of the Guide on DWI arrest rates.
The ultimate criterion for evaluating the Guide was the extent to which i t
enhanced DWI enforcement, as reflected by increased DWI arrest rates.
However, although detection accuracy is l i ke ly to influence enforcement
rate, i t is surely not the only factor that does. Other factors also
influence the decision of the patrol of f icer, f i r s t , to apprehend or not
apprehend a driver and, second, to arrest or release the apprehended
driver. As a consequence, the ultimate cr i ter ion of enhanced DWI enforce-
ment, as measured by DWI arrest rate, is l i ke ly to be contaminated for
purposes of evaluatingthe Guide. On the other hand, i f use of the Guide
cannot be shown, under present circumstances, to have some positive impact
on the rate of DWI arrests, i ts ultimate contribution to DWI enforcement w i l l probably be minimal.
Determine the extent to which DWI detection practices are Lo
changed through use of the Guide. Is the form of the Guide and the
training provided for its use adequate to modify DWI detection practices?
Are the.more discriminating cues reported more frequently as a result of
using the Guide? Are average BAC levels of arrested drivers DWI lower as a
result of detecting and arresting more drivers near the .10 threshold?
3. Verify the Guide. Development of the Guide was based mainly on
data collected during 643 DWI detection events. Prior to any widespread
use of the Guide, cue frequency distr ibutions and discr iminabi l i ty values
require verif ication through additional data obtained from additional DWI detection events.
4. Evaluate the Guide as a practical, useful detection aid. Is
the Guide too awkward to be of practical benefit? Is the Guide too
10


simple to provide the information needed? Does the Guide provide too
l i t t l e face v a l i d i t y to i n s t i l l confidence in the user? These and other
questions were addressed in the f i e l d study to obtain information that
might be useful to modify the Guide.
The f i e l d test was l imited to an assessment of the visual detection
of DWI. Therefore, detections were res t r i c ted to those made v isua l ly by
patro! o f f i cers while the dr iver suspected of DWI was in the car. DWI
arrests made as a consequence of an accident or by an o f f i ce r dispatched in
response to a request were eliminated.
11


METHOD
The f i e l d test of the Guide was conducted with a sample of 10 law
enforcement agencies at locations throughout the United States. The test
was designed to provide both longi tudinal and cross-sectional analyses of
several measures l i k e l y to re f l ec t the impact and u t i l i t y of using the
Drunk Driver Detection Guide, and to ve r i f y the detection p robab i l i t i es contained in the Guide.
FIELD-TEST DESIGN
The design was a compromise between what would be required for the
most de f i n i t i ve possible evaluation and what was p rac t i ca l l y feasib le in
terms of pol ice cooperation and avai lable resources. Under the pressures
that existed throughout the country for increased pol ice e f f i c ienc ies and
for more pol ice sens i t i v i t y to indiv idual privacy, f i e l d - t e s t procedures
could be neither burdensome nor po ten t i a l l y embarrassing to indiv idual
pol ice agencies. Consequently, i t was wi th in these constraints that the
f i e l d test was designed. Although less than optimal from a theoret ica l
perspective, the design did provide an adequate basis for evaluation of the
Guide while placing a minimum burden on the part of par t i c ipa t ing pol ice agencies.
Experimental Design
A within-subjects type of experimental design was employed with 10
par t i c ipa t ing police agencies. Measures related to DWI enforcement effec-
tiveness were obtained from each agency during a 12-month baseline period
and during a three-month test period in which the Guide was used. Three
measures were obtained during both baseline and test periods: DWI arrest
r a te , frequencies of reported detection cues, and BAC levels of persons
arrested. During the three-month test period, two addit ional measures
were obtained: ra t io of drivers DWI to drivers apprehended for each cue or
cue combination, and opinions and suggestions of par t i c ipa t ing pol ice of-
f i cers regarding use of the Guide. The experimental design is i l l u s t r a t e d in the diagram of Figure 1.
12


Field-Test Measures
The f i ve d i f f e ren t measures obtained during the f i e l d tes t re la ted
d i r e c t l y to one or more of the f i e l d - t e s t ob ject ives. The measures are
described in the fo l lowing paragraphs; the da ta -co l lec t ion and analysis
procedures required by each measure are discussed l a te r .
DWI arrest r a t e . This measure was defined as the number of DWI
arrests made per unit of patrol ef fort . Rates were calculated monthly for
each agency, in terms of number of DWI arrests per 100 person-hours of
patrol act iv i ty , during both baseline and test periods.
Frequencies of reported detection cues. Frequency distributions o f
cues reported on DWI arrest reports were obtained during both baseline and
test periods. Comparisons of these distributions might reveal whether or
not use of the Guide resulted in any changes in detection cues employed.
BAC levels. Measured BAC levels of persons arrested for DWI during
the period were obtained for comparison with BAC levels of persons arrested
during the baseline period. Enhanced detection of persons DWI might be
ref lected in decreased BAC levels, as off icers become more faci le in de-
tecting BAC levels closer to the legal impairment level.
DWI detection probabil it ies. For purposes of the f ie ld test, the
Guide was modified to permit direct recording of observed cues and the
outcome of each detection event. These data provided the basis for calcu-
lating DWI detection probabilit ies associated with each cue or cue combi-
nation, for comparison to Guide values.
Police off icer opinions and suggestions. Opinions and suggestions
were obtained from groups of officers about midway through the three-month
test period. Responses were obtained by means of group interviews con-
ducted by project staff members during agency v is i ts.
13


IN IT IATE USE OF THE DWI D E T E C T I O N o u o ,
SAMPLE OF P O L I C E A G E N C I E S
A I B I C I D I E I F I G I H I I I J
• DWl ARREST RATES • CUE D I S T R I B U T I O N S • BAC D I S T R I B U T I O N S
• DWl ARREST RATES • CUE D I S T R I B U T I O N S • BAC D I S T R I B U T I O N S • DWI DETECTION DATA • OPINIONS & S U G G E S T I O N S
Figure 1. Field study exper imenta l design.
m
12 M O N T H S
3 M O N T H S
14


PARTICIPATING AGENCIES
The 10 law enforcement agencies selected for part ic ipat ion in the
study are l isted below, along with the populations served by each agency,
as estimated by the 1970 census Agencies are l is ted in alphabetical order:
Albuquerque (New Mexico) Police Department
Englewood (Colorado) Police Department
Eugene (Oregon) Police Department
Evansville (Indiana) Police Department
Monroe County (New York) Sher i f f 's Off ice
Pulaski County (Arkansas) Sher i f f 's Off ice
Santa Ana (California) Police Department
Tacoma (Washington) Police Department
Topeka (Kansas) Police Department
Vanderburgh County (Indiana) Sher i f f ' s Office
243,751
33,695
76,346
138,764
711,917
287,189
156,601
154,581
125,011
168,772
Within the 10 agencies, data were collected from di f ferent types of
police patrols: nine agencies employed general patrols responsible for
criminal and t r a f f i c enforcement and/or t r a f f i c patrols responsible for
t r a f f i c enforcement; two agencies had DWI patrols responsible pr imari ly
for D~I enforcement; and one agency had a selective t r a f f i c patrol respons-
ible for DWI and speeding enforcement. A total of 466 patrol of f icers part icipated.
FIELD-TEST PROCEDURES
The f ie ld test consisted of seven major tasks conducted sequen-
t i a l l y . Each task is summarized and discussed in the following paragraphs.
15

! '

1. Preparation of Guide and Materials
Alternative formats for the Drunk Driver Detection Guide were devel-
oped and exposed to samples of police officers who had participated earl ier
in the research. After consideration of the opinions and suggestions
received, f inal specifications for the Guide were prepared. The resulting
Guide is described and i l lustrated in the Appendix. To accompany and
explain the Guide a booklet, "Drunk Driver Detection: An Explanation of
the Drunk Driver Detection Guide," was prepared and printed. The booklet
is also presented in the Appendix.
For collecting information for Guide veri f icat ion, a special record
form was designed for use during the three-month test period. This form
enabled the police off icer to check the cues observed, record estimated BAC
levels, and indicate the disposition of the apprehended driver. Sets of 25
forms were combined into a 10.16 cm x 20.96 cm (4 inches x 8~ inches) pad.
The form was about the size of most ci tat ion books to fac i l i t a te handling.
As a form was completed and removed for submittal to Anacapa, a new form
was exposed for recording the next detection event. The form is i l l us - trated in Figure 2.
2. Arrangement of Agency Participation
Ten law enforcement agencies were selected for participation in the
study. A l i s t of the participating agencies along with the size popula-
tions they served was presented earl ier. Agency selection was made in
accordance with the following cr i ter ia .
e Geographical dispersion throughout the United States, agencies from the West, North, East, South and Central regions of the country.
• Agency interest in enforcing statutes which prohibit DWI, although special DWI patrols or practices were not required.
¢ Agency willingness to cooperate in accordance with the require- ments of the study.
16


i .
I DO NOT WRITE IN THIS SPACE i:il .. I I l I I I I - - I
REPORT NO.
OFFICER ID:
M O N T H _ _
Check appropriate
box(es)
ESTIMATED BAC [ ] BELOW 0.05 OF THE DRIVER: [ ] 0 .05 to0 .10
D A Y _ _ Y E A R _ _
(01) [ ] (02) [ ] (o3) [ ] (o4) [ ] (05) [ ] (06) [ ] (07) [ ] (co) [ ] (09) [ ] (10) [ ] (11)[] (t2) [ ] (13) [ ] (14)[] 05) [ ] (16) [ ] (17) [ ] (18) [] (19) [ ] (20) [ ] (21) [ ] (22) [ ] (23) [ ] (24) [ ]
DISPOSITION:
[ ] 0.10 AND ABOVE
[ ] RELEASED [ ] ARRESTED
Percentage of nighttime drivers with BAC equal to or greater than .10 ]..
Visual Cues T STOPPING [WITHOUT CAUSE] IN TRAFFIC LANE . . . . . . 70 FOLLOWING TOO CLOSELY . . . . . . . . . . . . . . . . . . . . . . . 60 TURNING WITH WIDE RADIUS . . . . . . . . . . . . . . . . . . . . . 60 APPEARING TO BE DRUNK . . . . . . . . . . . . . . . . . . . . . . . . 60 DRIVING ON OTHER THAN DESIGNATED ROADWAY . . . . 55 STRADDLING CENTER OR LANE MARKER . . . . . . . . . . . . 55 ALMOST STRIKING OBJECT OR VEHICLE . . . . . . . . . . . . 55 ~.:.. SLOW RESPONSE TO TRAFFIC SIGNALS . . . . . . . . . . . . . 50 , HEADLIGHTS OFF [AT NIGHT] . . . . . . . . . . . . . . . . . . . . . 50 :::: SIGNALLINGINCONSISTENT WITH DRIVING ACTIONS .. 45 !:i :-i WEAVING . . . . . . . . . . . . . . . . . . . . . . . . . . . . . . . . . . . . . 45 : :i;i:;i TIRES ON CENTER OR LANE MARKER . . . . . . . . . . . . . . . 45 DRIFTING . . . . . . . . . . . . . . . . . . . . . . . . . . . . . . . . . . . . . . 45 :::;. SWERVING " 45 ii ;.iii ACCELERATING OR DECELERATING RAPIDLY . . . . . . . . . 45 ~:i~ii.i: SLOW SPEED [MORE THAN 10 MPH BELOW LIMIT] . . . . 45 :~ . FAST SPEED [MORE THAN 10 MPH ABOVE LIMIT ] . . . . . 35 FAILING TO RESPOND TO TRAFFIC SIGNALS OR SIGNS . 35 ~-i:, BRAKING ERRATICALLY 35 STOPPING INAPPROPRIATELY [OTHER THAN IN LANE] , 35 ~:i::,: TURNING ABRUPTLY OR ILLEGALLY . . . . . . . . . . . . . . . . 30 ii~:~i~i:il DRIVING INTO OPPOSING OR CROSSING TRAFFIC . . . . . 30 DRIVING WITH VEHICLE DEFECT[S] . . . . . . . . . . . . . . . . 30 ;::!i i OTHER: : i~.ii;ii:
.........
..... Special Adjustments to the Percentages ::i: i!: ;
;:~i:;i" • 2 cues: Add 5 to the larger percentage. ;.:.-
:!:i ::: - 3 o r more cues: Add 10 to the largest percentage, i ,
!~i;': • To predict BAC equal to or greater than .05: Add 20 to the per- ;:;:: :fill. centage.10, obtained for drivers with BAC equal to or greater than ~!:~i':~::::
Figure 2. Form for recording detection events.
17


Formal contact was made i n i t i a l l y by mail wi th four agencies in each
NHTSA region, fol lowed by telephone contact with those responding. V i s i t s
were then made to the 13 agencies that appeared to be most promising. The
f i n a l i0 were selected on the basis of what was learned during the v i s i t s
regarding agency in teres t and w i l l i ngness . The e f f o r t was c lose ly coor-
dinated with the Contract Technical Manager, cognizant personnel of Traf-
f i c Safety Programs, and NHTSA Regional Coordinators.
3. Collection of Baseline Data
Three types of baseline data were collected from each agency--number
of DWI arrests, frequencies of reported cues, and BAC levels of arrested
drivers. All reports of DWI arrests over the 12-month baseline period were
reviewed, and the required data abstracted from them. In addition, a
month-by-month tabulation of the number of person-hours of patrol act iv i ty
was recorded. This information was used to calculate DWI arrest rate,
number of DWI arrests per 100 person-hours of patrol act iv i ty.
4. Initiation of Guide Use
During the month pr io r to the three-month test period, t r a i n i ng was
conducted to introduce the Guide to the 466 p a r t i c i p a t i n g patro l o f f i ce rs
w i th in the 10 agencies. The t r a i n i ng required about 30 minutes and, in
many cases was conducted during r o l l - c a l l or rout ine b r i e f i ng sessions.
Although the Guide i t s e l f was r e l a t i v e l y se l f -exp lanatory , the t ra in ing
sessions provided an opportuni ty to:
• Explain the empir ical basis fo r the Guide, summarizing the re- search that went into i t s development.
• Assure that the three-step detect ion process and the underlying concepts of p robab i l i t y were understood.
• ~rovide an opportuni ty to c l a r i f y d e f i n i t i o n s of the visual detec- t ion cues and d is t i nc t ions among them.
• Answer questions concerning the Guide and i t s use.
18


• Explain the purpose of recording detection events and the use of the Drunk Driver Detection Guide and Record Form including in- s t ruct ions for submitting completed sheets to Anacapa.
5. Data Collection
During the three-month f i e l d - t e s t and data-co l lec t ion period,
a r res t - ra te , cue-frequency, and BAC-level data were col lected in the same
manner as the baseline data were col lected ea r l i e r .
DWI detection-event data were col lected by means of the detection
report forms discussed ear l ie r and shown in Figure 1. These forms were
kept in the patrol vehicle by each patrol o f f i ce r ; one form was completed
for each detection event. Completed forms were then given to a designated
member of the agency who ei ther held them for co l lec t ion by an Anacapa
s ta f f member or forwarded them by mail to Anacapa.
Police opinions and suggestions concerning the use of the Guide were
obtained during group discussions, about midway through the three-month
period. Opportunity and encouragement were provided for the group to cover
any topic related to the Guide. Topics covered in each session were, at•a minimum:
o How useful has the Guide been to you in the enforcement of DWI?
e Spec i f i ca l l y , what advantages and disadvantages have you found in using the guide?
o What speci f ic suggestions do you have for improving the Guide and increasing i t s usefulness?
During the data-col lect ion period, pro ject s ta f f members v is i ted
each agency about three times to assure that data were being col lected properly.
6. Data Analysis
Consistent with the four f i e l d - t e s t object ives and the types of data
col lected, the data-analysis e f f o r t consisted of the fo l lowing four parts:
19


Comparisons of DWI arrest rates. Arrest rates (number of DWI
arrests per 100 person-hours of patrol) were calculated monthly for each of
the ten police agencies, and patrol types within agencies, for each of the
12 months prior to and for each of the three months following in i t ia t ion of
the use of the Guide. These data were charted and comparisons made between
baseline and test periods. Baseline-test comparisons were made for indi-
vidual agencies and patrols for the total sample of agencies and patrols,
and for types of patrols. Statistical tests were conducted using both
analysis of variance (ANOVA) and X 2.
Comparisons of cues and BAC levels. Comparisons were made between
baseline and test periods for: number of cues employed, frequency d is t r i -
butions of cues reported, and mean BAC levels of drivers arrested. Statis-
t ical tests were made using ×2 and t sampling distributions to determine
the significance of any differences found in these variables between base-
line and test periods.
Guide verification. DWI probability values were calculated from
f ie ld data for each cue, under each cue occurrence possibi l i ty (one of one
or more cues, one of two or more cues, or one of three or more cues), and
compared with DWI probability values obtained from the Guide.
Tabulation of patrol officer opinions and suggestions. A content
analysis was completed of responses recorded from group discussions re-
garding u t i l i t y of the Guide. Responses were classified and tabulated;
notation was made regarding whether or not there was group consensus for
each opinion or suggestion made.
7. Preparation of Final Report
The findings resulting from the four components of the f ie ld-test
data collection and analysis effort were integrated and interpreted in
terms of their implication for the modification and future use of the
Guide. The study was then described and the results presented in this
report.
20


RESULTS
Use of the Drunk Driver Detection Guide was accompanied by a s i g n i f i -
cant increase in DWI arrest rate. However, use of the Guide was not
accompanied by increases in the number of cues reported per DWI arrest ,
changes in cue emphasis, or reductions in BAC levels of dr ivers arrested.
The p robab i l i t y values contained in the Guide were ver i f ied by
f i e l d - t e s t resu l ts . Average Guide and f i e l d - t e s t values were not s i g n i f i -
cant ly d i f fe ren t for e i ther P(BAC ~ .10) or P(BAC ~ .05). F ie ld - tes t
p robab i l i t y values for indiv idual cues correlated s i g n i f i c a n t l y with Guide p robab i l i t y values.
Police o f f i cers who used the Guide expressed doubts about i ts value
for increasing the i r own a b i l i t y to detect DWIo However, they considered
the Guide to be a valuable aid for increasing patrol awareness of useful
cues, t ra in ing inexperienced patrol o f f i ce rs , preparing DWI arrest reports, and supporting court testimony.
IMPACT ON DWI ARREST RATES
Col lec t i ve ly , for a l l 10 pa r t i c i pa t i ng agencies, DWI arrest rate was
12 percent higher during the test period than during the baseline period.
This di f ference was s t a t i s t i c a l l y s i gn i f i can t (p < .01). Comparison of
baseline and test periods is shown graph ica l ly in Figure 3. Ind iv idua l l y ,
f i ve agencies had DWI arrest rates s i g n i f i c a n t l y higher during the test
period; one had a s i g n i f i c a n t l y lower rate; and four had rates that remained essent ia l l y unchanged.
Arrest rate was defined and calculated as the number of DWI arrests
made per I00 person-hours of patrol a c t i v i t y . During the ent i re 15-month
period, a to ta l of 5348 arrests were made during a to ta l of 788,200 person-
hours of pa t ro l . Arrest rates are provided in Table 1 for each agency, fo r
the 12-month baseline period and three-month test period, along with the
numbers of arrests and person-hours of patrol a c t i v i t y from which they
21


0.9
. - I O ¢¢
0.8 <c
I t .
O 0.7 O3 ¢¢
O 0.6
Z O O3
0.5 IJJ
"" 0.4 ¢1: U.I a .
03 P" 0.3 03 U.I
<~ 0.2
1.0
0.1
AUG-OCT 1978
NOV-JAN FEB-APR MAY-JUL 1979
BASELINE
Figure 3. Quarterly DWl arrest rates for all ten participating agencies during baseline • and test periods.
AUG-OCT
I 1979 I
• TEST
22


TABLE 1
DWI Arrests per 100 Person-Hours of Patrol During Baseline and Test Periods by Agency
AGENCY
A
B
C
D
E
F
G
H
I
J
TOTAL
BASELINE PERIOD
DWI PATROL ARREST ARRESTS I00 HRS, RATE
2017 1387 1 .45
319 641 .50
150 639 .23
234 1346 .17
66 269 .25
148 728 .20
65 102 .64
530 68 7.79
130 362 .36
526 758 .69
4185 6300 .66
TEST PERIOD
DWI PATROL ARREST ARRESTS I00 HRS. RATE
379 369 1.03
135 150 .90
67 171 .39
% CHANGE
-29
+80
+70
109 331
14 65
30 176
13 25
217 16
28 93
171 186
1163 1582
.33 +94
.22 -12
.17 -15
.52 -19
13.56 +74
.30 -17
.92 +33
.74 +12
×2
38.68*
34.44*
12.17"
30.83*
.31
.88
.33
48.91"
.63
10.50"
10.57"
*p < .01
were calculated. The s t a t i s t i c a l s ign i f i cance of d i f ferences in arrest
rates between baseline and test periods were tested by means of the ×2
sampl~ng d i s t r i b u t i o n . Agencies are i d e n t i f i e d by a randomly assigned
l e t t e r for presentat ion of the resu l ts .
Some of the di f ferences among agencies in magnitude of DWI arrest
rates were a funct ion of the types of enforcement pat ro ls employed. The
types of pat ro ls included in the f i e l d study were: general pat ro ls
responsible fo r the f u l l range of cr iminal and t r a f f i c enforcement
23


a c t i v i t i e s , t r a f f i c patrols responsible for the f u l l range of t r a f f i c
enforcement, DWI patrols responsible mainly for DWI detection and ar rest ,
and a select ive t r a f f i c patrol responsible for DWI and speeding
enforcement. Within nine agencies data were col lected from general and/or
t r a f f i c patrols (GENERAL); w i th in two agencies data were col lected from
DWI patrols (DWI); and wi th in one agency data were col lected from a selec-
t i ve t r a f f i c patrol (SELECTIVE). Agency A had general and DWI pat ro ls ;
Agency J had general and select ive pat ro ls ; and data were co l lected only
from DWI patro ls in Agency H. In Agencies A and J, the percentage changes
in DWI arrest rate from baseline to tes t periods were comparable between
the two patrol types; thus, data from both types of patrol were combined for these two agencies in Table 1.
Arrest rates are shown in Table 2 fo r each type of patrol There
were s i gn i f i can t increases in arrest rate from baseline to tes t periods for
general and select ive t r a f f i c pat ro ls , but not for DWI patro ls . The DWI
patrol of Agency A had a s t a t i s t i c a l l y s i g n i f i c a n t (p < .01) 27 percent
decrease in arrest rate, from 18.50 to 13.50 whi le the DWI patrol of
Agency H had a s t a t i s t i c a l l y s i gn i f i can t (p <.01) 74 percent increase from
7.79 to 13.56. The decrease in one cancelled the increase in the other,
resu l t ing in a small increase overal l that was not s t a t i s t i c a l l y s i g n i f i - cant.
S t r i k ing dif ferences among arrest rates for the three types of
patro ls are also ref lected in Table 2. Arrest rate of se lect ive t r a f f i c
pat ro ls was about four times that of general pat ro ls ; arrest rate of DWI
patro ls was about 30 times that of general pat ro ls , and eight times that
of the select ive t r a f f i c pat ro l . From another perspective, these data
revealed that one DWI arrest was made for each eight hours of DWI pa t ro l ,
70 hours of select ive t r a f f i c pa t ro l , or 260 hours of general pat ro l .
CHANGES IN DWI DETECTION PRACTICES
There were no s ta t is t ica l ly significant differences between baseline
and test periods on any of three measures that might have reflected
24


TABLE 2 DWI Arrests per 100 Person-Hours of Patrol
During Baseline and Test Periods by Patrol Type
PATROL TYPE
GENERAL
SELECTIVE
DWI
TOTAL
BASELINE PERIOD
DWI PATROL ARREST ARRESTS 100 HRS. RATE
2277 5967 .38
299 208 1.44
1582 125 12.66
4158 6300 .66
TEST PERIOD
DWI PATROL ARREST ARRESTS 100 HRS. RATE
636 1504 .42
94 46 2.04
433 32 13.53
1163 1582 .74
% CHANGE
+16
+42
+07
+12
×2
5.34*
31.60"*
1.48
10.57"*
*p < .05 **p < .01
changes in DWI detection practices. The number of visual detection cues
recorded per arrest did not increase; a s ign i f i can t sh i f t to the use of
higher p robab i l i t y cues did not occur; and the BAC levels of persons
arrested did not decrease s i gn i f i can t l y .
As shown in Table 3, about 2.0 cues were recorded on DWI arrest
reports, on the average, over the 10 agencies during both baseline and test
periods. Although larger differences were found among individual agen-
cies, most of which were increases, none was s t a t i s t i c a l l y s ign i f i can t at p < .05.
The re la t i ve frequencies with which detection cues were reported on
DWI arrest reports were very stable and r e l a t i v e l y unaffected by use of the
Guide. Table 4 shows the frequency d is t r i bu t ions of detection cues re-
corded during both baseline and test periods. To permit d i rect comparison,
the d is t r i bu t ions shown were based on the number of occurrences of each cue
for 1000 to ta l cue occurrences. Inspection of the two d is t r ibu t ions re-
veals that they are nearly ident ica l .
25


TABLE 3
Mean Number of Cues Reported per DWI Arrest During Baseline and Test Periods by Agency
AGENCY
A
B
C
D
E
F
G
H
I
J
TOTAL
BASELINE PERIOD
NUMBER MEAN ARRESTS CUES
2017 2.35
319 2.01
150 1.38
234 1.78
66 1.47
148 2.43
65 2.56
530 1.92
130 1.83
526 1.19
4185 2.03
TEST PERIOD
NUMBER MEAN ARRESTS CUES
379 2.41
135 2.16
67 1.55
109 1.74
14 1.33
30 3.37
13 2.75
217 1.78
28 1.90
171 1 . 2 6
1163 1.99
% CHANGE
+02
+07
+12
-02
-09
+39
+07
-07
+04
+06
-02
The product-moment cor re la t ion between the two is .98, s t a t i s t i c a l l y s ig-
n i f i c a n t beyond p < .01. There was some s h i f t in frequencies toward the
higher p r o b a b i l i t y cues during the tes t period but th is was not s t a t i s t i -
ca l l y s i g n i f i c a n t . The 10 cues with highest DWI p r o b a b i l i t i e s occurred
8 percent more f requent ly in the tes t period whi le the 10 cues with lowest
DWI p r o b a b i l i t y occurred 9 percent less f requent ly .
Although the mean BAC of persons arrested fo r DWI decreased from the
baseline period to the test period in 9 of 10 agencies, the amount of the
decrease was not s t a t i s t i c a l l y s i g n i f i c a n t . These resu l ts are presented in Table 5.
VERIFICATION OF THE GUIDE
Probab i l i t y values contained in the Guide were ve r i f i ed by the pro-
port ions of dr ivers apprehended during the f i e l d tes t who were found
26


TABLE 4
Frequency Dis t r ibut ions of Detection Cues Recorded"on DWI Arrest Reports During Baseline and Test Periods
DETECTION CUE
OCCURRENCE (TIMES IN 1000) BASELINE TEST
1 Stopping (without cause) in t r a f f i c lane
2 Following too closely
3 Turning with wide radius
4 Appearing to be drunk
5 Driving on other than designated roadway
6 Straddling center or lane marker
7 Almost s t r i k ing object or vehicle
8 Slow response to t r a f f i c signals
9 Headlights o f f (at night)
10 Signal l ing inconsistent with dr iv ing actions 11 Weaving
12 Tires on center or lane marker
13 D r i f t i ng
14 Swerving
15 Accelerat ing or decelerating rap id ly
16 Slow speed--more than 10 MPH below l i m i t
17 Fast speed--more than 10 MPH above l i m i t
18 Fa i l ing to respond to t r a f f i c signals or signs
19 Braking e r r a t i c a l l y
20 Stopping inappropr iately other than in lane
21 Turning abruptly or i l l e g a l l y
22 Driving into opposing or crossing t r a f f i c
23 Driving with vehicle defect(s)
17
5
23
21
32
62
62
7
22
17
145
4
31
49
57
40
129
73
9
25
60
52
17
13
5
25
21
29
61
72
10
29
23
156
5
24
35
41
32
130
83
10
23
37
56
21
27


TABLE 5
Mean BAC of Persons Arrested During Baseline and Test Periods by Agency
AGENCY
A
B
C
D
E
F
G
H
I
J
TOTAL
BASELINE PERIOD
NUMBER MEAN ARRESTS BAC
1820 .163
210 .181
132 .182
177 .189
52 .193
80 .178
65 .181
53O
84
475
3625*
NUMBER ARRESTS
313
88
57
89
12
19
11
.174 210
.160 19
.154 153
.167 971"
TEST PERIOD
MEAN BAC
•162
.175
. 1 6 8
•192
• 187
•171
•170
• 167
•137
• 144
• 1 6 4
%
CHANGE
-01
-04
-08
+02
-03
-03
-06
-04
-14
-06
-02
*D i f f e r s from to ta l numbers of ar rests because BAC was not obtained for every person arrested•
to have BAC levels of equal to or greater than .05 and .10. Average Guide
p r o b a b i l i t y values over a l l cues were essen t i a l l y the same as the overal l
p r o b a b i l i t i e s calculated from f i e l d - t e s t data. Figure 4 shows comparisons
of Guide and test values for P(BAC ~ .05) and P(BAC ~ .10) when the observed
cue was one of one or more cues, one of two or more cues, and one of three or more cues.
Corre la t ions between Guide DWI p r o b a b i l i t i e s and tes t DWI p robab i l i -
t i es for ind iv idua l cues were s t a t i s t i c a l l y s i g n i f i c a n t (p < .05) in a l l
cases. Comparisons of Guide and tes t values are presented in Tables 6 and
7. Comparison of Guide and tes t values must be made in l i g h t of two
important considerat ions• F i r s t , the p r o b a b i l i t i e s contained in the Guide
28


1.0
U3
AI (J ,¢ ¢D o.
0 .8
0.6
0.4
0.2
="" ~ ~ ~ TEST
I I T ONE + TWO + THREE+ CUES CUES CUES
1.0-
^i C) m n
o~8
0.6
0.4
0.2
T E S T - ~
I I
ONE + TWO + THREE+ CUES CUES CUES
Figure 4. Comparison of average cue probabil i ty values of the Guide with those calculated from the field test.
29


TABLE 6 Comparison of Cue Probab i l i t y Values of Detection Guide
with Values Obtained from Fie ld-Test Data for P(BAC ~ .10)
1
2
3
4
5
" 6
7
8
9 10
11
12
13
14
15
16
17
18
_ 19
20
21
22
23
DETECTION CUE
Stopping (without cause) in t r a f f i c lane
Following too c losely
Turning with wide radius
Appearing to be drunk
Driving on other than designated roadway
Straddl ing center or lane marker
Almost s t r i k i ng object or vehicle
Slow response to t r a f f i c s igna ls
Headlights o f f (at night)
S ignal l ing inconsis tent with dr iv ing actions
Weaving
Tires on center or lane marker
D r i f t i ng
Swerving
Accelerat ing or decelerating rap id ly
Slow speed (more than i0 MPH below l i m i t )
Fast speed (more than 10 MPH above l i m i t )
Fa i l ing to respond to t r a f f i c signals or sign
Braking e r r a t i c a l l y
Stopping inappropr iate ly other than in lane
Turning abrupt ly or i l l e g a l l y
Driving into opposing or crossing t r a f f i c
Driving with vehicle defect(s)
AVERAGE
Coef f ic ien t of correlation~between Guide and test
P(BAC ~ .10) WHEN CUE OBSERVED AS ONE OF:
ONE OR MORE CUES
GUIDE TEST
.70 .42
.60 .38
.60 . 64
.60 .61
• 55 .56
.55 .64
.55 .65
.50 .38
• 50 .24
.45 .37
.45 .62
.45 .46
• 45 .50
.45 .57
.45 .26
.45 .52
.35 .13
.35 .15
.35 .52
.35 .41
.30 .34
• 30 .50
• 30 .06
.46 .43
.48
TWO OR MORE CUES
GUIDE TEST
.75 .75
.65 .44
• 65 .64
.65 .65
.60 .64
.60 .67
.60 .71
• 55 .64
.55 .41
.50 .58
.50 .67
.50 .47
.50 .54
.50 .61
.50 .34
.50 .65
.40 .49
.40 .39
• 40 .56
.40 . 52
.35 .53
• 35 .58
.35 .21
.51 .55
.54
THREE OR MORE CUES
GUIDE TEST
.80 .83
.70 .53
.70 .72
.70 .75
• 65 .76
.65 .68
• 65 .73
.60 .66
.60 .54
.55 . 73
. 5 5 . 7 6
.55 .53
• 5 5 . 6 5
. 5 5 . 6 6
.55 .52
.55 .70
.45 .59
• 45 .60
.45 .59
.45 .67
.40 .54
.40 .67
.40 .44
.56 .65
.54
30

1
2
3
4
5
, 6
7
" 8
9 10
11
12
13
14
15
16
17
18
19
2O
2 1
22
23
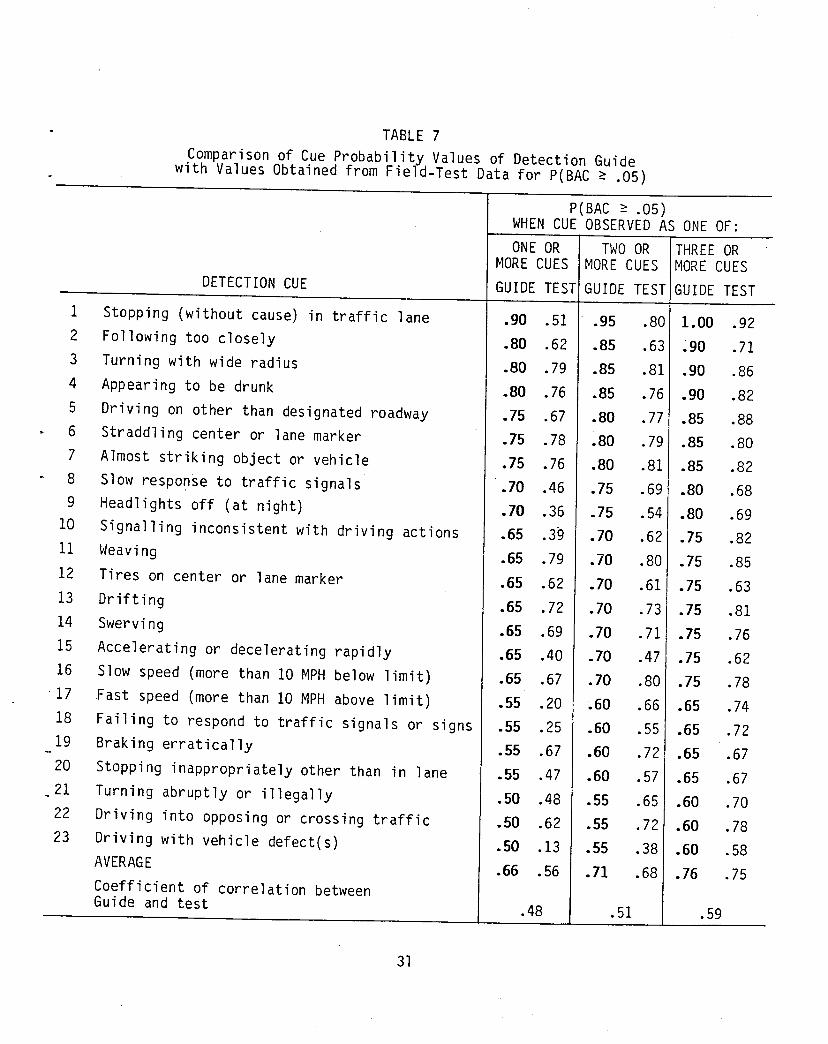
TABLE 7 Comparison of Cue Probab i l i t y Values of Detection Guide
with Values Obtained from Fie ld-Test Data for P(BAC ~ .05)
DETECTION CUE
Stopping (without cause) in t r a f f i c lane
Following too c losely
Turning with wide radius
Appearing to be drunk
Driving on other than designated roadway
Straddl ing center or lane marker
Almost s t r i k i ng object or vehicle
Slow response to t r a f f i c s igna ls
Headlights o f f (at night)
S ignal l ing inconsistent with dr iv ing actions Weaving
Tires on center or lane marker
D r i f t i n g
Swerving
Accelerat ing or decelerating rap id ly
Slow speed (more than 10 MPH below l i m i t )
Fast speed (more than I0 MPH above l i m i t )
Fa i l ing to respond to t r a f f i c signals or signs Braking e r r a t i c a l l y
Stopping inappropr iate ly other than in lane
Turning abrupt ly or i l l e g a l l y
Driving into opposing or crossing t r a f f i c
Driving with vehicle defect(s) AVERAGE
Coef f ic ien t of corre lat ion between Guide and test
P(BAC ~ . 0 5 ) WHEN CUE OBSERVED AS ONE OF:
ONE OR MORE CUES
GUIDE TEST
.90 .51
.80 .62
.80 .79
.80 .76
.75 .67
.75 .78
• 75 . 7 6
.70 .46
.70 .36
.65 .39
• 6 5 . 7 9
.65 .62
.65 .72
• 6 5 . 6 9
.65 .40
.65 .67
• 5 5 . 2 0
.55 .25
• 55 . 6 7
.55 .47
.50 .48
.50 .62
.50 .13
• 6 6 . 5 6
.48
TWO OR MORE CUES
GUIDE TEST
.95
.85
.85
.85
.80
.80
.80
.75
.75
.70
.70
.70
.70
.70
.70
.70
,60
.60
.60
.60
.55
.55
.55
.71
.51
THREE OR MORE CUES
GUIDE TEST
.80 1.00 .92
.63 ,90 .71
.81 .90 .86
.76 .90 .82
.77 .85 .88
.79 .85 .80
.81 .85 .82
.69 .80 .68
.54 .80 .69
.62 .75 .82
.8O .75 .85
.61 .75 .63 i
.73 .75 .81
.71 .75 .76
.47 .75 .62
.80 .75 .78
.66 .65 .74
.55 .65 .72
.72 .65 .67
.57 .65 .67
.65 .60 .70
.72 .60 .78
. 3 8 .60 .58
.68 .76 .75
.59
31


were derived from data col lected using procedures that were substant ia l l y
d i f fe ren t from those employed for co l lec t ing data in the f i e l d test . Guide
p robab i l i t i es were based on data obtained by stopping each dr iver observed
to be exh ib i t ing deviant dr iv ing behavior and administering a breath test
to the dr iver . Observers accompanied patrol o f f i cers for purposes of
recording the data. F ie ld - tes t p r o b a b i l i t i e s , on the other hand, were
obtained from data recorded on special forms during regular patrol by the
patrol o f f i cers themselves. Some detection procedures, such as the use of
radar to detect fast speed, d i f fered substant ia l l y from those used in the
ea r l i e r study. The three categories of BAC were estimated by the o f f i ce r
each time a dr iver was apprehended; however, ve r i f i ca t i on of about two-
th i rds of the BAC ~ .10 estimates showed them to be 99 percent accurate.
Second, Guide probab i l i t y values shown in Tables 6 and 7 were ob-
tained d i r ec t l y from the Guide. Thus, they were rounded-off values for
P(BAC ~ .10) that were extended to mul t ip le cue conditions and to P(BAC
.05) through appl icat ion of the simple adjustments presented at the bottom
of the Guide. Some loss in accuracy is l i k e l y to occur in the process. In
fact , corre lat ions between f i e l d - t e s t values and the actual values ob-
tained from the ear l i e r detection study were somewhat higher in a l l cases
than those shown in Tables 6 and 7.
During the f i e l d study 4019 apprehensions were made and information
about each apprehension was recorded on a Drunk Driver Detection Guide and
Record Form (see Figure 2). The disposi t ion of the 4019 apprehensions is
traced in Figure 5. As shown, 368 + 742 = 1110 dr ivers had an estimated
BAC ~ .05, and 742 had an estimated BAC ~ .10. Estimates were ver i f ied for
499 of the 742 by resul ts obtained la ter from chemical tests; 492 of th is
sample, 99 percent, were found to have a tested BAC ~ . i0 .
Detection data were combined from the ea r l i e r detection study (N =
643 apprehensions) and the f i e l d test (N = 4019 apprehensions)
32


4019 APPREHENSIONS
2909 ESTIMATED
BAC <.05
742 ESTIMATED
BAC >__.10
368 ESTIMATED
.05_<BAC <.10
I .
55 ARRESTED
REFUSED TEST
499 ARRESTED
BAC RECORDED
492 BAC_>.10
7 BAC <.10
198 ARRESTED BAC NOT
RECORDED
Figure 5. Disposition of 4019 apprehensions recorded on Drunk Driver Detection Guide and Record Forms during three-month test period.
33


to provide new cue d i sc r im inab i l i t y values based upon a subs tan t ia l l y
larger data base (N = 4662 apprehensions). Because of the larger numeri-
cal, geographical, and procedural foundation thus provided by th is data
base, the resul t ing p robab i l i t i es should be more re l i ab le and general iz-
able than those on the prototype Guide. These values are presented in
Tables 8 and 9. Cues are l i s ted in decreasing order for the i r new DWI p robab i l i t y values.
OPINIONS OF GUIDE UTILITY
Experienced police patrol o f f i cers were skeptical that use of the
Guide would enhance the i r DWI detection a b i l i t y . Between four to six weeks
after the Guide was introduced, sample groups of between two to seven
pa t ro l o f f i cers within each agency were assembled to discuss the i r experi-
ence with the Guide and to obtain the i r opinions about Guide u t i l i t y . A
more systematic and comprehensive survey of par t ic ipants was not autho-
r ized for the study. A content analysis of the recorded discussions is summarized in Table I0.
Only two of the 10 groups had a consensus that the Guide would help
them enhance DWI enforcement; four groups were s p l i t on th is issue; and
four groups had a consensus that the Guide would not enhance DWI enforce-
ment. Perhaps not co inc identa l ly , none of the four agencies with a nega-
t i ve group consensus on th is point increased DWI arrest rate during the
test period; f ive of the six agencies in which the group consensus was
posi t ive or s p l i t increased DWI arrest rate (see Table 1).
In eight of the nine agencies in which there was discussion of the
u t i l i t y of the Guide for increasing patrol s e n s i t i v i t y to important cues,
there was a posi t ive or s p l i t consensus. There were also general ly posi-
t ive opinions concerning the u t i l i t y of the Guide as a t ra in ing aid, as an
aid in preparing DWI arrest reports, and as an aid in providing court
testimony. Five groups suggested that cue frequency should be incorpo-
rated somehow in the Guide; however, three groups were s p l i t
34


Cl
C2
C3
C4
C5
C6
C7
C8
C9
C10
Cl l
C12
C13
C14
C15
C16
C17
C18
C19
C20
C21
C22
C23
TABLE 8 Cue D isc r im inab i l i t y Values Computed from 4662 Detections
Made During Detection and Field Studies: P(BAC ~ . I0)
VISUAL DETECTION CUES
Turning with wide radius
Straddling center or lane marker
Appearing to be drunk
Almost s t r i k i ng object or vehicle Weaving
Driving on other than designated roadway
Swerving
Slow speed (more than i0 MPH below l i m i t )
Stopping (without cause) in t r a f f i c lane Following too closely D r i f t i ng
Tires on center or lane marker
Braking e r r a t i c a l l y
Driving into opposing or crossing t r a f f i c
Signal l ing inconsistent with dr iv ing actions
Slow response to t r a f f i c signals
Stopping inappropr iate ly (other than in lane)
Turning abrupt ly or i l l e g a l l y
Accelerating or dece le ra t i ng rap id l y
Headlights o f f (at night)
Fa i l ing to respond to t r a f f i c signals or signs
Fast speed (more than 10 MPH above l i m i t )
Driving with vehicle defect(s)
AVERAGE
P(BAC ~ .10) WHEN CUE WAS ONE OF:
ONE OR TWO OR THREE OR MORE CUES MORE CUES, MORE CUES
.63 .63
.63 .65
.60 .66
.60
.58
.56
.53
.50
.49
.48
.48
.46
.46
.49
.42
.40
.37
.35
.32
.29
.18
.14
.07
.43
.68
.62 .70
.63 .69
.55 .59
.60 .71
.73 .81
.47 .52
.51 .58
.49 .52
• 50 . 5 9 i i
.54 ! .65
.54 .69
.63 .65
.48 .61
.48 .51
.38 .52
.45 .62
.42 .65
• 46 . 6 0
.24 .42
.54 .63 I
.68
.67
.75
.70
35


Cl
C2
C3
C4
C5
C6
C7
C8
C9
C10
Cl l
C12
C13
C14
C15
C16
C17
C18
C19
C20
C21
C22
C23
TABLE 9 Cue D isc r im inab i l i t y Values Computed from 4662 Detections
Made During Detection and Field Studies: P(BAC ~ .05)
VISUAL DETECTION CUES
Turning with wide radius
Straddl ing center or lane marker
Appearing to be drunk
Almost s t r i k i ng object or vehicle
Weaving
Driving on other than designated roadway Swerving
Slow speed (more than 10 MPH below l i m i t )
Stopping (without cause) in t r a f f i c lane Following too •closely D r i f t i n g
Tires on center or lane marker
Braking e r r a t i c a l l y
Driv ing into opposing or crossing t r a f f i c
S ignal l ing inconsistent with dr iv ing actions
Slow response to t r a f f i c signals
Stopping inappropr iate ly (other than in lane)
Turning abrupt ly or i l l e g a l l y
Accelerat ing or decelerating rap id ly
Headlights o f f (at night)
Fa i l ing to respond to t r a f f i c signals or signs
Fast speed (more than 10 MPH above l i m i t )
Driv ing with vehicle defect(s)
AVERAGE
P(BAC
ONE OR MORE CUES
.8O
.78
.76
.79
.77
.72
.69
.66
.61
• 70
.71
.65
.69
.60
• 57
• 48
.52
.50
.49
.42
.29
.23
.15
.59
05) WHEN CUE WAS ONE OF:
TWO OR MORE CUES
.82
.79
.78
THREE OR MORE CUES
.84
.80
.83
.79 .79
• 77 .83
.79 .81
.71 .71
• 7 7 . 8 3
.85 .72
.65 .69
.72 .74
• 6 6 . 6 6
.75 .69
.70 .77
.70 .81
• 6 8 . • 7 0
.65 .68
.64 .69
.54 .65
.60 .76
.59 .73
.66 .74
.41 .56
.70 .74
36


TABLE I0
Summary of the Content Analysis of Group Discussions Conducted at Each Part ic ipat ing Agency Regarding Guide U t i l i t y
(Group Consensus: ~ = Posit ive, ~ ) = Sp l i t , C) = Negative)
TOPIC
Help enhance DWI enforcement
Increases sens i t i v i t y to important cues
Helpful as a t ra in ing aid
Helpful i n r e p o r t i n g and t es t i f y i ng
Incorporate cue frequency in Guide
AGENCY
A B C D E F G H I
0 ~ ~ ) 0 @ 0 0 ~ 0
0 0 0 @
0 ~ (D @
@
@
~)
37


in opin ion on th is suggestion. The f o l l ow ing spec i f i c changes in the Guide
were each recommended by persons in one o r two of the ten groups:
• Col lapse weaving, d r i f t i n g , swerving and t i r e s on center or lane marker in to one cue.
• E l iminate p r o b a b i l i t y values on the Guide because they might lead to d i f f i c u l t y in court test imony.
• Provide a method fo r mounting the Guide on a dashboard or v i so r .
• Put Miranda and DWI warnings on the back of the Guide.
38


CONCLUSIONS AND RECOMMENDATIONS
The u t i l i t y of the Drunk Driver Detection Guide for on-the-road
detect ion of DWI was demonstrated in the f i e l d study. Use of the Guide
resul ted in an overal l increase in DWI arrest rate of 12 percent. This
increase took place in a f i e l d - t e s t sample that included 10 d i f f e r e n t
pol ice agencies located throughout the United States, that employed
d i f f e ren t types of pa t ro ls , that included a wide range of geographic and
t r a f f i c condi t ions, and that re f lec ted d i f f e r e n t levels of mot ivat ion fo r
DWI enforcement. Although there were no s t a t i s t i c a l l y s i g n i f i c a n t changes
in detect ion pract ices, such as those revealed by greater use of the more
d iscr iminat ing cues or by arrests of more dr ivers wi th lower BAC levels,
trends were in the expected d i rec t ions .
The DWI p robab i l i t y values associated wi th the cues contained in the
Guide were ve r i f i ed by f i e l d - t e s t resu l t s , provid ing a basis for using
Guide Values with confidence. Although some modi f ica t ions in Guide values
were indicated, the overal l resu l t was one of ve r i f y ing the average proba-
b i l i t y levels as well as the values for ind iv idua l cues. Average probabi l -
i t y values calculated from f i e l d - s t u d y data were essen t i a l l y the same as
average Guide values, and f i e l d - t e s t and Guide values fo r ind iv idua l cues
were s i g n i f i c a n t l y corre lated. These resu l ts were obtained in spi te of the
d i f f e r e n t data co l lec t ion methods employed in the o r ig ina l detect ion study
and in the f i e l d t e s t .
Some d i f f i c u l t y might be expected in gaining acceptance of the Guide
by pol ice o f f i ce rs experienced in DWI enforcement. Many feel they have
l i t t l e or nothing to learn from the Guide, or that detect ion is not a
primary problem in DWI enforcement. On the other hand, a f ter using i t ,
o f f i ce rs stated that the Guide would be of value fo r increasing patrol
s e n s i t i v i t y to important DWI detect ion cues, t r a i n i n g inexperienced patro l
o f f i c e r s , w r i t i ng DWI arrest reports , and provid ing court testimony in
conjunct ion with DWI arrests.
39


The Guide should be modified sl ight ly, as shown in Figure 6. The DWI probability values in the modified Guide were based on data combined from the earl ier detection study and the f ie ld test, providing a data base of
4662 detection events for these Values. The following three cues were
eliminated because they did not discriminate much beyond chance between DWI and DWS:
• Fast speed (more than 10 MPH above l imit)
• Failing to respond to t ra f f ic signals or signs
m Driving with vehicle defect(s)
The modified Guide was further simplified by including only two instead of three adjustments: increasing values whentwo or more cues are observed, and estimating the probability of BAC equal to or greater than
.05. Eliminating the adjustment for three or more observed cues should further fac i l i ta te the understanding and use of the Guide, and enhance the
accuracy of adjusted values. Also, DWI probability values are stated as
"chances in 100" rather than "percentages of" to avoid potential confusion between probabilities and expected frequencies. Modifications in the Guide should be reflected in the booklet designed to accompany the Guide.
To support implementation of the Guide, a short, color, sound, 16-mm motion picture was produced. The film should be used along with the
booklet to introduce potential users to the Guide in a cost-effective
manner. The film summarizes how the Guide was developed, defines and i l lustrates the visual detection cues contained in the Guide, and de-
scribes how the cues should be employed for on-the-road detection of DWI.
40


'4
f
DW] DETECTION GUIDE Chances in 100 of nightt ime driver with BAC equal or greater than .10
TURNING WITH WIDE RADIUS . . . . . . . . . . . . . . . . . . . . . . . . . . . . 65
STRADDLING CENTER OR LANE MARKER . . . . . . . . . . . . . . . . . . 65
APPEARING TO BE DRUNK . . . . . . . . . . . . . . . . . . . . . . . . . . . . . . . 60
ALMOST STRIKING ORJECT OR VEHICLE . . . . . . . . . . . . . . . . . . 60
WEAVING . . . . . . . . . . . . . . . . . . . . . . . . . . . . . . . . . . . . . . . . . . . . . . . 60
DRIVING ON OTHER THAN DESIGNATED ROADWAY . . . . . . . . . 55
SWERVING . . . . . . . . . . . . . . . . . . . . . . . . . . . . . . . . . . . . . . . . . . . . . 55
SLOW SPEED (MORE THAN 10 MPH BELOW LIMIT] . . . . . . . . 50
STOPPING (WITHOUT CAUSE] IN TRAFFIC LANE . . . . . . . . . . 50
FOLLOWING TOO CLOSELY . . . . . . . . . . . . . . . . . . . . . . . . . . . . . . . . 50
DRIFTING . . . . . . . . . . . . . . . . . . . . . . . . . . . . . . . . . . . . . . . . . . . . . . 50
TIRES ON CENTER OR LANE MARKER . . . . . . . . . . . . . . . . . . . . . 45
BRAKING ERRATICALLY . . . . . . . . . . . . . . . . . . . . . . . . . . . . . . . . . 45
DRIVING INTO OPPOSING OR CROSSING TRAFFIC . . . . . . . . . . 45
SIGNALLING INCONSISTENT WITH DRIVING ACTIONS . . . . . 40
SLOW RESPONSE TO TRAFFIC SIGNALS . . . . . . . . . " . . . . . . . . . 40
STOPPING INAPPROPRIATELY (OTHER THAN IN LANE] . . . . 35
TURNING ABRUPTLY OR ILLEGALLY . . . . . . . . . . . . . . . . . . . . . . 35
ACCELERATING OR DECELERATING RAPIDLY . . . . . . . . . . . . . . 30
HEADLIGHTS OFF . . . . . . . . . . . . . . . . . . . . . . . . . . . . . . . . . . . . . . . 30
Special adjustment to the cue values
• 2 or more cues observed: add 10 to the larger value
• BAC equal to or greater than .05: add 15 to the value obtained for BAC equal to or greater than .10
Figure 6. Modif ied Drunk Driver Detect ion Guide.
41

C~

APPENDIX
The Drunk Dr iver Detection Guide is i l l u s t r a t e d below in actual
s ize, 8.73 cm x 12.38 cm (3-7/16 inches x 4-7/8 inches). The Guide was
made of white p las t i c card stock. The p r i n t i n g was in dark blue.
A booklet , "Drunk Dr iver Detect ion: An Explanation of the Drunk
Dr iver Detect ion Guide," was prepared to accompany each Guide. The booklet
was pr in ted in blue on white paper, was stapled at the f o l d , and measured
10.16 cm x 20.96 cm (4 inches x 8~ inches). I t is shown on the fo l l ow ing pages.
Me
DRUNK DRIVER DETECTION GUIDE Percentage of nighttime drivers with BAC equal to or greater than .10
Visual Cues "~
STOPPING [WITHOUT CAUSE] IN TRAFFIC LANE . . . . . . 70 FOLLOWING TOO CLOSELY . . . . . . . . . . . . . . . . . . . . . . . 60 TURNING WITH WIDE RADIUS . . . . . . . . . . . . . . . . . . . . . 60 APPEARING TO BE DRUNK . . . . . . . . . . . . . . . . . . . . . . . . 60 DRIVING ON OTHER THAN DESIGNATED ROADWAY . . . . 55 STRADDLING CENTER OR LANE MARKER . . . . . . . . . . . . 55 ALMOST STRIKING OBJECT OR VEHICLE . . . . . . . . . . . . 55 SLOW RESPONSE TO TRAFFIC SIGNALS . . . . . . . . . . . . . 50 HEADLIGHTS OFF [AT NIGHT] . . . . . . . . . . . . . . . . . . . . . 50 SIGNALLING INCONSISTENT WITH DRIVING ACTIONS . 45 WEAVING 45 TreES ON CEN 'ER O, ILAN = : : : : : : : : : : : : : : : : : : : : : 4S DRIFTING SWERVING . . . . . . . . . . . . . . . . . ~ . . . . . . . . . . . . . . . . . . . 45
45 ACCELERATI't~(~ "O'R' I)'E{;'E'I_'E'R'.~'I:I~I(3" i~APi[)I'Y ' i i i i i i i i i 45 SLOW SPEED [MORE THAN 10 MPH BELOW LIMIT] . . . . 45 FAST SPEED [MORE THAN 10 MPH ABOVE LIMIT] . . . . . 35 FALLING TO RESPOND TO TRAFFIC SIGNALS OR SIGNS . 35 BRAKING ERRATICALLY . . . . . . . . . . . . . . . . . . . . . . . . . . 35 STOPPING INAPPROPRIATELY [OTHER THAN IN LANE] . 35 TURNING ABRUPTLY OR ILLEGALLY . . . . . . . . . . . . . . . . 30 DRIVING INTO OPPOSING DR CROSSING TRAFFIC . . . . . 30 DRIVING WITH VEHICLE DEFECT[S] . . . . . . . . . . . . . . . . 30
Special Adjustments to the Percentages • 2 cues: Add 5 to the larger percentage. • 3 or more cues: Add 10 to the largest percentage.
• To predict BAC equal to or greater than .05: Add 20 to the percentage ob- tained for drivers with BAC equal to or greater than .I0.
A-1

W"
~J

INTRODUCTION
This booklet provides a detailed ex- planation of the visual cues contained in the Drunk Driver Detection Guide. These cues for discriminating nighttime drunk drivers from nighttime sober drivers were extracted from interviews with a wide variety of law enforcement specialists in drunk driver detection, from detailed anal- ysis of over one thousand drunk driver arrest reports from different geographical regions, and from a field s tudy in which cues observed in more than 600 patrol stops were correlated with driver BAC levels. Thus, the 23-cue Drunk Driver De- tection Guide is the most systematically developed method currently available for visually predicting whether a vehicle oper- ated at night is being driven by a drunk driver or a sober driver.
This booklet contains: • A reproduction of the Drunk Driver
Detection Guide • A short explanation about the per-
centages presented in the Guide • Explanations of the 23 visual cues
used in the Guide
A-2 "

I
! J

q ,
0
o
DRUNK DRIVER DETECTION GUIDE Percentage of nighttime drivers with BAC equal to or greater than 10 - I
V Visual Cues
STOPPING [WITHOUT CAUSE] IN TRAFFIC LANE . . . . . . 70 FOLLOWING TOO CLOSELY . . . . . . . . . . . . . . . . . . . . . . . 60 TURNING WITH WIDE RADIUS . . . . . . . . . . . . . . . . . . . . . 60 APPEARING TO BE DRUNK . . . . . . . . . . . . . . . . . . . . . . . . 68 DRIVING ON OTHER THAN DESIGNATED ROADWAY . . . . 55 STRADDLING CENTER OR LANE MARKER . . . . . . . . . . . . 55 ALMOST STRIKING OBJECT OR VEHICLE . . . . . . . . . . . . 55 SLOW RESPONSE TO TRAFFIC SIGNALS . . . . . . . . . . . . . 50 HEADLIGHTS OFF [AT NIGHT] . . . . . . . . . . . . . . . . . . . . . 50 SIGNALLING INCONSISTENT WITH DRIVING ACTIONS .. 45 WEAVING . . . . . . . . . . . . . . . . . . . . . . . . . . . . . . . . . . . . . 45 TIRES ON CENTER OR LANE MARKER . . . . . . . . . . . . . . . 45 DRIFTING . . . . . . . . ~ . . . . . . . . . . . . . . . . . . . . . . . . . . . . . 45 SWERVING . . . . . . . . . . . . . . . . . . . . . . . . . . . . . . . . . . . . 45 ACCELERATING OR DECELERATING RAPIDLY . . . . . . . . . 45 SLOW SPEED [MORE THAN 10 MPH BELOW LIMIT] . . . . 45 FAST SPEED [MORE THAN 10 MPH ABOVE LIMIT] . . . . . 35 FAILING TO RESPOND TO TRAFFIC SIGNALS OR SIGNS . 35 BRAKING ERRATICALLY . . . . . . . . . . . . . . . . . . . . . . . . . . 35 STOPPING INAPPROPRIATELY [OTHER THAN IN LANE] . 35 TURNING ABRUPTLY OR ILLEGALLY . . . . . . . . . . . . . . . . 30 DRIVING IMTO OPPOSING OR CROSSING TRAFFIC . . . . . 30 DRIVING WITH VEHICLE DEFECT[S] . . . . . . . . . . . . . . . . 30
Speczal Adjustments to the Percentages
• 2 cues: Add 5 to the larger percentage. • 3 or more cues: Acid 10 to the largest percentage
• To predict BAC equal to or greater than .05: Add 20 to the percentage ob- taineO tot drivers with BAC equal to or greater than .10.
~PERCENTAGE INDICATORS
The percentage given after each cue in the Guide indicates the proport ion of drivers on the average who exhibi t that part icular cue and who also have a Blood Alcohol Concentrat ion (BAC) equal to or greater than .10. For example, the 70 per- cent fo l lowing the first cue, Stopping [Without Cause] In Traffic Lane, means that out of 100 night t ime drivers who stop wi thout cause in the traff ic lane, on the average 70 wil l have a BAC equal to or greater than .10.
Each percentage shown in the Guide is based on the observation of one cue. However, since more than one cue is often observed for a driver, the fo l lowing s imple adjustments are used to obtain percent- ages for mult ip le cues:
• If two cues are observed, f ind the larger of the two cue percentage values and add 5 to it.
• If three or more cues are observed, f ind the largest cue percentage value and add 10 to it.
When you want to predict the propor- t ion of drivers who have a BAC equal to or greater than .05, add 20 to the percentage value that was obtained in p red ic t i ng~ . driver BAC equal to or greater than .10. This applies to mul t ip le cues as well as to single cues.
Using the percentage indicators to decide whether or not to stop a part icular driver wi l l be a matter of department pol- icy and/or individual off icer judgement. The Guide is only an aid that provides basic information concerning which visual cues are most l ikely to indicate a night- t ime drunk driver.
A-3

t l
+
II 41.
2

q .
=r VISUAL CUE DEFINITIONS Stopping [Without Cause] in Traffic Lane (Percentage: 70)
The critical element in this cue is that there is no observable justification for the vehicle to stop in the traffic lane; the stop is not caused by traffic condi- tions, traffic signals, an emergency situa- tion, or related circumstances. Intoxicated drivers might stop in lane when their capability to interpret information and make decisions becomes severely im- paired. As a consequence, stopping (with- out cause) in the traffic lane is likely to occur at intersections or other decision points.
Following Too Closely (Percentage: 60) The vehicle is observed following
another vehicle ~vhile not maintaining the legal minimum separation.
Turning With Wide Radius (Percentage: 60)
During a turn, the radius defined by the distance between the turning vehicle and the center of the tui'n is greater than normal. This cue is illustrated below.
. . . . . #/ \
Appearing to be Drunk (Percentage: 60) This cue is actually one or more of a
set of indicators related to the personal behavior or appearance of the driver. Examples of specific indicators might include:
• Tightly gripping the steering wheel • Face close to the windshield • Eye fixation • Slouching in the seat • Gesturing erratically or obscenely • Drinking in the vehicre • Driver's head protruding from
vehicle The drawing below illustrates the first
three indicators in the above list.
Driving on Other Than Designated Road- way (Percentage: 55)
The vehicle is observed being driven on other than the roadway designated for traffic movement. Examples include driv- ing: at the edge of the roadway, on the shoulder, off the roadway entirely, and straight through turn-only lanes or areas. The last example is illustrated on the next page.
A-4

7
| I ~

.1,
- 4 .
Driving on Other Than Designated Roadway
r_ :
Straddling Center or Lane Marker (Percentage: 55)
The vehiole is moving straight ahead with the center or lane marker between the left-hand and right-hand wheels.
Almost Striking Object or Vehicle (Percentage: 55)
The observed vehicle almost strikes a stationary object or another moving vehi- cle. Examples include: passing abnormal- ly close to a sign, wall, building, or other object; passing abnormally close to another moving vehicle; and causing another vehicle to maneuver to avoid coll ision.
Slow Response to Traffic Signals (Percentage: 50)
The observed vehicle exhibits a long- er than normal response to a change in traffic signal. For example, the driver re- mains stopped at the intersection f o r an abnormally long period of time after the traffic signal has turned green.
Headlights Off [At Night] (Percentage: 50)
The observed vehicle is being driven with both headlights off during a period of the day when the use of headlights is required.
Signalling Inconsistent With Driving Actions (Percentage: 45)
A number of possibil i t ies exist for the driver's signall ing to be inconsistent with the associated driving actions. This cue occurs when inconsistencies such as the fol lowing are observed: fail ing to sig- nal a turn or lane change, signall ing op- posite to the turn or lane change exe- cuted, signalling constantly with no accompanying driving action, and driving with four-way hazard flashers on. An ex- ample of this cue is illustrated be low.
~ ,'. ,~',.'1:'.'"~ . . . . . . . . . . , . . . . . . . " ' , " : " : ' : ' . ! ! I ! ! i '~'"" ' " ' :" ! ''' '~''''~ . . . . . . . ~' " i
Weaving (Percentage: 45) Weaving occurs when the vehicle al-
ternately moves toward one side of the roadway and then the other, creating a zig-zag course. The pattern of lateral movement is relatively regular as one steering correction is closely fol lowed by
A-5


• g ' ,
• I I
L
another. Weaving is i l lustrated by the Drifting drawing below. ,i,,.,, ,i:~,&.,i' ~;~' :.:.,;..,.:,,::.. ..'.:,.":.: i" :d'"... .........
/ Swerv ing (Percentage: 45)
Tires on Center or Lane Marker (Percentage: 45)
The left-hand set of tires of the ob- served vehicle is consistent ly on the cen- ter line, or either set of tires is consis- tently on the lane marker.
Dr i f t i ng (Percentage: 45) Drif t ing is a straight- l ine movement
of the vehicle at a sl ight angle to the road- way. As the driver approaches a marker or boundary (lane marker, center line, edge of the roadway), the direction of dr i f t might change. As shown in the i l lustra- t ion on the next page, the vehicle dr i f ts across the lane marker into another lane, then the driver makes a correction and the vehicle dri f ts back across the lane marker. Drift ing might be observed within a s ingle lane, across lanes, across the center line, onto the shoulder, and from lane to lane.
A swerve is an abrupt turn away from a general ly straight course. Swerving might occur direct ly after a period of dr i f t - ing when the driver discovers the approach of traff ic in an oncoming lane or discovers that the vehicle is going o f f the road; swerving might also occur as an abrupt turn is executed to return the vehicle to the traff ic lane. In the i l lustrat ion below, a swerve was executed to return to a lane after a period of dr i f t ing toward oppos ing traff ic.
A-6

~J

4
W
i . Accelerating or Decelerating Rapidly (Percentage: 45)
This cue encompasses any accelera- tion or deceleration that is significantly more rapid than that required by the traffic conditions. Rapid acceleration might be accompanied by breaking traction; rapid deceleration might be accompanied by an abrupt stop. Also a vehicle might alter- nately accelerate and decelerate rapidly.
Slow Speed [More than 10 MPH Below Limit] (Percentage: 45)
The observed vehicle is being driven at a speed that is more than 10 MPH below the speed limit.
Fast Speed [More than 10 MPH Above Limit] (Percentage: 35)
The observed vehicle is being driven at a speed that is more than 10 MPH above the speed limit.
Failing to Respond to Traffic Signals or Signs (Percentage: 35)
The observed vehicle falls to respond to a traffic signal or sign. For example, the vehicle fails to stop for a red traffic signal, fails to stop for a stop sign, or fails to slow for caution signals.
Braking Erratically (Percentage: 35) The driver of the observed vehicle is
braking unnecessarily frequently, main- taining pressure on the brake pedal ("rid- ing the brakes"), or braking in an uneven or jerky manner.
Stopping Inappropriately [Other Than in Traffic Lane] (Percentage: 35)
The observed vehicle stops at an in- appropriate location or under inappropri- ate conditions, other than in the traffic lane. Examples include stopping: in a
prohibited zone, at a crosswalk, far short of an intersection, on a walkway, across lanes, for a green traffic signal, or for a flashing yellow traffic signal. The drawing below shows one example of this cue.
vI,;
\
Turning Abruptly or Illegally (Percentage: 30)
The driver executes any turn that is abnormally abrupt or illegal. Specific ex- amples include turning: with excessive speed, sharply from the wrong lane, a U illegally, and outside the designated turn lane. This cue is illustrated below.
I! r!ll!mi= ILl ! I'lL! I ~ I'' L" ' ' ~ql I" " !' ' '""' ~
A- 7 ~

gk,,
a~

Driving Into Opposing or Crossing Traffic "~ (Percentage: 30) ~, The vehicle is observed heading into
opposing or crossing traffic under one or more of the fol lowing circumstances: driving in the opposing lane, driving the wrong way on a one-way street, backing into traffic, fail ing to yield the right-of- way. The last circumstance is il lustrated below.
_ ~ ~ - , . , . ,~,1 ,' ~ i ' F
. ~ . . . ~ , . . . . . . . ,~ . , / /
../x JE Driving with Vehicle Defect[s] (Percentage: 30)
The observed vehicle is being driven with one or more defects, such as: faulty headlight, faulty tai l l ight, flat tire, or one of many other observable mechanical or electrical defects.
4¢,.
A--8

r
/