virtual miso triggers in wifi-like networks
TRANSCRIPT

Virtual MISO Triggers in WiFi-like NetworksOscar Bejarano and Edward W. Knightly
ECE Department, Rice University, Houston, TX 77005Technical Report
Abstract—Virtual Multiple-Input Single-Output (vMISO) sys-tems distribute multi-antenna diversity capabilities between asending and a cooperating node. vMISO has the potential tovastly improve wireless link reliability and bit error rates byexploiting spatial diversity. In this paper, we present the firstexperimental evaluation of vMISO triggers (when to invokevMISO rather than traditional transmission) in WiFi networkingenvironments. We consider the joint effect of gains obtainedat the physical layer with MAC and network-scale factors andshow that 802.11 MAC mechanisms represent a major bottleneckto realizing gains that can be attained by a vMISO PHY. Incontrast, we show how vMISO alters node inter-connectivity andcoordination and therefore can vastly transform the networkthroughput distribution in beneficial ways that are not describedmerely by vMISO link gains. Moreover, we show how to avoidtriggering vMISO when the increased spatial footprint of the newcooperator would excessively hinder other flows’ performance.In this paper, we build the first multi-flow vMISO testbed andexplore the cooperative trigger criteria that is essential to attainsubstantial gains in a fully integrated vMISO system. We find thatthe largest gains are achieved by a largely isolated flow (gains of110%) whereas cooperator interference effects are pronouncedin dense mesh topologies, reducing typical gains to 14%.
I. INTRODUCTION
Virtual MISO (vMISO) systems in combination with space-time block coding (STBC) have the potential to mitigate linkperformance degradation due to signal fading and multipatheffects by exploiting spatial diversity [9], [17]–[20]. In itssimplest form, a vMISO link consists of a distributed systemcomprised of a sender node and a helper or cooperator nodesimultaneously transmitting to a common receiver. STBCis a technique for orthogonalizing multiple streams acrossseveral transmit antennas. Thus, vMISO can employ STBCs toincrease robustness by using simultaneous transmission of twodata streams from two independent nodes, i.e., the originatingsender, and the helper.
By means of an experimental evaluation of vMISO proto-cols, we design vMISO trigger policies for Wifi-like networks.We define trigger policies as the set of specifications thatdictate when vMISO should be enabled in a given flow inorder to guarantee substantial throughput performance gainswhile minimizing the negative impact due to additional in-terference caused by the helper node. Our goal is to identifythe criteria that these policies must account for, in order toprovide such guarantees. Towards this end, we build the firstmulti-flow virtual MISO testbed, and present a comprehensiveexperimental evaluation of vMISO medium access control(MAC) protocols which we use to determine these criteria.Namely, we employ a methodical approach by which wegradually increase the complexity of the network scenario and
study isolated and joint factors affecting performance of virtualMISO schemes.
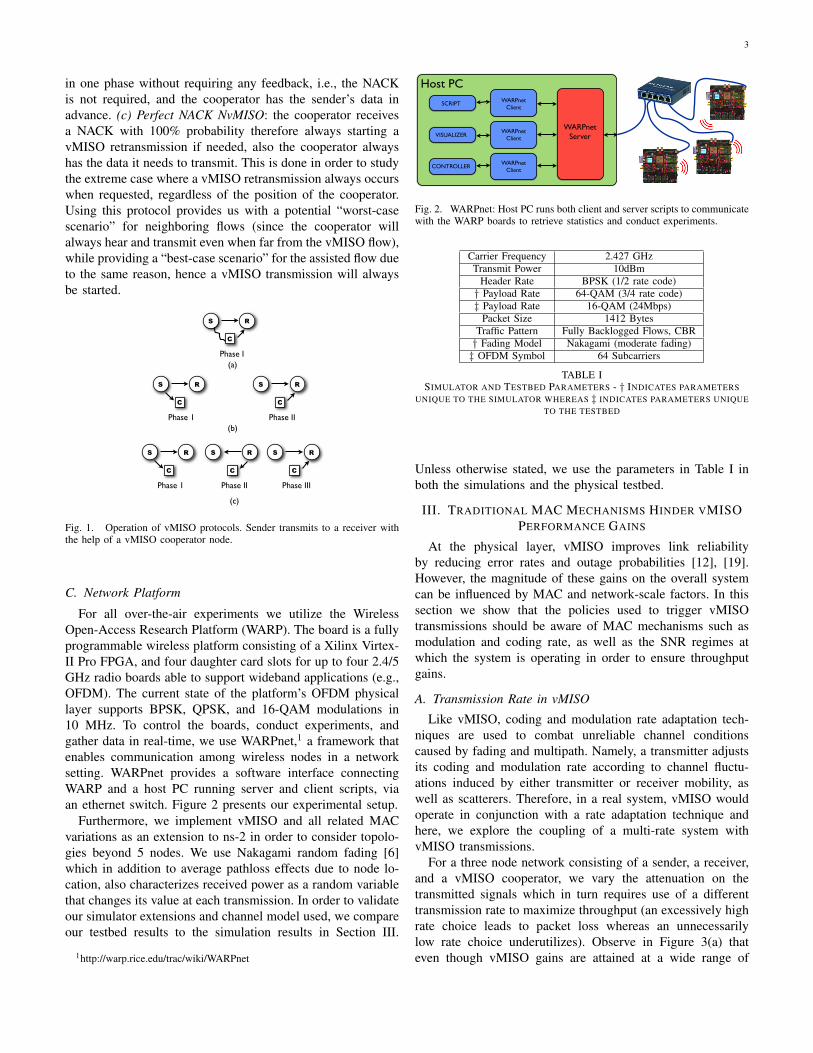
In particular, this paper has the following main contribu-tions: First, in order to develop trigger policies we implementand evaluate different protocols that employ distinct mech-anisms to invoke vMISO transmissions, in small and largescale networks: i) Reactive vMISO schemes (also known asOn-Demand) invoke vMISO transmissions only via explicitfeedback from the receiver when the original transmissionfailed and a retransmission is required, e.g., [8]. ii) Proactiveprotocols on the other hand, invoke vMISO transmissionsin an opportunistic manner via a two-phase process whereinitially the information is delivered to the helper and thena simultaneous sender-helper transmission is started withoutrequiring any feedback. In addition, we define a suite of bench-marking protocols that characterize idealized vMISO schemesfor simulation-based comparison. For example, this methodenables us to compare an operational vMISO protocol with agenie-based protocol in which the original failed transmissionis not needed to share data with the helper and a vMISOtransmission occurs within a single phase.
Second, we determine that in single-flow scenarios, a com-bination of reactive and proactive vMISO triggers yields thelargest gains for a wide range of SNR regimes. For instance,proactive vMISO is more suitable at low SNR because itdoes not waste resources on a SISO transmission attempt,whereas reactive vMISO is more advantageous for mediumto high SNR because vMISO transmissions are only enabledif an initial SISO attempt failed. Furthermore, we explorevMISO when coupled with MAC-layer mechanisms such asbit rate adaptation, and evaluate the protocols’ performanceas a function of signal attenuation, helper node position, andtransmission power. Our evaluation reveals that MAC mech-anisms such as the discrete and limited number of possibletransmission rates supported by the 802.11 can limit the gainsattained by vMISO at the physical layer. Moreover, for agiven channel condition, vMISO gains vary significantly withtransmission rate, with the largest gains available at rates thatwould yield a poor channel with Single-Input Single-Output(SISO), i.e., rates higher than a SISO channel would allow.Thus, a joint decision of which transmission rate to chooseand whether or not to trigger vMISO is ideal to maximizegains.
Third, in two-flow scenarios we demonstrate that the addi-tional transmitter (the vMISO helper) alters the network graph,medium contention, and inter-flow coordination. We show thatin some cases, a bigger footprint due to the additional helper

2
node substantially inhibits spatial reuse. However, in otherscenarios, the helping nodes added “links” (i.e., interactionsbetween the helper and other nodes), improve MAC coordina-tion, thereby improving fairness and throughput. For example,in hidden terminal scenarios the vMISO cooperator can addcoordination by forcing other senders to defer thereby avoidinghidden terminal collisions. Consequently, proactively trigger-ing vMISO transmissions in such cases leads to increasedoverall throughput performance.
Finally, we establish that vMISO cooperators lead to signif-icant increase in deferrals in large-scale topologies comprisedof multi-hop flows, ad hoc networks, and mesh networks thusdecreasing the gains attained by vMISO compared to small-scale scenarios. While in small scale scenarios each individualflow can greedily choose whether to enable vMISO, in large-scale networks a coordinated decision that only allows certainflows to trigger vMISO, strongly benefits the entire network(i.e., those that yield maximum gains while minimizing theirinterference footprint). We show that even a simple policyallowing only the flows achieving the highest gains to trig-ger vMISO, can significantly increase the gains in large-scale networks. Nonetheless, without distributed coordination,vMISO has the largest gains in small-scale topologies whereit can significantly improve a single link’s performance. Forexample, a poor quality link in a home WLAN might bedramatically improved by using a nearby device as a helper.
The rest of this paper is structured as follows. Section IIdescribes our vMISO system implementation. In Section IIIwe explore the interactions that arise from the coupling oftraditional MAC mechanisms and virtual MISO. Section IVcovers small scale topologies where we explore vMISO inisolated scenarios. Further, in section V we consider largescale topologies consisting of both structured and structure-less networks. Sections VI and VII discuss the prior work andconcluding remarks, respectively.
II. VMISO PROTOCOLS AND IMPLEMENTATION
We present the first multi-flow vMISO indoor testbed,comprised of several nodes forming different topologies. Inthis section we introduce such testbed, as well as the protocolswe implemented.
A. vMISO and STBC Implementation
Virtual MISO, also known as cooperative diversity, takesadvantage of spatial diversity and the relatively independentchannel realizations seen by different antennas. This is donein a distributed manner by exploiting the presence of multiplesingle-antenna nodes, which by operating together can emulatean antenna array [12]. That is, both the sender and the helpingnode (i.e., the vMISO cooperator) act as if they were a singlemulti-antenna device by transmitting cooperative packets to acommon receiver.
Our implementation consists of single-antenna distributednodes where the sender and cooperating node form a vMISOlink by simultaneously transmitting two copies of the samesignal to a common receiver. We consider OFDM systems
and vMISO protocols that rely on the use of space-time blockcodes (i.e., Alamouti codes [2]) to orthogonalize these twosignal copies. In contrast to receiver diversity schemes suchas maximal ratio combining, Alamouti STBC distributes infor-mation across two senders thus making it a transmit diversityscheme. Our implementation performs the encoding/decodingin the time domain and follows the implementation presentedin [15]. Moreover, the vMISO protocol we implement is basedon a decode-and-forward (DF) scheme (see [12] for example).
B. vMISO MAC
Virtual MISO requires at least two nodes to have a copyof the information to be transmitted, and since these nodesare separated, at least two phases are needed in order to firstdeliver the data to the cooperator and finally start a vMISOtransmission. The vMISO MAC determines how and whena vMISO transmission should be happen. Thus, in order toidentify the criteria required to design trigger policies thatprovide with most substantial gains, we implement two typesof vMISO MAC protocols.
Reactive vMISO schemes invoke vMISO transmissions onlyvia explicit feedback from the receiver. Specifically, we im-plement a protocol that relies on Negative Acknowledgementsor NACKs and we refer to it as Nack-based vMISO orNvMISO. The NACK serves as the “spark” for the cooperativetransmission at a time that the helper node has (ideally) alreadyoverheard the required transmission symbol sequence. That is,if the original transmission failed, a vMISO retransmissionis provoked by the NACK. The reception of the NACK alsosynchronizes both the source and the helper. In our system,the time between the transmission from the source and theone from the helper is at most 200ns. Thus, for a few hundredmeters of separation between the two transmitting nodes, thelength of the OFDM cyclic prefix allows us to treat thetwo copies as multipath at the receiver. Since the NACK istransmitted at base rate, we expect it to be highly reliable.According to 802.11 standard, it can be received as lows as-85dBm (for 10MHz channels), which increases the likelihoodof successfully starting a vMISO transmission if needed.
Proactive protocols trigger vMISO transmissions in a two-phase process where initially the information is delivered tothe helper and then a simultaneous sender-helper transmissionis triggered without requiring any feedback. The proactiveprotocol we implement is called Two-Phase vMISO (see Figure1(b)) . With good channel conditions this is considered anaive approach since it will always require two phases even ifthe first transmission would have been successful, thereforeunnecessarily wasting air time and helper’s resources, andincreasing interference.
Additionally, we define two benchmarking protocols forevaluation of vMISO; These are unrealizable and unimple-mentable in real systems but are valuable for simulation-basedcomparison. These benchmarking protocols are illustrated inFigure 1: (a) Genie vMISO: the vMISO cooperator acts asa genie that a priori possesses the information the sender isabout to transmit. Therefore, a vMISO transmission occurs
3
in one phase without requiring any feedback, i.e., the NACKis not required, and the cooperator has the sender’s data inadvance. (c) Perfect NACK NvMISO: the cooperator receivesa NACK with 100% probability therefore always starting avMISO retransmission if needed, also the cooperator alwayshas the data it needs to transmit. This is done in order to studythe extreme case where a vMISO retransmission always occurswhen requested, regardless of the position of the cooperator.Using this protocol provides us with a potential “worst-casescenario” for neighboring flows (since the cooperator willalways hear and transmit even when far from the vMISO flow),while providing a “best-case scenario” for the assisted flow dueto the same reason, hence a vMISO transmission will alwaysbe started.
(b)
C
S R
Phase 1 Phase II
C
S R
(c)
C
S R
Phase 1 Phase III
C
S R
Phase II
C
S R
(a)Phase I
C
S R
Tuesday, February 28, 2012
Fig. 1. Operation of vMISO protocols. Sender transmits to a receiver withthe help of a vMISO cooperator node.
C. Network Platform
For all over-the-air experiments we utilize the WirelessOpen-Access Research Platform (WARP). The board is a fullyprogrammable wireless platform consisting of a Xilinx Virtex-II Pro FPGA, and four daughter card slots for up to four 2.4/5GHz radio boards able to support wideband applications (e.g.,OFDM). The current state of the platform’s OFDM physicallayer supports BPSK, QPSK, and 16-QAM modulations in10 MHz. To control the boards, conduct experiments, andgather data in real-time, we use WARPnet,1 a framework thatenables communication among wireless nodes in a networksetting. WARPnet provides a software interface connectingWARP and a host PC running server and client scripts, viaan ethernet switch. Figure 2 presents our experimental setup.
Furthermore, we implement vMISO and all related MACvariations as an extension to ns-2 in order to consider topolo-gies beyond 5 nodes. We use Nakagami random fading [6]which in addition to average pathloss effects due to node lo-cation, also characterizes received power as a random variablethat changes its value at each transmission. In order to validateour simulator extensions and channel model used, we compareour testbed results to the simulation results in Section III.
1http://warp.rice.edu/trac/wiki/WARPnet
SCRIPT
VISUALIZER
CONTROLLER
WARPnetClient
WARPnetClient
WARPnetClient
WARPnetServer
Host PC
Monday, March 21, 2011
Fig. 2. WARPnet: Host PC runs both client and server scripts to communicatewith the WARP boards to retrieve statistics and conduct experiments.
Carrier Frequency 2.427 GHzTransmit Power 10dBm
Header Rate BPSK (1/2 rate code)† Payload Rate 64-QAM (3/4 rate code)‡ Payload Rate 16-QAM (24Mbps)
Packet Size 1412 BytesTraffic Pattern Fully Backlogged Flows, CBR† Fading Model Nakagami (moderate fading)‡ OFDM Symbol 64 Subcarriers
TABLE ISIMULATOR AND TESTBED PARAMETERS - † INDICATES PARAMETERS
UNIQUE TO THE SIMULATOR WHEREAS ‡ INDICATES PARAMETERS UNIQUETO THE TESTBED
Unless otherwise stated, we use the parameters in Table I inboth the simulations and the physical testbed.
III. TRADITIONAL MAC MECHANISMS HINDER VMISOPERFORMANCE GAINS
At the physical layer, vMISO improves link reliabilityby reducing error rates and outage probabilities [12], [19].However, the magnitude of these gains on the overall systemcan be influenced by MAC and network-scale factors. In thissection we show that the policies used to trigger vMISOtransmissions should be aware of MAC mechanisms such asmodulation and coding rate, as well as the SNR regimes atwhich the system is operating in order to ensure throughputgains.
A. Transmission Rate in vMISO
Like vMISO, coding and modulation rate adaptation tech-niques are used to combat unreliable channel conditionscaused by fading and multipath. Namely, a transmitter adjustsits coding and modulation rate according to channel fluctu-ations induced by either transmitter or receiver mobility, aswell as scatterers. Therefore, in a real system, vMISO wouldoperate in conjunction with a rate adaptation technique andhere, we explore the coupling of a multi-rate system withvMISO transmissions.
For a three node network consisting of a sender, a receiver,and a vMISO cooperator, we vary the attenuation on thetransmitted signals which in turn requires use of a differenttransmission rate to maximize throughput (an excessively highrate choice leads to packet loss whereas an unnecessarilylow rate choice underutilizes). Observe in Figure 3(a) thateven though vMISO gains are attained at a wide range of

4
−86 −84 −82 −80 −78 −76 −74 −72 −70 −680
2
4
6
8
10
12
14
16
18
Attenuation (dB)
Thro
ughp
ut (M
bps)
BPSK No CoopBPSK CoopQPSK No CoopQPSK Coop16QAM No Coop16QAM Coop64QAM No Coop64QAM Coop
−86 −84 −82 −80 −78 −76 −74 −72 −70 −680
1
2
3
4
5
6
7
8
9
Attenuation (dB)
Num
ber o
f Coo
pera
tive
Pack
ets
(x10
00)
BPSKQPSK16QAM64QAM
Attenuation (dB)
−86 −84 −82 −80 −78 −76 −74 −72 −70 −680
1
2
3
4
5
6
7
8
9
Attenuation (dB)
Num
ber o
f Coo
pera
tive
Pack
ets
(x10
00)
BPSKQPSK16QAM64QAM
Attenuation (dB)
Thr
ough
put
(Mbp
s)
0
2
4
6
8
10
12
14
16
18
Num
ber
of C
oope
rativ
e Pk
ts. (
x100
0)
0
1
2
3
4
5
6
7
8
9
-86 -84 -82 -80 -78 -76 -74 -72 -70 -68 -86 -84 -82 -80 -78 -76 -74 -72 -70 -68
(a) (b)
−86 −84 −82 −80 −78 −76 −74 −72 −70 −680
2
4
6
8
10
12
14
16
18
Attenuation (dB)
Thro
ughp
ut (M
bps)
6Mbps Direct Tx.6Mbps vMISO12Mbps Direct Tx.12Mbps vMISO24Mbps Direct Tx.24Mbps vMISO48Mbps Direct Tx.48Mbps vMISO
−86 −84 −82 −80 −78 −76 −74 −72 −70 −680
1
2
3
4
5
6
7
8
9
Attenuation (dB)
Num
ber o
f Coo
pera
tive
Pack
ets
(x10
00)
6Mbps12Mbps24Mbps48Mbps
Thursday, July 19, 2012
Fig. 3. (a) Throughput of NvMISO for different transmission rates. (b)Number of cooperative NvMISO packet transmissions for different rates.
SNR regimes, the magnitude of the gains achieved by eachdifferent rate is highly dependent on where the system operateswithin that range. That is, vMISO transmissions at a lowerrate can only yield gains at lower SNR, whereas for higherrates, gains are observed at higher SNR. The reason forthis is that higher rates will require a vMISO retransmissionin order to successfully deliver a packet even at a muchhigher SNR compared to lower rates. Moreover, observe theabsolute highest gains are achieved by higher modulation rates.Consequently, notice in Figure 3(b) that vMISO transmissionsoccur mostly at the higher modulation orders or rates; while,vMISO transmissions occur rarely, if at all for the lowerrates. Observe that for all cases, as attenuation decreases, thenumber of vMISO transmissions decreases because a directtransmission suffices and no retransmissions are triggered.
These results imply that a vMISO MAC can only maximizeits throughput performance at all times by jointly consideringtransmission rate and the vMISO trigger criteria. This shouldbe done to avoid wasting any resources trying to find the bestcooperator, or even triggering a vMISO transmission unnec-essarily. Namely, vMISO must opportunistically increase thetransmission rate in order to be able to trigger cooperationand increase throughput. Although the shown results are forreactive vMISO, notice that a proactive vMISO scheme wouldbe a better option in the case of low SNR, however it wouldhave a negative impact for higher SNR (as we will observe inthe next section).
B. MAC Overhead at High Rate
Next, since we observed that the highest vMISO gains occurwhen the transmission rate is highest (i.e., 64-QAM at 48Mbps for this case), we focus on this rate and investigate howthe MAC protocol overhead can affect these maximum gains.
We consider the same three node network where the vMISOcooperator is chosen among a pool of uniformly distributednodes located near the sender-receiver pair. To choose thecooperator we run an exhaustive search for the best performer(i.e., the node with which the highest avg. throughput over theentire run was obtained). For comparison we consider the casewhere the vMISO cooperator is a store and forward node suchthat in the first phase, the sender transmits to the cooperator,
and in the second phase, only the cooperator transmits data tothe receiver. We refer to this case as “Forced Two Hop.”
Figure 4(a) depicts the average results and 95% confidenceintervals of throughput performance for different protocolsas a function of the link distance between a sender andreceiver. Observe that at all times, both the genie-based vMISOand NvMISO schemes outperform direct transmission, exceptwhen the probability of error due to channel conditions is closeto zero (which occurs at distance zero in this scenario) whereall these protocols perform the same. More importantly, noticethat the genie-based vMISO sets an upper bound in throughputperformance for any type of vMISO scheme due its idealizedone-phase operation.
Theoretical physical-layer SNR gains and correspondingerror rate reductions consider a continuum of available rates.However, because a real system can only support a discrete andlimited number of rates, such gains cannot always be realizableat the MAC layer.
0 100 200 300 400 500 6000
10
20
30
40
50
60
70
80
90
100
Source−Destination Separation (meters)
Perc
ent o
f Coo
pera
tive
Pack
ets
NvMISOGenie−Based vMISO
0 100 200 300 400 500 6000
5
10
15
20
25
30
Source−Destination Separation (meters)
Thro
ughp
ut (M
bps)
Direct TransmissionForced Two−HopNvMISOGenie−Based vMISONaive vMISOTwo-Phase vMISO
Thursday, March 8, 2012
50 100 150 200 250 300Source-Destination Separation (meters)
Perc
ent
Coo
pera
tive
Pack
ets
100
0
90
80
70
60
50
40
30
20
10
0 100 200 300 400 500 6000
10
20
30
40
50
60
70
80
90
100
Source−Destination Separation (meters)
Perc
ent o
f Coo
pera
tive
Pack
ets
NvMISOGenie−Based vMISO
0 100 200 300 400 500 6000
5
10
15
20
25
30
Source−Destination Separation (meters)
Thro
ughp
ut (M
bps)
Direct TransmissionForced Two−HopNvMISOGenie−Based vMISONaive vMISOTwo-Phase vMISO
Thursday, March 8, 2012
15
30
25
20
10
5
0
Thr
ough
put
(Mbp
s)
50 100 150 200 250 300Source-Destination Separation (meters)
Monday, June 18, 2012
Fig. 4. (a) Comparison of vMISO schemes with direct transmission andmulti-hopping, and (b) Percentage of vMISO transmissions out of the totalnumber of MAC transmissions.
For each packet, the transmission time consists of the timeit takes to send the actual data packet plus channel access,data preamble and acknowledgement overheads. For example,transmitting at 48 Mbps physical layer rate even when channelconditions are “best” (no pathloss effects) only yields upto 26.6 Mbps MAC-layer throughput due to this overhead.Therefore, assuming the overhead is kept constant, the onlyway to increase the performance of this particular systemwould be by increasing the data rates. Doing this wouldallow vMISO to provide throughput gains not only whenthe distance between the sender and receiver is very small,but also considerably higher gains at longer distances. Theimplications of this limit imposed by the MAC are reflectedon wasted resources at the helper as well as unnecessaryincreased interference. Both Figure 4(a) and (b) demonstratethat for short distances in a moderate fading environment,any help provided by the vMISO cooperator is not requiredand should preferably be avoided to reduce overhead andpotential interference. Regardless of the number of vMISOtransmissions, the gains for the ideal genie-based schemeand NvMISO are negligible. However, for moderate to largedistances, a smart decision whether the helper should be usedor not has to be made.
Observe in Figure 4(a) that except for small distances

5
(below 20 meters), vMISO schemes are always the bestoption. Nevertheless, to outperform all other techniques at anyregime, the vMISO MAC must switch between being reactive(NvMISO) or proactive (two-phase vMISO). For moderatedistances (between 20 and 80 meters), a NvMISO can stillbenefit from successful one-phase transmissions if the channelis good, and use three-phase transmissions only if required.However, when initial transmissions from the sender beginto fail (when highest percentage of vMISO transmissionsare triggered as shown in Figure 4(b)), the proactive two-phase vMISO becomes the better option because it requiresfewer phases to achieve the same diversity and reliability. Incontrast to two-hop transmissions, vMISO schemes rely onboth an increase in diversity, as well as increased power dueto a simultaneous transmission from two nodes. Alternately,vMISO nodes could transmit with 1/N of the power requiredin a SISO transmission [9], thus keeping only the gainsachieved from diversity. In Figure 4(b) after reaching the high-est point, the number of vMISO transmissions decreases dueto increased distance between destination and helper, thereforereducing the likelihood of successfully NACK reception.
Findings: vMISO gains and trigger conditions must incor-porate the protocol (reactive or proactive), transmission rateand SNR. Namely, vMISO gains are best achieved when thetransmission rate is high for a given SNR such that onlywith vMISO, transmissions at that higher rate are successful.Additionally, while in theory vMISO gains are available evenat very high SNR (only bounded by capacity), in practicethe maximum transmission rate is limited, and therefore oncethis rate is achieved no further gains are possible. Thus,regardless of the magnitude of the gains at the PHY, theMAC represents a performance-limiting factor. Nevertheless,regardless of the sender-receiver link distance, the adequatechoice between a proactive or reactive vMISO guaranteesbetter performance compared to other transmission schemessuch as multi-hopping.
IV. VMISO TRANSFORMS THE NETWORK GRAPH ANDCONTENTION BEHAVIOR
Transmissions of vMISO cooperators in multi-flow topolo-gies introduce additional interference that can cause otherflows to defer potentially leading to net performance losses.However, depending on the topology, such interference couldinstead be beneficial since it can add coordination by implicitlyinforming other senders via carrier sense that a transmission isoccurring (e.g., the case of hidden terminals that can mutuallysense the active cooperator). In this section we explore fourdifferent scenarios via experiments and simulations to studythe effects of the vMISO triggers on the network topology.
A. Topology Generation and Validation
In order to isolate effects of vMISO inter-flow interaction,we consider the four basic topologies shown in Figure 5. Thesetopologies have been widely studied due to their significant
impact on real network deployments [7], and for this reasonwe explore their behavior in the presence of cooperator nodes.
(a) (b)
(d)
(c)
F1
F2
F1
F1F1
F2
F2
F2
F3
RR
(a) (b)
S1
S2
R1
R2
(c)
F1
F2
F1
F2
C
S1
S2
R1
R2 C
R
F1
C
S R
S1 S2
RC
Tuesday, February 28, 2012
Fig. 5. Small-scale topologies. Circles: senders and receivers. Squares:vMISO cooperators. Arrows indicate traffic flows, and dotted lines indicateconnectivity. Topologies: (a) Single Flow, (b) Fully Connected, (c) HiddenTerminal, and (d) Information Asymmetry.
To create the required topologies, we performed our ex-periments in a static environment where no moving scattererswere present. Before each 60-second experiment, we used twotransceivers to test bidirectional connectivity between them.We established that two nodes could not sense each other whenneither would defer to one another. In each case, positionsbetween senders and receivers were chosen such that the linkwould guarantee >90% packet reception at BPSK. Thus, inthis section we focus on the SNR regimes where vMISO yieldsthe most substantial gains i.e., medium to high SNR, andshow results only for reactive protocols which are expected toperform best in these situations. Nonetheless, we also provideinsights on the performance of proactive schemes for thesescenarios. We conducted all experiments at night and ensuredthat no other transmitters were active for the entire durationof each experiment by using a spectrum analyzer.
Figure 6(a) depicts the over-the-air deployment used forboth the single flow (nodes A, B and E are sender, receiverand cooperator, respectively) and the 5 node, 2-flow fullyconnected network (nodes C and D form the competing flow).Likewise, Figure 6(b) depicts the deployment used for thehidden terminal (nodes F and H are the senders, G is thereceiver, and J is the cooperator) and for the informationasymmetry scenarios (node H represents the sender and nodeI the receiver of the competing flow). For validation, in thissection both experiments and simulations are performed at16-QAM. Unless otherwise stated, throughout this sectionwe present average throughput results with 95% confidenceintervals.
control station issues an Ethernet broadcast to the boardsat the beginning of each experiment, which is used to resettheir clock. We verified that our technique achieves clockoffsets below a few micro-seconds.
Testbed Setup. We conduct our experiments on a five-node indoor testbed. In order to verify the robustness of MI-DAS to different node densities, we alternately deployed ournodes in different topological configurations. As a referencefor the reader, we list the locations used in our topologies indecreasing order of density, with reference to Figure 2: in thesingle-hop topology S1 all nodes are next to each other closeto position b; in the multi-hop topology M1 the nodes arelocated in the positions {a, b, c, d, e}; in the multi-hop M2the nodes are in positions {a, b, c, d, f}. Each board trans-mits 1000-byte data packets, with constant inter-packet timewhose value depends on the experiment. Each experimentrun lasts 10 seconds and, where not differently specified, thereported results are cumulative over 10 runs.
Figure 2: Layout of our testbed deployment.
5.2 Testbed ResultsExperimental Methodology. We evaluate the accu-
racy of the inference tool, by assessing its predictions in dif-ferent testbed and simulation settings. At the end of eachexperiment performed, we collect a single report from eachnode including its transmission time and busy time, whichrepresent the parameters T and B in Problem (5). We com-pute the optimal solution of Problem (5) corresponding tothe collected values using the Matlab solver fmincon. Weestablish the accuracy of the Activity Share inference bycomparing our estimations with the ground truth providedby an omniscent centralized approach based on the collectionof detailed traces (see the Validation Tool above).
Sensitivity to Network Density. The network densityinfluences the information in the node reports as follows.In low density conditions, the busy time reports constrainthe overlapping transmissions of a limited set of neighboringnodes (see Equation (3)), thus providing redundant infor-mation. For instance, in networks where each node has oneneighbor, the busy time of a node corresponds to the trans-mission time of the sole neighbor, which is also reported bythe neighbor itself. However, in high density conditions,more combinations of neighbor overlapping transmissionscan produce the same busy time value, thus increasing thecomplexity of the decomposition of the busy time in its Ac-tivity Share components. We investigate the effect of net-work density on the Activity Share accuracy by running ourexperiments on the three different topologies of our testbed.
Figure 3 shows the CDF of the normalized relative errorof the Activity Share estimation, where the relative errorcommitted in a state is weighted by the Activity Share ofthat state, i.e., proportionally to the duration. The X-axis
indicates the normalized relative error committed, while theY-axis is in (non-dimensional) time ratio units. For instance,a point in (0.1, 0.7) indicates that the network spends 70% ofthe time in states where our inference tool commits an errorof 10% or less. All plots show that our inference techniqueis extremely accurate under all density conditions; further,S1 is the most accurate solution, while the M1 plot mostlydominates M2. The respective average normalized relativeerrors, i.e., the relative error committed in a randomly sam-pled instant, are 4.6% for S1, 9.9% for M1, and 11.5% forM2. These results are obtained for broadcast packets; how-ever, similar values have been obtained using one-hop uni-cast flows, i.e., 4.8% for S1, 6.1% for M1, and 7.7% forM2. Figure 4 shows the scatterplot of the predicted andactual Activity Share collected for one run of scenario M2.Each value k on the X-axis denotes a network state !D cor-responding to the binary representation of k (once mappedthe bit indices 0 through 4 to the nodes positioned in a, b,c, d, and f , respectively, e.g., k = 20 maps to the networkstate {10100}, i.e., where only nodes f and c transmit). Thegraph shows an excellent agreement between the inferred Ac-tivity Share and the actual Activity Share obtained from thetraces. Further, we can observe that a number of states havevery short durations: these typically include simultaneoustransmissions of nodes in carrier sensing range, which occurless frequently than the others. We conclude that networkdensity increases the accuracy of the Activity Share inferencetool by reducing the amount of redundant information.
Sensitivity to Network Density is revisited in the simula-tions in Section 5.3 for larger topologies.
Throughput Prediction Accuracy. We evaluate theaccuracy of the model in Section 4, by comparing its pre-dictions with testbed experiments in the topology M1 withsingle-hop flows {a → c; b → a; c → a; d → b; e → c}. Foreach set of experiments, we consider a target under-servedlink whose traffic is fully backlogged, and we perform a refer-ence run, measuring the throughput of the target link whenall others transmit at 900 kbps rate. At the end of thereference run, we collect the node reports, infer the Activ-ity Share, and predict the throughput increase of the tar-get link obtained by rate-limiting any of the four conflictingnodes of a fixed quantity (400 kbps). Then, we perform fouradditional runs on the testbed, alternately rate-limiting adifferent conflicting node for the same 400 kbps quantity,and we record the actual throughput gain of the target link.Finally, we contrast the throughput gain predicted by ourmodel with the actual gain obtained in the testbed.
Figure 5 shows the CDF of the relative error for all pos-sible target link/conflicting node pairs for 10 repetitions ofour scenario (200 predictions in total). The long tail of thedistribution is due to few combinations for which the actualgain is very small (on the order of a few kbps); in those cases,even an error of few packets is decisive in relative terms. Interms of the absolute error, the predicted throughput gainis on average less than 80 kbps different from the actualthroughput gain (i.e., 20% of the rate-limiting value of 400kbps, or around 30% of the average actual throughput gainof approximately 240 kbps).
Additional Results. In [13] we present several addi-tional findings, including: 1) The accuracy of the inferencetool does not decrease for unsaturated and low traffic loads.We ran a set of experiments with topology M1, where weincreased the traffic load of the nodes from 400 kbps to fully
10m
10m
A
B
C
D
BE
Thursday, March 1, 2012
(a) (b)
A
B
C
D
F
G H
I
E
J
Monday, March 5, 2012
Fig. 6. Layout of our indoor testbed. (a) Used for single flow andfully connected topologies, (b) Used for hidden and information asymmetryscenarios

6
As a baseline, we first evaluate the performance of vMISOwith 3 nodes and a single flow (Figure 5(a)). vMISO isexpected to perform equally or better than direct transmissionbecause the cooperator only transmits when needed and cannotinterfere with any other flows. The results are depicted inFigure 7(a) and show vMISO gains as high as 110% with thelargest gains occurring when the cooperator is approximatelyhalfway between the sender and the receiver (see also Section3). More apropos, these results validate the vMISO simulatorwhich we use extensively in our evaluation.
Flow 1 Experiment Flow 2 Experiment Flow 1 Simulation Flow 2 Simulation0
0.5
1
1.5
2
2.5
3
3.5
4
Thro
ughp
ut (M
bps)
No CooperationCooperationNo CooperationCooperation
Experiment Simulation
Flow 2Flow 1Flow 2Flow 1
4
3.5
3
2.5
2
1.5
1
0.5
0
Th
rou
ghp
ut
(Mb
ps)
Saturday, July 16, 2011
Experiment Simulation0
1
2
3
4
5
6
7
8
9
Thro
ughp
ut (M
bps)
No CooperationCooperation9
8
7
6
5
4
3
2
1
0Experiment Simulation
Thr
ough
put
(Mbp
s)
Flow 1 Experiment Flow 2 Experiment Flow 1 Simulation Flow 2 Simulation0
0.5
1
1.5
2
2.5
3
3.5
4
Thro
ughp
ut (M
bps)
No CooperationCooperationNo CooperationCooperation
Experiment Simulation
Flow 2Flow 1Flow 2Flow 1
4
3.5
3
2.5
2
1.5
1
0.5
0
Th
rou
ghp
ut
(Mb
ps)
Saturday, July 16, 2011
4
3.5
3
2.5
2
1.5
1
0.5
0
Thr
ough
put
(Mbp
s)
Flow 1 Flow 2 Flow 1 Flow 2
Direct Tx.NvMISO
Direct Tx.NvMISO
Flow 2 Flow 1 Flow 2Experiment Simulation
(a) Single Flow (b) Fully Connected
Tuesday, February 28, 2012
Fig. 7. vMISO in Fully Connected Topologies
B. Fully Connected Topology
With a second (competing) flow, the vMISO flow’s in-creased transmission footprint due to the presence of thecooperator leads to additional interference. Here, we evaluatevMISO for a two flow network where all nodes can carriersense each other (see Figure 5(b)), and the cooperator assistsonly one flow at all times (i.e., flow 1).
Observe in Figure 7(b) that as expected, the throughputachieved by flow 1 is much higher when vMISO transmissionsare enabled. However, more importantly, there is no negativeeffect on the performance of the competing flow. Since bothsources mutually carrier sense, the competing flow is alreadydeferring to the cooperative one. This means that the vMISOcooperator transmits only when the competing flow is de-ferring. Furthermore, since the vMISO flow becomes moreefficient with fewer dropped packets, the increased amount ofair time leads to a slight increase in the performance of theother flow.
C. Hidden Terminals
Hidden terminals cannot coordinate via carrier sensing,thus leading to a high number of collisions compared tofully connected networks. Here, we explore wether vMISO’scooperator could potentially reduce collisions if its locationwould allow the different sources to sense it. For example,in Figure 5(c) if the source of flow 2 is able to sense thecooperator in a vMISO transmission, then it would defer to it,therefore decreasing the number of collisions.
Figure 8(a) presents the throughput achieved by both flowswith and without vMISO transmissions (RTS/CTS is disabled- a common practice in current deployments). Observe that justby enabling vMISO links in flow 1, its throughput increasesby approximately 64% in average. More importantly, vMISOnot only increases link reliability but can further coordinatesender nodes that are not able to sense each other. If thecooperator can be sensed by the different senders, a vMISOtransmission will cause other nodes to defer. The transmissionof a NACK from the common receiver (due to either a collisionor channel fade), triggers a vMISO retransmission which inthis case is more likely to be overheard by the competingsender. Such coordination and collision reduction also allowsthe competing flow to experience a slight performance in-crease. Thus, vMISO cooperators can provide the networkwith more information regarding the overall state of differenttransmitters. For instance, our simulations showed a decreasein the average number of collisions of approximately 15%.Such improvement corresponds to the increase in throughput atflow 2. For this particular case, notice that triggering a NACKeven due to a collision, at worst will lead to one node backingoff and one sending an immediate retransmission. This doesnot represent a major issue in such as small topology, however,it could have a significant effect on congestion experienced inbigger networks.
Flow 1 Experiment Flow 2 Experiment Flow 1 Simulation Flow 2 Simulation0
100
200
300
400
500
600
700
800
900
1000
Thro
ughp
ut (k
bps)
No CooperationCooperation
Flow 1 Experiment Flow 2 Experiment Flow 1 Simulation Flow 2 Simulation0
200
400
600
800
1000
1200
1400
1600
Thro
ughp
ut (k
bps)
No CooperationCooperationDirect Tx.NvMISO
Direct Tx.NvMISO1000
900
800
700
600
500
400
300
200
100
0
Thr
ough
put
(kbp
s)
Flow 1 Flow 2Flow 2Experiment Simulation
(a) Hidden Terminal
Flow 1 Flow 2 Flow 1 Flow 2Flow 2Experiment Simulation
(b) Information Asymmetry
Flow 1 Flow 2
1600
1400
1200
1000
800
600
400
200
0
Thr
ough
put
(kbp
s)
Tuesday, February 28, 2012
Fig. 8. Cooperation in Hidden Terminal (a), and Information Asymmetry(b) Topologies
D. Information AsymmetryIn a scenario with two active flows, in which only one
of them interferes with the other, the disadvantaged flowcould eventually reach starvation. We denote such scenarioas information asymmetry (see Figure 5(d)).
The starvation problem can be diminished by the presenceof a cooperator which is within range of both senders. If thisis the case, a vMISO transmission would cause the sender ofthe dominating flow to defer, hence decreasing the numberof collisions at the receiver of the disadvantaged flow. Everysingle failed packet in flow 1 triggers a vMISO transmissionthat can potentially cause the competing sender to defer.
Observe in Figure 8(b) that as expected, the difference inthroughput between the advantaged and the disadvantaged

7
flows is significant. Even though gains from vMISO forflow 1 are high (approximately 55%), its performance is stillunsatisfactory compared to that of flow 2. That is, using Jainfairness index we observe only a very small increase from0.51 to 0.56. In our case, since vMISO transmissions aretriggered only through feedback from the receiver, if collisionsare not resolved for the entire length of both packets, novMISO retransmission will occur. Likewise, if the cooperatoris not sensed by the competing sender, it will not defer.Such behaviors limits the extent to which the presence ofthe cooperator can positively affect the disadvantaged flow.Nevertheless, if the collision is resolved and a NACK istriggered, it will make the disadvantaged flow more aggressive.Thus, vMISO can still help alleviate the starvation problemby adding coordination, but MAC behavior dominates flowperformance.
E. Discussion on Helper Footprint and Spatial Reuse
To better understand the interference effect caused by theposition of the cooperator with respect to different flows ina network, we investigate each flow’s performance for thetwo scenarios depicted in Figure 9, compared to the fullyconnected case. In the fully connected scenario, the position ofthe cooperator influences the magnitude of the gains that canbe obtained through NvMISO without significantly affectingthe performance of the other flow. However, if both flowsare decoupled, the position of the cooperator could potentiallycause the competing flow to defer (as seen in Figure 9(a)), thusbecoming an important influencing factor on the performanceof such flow.
(a) (b)(c)
F1
F2
F1F1
F2
F2
F3
RR
(a) (b)
S1
S2
R1
R2
F1
F2
R
F1
C
S R C
S1
S2
R1
R2
F1
F2
C
Tuesday, February 28, 2012
Fig. 9. Topologies where the helper assists only one flow. In (a), F2 canonly sense the helper and vice versa; in (b), both flows are decoupled.
To explore these potential effects that originate from theposition of the cooperator with respect to other flows, wecreate two 5-node two-flow topologies where the first consistsof coupled flows (fully connected), and the second one consistsof uncoupled flows (independent flows), and evaluate thePerfect NACK NvMISO scheme. For every scenario we varythe position of the cooperator inside a square grid whilewe keep both senders and receivers fixed in their respectivepositions. We allow one cooperator to assist only one ofthe flows (flow 1) in order to analyze its influence on thecompeting flow (flow 2).
Figure 10 depicts the results with the x-y axis representingthe grid position of the cooperator. As a reference, locationsof the senders are represented by black circles and receiversby white. The dependent variable throughput gain or loss isrepresented by a colormap as illustrated on beside the figure.
For nearby flows in which spatial re-use was not possibleindependent of having a cooperator, the top two Figures 10(a)and 10(b) indicate that if a vMISO protocol is able to cooperateevery time it is needed, gains can be in the order of 200%.Equally important, as was the case with the results reportedin Figure 7(b), Figure 10(b) shows that cooperating with oneflow has minimal effect on the performance of the competingone. Hence, in a fully connected network, the cooperator(regardless of its position) is not consuming any extra channelresources than those that flow 1 would consume if its pathto the destination was relatively good and no cooperator waspresent. The best-case helper location significantly improvesthe performance of the vMISO flow whereas the worst-case location does not have any considerable effect on thecompeting flow.
c) Independent Flows - Flow 1Throughput Gain/Loss (%)
X−Position (meters)
Y−Po
sitio
n (m
eter
s)
Flow 1 Throughput Gain/Loss at d=700m (%)
0 100 200 3000
200
400
600
800
0
50
100
150
200
X−Position (meters)Y−
Posi
tion
(met
ers)
Flow 2 Throughput Gain/Loss at d=700m (%)
0 100 200 3000
200
400
600
800
−40
−30
−20
−10
0
X−Position (meters)
Y−Po
sitio
n (m
eter
s)
Flow 1 Throughput Gain/Loss at d=100m (%)
0 100 200 300 4000
50
100
150
200
250
300
0
50
100
150
200
X−Position (meters)
Y−Po
sitio
n (m
eter
s)
Flow 2 Throughput Gain/Loss at d=100m (%)
0 100 200 300 4000
50
100
150
200
250
300
−40
−30
−20
−10
0
X−Position (meters)
Y−Po
sitio
n (m
eter
s)
Flow 1 Throughput Gain/Loss at d=700m (%)
0 100 200 3000
200
400
600
800
0
50
100
150
200
X−Position (meters)Y−
Posi
tion
(met
ers)
Flow 2 Throughput Gain/Loss at d=700m (%)
0 100 200 3000
200
400
600
800
−40
−30
−20
−10
0
X−Position (meters)
Y−Po
sitio
n (m
eter
s)
Flow 1 Throughput Gain/Loss at d=100m (%)
0 100 200 300 4000
50
100
150
200
250
300
0
50
100
150
200
X−Position (meters)
Y−Po
sitio
n (m
eter
s)
Flow 2 Throughput Gain/Loss at d=100m (%)
0 100 200 300 4000
50
100
150
200
250
300
−40
−30
−20
−10
0
d) Independent Flows - Flow 2Throughput Gain/Loss (%)
a) Coupled Flows - Flow 1Throughput Gain/Loss (%)
b) Coupled Flows - Flow 2Throughput Gain/Loss (%)
F2
F1
F2
F1
F2
F1
F2
F1
Wednesday, March 7, 2012
Fig. 10. Influence of helper’s transmission footprint in coupled and uncoupledflows as a function of its position.
Next, we consider the case where farther away flows canemploy spatial re-use without vMISO. Figure 10(c) shows thatfor flow 1, the vMISO flow, gains can again reach up to 200%.However, Figure 10(d) indicates that if the cooperator is fartheraway from the assisted flow, it increasingly adversely impactsthe competing flow. These results show that such degradationreaches approximately 40% throughput losses. Moreover forsome vMISO cooperator positions, while the gains that canbe achieved by the vMISO flow are practically null, attemptsto cooperate can lead to significant adverse effects on theperformance of the surrounding flow.
In a proactive scheme, the negative effects on the competingflow (for both topologies in Figure 9) are more significantsince it would be required to defer for two consecutive phasesfor every single original transmission instead of only when aretransmission is needed.
Findings: For two contending flows, the addition of a

8
vMISO cooperator alters the node interconnectivity andthus MAC-layer coordination. Namely, the cooperator cancause a nearby sender that should defer but cannot sense theother transmitter to sense the cooperator and correctly defer.This yields new MAC-layer coordination that can lead todecreased collisions when senders are hidden or increasedfairness when the vMISO flow would have otherwise beentopologically disadvantaged. Therefore, both hidden terminalsand asymmetrically disadvantaged flows should proactivelyinvoke vMISO if a suitably located cooperator is available inorder to increase the flow’s aggressiveness. Thus, comparedto reactive schemes, a proactive protocol can have a moresignificant impact on competing flows due to a more constantvMISO triggering.
V. NETWORK-SCALE EVALUATION
In networks consisting of multiple flows, vMISO links leadto complex flow interactions that amplify and combine severalof the issues we observed in isolation in smaller topologies.For instance, transmissions by numerous cooperators lead toa more significant increase in interference compared to small-scale networks. This in turn leads to increased contention,which could potentially translate into performance losses.Nevertheless, the added coordination due to vMISO transmis-sions could also be augmented and have a stronger beneficialimpact on the network performance. Additionally, if vMISO isimplemented in a structured operational network as in the caseof a mesh network, the non-ideal position of the cooperatorcould also have a meaningful influence on the gains that canbe achieved with vMISO in such scenarios. Therefore, wededicate this section to explore the aggregate effects that arisefrom the activity of the cooperator on the overall performanceof the system in a large-scale network.
A. vMISO Cooperator Interference in Large-Scale Networks
To study the increase in interference due to vMISO in large-scale networks, we emulate static ad hoc single-hop topologiescomprised of different number of flows (i.e., from 2 to 20flows). For each case, we report averages over 30 differenttopologies where flows have been randomly positioned basedon a uniform distribution. Distances between sender andreceiver at each flow are chosen such that NvMISO wouldyield a gain if the flow was completely isolated (accordingto the results from Figure 4(a)). Moreover, whenever vMISOis enabled we select the cooperator that is closest to themidpoint between source and destination (i.e., the one weexpect to provide with the highest gains). Such topologiesprovide network configurations spanning from isolated flowsto fully connected scenarios. Due to the prohibitive cost andcomplexity of building a fully-scaled cooperative network, weemploy our validated simulator model to evaluate vMISO tech-niques. We present results for reactive protocols since thesecause the least amount of interference compared to proactiveschemes, thus providing with higher gains and demonstratingvMISO’s potential.
We compute the time in between a successful packet trans-missions and the next transmission for each individual flow.Since sources are fully backlogged, the rate at which packetsleave each source node will depend on MAC and PHY be-havior. Contention and interference affect this rate via carriersense. Therefore we use the inter-packet transmission timeto analyze the amount of contention present in the network:the longer the time, the higher the contention. Moreover, wecompare against perfect NACK NvMISO defined in Section IIto explore the “worst-case scenario” in terms of interferencewhere vMISO transmissions are always triggered if a NACKis sent.
0.5 1 1.5 2 2.5 3 3.5 4 4.5 5 5.51
2
3
4
5
6
7
8
9
10
11
Inte
r−Pa
cket
Tra
nsm
issio
n Ti
me
(ms)
Time seconds
Direct Tx.NvMISOPerfect NACK NvMISO
0.5 1 1.5 2 2.5 3 3.5 4 4.5 5 5.50
1
2
3
4
5
6
Thro
ughp
ut G
ain
(Mbp
s)
Perfect NACK NvMISONvMISO
6
5
4
3
2
1
0
Thr
ough
put
Gai
n (M
bps)
2 Flows 5 Flows 10 Flows 15 Flows 20 Flows 2 Flows 5 Flows 10 Flows 15 Flows 20 Flows
Inte
r-Pa
cket
Tra
nsm
issi
on T
ime
(ms)
11
10
9
8
7
6
5
4
3
2
1
(a) (b)
0.5 1 1.5 2 2.5 3 3.5 4 4.5 5 5.50
1
2
3
4
5
6
Thro
ughp
ut G
ain
(Mbp
s)
Perfect NACK NvMISONvMISO
0.5 1 1.5 2 2.5 3 3.5 4 4.5 5 5.51
2
3
4
5
6
7
8
9
10
11
Inte
r−Pa
cket
Tra
nsm
issio
n Ti
me
(ms)
Time seconds
Direct Tx.NvMISOPerfect NACK NvMISO
Thursday, March 8, 2012
0.5 1 1.5 2 2.5 3 3.5 4 4.5 5 5.50
1
2
3
4
5
6
Thro
ughp
ut G
ain
(Mbp
s)
Perfect NACK NvMISONvMISOManaged Network
0.5 1 1.5 2 2.5 3 3.5 4 4.5 5 5.50
1
2
3
4
5
6
Thro
ughp
ut G
ain
(Mbp
s)
Perfect NACK NvMISONvMISOManaged Network
Tuesday, July 24, 2012
Fig. 11. (a) Mean packet inter-transmission time for different network sizes.(b) Per-flow throughput gains/losses for different network sizes
Figure 11(a) depicts the mean packet inter-transmission timeper-flow. Error bars show the range of results for the differentflows in the network. Observe that for all cases, the mean inter-transmission time is much lower when vMISO is disabled.Moreover, the gaps between the direct transmission schemeand both NvMISO and perfect NACK NvMISO widen withan increased number of flows (same behavior observed inpercent difference between the vMISO protocols and the directtransmission scheme). Since each flow uses one cooperator,this indicates that the larger the number of cooperators used inthe network, the bigger the spatial footprint of each flow. Thisincrease causes most flows to experience higher contention,meaning that fewer packet transmissions occur.
In Figure 11(b) we present per-flow throughput gains fornetworks with different number of flows. Observe that inaverage, for 2 flows, NvMISO achieves up to 2.2 Mbpsgains, which corresponds to roughly 47% gains compared todirect transmission. On the other hand, perfect NACK NvMISOreaches gains of more than 5 Mbps or 104% throughput gains.However, as the number of flows increases to 20, the additionalinterference due to the cooperators leads to a significantdecrease in gains of approximately 98% and 96% for NvMISOand perfect NACK NvMISO, respectively. To overcome suchdegradation, we modify the latter protocol by reducing theextra interference generated throughout the entire network.That is, after observing all vMISO flows for some periodof time (10 seconds in our case) we only allow those thatachieve more than 10% gains to enable vMISO transmissions.This approach would require a centralized network manager(or distributed coordination) as well as a thorough study of
9
the optimal threshold to use to decide which flows can enablevMISO. Nevertheless, we demonstrate in Figure 11(b) thatthis simple management policy significantly improves overallperformance.
0204060801001200
1
2
3
4
5
6
7
8
Node Index
Thro
ughp
ut (M
bps)
Perfect NACK NvMISONvMISODirect Tx.
Fig. 12. Network consisting of 120 flows.
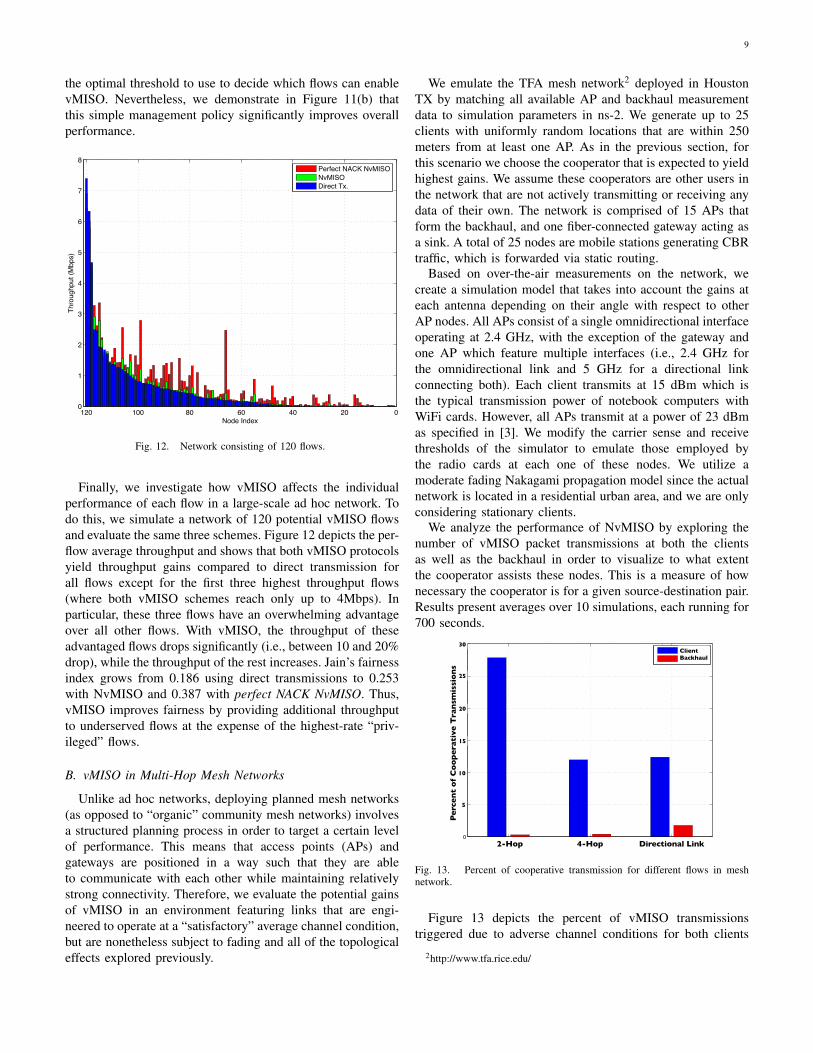
Finally, we investigate how vMISO affects the individualperformance of each flow in a large-scale ad hoc network. Todo this, we simulate a network of 120 potential vMISO flowsand evaluate the same three schemes. Figure 12 depicts the per-flow average throughput and shows that both vMISO protocolsyield throughput gains compared to direct transmission forall flows except for the first three highest throughput flows(where both vMISO schemes reach only up to 4Mbps). Inparticular, these three flows have an overwhelming advantageover all other flows. With vMISO, the throughput of theseadvantaged flows drops significantly (i.e., between 10 and 20%drop), while the throughput of the rest increases. Jain’s fairnessindex grows from 0.186 using direct transmissions to 0.253with NvMISO and 0.387 with perfect NACK NvMISO. Thus,vMISO improves fairness by providing additional throughputto underserved flows at the expense of the highest-rate “priv-ileged” flows.
B. vMISO in Multi-Hop Mesh Networks
Unlike ad hoc networks, deploying planned mesh networks(as opposed to “organic” community mesh networks) involvesa structured planning process in order to target a certain levelof performance. This means that access points (APs) andgateways are positioned in a way such that they are ableto communicate with each other while maintaining relativelystrong connectivity. Therefore, we evaluate the potential gainsof vMISO in an environment featuring links that are engi-neered to operate at a “satisfactory” average channel condition,but are nonetheless subject to fading and all of the topologicaleffects explored previously.
We emulate the TFA mesh network2 deployed in HoustonTX by matching all available AP and backhaul measurementdata to simulation parameters in ns-2. We generate up to 25clients with uniformly random locations that are within 250meters from at least one AP. As in the previous section, forthis scenario we choose the cooperator that is expected to yieldhighest gains. We assume these cooperators are other users inthe network that are not actively transmitting or receiving anydata of their own. The network is comprised of 15 APs thatform the backhaul, and one fiber-connected gateway acting asa sink. A total of 25 nodes are mobile stations generating CBRtraffic, which is forwarded via static routing.
Based on over-the-air measurements on the network, wecreate a simulation model that takes into account the gains ateach antenna depending on their angle with respect to otherAP nodes. All APs consist of a single omnidirectional interfaceoperating at 2.4 GHz, with the exception of the gateway andone AP which feature multiple interfaces (i.e., 2.4 GHz forthe omnidirectional link and 5 GHz for a directional linkconnecting both). Each client transmits at 15 dBm which isthe typical transmission power of notebook computers withWiFi cards. However, all APs transmit at a power of 23 dBmas specified in [3]. We modify the carrier sense and receivethresholds of the simulator to emulate those employed bythe radio cards at each one of these nodes. We utilize amoderate fading Nakagami propagation model since the actualnetwork is located in a residential urban area, and we are onlyconsidering stationary clients.
We analyze the performance of NvMISO by exploring thenumber of vMISO packet transmissions at both the clientsas well as the backhaul in order to visualize to what extentthe cooperator assists these nodes. This is a measure of hownecessary the cooperator is for a given source-destination pair.Results present averages over 10 simulations, each running for700 seconds.
2−Hop 4−Hop Directional Link0
5
10
15
20
25
30
Perc
ent o
f Coo
pera
tive
Tran
smis
sion
s
ClientBackhaul
2-Hop 4-Hop Directional Link
Pe
rce
nt
of
Co
op
era
tive
Tra
nsm
issi
on
s
30
25
20
15
10
5
2−Hop 4−Hop Directional Link0
5
10
15
20
25
30
Perc
ent o
f Coo
pera
tive
Tran
smis
sion
s
ClientBackhaulClientBackhaul
Saturday, July 16, 2011
Fig. 13. Percent of cooperative transmission for different flows in meshnetwork.
Figure 13 depicts the percent of vMISO transmissionstriggered due to adverse channel conditions for both clients
2http://www.tfa.rice.edu/
10
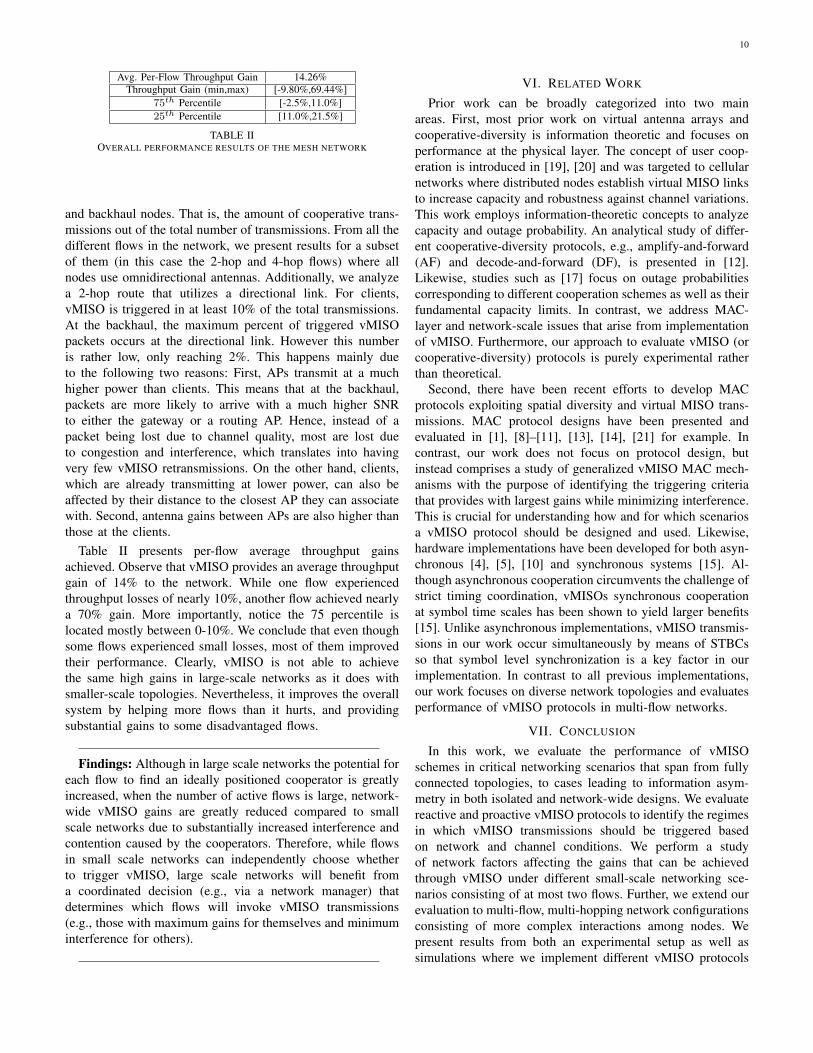
Avg. Per-Flow Throughput Gain 14.26%Throughput Gain (min,max) [-9.80%,69.44%]
75th Percentile [-2.5%,11.0%]25th Percentile [11.0%,21.5%]
TABLE IIOVERALL PERFORMANCE RESULTS OF THE MESH NETWORK
and backhaul nodes. That is, the amount of cooperative trans-missions out of the total number of transmissions. From all thedifferent flows in the network, we present results for a subsetof them (in this case the 2-hop and 4-hop flows) where allnodes use omnidirectional antennas. Additionally, we analyzea 2-hop route that utilizes a directional link. For clients,vMISO is triggered in at least 10% of the total transmissions.At the backhaul, the maximum percent of triggered vMISOpackets occurs at the directional link. However this numberis rather low, only reaching 2%. This happens mainly dueto the following two reasons: First, APs transmit at a muchhigher power than clients. This means that at the backhaul,packets are more likely to arrive with a much higher SNRto either the gateway or a routing AP. Hence, instead of apacket being lost due to channel quality, most are lost dueto congestion and interference, which translates into havingvery few vMISO retransmissions. On the other hand, clients,which are already transmitting at lower power, can also beaffected by their distance to the closest AP they can associatewith. Second, antenna gains between APs are also higher thanthose at the clients.
Table II presents per-flow average throughput gainsachieved. Observe that vMISO provides an average throughputgain of 14% to the network. While one flow experiencedthroughput losses of nearly 10%, another flow achieved nearlya 70% gain. More importantly, notice the 75 percentile islocated mostly between 0-10%. We conclude that even thoughsome flows experienced small losses, most of them improvedtheir performance. Clearly, vMISO is not able to achievethe same high gains in large-scale networks as it does withsmaller-scale topologies. Nevertheless, it improves the overallsystem by helping more flows than it hurts, and providingsubstantial gains to some disadvantaged flows.
Findings: Although in large scale networks the potential foreach flow to find an ideally positioned cooperator is greatlyincreased, when the number of active flows is large, network-wide vMISO gains are greatly reduced compared to smallscale networks due to substantially increased interference andcontention caused by the cooperators. Therefore, while flowsin small scale networks can independently choose whetherto trigger vMISO, large scale networks will benefit froma coordinated decision (e.g., via a network manager) thatdetermines which flows will invoke vMISO transmissions(e.g., those with maximum gains for themselves and minimuminterference for others).
VI. RELATED WORK
Prior work can be broadly categorized into two mainareas. First, most prior work on virtual antenna arrays andcooperative-diversity is information theoretic and focuses onperformance at the physical layer. The concept of user coop-eration is introduced in [19], [20] and was targeted to cellularnetworks where distributed nodes establish virtual MISO linksto increase capacity and robustness against channel variations.This work employs information-theoretic concepts to analyzecapacity and outage probability. An analytical study of differ-ent cooperative-diversity protocols, e.g., amplify-and-forward(AF) and decode-and-forward (DF), is presented in [12].Likewise, studies such as [17] focus on outage probabilitiescorresponding to different cooperation schemes as well as theirfundamental capacity limits. In contrast, we address MAC-layer and network-scale issues that arise from implementationof vMISO. Furthermore, our approach to evaluate vMISO (orcooperative-diversity) protocols is purely experimental ratherthan theoretical.
Second, there have been recent efforts to develop MACprotocols exploiting spatial diversity and virtual MISO trans-missions. MAC protocol designs have been presented andevaluated in [1], [8]–[11], [13], [14], [21] for example. Incontrast, our work does not focus on protocol design, butinstead comprises a study of generalized vMISO MAC mech-anisms with the purpose of identifying the triggering criteriathat provides with largest gains while minimizing interference.This is crucial for understanding how and for which scenariosa vMISO protocol should be designed and used. Likewise,hardware implementations have been developed for both asyn-chronous [4], [5], [10] and synchronous systems [15]. Al-though asynchronous cooperation circumvents the challenge ofstrict timing coordination, vMISOs synchronous cooperationat symbol time scales has been shown to yield larger benefits[15]. Unlike asynchronous implementations, vMISO transmis-sions in our work occur simultaneously by means of STBCsso that symbol level synchronization is a key factor in ourimplementation. In contrast to all previous implementations,our work focuses on diverse network topologies and evaluatesperformance of vMISO protocols in multi-flow networks.
VII. CONCLUSION
In this work, we evaluate the performance of vMISOschemes in critical networking scenarios that span from fullyconnected topologies, to cases leading to information asym-metry in both isolated and network-wide designs. We evaluatereactive and proactive vMISO protocols to identify the regimesin which vMISO transmissions should be triggered basedon network and channel conditions. We perform a studyof network factors affecting the gains that can be achievedthrough vMISO under different small-scale networking sce-narios consisting of at most two flows. Further, we extend ourevaluation to multi-flow, multi-hopping network configurationsconsisting of more complex interactions among nodes. Wepresent results from both an experimental setup as well assimulations where we implement different vMISO protocols

11
and demonstrate that the high gains from vMISO achieved insmall topologies decrease in large-scale network scenarios.
REFERENCES
[1] H. Adam, W. Elmenreich, C. Bettstetter, and S.M. Senouci. Core-MAC:A MAC-protocol for cooperative relaying in wireless networks. In Proc.of GLOBECOM, 2009.
[2] S.M. Alamouti. A simple transmit diversity technique for wirelesscommunications. IEEE Journal on Selected Areas in Communications,16(8):1451 –1458, Oct 1998.
[3] O. Bejarano, S. Miskovic, E. Aryafar, and E. Knightly. TFA: a largescale urban mesh network for social and network research. In Proc. ofthe 2010 ACM workshop on Wireless of the students, by the students,for the students, 2010.
[4] A. Bletsas and A. Lippman. Implementing cooperative diversity antennaarrays with commodity hardware. IEEE Communications Magazine,44(12):33 –40, Dec. 2006.
[5] G.J. Bradford and J.N. Laneman. An experimental framework for theevaluation of cooperative diversity. In Proc. Annual Conference onInformation Sciences and Systems, 2009.
[6] Q. Chen, F. Schmidt-Eisenlohr, D. Jiang, M. Torrent-Moreno, L. Del-grossi, and H. Hartenstein. Overhaul of IEEE 802.11 modeling andsimulation in ns-2. In Proc. of MSWiM, 2007.
[7] M Garetto, J. shi, and E. Knightly. Modeling media access in embeddedtwo-flow topologies of multi-hop wireless networks. In Proc. of ACMMobicom, 2005.
[8] C. Hunter, P. Murphy, and A. Sabharwal. Real-time testbed implemen-tation of a distributed cooperative MAC and PHY. In Proc. AnnualConference on Information Sciences and Systems, 2010.
[9] G. Jakllari, S. V. Krishnamurthy, M. Faloutsos, P. V. Krishnamurthy, andO. Ercetin. A framework for distributed spatio-temporal communicationsin mobile ad hoc networks. In Proc. of IEEE Infocom, 2006.
[10] T. Korakis, S. Narayanan, A. Bagri, and S. Panwar. Implementing acooperative MAC protocol for wireless LANs. In IEEE InternationalConference on Communications, 2006.
[11] M. Kurth, A. Zubow, and J.-P. Redlich. Cooperative opportunisticrouting using transmit diversity in wireless mesh networks. In Proc.of IEEE Infocom, 2008.
[12] J.N. Laneman, D.N.C. Tse, and G.W. Wornell. Cooperative diversityin wireless networks: Efficient protocols and outage behavior. IEEETransactions on Information Theory, 50(12):3062 – 3080, Dec. 2004.
[13] P. Liu, Z. Tao, S. Narayanan, T. Korakis, and S.S. Panwar. CoopMAC:A cooperative MAC for wireless LANs. IEEE Journal on Selected Areasin Comm., 25(2):340 –354, February 2007.
[14] M. Lu, P. Steenkiste, and T. Chen. Design, implementation andevaluation of an efficient opportunistic retransmission protocol. In Proc.of ACM MobiCom, 2009.
[15] P. Murphy, A. Sabharwal, and B. Aazhang. On building a coopera-tive communication system: testbed implementation and first results.EURASIP J. Wirel. Commun. Netw., 2009:7:1–7:9, February 2009.
[16] Patrick Murphy. Design, Implementation and Characterization of aCooperative Communications System. PhD thesis, Rice University, 2010.
[17] C.T.K. Ng and A.J. Goldsmith. Capacity and cooperation in wirelessnetworks. In Proc. of Information Theory and Applications, 2006.
[18] A. Nosratinia, T.E. Hunter, and A. Hedayat. Cooperative communicationin wireless networks. Communications Magazine, IEEE, 42(10):74 – 80,Oct. 2004.
[19] A. Sendonaris, E. Erkip, and B. Aazhang. User cooperation diversity.Part I. system description. IEEE Transactions on Communications,51(11):1927 – 1938, Nov. 2003.
[20] A. Sendonaris, E. Erkip, and B. Aazhang. User cooperation diversity.Part II. implementation aspects and performance analysis. IEEE Trans-actions on Communications, 51(11):1939 – 1948, Nov. 2003.
[21] Z. Xinyu and K.G. Shin. DAC: Distributed asynchronous cooperationfor wireless relay networks. In Proc. of IEEE Infocom, 2010.
[22] Ting Zhou, H. Sharif, M. Hempel, P. Mahasukhon, Wei Wang, and TaoMa. A novel adaptive distributed cooperative relaying MAC protocol forvehicular networks. IEEE Journal on Selected Areas in Communications,29(1):72 –82, January 2011.