virginia community corrections
TRANSCRIPT

Project Staff:
Scott E. Graves, Ph.D.
Michelle T. White, MPA
Shauna Strickland, MPA
National Center for State Courts
Project Co-Directors: Fred Cheesman, Ph.D. Tara L. Kunkel, MSW
Virginia Community Corrections Baseline Recidivism Study
July 18 2013
Virginia Community Corrections Baseline Recidivism Study
National Center for State Courts Page 2
Acknowledgements
The National Center for State Courts would like to take the opportunity to acknowledge and
thank all members of the Quality Assurance Subcommittee, as well as staff from the
Department of Criminal Justice Services, who committed a considerable amount of time to
this project. The strong collaborative effort between the Virginia Community Criminal
Justice Association and the Virginia Department of Criminal Justice Services has fervently
promoted the ability to assess the effectiveness and efficiency of Virginia’s local probation
agencies. Without the hard work and dedication of the individuals listed below, in addition
to all the committed professionals working in local probation agencies throughout the
Commonwealth of Virginia, this project would not have been possible.
Virginia Community Criminal Justice Association Quality Assurance Committee
Jackie Boxley Kris Bryant Ross Carew Gary Hughes Amy Jacobson Moe Petway Cynthia Plummer Joyce Sylvia Gene Whitlock Stephen Vilhelmsen Virginia Department of Criminal Justice Services Laurel Marks Paula Harpster Rebecca McNees Kenneth Rose
This project was supported by the Department of Criminal Justice Services (DCJS) grant #13-A2617AD11, with funds made available to the Commonwealth of Virginia from The Bureau of Justice Assistance, Office of Justice Programs, U.S. Department of Justice.
Points of view or opinions contained within this document are those of the author and do not necessarily represent the official position or policies of the Virginia Department of Criminal Justice Services or the United States Department of Justice.
Table of Contents

Virginia Community Corrections Baseline Recidivism Study
National Center for State Courts Page 3
INTRODUCTION .................................................................................................................................5
EBP SITES IN VIRGINIA ........................................................................................................................6
PROJECT APPROACH ..........................................................................................................................6
SOURCES OF DATA ................................................................................................................................................................... 7
PRETRIAL AND COMMUNITY CORRECTIONS CASE MANAGEMENT SYSTEM .. ERROR! BOOKMARK
NOT DEFINED.
VIRGINIA STATE POLICE DATA.......................................................................................................... 8
SAMPLE SELECTION ............................................................................................................................8
KEY FINDINGS ....................................................................................................................................9
BASELINE EVALUATION QUESTIONS ................................................................................................. 10
QUESTION 1: WHAT WAS THE DEMOGRAPHIC PROFILE OF PROBATIONERS WHO COMPLETED
COMMUNITY CORRECTIONS SUPERVISION IN FY04? ......................................................................................... 10
QUESTION 2: DID THE PROBATIONERS BEING SUPERVISED IN FY04 (BY THE 20 SITES THAT
WOULD BECOME THE EBP) SITES DIFFER DEMOGRAPHICALLY FROM THE PROBATIONERS
SUPERVISED IN THE NON-EBP SITES IN A STATISTICALLY MEANINGFUL WAY? ............................... 15
QUESTION 3: WHAT WAS THE AVERAGE LENGTH OF SUPERVISION IN FY04? ................................... 16
QUESTION 4: BY OFFENSE CATEGORY AND OFFENSE LEVEL, WHAT WERE THE PLACEMENT
CHARGES FOR THE FY04 PROBATION COMPLETERS? ....................................................................................... 17
QUESTION 5: WHAT WAS THE AVERAGE NUMBER OF OFFICE CONTACTS PER PROBATIONER
FOR THE FY04 COMPLETERS? ........................................................................................................................................ 19
QUESTION 6: WHAT SERVICES WERE PROBATIONERS ORDERED TO COMPLETE IN FY04? ........ 19
QUESTION 7: WHAT WERE THE CASE CLOSURE TYPES FOR LOCAL PROBATIONERS WHOSE
CASES WERE CLOSED IN FY04? IF UNSUCCESSFUL, WHY? ............................................................................. 20
QUESTION 8: WHAT PERCENTAGE OF FY04 LOCAL PROBATION COMPLETERS WERE RE-
ARRESTED AND/OR RECEIVED A NEW CONVICTION WHILE UNDER SUPERVISION? ....................... 22
QUESTION 9: WHAT PERCENTAGE OF FY04 LOCAL PROBATION COMPLETERS WERE RE-
ARRESTED AND/OR RECEIVED A NEW CONVICTION POST-PROGRAM THREE YEARS FROM EXIT
DATE? .......................................................................................................................................................................................... 22
QUESTION 10: WHAT TYPES OF NEW OFFENSES WERE COMMITTED BY LOCAL PROBATIONERS
AFTER EXITING IN FY04? .................................................................................................................................................. 24
QUESTION 11: WHAT, IF ANYTHING, PREDICTED WHETHER A PROBATIONER WOULD
COMPLETE LOCAL PROBATION SUPERVISION SUCCESSFULLY IN FY04? ................................................ 30
QUESTION 12: WHAT, IF ANYTHING, PREDICTED WHETHER A PROBATIONER WOULD BE
CONVICTED OF A NEW CRIME POST-PROGRAM IN FY04? ................................................................................ 31
CONCLUSIONS ................................................................................................................................. 31

Virginia Community Corrections Baseline Recidivism Study
National Center for State Courts Page 4
APPENDICES .................................................................................................................................... 33
APPENDIX A: EXAMPLES OF PLACEMENT OFFENSES IN EACH CATEGORY ........................................... 34
APPENDIX B: REPEATABLE RECIDIVISM STUDY ................................................................................................... 35
APPENDIX C: LOGIC MODEL ............................................................................................................................................. 42
Table of Figures
Figure 1: Age of Probationers Completing Supervision in FY04........................................................................ 10
Figure 2: Race of Probationers Completing Supervision in FY04 ..................................................................... 11
Figure 3: Gender of Probationers Completing Supervision in FY04 ................................................................ 12
Figure 4: Marital Status of Probationers Completing Supervision in FY04 ................................................. 13
Figure 5: Education of Probationers Completing Supervision in FY04 .......................................................... 13
Figure 6: Percentage of Probation Completers in FY04 with Prior Misdemeanor and Felony
Convictions ............................................................................................................................................................................... 14
Figure 7: Average Number of Prior Misdemeanor and Felony Convictions among Probation
Completers in FY04 .............................................................................................................................................................. 15
Figure 8: Average Length of Supervision by Placement Offense Level ........................................................... 17
Figure 9: Placement Charge for the FY04 Probation Completers by Offense Level ................................... 17
Figure 10: Misdemeanor Placement Charges for the FY04 Probation Completers ................................... 18
Figure 11: Felony Placement Charge for the FY04 Program Completers ...................................................... 18
Figure 12: Average Number of Office Contacts per Probation Completer in FY04 .................................... 19
Figure 13: Court-Ordered Services for FY04 Probation Completers ............................................................... 20
Figure 14: Case Closure Types for Local Probation Completers in FY04 ....................................................... 21
Figure 15: Reason for Unsuccessful Completion among FY04 Probation Completers ............................. 21
Figure 16: Re-Arrest and New Conviction Rates While Under Supervision ................................................. 22
Figure 17: Re-Arrest and New Conviction Three Years Post Exit for FY04 Probation Completers .... 23
Figure 18: New Conviction Rates Post Exit for FY04 Probation Completers................................................ 23
Figure 19: New Convictions within 3 Years by Offense Type for FY04 Probation Completers ............ 24
Figure 20: Average Number of Re-Arrests and New Convictions within 3 Years....................................... 25
Figure 21: New Convictions within 3 Years by Placement Charge for ............................................................ 25
Figure 22: New Convictions, by Type, for Probationers Placed on Supervision ......................................... 26
Figure 23: New Convictions, by Type, for Probationers Placed on Probation ............................................. 27
Figure 24: New Convictions, by Type, for Probationers Placed on Probation for Drug Offenses in
FY04 ............................................................................................................................................................................................ 28
Figure 25: New Convictions, by Type, For Probationers Placed on Supervision ........................................ 28
Figure 26: New Convictions, by Type, for Probationers Placed on Supervision ......................................... 29
Virginia Community Corrections Baseline Recidivism Study
National Center for State Courts Page 5
Introduction
In 1995, Virginia passed the Comprehensive Community Corrections Act which
established local, community-based probation as an alternative to incarceration for
persons convicted of certain misdemeanors or non-violent felonies for which sentences
would be 12 months or less in a local or regional jail. In Virginia, community correction
agencies are operated by local units of government but are funded by State general funds
through grants administered by the Virginia Department of Criminal Justice Services
(DCJS). DCJS provides administrative oversight to local probation and pretrial services.
There is also a statewide association, the Virginia Community Criminal Justice Association
(VCCJA), which represents and serves local probation and pretrial service agencies. As of
2012, there are 37 local probation agencies operating in Virginia, serving 128 of 134
localities in Virginia.1
Like many probation agencies across the nation, Virginia has experienced increasing
levels of probationer non-compliance with supervision conditions resulting in violations
that often lead to unsuccessful termination from supervision. In 2005, VCCJA and DCJS
committed to addressing this trend by beginning the process of integrating evidence-based
practices (EBPs) into all probation and pretrial services agencies. The goal of this initiative
is to use practices that have been empirically tested and have been shown to reduce
recidivism among offenders. What started as a small pilot in 2005 with four agencies
introducing EBPs into supervision has grown to 20 agencies as of 2012.
1 Comprehensive Community Corrections and Pretrial Services Act Report (December, 2012). Virginia Department of Criminal Justice Services.

Virginia Community Corrections Baseline Recidivism Study
National Center for State Courts Page 6
EBP Sites in Virginia
Phase I sites (implemented in 2005/2006): Blue Ridge Community Corrections Chesterfield/Colonial Heights Community Corrections Colonial Community Corrections Hampton/Newport News Criminal Justice Agency Henrico Community Corrections Lynchburg Community Corrections OAR/Jefferson Area Community Corrections Old Dominion Community Corrections Piedmont Court Services - Mecklenburg County Rappahannock Community Corrections
Phase II sites (implemented in 2010)
Culpeper County Criminal Justice Services Fairfax County Court Services Division Halifax/Pittsylvania Court Services New River Community Corrections & Pretrial Services Northern Neck Community Corrections Piedmont Court Services – Prince Edward County Portsmouth Community Corrections & Pretrial Services Prince William Office of Criminal Justice Services Riverside Criminal Justice Agency Virginia Beach Office of Community Corrections & Pretrial Services
Project Approach
In the fall of 2012, the Virginia Community Correction Justice Association contracted
with the National Center for State Courts (NCSC) to complete a baseline analysis of
outcomes associated with FY04 probation completers. The primary purpose of the baseline
analysis is to document the outcomes achieved by local probation in Virginia pre-EBP
implementation. Specifically, the baseline evaluation sought to answer the following
questions:
• What was the demographic profile of probationers who completed Community Corrections supervision in FY04?

Virginia Community Corrections Baseline Recidivism Study
National Center for State Courts Page 7
• Did the probationers being supervised in FY04 (by the 20 sites that would become the EBP) sites differ demographically from the probationers supervised in the non-EBP sites in a statistically meaningful way?
• What was the average length of probation supervision in FY04?
• By offense category and offense level, what were the primary placement charges for the FY04 probation completers?
• What was the average number of office contacts per probationer for the FY04 completers?
• What services were local probationers court-ordered to complete in FY04?
• What were the case closure types for local probationers whose cases were closed in FY04? If unsuccessful, why?
• What percentage of FY04 local probation completers were re-arrested and/or received a new conviction while under supervision?
• What percentage of FY04 local probation completers were re-arrested and/or received a new conviction post-program three years from exit date?
• What types of new offenses were committed by local probationers after exiting probation supervision in FY04?
• What, if anything, predicted whether a probationer would complete local probation supervision successfully in FY04?
• What, if anything, predicted whether a probationer would be convicted of a new crime post-program in FY04?
Sources of Data
The cohort for this report was defined as Community Corrections probationers who
completed supervision between July 1, 2003 and June 30, 2004. Data was collected from
several sources regarding this cohort.
Pretrial and Community Corrections Case Management System
Case-level and probationer data came from the statewide Pretrial and Community
Corrections (PTCC) case management. The PTCC case management system was developed
Virginia Community Corrections Baseline Recidivism Study
National Center for State Courts Page 8
under the auspices of the Department of Criminal Justice Services and is mandated for all
local probation and pretrial service agencies. In 2004 the PTCC system was still in its
relative infancy so some data elements that are now mandatory and/or more defined were
still optional in 2004.
Virginia State Police Data
Pre-program criminal history and all new arrest and conviction data were obtained from
the Virginia State Police for the FY04 probation completers selected for inclusion in the
study. Criminal history records for the sample were obtained in February 2013. Criminal
history information was separated into three categories: prior criminal history, placement
offense and recidivism offenses. Recidivism offenses were further divided into two
categories, in-program recidivism and post-program recidivism. In-program recidivism is
defined as an arrest and/or conviction (reported separately) for a criminal offense that
occurred between the probation entry and exit date. Post-program recidivism is defined as
a conviction for a new criminal offense that occurred anytime between the exit date from
probation and three years post-exit date.
Sample Selection
The study sample was drawn from all 37 local probation offices in Virginia. Because the
number of completers differed across sites, a sample was drawn from each site using the
following logic:
If 10% of a local probation office’s sample, after ineligible records were removed, was comfortably greater than 100, then a random sample of 10% was drawn.
If 10% of the site list was less than 100, then 100 records were drawn at random from the list.

Virginia Community Corrections Baseline Recidivism Study
National Center for State Courts Page 9
For three of the sites, the final list itself was either below or very near 100, and in those instances the entire site list was retained for the analysis sample.
Therefore, the sampling rate for the sites ranged from 10% to 100% for the three smallest
offices in population size. The remaining sites were sampled at a rate above 10%,
producing 100 individuals each. It is important to note that transfer in/out cases were
attributed to the jurisdiction that actually provided the supervision for purposes of this
study.
The entire population of Community Corrections probation in FY 2004 was 33,656.
A 10% sample of that population would total 3,366. However, due to oversampling at the
smaller sites as described above, the final sample size totaled 4,705. All estimates of
statewide summary statistics and correlations below account for this sampling strategy
with the use of probability weights and the number of observations reflect the weighted
counts, rather than the number of sampled observations. Observation totals will not
always sum to the entire population due to rounding errors or missing data.
Key Findings
This report was designed to establish a baseline recidivism rate, pre-EBP
implementation, for Virginia’s Community Corrections agencies. Based on a sample of
4,705 probationers who completed probation in FY04 we found:
The recidivism rate, as measured by a new arrest for a criminal offense three years post-exit, was 26.5% for successful completers and 44.2% for unsuccessful completers.
The recidivism rate, as measured by a new conviction for a criminal offense three years post-exit, was 16.2% for successful completers and 31.1% for unsuccessful completers.

Virginia Community Corrections Baseline Recidivism Study
National Center for State Courts Page 10
Baseline Evaluation Questions
Question 1: What was the demographic profile of probationers who completed
Community Corrections supervision in FY04?
The average age for probationers completing supervision in FY04 was 30 years. As Figure
1 shows, more than 80% of probation completers in FY04 were forty years old or younger.
Figure 1: Age of Probationers Completing Supervision in FY04 N = 33,626
More than half of the probationers completing supervision in FY04 were white. As Figure 2
indicates, over 40% were black and a small percentage, 3.6% were Hispanic.
22.9%
37.5%
21.0%
13.5%
4.0% 1.1%
0.0%
5.0%
10.0%
15.0%
20.0%
25.0%
30.0%
35.0%
40.0%
< 21 21-30 31-40 41-50 51-60 >60

Virginia Community Corrections Baseline Recidivism Study
National Center for State Courts Page 11
Figure 2: Race of Probationers Completing Supervision in FY04
N = 33,655
According to the 2000 US Census, 72.3% of Virginians were white and 19.6% were black
and 4.7% were Hispanic.2 As Figure 2 indicates, there was a disproportionate
representation of black persons in the FY04 sample.
Males represented nearly three-quarters of the probation completer sample in
FY04. This is also an over-representation, as in 2000 males comprised only 49% of the
population in Virginia. However, this percentage is not uncommon in correctional settings.
2United States Census Bureau. (2000). Profile of General Demographic Characteristics:
200Washington, D.C.: United States Census Bureau.
0.8%
41.1%
3.6% 0.1%
53.3%
1.1%
0.0%
10.0%
20.0%
30.0%
40.0%
50.0%
60.0%

Virginia Community Corrections Baseline Recidivism Study
National Center for State Courts Page 12
Figure 3: Gender of Probationers Completing Supervision in FY04
N = 33,654
As Figure 4 demonstrates, nearly 65% of probation completers in FY04 reported having
never been married. In the context of average age of probationers in the sample being 30
years, this appears reasonable.
73.5%
26.5%
Male
Female

Virginia Community Corrections Baseline Recidivism Study
National Center for State Courts Page 13
Figure 4: Marital Status of Probationers Completing Supervision in FY04
N = 33,555
Nearly half of the probationers completing supervision in FY04 had at least a high school
diploma/GED. Twenty percent (20%) of the probationers in the sample attended some
college.
Figure 5: Education of Probationers Completing Supervision in FY04
N = 33,518
20.1%
7.1% 7.9%
1.0%
64.0%
0.0%
10.0%
20.0%
30.0%
40.0%
50.0%
60.0%
70.0%
Married Separated Divorced Widowed Never Married
6.4% 4.9%
9.0% 12.5%
38.0%
7.6%
0.9%
6.7% 6.8% 3.1% 3.5%
0.7% 0.0%
5.0%
10.0%
15.0%
20.0%
25.0%
30.0%
35.0%
40.0%
Virginia Community Corrections Baseline Recidivism Study
National Center for State Courts Page 14
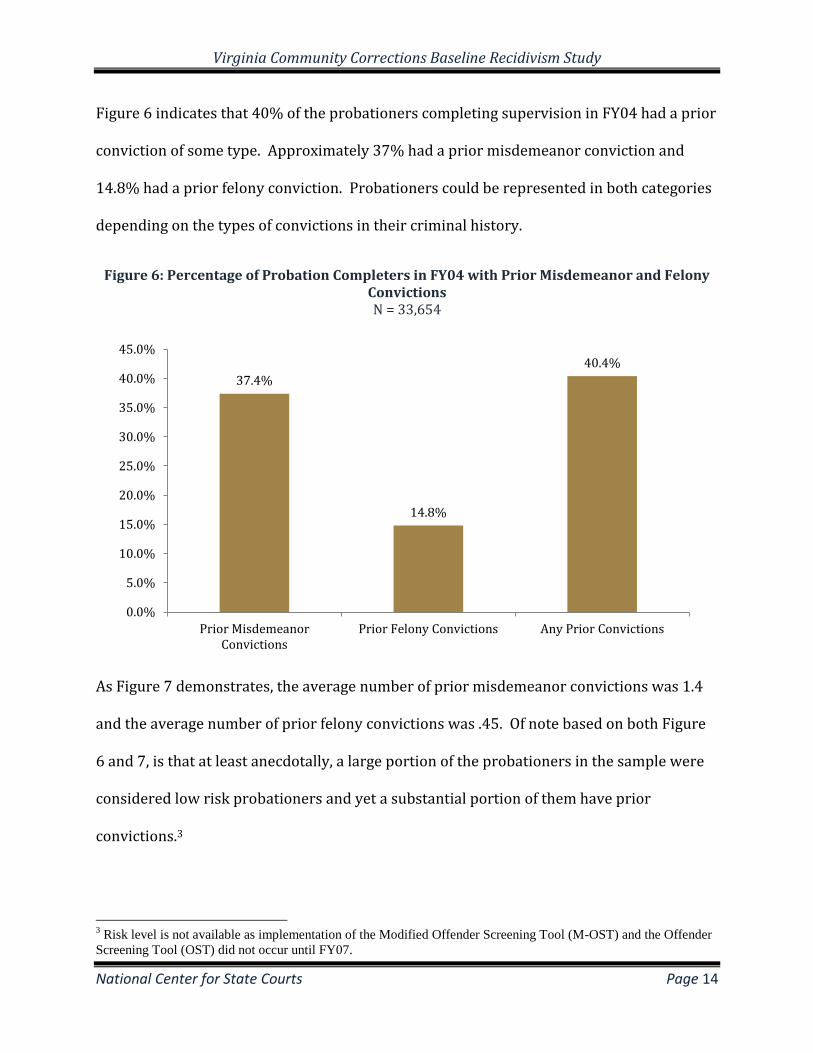
Figure 6 indicates that 40% of the probationers completing supervision in FY04 had a prior
conviction of some type. Approximately 37% had a prior misdemeanor conviction and
14.8% had a prior felony conviction. Probationers could be represented in both categories
depending on the types of convictions in their criminal history.
Figure 6: Percentage of Probation Completers in FY04 with Prior Misdemeanor and Felony Convictions N = 33,654
As Figure 7 demonstrates, the average number of prior misdemeanor convictions was 1.4
and the average number of prior felony convictions was .45. Of note based on both Figure
6 and 7, is that at least anecdotally, a large portion of the probationers in the sample were
considered low risk probationers and yet a substantial portion of them have prior
convictions.3
3 Risk level is not available as implementation of the Modified Offender Screening Tool (M-OST) and the Offender
Screening Tool (OST) did not occur until FY07.
37.4%
14.8%
40.4%
0.0%
5.0%
10.0%
15.0%
20.0%
25.0%
30.0%
35.0%
40.0%
45.0%
Prior Misdemeanor Convictions
Prior Felony Convictions Any Prior Convictions

Virginia Community Corrections Baseline Recidivism Study
National Center for State Courts Page 15
Figure 7: Average Number of Prior Misdemeanor and Felony Convictions among Probation Completers in FY04
N = 33,654
Question 2: Did the probationers being supervised in FY04 (by the 20 sites that
would become the EBP) sites differ demographically from the probationers
supervised in the non-EBP sites in a statistically meaningful way?
As Table 1 shows, there were no statistically significant differences between the
demographics of the probationers at the 20 sites that would become the EBP sites versus
the non-EBP sites in 2004. The EBP sites tended to be proportionately more white and less
black than the non-EBP sites but, again, the difference was not statistically significant. As
early implementers, the original EBP sites will continue to be sources of interest because
they will have the longest track record of employing the targeted EBPs and will be used in
comparisons to other agencies at varying stages of progress of adopting the targeted EBPs.
The expectation is that probation outcomes will improve as the targeted EBPs are
implemented and that they should consequently improve first among the early
implementers and later in later-adopting agencies. To assess the impact of the targeted
1.41
0.45
0
0.2
0.4
0.6
0.8
1
1.2
1.4
1.6
Average # of Prior Misdemeanor Convictions
Average # of Prior Felony Convictions

Virginia Community Corrections Baseline Recidivism Study
National Center for State Courts Page 16
EBPs on probationer outcomes, we want to be able to attribute any differences in outcomes
between probationers from agencies at varying stages of adoption to the stage of adoption
and not some demographic difference between the populations of the agencies. A primary
outcome, recidivism, is strongly related to many demographic characteristics such as
gender and age. This analysis rules out significant demographic differences between the
EBP and non-EBP sites which make it more likely that any differences in outcomes between
the two types of sites will be due to their stage of implementation of the targeted EBPs.
Table 1: Comparison of Demographic Characteristics of Probationers from Evidence-Based Practices Sites and Non-EBP Sites
Demographic Characteristic
Evidence-Based
Practice Sites Non-EBP
Sites Difference (EBP –
Non-EBP)
% Female 26.2% 26.9% -0.7%
% Asian 0.9% 0.6% 0.3%
% Black 39.2% 44.0% -4.8%
% Hispanic 3.8% 3.4% 0.4%
% Native American 0.1% 0.1% 0.0%
% White 55.0% 50.7% 4.3%
% Race/Ethnicity Unknown or Other
1.1% 1.3% -0.2%
Average Age 29.4 30.4 -1.1
NOTE: None of the differences are statically significant.
Question 3: What was the average length of supervision in FY04?
The average length of supervision for the entire sample was 8.6 months. For successful
probation completers the average length of supervision was 8.2 months and for
unsuccessful probationers it was 9.4 months. As Figure 8 indicates, the average length of
supervision for felony placements was 12.1 months and 8.3 months for misdemeanor
placements.

Virginia Community Corrections Baseline Recidivism Study
National Center for State Courts Page 17
Figure 8: Average Length of Supervision by Placement Offense Level
N = 31,153
Question 4: By offense category and offense level, what were the placement charges
for the FY04 Probation Completers?
The vast majority of probation completers in FY04 were placed on probation supervision
for a misdemeanor offense. Only 7% were placed on a felony offense.
Figure 9: Placement Charge for the FY04 Probation Completers by Offense Level N = 31,153
12.1
8.3
0
2
4
6
8
10
12
14
Felony Misdemeanor
7%
93%
0%
10%
20%
30%
40%
50%
60%
70%
80%
90%
100%
Felony Misdemeanor

Virginia Community Corrections Baseline Recidivism Study
National Center for State Courts Page 18
Figure 10 indicates the percentage of misdemeanor placements by offense category.
Person and drug offenses had the highest placement rates. Refer to Appendix A for a
description of charges included in each category.
Figure 10: Misdemeanor Placement Charges for the FY04 Probation Completers N = 28,969
Figure 11 indicates that the majority of the felony placements were for drug offenses.
Figure 11: Felony Placement Charge for the FY04 Program Completers N =2,184
29%
18%
26%
10% 11%
6%
0% 0%
5%
10%
15%
20%
25%
30%
35%
Person Offense
Property Offense
Drug Offense Public Order Offense
Technical Offense
Driving Offense
Other Offense
16%
27%
42%
4%
10%
0% 0% 0%
5%
10%
15%
20%
25%
30%
35%
40%
45%
Person Offense
Property Offense
Drug Offense Public Order Offense
Technical Offense
Driving Offense
Other Offense

Virginia Community Corrections Baseline Recidivism Study
National Center for State Courts Page 19
Of note are the person offenses, particularly in the felony category. Over 70% of the person
offenses, both misdemeanor and felony combined were domestic violence related.
Question 5: What was the average number of office contacts per probationer for the
FY04 completers?
Not all sites documented office contacts in PTCC in FY04. For the sites where this
information was documented, the average number of office contacts for successful
completers was 8.9 contacts and for unsuccessful completers was 10.6 contacts. Based on
the average length of supervision discussed in question 3, this equates to approximately
one contact per month during the period of supervision.
Figure 12: Average Number of Office Contacts per Probation Completer in FY04 N = 33,654
Question 6: What services were probationers ordered to complete in FY04?
Figure 13 details the types of services probationers were ordered to complete. It is
important to highlight that approximately 27% of all placements were for drug charges and
22.3% probationers received substance abuse assessment and/or treatment. And that
8.9
10.6
8
8.5
9
9.5
10
10.5
11
Successful Unsuccessful

Virginia Community Corrections Baseline Recidivism Study
National Center for State Courts Page 20
71% of the person offenses were domestic violence related (which equates to
approximately 20% of all placements) and 25% of probationers received anger
management or batterer’s intervention services.
Figure 13: Court-Ordered Services for FY04 Probation Completers N = 33,654
Question 7: What were the case closure types for local probationers whose cases
were closed in FY04? If unsuccessful, why?
As Figure 14 suggests, over two-thirds of probation cases closed in FY04 were closed
successfully. “Successful case closure” is defined as completion of all requirements of
supervision.
13.9% 11.0%
51.9%
0.1% 1.3%
14.2%
0.5% 3.0%
22.3%
29.5%
0.0%
10.0%
20.0%
30.0%
40.0%
50.0%
60.0%

Virginia Community Corrections Baseline Recidivism Study
National Center for State Courts Page 21
Figure 14: Case Closure Types for Local Probation Completers in FY04 N = 33,654
As Figure 15 depicts, technical violations were the most common reason for unsuccessful
case closure. A technical violation is defined as a violation of the terms and conditions of
probation whereby a probationer was returned to the sentencing court for review of the
case.
Figure 15: Reason for Unsuccessful Completion among FY04 Probation Completers N = 8,337
67.6%
24.8%
5.6% 1.8% 0.2% 0.1%
0.0%
10.0%
20.0%
30.0%
40.0%
50.0%
60.0%
70.0%
80.0%
Successful Unsuccessful Other Closure Type
Pending Medical Death
63.8%
17.8%
8.0%
2.4% 8.0%
0.0%
10.0%
20.0%
30.0%
40.0%
50.0%
60.0%
70.0%
Technical Violation Program Closed—Capias Issued
Revoked—New Misdemeanor
Offense
Revoked—New Felony Offense
Other

Virginia Community Corrections Baseline Recidivism Study
National Center for State Courts Page 22
Question 8: What percentage of FY04 local probation completers were re-arrested
and/or received a new conviction while under supervision?
Figure 16 demonstrates recidivism that occurred while probationers were under probation
supervision, broken out by successful and unsuccessful completers, and showing the group
as a whole. Both new arrests and new convictions were reported. Differences in rates
between arrest and conviction are due in large part to the short periods of supervision and
the sometimes lengthy criminal justice process to move from arrest to conviction,
particularly for new felony offenses. Differences between the successful and unsuccessful
completers on both measures are significant at the .001 level.
Figure 16: Re-Arrest and New Conviction Rates While Under Supervision for FY04 Probation Completers
N = 33,654
Question 9: What percentage of FY04 local probation completers were re-arrested
and/or received a new conviction post-program three years from exit date?
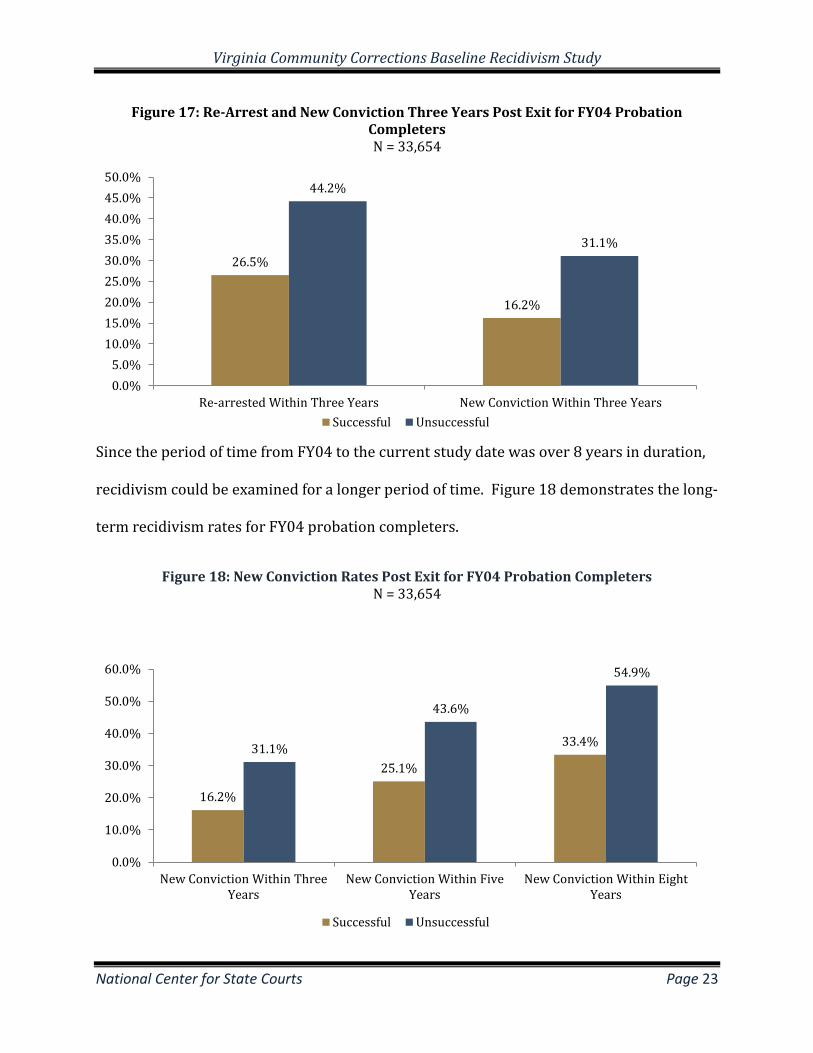
Figure 17 reflects recidivism that occurred three years after exit from Community
Corrections probation supervision. Both new arrests and new convictions were reported.
Differences between the successful and unsuccessful completers on all measures are
significant at the .001 level.
3.1%
8.3%
4.8%
1.6%
3.9%
2.3%
0.0%
1.0%
2.0%
3.0%
4.0%
5.0%
6.0%
7.0%
8.0%
9.0%
Successful Unsuccessful Total
Re-Arrested While in Program New Conviction While in Program
Virginia Community Corrections Baseline Recidivism Study
National Center for State Courts Page 23
Figure 17: Re-Arrest and New Conviction Three Years Post Exit for FY04 Probation Completers N = 33,654
Since the period of time from FY04 to the current study date was over 8 years in duration,
recidivism could be examined for a longer period of time. Figure 18 demonstrates the long-
term recidivism rates for FY04 probation completers.
Figure 18: New Conviction Rates Post Exit for FY04 Probation Completers N = 33,654
26.5%
16.2%
44.2%
31.1%
0.0%
5.0%
10.0%
15.0%
20.0%
25.0%
30.0%
35.0%
40.0%
45.0%
50.0%
Re-arrested Within Three Years New Conviction Within Three Years
Successful Unsuccessful
16.2%
25.1%
33.4% 31.1%
43.6%
54.9%
0.0%
10.0%
20.0%
30.0%
40.0%
50.0%
60.0%
New Conviction Within Three Years
New Conviction Within Five Years
New Conviction Within Eight Years
Successful Unsuccessful

Virginia Community Corrections Baseline Recidivism Study
National Center for State Courts Page 24
Though recidivism rates cannot decrease over time, there is a leveling-off effect that can be
seen. Over time, the increase in the rate diminishes. Differences between the successful
and unsuccessful completers on all measures are significant at the .001 level.
Question 10: What types of new offenses were committed by local probationers after
exiting in FY04?
New offenses committed by FY04 probation completers three years post-exit were
primarily property, drug and technical violations. Refer to Appendix A for a description of
offenses included in each category.
Figure 19: New Convictions within 3 Years by Offense Type for FY04 Probation Completers N = 33,654
Among those probation completers who committed a new offense, the average number of
re-arrests was 2.18 misdemeanors and 1.76 felonies three years post-supervision.
Likewise, for those probation completers who had new convictions, the average number of
new convictions was 1.81 misdemeanor convictions and 0.73 felony convictions within
14.1%
28.5%
23.9%
11.1%
23.3%
2.0% 1.2%
0.0%
5.0%
10.0%
15.0%
20.0%
25.0%
30.0%
Person Offense
Property Offense
Drug Offense
Public Order Technical Offense
Driving Offense
Other Offense

Virginia Community Corrections Baseline Recidivism Study
National Center for State Courts Page 25
three years among all recidivists. The average number of new convictions for
misdemeanors was more than double the average number of new felony convictions.
Figure 20: Average Number of Re-Arrests and New Convictions within 3 Years for FY04 Probation Completers
N = 33,654
Figure 21 depicts new convictions within three years by placement charge type. Those
probationers on supervision for a technical offense had the highest conviction rate for a new
charge. With the exception of driving offenses, all placement types had relatively the same
percentage of new convictions among all recidivists.
Figure 21: New Convictions within 3 Years by Placement Charge for FY04 Probation Completers
N = 33,654
1.76
0.73
2.18
1.81
0
0.5
1
1.5
2
2.5
Re-Arrest New Conviction
Felony Misdemeanor
Virginia Community Corrections Baseline Recidivism Study
National Center for State Courts Page 26
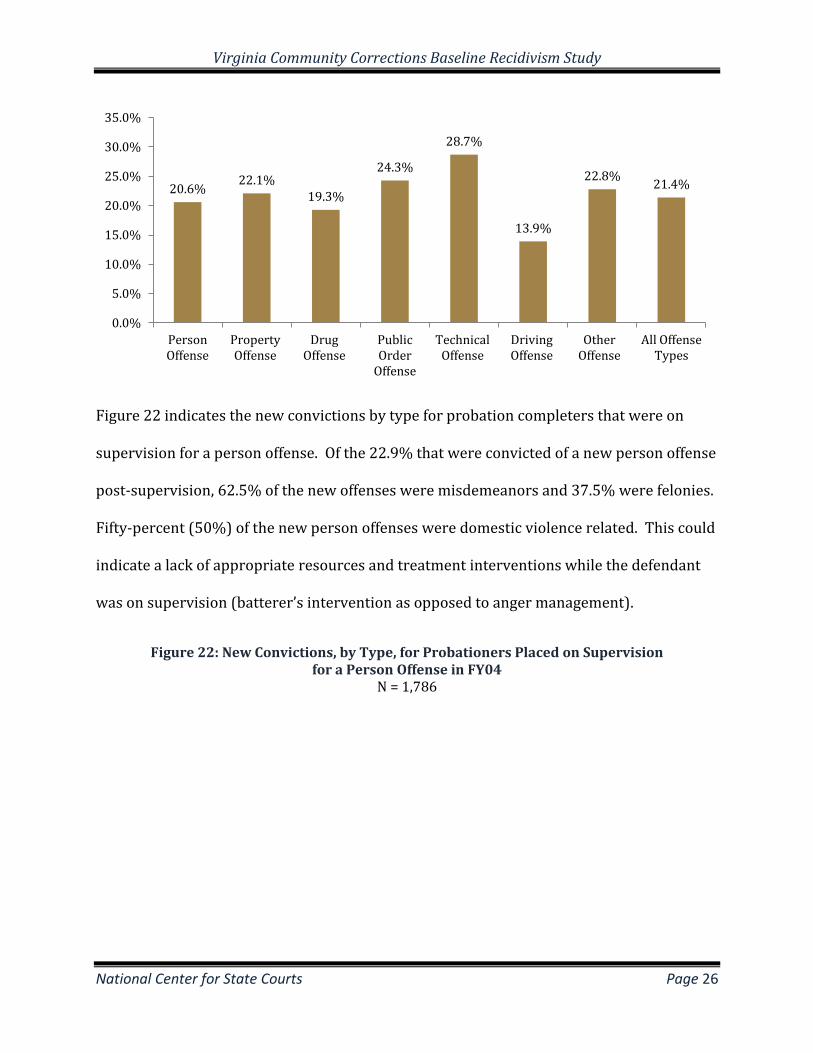
Figure 22 indicates the new convictions by type for probation completers that were on
supervision for a person offense. Of the 22.9% that were convicted of a new person offense
post-supervision, 62.5% of the new offenses were misdemeanors and 37.5% were felonies.
Fifty-percent (50%) of the new person offenses were domestic violence related. This could
indicate a lack of appropriate resources and treatment interventions while the defendant
was on supervision (batterer’s intervention as opposed to anger management).
Figure 22: New Convictions, by Type, for Probationers Placed on Supervision for a Person Offense in FY04
N = 1,786
20.6% 22.1%
19.3%
24.3%
28.7%
13.9%
22.8% 21.4%
0.0%
5.0%
10.0%
15.0%
20.0%
25.0%
30.0%
35.0%
Person Offense
Property Offense
Drug Offense
Public Order
Offense
Technical Offense
Driving Offense
Other Offense
All Offense Types

Virginia Community Corrections Baseline Recidivism Study
National Center for State Courts Page 27
Figure 23 indicates the new convictions by type for probation completers that were on
supervision for a property offense. The majority of the new convictions were for
subsequent property offenses, for example, a probationer on supervision for shoplifting
receiving a subsequent conviction for concealment. This could indicate a lack of resources
in cognitive behavioral treatment.
Figure 23: New Convictions, by Type, for Probationers Placed on Probation for Property Offenses in FY04
N = 1,262
22.9%
16.2% 17.9%
12.7%
26.3%
1.8% 1.7%
0.0%
5.0%
10.0%
15.0%
20.0%
25.0%
30.0%
Person Offense
Property Offenses
Drug Offenses
Public Order Technical Offenses
Driving Offenses
Other Offenses
9.2%
38.1%
19.0%
8.4%
22.9%
2.3% 0.0%
0.0%
5.0%
10.0%
15.0%
20.0%
25.0%
30.0%
35.0%
40.0%
45.0%
Person Offense
Property Offenses
Drug Offenses Public Order Technical Offenses
Driving Offenses
Other Offenses

Virginia Community Corrections Baseline Recidivism Study
National Center for State Courts Page 28
Figure 24 indicates the new convictions by type for probation completers that were on
supervision for a drug offense. The majority of the new convictions were for subsequent
drug offenses. This could also indicate a need for additional resources in the area of
substance abuse screening, assessment and treatment.
Figure 24: New Convictions, by Type, for Probationers Placed on Probation for Drug Offenses in FY04
N = 1,640
Figure 25 indicates the new convictions by type for probation completers that were on
supervision for a public order offense. The majority of the new convictions were for
subsequent drug offenses, for example, a probationer on supervision for indecent exposure
receiving a subsequent conviction for possession of marijuana. This could indicate a lack of
resources in drug/alcohol testing, and substance abuse screening, assessment and
treatment.
Figure 25: New Convictions, by Type, For Probationers Placed on Supervision for Public Order Offenses in FY04
N = 723
11.2%
21.7%
31.3%
10.5%
22.2%
0.9% 2.2%
0.0%
5.0%
10.0%
15.0%
20.0%
25.0%
30.0%
35.0%
Person Offense
Property Offenses
Drug Offenses
Public Order Technical Offenses
Driving Offenses
Other Offenses

Virginia Community Corrections Baseline Recidivism Study
National Center for State Courts Page 29
Figure 26 indicates the new convictions by type for probation completers that were on
supervision for a technical violation. The majority of the new convictions were for
subsequent technical violations, for example, a probationer on supervision for violation of a
protective order receiving a subsequent conviction for failure to appear. This could
indicate a lack of resources in screening and assessment, case planning and cognitive
behavioral treatment.
Figure 26: New Convictions, by Type, for Probationers Placed on Supervision
for Technical Violations in FY04 N = 1,000
8.7%
30.3%
36.4%
12.3% 10.3%
0.7% 0.9%
0.0%
5.0%
10.0%
15.0%
20.0%
25.0%
30.0%
35.0%
40.0%
Person Offense
Property Offenses
Drug Offenses
Public Order Technical Offenses
Driving Offenses
Other Offenses

Virginia Community Corrections Baseline Recidivism Study
National Center for State Courts Page 30
Question 11: What, if anything, predicted whether a probationer would complete
local probation supervision successfully in FY04?
Multivariate analyses were conducted to identify the factors that predicted the probability
of (1) successful completion and (2) recidivism. Because Type of Completion and Recidivism
are complex phenomenon, any number of factors could explain variation in these two
variables (e.g., age, race, sex). To determine each of these factors’ unique contribution to
explaining such variation, it is necessary to simultaneously control for the influence of all
the other explanatory factors by means of a multivariate analysis. The factors included in
the multivariate analyses of both successful completion and recidivism (a conviction for an
offense that occurred within three years of exit from probation) were:
Gender Race Felony placement offense Prior misdemeanor conviction Prior felony conviction Age (centered by site to control for average differences between sites)
11.7%
20.2%
15.7%
11.4%
35.4%
4.4%
0.8%
0.0%
5.0%
10.0%
15.0%
20.0%
25.0%
30.0%
35.0%
40.0%
Person Offense
Property Offenses
Drug Offenses Public Order Technical Offenses
Driving Offenses
Other Offenses

Virginia Community Corrections Baseline Recidivism Study
National Center for State Courts Page 31
Years of schooling (centered by site to control for average differences between sites)
Successful completion (used in analysis of recidivism)
The multivariate regression of successful completion revealed the following:
Blacks were 31% less likely to successfully complete than whites. Probationers placed on a felony-level charge are 53% less likely to successfully
complete than Probationers with a prior misdemeanor conviction at placement are 42% less
likely to successfully complete than . Probationers with a prior felony conviction at placement are 38% less likely to
successfully complete than . At each site, every year of education beyond the average for that site increases the
odds of successfully completing by 6%. At each site, every year of age beyond the average for that site increases the odds of
successfully completing by 2%.
All of the findings above are statistically significant at the .05 level or greater.
Question 12: What, if anything, predicted whether a probationer would be convicted
of a new crime post-program in FY04?
The multivariate regression of recidivism (conviction for an offense that occurred within
three years of probation exit) revealed the following:
Women are 35% less likely to recidivate than men. At each site, every year of age beyond the average for that site decreases the odds
of recidivism by 4%. Blacks are 39% more likely to recidivate than whites.
Probationers with prior misdemeanor convictions at placement are 117% more
likely to recidivate than those without prior misdemeanor convictions.
Successfully completing probation decreases the odds of recidivism by 46%.
All of the findings above are statistically significant at the .05 level or greater.
Conclusions
This report was designed to establish a baseline recidivism rate for Virginia’s Community
Corrections agencies (pre-EBP implementation) using the FY04 probation completers as
the baseline sample. A random of sample of 4,705 probationers, selected from all the sites

Virginia Community Corrections Baseline Recidivism Study
National Center for State Courts Page 32
across Virginia, was used to establish a baseline recidivism rate of 26.5% for successful
completers and 44.2% for unsuccessful completers, as measured by a new arrest for
criminal offense three years post-exit. When using new convictions three years post-exit as
the measure of recidivism, the rates drop to 16.2% for successful completers and 31.1% for
unsuccessful completers. A number of patterns were identified related to placement
offense type and the likelihood of committing specific types of offenses in the future that
suggest that defendants could benefit from more targeted interventions to address specific
risk factors. At baseline there were no statistically significant differences between what
are now EBP sites and non-EBP sites. Therefore, the EBP sites can serve as a valuable point
of reference in future studies to examine the potential impacts of the implementation of
evidence based practices as they are gradually implemented statewide. Future studies will
also benefit from improved data entry into PTCC and enhancements to the system. It is
recommended that this study be repeated annually with a cohort to include post-EBP
implementation time periods.

Virginia Community Corrections Baseline Recidivism Study
National Center for State Courts Page 33
Appendices

Virginia Community Corrections Baseline Recidivism Study
National Center for State Courts Page 34
Appendix A: Examples of Placement Offenses in each Category
Person Offenses: Domestic Assault, Simple Assault, Assault on a Law Enforcement Officer,
Child Abuse or Neglect, Hit and Run, Sex Offenses, Robbery, etc.
Property Offenses: Burglary, Larceny, Concealment, Unauthorized Use of a Vehicle, Fraud,
Forgery, Embezzlement, Receiving Stolen Property, Destruction of Property, etc.
Drug Offenses: All Possession charges, DUI, Drunk in Public, etc.
Public Order: Prostitution, Indecent Exposure, Disturbing the Peace, Obstruction of Justice,
etc.
Technical Violations: Failure to Appear, Violation of Court Order, Violation of Probation,
etc.
Driving: Driving with a Suspended Operator’s License, Habitual Offender, etc.
Other: Accessory After the Fact, Attempt/Conspiracy/Solicitation to Commit Misdemeanor
or Felony, Cruelty to Animals, etc.

Virginia Community Corrections Baseline Recidivism Study
National Center for State Courts Page 35
Appendix B: Repeatable Recidivism Study
The purpose of the repeatable recidivism study is to measure (1) probationer outcomes
and (2) the level of organizational change and evidence-based practice implementation at
each of the 37 probation sites in order to establish a causal link between implementation
and probationer outcomes. Examining recidivism rates requires selecting a cohort that
completed supervision a minimum of three years ago (to allow for a three year follow-up
period). As such, the FY10 probation completers are the next group that can be reasonably
studied. The FY10 probation completers are the first cohort that contains probationers
who were supervised after the introduction of the initial evidence-based reforms at the 10
pilot sites. While the evidence-based reforms were still in their infancy in FY10, this cohort
provides an initial opportunity to examine the impact of risk/needs assessment on
supervision practices and recidivism – something the FY04 baseline study could not
provide. In contrast to examining recidivism, measuring organizational change and
evidence-based practices implementation can only be done in the present since this data
has not been historically collected using standardized tools. As such, a reasonable schedule
for future studies is as follows:
Study Year Examination to be Conducted
FY13 Offender-level outcomes – baseline established using the FY04 probation completers (completed)
FY14 Offender-level outcomes – re-examined using the FY10 completers Agency and organizational outcomes – baseline established in FY14
FY15 Offender-level outcomes – re-examined using the FY12 completers

Virginia Community Corrections Baseline Recidivism Study
National Center for State Courts Page 36
FY16 Offender-level outcomes – examined using the FY13 completers Agency and organizational outcomes – FY16 rates compared to FY14 rates to measure change
FY 17 Offender-level outcomes – re-examined using the FY14. Examine relation between agency and organizational outcomes in FY14 (as measured by Survey of Organizational Functioning, Probation Services Survey, and Community Resources Map) and outcomes in FY 17.
FY 19 Offender-level outcomes – re-examined using the FY17. Relate change in measures of agency and organizational outcomes between FY14 and FY16 to changes in recidivism rates between FY14 and FY16.
Evaluation Plan for 2009 Probation Completer Cohort
Selection of the FY10 cohort will be conducted the same as the selection of the FY04 cohort,
which was used to establish the baseline recidivism rates. The following steps will be
completed:
1. All data related to probationers completing supervision in FY10 will be extracted from PTCC.
2. Any probationer whose supervision was transferred to another jurisdiction will be assigned to the jurisdiction that provided the actual supervision for purposes of the analysis.
3. If probationers have more than one placement in the sample, the placement with the earliest placement start date will be maintained in the sample and the others will be removed.
4. Because the number of completers differed across sites, a sample will be drawn from each site using the following logic: If 10% of a local probation office’s sample, after ineligible records were
removed, is comfortably greater than 100, then a random sample of 10% will be drawn.
If 10% of a local probation office’s sample is less than 100 but its total list is greater than 100, then 100 records will be drawn at random from the list.
The remaining sites will have either below or very near 100 total records on their lists, and in those instances the entire site list will be retained for the analysis sample.

Virginia Community Corrections Baseline Recidivism Study
National Center for State Courts Page 37
5. Demographic information for the sample will be submitted to the Virginia State Police to obtain criminal history and recidivism information for the sample. This data will be matched up with the PTCC data.
6. Any individual in the sample that does not have matching criminal history information will be removed from the study.
7. Criminal history information will be separated into three groups: Placement offenses will be identified by matching the placement offense
description and placement date. All offenses with offense dates prior to the probation date will be
considered prior criminal history. All offenses with offense dates after the placement date but prior to the
probation closure date will be considered in-program recidivism. All offenses with offense dates after the placement and probation closure
date will be considered post-supervision recidivism.
Research Questions for the FY10 Cohort
Many of the research questions from the baseline study will be examined with the FY10
cohort including the following:
1. What was the demographic profile of probationers who completed Community Corrections supervision in FY10?
2. Did the probationers being supervised in FY10 sites differ demographically from the probationers supervised in the non-EBP sites in a statistically meaningful way?
3. What was the average length of probation supervision in FY10? 4. By offense category and offense level, what were the placement charges for
the FY10 probation completers? 5. What was the average number of office contacts per probationer for the
FY10 completers? Were the FY10 probation completers supervised per their supervision level (as determined by the OST)?
6. What services were local probationers court-ordered to complete in FY10? 7. What were the case closure types for local probationers whose cases were
closed in FY10? If unsuccessful, why? 8. What percentage of FY10 local probation completers were re-arrested
and/or received a new conviction while under supervision? 9. What percentage of FY10 local probation completers were re-arrested
and/or received a new conviction post-program three years from exit date? 10. What types of new offenses were committed by local probationers after
exiting in FY10? 11. What impact did risk level (as measured by the OST and M-OST) have on
case closure type or recidivism rates for FY10 local probation completers?

Virginia Community Corrections Baseline Recidivism Study
National Center for State Courts Page 38
12. What, if anything, predicted whether a probationer would complete local probation supervision successfully in FY10?
13. What, if anything, predicted whether a probationer would be convicted of a new crime post-program in FY10?
In addition, a multivariate analysis of recidivism will be conducted that will enable three
pertinent comparisons:
14. EBP Pilot vs. EBP non-pilot sites for the 2010 cohort: Provides a preliminary test of effects of introduction of evidence-based reforms, using the non-pilot sites as the comparison group at a particular point in time (2010).
15. FY10probation completers vs. FY04 baseline cohort at the first 10 EBP pilot sites: Provides another preliminary test of effects of introduction of evidence-based reforms, comparing the pilot sites to themselves over time (pre-EBP implementation versus post-EBP implementation).
16. FY10 probation completers vs. FY04 baseline cohort at the non-EBP pilot sites: Are recidivism rates changing over time for reasons other than the introduction of evidence-based reforms?
While we simply will not have the data that will enable us to definitively establish a causal
link between the introduction of the evidence-based reforms and recidivism, we will
examine the dates of introduction of the evidence-based reforms in each pilot site and any
documentation about their introduction. To the extent possible, this information may
enable us to make some preliminary inferences about the effect of the introduction of the
evidence-base reforms on recidivism rates. As described below, the additional data that we
will collect for the 2010 cohorts will make it possible to more validly and reliably establish
whether the introduction of the evidence-based reforms has led to a reduction in
recidivism.
Agency and System Level Outcomes for FY14 samples
To measure agency and system level outcomes, the following will be administered in FY14:

Virginia Community Corrections Baseline Recidivism Study
National Center for State Courts Page 39
Tool to be Administered Target Audience for Survey
Approximate Date of Administration
CJ Survey of Organizational Functioning
All staff
October 2013
Evidence Based Practice Implementation Model Compliance Assessment & Best Practice Survey (which will be integrated into one online survey for ease of administration)
Administration October 2013
Probation Services Survey
All probationers seen in the office within a two
week period during the fall and spring
September 2013 and March 2014
All of the tools above (with the exception of the Probation Services Survey) will be
automated and available online for the staff to complete. The process of administering the
Probation Services Survey will be developed with the Quality Assurance Committee in the
summer of 2013.
Evaluation Plan for 2014 and Subsequent Cohorts
It is recommended that the next cohort be samples from probationers whose case
was closed in FY14. The addition of this and subsequent cohorts will enable us to more
definitively ascertain whether the introduction of the evidence-based reforms as opposed
to some other confounding explanation, such as a general drop in crime rates, has led to a
Virginia Community Corrections Baseline Recidivism Study
National Center for State Courts Page 40
reduction in recidivism. For these subsequent cohorts, we will have much more
information about the implementation of the evidence-based reforms.
The project logic model found in Appendix C captures our theory of offender change.
The model shows that Inputs and Activities will produce Outputs at all three levels (System,
Agency, and Case). Outputs measure the work that is accomplished at each level. We
hypothesize that changes in outputs at the agency and system level are pre-requisites for
changes at the case-level in offender behavior. To restate this hypothesis, we expect that
the extent of change at the system and agency-levels will predict the extent of change in
offender behavior (recidivism in particular). To test this hypothesis, we will employ a
technique known as Structural Equation Modeling (SEM)4 to determine whether outputs at
the agency and system-levels are significantly related to outputs at the case-level, as
described in the logic model.
As captured in the logic model, we also hypothesize that changes in outputs are pre-
requisites for changes in short-term outcomes. Also, we expect that changes in short-term
outcomes at the case level will be related to changes in short-term outcomes at the agency
and system-levels. These expected relationships will be tested using SEM and will provide
evidence as to whether short-term outcomes are related to the introduction of evidence-
based reforms.
Finally, we also hypothesize that changes in short-term outcomes at all three levels
are necessary for changes in long-term impacts. Since we also hypothesize that changes in
4 Structural equation modeling (SEM) is a statistical technique for testing and estimating causal relations using a
combination of statistical data and qualitative causal assumptions.

Virginia Community Corrections Baseline Recidivism Study
National Center for State Courts Page 41
short-term outcomes must be preceded by changes in outputs (at all three levels), these
relationships will all be incorporated in our SEM of long-term impacts. This analysis will
test whether implementation of the evidence-based reforms is causally related to long-
term offender impacts.
The data collected for cohorts subsequent to the 2014 cohort, can be used to more
definitively establish if the evidence-based reforms introduced by local probation agencies
are responsible for any observed reductions in the probability of recidivism. In this case we
will have at least two cohorts with data about implementation and the data should be
analyzed using a time series “panel” design.

Virginia Community Corrections Baseline Recidivism Study
National Center for State Courts Page 42
Appendix C: Logic Model