village ecosystem and its linkage with the...
TRANSCRIPT

Chapter-1
VILLAGE ECOSYSTEM AND ITS LINKAGE WITH THE
NATURAL RESOURCES
1. INTRODUCTION
1.1 Forest linked livelihood needs
Forests in the Himalaya are under pressure, through both internal
and external forces, with adverse impacts on the fuelwood, fodder and
other daily needs of the forest dwellers, and also on forest based
government revenues (Eckholm, 1982; Singh eta/., 1984; Ramakrishnan et
a/., 19992). Increasing flow of outside population in the form of tourists has
further added the pressure on the forest resources (lves and Pitt, 1988;
Thapa and Weber, 1990). Studies have shown that deforestation in
Himalaya has implications for agriculture not only in the adjoining hills and
mountains, but also in the plains far below (Pandey and Singh, 1984;
Mahat eta/., 1986; Virgo and Subba, 1994; Maikhuri eta/., 1997).
1.2 Traditional agroecosystems
Mountain societies are dependent upon traditional complex multi
species agroecosystems organized in space and time (Ramakrishnan,
1992; Swift et a/., 1996). Though highly energy efficient, with little or no
energy subsidies from outside (contrast with modern agriculture receiving
32

inorganic fertilizers and other chemical inputs), economic productivity is low
(Altieri, 1983; Maikhuri and Ramakrishnan, 1990, 1991; Maikhuri, 1996;
Semwal and Maikhuri, 1996). However, with high biodiversity within, these
agroecosystems are suggested to cope with environmental uncertainities,
in a reasonable way (Ramakrishnan, 2001 ).
Agriculture in the Himalaya and elsewhere is closely linked with the
forest ecosystems. Traditional agroecosystems are sustained through the
energy-flow from the adjoining forest ecosystems. Since, agriculture in the
traditional societies is highly dependent upon the natural resource base,
farmyard manure and human labour, quality of the forest from where they
extract the natural resource becomes highly important (Tsegye, 1997;
Datta and Virgo, 1998; Ellis-Jones, 1999; Sen eta/., 2000). Studies have
shown that agroecosystems located in natural resource rich areas are
generally more energy efficient than those located in resource poor areas
of the mountains (Maikhuri, 1992, 1996; Semwal and Maikhuri, 1996).
Hence, this study compares two agroecosystems, one from a resource rich
and another from a resource poor forested area.
1.3 Earthworms as indicators of soil fertility
Earthworms are the most common species of soil macrofauna and
are widespread. The beneficial effects that earthworm can have on soil
structure, fertility and plant production through their feeding and burrowing
activities are well documented (Lee, 1985). For example, earthworms can
improve the incorporation of organic matter below the soil surface, increase
33

the number of water stable soil aggregates, improve water infiltration,
aeration and root penetration (Lee and Foster, 1991; Lee, 2000).
Earthworms have been shown to be indicator of soil fertility, through many
studies, such as under shifting agriculture (Bhaduria and Ramakrishnan,
1989, 1991 ), settled farming (Tiwari and Mishra, 1995; Bhaduria et a/.,
1997), and from natural forest ecosystems (Bhaduria eta/., 2000). Senapati
using earthworms as soil fertility indicator (1984) has evolved earthworm
based ecotechnology for soil fertility improvement (Senapati et a/., 1999). In
this study, earthworms population dynamics was evaluated both in
agricultural and natural ecosystems, as indicator of soil fertility. The major
external pressure in this region is related to tourist flow passing into more
interior mountain areas of Nepal (Carpenter and Zomer, 1996; Boker and
Kolmair, 2000). There are studies available in the Himalayan region linking
village ecosystem operations under varied levels of natural resources
availability (Pandey and Singh 1984; Maikhuri and Ramakrishnan, 1990,
1991; Semwal and Maikhuri, 1996). Some studies are also available on the
impact of the tourism from Indian Himalayas (Rai and Sundriyal, 1997;
Maikhuri, 2000), and from the Nepal region (Shrestha, 1989; Boker and
Kolmair, 2000). These impacts have the implications for both forest
ecosystesms and for the food production systems (agriculture). Local
communities have adapted to avail natural resources and its degradation,
in a variety of different ways, for obtaining their livelihood needs. This study
therefore attempts to compare natural and human managed
agroecosystems operating under different tourism related pressure in the
34

village T amafok (less impacted and referred as TF hereafter) and the
village Madimulkharka (more impacted and referred as MM hereafter).
Study area and Climate:
The study area (27°12'N to 87°27'E) covering 24.69 km2
,
representing part of Piluwa watershed including two villages, namely
T amafok and Madimulkharka are studied here. Land use pattern of the
study area is forest 41.9%, agriculture land 54.4%, grassland 2.3%, and
1.4% under other uses. The altitude ranges from 2200 to 3100 m, with
sloping lands of 15- 45 °. The region is reported to be one of the high birds
diversity areas of Nepal (Ali, 1977), and is suggested to be the last
remaining Rhododendron forest stand of a size that is viable from the point
of conservation (Shrestha, 1984). Currently, this area is under
consideration as a Rhododendron (Rhododendron arboreum) Conservation
Area, particularly because this species represents the national flower
(MOPE, 1998). This area leads on to the Makalu Barun Conservation Area
towards the north-west, and Kanchenjunga Conservation Area towards the
north-east closer to the Qomolongma Nature Reserve in Tibet,
Autonomous Region, P.R. China. For this reason, the present area is
considered as the habitat corridor of many rare and endangered wildlife
species, and at the same time falls along the popular trekking route for
tourism to Kanchenjunga - Makalu range, and also Mt. Everest in the
north. The dark brown -black mountain soil, which is acidic (pH 4.3- 5.3)
has a high proportion of sand/silt, and is podozolic. The climate can be
35

Ma..p 1.. hEGEND Di•lrlcl Boundary
VDC Boundory
Hlvor
Main loot traiL'
CONTOUR INTERVAL 100 METRES
Mir.or lvol troll
School
Contour
Spot hoi9hl 3034
Sollltmtnl
forest
L;r~ ..

divided into three distinct seasons - cold winter from November to March
with an average maximum temperature of 17°C and a minimum of - 2°C,
monsoonic rainy season extending from May to October with an average
maximum temperature of 25°C and a minimum of 1 0°C, and a short
summer during April and May with an average maximum of 24°C and a
minimum of 8°C.
2. METHODS OF STUDY
2.1 Site selection:
Site selection was done based upon a Participatory Rural Appraisal
involving local elders, and confirmed by a Rapid Habit Assessment (IUCN,
1998) done in order to ensure comparable topographic and altitudional
conditions. Focus Group Discussion (Chambers, 1994), Personal interview
and Questionnaire Survey (Ardales, 1992) were carried out to evaluate
resource use pattern, size of land holdings, land use and socio-cultural
practices pertaining to village ecosystem and its linkage to natural
resources followed by a 12 months household level sample analysis, for
confirmation.
2. 2 Forest
Vegetation analysis of forest at different degradation level was done
using 30 quadrats in each of the forests, trees (10 X 10m), shrubs (5 X 5
m) and herbs (1 X 1 m). Frequency, density, basal area and Important
Value Index (lVI) of each species was analyzed (Mishra. 1968; Kershaw,
36

30 -r-----------------------------------------~-350
25 - 300
6~ ~~ 0
15 200 .§. ~ 10 150 ~ B c ~ 5 100 "(V m ~ a. E m
1-
50
~~~~~~~~~~§L~~~~~~~~-0
Month
1 ~Temperature Min l!!!i!!!M Temperature Max -+-----Rain-tall/
Fig. 1.1. Mean monthly maximum, minimum ambient temperature and
rainfall
20 18 16 14 12 10 8 6 4 2 0
Fig. 1.2. Soil temperature °C

1973; IUCN, 1998). Regeneration of tree spec1es were calculated by
counting the seedlings (height up to 20 em) and sapling (height > 20 em
but DBH < 10 em) per unit area following Sundriyal and Sharma (1996).
Diversity Index (R) was measured following Shannon and Wiener (1949)
and concentration of dominance (cd) of species was calculated following
(Simpson, 1949) for observation of strongest control/cover of species over
space.
Earthworms were extracted by digging twenty 25 X 25 X 25 em soil
monoliths, hand sorted and preserved in 5% formalin (Zazonc 1971;
Bhaduria and Ramakrishnan, 1991), for subsequent identification. Biomass
values were taken on fresh-weight basis. Composite soil samples of 0 - 15
em and 15 - 30 em depth were collected, and air dried for subsequent
physico-chemical analysis for characterizing soil features (Anderson &
Ingram, 1989).
2.3 Agriculture
Category of land holding sizes namely: small, medium and large ( < 1
ha, 1 - 2 ha, > 2 ha) respectively were set through Focus Group
Discussion (Chambers, 1994) method. Household survey was done taking
23% households (50 out of 218 households) as sample covering both the
villages (Ardales, 1992). Information was gathered on the basis of actual
observation on, category of land holdings, crop composition, labour input
(in terms of man and animal hours), seed and manure inputs, collection of
fodder, bedding material needs for livestock population, fuelwood
37

requirements, yield of crop and crop-by products and import/export of
agriculture produce. All studies on agroecosystems were based on
measurements in three replicate plots for each category, namely large,
medium and small landholdings.
The replicate samples were analyzed for calculating energy input
and output values. Input value was calculated for work done (human and
bullock) as man and bullock hours. Depending upon the human labour, it
was classified into 'sedentary', 'moderate' and 'heavy'. Per hour energy
expenditure of 0.418 MJ for sedentary work, 0.488 MJ for moderate work
and 0.679 MJ for heavy work for an adult male, and 0.331 MJ for sedentary
work, 0.383 MJ for moderate work and 0.523 MJ for heavy work, for an
adult female were used to calculate the human labour energy input into the
system (Gopalan et a/., 1989). Energy input through animal power (1
bullock hour = 3.03 MJ) was based on Mitchell (1979). Input of energy
through seeds was based on the energy expended to produce that fraction
of crop yield. The input of organic manure into agroecosystems was
converted into energy by multiplying their quantities with the standard value
given in Table 1.1. Crop and crop-by products yield values were on fifteen
sample plants from each replicate plot. Plot yield was then converted on a
hectare basis (Maikhuri & Ramakrishnan, 1990). For calculating crop
energy output, the standard values given (Mitchell, 1979; Gopalan et a/.,
1989) in Table 1 .1 were followed. The energy efficiencies of each system
were calculated as output/input ratio (Maikhuri & Ramakrishnan, 1990).
38
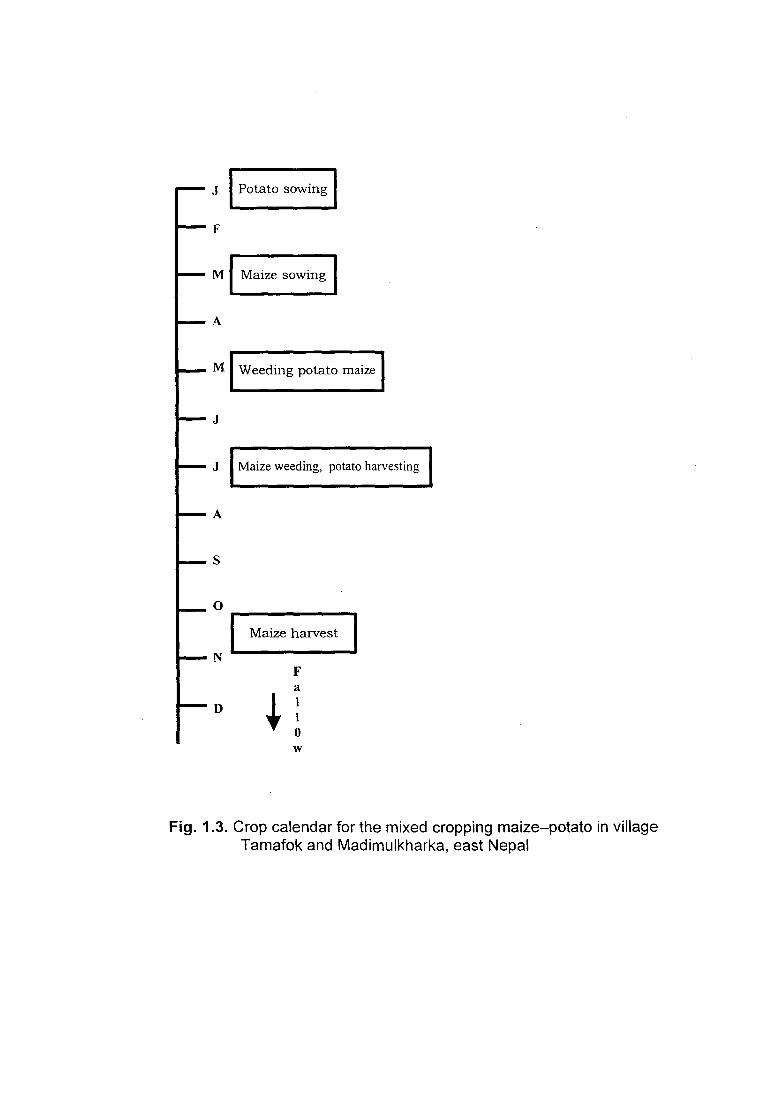
J Potato sowing
F
M Maize sowing
A
M Weeding potato maize
J
J Maize weeding, potato harvesting
A
s
0 r-----------~ I Maize harvest
N F
w
Fig. 1.3. Crop calendar for the mixed cropping maize-potato in village Tamafok and Madimulkharka, east Nepal

The economic efficiencies (outpuUinput ratio) for each inpuUoutput
item was calculated, based upon the current price values for each item.
Table 1.1. Energy value of different components considered in the agro
ecosystems (values expressed as fresh weight megajoules
equivalent).
Category
Maize, dry
Maize, tender
Barley
Potato
Mustard
Green fodder
Compost
1 Mitchell, 1979
2 Gopalan et at, 1989
2.4 Nutritional level
Average energy value
MJ kg -1
14.3 1
5.3 2
14.1 2
4.05 2
22.6·2
3.9 2
7.3 1, 2
The National Planning Commission (1994-95) estimates the
minimum daily requirements of cereals to be 525 g per capita (191 kg yr - 1)
in the mountain regions, to derive an average of 2340 k calories energy per
day, whilst World Health Organization's estimate 250 kg of cereals person-
1 yr - 1. However, the local population consider the satisfactory amount of
39

cereals intake of 328 kg person - 1 yr -1 to be satisfactory level. The mean of
all these three values calculated for our assessment works to be about 250
kg person - 1 yr - 1 and was considered as 'satisfactory level'. Intake of less
than half of that quantity (125 kg person -1 yr - 1) was considered to be
'destitute level'. Based on these two, a 'tolerable level' was taken to be a
range falling between 125- 250 kg person - 1 yr -1.
3. RESULTS
3.1 Forests
3.1.1 Forest structure
A total of twenty tree species were found in the study area with a
higher species number in the> 70% canopy cover TF as compared to MM,
with only < 50% canopy cover; with eight tree species common between
the two (Table 1.2). Density and basal area were higher in TF as compared
to MM. Rhodedendron arboreum, Goldfussia penstemo-noides and Lyonia
ovalifolia were the dominant tree species in TF, whereas, Quercus
semecarpifolia, Rhododendron arboreum and Lyonia ova/ifolia were
dominant in MM.
Density of shrubs was higher in TF as compared with MM (Table
1.3). Rhamnus nipa/ensis, Daphne sp. and Arundanaria mating were
common and dominant in both the forests but with higher densities in TF.
The mean volume of standing trees was not significantly different between
the two forests (Table 1.2).
40

Table 1. 2. Density, basal area and Important Value Indices (lVI) of tree species in Tamafok and Madimulkharka forests of Tinjure Milke region, Nepal
Species Local name Density Basal area IVI Density Basal area !VI (trees ha-t) (m2 ha -1
) (trees ha -I) (m2 ha- 1)
Tamafok Madimulkharka
Berberis aristata Chutro 3 0.23 2.9 Castanopsis sp. Bhote katus 3 0.03 2.5 Goldfussia penstemo-noides Angare 117 6.7 46.6 23 3.3 33.4 hchaemun rugusum Mallido 13 0.8 3.3 Loranthus pentapetalus Kandeliso 3 2.7 5.5 Lyonia oval(folia Angeri 107 6.7 39.0 60 2.1 37.2 Osmanthus suavis Shillinge 70 3.8 21.0 3 0.03 2.5 Pilea symmeria Kamale 7 0.07 3.8 Quercus glauca Falat 10 0.7 4. 9 3 0.97 4.2 Quercus semecarpifolia Khasru 20 7.6 20.0 147 37.3 140.3 Rhododendron arboreum Laliguras 340 35.1 116.1 77 12.4 58.6 Rhododendron grande Guras 7 0.2 3.8 Rhododendron hodgosonii Guras 10 0.6 4.8 7 0.1 5.5 Symplocos pyrifolia Kho1me 10 0.3 4.2 7 0.23 4.1 Symplocos ramossima Kharane 23 1.5 12.8 3 0.07 2.6 Taxus bacata Dhyangre sallo 3 1.1 3.2 Viburnum cordifolium As are 13 0.5 7.5 Viburnum cotilifolium Bakalpate 3 0.03 2.5 Miscellaneous (n = 2) 10 1.5 7.3
Total 756 " 69.8 300 346 56.9 300 Mean± S.E. of volume of trees (m3 ha 1
): TF = 373.08 ± 88.9; MM = 371.14 ± 65.5

Table 1. 3. Density of shrub species in Tamafok and Madimulkharka forest Tinjure-Milke region Nepal
Species Local name Density (Number ha- 1
)
Tamafok
Arundanaria maling Malingo 3146 Auricularia auricula Musakane Calamus acanthospathus Betkanda 200 Daphne sp. Lokta 4066 Desmodium microphyllum Bakhreghas Rhamnus nipalensis Chillikath 32632 Miscellaneous (n = 1) 40
Total 40084
Table 1.4. Diversity and dominance of tree species ofTamafok and Madimulkharka forest, Tinjure-Milke region, east Nepal
Madimulkharka
587 160
3812 67 20222
24848
Parameters Tamafok Madimulkharka
Diversity Index (H') Trees Shrubs
Concentration of dominance ( cd)
2.61 0.915 0.258
2.4 0.854 0.266

3.1.2 Species diversity and regeneration
The diversity index for both trees and shrubs was somewhat higher
in TF compared to MM, though the concentration of dominance was
stronger in MM (Table 1.4).
Regeneration potential (total number of seedlings and saplings) was
relatively higher in MM as compared to TF (Table 1.5). However, many tree
(e.g. /schaeum rugusum and Quercus glauca) species found in the adult
stage did not have any seedlings/saplings. Seedling and sapling
distribution did not correspond to the mature tree distribution. Berberis
aristata and Viburnum cordifolium were the dominant regenerating species
in TF, whereas, Viburnum cotilifolium and Rhododendron arboreum were
the dominant regenerating species in MM.
3.2 Agroecosystems
3.2.1 Landholding pattern
The detailed structure of the villages under study is presented m
Table 1.6. Average landholdings, cultivated land and fallow land are all
higher in the resource rich village TF compared to village MM. However,
livestock holding was higher in village MM compared to TF village. In MM,
self-employment through small business was more important activity than
TF.
The percentage of big landholders was more in village TF, whereas,
small landholders formed the majority in village MM (Table 1.7). A larger
41

Table 1.5. Sapling-seedling density of tree species ofTamafok, Madimulkharka forests, Tinjure-Milke region, Nepal Species Tamafok
Berberis aristata Castanopsis sp. Eurya cerasifolia Ficus nerrifolia Garuga pinnata Goldfussia penstemo-noides Lyonia ovalifolia Loranthus pentapetalus
Mahonia acanthifolia Osmanthus suavis Quercus semecarpifolia Rhododendron arboreum Symplocos pyrifolia Symplocos ramossima Viburnum cordifolium Viburnum cotilifolium Miscellaneous (n=2)
Total
(Number ha-1)
4932
533 133 13
67 147 360 80 587 1573 2399
200
11024
Madimulkharka (Number ha-1
)
1346 27 40 27 27 693 866 13
67 1280 1626 1586 387 1067 120 2026
11198

Plate 1. Tamafok, non-degraded forest with Siddhasthan sacred grove at the top
Plate 2. Bringing bedding material from the community forest for livestock use

Table 1.6. Selected ecological and socio-economic attributes of the villages under study Parameters
Altitude (masl) Major ethnicity Water source for agriculture Average family size Total land per household (ha)± S.E. Cultivated land per household (ha) ± S.E.
Fallow land per household (ha) Land under other uses (ha) Livestock holding per household Human density ha- cultivated land Livestock density ha-1 cultivated land Adult population with additional employment (%)
Small business Daily wages/services
Tamafok
2200-2560 Tamang Rain fed 6.95. 2.48 ± 0.36 1.03 ± 0.12 (40% of total land) 0.62 0.83 9.0 6.75 8.73
14 57
Madimulkharka
2200-2500 Chhetri Rainfed 7.19 1.91 ± 0.21 0.86 ± 0.12 (45%)
0.29 0.76 11.3 8.36 13.14 53
53 39

Table 1.7. Number of households under different landholding categories in the study villages. Value in parentheses indicates percentage of the total.
Category of land holdings Tamafok Madimulkharka
Large Medium Small
Total
23 (39) 19 (32) 17 (29)
59 (100)
30 (19) 54 (34) 75 (47)
159 (100)
Table 1.8. Percentage range ofland area cultivated out of the total available land with a given family
Category of land holdings Tamafok Madimulkharka
Large Medium Small
25-35 30-50 35-75
25-35 30-70 40-80

proportion of the available land with a given family is cultivated by small
farmers, closely followed by the medium category of farmers. The big
farmer cultivated a much smaller proportion of land available with him
(Table 1.8).
3.2.2 Agroecosystem structure and function
Agroecoystem analysis based on energy input/output has been done
for different ecological situations (Table 1.9). Human labour and organic
residue including farmyard manure are the only forms of energy input into
the system. Apart from edible output in the form of grain and tuber, some of
the biomass is used as a source of food, whilst the rest is used for organic
manure. Generally speaking natural resource poor area has higher energy
return and efficiency ratio compared to resource rich area.
Within village MM, energy input (P < 0.01) and output (P < 0.05)
increased significantly under the smaller holdings.
The agronomic yield and the total yield both was significantly higher
(P < 0.05) in village MM with the decline of landholding size, however the
difference was not significant in village TF. Whilst total energy input
increased significantly (P < 0.01) with the decrease in landholding size in
the village MM, there was no significant difference between landholdings in
the village TF.
The major energy contribution was through organic manure in all the
systems (Table 1.9 & 1.1 0).
42

Table 1.9. Total± S.E. annual energy input and output pattern and output/input ratio for the mixed cropping (values in MJ X ha· 1 yr- 1)
in study villages
Parameters Tamafok Madimulkharka
Large Landholding Medium Landholding Small landholding Large landholding Medium landholding Small landholding Inputs Human labour 224 ± 35 87± 8 105 ± 16 114 ± 12 116 ± 17 ISO± 15
Animal labour 149 ± 31 106 ± 12 94± 5. 48.3 ± 3.9 61 ± 10 92 ± 13 Farmyard manure 31638 ±54 17835 ± 1724 22191 ± 687 15432 ± 561 31965 ± 2334 33046 ± 1899 Seed 3032 ± 1573 68 ±6 855 ± 47 621 ± 65 597 ± 106 991 ± 137
Total 35044±1701 18091 ± 1716 22343 ± 761 16216 ± 642 32738 ± 2466 34278 ± 2064
Outputs Agronomic yield (Grain + tuber) 104006 ± 24425 111154 ± 818 110186 ± 7520 111075 ± 2006 227971 ± 28554 309111 ± 50827 Crop by product 120250 ± 19403 97890 ± 3538 77090 ± 7419 60433 ± 4920 131300 ± 23893 147420 ± 16362
Total 224256 ± 43828 209044 ± 4356 187276 ± 14939 171508 ± 6926 359271 ± 52447 456531 ± 65472
Output/Input ratio Edible biomass (Grain +tuber) 3 6.1 4.9 6.9 7 9
Edible biomass+ crop residue 6.4 10.3 8.4 10.6 II 13.3

Table 1.10. Percent share of energy in different input and output activities of the agroecosytems ofTamafok and Madimulkharka villages
Parameters
Input
Human labour
Animal labour
Farm yard manure
Seed
Total
Output
Grain +tuber yield
Crop by product
Total
Large
landholding
0.64
0.42
90.2
8.6
100
46.4
53.6
100
lamafok
Medtum
landholding
0.47
0.58
98.0
0.4
100
58.8
41.2
100
Madtmuikharka
Small Large landholdtng Medtum landholdtng Small landholdmg
landholding
0.45 0.7 0.35 0.44
0.40 0.3 0.19 027
95.4 95 97.6 96.4
3.7 3.8 1.8 2.9
100 100 100 100
53.2 64 63.5 67.7
46.8 36 36.5 32.3
100 100 tOO 100

Table 1.11. Total ± S.E. annual economic input output and output/input ratio for the mixed crop (maize+ potato) in two different villages (in Nepalese Rupees X ha -I yr -I: (1 US$ equivalent to75 NRs)
Parameters
Input
Human labour
Animal labour
Farmyard manure
Seed
Total
Output
Grain +tuber yield
Crop by product
Total
Output/Input ratio
Grain +tuber
Grains + crop residue
Large landholding
4063 ± 720
1227 ± 258
4013 ± 686
5980± 842
15283 ± 2805
302967 ± 32274
44250± 7462
349217± 31503
19.8
22.8
lamafol(
Medium landholding
1238 ±59
903 ± 97
2262 ± 218
80 ± 5
4483 ± 328
98979 ± 8868
29650± 1361
128627 ± 7570
22.0
28.7
Small landholding
1875 ± 300
820 ± 28
2839± 98
3232 ± 176
7840 ± 183
146740± 10576
37650± 2853
184390 ± I 3205
18.7
23.5
Large landholding
2101± 229
399 ± 3 I
1957±71
2129 ± 201
6758 ± 513
221071 ±20381
23500 ± I 804
244571 ± 19978
32.7
36.2
J'V'!a11nnul i(hari(a
Medium landholding
2068 ± 284
501± 81
4046 ± 288
1780 ± 121
8395 ± 669
457458 ± 30456
50500 ± 9190
507958 ± 38887
54.5
60.5
SmalllandholdiJig
2527± 140
755 ± 104
4149 ± 240
3602 ± 493
11033±845
66 7207 ± 70713
56700 ± 6293
723907 ±
72936
60.5
65.6

Energy output and efficiency ratios tend to be higher (P < 0.01)
under medium/small holdings compared to big holdings in both the villages.
Monetary output input ratio also followed the same trend as energy
input/output pattern in both the villages, except that the efficiency ratios
were generally higher (Table 1.11 ).
3.3 Earthworm dynamics in agriculture linked to forest
3.3.1 Species diversity in the forest
A total of ten earthworm species belonging to four families were
found in the study area (Table 1.12). Eight of them were endemic and two
exotics. Amongst the forest, more species were present in TF as compared
to MM, six species namely, Perionyx nanus (Stephenson), Perionyx
jorpokriensis (Julka) and Perionyx sp. of Megascolecidae; P/ute/lus
sikkimensis (Michaelson) and Plutellus sp. of Acanthodrillidae and
Sco/ioscolides bergitheili (Michaelson) of Octochaetidae being common to
both.
Density as well as biomass of common species was higher under TF
as compared to MM with the exception of Perionyx sp. and P/ute/lus
sikkimensis. Eutyphoeus lippus and Amynthas corticis (Kinberg) were
confined to TF forest alone.
43
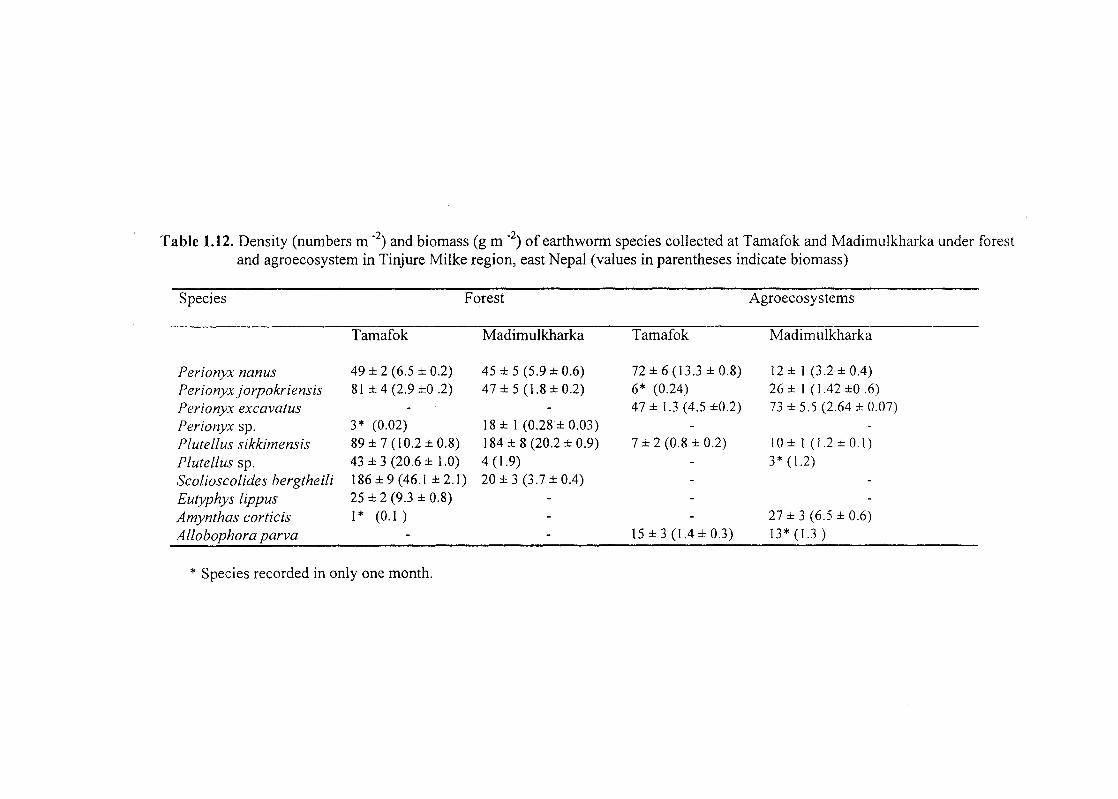
Table 1.12. Density (numbers m "2) and biomass (g m ·2) of earthworm species collected at Tamafok and Madimulkharka under forest and agroecosystem in Tinjure Milke region, east Nepal (values in parentheses indicate biomass)
Species Forest
Perionyx nanus Perionyx jorpokriensis Perionyx excavatus Perionyx sp. Plutellus sikkimensis Plutellus sp. Scolioscolides bergtheili Eutyphys lippus Amynthas corticis Allobophora parva
Tamafok
49 ± 2 (6.5 ± 0.2) 81 ± 4 (2.9 ±0 .2)
3* (0.02) 89 ± 7 (10.2 ± 0.8) 43 ± 3 (20.6 ± 1.0) 186±9(46.1 ±2.1) 25 ± 2 (9.3 ± 0.8) 1* (0.1)
* Species recorded in only one month.
Madimulkharka
45 ± 5 (5.9 ± 0.6) 47 ± 5 (1.8 ± 0.2)
18 ± 1 (0.28 ± 0.03) 184 ± 8 (20.2 ± 0.9) 4 ( l. 9) 20 ± 3 (3.7 ± 0.4)
Tamafok
72 ± 6 (13.3 ± 0.8) 6* (0.24) 47 ± 1.3 (4.5 ±0.2)
7 ± 2 (0.8 ± 0.2)
15 ± 3 (1.4 ± 0.3)
Agroecosystems
Madimulkharka
12± I (3.2±0.4) 26 ± 1 ( 1.42 ±0 .6) 73 ± 5.5 (2.64 ± 0.07)
10 ± I ( 1.2 ± 0.1) 3* (1.2)
27 ± 3 (6.5 ± 0.6) 13* (1.3)

Allobophora parva Amynthas
corticis
Exotic
Lumbricidae
Megascolecidae
Earthworm
Functional group Anecic
Anecic
Endemic
Spede/amily
Plutellus sikkimensis Acanthodrillidae
Plutellus sp.
Perionyx nanus P. jorpokriensis P. excavatus Perionyx sp. Scolioscolides bergitheili Eutyphoeus lippus
Megascolecidae
" Ochtochaetidae
Functional group
·Epigeic
" Endo-eipgeic
Fig. 1.4. Exotic versus endemic and functional classification of earthworm species in Tamafok an_d Madimulkharka forest and agroecosystems of Tinjure-Milke region, east Nepal

3.3.2 Species diversity in agroecosystems
Between agroecosystems, MM showed higher species richness,
compared to TF, thus showing a reverse situation form that found within the
forests. Earthworm density was also relatively higher in MM except for
Allobophora parva (Savigny) of Lumbricidae and Perionyx nanus.
Amynthas corticis was confined to MM alone, but in larger number ( see the
contrast with the forest).
3.3.4 Seasonal variation
Population of all the species occurring in both the forests peaked (P
< 0.01) in monsoon compared to summer and winter except for Amynthas
corticis, which occurred in summer only (Fig 1.5). Unlike in the forest, two
species, Perionyx jorpokriensis and Plutellus sikkimensis peaked during the
monsoon within agroecosystems of both the villages (Fig 1.6 c,d). Perionyx
nanus, P. excavatus (Perrier) generally peaked in summer (Fig 1.6 a, b).
In the forest, Plute/lus sp. and Eutyphoeus /ippus were absent during
winter and summer respectively. Plutellus sikkimensis was absent in
summer and Plutellus sp. in summer and winter as well, in agroecosystems
Allobophora paNa, Amynthas corticis, Plultellus sp. were completely
absent in winter season. Perionyx nanus, P. excavatus, P. jorpokriensis
and Plutellus sikkimensis although present in winter their numbers were
relatively low. Allobophora parva, Amynthas corticis were found in summer
only (Fig 1.6 f, g).
44

a.
40 :
""e 30 J
ci 20 I
z 10
0 Summer
c.
151 ~ 10 E
0 5 -z 0[
St.mra'
Perionyx nanus
Monsoon
Season
Fmcnyx sp.
I rvtnscx:n
Season
E 1soo E 1000
~ 500 .5
b. --------~
I
60 50
-----1 !li!JTF II "' 40
~~~~ E 30 0
i z 20
I 10 0
Winter
.~ d.
40l
~ 1:
~j ci fvTII1 z -Wintff
Seasonal raifall
&. 0 +--"""--~-Summer ll/lclnsoon Winter
Season
·---- -----~---
Perionyx jorpokriensis
Summer Monsoon Winter
Season
Plutellus sp.
• L Summer 1\A:Jnsoon Winter
Season
II§ Rainfall mm J
Fig. 1.5 Seasonal population of earthworm species in Tamafok and Madimulkharka forests
i I
:!jTF II i•Mrv11

e.
g.
"' E ci z
150 l
'E 100 1 ci z
50 ~
0 '
Plutellus sikkimesnis
f.
Scoliscolides bergitheili
150 l
"'E 100! _._
0 soJ • z a LGEEI..... -. - --·-
Surrrrer fvlonsoon Winter Summer Monsoon
Season
Winter
30 l
:~ l Summer
Season
Eutyphoeus lippus
I Monsoon
Season
e 1soo E 1000
~ 500 c
!i!ii! Winter
h.
~ "' E
M ci z
Seasonal raifall
~ 0 +----__._""----,--Summer fvlonsoon Winter
Season
Amynthas corticis
1.5 l
o.! j 0, I
Surrrrer
I
I I
I@! Rainfall m:Till L----~~~
I i
fvlonsoon
Season
'--------------------~-__j
Winter
Fig. 1.5 Seasonal population of earthworm species in Tamafok and Madimulkharka forests
~ MM

a. b.
Perionyx nanus Perionyx excavatus
6()_ ~ 40~
~ 2~ ~-~~---~~----80
N 60 E 40 ci 20 z 0 _ _.___ --- ~- -=-
c.
~
E ci z
Summer Mons001 Winter
Season
Perionyx jorpokriensis
25 20 ~ 15 J 10 J
~ l -Summer
J Monsoon
Season
1200 'E 1ooo . E 800 - 600 I ~ 400 ~ 200
-Winter
I I I
I•JTF ,I I•MMI
d.
Seasonal raifall
OL·~"""'=a~~-
Summer Monsoon
Season
~ 10 E 0 z
Winter
Summer Monsoon
Season
Winter
Pfutellus sikkirrensis
SllTTTrff l'v1onsoa1 Winter
Season
Ia RainfaD mm J I
Fig. 1.6. Seasonal population of earthworm species in Tamafok and Madimulkharka agroecosystems onal population variation of earthworm species 1n Tamafok and Madimulkharka agroecosystems

g.
Amynthas corticis
30
~ :L j ___ ~ Summer Monsoon Winter
Season
IEJTF
l•MM[' '----'
"' E 0 z
Allobophora parva
20 c
IJTF-: i
0 .MM 1 ,
Summer Monsoon Winter
Seasson
' -------~
"' 4 l E 0
~ j z
Plutellus sp.
I Summer Monsoon
Season
1200 e 1000 .§. 800
600 i 400
[;;;] M
Winter
Seasonal raifall
~ 20g ~-""'"""""'"'--~-Summer Monsoon
Season
\a Rainfal rm1 )
Winter
I ~------------------------~
Fig. 1.6. Seasonal population of earthworm species in Tamafok and Madimulkharka agroecosystems anal population variation of earthworm species in Tamafok and Madimulkharka ag roecosystems

3.4 Meeting livelihood needs
3.4.1 From the forests and village ecosystem
An account of the forest products extracted from the community
forest is given in Table 15. Extraction of fuelwood, fodder, bedding material
and animal feed was higher for village TF as compared to village MM.
However, reverse was true for timber and medicinal plant extraction.
Preferred species for fuelwood were Goldfussia penstemo-noides and
Rhododendron arboreum. Quercus semecarpifolia, Q. glauca and Lyonia
ovalifolia were the important timber species. Average yearly fuelwood use
per family was approximately 5,000 kg, with somewhat average higher
value for village TF. Annual fuelwood consumption pattern was as follows:
Cooking (70%), Animal feed preparation (10%), House warming (9%),
Local wine/beer preparation (8%), and Social gathering I festivals (3%).
Though fodder extraction from the forest was much higher in TF than in
MM, the latter village supplements this resource from agroforestry trees
that they maintained. Therefore, the average collection per year per family
was about 10,000 kg for both the villages.
Livestock is an important economic activity (Table 1.14). Swine
husbandry being more in village TF than in MM, swine feed from the
herbaceous plant from the forest floor Arisaema tortusoum (Wall) Schott
was higher in TF. Apart from timber, minor forest products are food from
the wild, medicinal plants and fibre. Collection of medicinal plants was
significantly higher (P < 0.05) in village MM than TF. Fibre plants Giardinia
45

Table 1.13. Use of forest product per family year -I in the study area. Category Tamafok Madimulkharka
Fuelwood (kg) Fodder (kg) Timber (m~) Bedding material (kg) Medicinal plants (kg) Wild edibles (kg) Animal feed (kg) Fibres (kg)
(n=14) (n=36)
5250 4760 10720 6480 (3724) 4 4.5 4120 3140(930) 2.5 10.5 1.0 1.0 770 381 2.35 1.7
Values in parentheses indicate the resources obtained from agroforestry
Table 1.14. Livestock population by type and grazing pattern Village Cattle Buffalo Sheep/Goat
S.F. Gz S.F. Gz Tamafok (n =59) 42 200 25 88 Per household 4.1 2.0 (average) Madimulkharka 202 427 66 171 (n = 159) Per household 4.0 1.4 (average)
Note: S.F., Stall fed; Gz., Grazing
S.F. 42 3.0
207
5.9
Gz 138
735
Poultry
Captive Open 59 .269 5
154 617
4.3
Swine
13 1
26
0.7

Table 1.15. Major medicinal herbs of economic importance for domestic consumption and food supplement, collected from the forest
Species Local name Locality (mas!) Use Parts used
Abrus precatorius Lalgedi 2500-3000 Sore throat Fruit Acarus calamus Bojho 1400-4600 Cough, scabies Root Ageratum conyzoides Bakhre ghas 1800-3000 Cuts, wound Tender leaves,
stem Artemesia indica Gandhe jhar 2500-3000 Gastroenteritis, Root, leaves
appetizer Bergenia cilia/a Pashanbed 2500-3000 Muscle pain. sprain, Root
hemorrhage Cannabis sativa Bhang 1800-3000 Livestock diarrhea Leaf, fruit Coccinia grandis Golkakri 1500-4600 Pneumonia, throat Roots & fruit
sore Duabanga grandiflora Lam pate jhar 1500-3000 Cut and wounds Stem and leaves Giardinea diversifolia Allo 1500-4600 Sprain, haemorrage Roots lndigofera pulchetta Roxb. Seto phusre 2500-3000 Appetizer, poison Roots
!ahara Kampferia rotunda Bhuichampa 2500-3500 Sprain, hemorrhage Roots Lagerstroemia reginae Asareful 1800-3000 Indigestion in cattle Root extract Roxb. Lycopodium Sunthangne 1800-3000 Medicine, cosmetic Vine, flower Peracarpa camosa Kalimunte 2500-4700 Cut & wounds Stem & leaves Pleione praecox Lasunpate 2000-3000 Indigestion in sheep, Root
goat Phytolacca acinosa Roxb. Jaringo 2500-3000 Diarrhea, indigestion Root extract Picorhiza sp. White gential 2600-3000 Boils, cut, cold & Flower
cough Rheum australe Padamchal 2600-3000 Tea, medicine on Roots
body pain, sprain, hemorrhage, cut and wounds
Rorippa nasturtium- Seemsag 1500-4700 Tuberculosis Stem & leaves · acquaticum (L.) Rumex crispus L. Halhale sag 2500-3000 Jaundice Root extract Rubus ellipticus Thorny 1800-2600 Gastroenteritis Fruit
raspberry Sonchus wighitianus DC Mulapate 2500-3000 Gastroenteritis, Root and leaf
appetizer Stephania glandulifera Rato gujargano 2500-3000 Cut, wounds Roots Misk Swertia chirayta Chiraito 1500-3000 Antipyretic, blood Stem and root
pressure Trichhosanthes wallichiana lndreni 1500-3000 Cattle cholera, FMD Root extract Viscum album Hadchur 2500-3000 Sprain, bone fracture Stem & leaf Xanthium strumarium L. Bhedekuro 2200-2700 Dysentery, Roots
wormicide,diarrhoea Miscellaneous (n = 10) Chingfing 1500-4700 Analgesic , nausea, Root, stem,
diarrhea, boil, sores, leaves and fruit gastroenteritis, joints inflammation , cuts, wounds, quasiworker, marasmus, pneumonia and snake bite

Table 1.16. Mean annual income in Nepalese Rupees± S.E. per household from animal husbandry and other land use activities
Category Animal husbandry Other land uses
Tamafok (n = 14) Madimulkharka (n = 36)
937.5 ± 375 4492 ± 1766 362.5 ± 65.5 1283 ± 687
Table 1.17. Households category(%) on the basis of food availability to the local population
a. Local production only Category
Destitute level Tolerable range Satisfactory level Satisfactory level
b. Total including import Destitute level Tolerable range Satisfactory level
Tamafok (n = 14)
12.5 25.0 62.5
0 25 75
Madimulkharka (n = 36)
18.8 25.0 56.2
18.8 6.2 75
Note: Destitute level: < 125 kg person year 1; Tolerable range 125-250 kg
- 1 - 1 s . f: 1 1 250 k - 1 - 1 person year ; atls actory eve : > g person year .
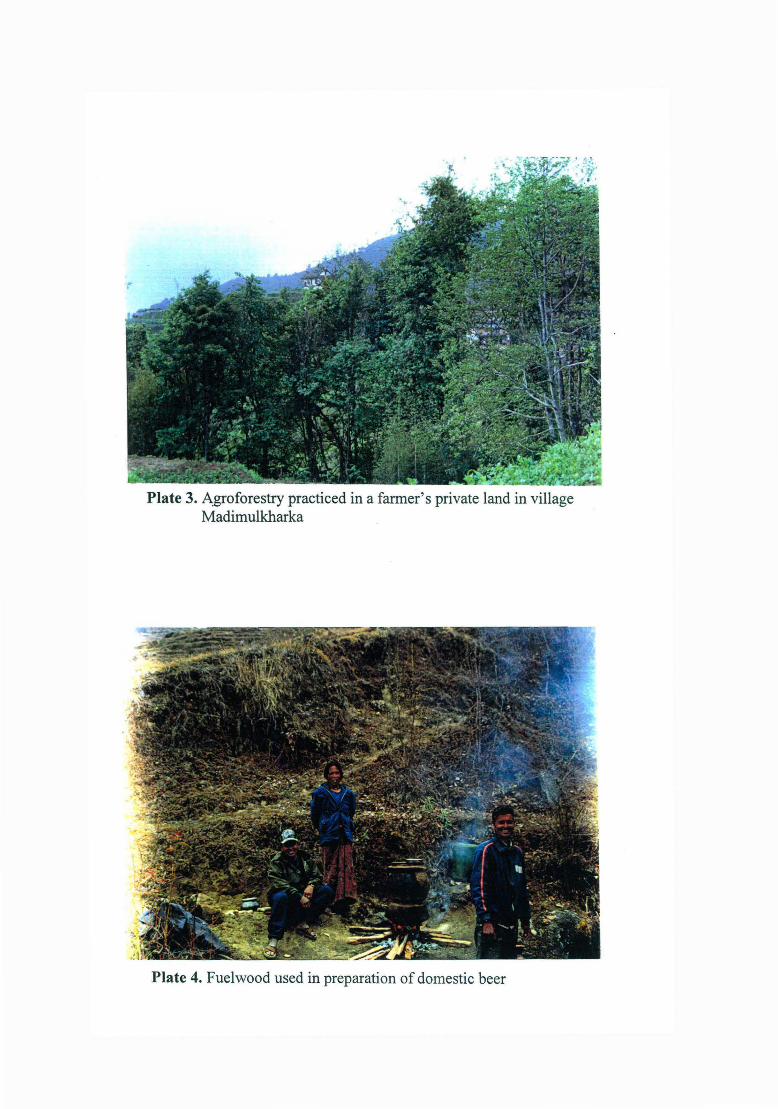
Plate 3. Agroforestry practiced in a farmer's private land in village Madimulkharka
Plate 4. Fuelwood used in preparation of domestic beer

diversifo/ia (Allo) and Daphne sp. (Lokta) collected were not significantly
different in both the villages.
Annual income from the sale of livestock and its products, as well as
that comes out of other land use systems were significantly higher (P <
0.01) in village MM compared to village TF (Table 1.16).
3.4.2 Food balance situation
Based on local food production alone village TF was better off than
village MM, the latter having lesser number of households in the
'satisfactory' level category (Table 1.17 a). In both the villages a larger
proportion of household belonged to the 'satisfactory' followed by 'tolerable~
level.
If the total including import from outside sources is included, the
situation changed to some extent (Table 1.17 b). Whilst there is an
improvement in the number of households for the village MM under the
'satisfactory' category, the corresponding decline came from the 'tolerable'
range category with no impact on 'destitute' level category.
4. DISCUSSION
4.1 Forests
4.1.1 Foreststructure
The difference in structure and composition of two forests arise out
of differential disturbance regime. Forest MM which is closer to settlement
46

experiences more pressure in the form of fuelwood, fodder needs of local
population as compared to TF. Such difference in resource use accounts
for higher tree density and basal area in TF, which is less disturbed.
Besides the higher density and basal area of Rhododendron arboreum in
TF, may also be due to its social value, as this happens to be symbolic as
the national flower of Nepal. The variation of dominant species amongst
two forests can be attributed more to ecological specificity of the species
rather than the disturbance regime. Quercus semecarpifo/ia that is
dominant in the MM forest may be related to lower altitude where it is
abundant, as also shown for this and other tree species distributed on an
altitudional basis in the eastern Himalaya. On the other hand
Rhododendron arboreum occurs at higher elevations (Shrestha, 1989;
Sundriyal and Sharma, 1996; Chaudhary, 1998). The site shows tree
species richness, a characteristic of eastern Himalaya (Dobremz and
Shakya, 1975; Shrestha, 1989; Sundriyal and Sharma, 1996; Carpenter
and Zomer, 1996).
4.1.2 Forest regeneration
Seedling germination and establishments are related to available
space created through perturbation and adaptation to different light regime
(Ramakrishnan et a/., 1982). Higher tree regeneration in MM may be
accounted as due to larger openings within the forest allowing better
penetration at the ground level in MM, compared to TF. The fact that many
trees through frequent in numbers at the adult stage but not represented in
47

the seedlings is perhaps indicative of their light requirements (Borman and
Likens, 1 979; Sundriyal and Sharma, 1 996).
4.2 Agroecosystems
4.2.1 Landholdings
As prevalent in the region (Shrestha, 1 989; Baskota, 1 990; Jackson,
1 990; Jackson et a/., 1 990; Carpenter and Woomer, 1 996; Dhaka!, 1 999;
Muller-Baker and Kolimair, 2000) maize and potato are the predominant
species in the cropping systems of both the villages with over 40% of the
land under these two crop mixed farming systems. Apart from its value it
also provides crop based by product (maize shoot, potato biomass and
even maize cob) as livestock feed. As part of this landscape management,
and as part of agroforestry practices, species such as Prunus cerastides,
D.Don, Pyracantha crenu/ata, Arundinaria maling contribute towards
stability of the terraces, provide erosion control, and used as fodder for
cattle, apart from the organic residue for the cropping system itself. As part
of a land management system as in the general practice in the region
(Shrestha, 1 989; Rajbhandary, 1991, Amatya, 1 999) each farmer keeps
aside a part of land for thatch grass (lmperata cylindrica), which is used for
house construction and even as fodder.
With relatively higher population and livestock pressure over the
limited land available per household, and lesser biomass from the
degraded forest that could be recycled into agriculture, energy input in the
4R

form of farmyard manure is relatively higher in village MM compared to
village TF. Higher input of FYM in MM is facilitated through higher cattle
population that constitutes the major component of the economy here. This
is not surprising since maintaining a larger cattle population is a
compensatory mechanism for the poor returns from agriculture on the
degraded lands (Mahat eta/., 1987; Muller-Boker and Kolmair, 2000). It is
also to be noted that smaller the holding of land in village MM, more the
input of farmyard manure per unit area, since the cattle holding remains
relatively stable.
4.2.2 Agroecosystems structure and function
With lesser land area per household to manage, and the consequent
better ability to manage his land through energy subsidies and proper
weeding practices village MM was able to obtain higher economic yield per
unit area, than village TF. In contrast, larger the holding of land, higher was
the economic return per unit area in TF. This could be explained as due to
better ability of the farmer with larger land area to mobilize resource in the
form of farmyard manure.
Unlike other mountain agroecosystems of the Nepal hill (Mahat et
a/., 1987; Thapa and Weber, 1990), and elsewhere in the central
Himalayan region, India (Semwal and Maikhuri, 1996; Singh eta/., 1997),
the emphasis on the farmyard manure as an input was relatively higher
here. It may be noted that generally speaking Nepali farmers are more
49

dependent upon the animal husbandry compared to other mountain
communities (Sharma eta/., 1996; Kushwaha and Ochi, 1999).
Unlike many traditional agroecosystems in Indian Himalaya
(Maikhuri, 1996; Semwal and Maikhuri, 1996) and other regions (Tsegaye,
1997; Guo, 1999) which had higher energy value for crop by-products
(green biomass) compared with the energy values for economic yield, in
the present system, by and large reverse was the case. However, the
larger holdings in village TF showed the reverse situation.
Energy efficiency of the agroecosystems between TF and MM
showed difference. Resource rich farmers in village TF had better efficiency
in the larger holdings compared to those in the resource poor MM.
However, the reverse situation where medium and small holdings which
showed the high efficiency values in MM than TF could be accounted as
due to better weed management practices and quantities of manure input.
The higher efficiency of agroecosystem in village MM may also be due to
large number of cattle that are stall fed, and with more efficient agroforestry
practices (agroforestry is not practiced in TF). It may be noted here that
anecic and epi-anecic earthworms, which are considered as ecosystem
engineers (Lavelle, 1992; Fragoso et al., 1997), which are exclusive to
agroecosystems alone, but absent in the forest. These species such as
Amynthas corticis and Allobophora parva are more in systems of MM than
in TF, and the species A. corticis is restricted to village MM alone ( cf.
Chapter 1.3.4 also)
50

The energy efficiency compared to more traditional slash and burn
agriculture systems such as those found in north-east India (Maikhuri and
Ramakrishnan, 1990, 1991; Maikhuri, 1996), the energy efficiency in the
agroecosystem here is lower. However, considering sedentary
agroecosystems in central (Singh and Singh, 1992; Semwal and Maikhuri,
1996; Semwal eta/., 2001) and western Indian Himalayan (Singh eta/.,
1997) regions, Nepalese systems considered here are better organized
with higher energy efficiencies. Economic efficiencies also remained higher
compared to those studies and that of Sikkim Himalaya (Sharma et a/.,
2000) as well.
4.3 Earthworm dynamics
4.3.1 Species diversity
The present comparative study between natural and human
managed ecosystems suggest that species diversity of earthworms in
these eastern Himalayan systems are comparable to the richness reported
by other studies from this part of the Himalaya (Julka, 1988, 2001).
However, the species richness in the study is much higher than that
reported in shifting agriculture/fallow systems, from north-east India
(Bhaduria and Ramakrishnan, 1989, 1991 ). Species richness in natural
ecosystem was much higher compared with human managed systems
(Bhaduria et a/., 1997, 2001). There are many reports that suggest the
reduction in species richness under perturbations (Edwards and Lofty,
1982). There, it is reasonable to expect lesser species diversity under
51

agriculture than in the adjoining natural ecosystems as noticed in this
study. It is in this context, that the higher species richness and relatively
higher density of earthworm species in the relatively undisturbed forest of
TF, compared to the poorer earthworm population found in the more
disturbed and open forest areas at MM needs to be viewed. In the latter
situation both lower litter fall and lesser soil moisture retention could be
implicated (Bhaduria and Ramakrishnan, 1989, 1991 ). Fragoso et at.,
(1997) also observed earthworm abundance and distribution as being
determined by quantity, quality and timing of the leaf litter inputs into the
soil system in his studies on the Mexican and Peruvian rain forests, and
African Savanahs.
4.3.2 Seasonal variation
Seasonal increase in earthworm population with the forest and
agroecosystems during monsoon period, except for the species Amynthas
corticis, could be attributed to more favourable soil and moisture conditions,
as also observed from other parts of the Himalaya and north-eastern Hills
in India (Bhaduria and Ramakrishnan, 1991; Bhaduria et at., 2000) and
other regions elsewhere, too (Edwards, 1983; Fragoso and Lavelle, 1995;
Fragoso et. at., 1997; Valle et. at., 1997). Besides soil moisture condition,
improved microbil activity, has also been implicated for increased
population activity during the monsoon (Fragoso and Lavelle, 1992). Tiwari
and Mishra (1995) suggest that the monsoonal increase of earthworm
population could be through an increased moisture level facilitating worm
52

movement and thereby accelerating growth and reproduction, and/or by
reducing mortality arising as a direct result from desiccation.
In general, paucity of earthworm during the dry season could be
attributed to decreased moisture availability in the soil (Bhaduria and
Ramakrishnan, 1989, 1991; Fragoso and Lavelle, 1995), and shortage of
food (Tiwari and Mishra, 1995; Bhaduria et. a/., 1997; Fragoso et. a/.,
1997).
Occurrence of Amynthas corticis and Alfobophora parva only in
summer may confer an advantage on these exotic species for avoiding
competition with natives that dominate during the monsoon. The summer
peaking shown by A. corticis is in contrast to winter peaking observed for
this species from north-east India (Bhaduria and Ramakrishnan, 1991) and
that from central Himalayan Indian region (Bhaduria et. a/., 2000). With an
optimum soil temperature 12 °C required for this species, for optimal
growth and reproduction, which is found to be common to all the study sites
discussed above, the difference observed in the seasonalities could be
explained.
Unlike a broad ecological amplitude in terms of seasonality for
Plutelfus sikkimensis and Sco/ioscolides bergitheili, these occurring
throughout the year could possibly be due to a wider range of physiological
adaptability to temperature, for these two species. These two species
where they occur form dominant species within that system and are
53

reported only from the eastern Himalayan region of Darjeeling and Sikkim
(Julka, 1988).
4.3.3 Endemic versus exotic species
Whilst natural forest ecosystems were generally dominated by
I
endemics and with no exotics, the human managed agroecosystems had
some exotic species Amynthas corticis and Allobophora parva.
Perturbation of ecosystem has been suggested generally to favour
biological invasion (Ramakrishnan, 1991), as also found by many workers
for earthworm species (Fragoso, 1993; Fragoso et a/., 1995; and Fragoso
and Rojas, 1994). In fact, working with shifting agriculture in the north-east
India, Bhaduria and Ramakrishnan (1991) have shown an increase in
exotic species after slash and burn operation. However, Bhaduria et al.,
(2000) reports that biological invasion could occur in relatively undisturbed
pine forests of central Himalaya, suggesting that there could be exceptional
situation.
4.3.4 Functional guild
Earthworms are classified into functional groups, epigeic, endogeic
and anecic depending upon their foraging niche. Epigeics, which forage the
surface layers of the soil, dominate the present study sites and this could
be related to the thin mountain soil cover that characterizes the region.
With more organic input going into the agroecosystem plots in MM
through agroforestry that they alone practice and more animal dung
54

recycling, there is a tendency for spec1es like Perionyx nan us, P.
jorpokriensis and Plutellus sikkimensis to be more dominant in village MM
than in TF, due to increase in organic residue and soil fertility in the surface
layers of the soil in MM, a conclusion similar that observed by Fragoso et
a!., ( 1997). Anecic and epi-anecic exotic species Amynthas corticis and
Allobophora parva observed in agroecosystem alone and that too during
the pre-monsoon period could be attributed to their ability to tolerate water
stress by migration to lower soil layers.
4.4 Meeting livelihood needs
4.4.1 From forests and village ecosystems
Similar to other mountain environments of the Himalayan region
(Pandey and Singh, 1984; Singh eta!., 1984; Mahat eta!., 1986; Blakie,
1988; lves, 1988; Carpenter and Zomer, 1996; Bohle and Adhikari, 1988)
and mountains elsewhere in the developing Africa (Tsegye, 1999; Becker,
1999) fuelwood is extracted from the forest as one of the important energy
source used by the local people. Half of the energy needs are met from
biomass by-product from the traditional agroforestry systems (maize stalk,
fodder twigs, worn out fence poles and others). Average per family per
year fuelwood consumption in the present study was found higher
compared to another study in the same District (Bajracharya, 1983), mid
hills of central Nepal (Mahat eta/., 1987), mid-hills of western Nepal (Fox,
1983), but similar to that for some communities of the Sikkim Himalayan
region (Sundriyal and Sharma, 1996). The higher fuelwood energy
55

consumption in this study could be partly for heating at a higher altitude
and partly for meeting tourists needs, with absence of alternate source of
energy.
Timber and fodder for animals and bedding materials are also
obtained from the forest, as for many other mountain societies (Ralhan et
a/., 1991; Ramakrishnan, et at., 1992; Sundriyal and Sharma, 1996).
However, Community Forestry User Groups (CFUGs) in the study area,
determine sustainable collection of forest resources through
restrictions/rotations established to avoid pressure on a specific forest area.
Whilst farmers in village TF rely on community forests, for their needs,
those from MM obtain about one third of their requirements from
agroforestry plots as in the case at Upper Pokhara Valley Watershed in
western Nepal, as shown by Thapa and Weber (1990) and Semewal and
Maikhuri (1996) Garhwal Himalaya, but relatively higher than buffer zone
of Makalu barun Conservation Area, Nepal as observed by Carpenter and
Womer (1996) and Garhwal Himalaya as shown by Pandey and Singh
(1984). Timber requirements for house construction and repairs is much
less; therefore extraction is not that frequent as others too, have shown
(Sundriyal and Sharma, 1996).
Though home gardens largely meet domestic needs only, a few
households produce some surplus vegetables for sale, during the tourist
season. People living in the resource poor village MM, arising out of
necessity alone have recently started tea (Camellia sinensis L.Kuntze)
56

cultivation as part of the home garden system and cultivating a medicinal
herb Swertia chiraita (Chirayto) after a light burn on some of the terraces,
for cash income. In this village MM, particular, for supplementary income,
some families also work as labourers or do some small business for cash
income. Other sources of income are through remittances coming from
youngsters migrating to places outside the region.
4.4.2 Food balance situation
Present scenario of local food production is sufficient to support
about 60% of the household in both the villages at a 'satisfactory level' ( cf.
Table 1.17). However, poverty is much higher in village MM since the
production of the land is poorer in the resource-poor village MM, they have
depended upon import through cash income which they are able to
manage through tourism. Whilst food import into village MM benefits the
richer sections (category 'satisfactory level' and 'tolerable range', cf. Table
1.17) only, the destitute level remains higher in village MM compared to TF.
It may be mentioned here that many mountain societies are
becoming more and more dependent upon food import for survival
(Ramakrishnan, 1999; Jodha, 2000).
57

5. CONCLUSION
Mountain societies such as those living in the two villages discussed
here are dependent upon forest for a variety of livelihood needs, as much
as in many societies in the developing world (Eckhojlm. 1982; lves, 1988;
Pitt, 1988; Ramakrishnan, et a/., 1992; Jodha, 2000). An aspect that is
discussed in the close linkage between agriculture and forest ecosystems
with resource flow between the two. Whilst communities living in the
resource rich forested area are able to manage their agriculture through
residue management arising out of forest litter, communities in the forest
poor area depend more upon animal dung to sustain agriculture, further
supplemented through more intensive input, too. In this study, earthworms
are looked upon as indicator species for soil fertility both in the natural and
human managed systems. As expected, under greater perturbation in the
forest (closer to MM), there is a tendency for exotics to take oler. The
tendency of exotics to take over under perturbation is more obvious in the
agroecosystem studies.
A conclusion that emerges is that diversification of the production
system more towards animal husbandry in the village MM is due to (a) the
need for a divrsified economy to compensate for reduced forest resources
here and (b) to adopt to the increased tourist flow into this village area (See
Chapter 3).
58