vii ent participation in the national school … · vii. student participation in the national...
TRANSCRIPT

VII. STUDENT PARTICIPATION IN THE NATIONAL SCHOOL LUNCHAND SCHOOL BREAKFAST PROGRAMS
A student participates in the National School Lunch Program (NSLP) or School Breakfast
Program (SBP) when he or she gets a school meal for which the local School Food Authority receives
federal reimbursement. The decision to eat a school meal, to eat a meal from some other source,
or to eat no meal at all is a complex one, which students and parents share. Personal and family
characteristics and preferences, as well as program features and characteristics of the meal service,
may affect the decision to participate in the NSLP and SBP. In addition, students from families
whose incomes are below certain thresholds are eligible to receive flee or reduced-price meals, and
families also decide whether to apply for this benefit.
The study addressed three sets of questions about participation in the NSLP and SBP:
· What proportion of students get an NSLP lunch, and what proportion obtain lunch fromother sources, including their homes, non-NSLP school lunches, and off-campuslocations? What proportion get an SBP breakfast, and what proportion obtain breakfastfrom other sources? Does having a school breakfast program increase the likelihood thata student will eat breakfast?
· How does participation in the NSLP and SBP differ by income level and by whether thestudent is certified for a free or reduced-price meal?
· What personal characteristics, programmatic factors, t_t-,meal-service characteristics areassociated with higher or lower rates of participation in the NSLP and SBP?
In addition to discussing findings on these questions, this chapter presents information on the
perceptions of parents and students about the NSLP and the reasons why some decided not to
participate in it.
Section A briefly summarizes the findings. Sections B and C present detailed findings on
participation in the NSLP and SBP, respectively.
127
A. SUMMARY OF FINDINGS
1. Participation in the NSLP
Ninety-two percent of students attend schools that participate in the NSLP. On a typical school
day, 56 percent of the students who attend a school with the NSLP select an NSLP lunch.
Participation rates differ markedly by family income and by certification for a flee or reduced-price
meal; nearly 80 percent of students certified for a free meal, more than 70 percent of those certified
for a reduced-price meal, and less than 50 percent of those who pay full price participated on the
school day surveyed. Between 16 percent and 25 percent of those whose family incomes make them
eligible for free or reduced-price meals are not certified. The participation rate of the low-income
children who pay full price is very similar to the participation rate of children whose family incomes
are greater than 185 percent of the poverty level.
The analysis identified several sets of factors affecting the likelihood that a student will select
an NSLP lunch.
· Schools offering lower-fat meals (leas than 32 percent of food energy from fat) tend tohave lower participation rates than do other schools. This finding indicates that effortsto bring the average fat content of school lunches in line with the Dietary Guideline goalmay alter the types of foods offered and preparation to a degree that affects studentparticipation adversely.
· Students who are certified for free or reduced-price meals are more likely than studentswho pay full price to select an NSLP lunch. Moreover, the amount of the full priceaffects participation levels; higher participation rates were observed in schools with lowerfull prices.
· An open-campus policy significantly reduces participation.
· Female students are less likely than male students to participate, and older students areless likely than younger students to do so.
· Students in urban and suburban schools are !ess likely than students in rural schools toparticipate, even after controlling for differences in the availability of alternatives to theNSLP lunch (a ia carte service and an open campus).
· Students in the Southeast, Southwest, and Mountain states are more likely than studentsin the Northeast and West to participate.
128
2. Perceptions About the Program
Parents generally hold favorable impressions of the school lunch program. Most parents believe
that school lunches are convenient, economical, and nutritious, but fewer reported that their children
like the lunches. Both parents and students cited students' dislike of the food as the most common
reason for not getting the school lunch. Very small percentages of students cited admini._trative
features of the program, such as _x_stof the meal or stigma, as reasons for nonparticipation_ Parents'
reasons for not applying for free or reduced-price meals pertained primarily to their perceived
ineligibility. Relatively few parents mentioned administrative requirements as reasons for not
applying. However, about 20 percent of parents whose children were eligible for a flee or reduced-
price meal on the basis of the family's income reported that they preferred to pay full price.
3. Prevnlence of Eating Breakfast
Approximately 88 percent of students eat breakfast on a given school day. The proportion that
eats breakfast is higher among younger students and males than among older students and females.
The availability of the SBP did not affect the likelihood that a student would eat breakfast.
4. Participation in the SBP
Ten percent of all students nationwide ate an SBP breakfast on the day covered by the students'
24-hour dietary recall. Just over one-half attend a school that offers the SBP; the participation rate
among students for whom the SBP is available is 19 percent. The analysis identified several sets of
factors that are associated with higher or lower rates of participation in the SBP.
· Students certified for free and reduced-price meals are more likely to select an SBPbreakfast than are students who are not certified, and who must pay full price. However,the amount of the full price does not appear to be a factor.
· Male students are more likely than female students to participate, and younger studentsare more likely than older students to do so.
· Membership in a low-income family affects the probability of selecting an SBP breakfastindependently from certification for free or reduced-price meals. That is, low-income
129

students who are not certified and, therefore, pay full price are more likely than higher-
income students to participate.
· African American and Hispanic students are more likely than white, non-Hispanicstudents to participate.
· Students in urban and suburban schools are less likely than students in rural schools to
participate, even after differences in the availability of alternatives to the SBP breakfast,such as a la carte service and open-campus policies, are controlled for.
B. PARTICIPATION IN THE NATIONAL SCHOOL LUNCH PROGRAM
1. Sources of Lunch
_Lunch" is defined in the analysis to include all foods that a student ate during the lunch period
at his or her school. Thus, the identification of "lunch" does not depend on a student's identifying
an eating occasion as "lunch." In principle, a student is an NSLP participant if he or she selects a
meal for which the school claims reimbursement under U.S. Department of Agriculture (USDA)
rules. NSLP participants were identified operationally in the analysis as students who reported
obtaining their meals from the school cafeteria and selecting at least three items that were credited
toward satisfying the NSLP meal-pattern requiremenL 1 The meals of students who ate non-NSLP
lunches were classified according to the source that provided the greatest amount of food energy
consumed at lunch.
Nationwide, the NSLP is available to 92 percent of all s_lents. Overall, on a typical school day,
56 percent of students attending schools that offer an NSLP lunch eat the school lunch (Table VII. I).
Thirty-eight percent eat a non-NSLP lunch, and 7 percent do not eat lunch.
Students who get a non-NSLP lunch obtain their meals from a variety of sources. Seven percent
of students obtain a la carte lunch items from the school cafeteria (but choose fewer than three foods
that count toward satisfying the NSLP meal-pattern requirement). Another 2 percent obtain lunch
from a vending machine or school store. Thus, 9 percent obtain lunch in school, but from a source
IA complete discussion of the rationale for this decision and its implications is provided inAppendix B.
130

other than a reimbursable NSLP lunch. Eighteen percent bring lunch from home. Another 1
percent obtain food from a source outside of school, but eat their lunch at school, and 1 percent
receive food from a friend or from some other source. Eight percent of students eat lunch away from
school--4 percent in a restaurant, and 4 percent at home.
Differencea across age and gender groups follow expected patterns. Younger students are more
likely than older students to _at the NSLP lunch, are more likely to eat a meal brought from home,
and are less likely to skip lunch. Students in the oldest age group are more likely than those in the
younger age groups to eat at a restaurant (11 percent to 14 percent, compared with 1 percent to 2
percent of the younger students) and are more likely to eat lunches obtained from vending machines.
The behavior of 15- to 18-year-old female students illustrates the extent to which the NSLP
'competes _ with alternative sources of food both within and outside the schools, and must work to
attract participation. Just over one-third of 15- to 18-year-old girls eat an NSLP lunch. Fifty-three
percent eat a non-NSLP lunch, and 12 percent eat no lunch. Of those eating a non-NSLP lunch,
18 percent obtained their food from a source in school (a la carte, 12 percent, and vending machine
or school store, 6 percent); 12 percent purchased food outsi_ of school (restaurant, 11 percent, and
store, 1 percent); 19 percent ate food from home (12 percent brought food, and 7 percent ate at
home); and the rest obtained food from a friend or some other source.
2. NSLP Participation, by Income and Meal-Pri_ Eligibility Status
A student is eligible to receive free school meals if his or her family income is 130 percent or
Ices of the poverty level and is eligible to receive reduced-price meals if family income is between 130
and 185 percent of the poverty level. To receive these benefits, the student's parent must submit an
application, and the student must be certified by school officials.
Table VII.2 shows the distribution of students attending schools offering NSLP meals, by family
income and by meal-price certification status. Twenty-seven percent of students are certified for a
free meal, 5 percent are certified for a reduced-price meal, and 66 percent pay full price; the
132
*I
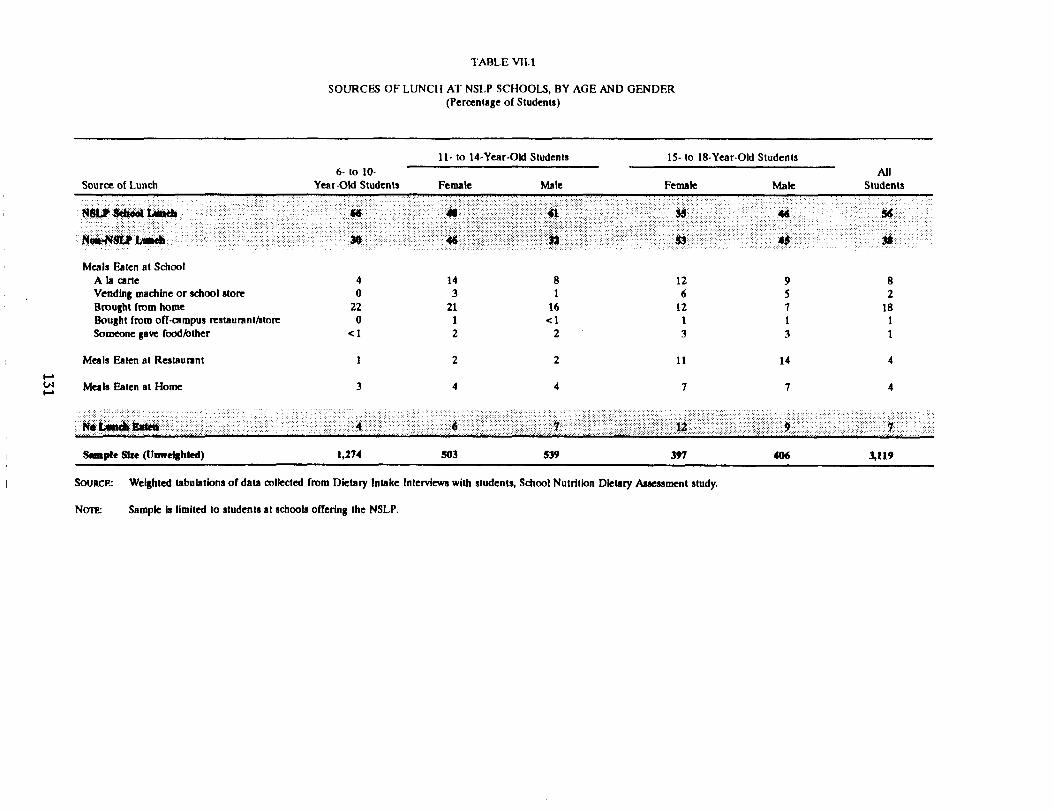
TABLE VII.I
SOURCES OF LUNCH AT NSLP SCHOOLS, BY AGE AND GENDER
(Percentage of Students)
11- to 14-Year-Old Students 15- to 18-Year-Old Students
6- to 10- All
Source of Lunch Year-Old Students Female Male Female Male Students
: '_ i iiiiiiii!ii!i ii::_i!i!ii;ii'::_ii?i_i:i:! iili!!_:_ii::: L_i::Meals Eaten at School
A tn (:nile 4 14 8 12 9 8
Vending machine or school store 0 3 I 6 5 2
Brought f_0m home 22 21 16 12 7 18
Bought fn_m off-campus restaurant/store 0 1 < 1 1 1 1Someone gave food/other < 1 2 2 3 3 1
Meals Eaten at Restaurant I 2 2 11 14 4
_=_c.n Meals Eaten st Home 3 4 4 7 7 4i..a
s_!_?U?ai:_i iiiii!iiiiiiiiiiiiii!:ii!_iliiiiiiii!iiii!! iiiiiiilli:'_iiiiiiiiiiiiiiiliiiiiliii!iiSample Site (Unwelllhled) 1,274 503 539 397 406 3,119
SOURCE: Weighted tabulations of data cx)lleeted from Dietary Intake Interviews with students, School Nutrition Dietary Assessment study.
NOTE: Sample is limited to students st schools offering the NSLP.
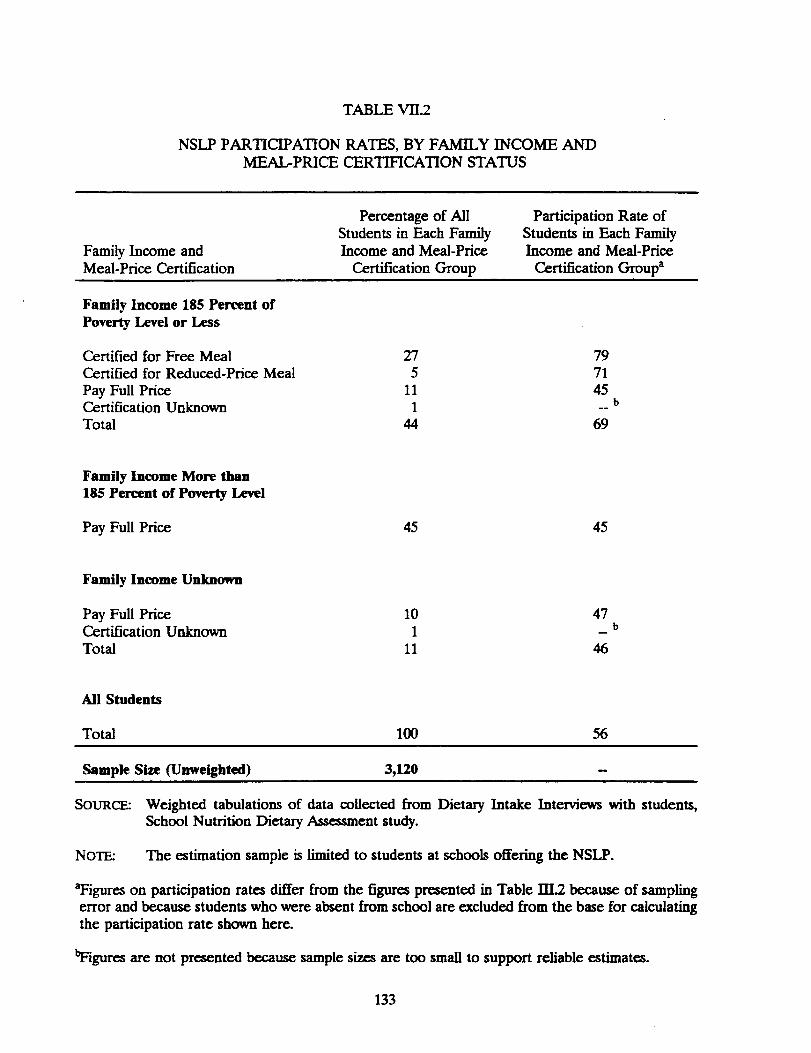
TABLE VII.2
NSLP PARTICIPATION RATES, BY FAMILY INCOME ANDMEAL-PRICE CERTIFICATION STATUS
Percentage of All Participation Rate ofStudents in Each Family Students in Each Family
Family Income and Income and Meal-Price Income and Meal-PriceMeal-Price Certification Certification Group Certification Group a
Family Income 185 Percent ofPoverty Level or Less
Certified for Free Meal 27 79Certified for Reduced-Price Meal 5 71
PayFullPrice 11 45bCertificationUnknown 1 --Total 44 69
Family Income More than185 Percent of Poverty Level
PayFullPrice 45 45
Family Income Unknown
Pay Full Price 10 47bCertificationUnknown 1 -
Total 11 46
Al! Students
Total 100 56
Sample Size (Unweighted) 3,120 -
SOURCE: Weighted tabulations of data collected from Dietary Intake Interviews with students,School Nutrition Dietary Assessment study.
NOTE: The estimation sample is limited to students at schools offering the NSLP.
aFigures on participation rates differ from the figures presented in Table III.2 because of samplingerror and because students who were absent from school are excluded from the base for calculatingthe participation rate shown here.
bFigures are not presented because sample sizes are too small to supportreliable estimates.
133
certification status of 2 percent was unknown, because data were mi_ing. 2 Family-income data
collected for the study indicate that 44 percent of families of students attending schools that
participate in the NSLP have incomes at or below 185 percent of the poverty level, and that 45
percent have incomes above the poverty level; the incomes of 11 percent of families were not known,
due to survey nonresponse. Family incomes are likely to have been understated in the survey. 3
Available data indicate that between 16 percent and 25 percent of students who appear to be
eligible on the basis of their family income are not certified to receive free or reduced-price meals.
The survey data indicate that an estimated 11 percent of students are not certified but are members
of families whose incomes are leas than 185 percent of the poverty level, whereas 44 percent of
students are from families with incomes in this range. Thus, it appears that as many as 25 percent
of students who are eligible for flee or reduced-price meals are not certified to receive such meals.
This figure is most likely an upper bound on the percentage of students who are elign'ble on the basis
of family income but are not certified for free or reduced price meals. Food and Nutrition Service
administrative data indicate that approximately 16 percent of eligible students are not certified.
According to these administrative estimates, 44 percent of students are from families that are eligible,
and 37 percent are certified for free or reduced-price meals. Thus, according to these data,
2Estimates based on administrative data indicate that 31 percent of students are certified for freemeals, and 6 percent are certified for reduced-price meals. The discrepancy between the study dataand the administrative data has not been resolved.
Zinc.omc data were collected by means of a mail survey, with telephone fonow-up, for studentsin grades 3 through 12, and by means of in-person interviews with the parents of students in grades1 and 2. The parents were asked to identify the range in which their current income fell. Relativeto data collection that requests detailed information on various sources of income, this type of simpleglobal estimate is likely to underestimate total income. Thus, the study data might possibly overstatethe proportion of the population whose income is less than 185 percent of the poverty level. Direct
comparisons of poverty rates in the School Nutrition Dietary Assessment study sample and in the1990 census confirm that the study sample understates family income and overstates the proportionof students who are from iow-income families. Approximately 22 percent of students in the study
sample are from families with incomes at or below poverty, according to the School Nutrition DietaryAssessment study data; I7 percent of children between the ages of 5 and 17 years are in families withincomes at or below poverty, according to the 1990 census.
134

84 percent of eligible students are certified (37/44 = .84), and 16 percent of eligible students are not
certified.
Participation rates in the NSLP are considerably higher among students who are certified for free
or reduced-price meals than among those who are not certified (Table VII.2). On a typical school
day, 79 percent of students certified for a free meal and 71 percent of students certified for a
reduced-price meal participate in the NSLP. In comparison, only 45 percent of students who pay full
price participate on a typical school day.
These data indicate that 11 percent of students who are eligible for free or reduced-price meals
obtain the meal, but pay the full price? This figure is most likely an upper bound on the true
percentage, given the tendency of survey respondents to under-report income. 5 However, data
presented in Table VII.7 and discussed in subsection B.4 provide corroborating evidence that a
substantial percentage of families whose incomes make them eligible to participate do not receive free
or reduced-price school meals. Forty-five percent of parents classified as income eligible on the basis
of their response to the survey and reporting that they had not applied for free or reduced-price
meals cited a factor other than income as the reason for not applying. Twenty percent reported that
they were willing and able to pay full price, and 10 percent cited administrative reasons. 6
3. Factors Affecting Participation in the NSLP
A number of factors may influence participation rates in the NSLP, including the price of the
meal, the student's meal-price status, whether offer versus serve (OVS) is used, the range of
4One-fourth of eligible students are not certified to receive free or reduced-price meals; of these,45 percent selected an NSLP lunch.
SAlthough the School Nutrition Dietary Assessment study Household Questionnaire replicated
the income questions on the certification application for free/reduced-price lunches, some parentsmay have reported lower incomes on the questionnaire (or incomes lower than what they would havereported on the application form).
6The other 15 percent either reported that their children preferred other lunch options or gaveanother reason.
135
alternative sources of lunch, the characteristics of NSLP meals, characteristics of the school's meal
service, the students' personal characteristics and characteristics of his or her family, and the location
of the community. Statistical techniques were used to estimate the effect of various factors on
participation, while controlling for the influence of other factors. (A full description of the
procedures used to estimate these effects is presented in Appendix B.)
Table VII.3 summarizes the results of this analysis. The table displays predicted NSLP
participation rates under alternative assumptions about student and meal characteristics. Each row
of the table displays a "base _ and an "alternative" assumption about a given meal or student
characteristic, the predicted participation rates under each base and alternative assumption, and the
difference between the predicted ratea. The difference indicates the effect on the participation rate
of the change from the "base _ characteristic to the "alternative" characteristic. Columns 1 and 3 in
the first set of rows under "Key Programmatic Variables _ indicate, for example, that 48 percent of
students who are not certified for a free or reduced-price lunch, and who must pay a full lunch price
of $1.20, are predicted to participate, when other factors are controlled for. Columnx 2 and 4
indicate that, if the same group of students were to pay a full lunch price of $0.80, their predicted
participation rate would be 52 percent. Thus, while holding all other factors constant, a reduction
of $0.40 in the full price of a lunch would increase participation by 4 percentage points. This
estimated effect of full price on program participation is relatively small: a 50 percent reduction in
price (from $1.20 to $0.80) is associated with only an 8 percent increase in the participation rate
(from 48 percent to 52 percent). However, the effect is statistically siotmificant.
Table VII.3 presents several important findings. Certification for free or reduced-price lunches
increases NSLP participation. Thus, the predicted participation rate of students who pay full price
is 48 percent, whereas the predicted participation rates of students who are certified for free and
reduced-price meals are 69 percent and 75 percent, respectively; both differences from the predicted
136
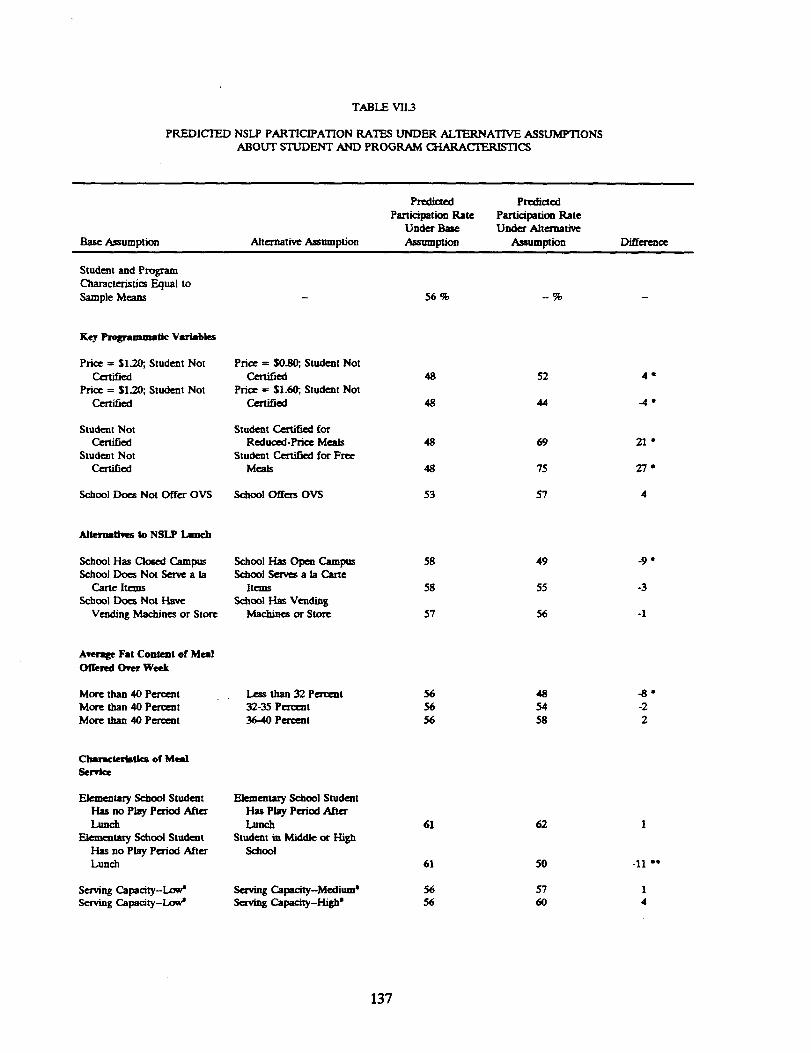
TABLE VII.3
PREDICTED NSLP PARTICIPATION RATES UNDER ALTERI_ATIVE ASSUMF_ONSABOUT STUDENT AND PROGRAM CHARACTERISTICS
Predicted Predicted
Participation Rate Participation RateUnder Brae Under Aizemative
Base Assumption Alternative Assumption Assumption Assumption Difference
Student and ProgramCharacteristics Equal toSample Me_n._ - 56 % - % -
Key Programmatic Variables
Price = $1220;,Student Not Price -- $0.80;, Student NotCer_ Certified 48 52 4 *
Price = $1.20; Student Not Price = $1.60;, Student NotCertified Certified 48 44 -4 ·
Student Not Student Certified forCertified Reduced-Price Meals 48 69 21 *
Student Not Student Certified for Fn_eCen_ed Meals 48 75 27 '
School Does Not Offer OVS School Offers OVS 53 57 4
AItemativts to NSLP Lm_
School Has Cloud Campus School Has Open Campus 58 49 -9 ·School Does Not Serve a la School Serves a la Carte
Carte Items Items 58 55 -3School Doer, Not Have School _ Veuding
Vending Machines or Store ]_ehin_ or Store 57 56 -1
Average Fat Content of MealOffered Over Week
More than 40 Percent Less than 32 Pert_t 56 48 -8 *More than 40 Percent 32-35 Pertznt 56 54 -2More than 40 Percent 36-40 Percent 56 58 2
ClmmOet_llca of MeadSetvke
Elementary School Student Elementary School StudentHas no Play Period After Has Play Period A/tm'Lunch Lunch 61 62 1
_tat 3, School Student Student in Middle or HighHas no Play Period After SchoolLunch 61 50 -11 '"*
Serving Capacity-Low' Serving Capacity-Medium' 56 57 1Serving Capacity-Low' Serving Capacity-High' 56 6O 4
137

TABLE VII3 (¢_.d)
Predicted Pr_lic_ed
Participation Rate Participation RateUnder Base Undex Alternative
Base Assumption Alternative Assumption Assumption Assumption Diffe,_ace
PelPl_ll_! nDd _samllyCharacteristics
Age-6-10 Years Age-Il-14 Year,s 57 % 58 % 1
Age-6-10 Year's Age-15-18 Years 57 53 -4Male Female 60 52 -8 "*
White African American 56 60 4
White Hispanic 56 58 2White Other Race _ 56 66 10 *
Family Income too High to Family Income Low Enough
Qualify for Free or to Qualify for Free orReduced-Price Meals Reduced-Pric_ Meals 56 56 <1
Mother Not in Household Mother in Household 56 56 <1
Mother Not Employed Mother Employed 57 56 -1
Family Size-l-2 Family Size-3-4 56 56 -1
Family Size-l-2 Family Size-5-7 56 57 1
Family Size-l-2 Family Size-More than 7 56 60 4
Loeallon and Region
Rural Urban 64 52 -12 *Rural Suburban 64 55 -9 *
New England Mid-Atlantic 51 50 -1
New England Southeast 51 64 13 *New England Midwest 51 53 2
New England Soutlmn:st 51 63 12 *
New England Mountain 51 63 12,0New England West 51 47 -4
SotmcE: Tabulations of data ct>lie(ned f, om Dietary Intake Interviews with students, School Nutrition Dietary Assessment study.
NOT_ The estimation sample is limited to students at schools offering the NSLP. Probit analysis was used to estimate the model.
Predicted participation rntm ave calculated by (1) computing for each student the predicted probability of NSLP participationunder the base assumption and under the alternative assumption, and (2) averaging these predicted probabilities aoro_ students.
Table entries show the effect of changing from the "base assumption" W thc _l_-_five assumption"while holding constant all
of the other characteristics that might vary across the two groups. Because the predi_n__0_participation controls for variation in
other characteristics, a group's predi__,__ participation rate may differ from its actual participation rate.
'The inde=cof serving capacity is the number of cash registers per minute of lunch per student in the school. A high value ret]ecas a greatercapacity to serve students and shorter average time waiting in line.
bincludes persons identified as Asians, Native Americans, or Pacific Islanders, or for whom information on ]-ace was misusing.
OVS = offer versus ser_.
· /t, indicates the diffc, c4ace is statistically si_ificnnt at the 95/99 peaxamt confidence level with a two-tailed tesL
138
full-price participation rate are statistically significant.7 The use of OVS does not have a significant
effect on participation.
The set of options available as alternatives to an NSLP lunch strongly influences the likelihood
of participation. In particular, permitting students to leave school in order to eat lunch at a
commercial establishment reduces the participation rate by 9 percentage points (from 58 percent to
49 percent). Neither the availability of a la carte items in the school cafeteria nor the availability of
vending machines affects the participation rate significantly.
The average fat content of the meals offered in the school is related to the rate of participation
in the NSLP. In particular, predicted participation rates are substantially lower in schools serving
meals that provide an average of less than 32 percent of food energy from fat than in schools serving
higher-fat lunches. The predicted participation rate is 48 percent in schools serving lunches that
provide, over one week, an average of less than 32 percent of energy from fat; the predicted rate is
54 percent at schools in which fat provides 32 percent to 35 percent of food energy, 58 percent in
schools in which fat provides an average of 36 percent to 40 percent of food energy, and 56 percent
in schools in which fat provides an average of more than 40 percent of food energy. The difference
in predicted participation rates across the fat-level groups is statistically significant only for the lowest-
fat group. That is, there is essentially no difference in participation rates among the groups in which
school lunches provide more than 32 percent of food energy from fat.
These findings have two important implications with respect to efforts to meet the Dietary
Guideline goal for the percentage of calories from fat in NSLP lunches. First, the analysis in Chapter
V showed that several different modifications in menu planning, food purchasing, and food
preparation were required in order to bring the average fat content close to the Dietary Guideline
goal. The relationship between participation rates and the average percentage of food energy from
fat in NSLP lunches suggests that taking all or most of the several steps necessary to bring total fat
7These estimates differ slightly from the estimates shown in Table VII.2 because of the effectsof controlling for other influences on participation rates.
139
content in line with the Dietary Guideline goal may affect the acceptability of the lunches adversely.
Participation is significantly lower in schools that have taken these dietary measures than in otherwise
similar schools offering meals in which the percentage of food energy fxom fat is higher than 32
percent.
Second, despite the adverse consequences of offering very-low-fat meals, it may be possible to
reduce the average fat content of lunches to well below the nationwide average of 38 percent of food
energy without adversely affecting participation in the NSLP. Participation rates are similar in schools
whose lunches provide a moderate percentage of food energy from fat (32 percent to 35 percent) and
in those whose meals provide a high or very-high percentage of food energy from fat. This fmding
suggests that taking some of the steps necessary to meet the Dietary Guideline goal will not affect
participation, but that taking all of the steps might do so.
In light of the policy importance of this finding, considerable analysis was conducted to determine
whether the finding is sensitive to specific decisions made in conducting the analysis presented in
Table VII.3. These sensitivity analyses are described in Appendix B. The basic fmding-that a
negative relationship exists between the participation rate and whether the average percentage of
food energy from fat is less than 32 percent-persists even when the sample and model specification
are changed. The results of these sensitivity tests suggest the negative relationship exists and is not
the result of chance or of the particular model specification chosen.
Offering a play period after lunch does not affect the participation of elementary school students
below the seventh grade. The availability in the cafeteria of a greater number of cash registers per
student, which reduces the average waiting time, has a small, but not statistically significant, effect on
participation.
Gender and age/grade are the only personal characteristics associated with participation in the
NSLP. Male students are more likely than female students to participate (60 percent predicted
participation rate, versus 52 percent, respectively). Although age itself is not significantly related to
140
participation, the predicted participation rate among students in grades 7 and higher is 11 percentage
points lower than the predicted participation rate among students in grades 6 and lower. Students
belonging to a racial group other than white, African American, or Hispanic are more likely than
members of those groups to participate. Finally, after controlling for the effects of other factors,
income level, family size, whether the student resides with his or her mother, and the mother's
employment status are not significantly associated with participation in the NSLP.
Predicted participation rates differ considerably by location and region of the country. Students
in urban and suburban schools are less likely than students in rural schools to select an NSLP lunch
(52 percent and 55 percent, respectively, compared with 64 percent of rural students). Predicted
participation rates are lower in the West (47 percent), Mid-Atlantic states (50 percent), New England
(51 percent), and Midwest (53 percent) than in the Southwest (63 percent), Mountain states (63
percent), and Southeast (64 percent).
4. Parents' and Students' Perceptions About the NSLP
The study asked parents and students to give their perceptions about the NSLP. Nonparticipants
were asked why they did not participate in the program.
a. Opinions About the Program and Reasons for Not Getting the School Lunch
Parents generally have favorable impressions of the NSLP. Nearly all parents feel that school
lunches are convenient, economical, and nutritious, but fewer stated that their children like the
lunches (Table VIL4). Nearly three-fourths "agreed strongly" with the statement, "school lunches are
convenient," and more than one-half"agreed strongly" that "school lunches are economical." Slightly
more than one-third "agreed strongly" with the statement, "the school lunch provides a nutritions
meal," and another 51 percent "agreed somewhat" with this statement. However, only 17 percent
"agreed strongly" with the statement, "children like the school lunch," and only 44 percent "agreed
somewhat" with the statement.
141
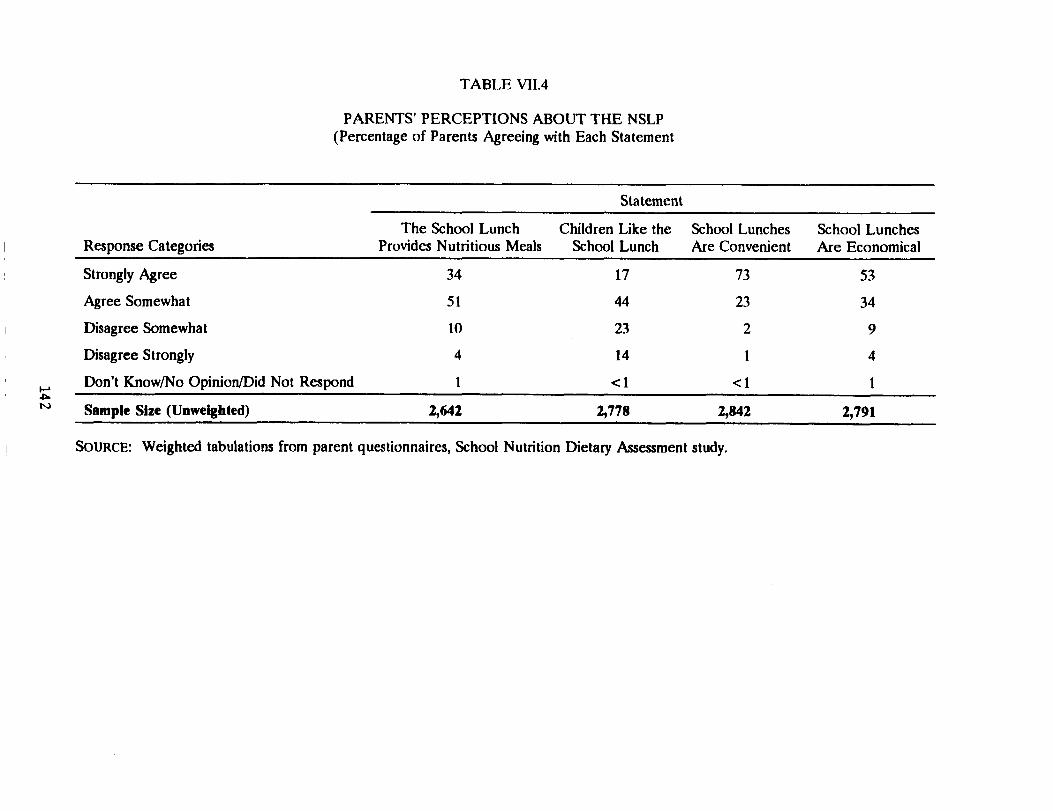
TABLE Vll.4
PARENTS' PERCEPTIONS ABOUT THE NSLP(Percentage of Parents Agreeing with Each Statement
Statement
The School Lunch Children Like the School Lunches School LunchesResponse Categories Provides Nutritious Meals School Lunch Are Convenient Are Economical
Strongly Agree 34 17 73 53
Agree Somewhat 51 44 23 34
Disagree Somewhat 10 23 2 9
Disagree Strongly 4 14 1 4
Don't Know/No Opinion/Did Not Respond 1 < 1 <1 1
Sample Size (Unwelghted) 2_642 2_778 2_g42 2_791i
SOURCE: Weighted tabulations from parent questionnaires, School Nutrition Dietary Assessment study.

Parents were asked about the participation of theft children in the school lunch program.
Parents who reported that their children did not get the school lunch every day were asked why the
children did not do so. Three-fourths of there parents gave dislike of the food on all days (17
percent) or on some days (47 percent) or their child's preference for meals from home (12 percent)
as the reason (Table VII.5). Five percent gave some other reason related to food needs or
preference: 4 percent stated that the child thought the food was different from the food served at
home, and 1 percent cited some special food need (for example, the child has food allergies or is a
vegetarian). Two percent stated that their child did not like the cafeteria, and 3 percent gave cost
as the reason. The remaining 9 percent of parents stated that the school did not have a lunch
program (4 percent) or gave either some other reason or no reason (5 percent).
Students who reported that they had not eaten the school lunch on the survey day were asked
the reasons why they did not eat it.8 Moat students gave reasons related to their food preferences,
rather than to factors pertaining to the operation of their school's lunch program (Table VII.6).
Forty-two percent stated that they do not like cafeteria food, and 26 percent stated that they ate a
lunch brought from home, ate at home, or went out for lunch. Twelve percent said that they did not
eat lunch or were not hungry. The remaining 20 percent gave a variety of reasons reflecting concerns
about operational features of the program-too expensive (7 percent); did not know about the lunch
program or believed he or she was ineligible (4 percent); had no time, wanted to play, had other
things to do (3 percent); did not like eating in the cafeteria (2 percent); and other (4 percent).
b. Reasons for Not Applying for Free or Reduced-Price Meals
Parents who reported that they did not apply for free or reduced-price meals were asked the
most important reason for not doing so (Table VII.7). Parents whose reported incomes made their
SThe question was asked only of students who had already had their lunch period at the time ofthe interview and who had not eaten the school lunch. Because many students were interviewed inthe morning before lunch, this sample is small.
143

TABLE VIL5
PARENTS' PERCEPTIONS ABOUT WHY TI4F_IR CHILD DOES NOT EATTHE SCHOOL LUNCH EVERY DAY
Percentage CitingCategory as Moat
Response Category Important Reason
My Child Never Likes the l:7ood the School Serves a I7
My Child Does Not Like the Food Served on Certain Days a 47
My Child Does Not Like to Get the School Lunch Became (His/Her)Friends Do Not Get the School Lunch a 5
My Child Prefers to Eat a Lunch Brought from Home a 12
My Child Thinks the Food Is Different from the Food Served at Home a 4
Child Has Food-Related Special Need b'c 1
Child Does Not Like Cafeteria b 2
Co_t b 3
School Does Not Have Lunch Program b 4
Other Reasons or No Reason Given b 5
Sample Size (Unweighted) 1,179
SOURCE: Weighted tabulations from parent questionnaires, School Nutrition Dietary Assessmentstudy.
aResponse category was provided to the respondents.
t'Response category was developed on the basis of an open-ended response given under "otherreason."
Clncludes food allergy, picky eater, vegetarian, not enough to eat
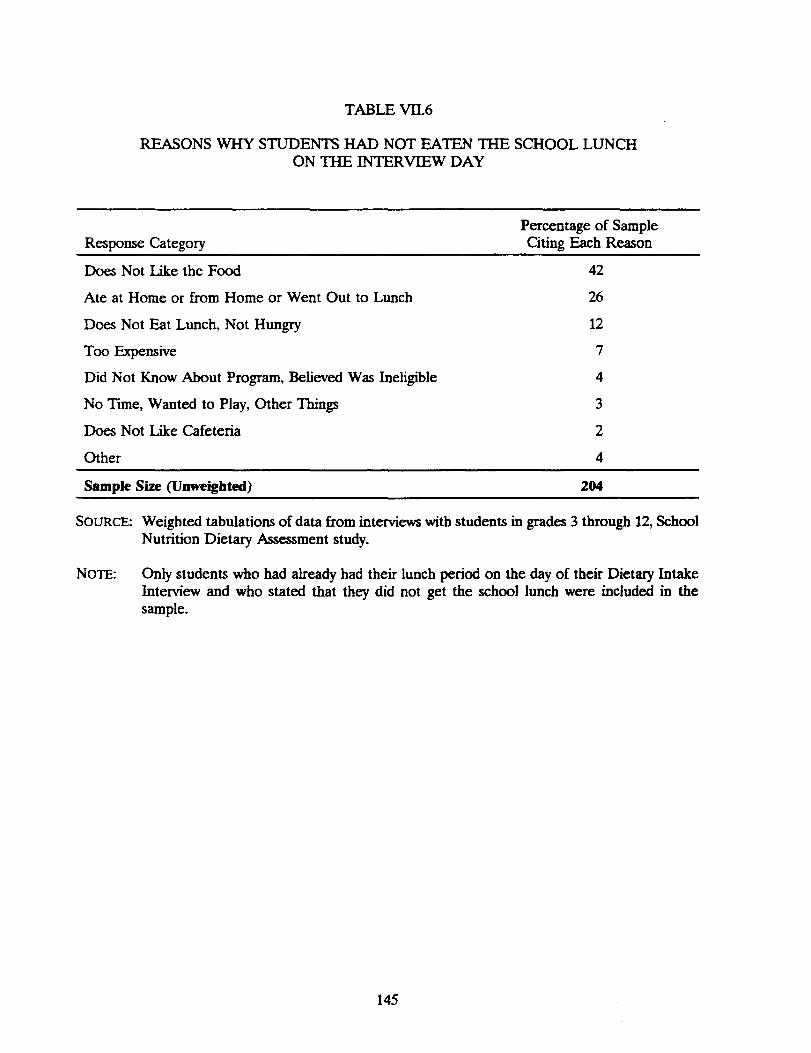
TABLE VIL6
REASONS WHY STUDENTS HAD NOT EATEN THE SCHOOL LUNCHON THE INTERVIEW DAY
Percentage of SampleResponse Category Citing Each Reason
Does Not Like the Food 42
Ate at Homeor from Homeor WentOut to Lunch 26
Does Not Eat Lunch, Not Hungry .12
Too Expensive 7
Did Not Know About Program, Believed Was Ineligible 4
No Time, Wanted to Play, Other Things 3
Does Not Like Cafeteria 2
Other 4
Sample Size (Unweighted) 204
SOURCE: Weighted tabulations of data from interviews with students in grades 3 through 12, SchoolNutrition Dietary Assessment study.
NOTE: Only students who had already had their lunch period on the day of their Dietary IntakeInterview and who stated that they did not get the school lunch were included in thesample.
145
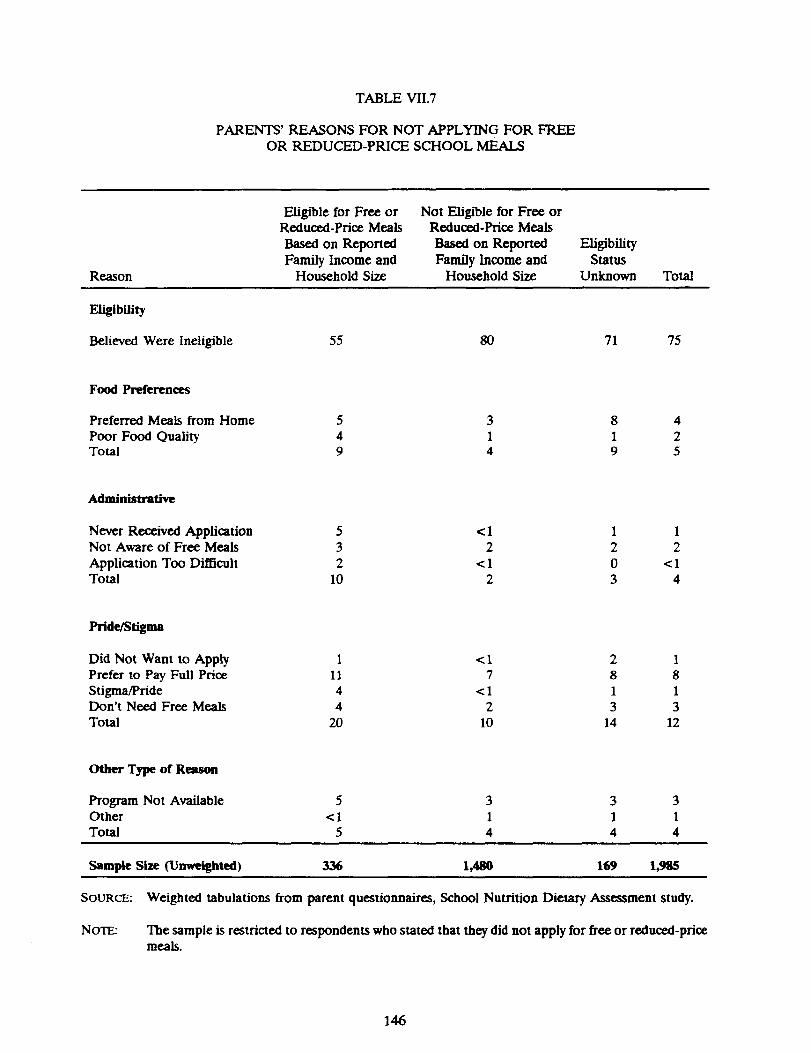
TABLE VII.7
PARENTS' REASONS FOR NOT APPLYING FOR FREI::_
OR REDUCED-PRICE SCHOOL MEALS
Eligible for Free or Not Eligible for Free orReduced-Price Meals Reduced-Price Meals
Based on Reported Based on Reported EligibilityFamily Income and Family Income and Status
Reason Household Size Household Size Unknown Total
FJigibUity
Believed Were Ineligible 55 80 71 75
Food Preferences
Preferred Meals from Home 5 3 8 4
Poor Food Quality 4 1 1 2Total 9 4 9 5
Administrative
Never Received Application 5 < 1 1 1NotAwareofFreeMeals 3 2 2 2
ApplicationTooDifficult 2 <1 0 <1Total 10 2 3 4
Pride/Stigma
Did Not Want to Apply 1 < 1 2 1Prefer to Pay Full Price 11 7 8 8Stigma/Pride 4 < 1 1 1Don't Need Free Meals 4 2 3 3Total 20 10 14 12
Other Type of Reason
Program Not Available 5 3 3 3Other < 1 1 1 1Total 5 4 4 4
Sample Size (Unweighted) 3.36 1,480 169 1,985
SOURCE: Weighted tabulations from parent questionnaires, School Nutrition Dietary Assessment study.
NOTE: The sample is restricted to respondents who stated that they did not apply for free or reduced-pricemeals.
146
children eligible for flee or reduced-price meals comprised about 17 percent of the total sample that
gave reasons for not applying. The responses of this group are especially important to policy makers
(first column in Table VII.7). Fifty-five percent of eligible respondents stated that they were
ineligible or believed themselves ineligible for free or reduced-price meals. 9 Of the remaining
eligible respondents, 9 percent cited food preferences, and 10 percent cited an admini._trative reason
(never received an application, not aware of the program, or application was too difficult). Twenty
percent cited a reason suggesting that pride, concern about stigma, or a simple preference not to
receive a subsidy was their reason for not applying. Finally, about 5 percent stated that the program
was not available or gave some other reason for not applying.
C. PARTICIPATION IN THE SCHOOL BREAKFAST PROGRAM
1. Sources of Breakfast
"Breakfast" was defined in this analysis to include aH foods eaten from the time that a student
awakens in the morning until 45 minutes after the start of school, provided that the total food energy
intake from those foods is at least 50 calories. This minimum ensures that a cup of coffee or tea is
not counted as "breakfast." All foods consumed during this period are counted as breakfast, rather
than only foods at a meal identified by the student as "breakfast," in order to avoid the poss_ility that
students' differing perceptions of what constitutes breakfast could affect the analysis.
SBP participants are defined as students who obtain from the school cafeteria foods that include
at least two items contn'buting toward the SBP meal-pattern requirement, l° The source of meals
VAs noted previously, responses to the income question on the survey of parents appear tounderstate income somewhat. For this group, which appears to be eligible, but whose members statedthat they were not eligible, or that they believed themselves to be ineligible, it is imposs_!e todetermine whether the parents' perceptions or the survey data more accurately estimate eligibility.
l°Students who cat breakfast at OVS schools are not differentiated from those at non-OVS
schools. Although USDA rules indicate that students must select three items that contn'bute towardthe SBP meal-pattern requirement at OVS schools, and four items at non-OVS schools, the availabledata did not allow an accurate application of the rules. For example, situations in which a single item(for example, french toast) contributed only one meal component could not be distinguished from
(continued...)
147
of students who did not obtain an SBP breakfast was classified according to the source providing the
greatest amount of total food energy consumed at breakfast.
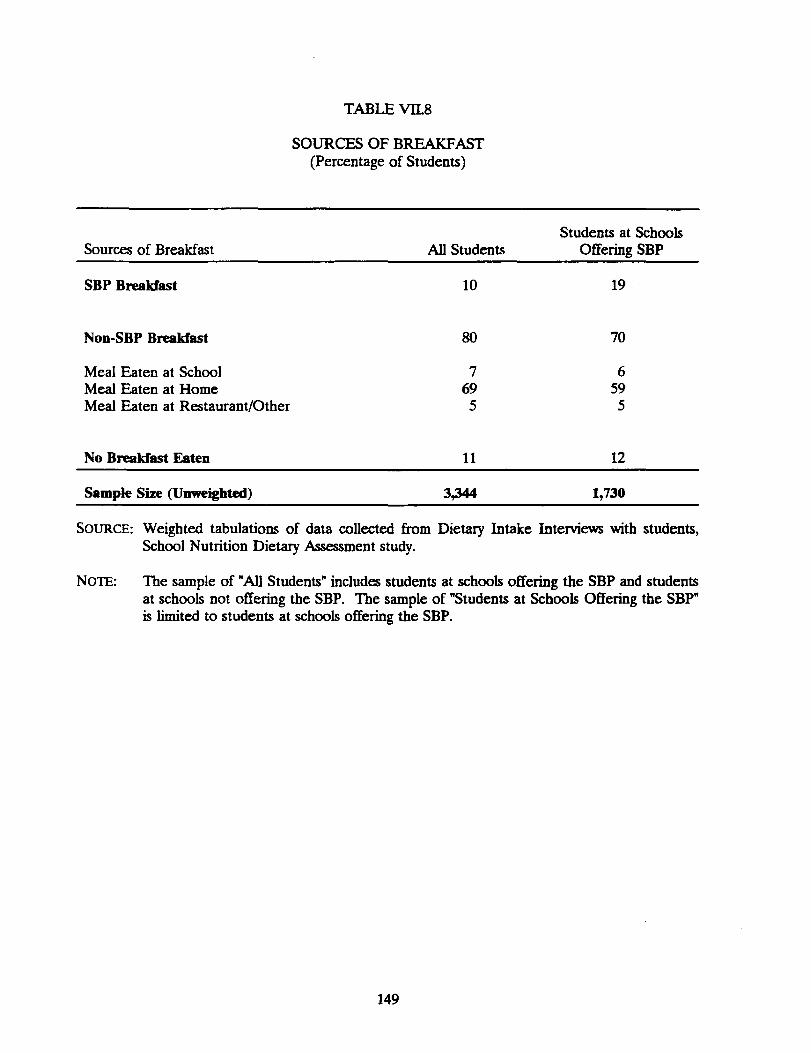
Table VII.8 shows the sources of breakfast of all students nationwide and of students attending
schools that offer an SBP breakfast. Nationwide, 10 percent of students overall select an SBP
breakfast, and 80 percent select a non-SBP breakfast. The majority of non-SBP breakfasts are
breakfasts eaten at home (69 percent). Seven percent are obtained at school, and 5 percent are
eaten at a restaurant or come from some other source. Eleven percent of students do not eat
breakfast. At schools offering the SBP, 19 percent of students eat an SBP breakfast, 70 percent eat
a non-SBP breakfast, and 12 percent eat no breakfast.
2. SBP Participation, by Income and Meal-Price Eligibility Status
Overall, approximately one-half of students nationwide attend schools that participate in the SBP.
Schools participating in the SBP have a higher percentage of students who are eligible for free or
reduced-price meals (family income of 185 percent of the poverty level or less) than do all schools
participating in the NSLP (54 percent versus 44 percent, respectively-see Table VII.9 for the
percentage eligible in SBP schools, and Table VII.2 for the percentage eligible in aH NSLP schools).
In addition, 36 percent of students attending schools offering the SBP are certified to receive free
meals, and 6 percent are certified to receive reduced-price meals (both figures are higher than the
corresponding figures for NSLP schools). Thus, the SBP is more prevalent in schools that serve a
larger proportion of low-income students than the national average. It is also noteworthy that !!
percent of students attending SBP schools are from families whose incomes are less than 185 percent
of the poverty level, but the students are not certified for free or reduced-price meals.
l°(...continued)situations in which, due to the quantity of bre_ad and/or eggs in the recipe, it contributed twocomponents. Nor could the analysis determine when a single bread item actually constituted twoservings of bread.
148
TABL_ VII.8
SOURCES OF BREAKFAST
(Percentage of Students)
Students at Schools
Sources of Breakfast All Students Offering SBP
SBP Breakfast 10 19
Non-SBP Breakfast 80 70
Meal Eaten at School 7 6MealEatenat Home 69 59
Meal Eaten at Restaurant/Other 5 5
No Breakfast Eaten 11 12
Sample Size (Unweighted) 3,344 1,730
SOURCE: Weighted tabulations of data collected from Dietary Intake Interviews with students,School Nutrition Dietary Assessment study.
NOTE: The sample of WAllStudents _ includes students at schools offering the SBP and studentsat schools not offering the SBP. The sample of *Students at Schools Offering the SBP _is limited to students at schools offering the SBP.
149
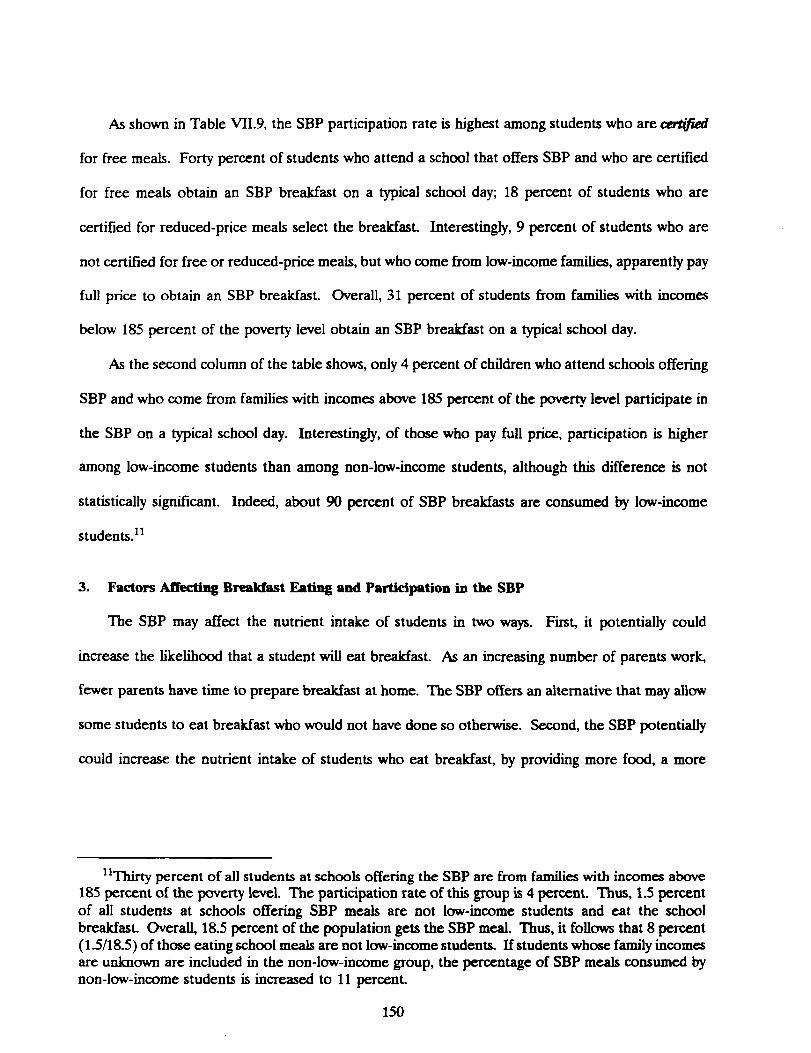
As shown in Table VII.9, the SBP participation rate is highest among students who are cert/f_
for free meals. Forty percent of students who attend a school that offers SBP and who are certified
for free meals obtain an SBP breakfast on a typical school day; 18 percent of students who are
certified for reduced-price meals select the breakfastl Interestingly, 9 percent of students who are
not certified for free or reduced-price meals, but who come from low-income families, apparently pay
full price to obtain an SBP breakfast. Overall, 31 percent of students from families with incomes
below 185 percent of the poverty level obtain an SBP breakfast on a typical school day.
As the second column of the table shows, only 4 percent of children who attend schools offering
SBP and who come from families with incomes above 185 percent of the poverty level participate in
the SBP on a typical school day. Interestingly, of those who pay full price, participation is higher
among low-income students than among non-low-income students, although this difference is not
statistically significant. Indeed, about 90 percent of SBP breakfasts are consumed by low-income
students. _
3. Factors Affecting Breakfast Eati_ and Participation in the SBP
The SBP may affect the nutrient intake of students in two ways. First, it potentially could
increase the likelihood that a student will eat breakfast. As an increasing number of parents work,
fewer parents have time to prepare breakfast at home. The SBP offers an alternative that may allow
some students to eat breakfast who would not have done so otherwise. Second, the SBP potentially
could increase the nutrient intake of students who eat breakfast, by providing more food, a more
llThirty percent of all students at schools offering the SBP are from families with incomes above185 percent of the poverty level. The participation rate of this group is 4 percent. Thus, 1.5 percentof all students at schools offering SBP meals are not low-income students and eat the schoolbreakfast. Overall, 18.5 percent of the population gets the SBP meal. Thus, it follows that 8 percent(1.5/18.5) of those eating school meals are not low-income students. If students whose family incomesare unknown are included in the non-low-income group, the percentage of SBP meals consumed bynon-low-income students is increased to 11 percent.
150
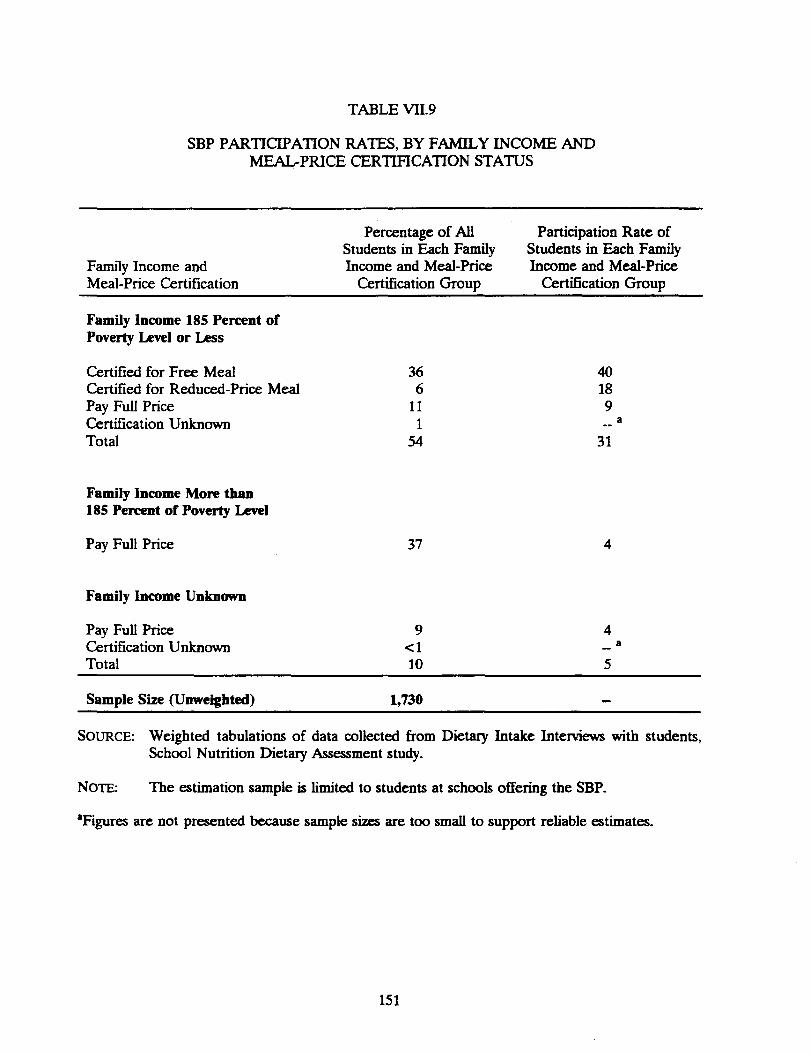
TABLE VII.9
SBP PARTICIPATION RATES, BY FAMILY INCOME ANDMEAI_P_ CERTIFICATION STATUS
Percentage of All Participation Rate ofStudents in Each Family Students in Each Family
Family Income and Income and Meal-Price Income and Meal-PriceMeal-Pr/ce Certification Certification Group Certification Group
Family Income 185 Percent of
Poverty Level or Less
Certified for Free Meal 36 40Certified for Reduced-Price Meal 6 18
Pay Full Pr/ce I I 9Certification Unknown 1 .. aTotal 54 31
Family Income More than185 Percent of Poverty Level
Pay Full Price 37 4
Family Income Unknown
Pay Full Price 9 4CertificationUnknown <1 _ aTotal 10 5
Sample Size (Unweighted) 1,730 -
SOURCE: Weighted tabulations of data collected from Dietary Intake Inter_ews with students,School Nutrition Dietary Aase_ment study.
NOTE: The estimation sample is limited to students at schools offering the SBP.
aFigures are not presented because sample sizes are too small to support reliable estimates.
151

balanced meal, or both. This section analyzes the factors that affect whether students eat breakfast,
and, given that they do so, whether they select an SBP breakfast or a non-SBP breakfast. 12
a. Breakfast Eating
The data indicate that availability of thc SBP does not affect whether a studcnt eats brcakfast.
The predicted percentage of students who eat breakfast is virtually the same regardless of whether
a school offers the SBP (87 percent), even after the potentially confounding effects of the other
characteristics of students at SBP schools, such as income, are taken into account (Table VII. 10).
The finding was confirmed when the sample was restricted to students from low-income households
(tabulations not shown).
The probability of eating breakfast is related to three key student characteristics. F'ust, older
students are less likely than younger students to eat breakfast. After controlling for other
characteristics, 94 percent of 6- to 10oyear-old students are predicted to eat breakfast, compared with
87 percent of 11- to 14-year-old students, and with 77 percent of 15- to 18-year-old students. Second,
female students are less likely than male students to eat breakfast (86 percent versus 89 percent).
Third, low-income students (those who are eligible on the basis of family income for frec or reduced-
price meals) are less likely than non-low-income students to eat breakfast (85 percent versus 88
percent). Location (urban, suburban, rural) and region of the country do not influence the
probability of eating breakfast.
b. Factors Affecting Student Selection of an SBP Breakfast
As shown in Table VII. 11, the main program-related variable that affects whether a student
selects an SBP breakfast is meal-price certification status. Twenty-seven percent of students who are
certified to receive free meals are predicted to participate in the SBP, compared with 11 percent of
12The analytical approach to these two issues is the same as that used to analyze the factorsaffecting participation in the NSLP. Appendix B provides details of this approach.
152
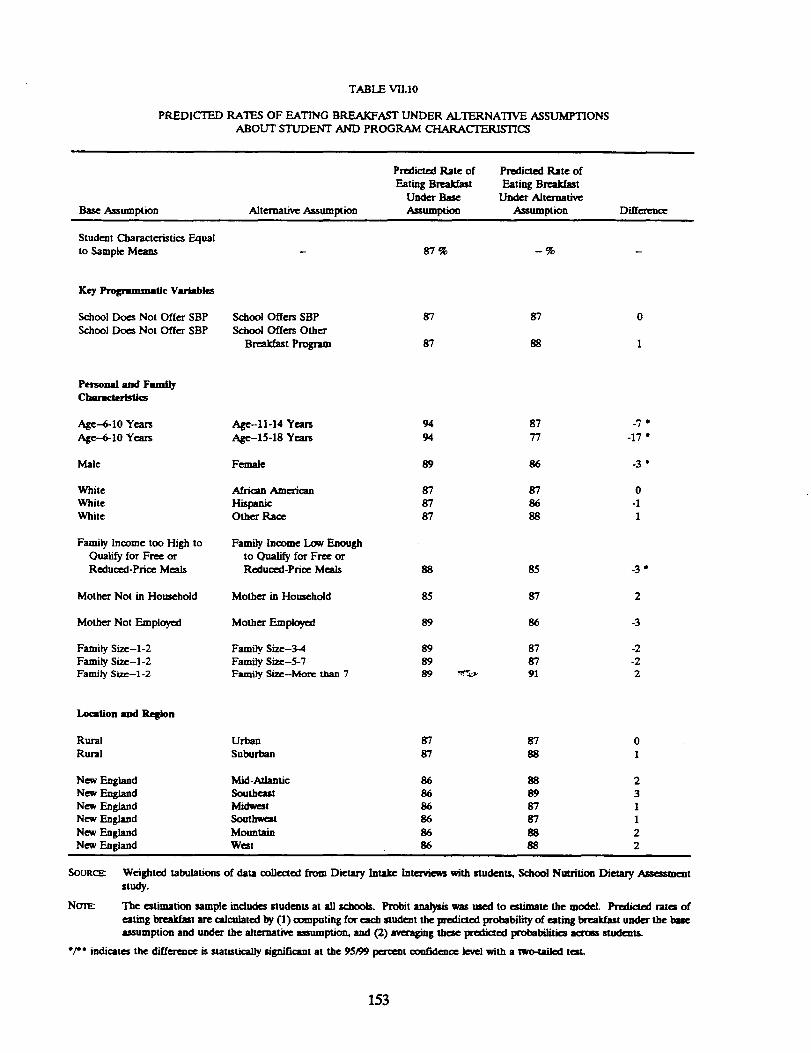
TABLE VII.10
PREDICTED RATES OF EATING BREAKFA.VI' UNDER ALTERNATIVE ASSUMPTIONS
ABOUT STUDENT AND PROGRAM CHARACTERISTICS
Predicted Rate of Predicted Rate of
Eating B_t Eating BreakfastUnder Base Under Alternative
Base Asaumption Alternative Assumption Asaumptiou Assumption Dillereuce
Student Characteristics Equal
to Sample Means - 87 % - % -
Key !_ogrsnunatic Var_bles
School Does Not Offer SBP School Offers SBP 87 87 0
School Does Not Offer SBP School Offers Other
Breakfast Program 87 88 1
Personal and FmnilyCharacteristics
Age--6-10 Years Age-Il-14 Years 94 87 -7 *
Age-6-10 Years Age-15-18 Years 94 77 -17 *
Male Female 89 86 -3 *
White African American 87 87 0
White Hispanic 87 86 -1White Other Race 87 88 1
Family Income too High to Family Income Low EnoughQualify for Free or to Qualify for Free orReduced-Price Meals Reduced-Price Meals 88 85 -3 '
Mother Not in Household Mother in Household 85 87 2
Mother Not Employed Mother Employed 89 86 -3
Family Size-l-2 Family Size-3--4 89 87 -2
Family Size-l-2 Family Size-5-7 89 87 -2Family Size-l-2 Family Size--More than 7 89 _"_ 91 2
Location and Region
Rural Urban 87 87 0
Rural Suburban 87 88 1
New England Mid-Atlantic 86 88 2
New England Southeast 86 89 3
New England Midwest 86 87 1New England Southwest 86 87 1
New EngLand Mountain 86 88 2
New England West 86 88 2
SOURCE: Weighted tabulations of data coUccted from Dietary Intake Interviews with students, School Nutrition Dietary Assessment
study.
NOTE: The estimation sample mciudes students at all schools. Probit analysis was used to esnimate the model. Predicted rates of
eating breakiBt are calculated by (1) oomputing for each student the predicted probability of eating break/asr under the base
assumption and under the alternative assumption, and (2) averaging these predicted probabilities across students.
'/'" indicates the difference is statistically significant at the 95/99 percent confidence level with a two-tailed test.
153
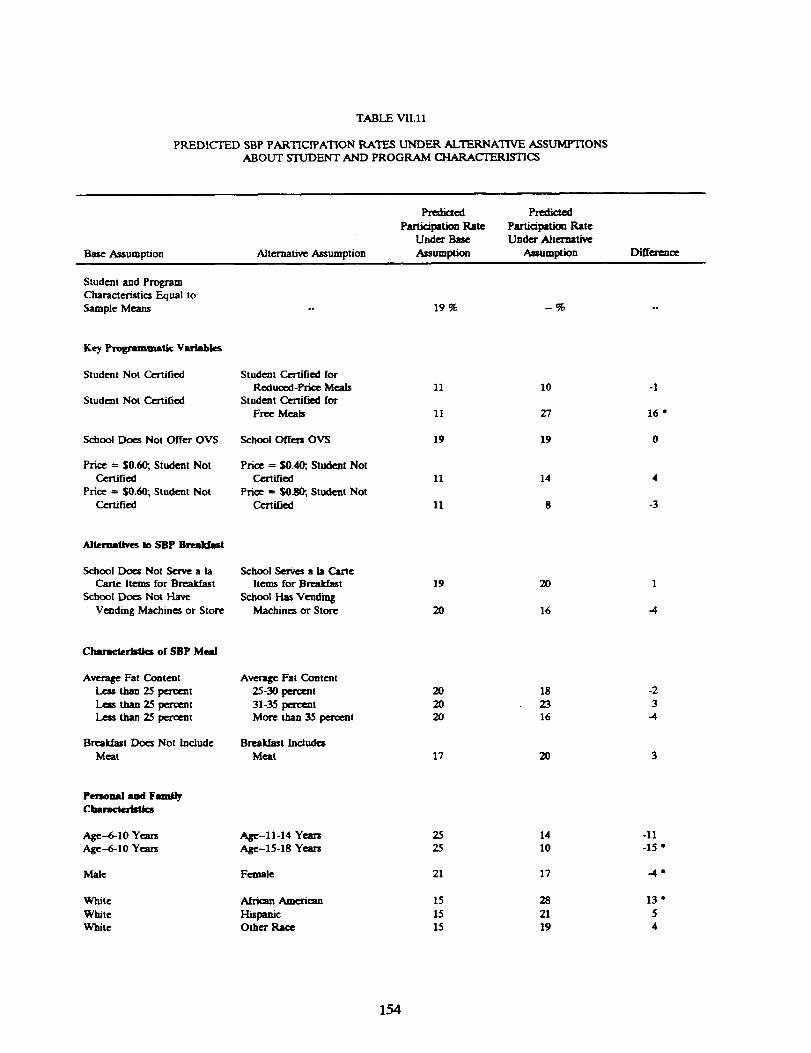
TABLE VII.Il
PREDICTED SBP PARTICIPATION RATES UNDF_.R ALTERNATIVE ASSUMPTIONS
ABOUT STUDENT AND PROGRAM CHARACTERISTICS
Predicted Predicted
Participation Rate Participation RateUnder Base Under AIternat/ve
Base Assumption Alternative Assumption Assumption ,assumption Difference
Student and Program
Characteristics Equal to
Sample Means - 19 % - % -
Key Prognmamatic Vm'inbks
Student Not Certified Student Certifi,.,-! for
Redumd-Prim Meals 11 10 -1
Student Not Certified Student Certif'mfl for
Free Meals 11 27 16 *
School Does Not Offer OVS School Offers OVS 19 19 0
Price = S0.60; Student Not Price -- $0.40;, Student NotCerd fled Certified 11 14 4
Price = $0,60; Student Not Price = $0.80;, Student Not
Certified Certified 11 8 -3
Alternatives to S'BP BrmMnst
School Does Not Serve a la School Serves a ia Carte
Carte Items for Break. fast Items for Breakfast 19 20 1
School Doe_ Not Have School Has VendingVending Machines or Store Machines or Store 20 16 -4
_ristlcs of SBP Meal
Average Fat Content Average Fat Content
Less than 25 percent 25-30 percent 20 18 -2
Less than 25 percent 31-35 percent 20 23 3
Ltms than 25 percent More than 35 percent 20 16 -4
Breakfast Does Not Include Breakfast Includes
Meat Meat 17 20 3
Personal smd FamilyClmr.ctettstl_
Age-6-10 Years Age-Il-14 Years 25 14 -11Age--6-10 Years Age-15-18 Years 25 10 -15 *
Male Female 21 17 --4 *
White African American 15 28 13 *
White Hispanic 15 21 5White Other Race 15 19 4
154
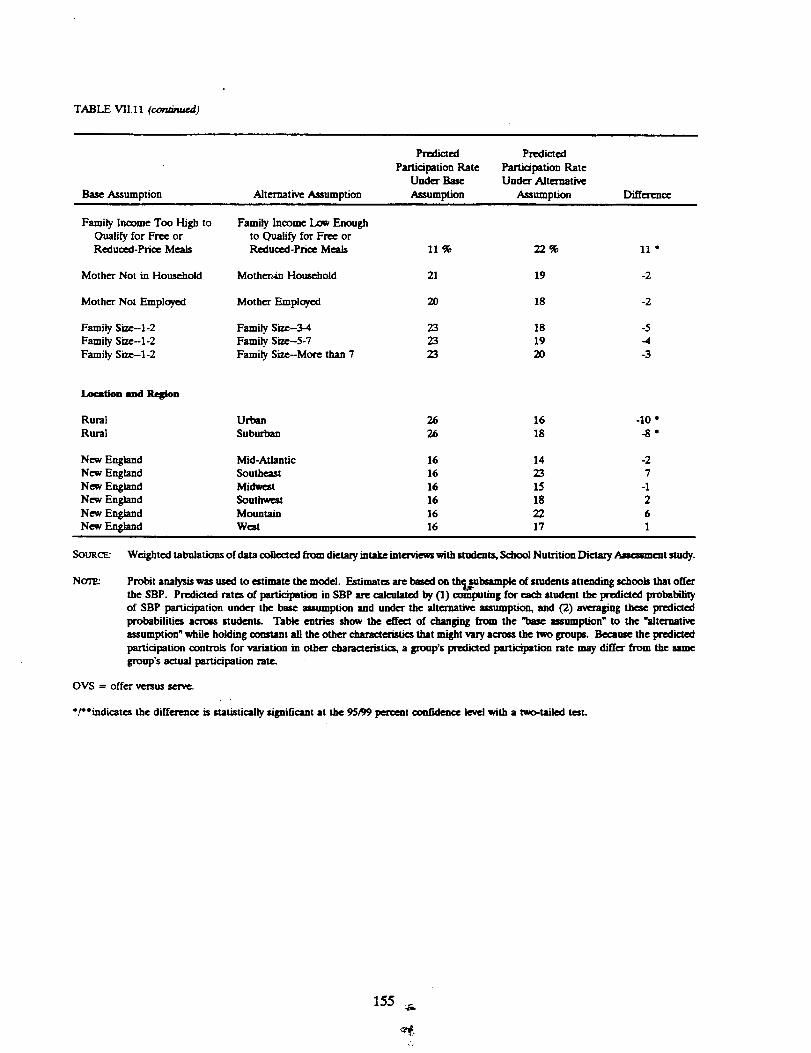
TABLE VII.11 (c_j
Predicted Predicted
Participation Rate Panic/pation RateUnder Base Under Alternative
Base Assumption Alternative Assumption Assumption Assumption Diffo-o_ce
Fam/ly Income Too High to Family Income Low EnoughQualify for Free or to Qualify for Free orReduced-Price Meals Reduced-Price Meals 11% 22 % 11 *
Mother Not in Household Mother,,/n Household 21 19 -2
Mother Not Employed Mother Employed 20 18 -2
Family Size-l-2 F_mily Size-3-4 23 18 -5Family Size-l-2 Famfiy Size-5-7 23 19 -4Family Size-l-2 Family Size-More than 7 23 20 -3
Location and i_n
Rural Urban 26 16 -10 *Rural Suburban 26 18 -8 *
New England Mid-Atlantic 16 14 -2New England Southeast 16 23 7New England Midwest 16 15 -1New England Southwest 16 18 2New England Mountain 16 22 6New England West 16 17 1
SOURCE: Weighted tabulations of data collected from dietary intake interviews with students, School Nutrition Dietary Assessment study.
NOTE: Probit analysis was used to estimate the model. Estimates are based on thed_!_ul_ampleof students attending schools that offerthe SBP. Predicted rates of participation in SBP are calculated by (1) computing for each student the predicted probabilityof SBP participation under the base assumption and under the alternative assumption, and (2) averaging these predictedprobabiliti_ across students. Table entries show the effect of changing from the "base assumption _ to the "alternativeassumption" while holding -_,r_tant all the other characzeristics that might vary across the two groups. Because the predictedparticipation controls for variation in other characleristics, a group's predicied participation rate may differ from the samegroup's aaual participation rate.
OVS = offer versus serve.
· /**indicates the difference is statistically significant at the 95_9 percent confidence level with a two-tailed test.
155
students paying full price. This 16 percentage point difference is statistically significant. However,
certification for reduced-price meals has no effect on the predicted SBP participation rate. For
students who pay full price, the price of breakfast is negatively related to SBP participation, as one
would _xpect; 14 percent of those who pay $0.40 for breakfast are predicted to select an SBP
breakfast, compared with 11 percent of those who pay $0.60, and with 8 percent of those who pay
$0.80?
The availability of alternative sourc_ of breakfast in school, such as a la carte service and
vending machines, does not affect SBP participation.
The meal characteristics examined do not affect SBP participation. Students who are offered
a high-fat breakfast (more than 35 percent of food energy from fat) are somewhat less likely to
participate in the SBP, and those who are offered meat are somewhat more likely to participate;
however, neither of these effects is statistically significant.
Several personal and family characteristics affect SBP participation. As with the probability of
eating breakfast, the probability of SBP participation is higher among younger students than older
students, and higher among male students than female students. Twenty-frye percent of 6- to 10-year-
old students are predicted to select an SBP breakfast, compared with only 10 percent of 15- to 18-
year old students. African American students are substantially more likely than white, non-Hispanicnc.i_
students to eat an SBP breakfast. After income, family status, and location are controlled for, the
predicted SBP participation rate of African American students is a statistically significant 13
percentage points higher than the rate of white, non-Hispanic students.
Students whose family incomes make them eligible for free or reduced-price meals are more
likely than higher-income students to select an SBP breakfast-22 percent, compared with 11 percent
of higher-income students. This finding is surprising, given that certification status is controlled for,
and that certification for a free breakfast itself has a large, positive effect on participation. The
13The effects of price are statistically significant at the 90 percent confidence level, but not at the95 percent confidence level.
156
finding indicates that, even among students who must pay full price for breakfast, students from low-
income families are more likely than those from families with higher incomes to select an SBP
breakfast.
SBP participation does not vary greatly by the region of the country. In contrast to the findings
for the NSLP, regional differences in SBP participation are relatively small and are not statistically
significant. However, participation rates in urban and suburban locations are a statistically significant
8 to 10 percentage points lower than those in rural areas (after the effects of other factors are
controlled for).
157
VIII. DIETARY INTAKES OF NATIONAL SCHOOL LUNCH PROGRAM AN D SCHOOLBREAKFAST PROGRAM PARTICIPANTS
This chapter presents data on the dietary intakes of students who participate in the National
School Lunch Program (NSLP) and School Breakfast Program (SBP). 1 The data answer the
following questions:
· What nutrients are consumed by students who eat NSLP lunches and SBP breakfasts?How do nutrients consumed compare with program targets of one-third of theRecommended Dietary Allowances (RDA) for lunch and one-fourth of the RDA forbreakfast? How do they compare with guidelines derived from recommendations in the
Dietary Guidelines for Americans and recommendations by the National Research Council(NRC)?
° What are average intakes of program participants over 24 hours, and how do 24-hourintakes compare with targets and goals? Do these intakes differ by age and gender orby income groups?
· How much food is wasted at lunch? Does use of offer versus serve (OVS) at schoolsbelow the secondary level affect the nutrient content of the NSLP lunches as consumed?
The next section summarizes the findings on these questions. The sections that follow present details
on the intakes of NSLP and SBP participants, respectively.
A. SUMMARY OF FINDINGS ON NUTRIENT INTAKES
1. Lunch Intakes of NSLP Participants
NSLP participants' mean intakes at lunch of most nutrients are at least one-third of the RDA.
NSLP participants also consume more than the Dietary Guideline goals for fat and saturated fat, and
more than one-third of the NRC's daily recommendation for sodium. Their lunch intake of
cholesterol is just one-third of the NRC's daily recommendation for cholesterol. In general, the
lThe intakes of participants and nonparticipants are compared in the companion report, _'heSchool Nutrition Dietary Assessment Study:. Dietary Intakes of Program Participants andNonparticipants" (Devaney et al. 1993).
159

patterns of NSLP participants' mcan dietary intakes at lunch are similar across age and gender
groups, as well as across income groups.
2. 24-Hour Intakes of NSLP Participants
NSLP participants' mean intakes over 24 hours of food energy, protein, and all vitamins and
minerals are greater than the RI)A. Average 24-hour intakes of fat, saturated fat, and sodium exceed
the Dietary Guideline goals and NRC recommendations, although, proportionately, they are lower
than lunch intakes. As with lunch intakes, 24-hour intakes of NSLP participants follow similar
patterns in all age and gender groups, and in all income groups.
3. Waste and the Effect of OVS on Lunch Intakes
Overall, NSLP participants waste approximately 12 percent of the food energy that they are
served. Waste of individual nutrients ranges from 10 percent to 15 percent. Younger students and
adolescent females waste more food than do older students and adolescent males, respectively.
The use of OVS does not affect the average nutrient content of the NSLP lunch as consumed.
Although students at OVS schools arc less likely than students of similar age at non-OVS schools to
select milk, they also waste lees food. The overall nutrient intakes at lunch of students at OVS and
non-OVS schools do not differ.
4. Breakfast Intakes of SBP Participants
SBP participants' mean intakes at breakfast exceed one-fourth of the RDA for nearly all
nutrients. Their mean percentage of food energy from fat is just slightly higher than the Dietary
Guideline goal. However, their breakfast intake of saturated fat exceeds the Dietary Guideline goal,
and their intakes of cholesterol and sodium exceed one-fourth of the NRC daily recommendation for
these dietary components.
160
5. 24-Hour Intakes of SBP Participants
SBP participants' mean intakes over 24 hours exceed the RDA for nearly all nutrients. The
mean percentages of their food energy from fat and saturated fat over 24 hours exceed the Dietary
Guideline goals, and their mean intakes of cholesterol and sodium exceed NRC recommendations.
B. INTAKES OF NSLP PARTICIPANTS
This section presents data on NSLP participants' intakes at lunch and over 24 hours. Subsection
B.3 describes plate waste and the effects of OVS.
1. Lunch Intakes
As described in Chapter VII, NSLP participants were identified as those students who reported
obtaining foods from their school cafeteria and reported selecting foods that contributed to at least
three of the five required meal-pattern components. NSLP participants may have consumed foods
and beverages during their lunch period that were not part of the NSLP lunch-for example, ice
cream purchased a la carte or soda obtained from a vending machine. NSLP participants' lunch
intakes presented in this section include the nutrients and other dietary components obtained from
all foods and beverages consumed during the lunch period at the student's school; the estimates are
not restricted to items in the NSLP lunch.
NSLP participants' mean intake of all nutrients is at least one-third of the daily RDA. Table
VIII. 1 shows mean intakes of each nutrient, by all NSLP participants, and by each age/gender group.
For all NSLP participants, the mean intakes of food energy, vitamin A, vitamin B6, iron, and zinc are
approximately one-third of the RDA. The mean intake of protein is nearly the total RDA, and the
intake of vitamin B12 is more than 100 percent of the RDA. Participants' mean intakes at lunch of
all other nutrients considered--vitamin C, thiamin, riboflavin, niacin, folate, calcium, phosphorus, and
magnesium-are between 40 percent and 60 percent of the RDA.
161
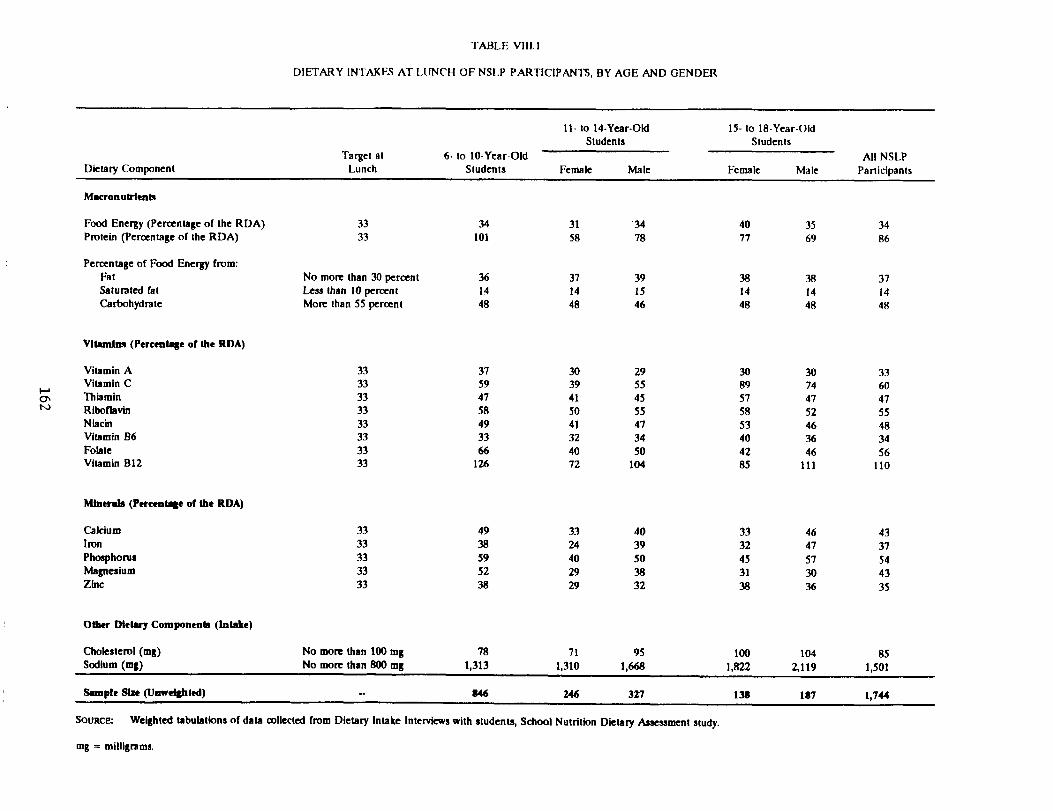
TABLE VILLI
DIETARY INTAKES AT LUNCH OF NSLP PARTICIPANTS, BY AGE AND GENDER
11- to 14-Year-Old 15- to 18-Year-OldStudents Students
Target at 6. to 10-Year-Old All NSLP
Dietary Component Lunch Students Female Male Female Male Participants
Mmcronulrlenls
Food Energy (Percentage of the RDA) 33 34 31 34 40 35 34
Protein (Percentage of the RDA) 33 101 58 78 77 69 86
Percentage of Food Energy from:
Fat No mote than 30 percent 36 37 39 38 38 37
Saturated fat Less than l0 percent 14 14 15 14 14 14
Carbohydrate More than 55 percent 48 48 46 48 48 48
Vltanfins(Percentnlge oft he RDA)
VitaminA 33 37 30 29 30 30 33
Vitamin C 33 59 39 55 89 74 60i..ac_ Thmmin 33 47 41 45 57 47 47
t,,o Riboflavin 33 58 50 55 58 52 55Niacin 33 49 41 47 53 46 48
Vitamin B6 33 33 32 34 40 36 34
Fobte 33 66 40 50 42 46 56
Vitamin BI2 33 126 72 104 85 111 110
Minerals (Percentqe of the RDA)
Calcium 33 49 33 40 33 46 43
Iron 33 38 24 39 32 47 37
Phosphorus 33 59 40 50 45 57 54
Magnesium 33 52 29 38 31 30 43
Zinc 33 38 29 32 38 36 35
Other Dietary Components (Intake)
Cholesterol (rog) No mort than 100 mg 78 71 95 100 104 85
Sodium (rog) No mote than 800 mg 1,313 1,310 1,668 1,822 2,119 1,501
S_nple Size (Unweighted) -- 846 246 327 138 187 1,744
SOURCE: Weighted tabulations of data collected from Dietary Intake Interviews with students, School Nutrition Dietary Assessment study.
mg= milligrams.

Most age and gender groups consume mean energy of approximately one-third of the daily RDA.
Female NSLP participants 11 to 14 years old consume mean energy at lunch of 31 percent of the
RDA. 2 The mean lunch energy intake of 15- to 18-year-old female participants is 40 percent of the
RDA. 3 Mean lunch intakes of protein by all age and gender groups exceed one-half of the RDA.
Some subgroups consume slightly less than one-third of the daily RDA of some vitamins and
minerals. Female participants 11 to 14 years old have low mean intakes of iron (24 percent of the
RDA), magnesium (29 percent), and zinc (29 percent). The mean intake of this age/gender group
is somewhat less than one-third of the RDA for vitamin A (30 percent), and for vitamin 136 (32
percent). In fact, for most nutrients, female NSLP participants 11 to 14 years old have lower intakes
relative to the RDA than do students in other age groups. The pattern of low intakes of adolescent
females relative to their RDA is similar to the patterns observed in other studies of children.
For the other age and gender groups, only the mean intakes of vitamin A and magnesium are
substantially less than one-third of the daily RDA. Indeed, all groups, except children 6- to 10-years
old, have mean intakes of vitamin A of approximately 30 percent. In addition, mean intakes of
magnesium are less than one-third of the RDA for female and male students 15- to 18-years old (31
percent and 30 percent, respectively).
NSLP participants' mean lunch intakes of fat, saturated fat, and sodium exceed the Dietary
Guidelines goals and the NRC recommendations. NSLP lunches provide an average of 37 percent
of food energy from fat, compared with the Dietary Guideline goal of 30 percent or less. Saturated
fat provides an average of 14 percent of the food energy of NSLP lunches, compared with the
Dietary Guideline goal of less than 10 percent. The mean intake of sodium is 1,500 rog, which is 63
percent of the maximum recommended by the NRC, and nearly twice the reference standard for
lunch. The mean percentage of food energy from carbohydrate is 48 percent (the NRC
2'I'he 95 percent confidence interval is 29 percent to 33 percent.
3Becatase the sample for this subgroup was very small, this estimate has a 95 percent confidenceinterval of 30 percent to 50 percent.
163
recommendation is more than 55 percent). The mean cholesterol intake of 85 mg is significantly less
than the reference standard of 100 mg, (The NRC recommends that daily cholesterol intake not
exceed 300 mg.)
NSLP lunches as offered and as consumed are very similar in average fat and sodium content.
Fat provides 38 percent of the energy in lunches as offered, compared with 37 percent in lunches as
consumed. Lunches offered and consumed both provide 1,500 mg of sodium. This finding, which
indicates that students' food choices closely reflect foods offered, was not necessarily expected, given
the wide variety of lunch choices available in most schools.
The patterns of fat and carbohydrate intake by all age and gender groups are very similar,
although adolescents consume a slightly larger percentage of food energy from total fat than do 6-
to 10-year-old students. Because age-specific targets for sodium and cholesterol have not been
developed, these components are expre_ed in their natural units. The intake of sodium and
cholesterol increas_ with age.
The mean lunch intakes of NSLP participants from different income levels are very similar. A
goal of the NSLP is to make a nutritious lunch available to all students, regardless of their ability to
pay. Thus, one would expect the pattern of nutrient intakes to be similar for students at different
income levels (Table VIII.2). One interesting exception, however, is that the percentage of food
energy from fat is lowest for students whose family incomes are below the poverty level (36 percent),
and are highest for students whose family incomes exceed 185 percent of the poverty level (38
percent). This difference across the income groups is statistically significant. All other diffcrences
in mean intakes across the income groups are small and not statistically significant.
2. 24-Hour Intakes
Over 24 hours, NSLP participants' mean intakes of food energy, protein, and all vitamins and
minerals exceed the daily RDA. The mean 24-hour intake of food energy is 115 percent of the RDA
(Table VIII.3). Thus, although NSLP participants consume approximately one-third of the RDA at
164

TABLE VIII.2
DIETARY INTAKES AT LUNCH OF NSLP PARTICIPANTS, BY POVERTY STATUS OF FAMILY
Family Income
Target at Below 100 to 185 Percent of More than 185 Percent All NSLP
Dietary Component Lunch Poverty Level Poverty Level of Poverty Level Participants
MncronutFJents
Food Energy (Percentage of the RDA) 33 33 34 35 34
Protein (Percentage of the RDA) 33 88 88 85 86
Percentage of Food Energy from:
Fat No more than 30 percent 36 37 38 37
Saturated fat Less than 10 percent 14 15 14 14
Carbohydrate More than 55 percent 49 48 47 48
Vltmnirm (Percentage of the RDA)
Vitamin A 33 35 31 34 33
Vitamin C 33 59 62 59 60
Thiamin 33 46 47 47 47
O_ Riboflavin 33 56 55 55 55cn Niacin 33 46 47 49 48
Vitamin B6 33 33 34 35 34
Folate 33 59 55 55 56
Vitamin B12 33 115 113 107 110
b!inerels (Percentage of the RDA)
Calcium 33 45 43 43 43
Iron 33 36 37 38 37
Phosphorus 33 54 54 54 54
Magnesium 33 44 44 42 43
Zinc 33 35 37 35 35
Other Dietary Components (Intake)
Cholesterol (rog) No more than 100 mg 78 84 88 85Sodium (rog) No more than 800 mg 1,417 1,492 1,561 1,501
SampleSize(UnweJghted) -- 459 282 782 1,744
SOURCE: Weighted tabulations of data collected from Dietary Intake Interviews with students, School Nutrition Dietary Assessment study.
NOTE: Students for whom data on family income are missing are omitted from the income subgroup tabulations, but are included in the tabulations for all NSLP participants.
mg _ milligrams.
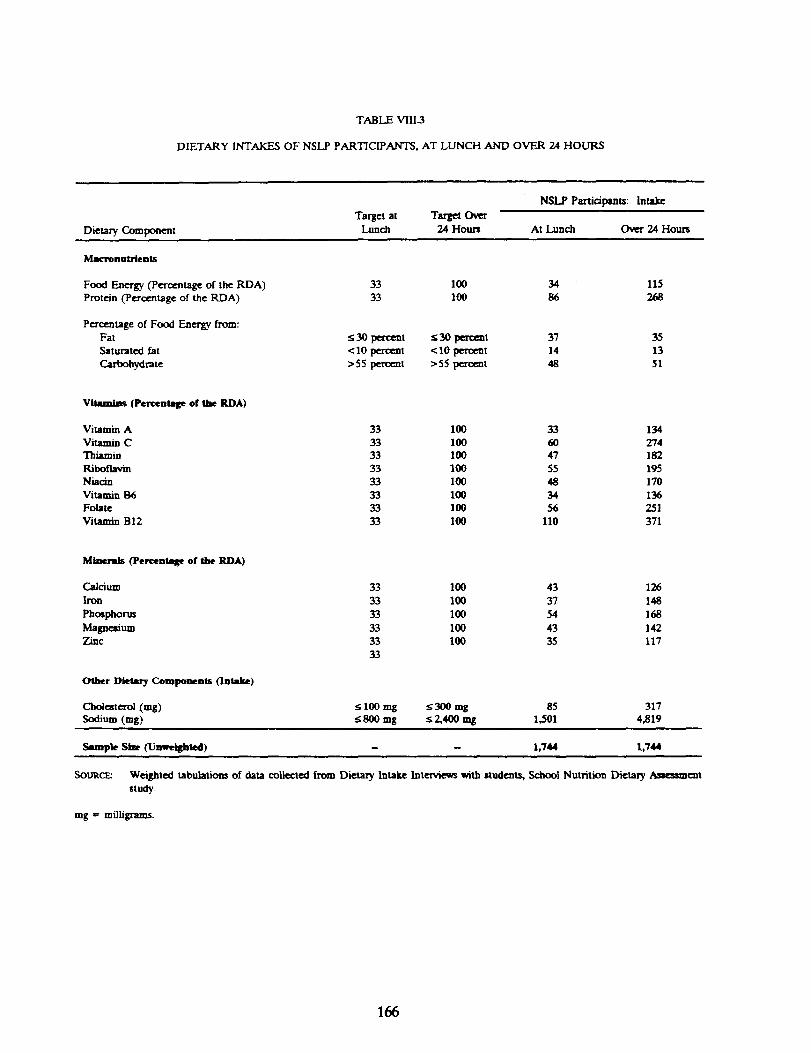
TABLE VIII3
DIETARY INTAKES OF NSLP PARTICIPANTS, AT LUNCH AND OVER 24 HOURS
NSLY Participants: Intake
Target at Target Over
Dietary Component Lunch 24 Hours At Lunch Over 24 Hours
Macronutrlents
Food Energy (Percentage of the RDA) 33 100 34 115Protein (Percentage of the RDA) 33 100 86 268
Percentage of Food Energy from:
Fat < 30 percent < 30 percent 37 35
Saturated fat <10 percent <10 percent 14 13
Carbohydrate >55percent >55pere_t 48 51
Vitamins (Percentage of the RDA)
VitaminA 33 100 33 134
Vitamin C 33 100 60 274Thiamin 33 100 47 182
Ribonavin 33 100 55 195
Niacin 33 100 48 170
Vitamin 136 33 100 34 136
Folate 33 100 56 251
Vitamin B12 33 100 110 371
Minerals (Percentage of the RDA)
Calcium 33 100 43 126
Iron 33 100 37 148
Phosphorus 33 100 54 168
Magnesium 33 100 43 142Zinc 33 100 35 117
33
Other Dietary Components (Intake)
Choleaterol (rog) :; 100 mg -:300 mg 85 317Sodium (tug) _;800 mg :;2,400 mg 1,501 4,819
Samples_ fu,,wetzim_) - - t,744 t,7_
SouRcE: Weighted tabulations of data collected from Dietary Intake Int_ with students, School Nutrition Dictazy Assessment
study.
mg = milligrams.
166

lunch, as intended, they consume more than two-thirds of the RDA at other eating occasions during
the day.
Participants' mean intakes of fat and protein over 24 hours exceed the Dietary Guideline goals
and NRC recommendations. They receive 35 percent of food energy from fat and 13 percent from
saturated fat, compared with the Dietary Guideline goals of 30 percent or less and leas than 10
percent, respectively. Because t"he percentage of food energy from fat obtained over 24 hours is less
than the percentage obtained at lunch (35 percent versus 37 percent), NSLP participants consume
proportionately less fat at other meals than they do at lunch. Similarly, the percentage of energy
from saturated fat is lower over 24 hours than at lunch (13 percent versus 14 percent). Finally, the
mean 24-hour intake of protein exceexts twice the RDA by a considerable margin.
NSLP participants' 24-hour intakes of all vitamins and minerals are well above the RDA. Given
that the RDA are set in a manner whereby even intakes well below the RDA may be sufficient for
many individuals, these data suggest that, as a group, NSLP participants receive adequate amounts
of key vitamins and minerals.
Data on the percentage of NSLP participants who co_[sume at least one-third of the RDA
at lunch and the percentage who consume the full RDA over 24 hours provide additional perspective
on participants' dietary intakes (Table VIII.4). Consistent with the data on mean intakes at lunch,
one-half or more of NSLP participants consume at least one-third of the RDA for all nutrients,
except vitamin A (33 percent of participants), vitamin 136 (40 percent of participants), and zinc
(39 percent of participants). In addition, just 42 percent of NSLP participants consume at least one-
third of the RDA for food energy at lunch. For food energy and each nutrient, somewhat larger
percentages of NSLP participants consume at least the RDA over 24 hours than consume at least
one-third of the RDA at lunch.
Also consistent with the data on mean intakes at lunch and over 24 hours, the percentages of
students meeting Dietary Guideline goals for fat and NRC recommendations for sodium and
167._

TABLE VIII.4
PERCENTAGE OF NSLP PARTICIPANTS MEETING DIETARY TARGETS,AT LUNCH AND OVER 24 HOURS
NSLP Participants: Percentage
Meeting Dietary Target
Target at Target Over At Over
Dietary Component Lunch 24 Hours Lunch 24 Hours
Mact_nntrtents
Food Energy 1/3 of thc RDA RDA 42 58Protein 1/3 of the RDA RDA 92 96
Percentage of Food Energy from:Fat <30 perccnl <30 percent 21 22Saturated fat <10 percent <10 percent 14 16
Carbohydrate >55 percent >55 percent 26 3'2
Vilavninan
Vitamin A 1/3 of the R.DA R.DA 33 50
Vitamin C 1/3 of the RDA R.DA 50 78
Thiamin 1/3 of tim RDA RDA 64 86Riboflavin 1/3 of the RDA RDA 84 gO
Niacin 1/3 of the RDA RDA 60 80
Vitamin B6 1/3 of the RDA RDA 40 64
Folate 1/3 of the RDA RDA 69 88
Vitamin BI2 1/3 of the RDA RDA 90 94
btlnerals
Calcium 1/3 of the RDA RDA 64 60
Iron 1/'3 of the RDA RDA 47 69
Phosphorus 1/3 of the R.DA RDA 78 84Magnesium 1/'3 of the RDA RDA 58 68
Zinc 1/3 of thc RDA _A 39 50
Other Dietary Compo_nts
Cholcstea-ol (rog) < 100 mg <300 mg 73 60
Sodium (rog) <800 mg _;2,400 lng 21 10
Sample Size OUlaWeighted) - - 1,744 1,744
SOURCe: Weighted tabulations of data collected from Dietary Intake Interviews with students, School Nutrition Dietary Assessmentstudy.
mg= milligrams.
168
carbohydrate are relatively small. Just over one-fifth of participants meet the Dietary Guideline goal
for percentage of food energy from total fat, and less than one-frith meet the Dietary Guideline goal
for saturated fat. Similarly, just over one-fourth of NSLP participants obtain more than 55 percent
of food energy from carbohydrate at lunch, and just less than one-third do so over 24 hours. Just
one-fifth of participants consume one-third or less of the NRC daily recommended amount of sodium
at lunch, whereas only 10 percent consume the daily amount or less over 24 hours. Finally, nearly
three-fourths of participants meet the reference standard for lunch intake of cholesterol, and 60
percent consume an amount over 24 hours that meets the NRC recommendation for cholesterol.
The findings that, on average, NSLP participants consume more than 100 percent of the RDA
for food energy, and that more than one-half consume at least the RI)A, are surprising. Because the
RDA for food energy is set in accordance with the average energy needs of the population, one
would expect the average energy intake of NSLP participants to be approximately 100 percent of the
RDA.
These findings have several poss_le explanations or interpretations. First, measurements from
the dietary intake interviews of students' intakes may have contained errors. Thus, mean intakes are
reported as high because the data overestimate true intakes. Second, the average energy needs of
NSLP participants may be higher than those of students who elect not to eat the NSLP lunch.
Because the NSLP is a relatively inexpensive source of a considerable amount of food, the program
may attract students who are not fussy about what they eat, and who tend to consume more food
than do nonparticipants. A third poss_ili_ is that mean intakes actually do exceexi the RI)A, but
that participants have average energy needs. If so, the RDA for energy may be set relatively low,
or some participants may be consuming more food energy than needed, with the associated increase
in the risk of overconsumption.
The basic patterns of 24-hour intakes observed for all NSLP participants also hold for all age
and gender groups and all income groups. Adolescent females' 24-hour intakes of most nutrients are
169
lower relative to their RDA than are the intakes of younger children and adolescent males (Table
VIII.5). Although adolescent females' mcan 24-hour intakes of calcium are less than the RDA (93
percent for the 11- to 14-year-olds and 87 percent for the 15- to 18-year-olds), the mcan lunch
intakes are 33 percent of the RDA (for each group). Thus, the slight shortfall over the 24-hour
period occurred even though the lunch target was met.
Finally, NSLP participants with family incomes below the poverty level, between 100 percent and
185 percent of the poverty level, and more than 185 percent of the poverty level all have very similar
24-hour intakes of food energy and of all other nutrients (Table VIII.6). Although students whose
family incomes are less than 185 percent of the poverty level have slightly lower mean intakes of food
energy than do students from families whose incomes exceed 185 percent of the poverty level, the
difference is not statistically significant.
3. Waste and OVS
Concerns about plate waste prompted the introduction of OVS into the NSLP more than a
decade ago. Under OVS, schools must offer all five of the items requffed by the NSLP meal pattern
and may receive reimbursement for the meal from the U.S. Department of Agriculture, even though
students may decline one or two of the five items. 4 In a school that does not use OVS, a student
is required to take all free items in order for the meal to qualify for federal reimbursement. OVS is
required in all secondary schools. It is optional in schools below the secondary level, at the discretion
of local officials. According to the data, 71 percent of elementary schools and 90 percent of middle
schools currently use OVS. Schools that do not offer OVS may be concerned that the nutritional
quality of the meal as consumed could be compromixed ff children are allowed to refuse two items.
4Schools are required to charge the same price to all students in a given meal-price eligibilitycategory, regardless of the number of components selected.
17_0

TABLE VIII.5
24-HOUR DIETARY INTAKES OF NSLP PARTICIPANTS, BY AGE AND GENDER
11- to 14-Year-Old 15- to 18-Year-Old
Students Students
Target Over 6- to 10-Year-Old All NSLP
Dietary Component 24 Hours Students Female Male Female Male Participants
Mactonulrlenis
Food Energy (Percentage of the RDA} 100 113 108 121 116 117 115
Protein (Percentage of the RDA) 100 311 185 260 210 226 268
Percentage of Food Energy from:
Fat No mote than 30 percent 35 35 36 35 35 35
Saturated fat Less than 10 percent 13 13 13 13 13 13Carbohydrate More than 55 percent 51 52 50 51 51 51
Vltamlm (Percentage of file RDA)
Vitamin A 100 142 118 140 97 131 134
Vitamin C 100 272 218 313 236 316 274
Thiamin 100 184 161 188 172 194 182---.IRiboflavin 100 200 175 212 167 194 195Niacin 100 175 148 177 153 180 170Vitamin B6 100 135 126 144 126 147 136
Folate 100 298 174 240 150 217 251
Vitamin BI2 100 393 269 430 234 397 371
Minerals (Percentage of the RDA)
Calcium I00 139 93 123 87 135 126
Iron 100 152 100 163 102 201 148
Phosphorus 100 182 125 164 126 187 168
Magnesium 100 170 100 137 98 103 142Zinc I00 122 102 112 109 126 117
Other Dietary Componenls (Intake)
Cholesterol (rog) No mote than 300 mg 288 274 379 276 427 317
Sodium (rog) No mote than 2,400 mg 4,215 4,382 5,697 4,790 6,768 4,819
Sample Size (Unwelghted) .. 846 246 327 138 187 1,744
SOURCE: Weighted tabuintions of data cotlected from Dietary Intake Interviews with students, School Nutrition Dietary Assessment study.
mg = milligrams.
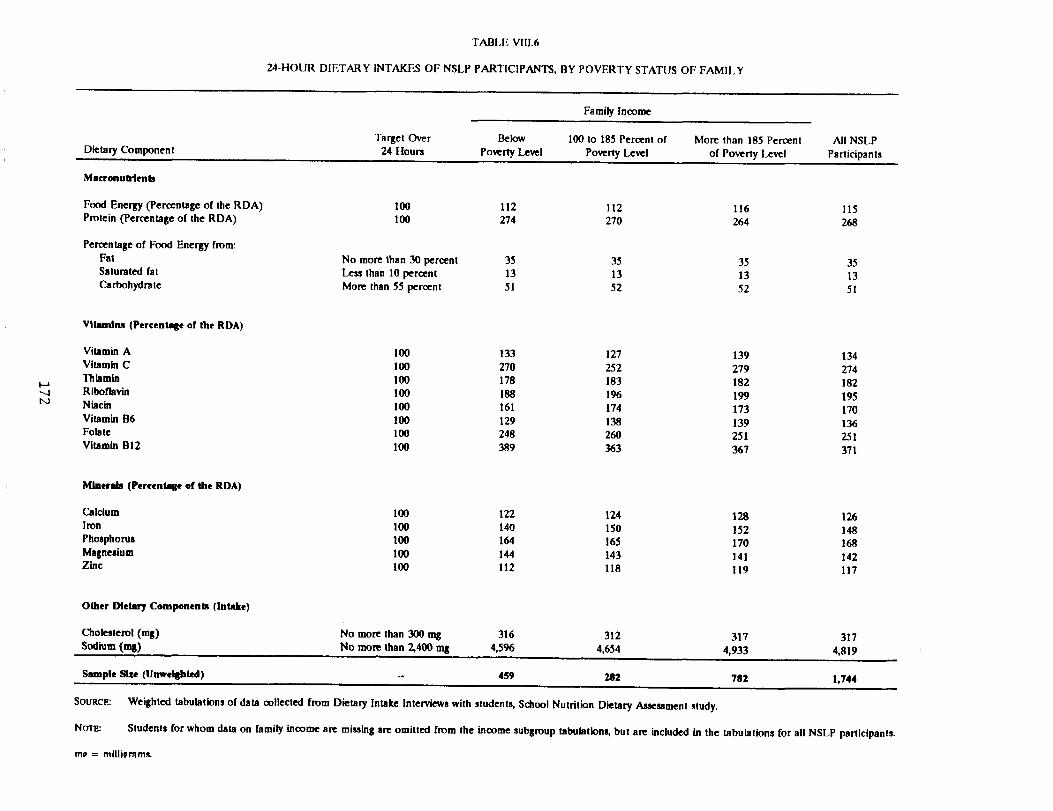
TABLE Vlil.6
2,4-HOUR DIETARY INTAKES OF NSLP PARTICIPANTS, BY POVERTY STATUS OF FAMILY
Family Income
Target Over Below 100 to 185 Percent of More than 185 Percent All NSLP
Dietary Component 24 Hours Poverty Level Poverty Level of Poverty Level Participants
Macronulrlenls
Food Energy (Percentage of the RDA) 100 112 112 116 115Protein (Percentage of the RDA) 100 274 270 264 268
Percentage of Food Energy from:Fat No more than 30 percent 35 35 35 35Saturated fat Less than 10 percent 13 13 13 13Carbohydrate More than 55 percent 51 52 52 51
Vitamins (Percentage of the RDA)
Vitamin A 100 133 127 139 134Vitamin C 100 270 252 279 274
_.a Thiamin 100 178 183 182 182-...4 Riboflavin 100 188 196 199 195ro Niacin 100 161 174 173 170
Vitamin B6 100 129 138 139 136Foiate 100 248 260 251 251Vitamin BI2 100 389 363 367 371
Mlnerds (Percentalle of the RDA)
Calcium 100 122 124 128 126Iron 100 140 150 152 148Phosphorus 100 164 165 170 168Magnesium 100 144 143 141 142Zinc 100 112 118 119 117
Other Dietary Components (Intake)
Cholesterol (rog) No more than 300 nag 316 312 317 317
Sodium (rog) No more than 2,400 mg 4,596 4,654 4,933 4,819
Sample Size (Uuwelghted) -- 4S9 282 782 1,744
SouRce: Weighted tabulations of data collected from Dietary Intake Interviews with students, School Nutrition Dietary Assessment study.
NOTE: Students for whom data on family income are missing are omitted from the income subgroup tabulations, but are included in the tabulations for all NSLP participants.
m_ = millk,rnm&
The analysis of OVS addresses the following questions:
· Overall, how much of the various nutrients from NSLP lunches do students waste?
· Does the nutrient content of NSLP lunches as consumed differ between schools usingOVS and schools not using OVS?
· Are students more likely to select some meal components than others, and does theamount of waste differ by component?
The findings in this section are based on data drawn from the dietary intake interviews, in which
students were asked about the foods they consumed and discarded at school.
a. Nutrients Wasted, by Age and Gender
The most comprehensive measure of food waste is the difference between the total caloric
content of foods that a student reported selecting for lunch and the total caloric content of foods that
a student reported consuming. Overall, NSLP participants waste about 12 percent of the food energy
in the meal that they select (Table VIII.7).
For most nutrients, the percentage wasted does not deviate greatly from this overall 12 percent
figure. Eleven percent of both fat and protein and 13 percent of carbohydrate are wasted. About
14 percent of most vitamins is wasted, although the percentage is lower for riboflavin (11 percent),
niacin (12 percent), and vitamin B12 (10 percent). Eleven percent of calcium and phosphorus and
13 percent of iron and magnesium are wasted. Finally, 10 percen t of cholesterol and 13 percent of
sodium are wasted.
Age and gender groups exhibit different patterns of intake and waste. Younger students
generally leave more waste than do older students. For example, 6- to 10-year-old NSLP participants
waste 14 percent of the food energy in the foods that they select; 11- to 14-year-old participants
waste approximately 10 percent (17 percent by females, and 8 percent by males); and 15- to 18-year-
old participants waste about 7 percent (11 percent by females, and 5 percent by males).
173
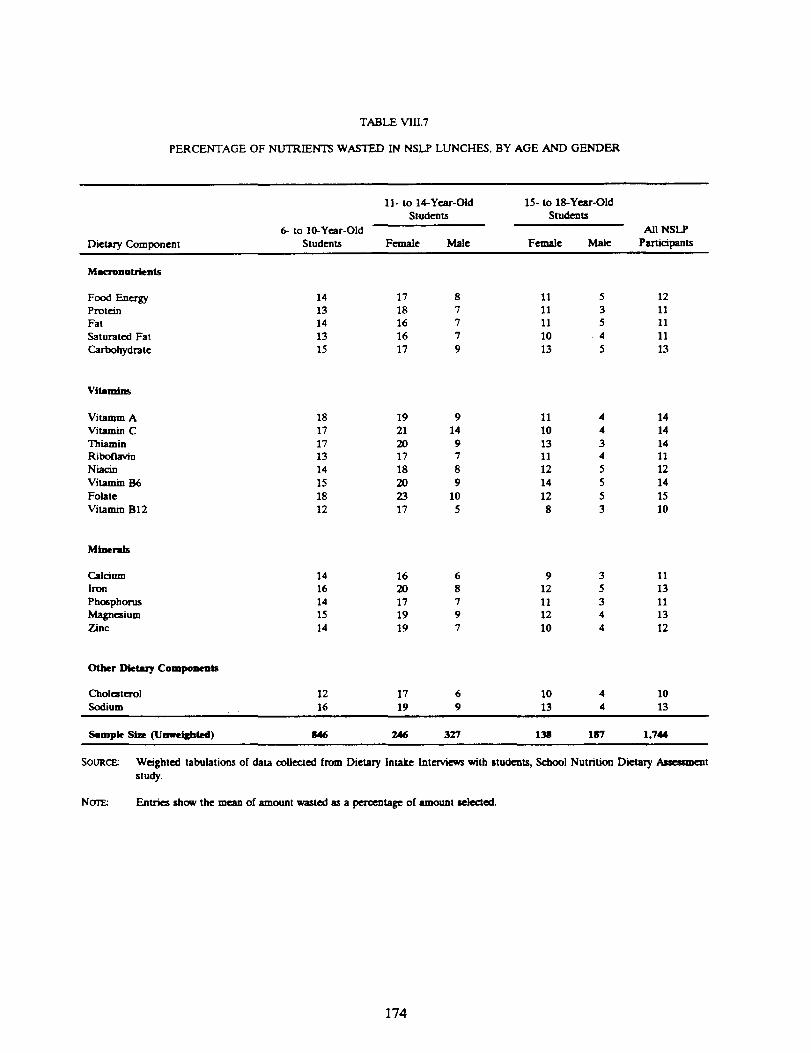
TABLE VIII.7
PERCENTAGE OF NLrl'RII:_.NTS WASTED IN NSLP LUNCHES, BY AGE AND GENDER
11- to 14-Year-Old 15- to 18-Year-Old
Students Students
6- to 10-Year-Old All NSLP
Dietary Component Students Female Male Female Male Participants
Mocronutrients
Food Energy 14 17 8 11 5 12Protein 13 18 7 11 3 11
Fat 14 16 7 11 5 11
Saturated Fat 13 16 7 10 4 11
Carbohydrate 15 17 9 13 5 13
Vilamln_
Vitam TM A 18 19 9 11 4 14
Vitamm C 17 21 14 10 4 14Thiamin 17 20 9 13 3 14
Riboflavin 13 17 7 11 4 11
Niacin 14 18 8 12 5 12
Vitamin B6 15 20 9 14 5 14
Folate 18 23 10 12 5 15Vitamin B12 12 17 5 8 3 10
Minerals
Calcium 14 16 6 9 3 11Iron 16 20 8 12 5 13
Phosphorus 14 17 7 11 3 11
Magnesium 15 19 9 12 4 13Zinc 14 19 7 10 4 12
Ot_r I_mry Components
Cholesterol 12 17 6 10 4 10
Sodium 16 19 9 13 4 13
Sample Size ('Uu_eJghied) 846 246 327 138 IFF'/ 1,744
SouRcE: Weighted tabulations of data collected from Dietary Intake Interviews with students, School Nutrition Dietary Assessment
study.
NOTE: Entries show the mean of amount wasted ]ts a percentage of amount selected.
174
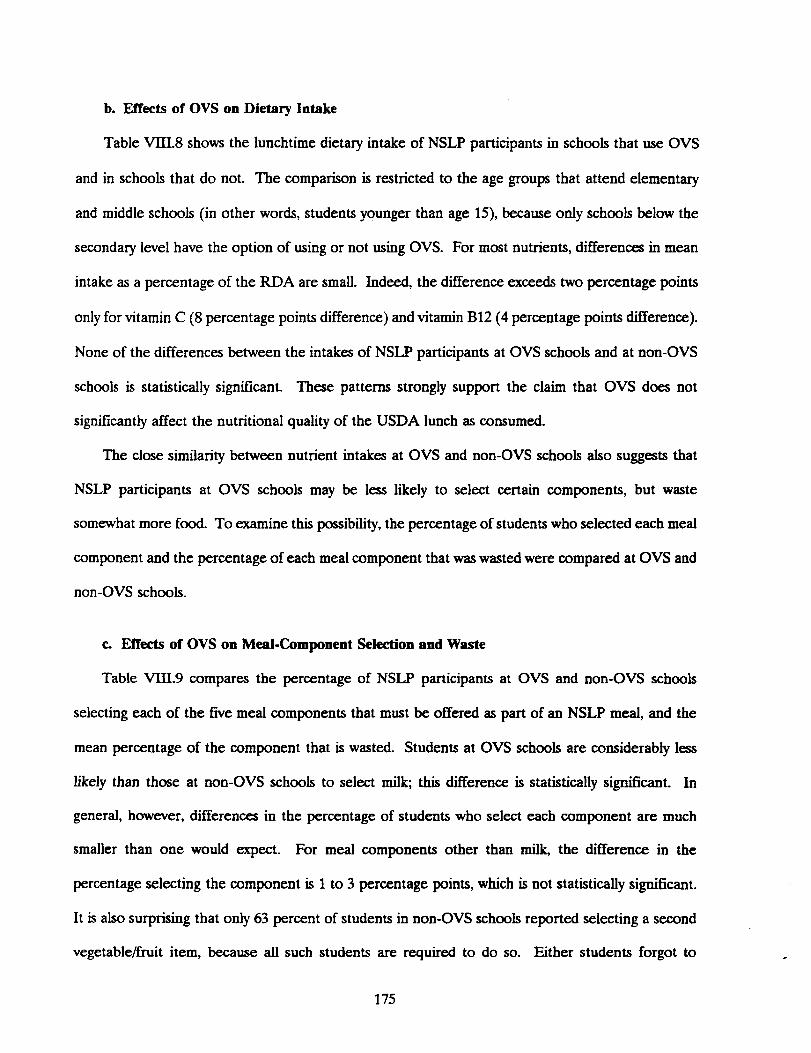
b. Effects of OVS on Dietary Intake
Table VIII.8 shows the lunchtime dietary intake of NSLP participants in schools that use OVS
and in schools that do not. The comparison is restricted to the age groups that attend elementary
and middle schools (in other words, students younger than age 15), because only schools below the
secondary level have the option of using or not using OVS. For most nutrients, differences in mean
intake as a percentage of the RDA are small. Indeed, the difference exceeds two percentage points
only for vitamin C (8 percentage points difference) and vitamin B12 (4 percentage points difference).
None of the differences between the intakes of NSLP participants at OVS schools and at non-OVS
schools is statistically significanL These patterns strongly support the claim that OVS does not
significantly affect the nutritional quality of the USDA lunch as consumed.
The close similarity between nutrient intakes at OVS and non-OVS schools also suggests that
NSLP participants at OVS schools may be less likely to select certain components, but waste
somewhat more food. To examine this poss_flity, the percentage of students who selected each meal
component and the percentage of each meal component that was wasted were compared at OVS and
non-OVS schools.
c. Effects of OVS on Meal-Component Selection and Waste
Table VIII.9 compares the percentage of NSLP participants at OVS and non-OVS schools
selecting each of the five meal components that must be offered as part of an NSLP meal, and the
mean percentage of the component that is wasted. Students at OVS schools are considerably less
likely than those at non-OVS schools to select milk; this difference is statistically significant. In
general, however, differences in the percentage of students who select each component are much
smaller than one would expect. For meal components other than milk, the difference in the
percentage selecting the component is 1 to 3 percentage points, which is not statistically significant.
It is also surprising that only 63 percent of students in non-OVS schools reported selecting a second
vegetable/fruit item, because all such students are required to do so. Either students forgot to
175
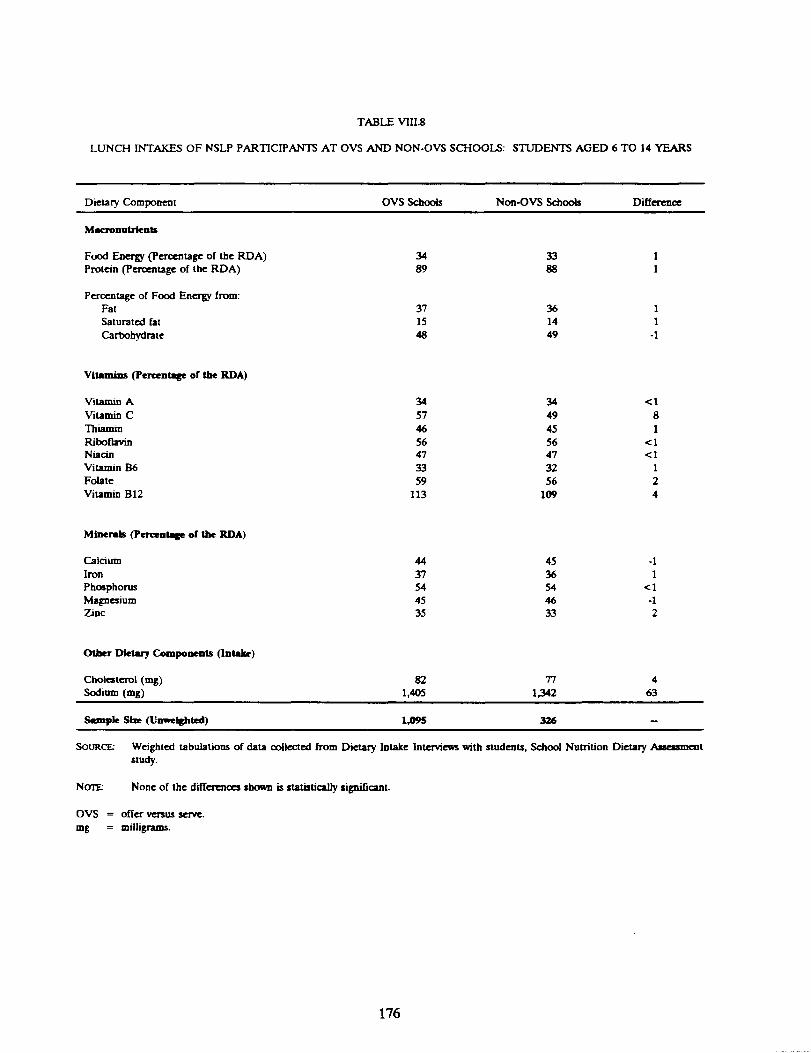
TABLE VIII.8
LUNCH INTAKES OF NSLP PARTICIPANTS AT OVS AND NON-OVS SCHOOLS: STUDENTS AGED 6 TO 14 YEARS
Dietary Component OVS Schools Non-OVS Schools Diff_.oe
Mmcr_nutrJents
Food Energy (Percentage of the PDA) 34 33 1
Protein (Per_ntage of the RDA) 89 88 1
Percentage of Food Energy from:Fat 37 36 1
Saturated fat 15 14 1
Carbohydrate 48 49 -1
vitamins OPercenmge of _ RDA)
Vitamin A 34 34 <1
Vitamin C 57 49 8
Thiamin 46 45 l
Riboflavin 56 56 < 1Niacin 47 47 < 1
Vitamin B6 33 32 1
Folate 59 56 2
Vitamin B12 113 109 4
Mimral_ (PercenU_ or the RDA)
Calcium 44 45 -1
Iron 37 36 1
Phosphorus 54 54 <1
Magnesium 45 46 -1Zinc 35 33 2
Other Dtielmry Comp,onenLq (Intake)
Cholesterol (rog) 82 77 4Sodium (lng) 1,405 1,342 63
Sample ssi' (Unwetghted) 1,09S 326 -
SOURCE: Weighted tabulations of data collocted from Dietary Intake Interviews with students, School Nutrition Dietary Am4mamem
StUdy,
NOTE: None of the diffenmoes shown is statistically significant.
ors = offer versus serve.
mg = milligrams.
176

TABLE VIII.9
EFFECTS OF OVS ON SELECTION AND WASTEOF MEAL-PATtERN COMPONENTS
Percentage of Students Selecting Component Mean Percentage of Component Wasted
OVS Non-OVS OVS Non-OVS
MealComponent Schools Schools Difference Schools Schools Difference
Meat 96 98 -2 11 15 -4
Bread 89 91 -3 13 16 -3
Milk 84 95 -11 * 9 14 -5
One Vegetable/Fruit 94 95 -1 17 25 -8
Second Vegetable/Fruit 61 63 -2 22 31 -9l...a.-,o
-a Sample Size (Unweighted) 1,095 326 -- 1,095 326 --
SOURCE: Weighted tabulations of data collected from Dietary Intake Interviews with students, School Nutrition Dietary Assessment study.
OVS = offer versus serve.
· indicates the difference is statistically significant at the 95 percent confidence level with a two-tailed test.

mention a selected item or cafeteria workers in some non-OVS schools do not require all students
to select five componentsfi
As shown in the table, reported waste is somewhat higher at non-OVS schools than at OVS
schools. The percentage wasted is 3 to 5 percentage points lower for meat, bread, and milk, and 8
to 9 percentage points lower for vegetables.
In summary, the data indicate that NSLP participants' average intakes of most nutrients are
virtually identical in OVS and non-OVS schools. The surprisingly small differences in the proportion
of students at OVS schools and non-OVS schools who select each component (except milk) suggest
that non-OVS schools do not adhere strictly to the five-component requirement, but that most
students nonetheless select most components. In addition, students in OVS schools report wasting
somewhat less food than do those in non-OVS schools. Together, these findings-that waste is lower
in OVS schools, and that OVS does not reduce the intake of key nutrients-support the use of OVS
for all students below the secondary level.
C. INTAKES OF SBP PARTICIPANTS
This section presents findings on SBP participants' nutrient intakes at breakfast and over 24
hours.
1. Breakfast Intakes
SBP participants' mean intakes at breakfast of nearly all nutrients exceed one-fourth of the RDA
(Table VIII. 10). Only the mean intake of zinc is less than one-fourth of the RDA--22 percent.
Mean intakes of protein, vitamin C, thiamin, riboflavin, folate, and vitamin B12 are more than one-
half of the RDA, and mean intakes of vitamin A, niacin, vitamin 136,calcium, iron, phosphorus, and
magnesium are more than one-third of the RDA. The mean intake of food energy is 26 percent of
SFurther discussion of this issue is presented in Appendix B, which doscn'bes the operationaldefinition of NSLP participant and the sensitivity of the estimates to whether students in non-OVSschools who choose three or four items are categorized as NSLP participants.
178
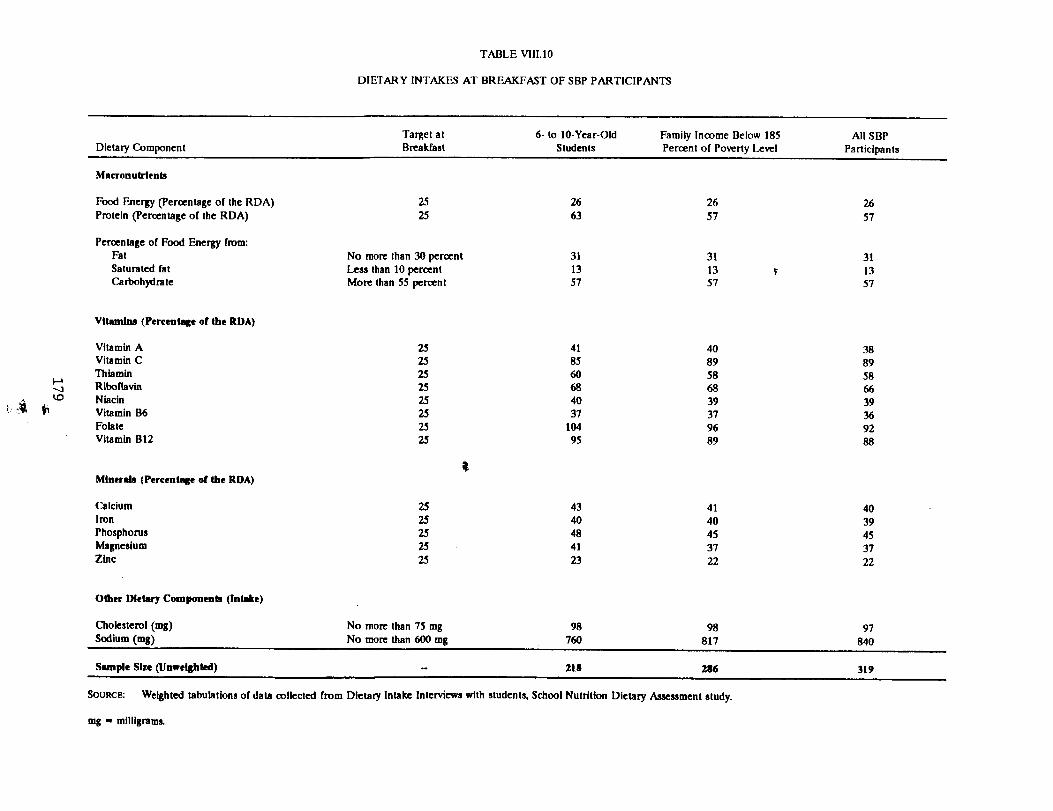
TABLE VIll. 10
DIETARY INTAKES AT BREAKFAST OF SBP PARTICIPANTS
Target at 6- to 10-Year-Old Family Income Below 185 All SBP
Dietary Component Breakfast Students Percent of Poverty Level Participants
Maeronutrlents
Food Energy (Percentage of the RDA) 25 26 26 26
Protein (Percentage of the RDA) 25 63 57 57
Percentage of Food Energy from:
Fat No more than 30 percent 31 31 31
Saturated fat Leas than 10 percent 13 13 tr 13
Carbohydrate More than 55 percent 57 57 57
Vitamins (Pereentnl_e of the RDA)
Vitamin A 25 41 40 38
Vitamin C 25 85 89 89
Thiamin 25 60 58 58-o Riboflavin 25 68 68 66
Niacin 25 40 39 39
_; _ _ Vitamin B6 25 37 37 36
Folate 25 104 96 92
Vitamin BI2 25 95 89 88
Minerals (Percentage or the RDA)
Calcium 25 43 41 40
Iron 25 40 40 39
Phosphoms 25 48 45 45Magnesium 25 41 37 37
Zinc 25 23 22 22
Other Dietary Components (Intake)
Cholesterol (rog) No more than 75 tug 98 98 97
Sodium (mg) No more than 600 mg 760 817 840
Sample Size (Unwelshted) -- 218 286 319
SOURCE: Weighted tabulations of data collected from Dietary Intake Interviews with students, School Nutrition Dietary Assessment study.
mg= milligrams.
the RDA. The means for students 6- to 10-years old and the means for students from families whose
incomes are less than 185 percent of the poverty level are very similar to the means for all SBP
participants. This finding is not surprising, as students aged 6 to 10 years comprise two-thirds of SBP
participants, and those from low-income families comprise 85 percent. 6
SBP participants' mean breakfast intake of fat is just slightly above the Dietary Guideline goal,
but their breakfast intake of saturated fat ex_ the Dietary Guideline goal by a substantial amount.
Breakfast intakes of cholesterol and sodium exceed reference standards for breakfast (which are
defined as one-fourth of the amount that the NRC recommends as the maximum daily intake). SBP
participants consume a mean of 31 percent of food energy from fat, compared with a goal of 30
percent or less. The mean percentage of food energy from saturated fat is 13 percent, compared with
a goal of less than 10 percent. The mean percentage of food energy from carbohydrate is 57 percent
(the NRC recommendation is more than 55 percent). As with NSLP lunches, the percentage of food
energy from fat in breakfasts as consumed is similar to the percentage in breakfasts as offered.
However, this finding is less surprising than the analogous finding for lunch, because breakfasts
generally offer fewer food choices than do lunches. A mean of 97 mg of cholesterol is consumed at
breakfast, which exceeds the reference standard of 75 rog. Finally, the mean breakfast intake of
sodium is 840 rog, which is well above the breakfast target reference standard of 600 rog. The mean
intakes of these dietary components by low-income students and by students 6 to I0 years old are
nearly identical to the mean intakes by aH SBP participants.
2. 24-Hour Intakes
SBP participants' mean intakes over 24 hours of nearly all nutrients exceed the RDA (Table
VIII.II). They consume an average amount of food energy of 117 percent of the RDA. Thus,
breakfast provides about 22 percent of the participants' total food energy. SBP participants' intake
6Sample sizes were too small to support separate analyses of other subgroups.
180
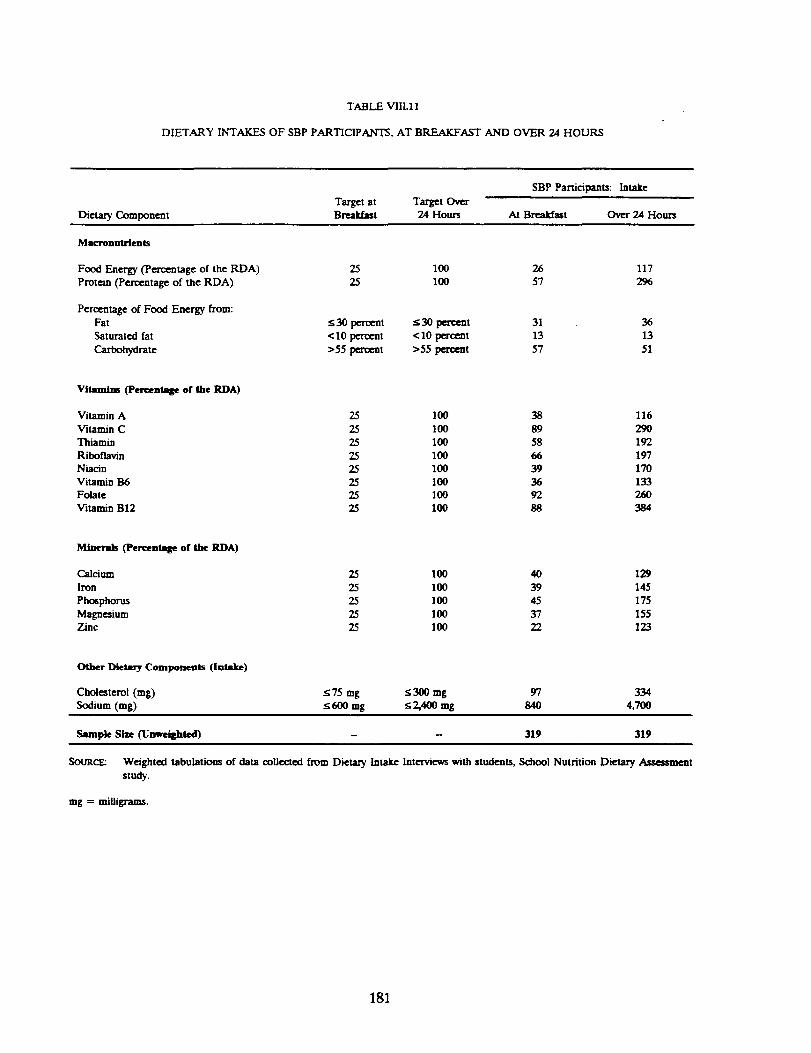
TABLE VILLI 1
DIETARY INTAKES OF SBP PARTICIPANTS, AT BREAKFAST AND OVER 24 HOURS
SBP Parucipant3: Im_ke
Target at Target Over
Dietary Component Brt*=_fm-qt 24 Hours At Breakfast Over 24 Hours
Macronutrlents
Food Energy (Percentage of the RDA) 25 100 26 117
Protein (Percentage of the RDA) 25 100 57 296
Percentage of Food Energy from:
Fat < 30 percem < 30 percent 31 36Saturated fat <10 percent <10 percent 13 13
Carbohydrate :,55 percent >55 percent 57 51
Vitamins (Percentage of the RDA)
Vitamin A 25 100 38 116
Vitamin C 25 100 89 290
Thiamin 25 100 58 192
Riboflavin 25 100 66 197Niacin 25 100 39 170
Vitamin 136 25 100 36 133
Folate 25 100 92 260
Vitamin B12 25 100 88 384
Mineruls (])ercentt_e of the RI)A)
Calcium 25 100 40 129
iron 25 100 39 145
Phosphorus 25 100 45 175
Magnesium 25 100 37 155Zinc 25 100 22 123
Other Dietary Components (Intake)
Cholesterol (mg) _ 75 mg <300 mg 97 334
Sodium (rog) _;600 mg <:2,400 mg 840 4,700
Sample Size (Unweighiea) - - 319 319
SOURCE: Weighted tabulations of data collected from Dietary Intake Interviews with students, School Nutrition Dietary Assessmem
study.
mg -- milJigramq.
181
of protein is nearly three times the RDA. Mean intakes of all vitamins and minerals over 24 hours
are well above the RDA.
SBP participants' mean intakes over 24 hours of fat, saturated fat, cholesterol, and sodium are
higher than the Dietary Guideline goals and NRC recommendations. Although breakfast intakes of
fat are close to the Dietary Guideline goal, SBP participants consume proportionately more fat at
other meals, thus raising the 24-hour percentage of food energy from fat from 31 percent at breakfast
to 36 percent over 24 hours. Data presented in the companion report by Devaney et al. (1993)
indicate that low-income students, who comprise the great majority of SBP participants, obtain more
of their food energy from fat than do students from families with incomes above 185 percent of the
poverty level.
D. CONTRIBUTION OF USDA MEALS TO 1A-HOUR INTAKES
This section presents data on the percentage of the total 24-hour intake of various dietary
components that program participants derive from the NSLP and the SBP. Table VIII. 12 shows the
intakes of students who participated in either the NSLP or the SBP, or in both programs, as a
percentage of their 24-hour intakes, by family income level.
Overall, participants derive 35 percent of food energy from school meals. Students from families
with incomes below the poverty level receive 38 percent of their food energy from school meals.
Those from families with incomes between 100 percent and 185 percent of the poverty level receive
35 percent from school meals. Students from families with incomes above 185 percent of the poverty
level receive 32 percent of their food energy from school meals.
Percentages of other dietary components derived from school meals follow the same pattern
across the income groups. Percentages are highest for the low-income group and are lowest for the
higher-income group. School meals provide more than 40 percent of vitamin A, riboflavin, vitamin
B12, calcium, phosphorus, and magnesium for students from families with incomes below the poverty
level.
182
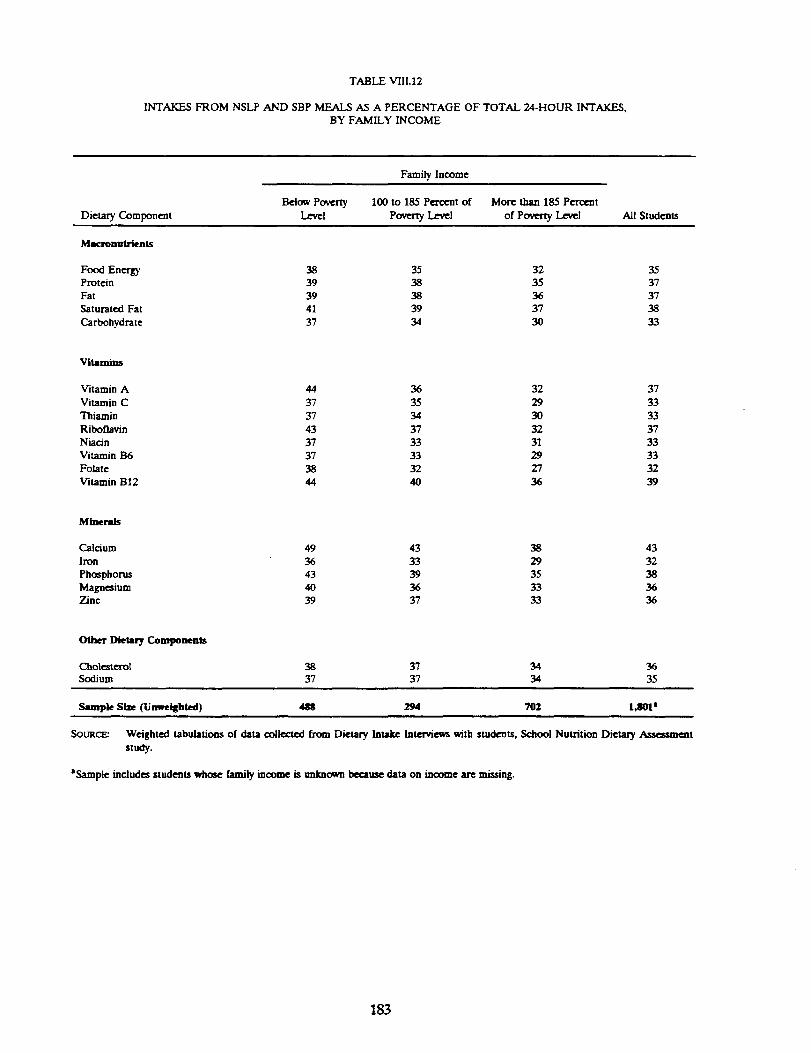
TABLE VIII.12
INTAKES FROM NSLP AND SBP MEAI.3 AS A PERCENTAGE OF TOTAL 24-HOUR INTAKES,BY FAMILY INCOME
Family Income
Below Poverty 100 to 185 Percent of More than 185 Percent
Dietary Component Level Poverty Level of Poverty Level All Students
Macronulrients
Food Energy 38 35 32 35Protein 39 38 35 37
Fat 39 38 36 37
Saturated Fat 41 39 37 38
Carbohydrate 37 34 30 33
¥ilarnin_
Vitamin A 44 36 32 37
Vitamin C 37 35 29 33Thiamin 37 34 30 33
Riboflavin 43 37 32 37
Niacin 37 33 31 33
Vitamin 156 37 33 29 33
Folate 38 32 27 32
Vitamm B12 44 40 36 39
Minerals
Calcium 49 43 38 43
Iron 36 33 29 32
Phosphorus 43 39 35 38
Magnesium 40 36 33 36Zinc 39 37 33 36
OIher Dietary Components
Cholesterol 38 37 34 36Sodium 37 37 34 35
Sample Size (Umveighted) 485 294 702 lag01 a
SOURCF_ Weighted tabulations of data collected from Dietary Intake Interviews with students, School Nutrition Dietary Assesamestt
study.
'Sample includes students whose family income is tlnJ_owla beCaUl_ data on income are missing.
183