web viewwater supply: what is the quality of water in a waterway or water body? how do human...
TRANSCRIPT

1
WATER SUPPLY:WHAT IS THE QUALITY OF WATER IN A WATERWAY OR WATER
BODY?HOW DO HUMAN ACTIVITIES AFFECT THE QUALITY OF WATER IN A
WATERWAY OR WATER BODY?
GEOGRAPHICAL INVESTIGATION LOGThis Log belongs to:Name:Class:
My group is:Group Number:
Group Members:
1.2.3.4.5.
My Marks for this Geographical InvestigationMarks for Group Contribution: / 10
Marks for Group End Product: / 10
Marks for Individual Contribution: / 10
Total / 30
2
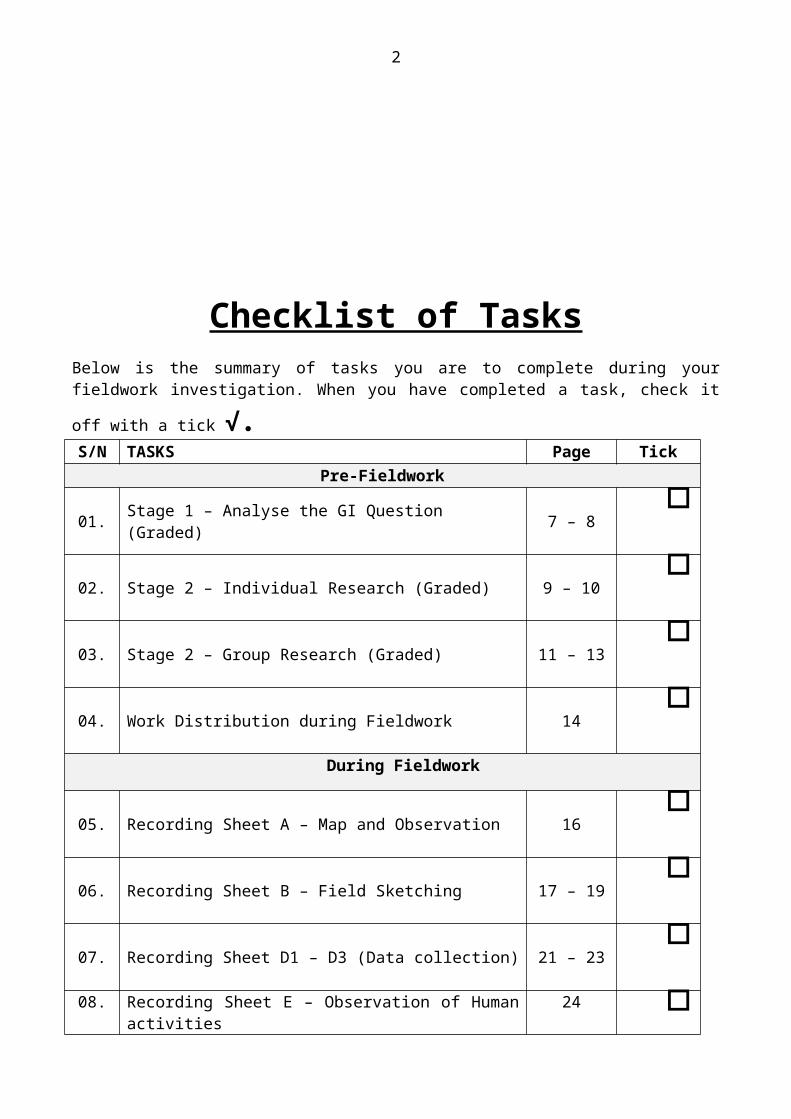
Checklist of TasksBelow is the summary of tasks you are to complete during your fieldwork investigation.
When you have completed a task, check it off with a tick √. S/N TASKS Page Tick
Pre-Fieldwork
01. Stage 1 – Analyse the GI Question (Graded) 7 – 8
02. Stage 2 – Individual Research (Graded) 9 – 10
03. Stage 2 – Group Research (Graded) 11 – 13
04. Work Distribution during Fieldwork 14
During Fieldwork
05. Recording Sheet A – Map and Observation 16
06. Recording Sheet B – Field Sketching 17 – 19
07. Recording Sheet D1 – D3 (Data collection) 21 – 23
08. Recording Sheet E – Observation of Human activities 24
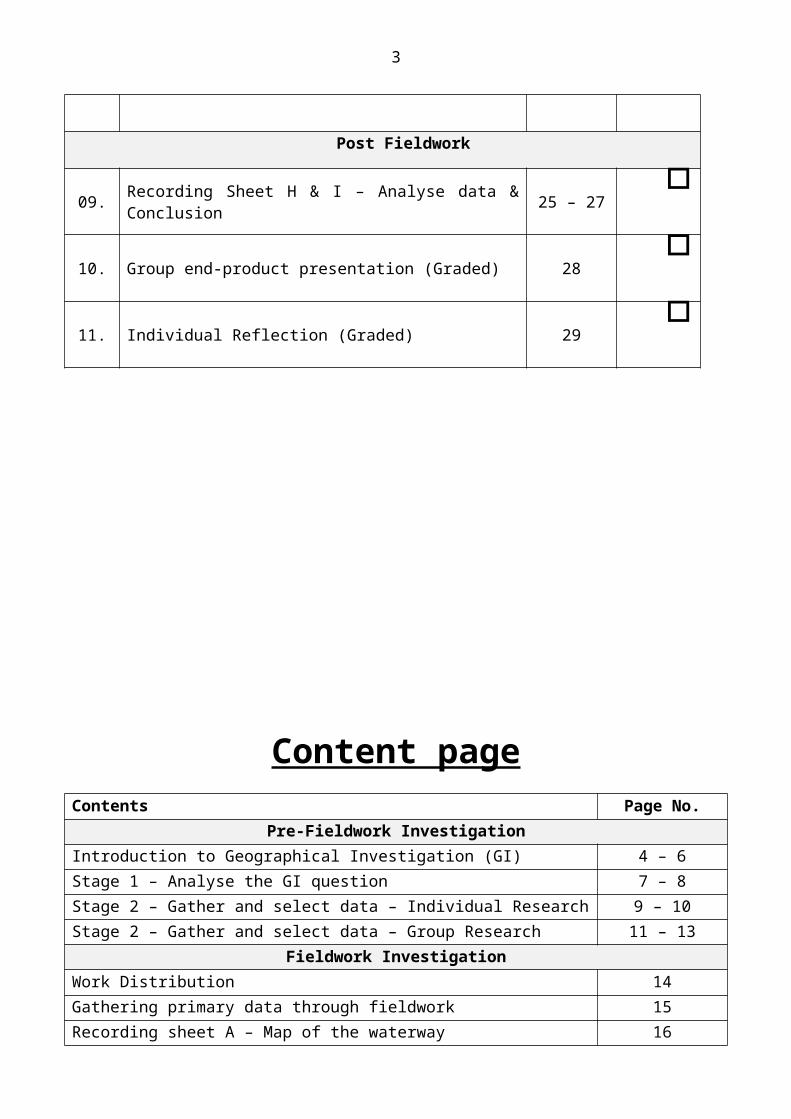
Post Fieldwork
09. Recording Sheet H & I – Analyse data & Conclusion 25 – 27
10. Group end-product presentation (Graded) 28
11. Individual Reflection (Graded) 29
3
Content pageContents Page No.
Pre-Fieldwork InvestigationIntroduction to Geographical Investigation (GI) 4 – 6Stage 1 – Analyse the GI question 7 – 8Stage 2 – Gather and select data – Individual Research 9 – 10Stage 2 – Gather and select data – Group Research 11 – 13
Fieldwork InvestigationWork Distribution 14Gathering primary data through fieldwork 15Recording sheet A – Map of the waterway 16Recording sheet B – Field sketching 17 – 19Recording sheet C – Sampling 20Recording sheet D1 – Measuring Turbidity 21Recording sheet D2 – Measuring Dissolved Oxygen 22Recording sheet D3 – Measuring pH 23Recording sheet E – Observation of Human Activities 24
Post-Fieldwork InvestigationStage 3 – Analyse data (Recording Sheet H) 25 – 26Stage 4 – Construct group response (Recording Sheet I) 27Stage 5 – Present group end product 28Stage 6 – Individual Reflection 29Annex A 30 – 31Annex B1 32Annex B2 33Annex B3 34Annex C 35Annex D 36 – 37

4
INTRODUCTION TO GI
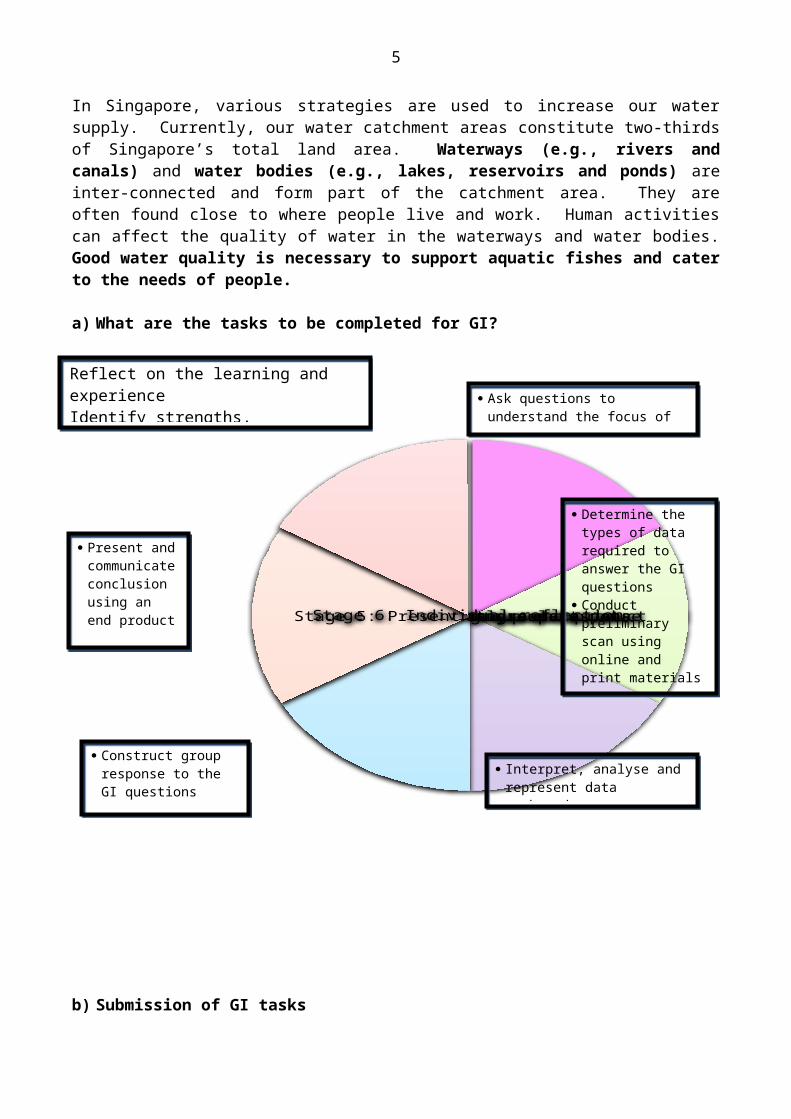
In Singapore, various strategies are used to increase our water supply. Currently, our water catchment areas constitute two-thirds of Singapore’s total land area. Waterways (e.g., rivers and canals) and water bodies (e.g., lakes, reservoirs and ponds) are inter-connected and form part of the catchment area. They are often found close to where people live and work. Human activities can affect the quality of water in the waterways and water bodies. Good water quality is necessary to support aquatic fishes and cater to the needs of people.
a) What are the tasks to be completed for GI?
What is the quality of water in a waterway or water body? How do
human activities affect the quality of water in a waterway or water body?
Ask questions to understand the focus of the GI
Reflect on the learning and experienceIdentify strengths, limitations and possible ways of improving the investigation
5
b) Submission of GI tasks
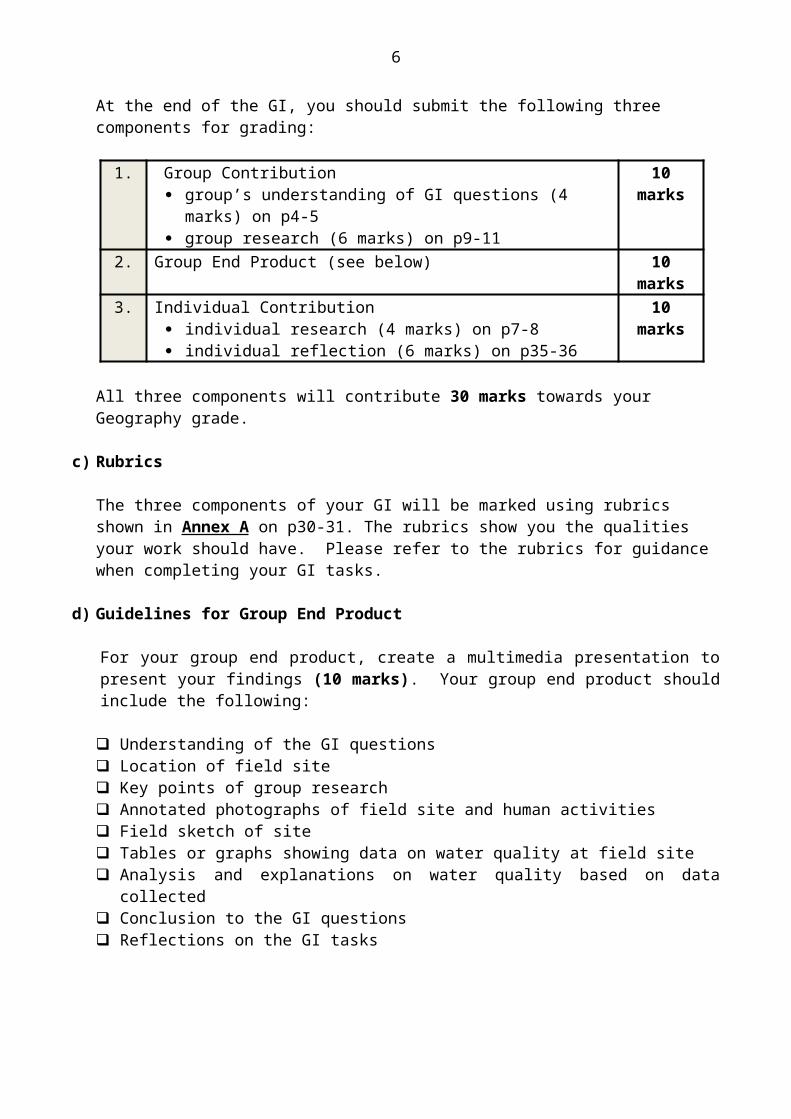
At the end of the GI, you should submit the following three components for grading:
1. Group Contribution group’s understanding of GI questions (4 marks) on p4-5 group research (6 marks) on p9-11
10 marks
2. Group End Product (see below) 10 marks
3. Individual Contribution individual research (4 marks) on p7-8 individual reflection (6 marks) on p35-36
10 marks
All three components will contribute 30 marks towards your Geography grade.
c) Rubrics
Stage 1: Analyse the GI questionsStage 2: Gather and select dataStage 3: Analyse dataStage 4: Construct group responseStage 5: Present group end productStage 6: Individual reflection
Determine the types of data required to answer the GI questions
Conduct preliminary scan using online and print materials
Conduct fieldwork
Interpret, analyse and represent data gathered
Construct group response to the GI questions
Present and communicate conclusion using an end product
6
The three components of your GI will be marked using rubrics shown in Annex A on p30-31. The rubrics show you the qualities your work should have. Please refer to the rubrics for guidance when completing your GI tasks.
d) Guidelines for Group End Product
For your group end product, create a multimedia presentation to present your findings (10 marks). Your group end product should include the following:
Understanding of the GI questions Location of field site Key points of group research Annotated photographs of field site and human activities Field sketch of site Tables or graphs showing data on water quality at field site Analysis and explanations on water quality based on data collected Conclusion to the GI questions Reflections on the GI tasks
Form your group
Form a group comprising five members and assign a role for every member. This will help you plan and complete the GI tasks. Refer to Annexes B1-B3 to guide your group formation.
Role Name of Group Member
Group Facilitator 1
Recorder/Secretary(2 members)
2
3Resource Representative 4
Checker 5

7
STAGE 1 – ANALYSE THE GI QUESTION
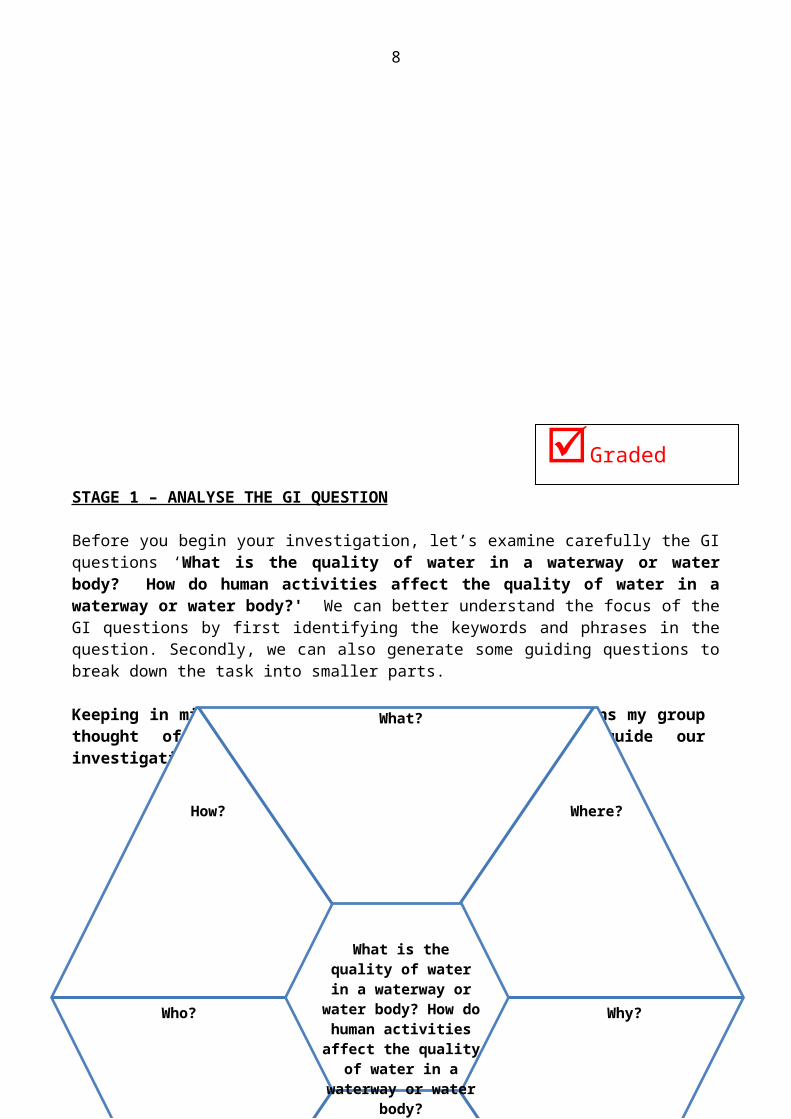
Before you begin your investigation, let’s examine carefully the GI questions ‘What is the quality of water in a waterway or water body? How do human activities affect the quality of water in a waterway or water body?' We can better understand the focus of the GI questions by first identifying the keywords and phrases in the question. Secondly, we can also generate some guiding questions to break down the task into smaller parts. Keeping in mind the GI questions, some guiding questions my group thought of using the 5W1H question frame to guide our investigation are:
Graded Task
What is the quality of water in a
waterway or water body? How do
human activities affect the quality of
water in a waterway or water
body?
What?
Where?How?
8
With the GI question in mind, our group agreed on the following two guiding questions. These guiding questions are selected as we consider them to be most relevant to our understanding of the GI question and they will guide us in our investigation.
1. ……………………………………………………………………………………………………………………………………………………
……………………………………………………………………………………………………………………………………………………
2. ……………………………………………………………………………………………………………………………………………………
……………………………………………………………………………………………………………………………………………………
MARKS FOR GROUP UNDERSTANDING OF GI
QUESTION4
Graded Task
9
STAGE 2: GATHER AND SELECT DATA
Gather secondary data through library and online research Based on the guiding questions agreed by your group, you will need to conduct library and online research to find out the information available that would help you to conduct your GI in a particular waterway or water body that your teacher is bringing you to.
As a group, discuss how your group plans to allocate the research amongst yourselves. Record the plan in your group log. Proceed to carry out research in your respective areas individually and consolidate a group research addressing the guiding questions.
The research is found in Annex D.
a) Individual research (4 marks)
For the individual research, members of your group will need to discuss and agree on who does research on which guiding question or area. Use the Question, Answer, Details, Source (QUADS) template below when doing your research.
Graded Task

10
Guiding QUestion or area of research:
Answer:
Details:
Sources or Bibliography:
Based on your preliminary research using the QUADS template, next summarise the answer and details to the guiding question or area of research in the space (within 1 page) provided below. Remember to do this in your own words.
11
MARK FOR INDIVIDUAL
RESEARCH4
b) Group research (6 marks)
Based on the individual research done by members, produce a collated group research in the space provided below. The group research should provide comprehensive information to address the guiding questions.
Individual contributions:Name Guiding question or Area of research
(i) Explain how water quality is measured and the acceptable range for use by humans and to support aquatic fishes.
Graded Task

12
(ii) Describe how human activities (e.g., by individuals, industries and government agencies) affect the quality of Singapore’s waterways and water bodies.
Graded Task
13
Self-check:Did you rewrite the information in your own words? Did you remember to provide references to the materials you consulted?
(iii) Bibliography
MARK FOR GROUPRESEARCH 6

14
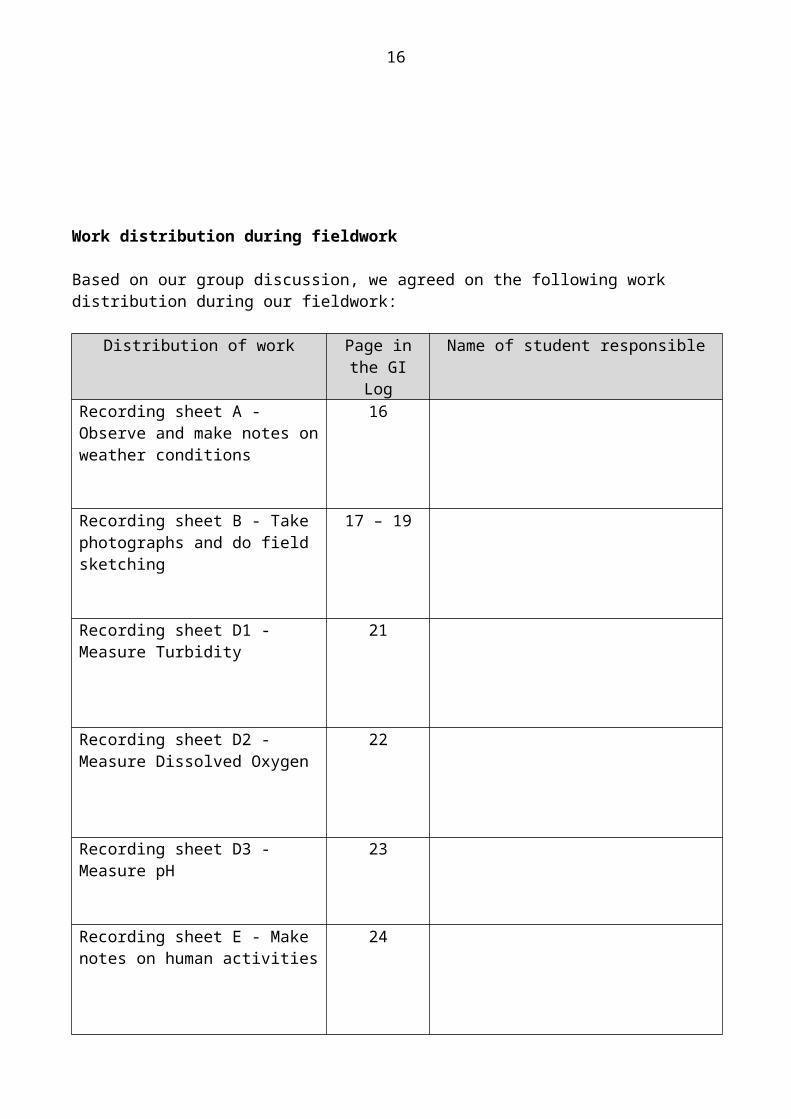
Work distribution during fieldwork
Based on our group discussion, we agreed on the following work distribution during our fieldwork:
Distribution of work Page in the GI Log
Name of student responsible
Recording sheet A - Observe and make notes on weather conditions
16
Recording sheet B - Take photographs and do field sketching
17 – 19
Recording sheet D1 - Measure Turbidity
21
Recording sheet D2 - Measure Dissolved Oxygen
22
Recording sheet D3 - Measure pH 23
Recording sheet E - Make notes on human activities
24
15
Gathering primary data through fieldwork
In this section, your group will need to carry out a series of activities to collect primary data to help you answer the GI question. Your group will need to do the following:
i. Use the water test kits to gather data on the turbidity, dissolved oxygen and pH of the water;
ii. Draw a field sketch of your given field site; iii. Take photographs; and iv. Observe and record the human activities taking place.
A series of recording sheets are designed to help you to record the required data from the field. Use these recording sheets when you are conducting your fieldwork and make use of the data gathered to complete your group’s end product later.
Before you set off for the field site, your group would need to ensure that you have brought along the following materials:
i. Geographical Investigation Logii. Camera iii. Cap iv. Mosquito repellent (if applicable)v. Poncho or umbrellavi. Sun block (if applicable)
vii. Water bottle
At the field site, gather in your groups and do the following:i. Listen to a briefing by your teacher (Tuning into the environment and safety
reminders – Refer to Annex C)ii. Collect fieldwork equipmentiii. Conduct fieldwork activities
At the end of the fieldwork, ensure that you have completed the following before you leave the field site:
i. Complete the recording sheetsii. Return all fieldwork equipmentiii. Complete the reflection exercise worksheet
16
a) Map of the waterway
Name of field site: ______________________________________________
In the box below, paste/draw a map showing the area where your group will collect primary data. Indicate with a letter ‘X’ the site where your group will be gathering data.
Recording Sheet A

17
Briefly describe the weather conditions (e.g., temperature, rainfall and wind) on the actual day of fieldwork. How will it affect your investigation?

18
b) Field Sketching
Draw a field sketch of your group’s field site in the box below. You may refer to p18 – p19 for tips on field sketching.
Recording Sheet B

19
Sketching
Field sketching and field photography are fundamental parts of any field work investigation. It is a simple qualitative technique which, done correctly, will support the data collected and enhance the whole study.
The essence of all fieldwork is to observe, record and interpret what you see around you. Field sketching helps you look closely at the inter-related elements of an environment to decide which are more important than others.
Photo of a field site
1. Identify the focus and purpose of your sketch.
2. Create a title for your sketch.
3. Draw a clear outline box.
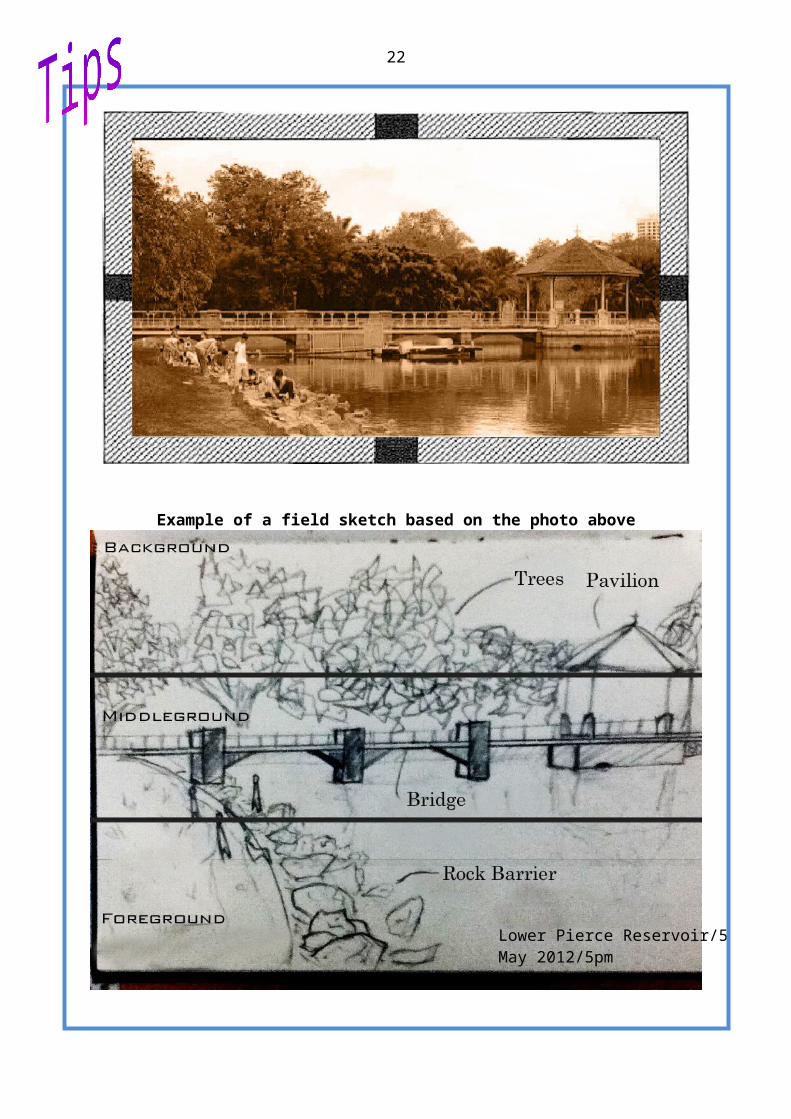
4. Divide your frame into equal horizontal sections (i.e., foreground, middle ground, and background) and equal vertical sections (i.e., left, centre and right)
5. Keeping the purpose in mind, identify relevant details to be included in the sketch.
6. Begin your sketch with the furthest frame (i.e., background) down to the nearest frame (i.e., foreground).
7. Always label and/or annotate on your sketch. Refer to p26 which shows the difference between labelling and annotating.
8. When drawing your sketch, consider scale by taking note of prominent objects or features.
9. In your sketch, note the location, direction, date and time. Such information can be useful for comparison purposes at the same site in the future.

20
Example of a field sketch based on the photo above
Lower Pierce Reservoir/5 May 2012/5pm

21
Sampling
IntroductionIn this investigation, it is not possible to measure all the water in the waterway or water body. So we need to decide on the field site to collect samples of water that we want to gather the data from. A selection or also known as sampling method will thus need to be used to help us determine the field sites to collect water samples. The aim is to be able to use the results obtained from the water samples to make conclusions about the quality of water in the waterway or water body on a particular date and time. Random sampling refers to collecting data at random or irregular intervals. In this GI, it could mean collecting water from field sites at irregular distances along a waterway or water body or wherever a canal joins the waterway or water body.
Systematic sampling refers to collecting data at regular intervals. In this GI, it could mean collecting water from field sites at every 15 meters along a waterway or water body.
Each method has its advantages and disadvantages. Can you think of one advantage and one disadvantage for each method? Jot down your answer in the table below.
Method Advantage Disadvantage
Random sampling
Systematic sampling
You can refer to your textbook for more information.
Our class decided to use the _____________________ sampling method.
Recording Sheet C
Recording Sheet D1
22
c) Water Quality Indicators
For each indicator of water quality, you have to write down the following: steps to measure it precautions taken to ensure accuracy of readings calculation of the average of three readings
i) Turbidity
Definition: The amount of solid particles that are suspended in water and that cause light rays shining through the water to scatter. Thus, turbidity makes the water cloudy or even opaque in extreme cases.Importance:Murkiness can give some clues to what may be in the water. There may be dissolved pollutants or bacteria. However, murky water does not necessarily mean there is pollution.
Steps for measuring turbidity:
Precautions taken to ensure accuracy of readings:
Data CollectionLocation A Location B Location C

23
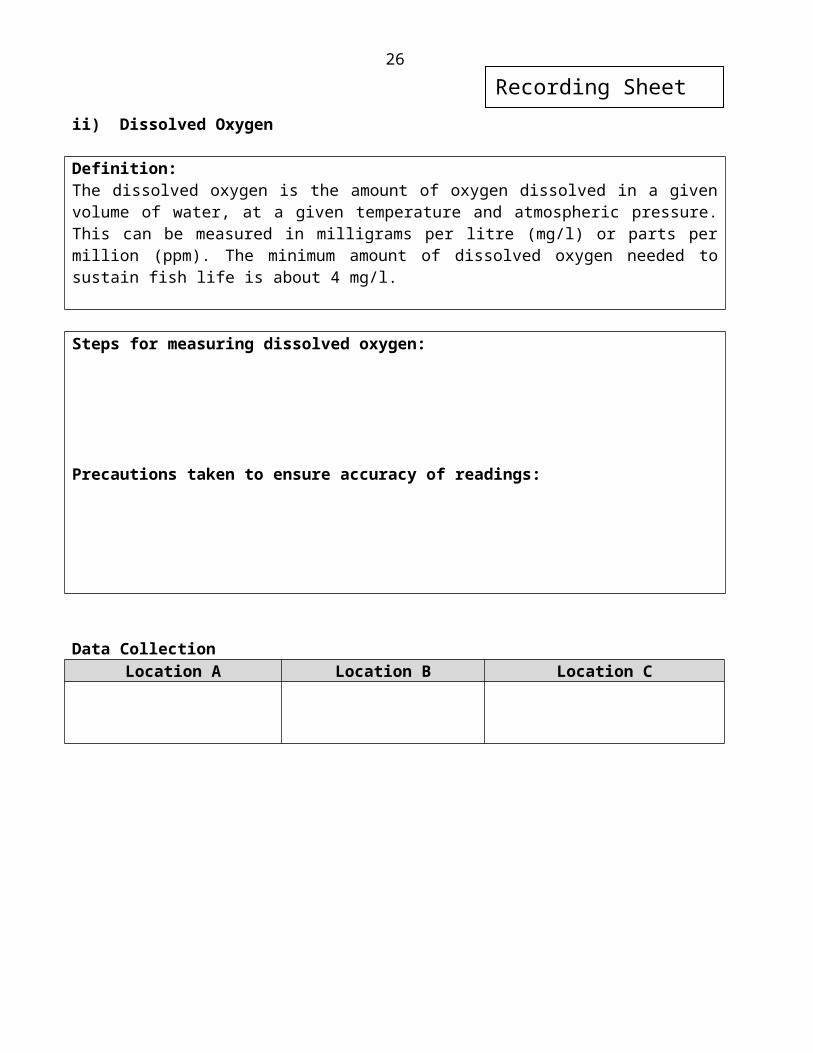
ii) Dissolved Oxygen
Definition:The dissolved oxygen is the amount of oxygen dissolved in a given volume of water, at a given temperature and atmospheric pressure. This can be measured in milligrams per litre (mg/l) or parts per million (ppm). The minimum amount of dissolved oxygen needed to sustain fish life is about 4 mg/l.
Steps for measuring dissolved oxygen:
Precautions taken to ensure accuracy of readings:
Data CollectionLocation A Location B Location C
Recording Sheet D2

24
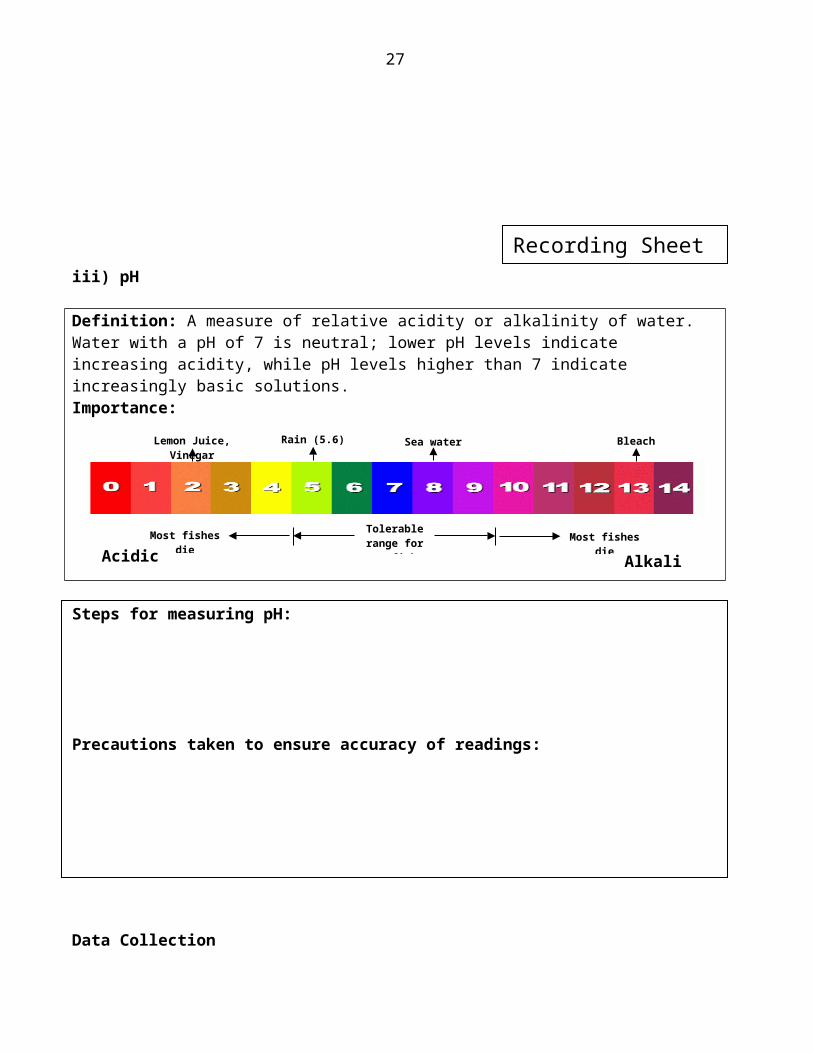
iii) pH Definition: A measure of relative acidity or alkalinity of water. Water with a pH of 7 is neutral; lower pH levels indicate increasing acidity, while pH levels higher than 7 indicate increasingly basic solutions.Importance:
Steps for measuring pH:
Precautions taken to ensure accuracy of readings:
Data CollectionLocation A Location B Location C
Recording Sheet D3
Acidic Alkaline
Tolerable range for
most fishesMost fishes
dieMost fishes
die
Lemon Juice, Vinegar
BleachSea waterRain (5.6)

25
d) Observation of Human Activities
i. What are the human activities that you observe at this site? How would the activities affect the water quality?
ii. What are other possible sources (which may not be observable during your fieldwork) that may affect water quality? How does it affect water quality?
iii. Are there measures (e.g., presence of netting to trap rubbish, etc.) to ensure that the quality of water would be able to support aquatic fishes as well as meet the needs of humans?
Recording Sheet E
26
STAGE 3: ANALYSE DATA
3.1 Interpret, analyse and represent data gathered
Welcome back to class! After measuring the water quality, doing field sketching and taking photographs of the waterway or water body, your group will have to start analysing the data collected from your given fieldwork site.
An important question to ask yourself and each other is: How does the data we have collected help us to answer the GI questions of ‘What is the quality of water in a waterway or water body? How do human activities affect the quality of water in a waterway or water body?'
Based on the data collected, your group will need to interpret and analyse the average reading obtained for each indicator. Together, with reference to your notes for human activities, photographs and field sketches, write a summary on what is observed and explanation on various indicators of water quality and human activities at your given site.
For each water indicator (i.e., turbidity, dissolved oxygen and pH), you could use the following questions to guide you in the analysis of your group data: What is the average reading? What does this reading tell you about the turbidity or dissolved oxygen or pH of water in the
waterway or water body? Is the reading within the acceptable range for use by humans and able to support aquatic
fishes? Does this reading agree with or contradict your online research? What does the reading tell you about the water quality at this field site along the waterway
or water body?
Turbidity
Dissolved Oxygen
pH
Recording Sheet H
27
Human ActivitiesYou could use the following questions to guide you in the analysis of your group data: What are the observed effects of human activities on the water quality in the waterway or
water body? What other human activities are likely to be carried out near this waterway or water body at
other times of the day and on weekends? How do these human activities affect the water quality?
Do these human activities differ from those that you found in your online research? If so, what are the possible effects of these human activities on water quality?

28
STAGE 4: CONSTRUCT GROUP RESPONSE
4.1 Construct a group response to the GI questions
Based on your group’s analysis in Stage 3, construct a group conclusion to the GI questions.
Group’s conclusion to the GI questions on ‘What is the quality of water in a waterway or water body? How do human activities affect the quality of water in a waterway or water body?'
After your group has reached a conclusion, use the information in Recording Sheets A to I of this log to produce your group’s end product.
Recording Sheet I
29
STAGE 5: PRESENT GROUP END PRODUCT
5.1 Group end product presentation
For your group end product, create a multimedia presentation to present your findings (10 marks). Follow the steps below to create your group’s presentation. The three components of your GI will be marked using rubrics shown in Annex A on p30-31 of your GI logs. The rubrics show you the qualities your work should have. Please refer to the rubrics for guidance when completing your GI tasks.
1. Go to http://padlet.com 2. Sign up ONE Padlet account either using your Broadrick email or one of your group
member’s email.BRD email: Go to http://www.broadricksec.moe.edu.sg > Google Mail > Username: [email protected] (uppercase) Password: nric (lowercase)
3. Go to MODIFY THIS WALL>ADDRESS> Name your wall GI2014_YourGroupName
4. **OUR PADLET WALL URL IS: _________________________**5. Please look at http://padlet.com/wall/GI2014_GROUPZ to help you design your padlet
walls.6. Create these headings (refer to Annex B) on your padlet wall:
Water Quality Observation of Human Activities
Group Conclusion
Group members
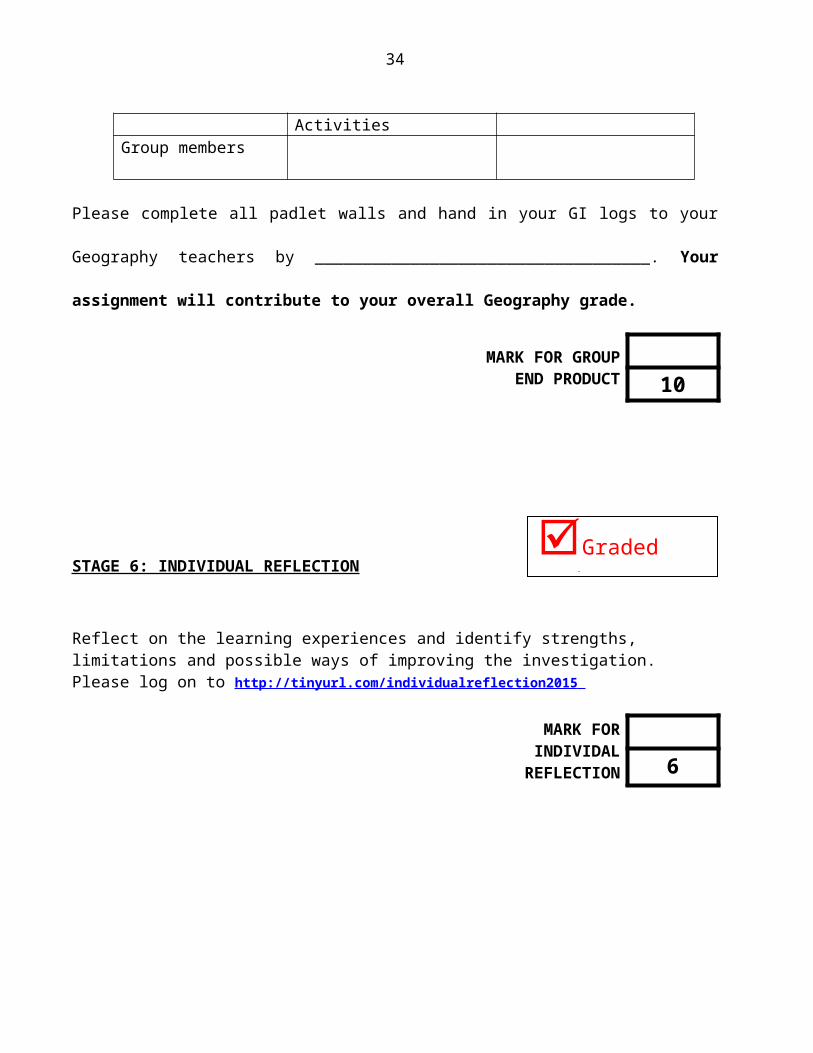
Please complete all padlet walls and hand in your GI logs to your Geography teachers by
___________________________________. Your assignment will contribute to your overall
Geography grade.
MARK FOR GROUP END
PRODUCT 10
Graded Task

30
STAGE 6: INDIVIDUAL REFLECTION
Reflect on the learning experiences and identify strengths, limitations and possible ways of improving the investigation. Please log on to http://tinyurl.com/individualreflection2015
MARK FOR INDIVIDAL
REFLECTION 6
Annex A: GI Scoring Rubric
Graded Task

31
Students should be able to:Exceeding
ExpectationMeeting
ExpectationApproaching Expectation
Below Expectation
GR
OU
P C
ON
TRIB
UTI
ON
(10
MA
RK
S) Understand the GI
question Ask guiding questions
that are relevant to the GI questions
4 marksShows an understanding of the GI questions and provides clear evidence of this ability by being able to ask guiding questions that are relevant to the GI questions.
2 marksShows partial understanding of the GI questions and requires more monitoring and guidance from the teacher to ask guiding questions that are relevant to the GI questions.
Knowledge Explain how water
quality is measured and the acceptable range for use by humans and to support aquatic fishes.
Describe how human activities (e.g., by individuals, industries, and government) affect the quality of Singapore’s water resources
5-6 marksClear and detailed description and explanation, provides a comprehensive coverage of terms, concepts and related issues.
3-4 marksClear description and explanation, provides a complete coverage of terms, concepts and related issues.
2 marksSomewhat clear description and explanation, provides a partial coverage of terms, concepts and related issues.
1 markUnclear and inadequate description and explanation, provides a limited coverage of terms, concepts and related issues.
GR
OU
P E
ND
PR
OD
UC
T(1
0 M
AR
KS
) Exercising Reasoning Organise and present
data meaningfully using maps, tables and graphs.
Draw comparisons and identify relationships in order to arrive at reasoned conclusions.
9-10 marksUses a wide range of methods, effectively presents findings succinctly and persuasively.
Conclusions are well supported by the analysis of findings and the aims of the investigation are fully achieved.
6-8 marksUses a range of appropriate methods, presents findings in a clear and easy to understand manner.
Conclusions are largely drawn from the analysis of findings and relate to the aims of the investigation.
3-5 marksUses a limited range of methods, presents different findings in similar ways.
Conclusions are based on the findings to some extent and generally relate to the aims of the investigation.
1-2 marksUses a limited range and inappropriate methods, shows findings crudely and without much thought.
Conclusions are largely not drawn from the analysis of findings and generally do not relate to the aims of the investigation.
32
IND
IVID
UA
L C
ON
TRIB
UTI
ON
(10
MA
RK
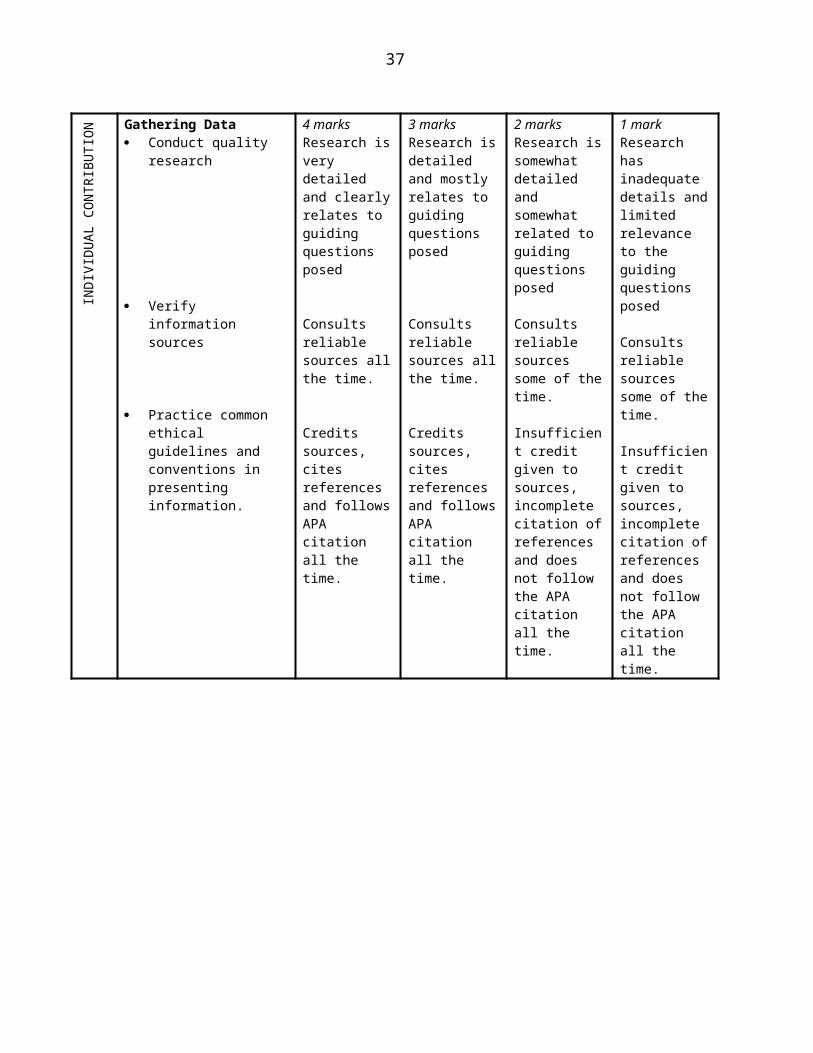
S) Gathering Data
Conduct quality research
Verify information sources
Practice common ethical guidelines and conventions in presenting information.
4 marksResearch is very detailed and clearly relates to guiding questions posed
Consults reliable sources all the time.
Credits sources, cites references and follows APA citation all the time.
3 marksResearch is detailed and mostly relates to guiding questions posed
Consults reliable sources all the time.
Credits sources, cites references and follows APA citation all the time.
2 marksResearch is somewhat detailed and somewhat related to guiding questions posed
Consults reliable sources some of the time.
Insufficient credit given to sources, incomplete citation of references and does not follow the APA citation all the time.
1 markResearch has inadequate details and limited relevance to the guiding questions posed
Consults reliable sources some of the time.
Insufficient credit given to sources, incomplete citation of references and does not follow the APA citation all the time.
Exercising Reasoning Draws conclusions and
connections between class and group findings.
Reflective Thinking Describes the strengths
of the investigation Describes the
limitations of the findings and suggests ways to improve the investigation
5-6 marksConclusions and connections drawn are well supported by the analysis of the class and group findings.
Describes and explains more than one key strength and limitation of the investigation and suggests effective ways to improve the investigation.
3-4 marksConclusions and connections drawn are largely supported by the analysis of the class and group findings.
Describes at least one key strength and one key limitation of the investigation and suggests at least one possible way to improve the investigation.
2 marksConclusions and connections drawn are to some extent supported by the analysis of the class and group findings.
Describes at least one key strength or one key limitation of the investigation, and suggests at least one possible way or made no suggestions to improve the investigation.
1 markConclusions and connections drawn are largely not supported by the analysis of the class and group findings.
Describes at least one key strength or one key limitation of the investigation or suggests at least one possible way or made no suggestions to improve the investigation.

33
Annex B1: Suggested Group Roles
Roles Duties
Group Facilitator
Keeps group members focused on the topic of the discussion or on task.
Leads discussion on the distribution of work and responsibilities and ensures that every group member is in agreement.
Encourages all group members to participate actively in discussions, Monitors that work is done by all,
Helps to manage any disagreement between group members.
Recorder Secretary(2 members)
Takes notes of the group discussions and the decisions made. Helps each group member keep track of progress in the GI by
recording down what is to be done by each group member, and by when.
Helps the teacher by providing a summary of each group member and the group's current progress when asked to do so.
Resource Representative
Takes charge of, and maintains backup copies of all materials given by the teacher, such as GI Logs, consent forms, etc.
Takes charge of, and maintains backup copies of all the resources and research information gathered by every group member.
Collects and returns all equipment borrowed.
Checker
Checks that all group members understand the ideas discussed and made by the group.
Checks the content of the end-product, the bibliography, the use of data, etc., for accuracy, spelling, grammar, etc.
Checks the quality of GI end product by checking against the rubrics provided.
Note: For successful completion of GI, all group members are to contribute to the GI task and take part in discussions actively. Everyone should contribute to the group’s constructive discussions by asking questions to help the group discuss and better understand the issues.
34
Annex B2: Behaviours for Effective Group Work
a. In Discussions
Keep the discussion directly related to the topic.
Be clear about task given.
Remind members to question ideas produced, and not the members.
Be clear about what is to be covered during the discussion.
b. Assignment of tasks
Distribute work fairly and according to the strengths of members.
Get members to decide on deadlines together.
Keep to the time-frame/schedule.
Check that all members carry out the specific tasks assigned to them.
c. Disagreements/Conflicts
Encourage members to work towards an agreement when they have differences.
Get members to brainstorm ways to resolve conflict.
d. When members talk about something not related to work
“Could we please come back to the discussion?”
“We need your input about this.”
“What do you think about this idea?”
e. When members do not keep to the schedule
“What ideas do you need from us to complete this piece of work?”
“When will you be able to get this completed?”
f. When members do not agree with one another
“Can we each share our views and see how we can come to an agreement?”
“Let us list the points and see how we can come to an agreement.”
g. When members hand in contributions that are unsatisfactory/below expectations
“What improvements can we make?”
“Our group can do better if we try harder by doing…”

35
Annex B3: Useful Questions for Effective Group Discussions Questions to seek clarification
“What do you mean by…?”
“Could you say it in a simpler way?”
“Could you give me an example of what you just said?”
“Can you explain this in detail?”
“Could you tell us more about this?”
“Why do you say…?”
Questions to seek evidence
“How did you find out or know that…?”
“What are the most important points?”
“How is your example linked to…?”
“Do we need more evidence?”
Questions to probe assumptions and trigger further thinking
“Have we thought about…?”
“What assumptions are we making?”
“Can we look at things from another point of view?”
Questions to probe consequences
“What are the consequences of…?”
“What are the long-term effects of what is being suggested?”

36
Annex C: Safety Guidelines and Conduct During Fieldwork
Prior to fieldwork 1. Ensure that you are familiar with the fieldwork techniques:
Use of water testing kit Field sketching Photo-taking and annotation of photos
2. Please let your teacher know if you are not feeling well prior to leaving for the field site and at any point during the conduct of the fieldwork.
3. Things to bring: Paper and writing materials Camera Cap Mosquito repellent Poncho or umbrella Sunblock Water bottle
4. Attire: Either in PE T-shirt with shorts/skirts or school uniform5. Travel with minimal belongings and DO NOT bring any unnecessary valuables to the field
site.6. Bring along a plastic cover for your recording sheet in case of a sudden downpour. 7. Ensure that you have keyed the numbers of the teacher and Allied Educators (AED) into
your handphone.
During the fieldwork 1. Be considerate towards the members of public who are using the site i.e. avoid blocking
pathways.2. Be focused and work at collecting the data.3. Drink water regularly.4. Handle the field equipment with care.5. In case of injuries, alert the teacher or AED immediately. Call them if they are not within
sight. Stay at the site until the teacher arrives. 6. In the event of bad weather, seek shelter in the area designated by the teacher at the start
of the fieldwork. 7. Keep noise level low.8. Keep to the time allocated to the tasks.9. Stay away from the water bodies.10. When conducting the fieldwork, leave your belongings at a spot that is within sight.
Source: Royal Geographical Society with IBG, Fieldwork Safety, http://www.rgs.org/OurWork/Schools/Fieldwork+and+local+learning/Fieldwork+safety/Fieldwork+safety.htm
37
Annex D – Research
1. Water Quality Indicators
pH - A measure of relative acidity or alkalinity of water. Water with a pH of 7 is neutral; lower pH levels indicate increasing acidity, while pH levels higher than 7 indicate increasingly basic solutions.
Turbidity - The amount of solid particles that are suspended in water and that cause light rays shining through the water to scatter. Thus, turbidity makes the water cloudy or even opaque in extreme cases. Turbidity can be measured in many ways and represented by different units of measure. Formazin Turbidity Unit (FTU) is identical to the Nephelometric Turbidity Unit (NTU). The other two methods used to test for turbidity and their measurement units are the Jackson Turbidity Unit (JTU) and the Silica unit (mg/l SiO2) U).
Dissolved Oxygen (DO) – Amount of oxygen gas dissolved in a given quantity of water at a given temperature and atmospheric pressure. It is usually expressed as a concentration in parts per million or as a percentage of saturation.
pH - Most aquatic animals prefer a pH range of 6.5 to 8.0. They are adapted to a specific pH level and may die, stop reproducing or move away if the pH of the water goes beyond this range. Low pH can also allow toxic compounds to become more available to aquatic plants and animals. Water with low pH can also corrode pipes in drinking water distribution systems. Also, water with a pH below 5 is too acidic and above 9 is too basic for human consumption.
Turbidity affects fishes which need clear water to spot their prey. Particles or sediments can smother fish eggs and suffocate clams and oysters. They also decrease light penetration and inhibit photosynthesis by aquatic plants.
Dissolved Oxygen is important to the health of aquatic animals. All aquatic animals need oxygen to survive. Natural waters with consistently high dissolved oxygen levels are capable of supporting a wide range of aquatic organisms.
(Source: Project WET Foundation, 2011)
Pre-field work data on Water Quality Indicatorswww.monitorWater.org
Singapore Green Planhttp://eresources.nlb.gov.sg/infopedia/articles/SIP_1370_2008-11-22.html
Dry Spell: Enough water, but conservation still vitalhttp://wildsingaporenews.blogspot.sg/2010/03/dry-spell-enough-water-but-conservation.html

38
Four national taps provide water for allhttp://www.pub.gov.sg/water/pages/default.aspx
Geography, Waterhttp://www.slideshare.net/guest266d7b/geographywater-presentation
Water Quality Monitoringhttp://waterqualityinsingapore.blogspot.sg/
The Singapore water storyhttp://publ.gov.sg/water/Pages/singaporewaterstory.asp
Water Pollution Controlhttp://app2.nea.gov.sg/anti-pollution-radiation-protection/water-pollution-control
Water Qualityhttp://www.nea.gov.sg/cms/ccird/pg_24_33.pdf
Effects of human activities on the interaction of Ground water and surface water http://pubs.usgs.gov/circ/circ1139/pdf/part2.pdf
How can human activities affect water resources?http://www.greenfacts.org/en/water-resources/l-3/4-effect-human-actions.htm
A focus on water quality solutionshttp://www.unep.org/PDF/Clearing_the_Waters.pdf