· web viewsee the texas state board of professional geoscientists’ web page at for...
TRANSCRIPT

Texas Commission on Environmental Quality
Texas Risk Reduction Program
Instructions for Completing an Affected Property Assessment Report
PurposeThe purpose of this document is to provide a standard format for the Affected Property Assessment Report (APAR).
Regulatory Citation30 TAC §350.91
Abbreviations and Acronyms
TCEQ-10325/APAR June 2005 1

BAF – bioaccumulation factorBCF – bioconcentration factorBSAFs - biota-sediment accumulation factorsbgs – below ground surfaceCAPM – corrective action project managerCAS No. – Chemical Abstract Service registry numberC/I – commercial/industrialCOC - chemical of concernCP – compliance planDCRP – Dry Cleaner Remediation ProgramDNAPL – dense non-aqueous phase liquidsDUS – data usability summaryeco - ecologicalEPA – Environmental Protection Agencyft. – feetGW – groundwaterGWBU – groundwater-bearing unitHW – hazardous wasteID – identificationLNAPL – light non-aqueous phase liquidsLPST – leaking petroleum storage tankMC - mail code for TCEQ mail routingMCL – maximum contaminant levelMDL – method detection limitmg/kg – milligrams per kilogrammg/L – milligrams per literMQL – method quantitation limitMSD – municipal settings designationMSW – municipal solid wasteMW – monitor wellNAF – natural attenuation factorNAICS - North American Industry Classification SystemNAPL – non-aqueous phase liquidsND – not detected/nondetectNFA – no further actionNOR – notice of registrationNOV – notice of violationOSHA - Occupational Safety and Health AdministrationPCBs – polychlorinated biphenylsPCL – protective concentration levelPCLE – protective concentration level exceedancePOE – point of exposurePST – Petroleum Storage TankQA/QC - quality assurance/quality controlRAL – residential assessment levelRBEL – risk-based exposure limitRCAS – registered corrective action specialistRCRA – Resource Conservation and Recovery Actsed - sedimentSLERA – screening-level ecological risk assessmentSOP – standard operating procedureSQL - sample quantitation limitSSERA – site-specific ecological risk assessmentSTEERS - State of Texas Environmental Electronic
Reporting System
SVOCs – semi-volatile organic compoundsSW – surface waterSWMU - solid waste management unitSWR - solid waste registrationTAC - Texas Administrative CodeTDS – total dissolved solidsTPDES – Texas Pollutant Discharge Elimination SystemTSCA – Toxic Substances Control ActTRRP – Texas Risk Reduction ProgramUSGS - United States Geological SurveyVOCs – volatile organic compoundsVCP – Voluntary Cleanup Program
TCEQ-10325/APAR June 2005 2

General InstructionsWhen is an APAR required?
An APAR is required when a person is addressing a release of COCs under 30 TAC Chapter 350, the Texas Risk Reduction Program (TRRP). The requirement for an APAR may not be applicable to:
A release of COCs that is regulated under 30 TAC Chapter 327 (relating to Spill Prevention and Control) unless the response action can not be completed within 180 days or the person chooses to respond to the spill under TRRP;
A release of COCs that is regulated under a rule, permit or enforcement order with other reporting requirements;
Unit closures when no release is documented (refer to TRRP Compatibility with RCRA (RG-366/TRRP-3) for guidance on closure requirements);
A release that is not subject to TRRP pursuant to the criteria described in the October 21, 2003 TCEQ document Determining Which Releases are Subject to TRRP available at http://www.tnrcc.state.tx.us/permitting/trrp.htm; or
Areas that are approved Facility Operations Areas (FOA) under Subchapter G, Chapter 350.
What is the purpose of the APAR?
The purpose of the APAR is to document all relevant affected property information to identify all release sources and COCs, determine the extent of all COCs, identify all transport/exposure pathways, and to determine if any response actions are necessary. All data collected as part of the assessment should be reported. Justify conclusions with supporting documentation. Refer to the definition of affected property in §350.4(a)(1) and the requirements of §350.91(b). Do not limit the information to just the data gathered in the latest round of assessment or field work. Text, data, results, and conclusions must take into account all information that is known about the affected property. Refer to the TRRP rule and applicable guidance documents for requirements and information on assessments.
The APAR is organized into a standardized format to expedite TCEQ review, to help guide the person in providing all pertinent information, and minimize the need for additional assessment or notices of deficiencies.
When do I submit the APAR?
Submit the APAR upon completion of the assessment. Discuss extenuating circumstances that prevent the completion of the assessment with the TCEQ project manager or program before submitting an incomplete APAR.
How do I submit the APAR?
Submit the signed and sealed APAR to the applicable TCEQ program area in the Austin central office and submit a copy of the transmittal letter to the appropriate TCEQ region office. Check with the program area or the applicable permit or order as to the number of copies to submit. Find the mailing address and phone number for each region office at http://www.tceq.state.tx.us/about/directory/region/reglist.html. The address for the central office is:TCEQ, [specify program area], MC- , P.O. Box 13087, Austin, Texas 78711-3087
TCEQ-10325/APAR June 2005 3

How do I obtain more information?Information on the Texas Risk Reduction Program is available at http://www.tnrcc.state.tx.us/permitting/trrp.htm. The APAR instructions are not a guidance document and do not provide the information needed to conduct an assessment. Read the TRRP rule, applicable TRRP guidance documents, and other information on the TRRP web page prior to conducting the assessment. The TRRP guidance documents (RG-366 series) include:
TRRP-1 Introduction to the Texas Risk Reduction ProgramTRRP-2 TRRP Applicability and Grandfathering (revised December 2003)TRRP-3 TRRP Compatibility with RCRATRRP-4 Comparison of 30 TAC 335 and 30 TAC 350: Points to Consider in Making the Shift
TRRP-4A Comparison of 30 TAC 334 and 30 TAC 350: Regulation of LPST Sites under TRRPTRRP-6 Planning and Assessment SurveysTRRP-7 Land Use ClassificationTRRP-8 Groundwater ClassificationTRRP-10 Selecting Target Chemicals of ConcernTRRP-11 Data Needs for Tiered PCL DevelopmentTRRP-12 Affected Property Assessment Requirements
TRRP-12A NAPL AssessmentTRRP-13 Review and Reporting of COC Concentration Data TRRP-14 Screening Target Chemicals of Concern from PCL DevelopmentTRRP-15 Determining Representative ConcentrationsTRRP-16 Institutional ControlsTRRP-17 Notification RequirementsTRRP-18 Risk Levels, Hazard Indices, and Cumulative AdjustmentsTRRP-19 Toxicity Factors and Chemical/Physical ParametersTRRP-21 Human Health Points of ExposureTRRP-22 Tiered Development of Human Health PCLsTRRP-23 Tier 1 PCL TablesTRRP-24 Determining PCLs for Surface Water and Sediment
Companion documents: Sediment PCL table Surface Water RBELs tablesTRRP-25 Critical PCLsTRRP-26 Application of Tier 1 and 2 NAF ModelsTRRP-27 Development of Human Health PCLs for Total Petroleum Hydrocarbon MixturesTRRP-28 Application of Remedy Standards A and BTRRP-29 Soil and Groundwater Response ObjectivesTRRP-30 Compliance Sampling and MonitoringTRRP-31 Evaluating Remedy EffectivenessTRRP-32 Risk-Based NAPL ManagementTRRP-33 Monitored Natural Attenuation DemonstrationsTRRP-34 Facility Operations AreasRG-263 Guidance for Conducting Ecological Risk Assessments at Remediation Sites in Texas
In the future, check the TRRP guidance and forms web page http://www.tnrcc.state.tx.us/permitting/remed/techsupp/guidance.htm for documents not available at the time of this printing.
Address questions regarding the affected property to the program area that is handling your case. Phone numbers and mail codes (MC) for the TCEQ programs are listed below.
Corrective Action Section 512/239-2343 MC-127Municipal Solid Waste Permits 512/239-2334 MC-124Petroleum Storage Tank / Responsible Party Remediation Section 512/239-2200 MC-137Site Assessment and Management 512/239-2120 MC-136Superfund Cleanup Section 512/239-2486 MC-143
TCEQ-10325/APAR June 2005 4

Voluntary Cleanup Section 512/239-5891 MC-221
TCEQ-10325/APAR June 2005 5

How do I complete the APAR?
Download an electronic version of the APAR from the TRRP guidance and forms web page at http://www.tnrcc.state.tx.us/permitting/remed/techsupp/guidance.htm. This APAR format is a text-based report along with tables and figures to represent data in the most suitable way possible. Follow these instructions to ensure that all applicable information is included in the report and reduce potential deficiencies. Submit the Table of Contents as a checklist for report completeness, cover page, professional signatures and seals page, executive summary, conclusions, chronology, specialized submittal checklist, and Sections 1 through 4 in every report. Submit Sections 5 through 13 and related appendices as applicable to the affected property discussed in the report. Place the provided tables within the text-based report. Do not submit a section, table, or appendix that does not apply to the affected property. Do not include the instructions in the submitted report.
Report Organization and FormattingProvide, at a minimum, the requested information in a text-based report supported by the specified tables and figures. Add additional discussions as necessary to explain site-specific situations. Arrange the sections, tables, figures, and appendices in the order specified in the APAR Table of Contents and include the section and subsection titles as headings in the report. Print as much of the report as possible on double-sided paper, particularly the text and laboratory reports. Some figures, tables, and appendices do not have prescribed formats. Place tabs in the bound report to clearly identify each major section included in the report.
Reporting Multiple Affected Properties in One APARAn assessment may include activities on more than one affected property. Submit a separate report for each affected property, or include more than one affected property in one report. When submitting a report on more than one affected property, repeat the executive summary, figures, and tables, along with the appropriate text sections. Clearly identify the affected properties to which the information applies.
Documentation and ReferencesSupport data with references and documentation. Unsubstantiated information may be considered invalid. Explain assumptions made and how those assumptions are either conservative or appropriate for the affected property. Clearly label and include references in Appendix 16.
Maps and FiguresAll maps and cross sections must be drawn to scale and must be legible. Use of 8.5 x 11-inch or 11 x 17-inch paper is encouraged. Minimize the use of oversized paper unless necessary. Determine a scale and paper size that is appropriate for the information required and ensure that the data are legible. Center the affected property on each map as appropriate to illustrate the required information. Label relevant site features such as roads, intersections, property boundaries, landmarks, water bodies, etc. to orient the reader. Always include a legend that identifies the symbols used in the maps and figures, a north arrow, fraction and bar scales (including vertical scale for cross sections), and map source.
For affected properties with multiple COCs, a group of related COCs may be presented in a logical manner on one map as long as the information remains legible. One COC may be used to represent a group of COCs that exhibit the same chemical and physical properties and originated from the same source, as long as the lateral and vertical extent of the representative COC is greater than the other COCs in the group. Be sure to identify which COCs are represented.
Use color as appropriate in maps, tables, and figures, but make sure that the information is still legible when photocopied in grayscale.
TCEQ-10325/APAR June 2005 6

TablesReview the instructions for each table to determine the information required. Format the tables as prescribed in this document. Add additional related information to the tables or provide additional tables if needed. If a format is not prescribed, arrange the table to best illustrate the data. If there are exposure pathways applicable to the affected property other than those listed in the assessment level tables (Sections 4 and 5) and critical PCL tables (Sections 6, 7, 11, and 12), add columns to the tables as necessary to include the additional exposure pathways in the evaluation. Highlight the concentrations and SQLs that exceed the residential assessment level or the critical PCL as applicable to the table.
Use the chemical names as listed in the Tier 1 PCL tables and use those names throughout the report. Do not use abbreviations for COC names (e.g., perc). Use the most recent Tier 1 PCL tables for PCLs and other information. Provide the CAS number for each COC not listed in the Tier 1 tables. List the COCs into chemical classes or by analysis type, such as metals, VOCs, SVOCs, pesticides, and PCBs. Clearly identify the affected property to which the table applies and include appropriate units of measure for the data.
If the result was non-detect (do not write "ND") or not quantifiable, specify the concentration as less than the maximum SQL value for that sample (for example, <0.01 mg/kg). Include in the data summary tables the data qualifiers or flags assigned during the data review and identified in the Data Usability Summary (DUS) (see Review and Reporting of COC Concentration Data (RG-366/TRRP-13)).
Complete the prescribed tables provided here by typing in the table’s cells. A separate APAR Tables file is also provided at the TRRP guidance and forms web page (http://www.tnrcc.state.tx.us/permitting/remed/techsupp/guidance.htm) with the tables formatted with checkboxes and dropdown lists.
PhotographsProvide photographs in Sections 2 and 6 as requested. Submit other photographs in Appendix 13 as needed. If submittal of the requested photographs is a concern for Homeland Security, state such fact in the requested sections and do not submit the requested photographs.
APAR Table of Contents
Submit the Table of Contents to indicate the sections, figures, and tables included in the report.
Cover Page
Submit the Cover Page to provide identifying information on the affected property and the person. Specify the primary program identification (ID) number assigned to the on-site property by the program area to which the APAR is being submitted (this is not the Customer Reference number (CN) or the Regulated Entity number (RN) as used on the agency’s core data form). If the primary program ID number is not known, contact the appropriate program area to obtain that number before submitting this report.
On-Site Property InformationProvide information regarding the physical location of the on-site property. Specify the complete street address, including the street predirectional, which is the compass direction of the street address that occurs before the street name (example: North), and the street postdirectional, which is
TCEQ-10325/APAR June 2005 7

the compass direction of the street address that occurs after the street name (example: West). Specify the county code and the TCEQ Region in which the affected property is located (refer to the list of county codes and TCEQ Region numbers at the end of the instructions). Specify the nearest street intersection or location description. For example, a location description may be: “On FM 1055, 1 mile south of the intersection of FM 1055 and US Highway 57" or “On Main Street at the northwest corner of Main Street and Oak Street.” Specify in decimal degrees the latitude and longitude near the center of the on-site property. Refer to the TCEQ document Attribute Standards for TCEQ Geographic Locational Data and the TCEQ policies 8.11 and 8.12, available on the agency’s web page at http://www.tnrcc.state.tx.us/gis/gisplcy.html.
Contact Person for On-Site Property Information and AcknowledgmentProvide information about the person performing the response action (not the consultant). Refer to the definition of “person” in §350.4. The person should review the acknowledgment carefully and must sign and date the report. The consultant is not allowed to sign this report for the person.
Professional Signatures and Seals
A professional geoscientist (P.G.), or a professional engineer (P.E.) when allowed by law, must sign and seal the APAR on the Professional Signatures and Seals page. See the Texas State Board of Professional Geoscientists’ web page at http://www.tbpg.state.tx.us/ for information on geoscientist registration and requirements for sealing reports that contain geoscience. Refer to the Remediation Division’s policy on returning unsealed reports at http://www.tnrcc.state.tx.us/permitting/trrp.htm.
Leaking PST sites must also be signed (seal not required) by a registered Corrective Action Specialist (RCAS) and Corrective Action Project Manager (CAPM). Note that the RCAS/CAPM signatures are required only for LPST sites, and the Professional Geoscientist and RCAS/CAPMs can be the same person. Professional Engineers and Professional Geoscientists may sign in place of RCAS/CAPMs if they have applied for this reciprocal arrangement and have been approved by the TCEQ.
Executive Summary
Provide the information requested to summarize the major points of the report.
Conclusions
Use this section to discuss the conclusions of the assessment. Summarize the results of the assessment, activities conducted to date, and discuss in general the plan of action based on the assessment results.
Chronology
Attach a chronology, listed in chronological order beginning with the most recent activity, of events associated with this assessment and previous abatement, assessment, and remedial activities conducted at the affected property. Include the date of actions taken and a brief description of release abatement activities, assessment activities, and response actions conducted.
Specialized Submittals Checklist
TCEQ-10325/APAR June 2005 8

The purpose of this form is to identify, up front, specific information included in the APAR which may potentially require the TCEQ project manager to involve other agency resources to complete the review. Identifying such submittals helps the TCEQ expedite the review process.
TCEQ-10325/APAR June 2005 9

County Codes and TCEQ Region NumbersCounty County
CodeRegion
No.County Code Reg
No.County Code Reg
No.County Code Reg
No.County Code Reg.
No.County Code Reg
No.Anderson 1 5 Comal 46 13 Grayson 91 4 Kinney 136 16 Orange 181 10 Tom Green 226 8Andrews 2 7 Comanche 47 3 Gregg 92 5 Kleberg 137 14 Palo Pinto 182 4 Travis 227 11Angelina 3 10 Concho 48 8 Grimes 93 9 Knox 138 3 Panola 183 5 Trinity 228 10Aransas 4 14 Cooke 49 4 Guadalupe 94 13 Lamar 139 5 Parker 184 4 Tyler 229 10Archer 5 3 Coryell 50 9 Hale 95 2 Lamb 140 2 Parmer 185 1 Upshur 230 5Armstrong 6 1 Cottle 51 3 Hall 96 1 Lampasas 141 9 Pecos 186 7 Upton 231 7Atascosa 7 13 Crane 52 7 Hamilton 97 9 La Salle 142 16 Polk 187 10 Uvalde 232 13Austin 8 12 Crockett 53 8 Hansford 98 1 Lavaca 143 14 Potter 188 1 Val Verde 233 16Bailey 9 2 Crosby 54 2 Hardeman 99 3 Lee 144 11 Presidio 189 6 Van Zandt 234 5Bandera 10 13 Culberson 55 6 Hardin 100 10 Leon 145 9 Rains 190 5 Victoria 235 14Bastrop 11 11 Dallam 56 1 Harris 101 12 Liberty 146 12 Randall 191 1 Walker 236 12Baylor 12 3 Dallas 57 4 Harrison 102 5 Limestone 147 9 Reagan 192 8 Waller 237 12Bee 13 14 Dawson 58 7 Hartley 103 1 Lipscomb 148 1 Real 193 13 Ward 238 7Bell 14 9 Deaf Smith 59 1 Haskell 104 3 Live Oak 149 14 Red River 194 5 Washington 239 9Bexar 15 13 Delta 60 5 Hays 105 11 Llano 150 11 Reeves 195 7 Webb 240 16Blanco 16 11 Denton 61 4 Hemphill 106 1 Loving 151 7 Refugio 196 14 Wharton 241 12Borden 17 7 DeWitt 62 14 Henderson 107 5 Lubbock 152 2 Roberts 197 1 Wheeler 242 1Bosque 18 9 Dickens 63 2 Hidalgo 108 15 Lynn 153 2 Robertson 198 9 Wichita 243 3Bowie 19 5 Dimmit 64 16 Hill 109 9 McCulloch 154 8 Rockwall 199 4 Wilbarger 244 3Brazoria 20 12 Donley 65 1 Hockley 110 2 McLennan 155 9 Runnels 200 3 Willacy 245 15Brazos 21 9 Duval 66 16 Hood 111 4 McMullen 156 16 Rusk 201 5 Williamson 246 11Brewster 22 6 Eastland 67 3 Hopkins 112 5 Madison 157 9 Sabine 202 10 Wilson 247 13Briscoe 23 1 Ector 68 7 Houston 113 10 Marion 158 5 San Augustine 203 10 Winkler 248 7Brooks 24 15 Edwards 69 13 Howard 114 7 Martin 159 7 San Jacinto 204 10 Wise 249 4Brown 25 3 Ellis 70 4 Hudspeth 115 6 Mason 160 8 San Patricio 205 14 Wood 250 5Burleson 26 9 El Paso 71 6 Hunt 116 4 Matagorda 161 12 San Saba 206 9 Yoakum 251 2Burnet 27 11 Erath 72 4 Hutchinson 117 1 Maverick 162 16 Schleicher 207 8 Young 252 3Caldwell 28 11 Falls 73 9 Irion 118 8 Medina 163 13 Scurry 208 3 Zapata 253 16Calhoun 29 14 Fannin 74 4 Jack 119 3 Menard 164 8 Shackelford 209 3 Zavala 254 16Callahan 30 3 Fayette 75 11 Jackson 120 14 Midland 165 7 Shelby 210 10Cameron 31 15 Fisher 76 3 Jasper 121 10 Milam 166 9 Sherman 211 1Camp 32 5 Floyd 77 2 Jeff Davis 122 6 Mills 167 9 Smith 212 5Carson 33 1 Foard 78 3 Jefferson 123 10 Mitchell 168 3 Somervell 213 4Cass 34 5 Fort Bend 79 12 Jim Hogg 124 15 Montague 169 3 Starr 214 15Castro 35 1 Franklin 80 5 Jim Wells 125 14 Montgomery 170 12 Stephens 215 3Chambers 36 12 Freestone 81 9 Johnson 126 4 Moore 171 1 Sterling 216 8Cherokee 37 5 Frio 82 13 Jones 127 3 Morris 172 5 Stonewall 217 3Childress 38 1 Gaines 83 7 Karnes 128 13 Motley 173 2 Sutton 218 8Clay 39 3 Galveston 84 12 Kaufman 129 4 Nacogdoches 174 10 Swisher 219 1Cochran 40 2 Garza 85 2 Kendall 130 13 Navarro 175 4 Tarrant 220 4Coke 41 8 Gillespie 86 13 Kenedy 131 15 Newton 176 10 Taylor 221 3Coleman 42 3 Glasscock 87 7 Kent 132 3 Nolan 177 3 Terrell 222 7Collin 43 4 Goliad 88 14 Kerr 133 13 Nueces 178 14 Terry 223 2Collingsworth 44 1 Gonzales 89 14 Kimble 134 8 Ochiltree 179 1 Throckmorton 224 3Colorado 45 12 Gray 90 1 King 135 2 Oldham 180 1 Titus 225 5
TCEQ-10325/APAR June 2005 10

APAR Table of Contents1 Check if included
Cover PageProfessional Signatures and SealsExecutive SummaryConclusions and RecommendationsChronology* Specialized Submittals Checklist
Section 1 Property InformationDiscussion of site operations, release sources, and geology/hydrogeologyTable 1A - Sources of ReleaseTable 1B - Potential Off-Site SourcesFigure 1A - On-Site Property Map*Figure 1B - Affected Property Map*Figure 1C - Regional Geologic Map*Figure 1D - Regional Geologic Cross Section(s)*
Section 2 Exposure Pathways and Groundwater Resource ClassificationDiscussion of potential receptors, groundwater classification, and exposure pathwaysTable 2A - Water Well SummaryTable 2B - Affected Water Well SummaryTable 2C - Complete or Reasonably Anticipated to be Complete Exposure PathwaysFigure 2A - Potential Receptors Map*Figure 2B - Field Survey Photographs*Figure 2C - Water Well Map*Attachment 2A - Tier 1 Ecological Exclusion Criteria ChecklistAttachment 2B - Tier 1 Ecological Exclusion Criteria Supporting Documentation*
Section 3 Assessment StrategyDiscussion of assessment strategiesTable 3A. Underground Utilities
Section 4 Soil AssessmentDiscussion of nature and extent of COCs in soilTable 4A - Surface Soil Residential Assessment Levels with no Ecological ComponentTable 4B - Surface Soil Residential Assessment Levels with Ecological ComponentTable 4C - Subsurface Soil Residential Assessment LevelsTable 4D - Soil Data Summary*Table 4E - Soil Geochemical/Geotechnical Data Summary*Figure 4A - Surface Soil COC Concentration Maps*Figure 4B - Subsurface Soil COC Concentration Maps*Figure 4C - Cross Sections*
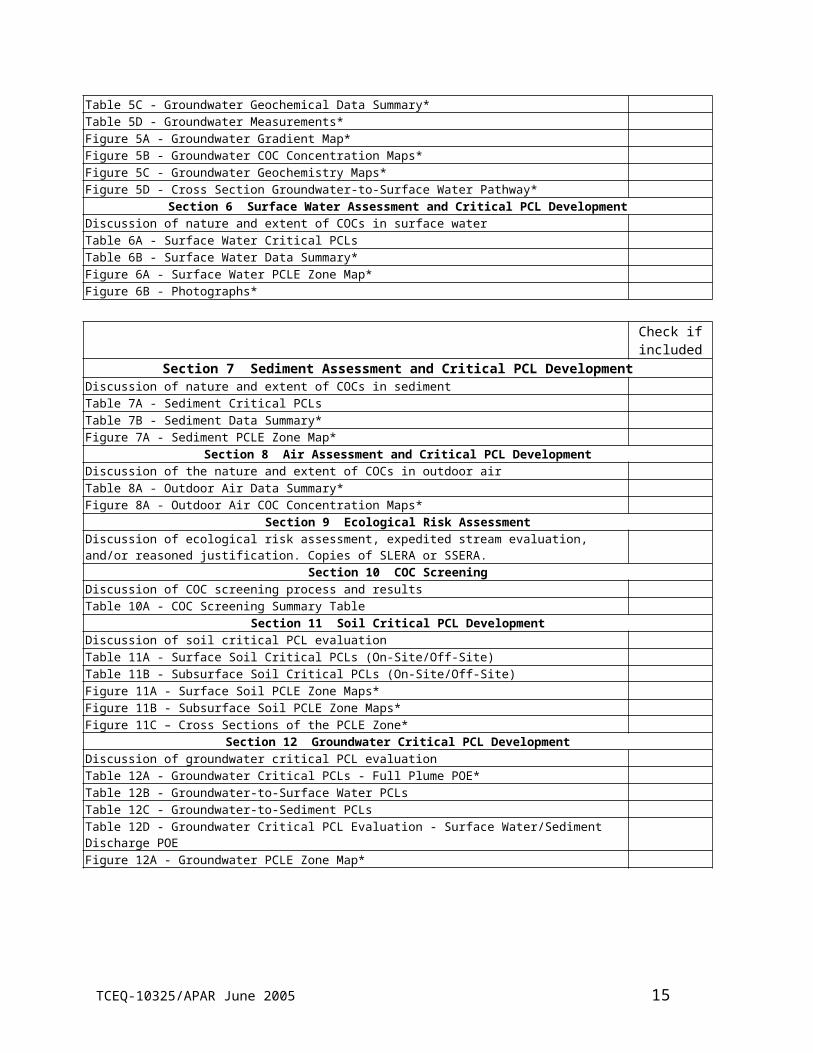
Section 5 Groundwater AssessmentDiscussion of nature and extent of COCs in groundwaterTable 5A - Groundwater Residential Assessment LevelsTable 5B - Groundwater Data Summary*Table 5C - Groundwater Geochemical Data Summary*Table 5D - Groundwater Measurements*Figure 5A - Groundwater Gradient Map*Figure 5B - Groundwater COC Concentration Maps*Figure 5C - Groundwater Geochemistry Maps*Figure 5D - Cross Section Groundwater-to-Surface Water Pathway*
Section 6 Surface Water Assessment and Critical PCL DevelopmentDiscussion of nature and extent of COCs in surface waterTable 6A - Surface Water Critical PCLsTable 6B - Surface Water Data Summary*Figure 6A - Surface Water PCLE Zone Map*Figure 6B - Photographs*
1 Items marked with an asterisk do not have prescribed formats (for example, laboratory reports).
TCEQ-10325/APAR June 2005 11

Check if included
Section 7 Sediment Assessment and Critical PCL DevelopmentDiscussion of nature and extent of COCs in sedimentTable 7A - Sediment Critical PCLsTable 7B - Sediment Data Summary*Figure 7A - Sediment PCLE Zone Map*
Section 8 Air Assessment and Critical PCL DevelopmentDiscussion of the nature and extent of COCs in outdoor air Table 8A - Outdoor Air Data Summary*Figure 8A - Outdoor Air COC Concentration Maps*
Section 9 Ecological Risk AssessmentDiscussion of ecological risk assessment, expedited stream evaluation, and/or reasoned justification. Copies of SLERA or SSERA.
Section 10 COC ScreeningDiscussion of COC screening process and resultsTable 10A - COC Screening Summary Table
Section 11 Soil Critical PCL DevelopmentDiscussion of soil critical PCL evaluationTable 11A - Surface Soil Critical PCLs (On-Site/Off-Site)Table 11B - Subsurface Soil Critical PCLs (On-Site/Off-Site)Figure 11A - Surface Soil PCLE Zone Maps*Figure 11B - Subsurface Soil PCLE Zone Maps*Figure 11C – Cross Sections of the PCLE Zone*
Section 12 Groundwater Critical PCL DevelopmentDiscussion of groundwater critical PCL evaluationTable 12A - Groundwater Critical PCLs - Full Plume POE*Table 12B - Groundwater-to-Surface Water PCLsTable 12C - Groundwater-to-Sediment PCLsTable 12D - Groundwater Critical PCL Evaluation - Surface Water/Sediment Discharge POEFigure 12A - Groundwater PCLE Zone Map*
Section 13 NotificationsDiscussion of notifications conductedTable 13A - Notification SummaryFigure 13A - Notification Map*
AppendicesAppendix 1 Notifications*Appendix 2 Boring Logs and Monitor Well Completion Details*Appendix 3 Monitor Well Development and Purging Data*Appendix 4 Registration and Institutional Controls*Appendix 5 Water Well Records*Appendix 6 Monitor Well Records*Appendix 7 Aquifer Testing Data*Appendix 8 Statistics Data Tables and Calculations*Appendix 9 Development of Non-Default RBELs and PCLs*Error: Reference source not found*Appendix 11 Miscellaneous Assessment*Appendix 12 Waste Characterization and Disposition Documentation*Appendix 13 Photographic Documentation*Appendix 14 Standard Operating Procedures*Appendix 15 OSHA Health and Safety Plan (§350.74(b)(1))*Appendix 16 Reference List*
TCEQ-10325/APAR June 2005 12

Cover PageProgram ID No. (primary): Report date:TCEQ Region No.: MSD Certificate No.:Additional Program ID Numbers.: SWR/Facility ID No.: PST Facility ID No.:DCRP ID No.: VCP ID No.: LPST ID No.:MSW Tracking No.: HW Permit/CP No.: Enforcement ID No.:Other ID Nos.:
Reason for submittal (check all that apply): Notice of Deficiency Letter Enforcement/Agreed orderInitial submittal Permit/Compliance Plan Directive/NOV letterRevision Voluntary response Other:
On-Site Property InformationOn-Site Property (Facility) Name:Street no. Pre dir: Street name: Street type: Post dir:City: County: County Code ZipNearest street intersection and location description:
Latitude: Decimal Degrees (indicate one) NorthLongitude: Decimal Degrees (indicate one) West
Contact Person for On-Site Property Information and AcknowledgmentCompany Name or Person:Contact Name: Title:Mailing Address:City: State: Zip: Phone:Email: Fax:Person is: property owner property manager potential purchaser tenant operator
other
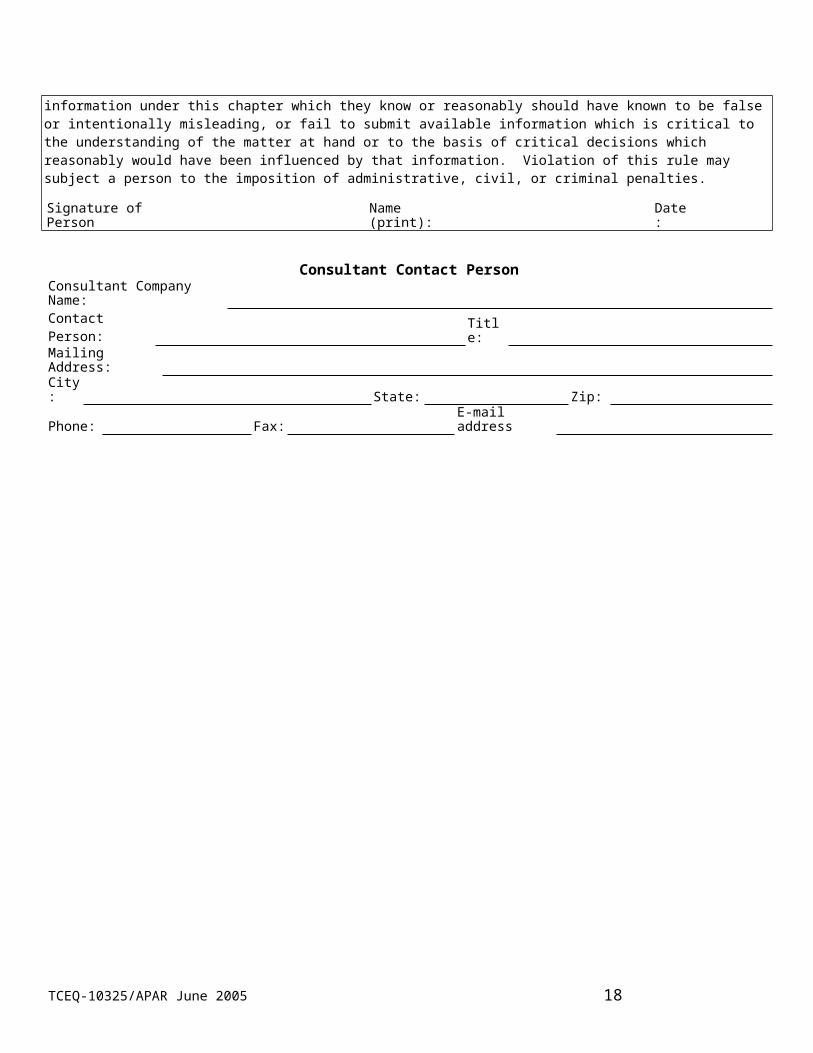
By my signature below, I acknowledge the requirement of §350.2(a) that no person shall submit information to the executive director or to parties who are required to be provided information under this chapter which they know or reasonably should have known to be false or intentionally misleading, or fail to submit available information which is critical to the understanding of the matter at hand or to the basis of critical decisions which reasonably would have been influenced by that information. Violation of this rule may subject a person to the imposition of administrative, civil, or criminal penalties.
Signature of Person Name (print): Date:
Consultant Contact Person Consultant Company Name:Contact Person: Title:Mailing Address:City: State: Zip:Phone: Fax: E-mail address
TCEQ-10325/APAR June 2005 13

Professional Signatures and Seals
Professional Geoscientist
Professional Geoscientist Geoscientist License number Expiration date
Signature Date
Telephone number FAX number E-mail
Professional Engineer
Professional Engineer P.E. License number Expiration date
Signature Date
Telephone number FAX number E-mail
Registered Corrective Action Specialists (RCASs) and Corrective Action Project Managers (CAPMs) For LPST sites only.
Registered Corrective Action Specialist RCAS Registration number Expiration date
Signature Date
Corrective Action Project Manager CAPM Registration number Expiration date
Signature Date
Telephone number FAX number E-mailSeals, as applicable:
TCEQ-10325/APAR June 2005 14
Executive Summary
Environmental Media
Actual or Probable Exposures On-Site?
Actual or Probable Exposures Off-Site?
Have notifications for actual or probable exposures been completed?
(§350.55(e))Yes No Yes No Yes No N/A
SoilGroundwaterSedimentSurface Water
Is there, or has there been, an affected or potentially affected water well? Yes NoIf yes, what is the well used for?
Actual land use: On-site: Res C/I Off-site affected property: Res C/I N/ALand use for critical PCL determination: On-site: Res C/I Off-site affected property: Res C/I N/ADid the affected property pass the Tier 1 ecological exclusion criteria checklist? Yes No
Affected groundwater-bearing unit(s) (in order from depth below ground surface), or uppermost groundwater-bearing unit if none affected
Unit No. Name Depth below ground surface (ft) Resource Classification (1, 2, or 3)
123
AssessmentEnvironmental
MediaAssessment Levels Exceeded? Affected property
defined to RAL?Is COC
extent stable or
expanding?
General classes of
COCs (VOCs SVOCs,
metals, etc.)
On-Site? Off-Site?
Yes No Notsampled Yes No Not
sampledYes No N/A
Soil SurfaceSubsurface
GroundwaterSedimentSurface Water
TCEQ-10325/APAR June 2005 15

NAPL Occurrence MatrixNAPL Occurrence Description
NAPL invadose zone
No NAPL in vadose zone There is no direct or indirect evidence of NAPL in the vadose zone
NAPL in/on soil NAPL detected in or on unsaturated, unconsolidated clay-, silt-, sand-, and/or gravel-dominated soils
NAPL in fractured clay NAPL detected in fractures of unsaturated fine-grained soils
NAPL in fractured or porous rock NAPL detected in unsaturated lithologic material NAPL in karst NAPL detected in karst environment
NAPL atcapillary
fringe
No NAPL at capillary fringe There is no direct or indirect evidence of NAPL at the capillary fringe
NAPL at capillary fringe NAPL detected at vadose-saturated zone transition, capillary fringe (in contact with water table)
NAPL in saturated
zone
No NAPL in saturated zone There is no direct or indirect evidence of NAPL in the saturated zone
NAPL in soil NAPL detected in saturated unconsolidated clay-, silt-, sand-, and/or gravel-dominated soils
NAPL in fractured clay NAPL detected in fractures of saturated fine-grained soil or other double-porosity sediments
NAPL in saturated fractured or porous rock NAPL detected in saturated lithologic material
NAPL in saturated karst NAPL detected in karst environment within the saturated zone
NAPL in surface water or sediment
No NAPL in surface water or sediment
There is no direct or indirect evidence of NAPL in surface water or sediments
NAPL in surface water NAPL detected in surface water at exceedance concentration levels or visual observation
NAPL in sedimentsNAPL detected in sediments at exceedance concentration levels or visual observation via migration pathway or a direct release
Remedy DecisionEnvironmental Media Critical PCL
exceeded on-site?
Critical PCL exceeded off-
site?
PCLE zones defined?
General class (VOCs, SVOCs, metals, etc.)
of COCs requiring remedy
Yes No N/A Yes No N/A Yes No N/ASoil Surface
SubsurfaceGroundwaterSedimentSurface Water
TCEQ-10325/APAR June 2005 16

NAPL Triggers
NAPL Response Action Triggers Description of Triggers
No NAPL response action triggersNo NAPL triggers have been observed in any assessment zones (vadose, capillary fringe and saturated), nor in surface water or sediments
NAPL vapor accumulation is explosive
NAPL vapors accumulate in buildings, utility and other conduits, other existing structures, or within anticipated construction areas at levels that are potentially explosive (≥ 25% LEL)
NAPL zone expanding NAPL zone is observed to be expanding using time-series data
Mobile NAPL in vadose zone NAPL zone is observably mobile, or is theoretically mobile based on COC concentrations and residual saturation
NAPL creating an aesthetic impact or causing nuisance condition
NAPL is responsible for objectionable characteristics (e.g., taste, odor, color, etc.) resulting in making a natural resource or soil unfit for intended use
NAPL in contact with Class 1 groundwater
NAPL has come in actual contact with saturated zone or capillary fringe of a Class 1 GWBU
NAPL in contact with Class 2 or 3 groundwater
NAPL has come in actual contact with saturated zone or capillary fringe of a Class 2 or Class 3 GWBU
NAPL in contact with surface waterLiquid containing COC concentrations that exceed the aqueous solubility in contact with surface water via various migration pathways or direct release to surface water
NAPL in or on sedimentsLiquid containing COC concentrations that exceed the aqueous solubility impact surface water sediments via migration pathway or a direct release
TCEQ-10325/APAR June 2005 17
Conclusions and RecommendationsUse this section to summarize the major activities conducted, results, and conclusions of the assessment and to briefly discuss the recommended response actions.
Assessment ResultsDiscuss the conclusions of the assessment. Identify the affected environmental media, and identify the media for which a response action is necessary or for which a response action has already been completed. Describe the affected or potentially affected receptors.
NAPL DiscussionDiscuss the conclusions of the NAPL assessment. Describe the presence or absence of NAPL in environmental media based on direct and indirect evidence. If there is direct or indirect evidence of NAPL, discuss the response action trigger applicable to the affected property. Refer to Risk-Based NAPL Management (RG-366/TRRP-32) and NAPL Assessment (RG-366/TRRP-12A) for information on NAPL management and assessment, respectively.
Response Actions and RecommendationsDescribe response actions completed or underway. In order to focus direction and provide context to the assessment results, discuss general (not detailed) recommended response actions or other activities that could influence site conditions or that relate to the release and resulting contamination to be conducted at the affected property. If known, specify if planning a Remedy Standard A or Remedy Standard B.
Figure A - Affected Property and PCLE Zone MapUse this map to illustrate the overall affected property and the overall PCLE zone. Illustrate the maximum extent of the affected property in environmental media, and illustrate in a different manner the maximum extent of the PCLE zone for environmental media. Identify areas where NAPL is present based on direct or indirect evidence. Sampling locations are not required to be provided on this map.
TCEQ-10325/APAR June 2005 18

Specialized Submittals ChecklistCheck here if no specialized submittals in this report
If included, specify section
or appendix
Ecological Risk Assessment
Reasoned justification, expedited stream evaluation, Tier 2 or 3 ecological risk assessment, and/or proposal for ecological services analysis
Statistics
Calculated site-specific background concentrations
Used alternate statistical methods to determine proxy values for non-detected results (§350.51(n))
Calculated representative concentrations (§350.79(2)) for remedy decision
Analytical Issues
Used SQL for assessment or critical PCL instead of the MQL (§350.51(d)(1)) or PCL (§350.79)
The MQL of the analytical method exceeds assessment levels/critical PCLs (§350.54(e)(3))
Human Health/Toxicology
Variance to exposure factors approved by TCEQ Executive Director1 (§350.74(j)(2))
Developed PCLs based on alternate exposure areas
Evaluated non-standard exposure pathway (e.g., agricultural, contact recreation, etc)
Combined exposure pathways across media for simultaneously exposed populations (§350.71(j))
Adjusted PCLs due to residual saturation, cumulative risk, hazard index, aesthetic concerns, or theoretical soil vapor
Utilized non-default human health RBELs to calculate PCLs (includes use of non-default parameters, toxicity factors not published in rule, etc.) (§350.51(l), §350.73, §350.74)
Calculated Tier 2 or 3 RBELs/PCLs or TSCA levels for polychlorinated biphenyls, or calculated Tier 2 or 3 RBELS/PCLs for cadmium, lead, dibenzo-p-dioxins, dibenzofurans, and/or polycyclic aromatic hydrocarbons
Calculated Tier 1, 2, or 3 total petroleum hydrocarbon (TPH) PCLs
Developed sediment/surface water human health RBELs and PCLs
Fate and Transport
Used or developed groundwater to surface water dilution factors
Calculated Tier 2 PCL
Calculated Tier 3 PCL
Groundwater Issues
Conducted aquifer test, classified Class 3 groundwater, or determined non-groundwater bearing unit (saturated soil)
1 Prior approval by Executive Director is required.
TCEQ-10325/APAR June 2005 19
Section 1 Property InformationUse this section to describe the environmental setting, the geology/hydrogeology of the area, general operational history for the property, the affected property, and sources of releases.
Section 1.1 Physical Location
Property Location and Land UseIdentify the name of the facility and the physical address or location of the property. Provide the name of the property owner, the size of the on-site property and the general land use of the surrounding area.
TopographyDescribe how the topography affects COC distribution at the affected property. Discuss ground slope direction and grade, water bodies, and other significant topographic features. Identify whether the site is within the 100-year floodplain.
WeatherDiscuss the effect of recent extreme weather conditions, such as droughts or floods, and seasonal variations on COC transport and distribution.
Section 1.2 Affected Property and Sources of Release
History and OperationsDescribe past, current, and if known, planned future operations at the on-site property back to initial commercial or industrial development, including times it may have been vacant. For each different use of the property, include a description of the type of business or facility and associated NAICS codes, the dates of operation, description of business process and/or the primary products used, stored, or manufactured, and wastes generated, stored, or disposed on-site.
Project OverviewIdentify the affected property(ies) included in this report. For each affected property, discuss why the investigation was conducted and describe the events that led up to the initiation of the assessment. Describe when and how the release occurred, how the release was discovered, and previous assessment, abatement, and response actions taken at the affected property.
If other on-site sources are contributing to this affected property but are being addressed under a separate assessment, briefly describe the nature of the release and how it is being addressed.
If the subject property is a VCP site, discuss the potential sources of COCs identified during the required Phase I environmental site assessment. Discuss potential contribution of COCs from off-site source(s) and briefly describe the off-site facilities that could be a source of COCs at the affected property, including the type of potential source and type of COCs.
Section 1.3 Geology/Hydrogeology
Describe the regional geology and hydrogeology from the ground surface to the base of the principal regional water supply aquifer, or the most significant groundwater-bearing unit in use near or at the affected property, whichever is deeper. Discuss the significant formations, aquifers,
TCEQ-10325/APAR June 2005 20

aquitards, and structural influences. Relate the regional geology/hydrogeology to the geology and hydrogeology of the affected property.
Characterize and describe in detail the site-specific geologic and associated hydrogeologic conditions of the affected property. Describe characteristics which might affect COC transport such as geochemical and geotechnical parameters or geologic features which might serve as preferential pathways or as impedances for horizontal or vertical COC migration. For each unsaturated zone, saturated zone that is not a groundwater-bearing unit, and each groundwater-bearing unit, describe the thickness and the thickness variability across the affected property.
Include the aquifer/formation name, the average depth to groundwater, magnitude and duration of static water level fluctuations, groundwater flow direction and hydraulic conductivity, and chemical properties of the water as known (total dissolved solids [TDS], sulfates, nitrates, pH, etc). Discuss how the characteristics of each groundwater-bearing unit compare to regional characteristics and explain the differences.
TCEQ-10325/APAR June 2005 21

Table 1A - Sources of ReleaseList the sources (for example: landfill, tank, impoundment) being addressed under this assessment which are contributing COCs to each affected property. Use the inputs from the list provided below to complete Table 1A. For each source, provide the type of source, applicable NOR unit or SWMU numbers, substances of potential concern, the size of the source (capacity, area, or volume as applicable), and specify the status of the release source. Indicate whether a release from the source has been confirmed, provide the method of release discovery, and the date the release was discovered. Include the date if the status is “closed.”
Inputs list for Table 1A (do not include this list in the report)Column 1 Column 2 Column 3 Column 4
Types of Potential Sources Substances of Potential Concern Status of Source Method of Release Discovery
Container Acid solution Active Site assessmentContainer storage area Adhesives/epoxy Inactive Spill incidentLandfills Caustic solution Abandoned NAPL discovery
Piping/distribution system Dioxins/furans Closed - specify date closed Water well impact
Spills Explosives Other (specify) Vapor impact
Sump Fertilizer Surface water/sediment impactSurface impoundments/ponds/lagoons Halogenated hydrocarbons Release detection equipment
Tanks Lacquer/varnish Other (specify)
Wash/repair areas MetalsWaste piles Paint/ink/dyes
Waste treatment unit Paint thinner
Waste water treatment unit PCBsOther (specify) Pesticide (herbicide, insecticide)
Petroleum Hydrocarbons (specify): gasoline, aviation gas, jet fuel (type), diesel, lube oil, hydraulic oil, used oil, etc.Radionuclides
Wood preservatives
Other (specify)
TCEQ-10325/APAR June 2005 22

Table 1A. Sources of Release (see input values on preceding page)Affected property
name/number1
Name of potential source2
(supplied by the person)
Type of potential source
(select from Column 1 on
Inputs list)
NOR unit or SWMU
number, if applicable
Substances of potential concern
(select from Column 2 on
Inputs list)
Size of source
(capacity, area, or volume)
Status of source(select from Column 3
on Inputs list)
Was a release from this source confirmed?
(if yes, indicate the discovery method from Column 4 on Inputs
list, and date release was discovered)
Status3: If closed or other, list date
closed or explain:
No Yes Discovery method
Date
1 The name or number is an identification of the affected property assigned by the person. Continue using the name or number identification throughout this report and all other correspondence on the affected property.2 The potential source is the source of the release. The person determines the name given to the potential source. Examples: northwest tank farm, Main Street landfill, etc.3 Specify whether the source status is active, inactive, abandoned, closed, or specify another status as appropriate.
TCEQ-10325/APAR June 2005 23

Table 1B - Potential Off-Site SourcesComplete this table for VCP sites or when alleging contribution from an off-site source. List the off-site facilities (for example, RCRA, PST, LPST, MSW, state and federal superfund sites, and other facility or site) in the vicinity of the affected property that could be a source of COCs at the affected property. For potential off-site sources, specify the name of the facility or site, the physical address, the regulatory identification number, the type of operation/business, and the years of operation (if known).
Table 1B. Potential Off-Site SourcesAffected property
name/number
Off-site facility/site name
Physical address
Regulatory ID number
Type of operation/business
Years of operation(if known)
COCs
Figure 1A - On-Site Property MapInclude a map that illustrates the relevant physical features of the on-site property and immediately adjacent areas. Indicate the locations of legal property boundaries, the locations of areas assessed for this report, land uses, buildings and other structures, roads (include at least one labeled intersection), surface drainage, surface water bodies, and water supply wells.
Figure 1B - Affected Property MapUse this map to illustrate detailed features of each area assessed for this report. This map may suffice for Figure 1B when the scale of the map is adequate to illustrate the necessary physical features of the affected property. Keep in mind however that the affected property may extend across one or more legal property boundaries.
For each area assessed, illustrate relevant features such as the affected property, buildings and other structures, adjacent roads, potential sources and known release areas listed in Tables 1B and 1C, type of surface cover, subsurface utilities, surface drainage, surface water bodies, boring and monitor well locations, sampling locations, cross section lines, and water supply wells.
Figure 1C - Regional Geologic MapInclude an 8 ½ by 11 cutout of the original or a color copy of a published regional geologic map. Center the on-site property on the map, and identify the location of the on-site property. The map scale should be no less than 1:250,000 (as in the Bureau of Economic Geology’s Geologic Atlas maps). If available, use the Bureau of Economic Geology’s Geologic Quadrangle maps.
Figure 1D - Regional Geologic Cross Section(s)Include at least one published geologic cross section (color copy) that illustrates the regional stratigraphy of the area from the surface to the base of the principal regional water supply aquifer or the most significant groundwater-bearing unit in use, whichever is deeper. Label formations, aquitards, and minor and major aquifers. Sources for regional cross sections and stratigraphic columns include, among others, the Bureau of Economic Geology, the Texas Water Development Board, and local geological societies. Indicate the source for the published cross sections in Appendix 16.
Provide a continuous stratigraphic section (not a boring log) from existing literature that describes the regional geologic framework from the surface to the base of the principal regional water supply aquifer (or the most significant groundwater-bearing unit in use near or at the affected property, whichever is deeper). Identify significant formations and aquifers. Use written descriptions and standard symbols to illustrate the lithologies of each formation. Identify and describe the principal formations, aquifers, and aquitards. Indicate the source for the published cross sections in Appendix 16.
TCEQ-10325/APAR June 2005 24

Section 2 Exposure Pathways and Groundwater Resource Classification
Use this section to discuss the actions taken to identify the presence or lack of receptors and the results of the receptor surveys. Completion of these surveys may require considerable research. Reference the primary sources of information (this is not the company who conducts the well search) used in this research in Appendix 16. Note that the survey radii required by §350.51(i) are relative to the affected property, not legal real property boundaries.
Section 2.1 Source(s) of Potable Water for On-Site Property and Affected Off-Site Properties
Identify the source(s) of potable water for each real property within the affected property. Provide the name of the supplier, utility district or well owner, and the distance and direction of the potable water source from the affected property. If the source of potable water is a water well, identify the groundwater production zone and the total well depth. Taking into account the distance to the affected property, the production zone of the water well(s), surface completions, and pumping rates, discuss the potential for impact from affected groundwater. If the potable water source is a surface water body, identify the name of the surface water and segment number if available. Clearly identify the location of the water supply source (well(s) or intake structure(s)) in Figures 2A and 2C when the scale of the map is appropriate to show the locations of the sources.
If groundwater is affected, list the real properties within the 500-foot field receptor survey radius that are not connected to a public water supply.
Identify existing institutional controls (for example, local ordinances or deed restrictions) or certified Municipal Settings Designation (MSD) applicable to the affected property that prevent or restrict the installation of water wells. Provide a copy of the ordinance, deed restriction, and/or a copy of the MSD certificate and a map that illustrates the boundary of the MSD and the affected property in Appendix 4.
Section 2.2 Field Receptor Survey
Provide documentation of the performance of the 500-ft field receptor survey as measured from the boundary of the affected property. Provide a detailed discussion of the actions taken and the specific receptors addressed in the survey. Discuss how the survey was conducted, who conducted the survey, and document the sources of information including the names of people interviewed and the real properties examined.
Section 2.3 Records Survey
Use this section to provide documentation of the performance of a survey of records on receptors available within one-half mile radius of the affected property (this may include both on-site and off-site properties). List the specific primary sources of information used in the records survey (not the company who conducted the search), including individuals and personal interviews, companies, agencies such as the Texas Water Development Board, Texas Department of Licensing and Registration, and TCEQ, published documents, databases, groundwater
TCEQ-10325/APAR June 2005 25

conservation districts, groundwater subsidence districts, and other records of wells. Provide copies of the records survey results in Appendix 5, including copies of water well records, copies of pages from published documents, database reports, and documentation of other results.
Provide a list of sources of information used to complete this section of the report in Appendix 16, and clearly identify the text to which the reference applies.
Section 2.4 Receptor Survey Results
Discuss the results of the receptor surveys and records surveys and identify potential receptors. Include a detailed discussion of the extent of the field receptor survey, observations of the general land use in the area, descriptions of the topography of the surveyed area as it applies to drainage to surface water, the results of the survey, and identify potential receptors noted in the 500-ft field survey. Discuss the presence or lack of intermittent or perennial surface water bodies, drainage ditches, water wells, water meters, water tanks and/or pump houses, windmills, cisterns, and other items that suggest the presence of potential receptors. If the affected property overlies a major or minor aquifer or if there are populated areas within one-half mile with no public water supply, and no water wells were identified in the records survey, explain how the survey was adequate to identify the water wells within the survey area.
Discuss relevant information about potential receptors that relates to the likelihood of the receptor to become affected or serve as an avenue of COC migration. Taking into account the distance to the water well(s), the production zone of the water well(s), surface completions, and pumping rates, discuss the potential connection between affected saturated zones and the water wells and the potential for impact from affected groundwater.
Discuss the depth and flow regime of surface water bodies/drainage ditches, location and status of identified wells, presence of buildings within or near the footprint of the affected property, and a discussion of specific land use or areas of potential ecological concern which result or might result in a completed human health or ecological exposure pathway.
Section 2.5 Groundwater Resource Classification
Identify the groundwater resource classification (Class 1, 2 or 3) of each affected or potentially affected groundwater-bearing unit. For information on groundwater classification, refer to Groundwater Classification (RG-366/TRRP-8). Describe in detail the criteria upon which the groundwater-bearing unit is classified. Provide site-specific documentation, such as results of aquifer tests, recharge observations during the development of monitor wells, analysis of total dissolved solids (TDS), and/or groundwater resource classification at surrounding sites in Appendix 7 to support the classification of each groundwater-bearing unit. If supporting documentation was submitted previously to the TCEQ under a separate cover, provide the date and title of the report.
Section 2.6 Exposure Pathways
Describe current or previous immediate threats of exposure or actual exposure at the affected property. Describe actions taken to identify the threat of exposure or actual exposure, efforts to mitigate the exposure, and describe the actions that will be done to prevent further exposure.
Explain how the potential exposure scenarios were identified. Explain which exposure pathways
TCEQ-10325/APAR June 2005 26

were evaluated and why. If the exposure pathways listed in §350.71(c) or other possible exposure pathways were determined to be incomplete as allowed by rule, provide the data and documentation that support this conclusion, explain how the data were derived, and explain how it was determined that the exposure pathway is incomplete.
Describe factors that affect potential exposures, including the type and extent of surface cover, proximity to surface water bodies and drainages, types and concentrations of COCs, COC migration patterns from both the ground surface and underground, presence of water wells, surface water intakes, usage of nearby surface water, interconnectedness of groundwater and surface water, and other site-specific situations regarding exposure pathways.
TCEQ-10325/APAR June 2005 27

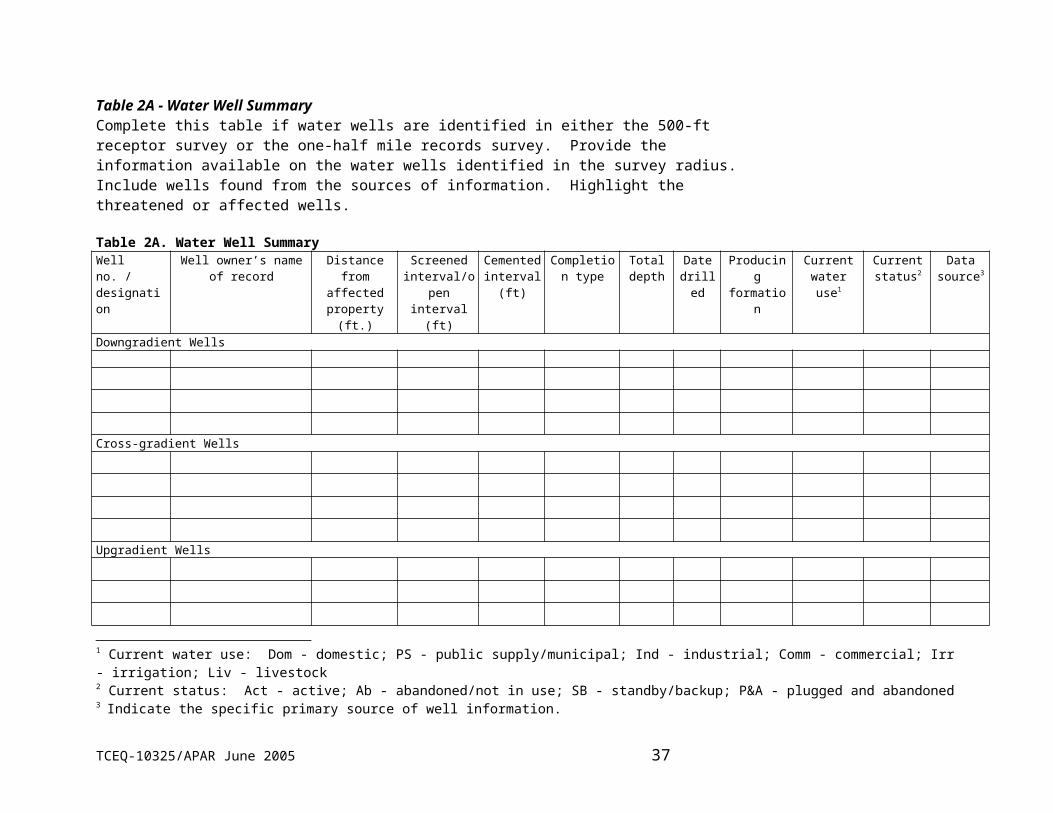
Table 2A - Water Well SummaryComplete this table if water wells are identified in either the 500-ft receptor survey or the one-half mile records survey. Provide the information available on the water wells identified in the survey radius. Include wells found from the sources of information. Highlight the threatened or affected wells.
Table 2A. Water Well SummaryWell no. / designation
Well owner’s name of record
Distance from affected
property (ft.)
Screened interval/open interval (ft)
Cemented interval (ft)
Completion type
Total depth
Date drilled
Producing formation
Current water use1
Current status2
Data source3
Downgradient Wells
Cross-gradient Wells
Upgradient Wells
1 Current water use: Dom - domestic; PS - public supply/municipal; Ind - industrial; Comm - commercial; Irr - irrigation; Liv - livestock2 Current status: Act - active; Ab - abandoned/not in use; SB - standby/backup; P&A - plugged and abandoned3 Indicate the specific primary source of well information.
TCEQ-10325/APAR June 2005 28

Table 2B - Affected Water Well SummaryList the threatened or affected water wells from Table 2A in this table. Provide the owner’s name, telephone number, property address, and name of tenant or easement holder. Document the sources of information used to obtain this information in Appendix 16.
Table 2B. Threatened and Affected Water Well SummaryWell number/designation
Current owner and phone
number
Property address and/or legal description1
Tenants and/or easement holders2
Samples collected Do COC concentrations exceed Tier 1
GWGWIng PCLs?Yes No Yes No
1 Provide the address of the property containing the threatened or affected well. If the property does not have an address or if property plot maps are provided, include the legal description of the property (i.e., lot and block numbers, appraisal district reference numbers, etc.)2 If samples were collected on property not owned by the person and results exceed Tier 1 PCLs, provide the names of tenants and/or easement holders.
TCEQ-10325/APAR June 2005 29

Table 2C - Complete or Reasonably Anticipated to be Complete Exposure PathwaysUse this table to indicate the complete or reasonably anticipated to be complete exposure pathways by checking the applicable pathways based on the media affected by COCs and the potential for migration of COCs. The shaded boxes are those pathways considered complete per the TRRP rule. If a shaded box is not checked, explain in Section 2.6 why the pathway is not complete.
Table 2C. Complete or Reasonably Anticipated to be Complete Exposure PathwaysExposure pathway Surface soil1 Subsurface soil2 Groundwater Surface water/
sedimentTotSoilComb
3 NANA
NA
AirSoilInh-V NAGWSoilIng or GWSoilClass3
GWGWIng or GWGWClass3
NA NA
AirGWInh-V
SWGWSedGWSWSW or SedSed NAOther (specify)4
Figure 2A - Potential Receptors MapProvide a map of appropriate scale identifying and depicting the location of the potential receptors (surface water bodies, water wells, areas of ecological concern, etc.) identified within at least a 500-foot radius of the affected property. Include receptors located outside the 500-foot radius if they are potentially threatened by the release. Depict the receptors in relation to the sampling locations for the associated affected media. Clearly depict the boundary of the 500-foot field survey area. Illustrate the general land use (residential or commercial/industrial) for properties within the survey area.
Figure 2B - Field Survey PhotographsProvide original or high-resolution color copies of photographs that depict observations made during the 500-ft field survey, explain the survey actions taken, and document the presence or absence of receptors. Clearly label the photographs with a description of the subject and photographer’s vantage point and direction of view. Provide a map that shows the location and view direction of the photographer.
Figure 2C - Water Well MapInclude a color copy of a USGS 7.5 minute topographic map illustrating the locations of the registered and unregistered water wells, including those located during the 500-foot field survey and within one-half mile radius of the groundwater affected above the residential assessment level. Portray and label the wells on the map with the well number and illustrate the affected property location and the one-half mile search radius on the map.
1 Residential: soils from 0-15 feet deep, or to bedrock or groundwater-bearing unit if shallower. Commercial/industrial: soils from 0-5 feet deep, or to bedrock or groundwater-bearing unit if shallower.2 The vadose zone beneath the surface soil extending to the groundwater-bearing unit, and including unsaturated zones between stratified groundwater-bearing units.3 Residential: AirSoilInh-VP + SoilSoilIng + SoilSoilDerm + VegSoilIng
Commercial/industrial: AirSoilInh-VP + SoilSoilIng + SoilSoilDerm4 If other exposure pathways are identified here, include those pathways in the derivation of assessment levels and evaluation of critical PCLs.
TCEQ-10325/APAR June 2005 30

Attachment 2A - Tier 1 Ecological Exclusion Criteria Checklist Complete this checklist for each affected property. Refer to Chapter 307, Texas Surface Water Quality Standards, Guidance for Conducting Ecological Risk Assessments at Remediation Sites in Texas (RG-263 revised, and future updates), and Determining PCLs for Surface Water and Sediment (RG-366/TRRP-24) for the definition of surface water, surface water types, uses, basin numbers, and state-designated stream segment numbers. The person and the preparer must sign this checklist.
Attachment 2B - Tier 1 Ecological Exclusion Criteria Supporting DocumentationAs required in the Tier 1 Ecological Exclusion Criteria Checklist, attach a brief statement (not to exceed 1 page) summarizing the information provided in Attachment 2A. Include in this summary sufficient information to verify that the affected property meets or does not meet the exclusion criteria. Also include in this attachment photographs and correspondence with wildlife management agencies used to complete the checklist. Include a topographic map and/or aerial photo to depict the affected property and surrounding area.
TCEQ-10325/APAR June 2005 31

Attachment 2A. Tier 1 Exclusion Criteria Checklist
PART I. Affected Property Identification and Background Information
1) Provide a description of the specific area of the response action and the nature of the release. Include estimated acreage of the affected property and the facility property, and a description of the type of facility and/or operation associated with the affected property. Also describe the location of the affected property with respect to the facility property boundaries and public roadways.
Attach available USGS topographic maps and/or aerial or other affected property photographs to this form to depict the affected property and surrounding area. Indicate attachments:
Topo map Aerial photo Other (specify)
2) Identify environmental media known or suspected to contain chemicals of concern (COCs) at the present time. Check all that apply:
Known/Suspected COC Location Based on sampling data?Soil <5 ft below ground surface Yes NoSoil >5 ft below ground surface Yes NoGroundwater Yes NoSurface Water/Sediments Yes No
Explain (previously submitted information may be referenced):
3) Provide the information below for the nearest surface water body which has become or has the potential to become impacted from migrating COCs via surface water runoff, air deposition, groundwater seepage, etc. Exclude wastewater treatment facilities and stormwater conveyances/impoundments authorized by permit. Also exclude conveyances, decorative ponds, and those portions of process facilities that are:a. Not in contact with surface waters in the State or other surface waters which are ultimately in contact
with surface waters in the State; andb. Not consistently or routinely utilized as valuable habitat for natural communities including birds,
mammals, reptiles, etc.
The nearest surface water body is feet/miles from the affected property and is named:
The water body is best described as a:freshwater stream:
perennial (has water all year)intermittent (dries up completely for at least 1 week a year)intermittent with perennial pools
freshwater swamp/marsh/wetlandsaltwater or brackish marsh/swamp/wetlandreservoir, lake, or pond; approximate surface acresdrainage ditchtidal stream bay estuary
TCEQ-10325/APAR June 2005 32

other; specify
TCEQ-10325/APAR June 2005 33

Is the water body listed as a State classified segment in Appendix C of the current Texas Surface Water Quality Standards; §§307.1 - 307.10?
Yes Segment # Use Classification:No
If the water body is not a State classified segment, identify the first downstream classified segment.Name:Segment #:Use Classification:
As necessary, provide further description of surface waters in the vicinity of the affected property:
PART II. Exclusion Criteria and Supportive Information
Subpart A. Surface Water/Sediment Exposure
1) Regarding the affected property where a response action is being pursued under the TRRP, have COCs migrated and resulted in a release or imminent threat of release to either surface waters or to their associated sediments via surface water runoff, air deposition, groundwater seepage, etc.? Exclude wastewater treatment facilities and stormwater conveyances/impoundments authorized by permit. Also exclude conveyances, decorative ponds, and those portions of process facilities which are:
a. Not in contact with surface waters in the State or other surface waters which are ultimately in contact with surface waters in the State; and
b. Not consistently or routinely utilized as valuable habitat for natural communities including birds, mammals, reptiles, etc.
Yes No
Explain:
If the answer is yes to Subpart A above, the affected property does not meet the exclusion criteria. However, complete the remainder of Part II to determine if there is a complete and/or significant soil exposure pathway, then complete PART III - Qualitative Summary and Certification. If the answer is No, go to Subpart B.
TCEQ-10325/APAR June 2005 34

Subpart B. Affected Property Setting
In answering “Yes” to the following question, it is understood that the affected property is not attractive to wildlife or livestock, including threatened or endangered species (i.e., the affected property does not serve as valuable habitat, foraging area, or refuge for ecological communities). (May require consultation with wildlife management agencies.)
1) Is the affected property wholly contained within contiguous land characterized by: pavement, buildings, landscaped area, functioning cap, roadways, equipment storage area, manufacturing or process area, other surface cover or structure, or otherwise disturbed ground?
Yes No
Explain:
If the answer to Subpart B above is Yes, the affected property meets the exclusion criteria, assuming the answer to Subpart A was No. Skip Subparts C and D and complete PART III - Qualitative Summary and Certification. If the answer to Subpart B above is No, go to Subpart C.
Subpart C. Soil Exposure
1) Are COCs which are in the soil of the affected property solely below the first 5 feet beneath ground surface or does the affected property have a physical barrier present to prevent exposure of receptors to COCs in surface soil?
Yes No
Explain:
If the answer to Subpart C above is Yes, the affected property meets the exclusion criteria, assuming the answer to Subpart A was No. Skip Subpart D and complete PART III - Qualitative Summary and Certification. If the answer to Subpart C above is No, proceed to Subpart D.
Subpart D. De Minimus Land Area
In answering “Yes” to the question below, it is understood that all of the following conditions apply:
The affected property is not known to serve as habitat, foraging area, or refuge to threatened/endangered or otherwise protected species. (Will likely require consultation with wildlife management agencies.)
Similar but unimpacted habitat exists within a half-mile radius. The affected property is not known to be located within one-quarter mile of sensitive
environmental areas (e.g., rookeries, wildlife management areas, preserves). (Will likely require consultation with wildlife management agencies.)
There is no reason to suspect that the COCs associated with the affected property will migrate such that the affected property will become larger than one acre.
TCEQ-10325/APAR June 2005 35

1) Using human health protective concentration levels as a basis to determine the extent of the COCs, does the affected property consist of one acre or less and does it meet all of the conditions above?
Yes No
Explain how conditions are met/not met:
If the answer to Subpart D above is Yes, then no further ecological evaluation is needed at this affected property, assuming the answer to Subpart A was No. Complete PART III - Qualitative Summary and Certification. If the answer to Subpart D above is No, proceed to Tier 2 or 3 or comparable ERA.
PART III. Qualitative Summary and Certification (complete in all cases.)
Attach a brief statement (not to exceed 1 page) summarizing the information you have provided in this form. This summary should include sufficient information to verify that the affected property meets or does not meet the exclusion criteria. The person should make the initial decision regarding the need for further ecological evaluation (i.e., Tier 2 or 3) based upon the results of this checklist. After review, TCEQ will make a final determination on the need for further assessment. Note that the person has the continuing obligation to re-enter the ERA process if changing circumstances result in the affected property not meeting the Tier 1 exclusion criteria.
Completed by (Typed/Printed Name)(Title)(Date)
I believe that the information submitted is true, accurate, and complete, to the best of my knowledge.
(Typed/Printed Name of Person)(Title of Person)(Signature of Person)(Date Signed)
TCEQ-10325/APAR June 2005 36
Section 3 Assessment StrategyUse this section to discuss the rationale for the assessment and identify remaining data gaps.
Section 3.1 General Assessment Issues
Environmental Media AssessedIdentify the environmental media assessed and describe the method used to determine which media to sample. Relate the media assessed to the identified exposure pathways. Explain the methods used to evaluate whether an underlying groundwater-bearing unit is affected. If a medium was not assessed or if a complete or reasonably anticipated to be complete exposure pathway identified in Table 2C was not evaluated, explain why and how it was determined that the medium did not need to be assessed.
Target COCsProvide a list of the target COCs that are the basis for analysis of samples. If the complete list of chemicals in an analytical method was used as the target COC list, specify the analytical method number instead of listing each COC separately. Describe how the target COCs were identified, discuss whether the target COCs differ by medium, and if so, why. Relate the target COCs to the types of materials, wastes, and products historically located in the area assessed and reference this discussion to the information in Tables 1A and if applicable, Table 1B. If there are target COCs for which analysis was not conducted, identify those COCs and discuss the reasons why analysis was not conducted. Refer to Selecting Target Chemicals of Concern (RG-366/TRRP-10) for additional guidance.
BackgroundIf a site-specific background study was conducted, describe how representative site-specific background concentrations were determined for each environmental medium, as applicable. Explain the rationale for the sampling locations and depths. Provide information to support the determination that areas from which the samples were collected have not been impacted by industrial activities. If background is anthropogenic, explain the potential source(s) of the COCs measured.
Section 3.2 Assessment Strategy
General Assessment ApproachFor each medium assessed, explain the assessment strategy. Identify how sampling locations were determined in relation to available history and data in the area being assessed. Describe the intended use of critical samples (refer to Section 1 in Review and Reporting of COC Concentration Data (RG-366/TRRP-13) for the definition of critical samples). If field screening was conducted, explain how the field screening results were used. Explain how the sampling and analytical methods met the sampling objectives. If there is no affected property and/or no PCLE zone, explain how the assessment was adequate to make that determination.`
Describe how the layout, infrastructure, and logistics modified or limited the assessment. Identify how the assessment compensated for these logistical issues.
TCEQ-10325/APAR June 2005 37

Sampling ApproachExplain how the sampling locations and methods are the most optimal to detect COCs, as well as the direct or indirect evidence of NAPL, based on the type of COC, the physical and chemical properties of NAPL and COCs, the stratigraphy and geology of the area, the type and location of receptors, and the expected migration pathways of the COCs.
Surface Water and Sediment AssessmentDescribe the method(s) used to determine whether the surface water body and/or sediments are threatened or affected. Include and justify the distance surveyed based on site-specific conditions such as fate and transport of the COCs, the geology and hydrogeology in the area, topography of the area, and other factors that may determine the potential for impact. Explain how the groundwater assessment took into account the potential impacts to surface water or sediment. If surface water or sediment was assessed, discuss whether the surface water body is a gaining and/or losing water body in the impact area and whether the surface water is hydrologically connected to groundwater. Discuss tidal effects or hydraulic effects and how this was taken into account when conducting surface water or sediment sampling. Provide the flow rate and/or velocity at the time of sampling.
MiscellaneousDescribe the rationale for the assessment of miscellaneous items not included in the discussion of other environmental media, such as: geophysical investigations (seismic surveys, ground-penetrating radar surveys, and resistivity surveys), wipe samples, waste sampling, system components decontamination, concrete slab sampling, biota sampling (flora or fauna), food sampling, etc. Provide the results of the assessment in Appendix 11.
UtilitiesDescribe the method(s) used to investigate whether an underground utility is threatened, affected, or is a potential migration pathway. Identify the underground utilities located within the affected property that may be threatened, affected, or that may serve as a migration pathway. Provide justification for concluding that those utilities present within the affected property but not listed in Table 3A are not preferential pathways for migration. Include in the discussion relevant site-specific factors regarding this potential migration pathway, such as fate and transport of the specific COCs, soil and rock types, permeability contrasts between the utility backfill and native geology, utility type, location, and construction, and other factors that may affect the migration of COCs.
Assessment MethodsIdentify and describe the sampling method(s) used (drilling, hand auger, push probe, excavation, etc.) for critical samples, the method of sample collection and preservation, how NAPL was investigated (techniques to identify and evaluate NAPL occurrence and properties), and sample handling procedures. Discuss the site-specific reasons for choosing the sample collection and handling method(s). If a dedicated sampling device was not used for each monitor well, describe the decontamination procedures.
If water samples were filtered, specify the pore size and type of filter, describe how the samples were filtered, and justify the use of filtering.
Explain atypical procedures used or problems encountered, and describe deviations from procedures specified in standard operating procedures (SOPs) included in Appendix 14.
TCEQ-10325/APAR June 2005 38

Explain how atmospheric conditions affected the sampling protocol, instrument calibrations, and other aspects of the ambient air assessment.
Provide a general description of the well development and purging method(s) followed during the assessment or provide an SOP in Appendix 14. Specify deviations from the SOP. Describe in this section or the SOP the water quality stabilization parameters (pH, temperature, etc.), the purge rate and/or amount purged, a description of the purging devices, and the decontamination procedures for the equipment. If water wells were also sampled, include a discussion of how these wells were purged and sampled, if different from the monitor wells. Include the well development and purging data in Appendix 3.
For surface water and sediment sample collection, specify the sample method and sampling equipment (e.g., direct grab, dredge device, core sampling device, Van Dorn sampler). For dissolved metals in surface water, describe the filter size and filtering procedure, sample handling procedures and preservatives. If sediment pore water samples were collected, describe the sample collection methodology. Describe the field measurements (e.g., temperature, dissolved oxygen) and significant field observations (e.g., unusual flow conditions, water appearance, sheens, odors, turbidity, biological activity, watershed activities such as dredging or construction).
Data QualityDescribe the rationale for selecting each of the laboratory or field analysis methods used. If an MQL was used as the assessment level or critical PCL, provide documentation that the standard available analytical method selected provides the lowest possible MQL for that COC.
If applicable, describe the types of field analysis equipment used and the frequency and procedures for calibration.
Table 3A - Underground UtilitiesIdentify the underground utilities within or immediately adjacent to the affected property that are threatened or affected or those that may be, or are known, preferential migration pathways. List the utility type (e.g., sanitary sewer, water line, etc), the construction material (e.g., clay, concrete, etc) and backfill material (native soil, gravel, etc), the approximate depth at which the utility line is buried, and the name of the company responsible for the utility line. Indicate if the utility line is a potential pathway for COC migration and if the utility line itself is impacted.
Table 3A. Underground UtilitiesUtility type Construction
materialBackfillmaterial
Approx. depth
(ft)
Utility company
name
Potential migration pathway?
Affected?
Yes No Yes No
TCEQ-10325/APAR June 2005 39

Section 4 Soil AssessmentUse this section to discuss the results of the surface and subsurface soil assessment and the nature and extent of NAPL and COCs in soil. For this discussion, the term soil includes the vadose zones, capillary fringe, and saturated zones that are not groundwater-bearing units. Refer to Affected Property Assessment Requirements (RG-366/TRRP-12) for guidance on assessment levels and NAPL Assessment (RG-366/TRRP-12A) for information on determining the nature and extent of NAPL.
Section 4.1 Derivation of Assessment Levels
Discuss the human health and ecological exposure pathways considered for the determination of the residential assessment level in surface and subsurface soil. Refer to the definition of assessment level in the rule at §350.4(3). The determination of the residential assessment level includes consideration of the applicable human health and ecological PCLs, the MQL, and background. Identify the presence or absence of human and ecological receptors, the POEs for each receptor, and the exposure pathway for each receptor. Describe, if applicable, the site-specific scenarios that change the assessment level for a COC based on the presence or absence of a receptor or potential exposure pathway. Complete Section 11 as applicable, and include the calculations, equations, and supporting documentation for Tier 2 or 3 GWSoil PCLs in Appendix 9.
If applicable, discuss the use of multiple residential assessment levels for the same COC in the same soil zone due to differing background COC concentrations (natural or anthropogenic) based on changes in lithology or geochemistry, or when COCs are from off-site sources, and explain how it was determined that the assessment levels differ within the same media. Repeat Table 4A as necessary to document the differing assessment levels.
Section 4.2 Nature and Extent of COCs and NAPL in Soil
Discuss the nature and extent of NAPL and COCs in surface and subsurface soils, including those soils beneath affected groundwater-bearing units, if applicable. Identify and discuss the critical sampling locations used to delineate the horizontal and vertical extent of each COC. Relate the distribution of NAPL and COCs to the source(s) of release and the locations of human and ecological receptors. If there is direct or indirect evidence of NAPL in soil, describe the nature and extent of NAPL, including the distribution, composition, and other pertinent characteristics and observations.
If a groundwater assessment has not been conducted, explain how it was determined that groundwater is not affected. Discuss how the vertical limit of COCs in soil was determined, and include a discussion and a table or a list of the COC concentration (MQLs or background concentrations) used to define the vertical limit of COCs in soil.
When claiming evidence of groundwater protectiveness using §350.75(i)(7)(C), provide a complete justification here and include the supporting documentation in Appendix 9.
Provide a short discussion if declaring the entire soil column as a PCLE zone in accordance with §350.51(d), in lieu of delineating COCs vertically.
Discuss modifications made to the assessment when existing physical controls will be used in a Remedy Standard B response action (see §350.51(a) and §350.71(d)).
TCEQ-10325/APAR June 2005 40

Table 4A - Surface Soil Residential Assessment Levels with no Ecological ComponentUse this table to summarize the residential assessment level for each COC analyzed in surface soils in areas where human health PCLs apply and to compare the residential assessment level to the higher of the maximum COC concentration or the maximum SQL to determine if the residential assessment level has been exceeded. For each COC, highlight the value that is the residential assessment level and highlight the maximum concentration if it exceeds the residential assessment level. Add columns as necessary to include applicable exposure pathways. If a Tier 2 or Tier 3 GWSoil PCL was used as the residential assessment level, include supporting documentation in Appendix 9.
Table 4A. Surface Soil Residential Assessment Levels for Human Health Exposure Pathways
COC Source area size
(acres)
TotSoilComb
PCL(mg/kg)
GWSoil PCL MQL(mg/kg)
Back-ground(mg/kg)
Maximum concentration
(mg/kg) Tier Sample ID
Sample depth
Sample date
Conc(mg/kg)
Table 4B - Surface Soil Residential Assessment Levels with Ecological ComponentUse this table to summarize the residential assessment level for each COC analyzed in surface soils in areas where human health and ecological concerns apply and to compare the residential assessment level to the maximum COC concentration to determine if the residential assessment level has been exceeded. If a PCL has not been developed under an ecological risk assessment, provide the basis for the value used. Complete this table for each COC analyzed. For each COC, highlight the value that is the residential assessment level and highlight the maximum concentration if it exceeds the assessment level.
Table 4B. Surface Soil Residential Assessment Levels with Ecological ComponentCOC Human
health PCL1
(mg/kg)
Ecological PCL(0 to 0.5 ft)
Ecological PCL(0.5 to 5 ft)
MQL(mg/kg)
Back-ground(mg/kg)
Maximum concentration in areas of ecological concern
(mg/kg) Basis2 (mg/kg) Basis2 Sample ID Sample depth
Sample date
Conc(mg/kg)
1 List the lower of TotSoilComb and GWSoil values from Table 4A.2 Specify the basis of the ecological PCL (benchmark, MQL, background, Tier 2 PCL, or Tier 3 PCL).
TCEQ-10325/APAR June 2005 41

Table 4C - Subsurface Soil Residential Assessment LevelsThe purpose of this table is to illustrate the residential assessment levels for each COC analyzed in subsurface soils and to compare the residential assessment level to the maximum COC concentration to determine if the residential assessment level has been exceeded. Complete this table for each target COC. Highlight the value that is the residential assessment level for each COC and highlight the maximum concentration if it exceeds the assessment level. Add columns as necessary to include other applicable exposure pathways. If a Tier 2 or Tier 3 GWSoil PCL was used as the residential assessment level, include supporting documentation in Appendix 9.
Table 4C. Subsurface Soil Residential Assessment LevelsCOC Source
area size(acres)
AirSoilInh-V
PCL(mg/kg)
GWSoil PCL MQL Back-ground
Maximum concentration
(mg/kg) Tier (mg/kg) (mg/kg) Sample ID
Sample depth
Sample date
Conc(mg/kg)
Table 4D - Soil Data SummaryThe purpose of this table is to summarize the analytical results for soil and illustrate which samples exceed the residential assessment level, the critical PCL, or both. Do not split the table into surface soil samples and subsurface soil samples. Include the following for each COC: sample ID name/number, boring number, sample date, sample depth, COC name, residential assessment level, critical PCL, and COC concentration.
Use mg/kg as the units for the concentrations.
If the result was not detected, report the result as less than the SQL (for example, “<0.01 mg/kg”). Do not use acronyms such as “ND” for non-detected results.
Highlight: concentrations that exceed the residential assessment level, and SQLs (non-detected results) that exceed the residential assessment level, and highlight in a different manner: concentrations that exceed the critical PCL, and SQLs (non-detected results) that exceed the critical PCL.
Table 4E - Soil Geochemical/Geotechnical Data SummaryProvide summary tables of geochemical or geotechnical analyses results. Include in the tables the sample ID number, boring number, sample date, sample depth, parameter analyzed, analytical method, and analytical result. Include data qualifiers and identify the data qualifiers. Report non-detected results as
TCEQ-10325/APAR June 2005 42

less than the SQL, where applicable.
Figure 4A - Surface Soil COC Concentration MapsThe purposes of these maps are to illustrate the distribution of COCs and NAPL in surface soils (0-15 ft. bgs), demonstrate the extent of COCs in surface soils has been delineated in accordance with the rule, and identify source areas. When the residential assessment level for a COC is exceeded, provide a map for that COC which illustrates the extent of the affected property in surface soil. Include the locations of the borings and surface soil samples, excavated areas, buildings and other structures, potential sources and known release areas, the maximum COC concentration detected at each location, and the depth at which the maximum concentration was detected in surface soils. Clearly label the isoconcentration contour line representing the residential assessment level. In order to avoid duplicating maps in Figure 11A, when the land use for purpose of PCL development is residential, depict the PCLE zones on these maps and omit Figure 11A.
Additional maps or graphs may be submitted to illustrate the changes in COC concentrations and distribution over time.
Figure 4B - Subsurface Soil COC Concentration MapsThe purposes of these maps are to illustrate the distribution of COCs and NAPL in subsurface soils (>15 ft. bgs), demonstrate the extent of COCs in subsurface soils has been delineated in accordance with the rule, and identify source areas. When the residential assessment level for a COC is exceeded, provide a map for that COC which illustrates the extent of the affected property in subsurface soil. Include the locations of the borings and subsurface soil samples, excavated areas, buildings and other structures, potential sources and known release areas, the maximum COC concentration detected at each location, and the depth at which the maximum concentration was detected in subsurface soils. Clearly label the isoconcentration contour line representing the residential assessment level. In order to avoid duplicating maps in Figure 11B, when the land use for purpose of PCL development is residential, depict the PCLE zones on these maps and omit Figure 11B.
Figure 4C - Cross SectionsThe purpose of the cross sections is to illustrate the subsurface geology and hydrogeology, the horizontal and vertical distribution of COCs, the affected soils, and the potential for future migration. Construct the cross section using the actual ground surface elevations at each of the boring locations. Indicate the cross section lines on the map in Figure 1B or provide an index map on the cross section.
Construct cross sections to represent the subsurface stratigraphy and extent of COCs using at least three representative points. Construct a minimum of two cross sections perpendicular to each other through the source area and affected property unless the characteristics (geology, COC distribution, etc) are homogeneous and can be adequately illustrated with one cross section. For affected properties with monitor wells, construct one cross section approximately down the primary axis of COC transport and one approximately perpendicular to COC transport direction.
Include the following for the cross sections: boring or monitor well identification numbers, interpolated stratigraphy between each boring/monitor well from the ground surface to the
maximum depth assessed, groundwater-bearing units and aquitards, sample locations, areas exceeding the residential assessment levels for each media,
TCEQ-10325/APAR June 2005 43

areas exceeding the critical PCL for each medium (may be shown here or in cross sections in Section 11),
COC concentrations at critical sampling points, areas exceeding the higher of background or MQL if a groundwater assessment has not been
conducted, distribution of NAPL, potentiometric surface or water table based on static groundwater level in each monitor well, monitor well screened intervals, structural features or other migration pathways, excavated areas, subsurface conduits, underground utilities, and compass directions of the cross sections.
TCEQ-10325/APAR June 2005 44

Section 5 Groundwater AssessmentUse this section to discuss the results of the assessment of each groundwater-bearing unit including the nature and extent of COCs. Refer to Affected Property Assessment Requirements (RG-366/TRRP-12) for guidance on assessment levels and NAPL Assessment (RG-366/TRRP-12A) for information on determining the nature and extent of NAPL.
Section 5.1 Derivation of Assessment Levels
Discuss how the residential assessment levels were determined for each COC in each groundwater-bearing unit. Identify the presence or absence of human or ecological receptors, the POEs for each receptor, and the exposure pathways for each receptor. Describe, if applicable, the site-specific scenarios that change the assessment level for a COC based on the presence or absence of a receptor or potential exposure pathway, including at or near the groundwater-surface water interface when considering the SWGW or SedGW pathway.
Section 5.2 Nature and Extent of COCs and NAPL in Groundwater
Discuss the nature and extent of NAPL and COCs in each groundwater-bearing unit. Explain how groundwater was assessed near surface water bodies and describe the results of the investigation to evaluate the groundwater-to-surface water and groundwater-to-sediment pathways. Identify and discuss the critical sampling locations used to delineate the extent of each COC. If there is direct or indirect evidence of NAPL in groundwater, describe the nature and extent of NAPL, including the distribution, measured thickness, composition, and other pertinent characteristics and observations. Relate the distribution of NAPL and COCs to the source(s) of release and human and ecological receptors. Identify the “driver” COCs in groundwater, and explain why these COCs are of particular concern or how they can be used to represent the affected groundwater.
Demonstrate that the vertical assessment of NAPL and COCs in groundwater was completed by documenting that COC concentrations in a deeper groundwater-bearing unit are less than the residential assessment level. Alternatively, demonstrate that vertical migration to a lower groundwater-bearing unit is not probable considering COC properties and hydrogeologic conditions.
Discuss modifications made to the assessment when existing physical controls will be used in a Remedy Standard B response action (see §350.51(a), §350.71(d), and §350.33 (f)(2)).
TCEQ-10325/APAR June 2005 45

Table 5A - Groundwater Residential Assessment LevelsThe purpose of this table is to summarize the residential assessment level for each COC analyzed in groundwater and to compare the residential assessment level to the higher of the maximum COC concentration or maximum SQL to determine if the residential assessment level has been exceeded. Add columns as necessary to indicate other applicable exposure pathways. For each COC, highlight the value that is the residential assessment level and highlight the maximum concentration if it exceeds the residential assessment level. Repeat the table for each groundwater-bearing unit.
Table 5A. Groundwater Residential Assessment LevelsCOC GWGWIng or
GWGWClass3
(mg/L)
AirGWInh-VSWGW1
(mg/L)SedGW1
(mg/L)MQL
(mg/L)Back-
ground(mg/L)
Maximum concentration
(mg/L) Source area size (acres)
SampleID
Sample depth
(ft)
Sample date
Conc(mg/L)
Table 5B - Groundwater Data SummaryThe purpose of this table is to summarize the analytical results for groundwater and illustrate which samples exceed the residential assessment level, the critical PCL, or both. Include the following for each COC: sample ID name/number, monitor well number, sample date, sample depth, COC name, residential assessment level, critical PCL, and COC concentration.
Use mg/L as the units for the concentrations.
If the result was not detected, report the result as less than the SQL (for example, “<0.01 mg/L”). Do not use acronyms such as “ND” for non-detected results.
Highlight: concentrations that exceed the residential assessment level, and SQLs (non-detected results) that exceed the residential assessment level,and highlight in a different manner: concentrations that exceed the critical PCL, and SQLs (non-detected results) that exceed the critical PCL.
Table 5C - Groundwater Geochemical Data SummaryProvide summary tables of the results for geochemical analyses. Include the sample ID number or monitor well number, sample date, parameter analyzed, analytical method, and analytical result. If the 1 PCLs for these pathways are not applicable to all sites. Refer to Determining PCLs for Surface Water and Sediment (RG-366/TRRP-24) to determine when to calculate a PCL for this pathway.
TCEQ-10325/APAR June 2005 46

result was nondetect, specify the SQL for that parameter (do not write “ND”). Repeat the table for each groundwater-bearing unit.
Table 5D - Groundwater MeasurementsProvide a summary table of the monitor well and water well gauging data. Include in the table: measured depth to groundwater, measurement date, groundwater elevation in relation to mean sea level, top of casing and/or ground surface elevations (specify measuring point), corrected water level and well screen interval, and measured NAPL thickness if applicable. Organize the table with the results for each monitor well or water well listed in date order (oldest first). If measurable LNAPL is present, provide the specific gravity of the LNAPL and the equation used to calculate the corrected groundwater elevation.
Figure 5A - Groundwater Gradient MapProvide a groundwater gradient map for each groundwater-bearing unit, drawn to scale, illustrating the monitoring wells and other groundwater measuring points, groundwater surface elevation relative to sea level, labeled groundwater elevation contours, and groundwater flow direction. If groundwater elevation data were collected at several times and the groundwater flow magnitude or direction has changed over time, submit a sufficient number of maps to illustrate these changes. Figure 5B - Groundwater COC Concentration MapsWhen the residential assessment level for a COC is exceeded in a groundwater-bearing unit, provide a map for that COC to illustrate the distribution of the COC and NAPL if applicable, that includes the following: the extent of the COC in groundwater delineated to residential assessment levels, potential source areas and known release areas, locations of the monitor wells and other sampling points, buildings and other structures, excavated areas, the maximum COC concentration detected at each location representative of current conditions
and the depth at which the maximum concentration was detected, isoconcentration contours, including the isoconcentration contour line representing the residential
assessment level, and a contour of the 1% solubility limit for the COC (indirect evidence of NAPL), if applicable, and
areas of direct evidence of NAPL associated with the COC.
In order to avoid duplicating maps, when the land use for the purpose of PCL development is residential, depict the PCLE zones on these maps and omit Figure 12A.
When sufficient time series data are available, also construct maps for significant COCs to illustrate the changes in COC concentrations and distribution over time. Also include graphs of COC concentrations over time and COC concentrations over distance.
If there is direct or indirect evidence of LNAPL, provide a separate map that illustrates the largest extent of LNAPL, including measured LNAPL and areas where there is indirect evidence of LNAPL. Label each sampling point with either the measured LNAPL thickness or the concentration that indirectly indicates the presence of LNAPL.
If there is direct or indirect evidence of DNAPL, provide a map the illustrates the largest extent of measured DNAPL and areas where there is indirect evidence of DNAPL. Label each sampling point, with either the measured DNAPL thickness or the concentration that indirectly indicates the presence of DNAPL. If DNAPL is detected or suspected, provide a structure contour map for the top of the aquiclude or base of saturated zone as appropriate.
TCEQ-10325/APAR June 2005 47

Figure 5C - Groundwater Geochemistry MapsProvide maps as necessary to effectively illustrate the distribution of groundwater geochemistry (for example, sulfate, nitrate, total dissolved solids) when such information is collected. Illustrate on the maps the sampling points, geochemical values, isoconcentration contours as appropriate to accurately depict the data in each media, sample depth intervals, and relevant surface and subsurface features.
When sufficient time series data are available, also construct maps for significant geochemical data to illustrate the changes in geochemistry and distribution over time.
Figure 5D - Cross Section Groundwater-to-Surface Water PathwayIf there is a complete or reasonably anticipated to be complete exposure pathway from groundwater to surface water, provide at least one cross section illustrating the subsurface conditions where the groundwater is in contact with surface water. Illustrate the depth to groundwater, the boundary of the surface water body, surface water depth and sediment thickness, monitor well completion details, groundwater, surface water, and sediment sampling points, and other information necessary to illustrate these conditions. Include an index map showing the cross section location in relation to surface features and the affected property.
TCEQ-10325/APAR June 2005 48

Section 6 Surface Water Assessment and Critical PCL Development
Complete this section for each surface water body that is threatened, affected, sampled, or if the groundwater-to-surface water pathway is complete or reasonably anticipated to be complete. The purpose of this section is to describe and provide sufficient documentation to support the applicable water quality criteria, RBELs for human health and aquatic life, and critical PCLs for each surface water body. Refer to Determining PCLs for Surface Water and Sediment (RG-366/TRRP-24) and Affected Property Assessment Requirements (RG-366/TRRP-12) for guidance.
Section 6.1 Type of Surface Water and Applicable Water Quality Criteria
Provide a general description of the physical characteristics of the surface water body and, as applicable, additional water bodies downstream to the first perennial water body. Include the name of the surface water body, the nature of the bed, depth of water column, whether the surface water body is a gaining and/or losing water body, and relevant field observations. Identify if the water body or the nearest classified segment downstream of the affected property is on the Clean Water Act §303(d) list. If so, identify the specific chemicals or other parameters which are listed as impairing the nearest classified segment at or downstream of the affected property. Identify the segment number and name (e.g., 0601; Neches River Tidal) of the first classified segment at or downstream of the surface water body. If the surface water body is a classified segment, indicate this.
Discuss and provide supporting documentation for the following for each surface water body:
I. CategoryA. Classified (provide the segment number) orB. Unclassified
1) tidal,2) lake, or3) stream, river, or ditch (provide stream flow information if relevant)
i) perennial,ii) intermittent, oriii) intermittent with pools.
II. Use(s) (designated, observed, or presumed)A. Recreation (contact or non-contact)B. Aquatic life (exceptional, high, intermediate, or limited where the water body is
indicated in Appendix A or D of the Texas Surface Water Quality Standards)C. Domestic water supply (public or aquifer protection), and/orD. Other
III. CriteriaA. Human health, and/or
1) sustainable or incidental fishery, and/or 2) public drinking water supply
B. Aquatic life1) freshwater or saltwater; and2) acute and/or chronic
TCEQ-10325/APAR June 2005 49

If the surface water body is not classified as a drinking water source but is used for recreational purposes (designated or observed), discuss the potential exposure for humans wading or swimming in the surface water. If applicable, provide the rationale for eliminating these recreational pathways.
Section 6.2 Surface Water Risk-Based Exposure Levels (RBELs) for Human Health and Aquatic Life Protection
Discuss how the RBELs for aquatic life and human health protection were developed for each surface water body. Include the calculations and supporting data in Appendix 9. If a Texas standard does not exist for a COC and a pre-approved value is not posted on the TRRP web site, provide the following:
For human health, discuss the method used to develop each RBEL and the rationale for the bioconcentration factor (BCF) or bioaccumulation factor (BAF) and reference dose or cancer slope factor used to derive the RBEL.
For aquatic life, provide the mechanism used to derive a RBEL and the rationale for the aquatic organism and associated LC50 used to derive the RBEL. Discuss the information used to determine if the COC is persistent or bioaccumulative.
For the non-default parameters, provide the rationale for the value used in the development of the RBEL.
For human health pathways not addressed by the surface water RBEL (incidental ingestion and dermal contact), discuss the pathways evaluated, the pathway-specific exposure parameters used to develop the RBEL, and the equations used.
For releases of petroleum fuel contaminated waters, discuss the applicability of and demonstrate compliance with, the discharge criteria for the TPDES general permit in addition to the applicable human health and aquatic life protection RBELs.
If applicable, discuss the rationale for and the method used to modify the surface water RBEL based on aesthetics, nutrients, and/or adverse toxic effects.
If applicable, provide the derivation of a RBEL for salinity, chlorides, sulfates, total dissolved solids, and/or pH.
Section 6.3 Nature and Extent of COCs in Surface Water
Describe the results of the assessment for each surface water body. If a PCL has not been developed for ecological receptors, discuss the value used as the assessment level (MQL, background, benchmark, or human health PCL). Discuss how the extent of NAPL and COCs was determined and how the assessment identified the affected surface water. Include a discussion of the COCs detected, presence or absence of LNAPL and/or DNAPL based on direct and/or indirect evidence, and the potential source(s) of the release associated with each COC. Describe the potential migration pathways (e.g., groundwater, air emissions, man-made conduits, storm water drainage and related outfalls, etc.) from the source area to the surface water body. If applicable, discuss how background concentrations were determined and include the calculations in Appendix 8. Identify critical samples used to delineate the extent of COCs and determine if remedial actions are necessary.
TCEQ-10325/APAR June 2005 50

Section 6.4 Critical PCL for Surface Water
Discuss the comparison of ecological PCLs developed in the ecological risk assessment with the RBELs determined for human health and aquatic life. Explain how the critical PCL and associated exposure pathway for each COC was determined.
If applicable, provide a discussion of the PCL adjustment to address a more conservative RBEL or PCL for the affected downstream water body.
TCEQ-10325/APAR June 2005 51

Table 6A - Surface Water Critical PCLsRepeat this table for each affected surface water body. The purpose of this table is to identify the critical PCLs and those that have been exceeded. List the COCs that were targeted for assessment. For each COC, list the lowest MQL, the background concentration (if calculated), the maximum detected or representative concentration, ecological PCLs determined in an ecological risk assessment, surface water RBELs for aquatic life and human health, and surface water PCLs protective of human health (incidental ingestion, dermal contact, fish and shellfish uptake), where appropriate. If an ecological PCL was not developed under an ecological risk assessment, identify the value (benchmark, background, MQL, or human health PCL) used as the assessment level. For each COC, highlight the value that is the critical PCL and highlight the maximum or representative concentration if it exceeds the critical PCL.
Table 6A. Surface Water Critical PCLsCOC Background
(mg/L)MQL
(mg/L)Human Health1
(SWSWHH)Aquatic Life and
Ecological2(SWSWeco)
SWSWpetroleum
fueldischarges3
(mg/L)
Conc(mg/L)
Contact recreation Max Rep4
Waterand fish(mg/L)
Fish only
(mg/L)
Incidentalingestion
(mg/L)
Dermalcontact(mg/L)
Acute(mg/L)
Chronic(mg/L)
Wildlifereceptors
(mg/L)
1 SWSWHH – Surface water PCL protective of human health.2 SWSWeco – Surface water PCL protective of aquatic life and wildlife ecological receptors. If a PCL was not developed under an ecological risk assessment, provide the value used (benchmark, MQL, background, or human health PCL), as appropriate.3 SWSW – Surface water PCL for discharge of petroleum fuel contaminated water. See Section 3.4 of Determining PCLs for Surface Water and Sediment (RG-366/TRRP-24).4 Document the development of representative concentrations in Appendix 8.
TCEQ-10325/APAR June 2005 52

Table 6B - Surface Water Data Summary The purpose of this table is to summarize the analytical results (COC, geochemical, NAPL, and conventional parameters) for surface water and highlight which concentrations exceed the critical PCL. Include the following for each COC: sample ID name/number, sample date, sample depth, COC name, and COC concentration.
Use mg/L as the units for the concentrations.
If the result was nondetect, report the result as less than the SQL (for example, “<0.01 mg/L”). Do not use acronyms such as “ND” for non-detected results.
Highlight the: concentrations that exceed the critical PCL, and SQLs (non-detected results) that exceed the critical PCL.
Figure 6A - Surface Water PCLE Zone MapThe purpose of this map is to illustrate the distribution of COCs in surface water. Provide a map that effectively illustrates the distribution of COCs and NAPL, geochemical and geotechnical parameters, and conventional parameters in each surface water body that was sampled. Highlight the samples that exceed the critical PCL or illustrate the PCL zone. Include the sampling points, depth intervals, and associated concentrations in surface water as well as groundwater near the surface water. Label the location of each surface water body, and identify the name, segment number, flow direction, and relevant surface and subsurface features of each surface water body. If applicable, illustrate the area of NAPL which requires a response action.
Figure 6B - PhotographsIf not provided in Figure 2B, provide color original or high-resolution color copies of photographs to document field observations and the physical characteristics of the surface water body. Clearly label the photographs with a description of the subject and photographer’s view. Provide a map that shows the location and view direction of the photographer.
TCEQ-10325/APAR June 2005 53

Section 7 Sediment Assessment and Critical PCL Development
Complete this section for sediment threatened, affected, and/or sampled, or if the groundwater-to-sediment pathway is complete or reasonably anticipated to be complete. The purpose of this section is to describe and provide sufficient documentation to support the sediment RBELs for human health and the critical PCLs for sediment based on human and ecological receptors. Refer to Determining PCLs for Surface Water and Sediment (RG-366/TRRP-24) for guidance.
Section 7.1 Type of Sediment and Applicable Criteria
Provide a general description of the sediment (soils, sand, organic matter, minerals or other material that have accumulated on the bottom of each surface water body) based on visual observations. Include the thickness of the sediment column (if known), depth of aerobic zone, texture, color, observations of biota, and odors. Provide a general discussion of the depth of the water column anticipated during times of contact recreation in the water body.
Provide a discussion of the potential for direct human exposure due to wading or swimming, or indirect exposure from ingestion of shellfish and fish. If applicable, provide the rationale for eliminating the human health exposure pathways.
Section 7.2 Sediment Risk-based Exposure Levels (RBELs) for Human Health
Discuss the development of RBELs protective of human health. If a pre-approved value from the TRRP web site was not used, provide the rationale, exposure assumptions, and non-default parameter values used in the development of these RBELs. Provide a discussion of literature-derived or measured water body-specific biota-sediment accumulation factors (BSAFs) used for sediment to fish/shellfish (to human) pathway, as appropriate. Include the calculations and supporting data in Appendix 9.
Section 7.3 Nature and Extent of COCs in SedimentDescribe the results of the sediment assessment. If an ecological PCL was not developed under an ecological risk assessment, provide a discussion of the value (benchmark, MQL, background, or human health PCL) used as the assessment level. Discuss how the extent of NAPL and COCs was determined and how the assessment identified the affected sediment. Include a discussion of the COCs detected, presence or absence of LNAPL and/or DNAPL, and potential source(s) of the release associated with each COC. If applicable, discuss how background concentrations were determined and include the calculations in Appendix 8.
Identify critical samples that were used to delineate the extent of COCs and determine if remediation activities are warranted.
TCEQ-10325/APAR June 2005 54

Section 7.4 Critical PCL for Sediment
Discuss the comparison of ecological PCLs developed in the Ecological Risk Assessment with the RBELs determined for human health. Explain how the critical PCL and associated exposure pathway for each COC was determined.
Table 7A - Sediment Critical PCLs Repeat this table for the affected sediment in each water body. The purpose of this table is to identify the critical PCLs that have been exceeded. List the COCs that were targeted for assessment. For each COC, list the lowest MQL, the background concentration (if determined), the maximum detected or representative concentration, ecological PCLs determined in the ecological risk assessment, and sediment PCLs protective of human health (including incidental ingestion, dermal contact, fish and shellfish uptake), where appropriate. For each COC, highlight the value that is the critical PCL and highlight the maximum or representative concentration if it exceeds the critical PCL.
Table 7A. Sediment Critical PCLsCOC MQL
(mg/kg)Background
(mg/kg)Human Health (SedSedHH)1 Ecological
(SedSedEco)2Conc
(mg/kg)Contact recreation Ingestion of impacted
fish/shellfish(mg/kg)
Incidental ingestion(mg/kg)
Dermalcontact(mg/kg)
Benthics(mg/kg)
Wildlifereceptors/fish
(mg/kg)
Max Rep3
Table 7B - Sediment Data Summary The purpose of this table is to summarize the analytical results (COC, geochemical, NAPL, and conventional parameters) for sediment and highlight which concentrations exceed the critical PCL. Include the following for each COC: sample ID name/number, sample date, sample depth, COC name, critical PCL, and COC concentration.
Use mg/kg as the units for the concentrations.
If the result was nondetect, report the result as less than the SQL (for example, “<0.01 mg/kg”). Do not use acronyms such as “ND” for non-detected results.
Highlight the: concentrations that exceed the critical PCL, and SQLs (non-detected results) that exceed the critical PCL.
1 SedSEDHH – Sediment PCL protective of human health.2 SedSEDEco – Sediment PCL protective of ecological receptors. If a PCL was not developed under an ecological risk assessment, provide the value (benchmark, background, MQL, or human health PCL) used, as appropriate.3 Document the development of representative concentrations in Appendix 8.
TCEQ-10325/APAR June 2005 55

Figure 7A - Sediment PCLE Zone Map The purpose of this map is to illustrate the distribution of COCs in sediment. For each COC assessed, provide a map(s) that effectively illustrates the distribution of COCs, geochemical and geotechnical parameters, LNAPL and/or DNAPL, and conventional parameters in the sediment that was sampled. Identify the areas where the water column depth overlying the sediment is less than 2 meters (6.56 feet) during times of contact recreation in the water body. Highlight the samples that exceed the critical PCL or illustrate the PCLE zone. Include the sediment sampling locations, sample depth intervals, water body names, segment numbers, COC concentrations, surface water flow direction, and relevant surface and subsurface features. Also provide the sampling locations for other media that may be potential sources for COCs in the sediment. If applicable, illustrate the area of NAPL which requires a response action.
TCEQ-10325/APAR June 2005 56

Section 8 Air Assessment and Critical PCL Development
Section 8.1 Risk-Based Exposure Levels
Describe how the air RBELs were derived for outdoor air. Include the calculations and supporting data in Appendix 9. Provide the method used to determine site-specific values for non-default parameters. If an occupational inhalation criteria was used as the RBEL:
demonstrate that a health and safety plan is in place, describe how the health and safety plan ensures compliance with the RBEL, and describe the plan for monitoring COC concentrations in air and the actions that will be
taken if the RBEL is exceeded.
Section 8.2 Nature and Extent of COCs in Air
Discuss the assessment results from screening or sampling ambient air either outside, or in or around underground utility lines. Describe the nature and extent of COCs, and measures taken to mitigate the impact. Discuss the distribution of COCs relative to the source(s) and potential receptors.
Table 8A - Outdoor Air Data Summary The purpose of this table is to summarize the analytical results (COC and conventional parameters) for air and illustrate which samples exceed the critical PCL. Include the following for each COC: sample ID name/number, sample date, sample height, COC name, critical PCL, and COC concentration.
Use parts per million by volume (ppmv) as the units for the concentrations.
If the result was nondetect, report the result as less than the SQL (for example, “<0.01 ppmv”). Do not use acronyms such as “ND” for non-detected results.
Highlight the: concentrations that exceed the critical PCL, and SQLs (non-detected results) that exceed the critical PCL.
Figure 8A - Outdoor Air COC Concentration MapsUse these maps to illustrate the distribution of COCs in outdoor air and to illustrate areas that exceed the critical PCLs. Provide map(s) drawn to scale depicting the outdoor air (including particulate and subsurface utilities) sampling points, relevant surface and subsurface features, and COC concentrations. When sufficient time series data are available, also construct maps for significant COCs using previous sampling dates to illustrate concentration changes over time. Include a lateral view of the sampling area, as needed, to effectively illustrate the vertical distribution of sampling points.
TCEQ-10325/APAR June 2005 57
Section 9 Ecological Risk AssessmentComplete this section when the affected property fails the Tier 1 Ecological Exclusion Criteria Checklist (Attachment 2A). There is not a standard format for this section since each affected property is unique. Submit a reasoned justification, an expedited stream evaluation, proposal for an ecological services analysis, and/or a Tier 2 or Tier 3 risk assessment. Refer to the TCEQ Guidance for Conducting Ecological Risk Assessments at Remediation Sites in Texas (RG-263) December 2001 and future updates for the required information. The TCEQ may request additional copies of the APAR when this section is completed.
Reasoned JustificationProvide a reasoned justification for terminating the ecological risk assessment. Briefly describe the planned response action for affected soil that is designed to address human health exposure and how the response action coincidentally addresses ecological exposure as well.
Expedited Stream Evaluation Demonstrate that the surface water body is an intermittent stream without perennial pools. Provide an evaluation of the setting and habitat (or lack thereof), verification that the stream meets acute water quality criteria, and discuss the likelihood of ecological receptors being present. Discuss and demonstrate the potential for downstream impacts where the setting is more conducive to aquatic life or wildlife, including verification that the maximum COC concentrations downstream are below the greater of background or ecological benchmarks, as appropriate, and that bioaccumulative COCs must be below background. Provide photographs of the intermittent stream, the surrounding area, the downstream area, and the sampling locations.
Tier 2 Screening Level Ecological Risk Assessment (SLERA)Required information for the SLERA can be found in RG-263. If applicable, provide a copy of the SLERA in this section.
Tier 3 Site-Specific Ecological Risk Assessment (SSERA)Required information for the SSERA can be found in RG-263. If applicable, provide a copy of the SSERA in this section.
Proposal for Ecological Services AnalysisUse this section to provide a proposal for an ecological services analysis.
TCEQ-10325/APAR June 2005 58

Section 10 COC ScreeningUse this section to document the rationale used to screen COCs from critical PCL development based on criteria outlined in §350.71(k). Do not complete this section of the report if critical PCLs were developed for all COCs. Include only those COCs that meet the screening criterion. Refer to Screening Target Chemicals of Concern from PCL Development (RG-366/TRRP-14).
Section 10.1 Frequency of Detection
For each COC screened from critical PCL development in accordance with the three criteria in §350.71(k)(2)(A), identify the total number of samples analyzed in the environmental medium and identify the frequency the COC was detected above the method quantitation limit. Provide clear justification why development of a critical PCL is not warranted to protect human health and the environment. Include in this justification a discussion of the concentration and distribution of the COC in environmental media, source area data, knowledge of on-site historical operations, COC and affected property characteristics, and companion and daughter product relationships.
Section 10.2 Lab Contaminant or Blank Contaminant
For each COC screened from critical PCL development under §350.71(k)(2)(B) and (C), demonstrate the COC was detected in an analytical blank. Explain why the COC is not anticipated to be present at the affected property based on knowledge of historical operations, including consideration of companion and daughter products. For common lab contaminants, demonstrate the maximum COC concentration detected in the environmental medium does not exceed 10 times the maximum amount detected in an associated blank. For COCs that are not common laboratory contaminants, demonstrate the concentration detected in each sample for that medium does not exceed 5 times the maximum amount detected in an associated blank.
Section 10.3 COC Not Sourced On-Site
For each COC screened under (§350.71(k)(2)(E), provide evidence that the detected COC did not result from activity at the on-site property. Discuss the concentration and distribution of the COC in environmental media, source area information, consideration of companion and daughter products, and knowledge of on-site historical operations that prove the COC did not originate from an on-site release. Attach to the end of this section additional documentation supporting this screening criteria.
Section 10.4 Appropriate Sample Quantitation Limits
If the SQLs in one or more samples exceed the residential assessment level and the COC was screened from critical PCL development, document that this criteria (§350.71(k)(3)(B)) has been met by including a discussion and appropriate demonstration that:
an appropriate analytical method was used; the COC is not anticipated to be present at the site, based on source area information,
knowledge of on-site historical operations, characteristics of the COC and affected property;
the SQLs in critical samples are below the MQL, the COC is not a companion or daughter product for a parent COC that cannot be
TCEQ-10325/APAR June 2005 59

screened from critical PCL development, no companion or daughter products to the parent COC are detected, and the exposure potential is low based on the nature of the source area, the nature of the
COC, the use and conditions of the affected property, the nature of the groundwater, local water use, proximity to potential receptors, and other appropriate site-specific factors affecting potential exposure to the COC should it be present.
Section 10.5 Screened COCs Expected to be Present Dropped from Future Sampling
Identify the screened COCs that will be dropped from future sampling events. Justify why the COC is not expected to be present in the environmental medium in the future. Discuss whether the screened COC is a daughter or degradation product of a COC, whether the COC could not be screened from another media, whether the compound partitions readily to a certain medium, and whether sufficient data has been collected to verify analytical results.
TCEQ-10325/APAR June 2005 60

Table 10A - COC Screening Summary TableUse this table to summarize the criteria under which a COC was screened from critical PCL development. Include in this table only COCs that meet one or more of the screening criteria. List the COC. In the column(s) for the applicable criteria, list each medium (soil 0-15 ft., soil >15 ft., groundwater (gw), surface water (sw), or sediment (sed)) to which the screening criteria apply for that COC. If the COC meets the criteria in Column 2, enter the medium/media in which the COC was detected and leave the remaining columns blank. If the COC meets the criteria in Columns 3 through 8, any nondetected results must also meet §350.71(k)(3)(A) or §350.71(k)(3)(B). Enter the medium in Column 9 or 10 to indicate which rule requirement is met. Refer to the footnotes to identify which of the criteria require additional justification, and provide that justification and the supporting documentation in the text.
This table is used only to report the results of COC screening, and is not designed to perform the COC screening. Refer to the TRRP rule (§350.71(k)) and the guidance in Screening Target Chemicals of Concern from PCL Development (RG-366/TRRP-14) for instructions on how to screen COCs.
Table 10A. COC Screening Summary Table1 2 3 4 5 6 7 8
SQL Justifications9 10
COC All detected concentrations
and SQLs < residential
assessment level in all
sampled media§350.71(k)(1)
COC not detected in
any sample in the medium
§350.71(k)(3)
Frequency of detects <5% of
the >20 samples in this medium1
§350.71(k)(2)(A)(i) through (iii)
Common lab contaminant2
§350.71(k)(2)(B)
Blank contaminant2
§350.71(k)(2)(C)
Max conc < background
§350.71(k)(2)(D)
COC not sourced on-site3
§350.71(k)(2)(E)
All SQLs < RAL§350.71(k)(3)(A)
SQL > RAL but justified4
§350.71(k)(3)(B)
1 Provide in the text justification that a critical PCL is not warranted based on the criteria specified in §350.71(k)(2)(A)(iii).2 Provide in the text justification that the COC is not anticipated to be present at the site (see §350.71(k)(2)(B) or (C)).3 Provide in the text justification that the COC is not from an on-site source (see §350.71(k)(2)(E)).4 Provide in the text justification that all requirements of §350.71(k)(3)(B) are met.
TCEQ-10325/APAR June 2005 61

Section 11 Soil Critical PCL DevelopmentUse this section of the report to document the development of Tier 2 or 3 soil PCLs and complete the soil critical PCL evaluation for those COCs not screened from PCL development.
Section 11.1 Tier 2 or 3 PCL Development and Non-Default Parameters
Tier 2 and 3 DevelopmentDescribe the development of the Tier 2 or 3 soil RBELs and PCLs. Provide a brief discussion of the equations and/or models used to calculate the RBELs and PCLs for the surface and/or subsurface soils. For Tier 3, provide the rationale for selecting the model used and demonstrate the model is appropriate. Repeat calculations, discussions, tables and figures for off-site properties as needed to describe the development of different PCLs. If the model has been calibrated or a sensitivity analysis has been performed, provide a discussion of the methods and results of these evaluations.
Non-Default Affected Property ParametersProvide a discussion of non-default parameters used to calculate soil RBELs and/or Tier 2 or 3 PCLs. Explain how the parameters were measured or estimated and justify why these parameters are appropriate for the affected property. If only one measurement of the parameter was made, explain how that value is representative of conditions throughout the affected property and/or how it conservatively estimates the range of conditions present.
Provide references in Appendix 16 for literature values used and explain how the values are appropriate for the affected property. Provide the equations and default and non-default parameters used, the calculations, and the results of calculations in Appendix 9. Submit verification that the TCEQ Executive Director has approved a variance from default exposure factors for average time (AT.w), exposure duration (ED.w), or exposure frequency (EF.w) in accordance with §350.74(j)(2).
Section 11.2 Soil PCL Adjustments
Discuss the evaluation of residual saturation, cumulative risk, hazard index, and/or theoretical soil vapor calculations used to adjust PCLs and discuss the logic and methods used to make the adjustments. If there are ten or more COCs in one medium, and a risk level and hazard check is not done in Appendix 9, explain why the risk level and hazard check is not necessary. Document the PCL adjustments using the tables provided in Appendix 9. Refer to Risk Levels, Hazard Indices, and Cumulative Adjustments (RG-366/TRRP-18) and Tiered Development of Human Health PCLs (RG-366/TRRP-22) for guidance.
If aesthetics are an issue, discuss the aesthetics issue and explain in general how the situation will be corrected.
Section 11.3 Soil Critical PCLs
Provide a discussion of how the critical PCLs, including ecological PCLs, for surface and subsurface soils were developed for each COC. Identify the human and ecological potential receptors and associated exposure pathways. Describe, if applicable, the site-specific scenarios where the exposure pathways and critical PCLs vary due to different receptors or POEs.
TCEQ-10325/APAR June 2005 62

Table 11A - Surface Soil Critical PCLs (On-Site/Off-Site)Use this table to perform a soil critical PCL evaluation for exposure pathways for those COCs in the surface soil which were not screened from PCL development in Section 10. Add columns as needed to include the applicable human health and ecological exposure pathways. List each COC, and its maximum or representative concentration, to compare to its critical PCL to determine if a remedy is required. For each COC, highlight the value that is the critical PCL, and highlight the maximum concentrations that exceed the critical PCL.
Table 11A. Surface Soil Critical PCLsDate of the Tier 1 PCL tables used in the determination of PCLs:
On-Site Surface Soil Critical PCLsLand use for purpose of critical PCL development: Residential Commercial/industrial
COC TotSoilComb
PCLGWSoil1PCL Ecological PCL
MQL(mg/kg)
Back-ground(mg/kg)
SWSoil2(mg/kg)
SedSoil2(mg/kg)
Conc(mg/kg)
Remedy or NFA(mg/kg) Tier Source
area size (acres)
(mg/kg) Tier Source area size (acres)
0-0.5 ft.(mg/kg)
0.5-5 ft.(mg/kg)
Max Rep3
Off-Site Surface Soil Critical PCLsLand use for purpose of critical PCL development:4 Residential Commercial/industrial
COC TotSoilComb
PCLGWSoil1PCL Ecological PCL
MQL(mg/kg)
Back-ground(mg/kg)
SWSoil2(mg/kg)
SedSoil2(mg/kg)
Conc(mg/kg)
Remedy or NFA(mg/kg) Tier Source
area size (acres)
(mg/kg) Tier Source area size
(acres)
0-0.5 ft.(mg/kg)
0.5-5 ft.(mg/kg)
Max Rep3
1 GWSoil includes GWSoilIng, GWSoilClass3, AirGW-SoilInh-V, and GWSoil for secondary MCLs, as applicable.2 Refer to Determining PCLs for Surface Water and Sediment (RG-366/TRRP-24) to determine if a PCL is required to be developed for this pathway.3 Provide justifications and calculations for use of representative concentrations in Appendix 8.4 Repeat the table if needed for different off-site land uses.
TCEQ-10325/APAR June 2005 63

Table 11B - Subsurface Soil Critical PCLs (On-Site/Off-Site)Use this table to perform a soil critical PCL evaluation for exposure pathways for those COCs in the subsurface soil which were not screened out in Section 10. List each COC, with its maximum concentration compared to its critical PCL to determine if a remedy is required. Add columns as needed to include the applicable human health and ecological exposure pathways. For each COC, highlight the value that is the critical PCL, and highlight the maximum concentrations that exceed the critical PCL.
Table 11B. Subsurface Soil Critical PCLsDate of the Tier 1 PCL tables used in the determination of PCLs:
On-Site Subsurface Soil Critical PCLsLand use for purpose of critical PCL development: Residential Commercial/industrial
COC AirSoilInh-V
PCLGWSoil1PCL
MQL(mg/kg)
Background(mg/kg)
Max conc(mg/kg)
Remedy or NFA(mg/kg) Tier Source
area size (acres)
(mg/kg) Tier Source area size(acres)
Off-Site Subsurface Soil Critical PCLsLand use for purpose of PCL development2: Residential Commercial/industrial
COC AirSoilInh-V
PCLGWSoil1PCL
MQL(mg/kg)
Background(mg/kg)
Max conc(mg/kg)
Remedy or NFA(mg/kg) Tier Source
area size (acres)
(mg/kg) Tier Source area size(acres)
1 GWSoil includes GWSoilIng, GWSoilClass3, AirGW-SoilInh-V, and GWSoil for secondary MCLs, as applicable.2 Repeat the table if needed for differing off-site land uses.
TCEQ-10325/APAR June 2005 64

Figure 11A - Surface Soil PCLE Zone MapsThe purpose of these maps is to illustrate the distribution of NAPL and COCs in surface soils and clearly identify the areas in soil that exceed the critical PCL (PCLE zones). In order to avoid duplicate maps, when the land use for purpose of critical PCL development is residential, use Figure 4A to depict the surface soil PCLE zones. If the land use is commercial/industrial, provide surface soil PCLE zone maps here. Include in the maps the soil sampling points and maximum COC concentrations with corresponding sample depths at each sampling point, relevant surface and subsurface features, and isoconcentration contour(s) representing the critical PCL values. Label the contour lines with the critical PCL values and include critical PCL values in the legend. If exposure areas are used to determine if a remedy is required, illustrate those exposure areas over the area enclosed by the critical PCL contour line and highlight those exposure areas which fail. As long as the information is legible, several COCs may be grouped on one map.
Figure 11B - Subsurface Soil PCLE Zone MapsThe purpose of these maps is to illustrate the distribution of NAPL and COCs in subsurface soils and clearly identify the areas in soil that exceed the critical PCL (PCLE zones). In order to avoid duplicate maps, when the land use for purpose of critical PCL development is residential, use Figure 4B to depict the subsurface soil PCLE zones. If the land use is commercial/industrial, provide PCLE zone maps here. Include in the maps the soil sampling points, maximum COC concentrations with corresponding sample depths at each sampling point, relevant surface and subsurface features, and isoconcentration contour(s) representing the critical PCL value. Label the contour lines with the critical PCL values and include the critical PCL values in the legend. As long as the information is legible, several COCs may be grouped on one map.
Figure 11C – Cross Sections of the PCLE ZoneIf the cross sections provided in Figure 4C do not depict the surface and subsurface soil PCLE zone(s), then present the PCLE zone cross section here. Construct a minimum of two cross sections using at least 3 representative points perpendicular to each other through the most contaminated or widest portion of the PCLE zone. For affected properties with monitor wells, construct one cross section approximately parallel to the COC transport direction and one approximately perpendicular to COC transport direction. Illustrate affected property stratigraphy using the boring logs through the total depth of the borings/monitor wells or water well if used in the cross section. Indicate the cross section lines on the map(s) in Figures 11A and 11B, or Figures 4A and 4B, as applicable. Submit additional cross sections as needed to effectively portray subsurface conditions.
Include the following for the cross sections:$ boring or monitor well identification numbers,$ interpolated stratigraphy and groundwater-bearing units between each boring/monitor well from
ground surface to maximum depth assessed,$ groundwater-bearing units and aquitards,$ sample locations,$ areas exceeding the critical PCL (PCLE zone) for each media (soils - surface, subsurface, and
groundwater - each groundwater-bearing unit, surface water, sediment),$ COC concentrations at critical sampling points,$ the distribution of NAPL,$ potentiometric level surface or water table based on static groundwater level in each monitor
well,$ monitor well screened intervals,$ structural features or other migration pathways,$ subsurface conduits, underground utilities, and $ compass directions of the cross sections.
TCEQ-10325/APAR June 2005 65

Section 12 Groundwater Critical PCL DevelopmentUse this section of the report to document the development of Tier 2 or 3 groundwater PCLs and complete the groundwater critical PCL evaluation for those COCs not screened from PCL development. Repeat the subsections and tables as necessary for each groundwater-bearing unit.
Section 12.1 Tier 2 or 3 PCL Development and Non-Default Parameters
Tier 2 and 3 DevelopmentDescribe the development of the Tier 2 or 3 groundwater RBELs and PCLs. Provide a brief discussion of the equations and/or models used to calculate the RBELs and PCLs. For Tier 3, provide the rationale for selecting the model used and demonstrate that the model is appropriate. Repeat calculations, discussions, tables, and figures for off-site properties as needed to describe the development of different PCLs. If the model has been calibrated or a sensitivity analysis has been performed, provide a discussion of the methods and results of these evaluations.
Non-Default Affected Property ParametersProvide a discussion of non-default parameters used to calculate Tier 2 or 3 groundwater RBELs and PCLs. Explain how the parameters were measured or estimated, and justify why these parameters are appropriate for the affected property. If only one measurement of the parameter was made, explain how that value is representative of conditions throughout the affected property and/or how that the value conservatively estimates the range of conditions present. Provide references in Appendix 16 for literature values used and explain how the values are appropriate for the affected property.
Provide the equations and default and non-default parameters used, the calculations, and the results of calculations in Appendix 9. Submit verification that the TCEQ Executive Director has approved a variance from default exposure factors for average time (AT.w), exposure duration (ED.w), or exposure frequency (EF.w) in accordance with §350.74(j)(2).
Groundwater to Surface Water Dilution FactorsDiscuss how the surface water dilution factor was established. Describe how site-specific base flow conditions for groundwater and the 7Q2 conditions for the receiving water body were determined. Provide justification for the parameters utilized in the calculations or models. Provide the equations, input parameters, and/or models in Appendix 9. Refer to Determining PCLs for Surface Water and Sediment (RG-366/TRRP-24).
Section 12.2 Groundwater PCL Adjustments
Discuss the evaluation of cumulative risk or hazard index to determine the need to adjust PCLs and discuss the logic and methods used to make the adjustments. Provide documentation of the PCL adjustments using the tables provided in Appendix 9. If there are ten or more COCs in one medium, and a risk level and hazard check is not done in Appendix 9, explain why the risk level and hazard check is not necessary. Refer to Risk Levels, Hazard Indices, and Cumulative Adjustments (RG-366/TRRP-18) and Tiered Development of Human Health PCLs (RG-366/TRRP-22) for guidance.
If aesthetics are an issue, discuss the situation and explain how the situation will be corrected.
TCEQ-10325/APAR June 2005 66

Section 12.3 Groundwater Critical PCLs
Provide a discussion of how the critical PCL for groundwater was developed for each COC. Identify the potential receptors (human and ecological) and the associated exposure pathway. Describe, if applicable, the site-specific scenarios where the exposure pathways and critical PCLs vary due to different receptors or POEs.
TCEQ-10325/APAR June 2005 67

Table 12A - Groundwater Critical PCLs - Full Plume POEUse this table to perform a groundwater critical PCL evaluation applicable to the points of exposure throughout the affected groundwater. List each COC with its maximum concentration to compare to its critical PCL to determine if a remedy is required. For each COC, highlight the value that is the critical PCL and highlight the maximum concentration that exceeds the critical PCL. If representative concentrations were developed as allowed in Determining Representative Concentrations (RG-366/TRRP-15), provide justifications and calculations in Appendix 8. If groundwater discharges to surface water, complete Tables 12B, 12C, and 12D to determine the groundwater critical PCL applicable only to the POEs at the groundwater to surface water interface.
Table 12A. Groundwater Critical PCLs – Full Plume POEGroundwater-bearing unit:Repeat table for each applicable groundwater-bearing unit.Date of the Tier 1 PCL tables used in the determination of PCLs:
On-Site Groundwater Critical PCLsLand use for purpose of PCL development: Residential Commercial/industrial
COC GWGWIng
PCL
AirGWInh-V
PCLEcological PCL for
groundwater1MQL
(mg/L)Background
(mg/L)Conc
(mg/L)Remedy or
NFA
(mg/L) Tier (mg/L) Tier (mg/L) Tier Max Rep2
Off-Site Groundwater Critical PCLsLand use for purpose of PCL development3: Residential Commercial/industrial
COC GWGWIng
PCLAirGWInh-V
PCLEcological PCL for
groundwater1MQL
(mg/L)Background
(mg/L)Conc
(mg/L)Remedy or
NFA(mg/L) Tier (mg/L) Tier (mg/L) Tier Max Rep2
1 This pathway is applicable for direct contact with groundwater, such as cave invertebrates or salamanders.2 Provide justifications and calculations for use of representative concentration in Appendix 8.3 Repeat the table if needed for different off-site land uses.
TCEQ-10325/APAR June 2005 68

Table 12B - Groundwater-to-Surface Water PCLsComplete this table when the groundwater-to-surface water pathway is complete or reasonably anticipated to be complete (note: also complete Section 6). Use this table to summarize the groundwater-to-surface water PCLs calculated to protect human health and ecological receptors. Include the surface water critical PCL from Table 6A and the groundwater-to-surface water dilution factor used in cross-media PCL calculations, if applicable. Repeat the table for each applicable groundwater-bearing unit.
Table 12B. Groundwater-to-Surface Water PCLsGroundwater-bearing unit:
COC SW critical PCL(mg/L)1
Groundwater-to-surface water dilution
factor
SWGWcritical PCL2
(mg/L)
Table 12C - Groundwater-to-Sediment PCLsComplete this table when the groundwater-to-sediment exposure pathway is complete or reasonably anticipated to be complete (also complete Section 7). Use this table to summarize the groundwater-to-sediment PCLs calculated to protect human health and ecological receptors. Include the sediment critical PCL from Table 7A and the surface water mixing factor for the affected property, if applicable. Refer to Determining PCLs for Surface Water and Sediment (RG-366/TRRP-24). Repeat the table for each applicable groundwater-bearing unit.
Table 12C. Groundwater-to-Sediment PCLsGroundwater-bearing unit:
COC Sed critical PCL(mg/kg)3
Surface water mixing factor4
Ksed-w
(mg/L-gw/mg/kg-sed)
SedGW critical PCL5
(mg/L)
1 From Table 6A.2 Equals results of Table 12B second column divided by the value in the third column.3 From Table 7A.4 Default is 1.5 Equals product of Table 12C columns 2, 3, and 4.
TCEQ-10325/APAR June 2005 69

Table 12D - Groundwater Critical PCL Evaluation - Surface Water/Sediment Discharge POEUse this table to perform a groundwater critical PCL evaluation applicable to the POEs located at the groundwater-to-surface water interface. In order to complete this evaluation, compare the critical PCLs determined for groundwater (Table 12A), groundwater-to-surface water (Table 12B), and groundwater-to-sediment (Table 12C). The lesser of these PCLs is the critical PCL for the POEs at the groundwater-to-surface water interface. Highlight the maximum or representative concentration that exceeds the critical PCL. Repeat the table for each applicable groundwater-bearing unit.
Table 12D. Groundwater Critical PCL Evaluation - Surface Water/Sediment Discharge POEGroundwater-bearing unit:
COC GW Critical PCL1
(mg/L)
SWGW critical PCL2
(mg/L)
SedGW critical PCL3
(mg/L)
Critical PCL for GW-SW
POE4
(mg/L)
Conc at GW-SW POE
(mg/L)
At GW-SW POE, remedy
or NFA?
Max Rep5
Figure 12A - Groundwater PCLE Zone MapThe purpose of these maps is to illustrate the distribution of NAPL and COCs in groundwater and clearly identify the areas in groundwater that exceed the critical PCL (PCLE zones). In order to avoid duplicate maps, when the land use for purpose of critical PCL development is residential, depict the PCLE zones on the groundwater COC concentration maps in Figure 5B. If the land use is commercial/industrial, provide PCLE zone maps here. Include in the maps the groundwater sampling points, maximum COC concentrations or measured NAPL thickness at each sampling point, relevant surface and subsurface features, and isoconcentration contour(s) representing the critical PCL value. Label the contour line with the critical PCL value and include the critical PCL value in the legend. As long as the information is legible, several COCs may be grouped on one map.
1 From Table 12A, on-site or off-site, whichever is appropriate for this POE.2 From Table 12B3 From Table 12C4 Lowest of the values in the three previous columns.5 Provide justifications and calculations for use of representative concentrations in Appendix 9.
TCEQ-10325/APAR June 2005 70

Section 13 NotificationsThe purpose of this section is to describe the notifications that have been completed or will be completed under §350.55. Refer to Notification Requirements (RG-366/TRRP-17) for guidance on the conditions that require notice.
Section 13.1 Notification of Actual or Probable ExposureProvide a summary of the notifications made to people who are actually or probably exposed to COCs. Describe data collected which indicated that a notification was necessary, explain the exposure situation, and discuss the content of the notifications. Provide copies of the notification letters in Appendix 1. For notifications that have not yet been completed, explain problems that have arisen during the notification process and provide a time frame and method in which the parties will be notified.
Section 13.2 Other NotificationsDescribe other situations that require notice to property owners and/or easement holders/franchisees under §350.55. Describe data collected that indicated that a notification was necessary and discuss the content of the notifications. Provide a notarized statement that notifications were completed in Appendix 1. For notifications that have not yet been completed, explain problems that have arisen during the notification process and provide a time frame and method by which the parties will be notified.
Table 13A - Notification SummaryUse this table to identify the real properties for which notification is required. Assign each real property an ID that is then used on Figure 13A to distinguish property locations. In the Reason for Notification column, specify if notification was required for an actual or probable exposure or another situation that prompted notification. If actual or probable exposure necessitates the notification of tenants/lessees or other persons related to the property usage, provide a list of the persons, their mailing addresses, and telephone numbers with Table 13A and identify the property which with they are associated.
Table 13A. Notification SummaryProperty
IDProperty owner name
Physical property address, city, zip
Property owner mailing address,
city, state, zip
Property owner phone no.
Contact name, mailing address, city, state, zip (if different
from owner)
Reason for notification
Figure 13A - Notification MapInclude a large-scale map that illustrates the locations of the properties, including rights of way and easements, that require notification. Label each property with the property ID assigned in Table 13A. Illustrate the legal property boundary and the relevant affected property boundary as defined by the assessment levels. To eliminate this figure, this information may be presented in Figure 1A or 1B if the scale is appropriate.
TCEQ-10325/APAR June 2005 71

AppendicesAppendix 1 NotificationsProvide copies of notification to affected landowner(s) or other entities requiring notification. Document that the required notices have been completed by providing a notarized statement of such fact including the names and addresses of persons receiving direct notice, such as mail, personal contact, public meeting, fliers, etc. Refer to Notification Requirements (RG-366/TRRP-17) for guidance.
Appendix 2 Boring Logs and Monitor Well Completion DetailsFor each boring drilled or monitor well installed during the assessment, provide a soil boring log with monitor well completion details if applicable. Include in the boring log:
elevation of ground surface referenced to mean sea level, soil description and classification, moisture content, depth at which groundwater was encountered while drilling, visual confirmation of NAPL, such as staining, identification of groundwater-bearing units and saturated zones, field-screening results and field-screening sample locations, sample locations submitted for laboratory analyses, depth markings, sample type (Shelby tube, split spoon, etc.), boring diameter, date drilled, name of the person who logged the well, and drilling method.
Include in the monitor well completion details: elevation of top and bottom of casing referenced to mean sea level, static water level and date measured (referenced from both depth below ground surface and mean
sea level), screened interval and slot size, casing interval and diameter, sand pack grain size and interval, date(s) of installation, cement and grout interval.
If the assessment was conducted solely by excavation, indicate such and provide lithologic descriptions and the other information requested to the extent appropriate.
Appendix 3 Monitor Well Development and Purging DataSubmit monitor well development and purging data in a table or provide in photocopies of field notes that specify water quality stabilization parameters, turbidity measurements, water-level measurements while purging, flow rates, and the other parameters measured during well development and purging.
Appendix 4 Registration and Institutional ControlsInclude in this appendix copies of the Industrial and Solid Waste Notice of Registration (NOR), MSD documentation (a copy of the ordinance, deed restriction, and a copy of the MSD certificate and a map that illustrates the boundary of the MSD and the affected property), and/or existing institutional controls restricting well installation or other uses of the property.
TCEQ-10325/APAR June 2005 72

Appendix 5 Water Well RecordsInclude a copy of the State Well Report and companion documents (water quality analysis, undesirable water reports, etc) completed by the driller for each water well identified in the receptor surveys. Also include in this appendix other documentation on the water wells, including information from state agency databases and records, published reports (particularly those by the Texas Water Development Board and Bureau of Economic Geology), records from groundwater conservation districts or subsidence districts, and records from other entities with information on the water well(s). Document the presence or absence of water wells and the primary sources of information researched to come to this conclusion.
Appendix 6 Monitor Well RecordsProvide a copy of the State Well Report completed by the driller for each installed monitor well. For information on completing State Well Reports, contact the Texas Department of Licensing and Regulation at 800-803-9202 or 512-463-6599 or http://www.tdlr.state.tx.us. Appendix 7 Aquifer Testing DataFor the aquifer tests performed on each groundwater-bearing unit, provide a narrative description of the work performed and the conclusions drawn. Identify the monitor wells used and provide an analysis of the field data, governing equations, sample calculations, assumptions, limitations in the collection of data, and justification for choosing the test method based on the site conditions. Provide a table of field measurements and input parameters such as transmissivity, hydraulic conductivity, storage coefficient of the aquifer, optimum sustainable groundwater pumping rate, and groundwater capture zone/radius of influence. Also provide a graph of well plots showing time of drawdown/buildup (or recovery for a slug test). Refer to the appropriate figure(s) which illustrate the locations of wells utilized.
Appendix 8 Statistics Data Tables and CalculationsUse this appendix to document data and statistical calculations used to determine site-specific background or representative concentrations of COCs in the following situations:
1. for calculating the site-specific background value, used as the residential assessment level or the critical PCL, for direct comparison to the individual samples from the assessed environmental medium data, as provided in §350.51(l) and §350.79(1);
2. for calculating a representative concentration (the upper confidence limit (UCL)) from the sample data from the environmental medium within an exposure area for statistical comparison to the critical PCL, or an alternative statistical method which meets the performance criteria required in §350.79(2)(A); or
3. for statistically comparing the environmental medium data set within an exposure area to the site-specific background data set, meeting the performance criteria required in §350.79(2)(B).
When applicable, include a map of exposure areas and provide justification for the placement and size of the exposure areas. Provide full documentation of the statistical comparisons including, but not limited to, the name and description of the statistical method(s) used and a list of statistical parameters and assumptions. Provide tables that, at a minimum, contain the following for each media: COC or parameter type, concentration, sample depth or interval, total number of samples used in the statistical calculation, and the statistical value calculated. Non-detect analytical results should be assigned a proxy value in accordance with §350.51(n). Either provide a map illustrating the sample locations used in the statistical calculations, or reference the appropriate figure in this report in which those samples have been specifically denoted.
Appendix 9 Development of Non-Default RBELs and PCLsInclude in this appendix the equations, calculations, detailed explanations beyond that provided in other sections, justification, input parameters, results, and supporting documentation associated with the development of non-default RBELs and Tier 2 and 3 PCLs. Refer to Tiered Development of Human
TCEQ-10325/APAR June 2005 73

Health PCLs (RG-366/TRRP-22). Also include in this appendix the information on development of TPH PCLs (refer to Development of Human Health PCLs for Total Petroleum Hydrocarbon Mixtures (RG-366/TRRP-27). Be sure to clearly label the information to adequately identify the COC, the input parameters, the model used, and the tier under which the evaluation was conducted. Document the applicability of non-default input parameters with lab reports, calculations, maps, or other justification. If PCLs have been adjusted due to cumulative risk/hazard level, aesthetic concerns, residual soil saturation, or theoretical soil vapor calculations, complete the appropriate tables and discuss the logic and methods used to make the adjustments. Support non-default input parameters and development of Tier 2 and 3 PCLs with complete documentation and justification. Unsubstantiated information will be considered invalid. Exposure factors that cannot be varied are listed in §350.74. Include verification that the TCEQ Executive Director has approved a variance from default exposure factors.
For convenience, Tier 2 tables are provided in this appendix. Use the tables only as necessary. Repeat the tables as necessary to document PCL development for different media, and for differing PCLs on-site and off-site. If Tier 3 PCLs were calculated, develop tables to document the inputs. If a Tier 2 dilution factor was calculated, provide maps and cross sections, if not referenced elsewhere in the report, to illustrate the location and measurements for deriving the inputs.
TCEQ-10325/APAR June 2005 74

Appendix 9 Tables
COC Chemical/Physical Parameters and Toxicity Factors
Use these two tables only when a parameter was changed from that listed in rule or guidance. If a parameter different from that listed in rule or guidance was not used, do not submit this table. Provide in this appendix the associated supporting documentation. See Toxicity Factors and Chemical/Physical Parameters (RG-36/TRRP-19) for more information.
Properties for many COCs are listed in the Chemical/Physical Properties table in the Tier 1 PCL tables available on the TRRP web page. Use this table to list ONLY those COCs that are not included in the rule or web page or those COCs for which the person changed the value from a Tier 1 default. Only complete the portions that apply to these particular COCs. Note that values for shaded columns may not be changed from values listed in the rule. Include the calculations in this appendix and document the sources of information for those properties changed in accordance with §350.73(e). Do not complete this table for those COCs where the properties are the same as those listed in Figure 30 TAC 350.73(e) or in the chemical/physical properties table available from http://www.tnrcc.state.tx.us/permitting/trrp.htm.
COC Physical state
Type M.W.(g/mole)
H'(cm3-H2O/cm3-air)
LogKoc LogKd Dair
(cm2/s)Dwat
(cm2/s)Solubility
(mg/l)Vapor
pressure(mm Hg)
Log Kow BrAbg
(g soil/g D.W.)
BrBg
(g soil/g D.W.)
Physical state s - solid at 20oC; l - liquid at 20oC; g - gaseous at 20oC; Kd Soil-water partition coefficient (cm3-H2O/g-Soil)Type O: organic; I: inorganic; M: metal; OA: organic acid Dair Diffusion coefficient in air (cm2/s)M.W. Molecular weight (g/mole) Dwat Diffusion coefficient in water (cm2/s)
H' Dimensionless Henry's Law Constant H' = H x 41.57 at 20oC (cm3-H2O/cm3-air) Kow Octanol-water partition coefficient (cm3-H2O/cm3-Octanol)H Henry's Law Constant (atm-m3/mole) BrAbg Soil-to-above ground plant biotransfer factor (g soil/g plant tissue dry weight)
Koc Soil organic carbon-water partition coefficient (cm3-H2O/g-Carbon) BrBg Soil-to-below ground plant biotransfer factor (g soil/g plant tissue dry weight)
List the COCs not included in the Toxicity Factors Table. Do not complete this table if the toxicity factors are the same as those in the Toxicity Factors Table as provided in the Tier 1 PCL tables at http://www.tnrcc.state.tx.us/permitting/trrp.htm. Note that the toxicity factors must be provided by the TCEQ before use.
Provide the date of the toxicity factors table used:
COC Reference concentration
RfC1
(mg/m3)
Oral reference dose RfDo
(mg/kg-day)
Dermal reference dose RfDd
(mg/kg-day)
Dermal slope factor SFd
(mg/kg day)
Oral slope factor SFo
(mg/kg day)
Inhalation unit risk factor URF
(µg/m3)
Relative bioavailability factor
RBAF(unitless)
Dermal absorption fraction ABS.d2
(unitless)
Gastrointestinal absorption fraction
ABSGI
(unitless)
1 When no RfC or URF is available, use the most current TCEQ Chronic Remediation-Specific Effects Screening Level value as the RfC.2 It is not necessary to calculate a soil dermal contact RBEL for COCs with a vapor pressure in mm HG 1.TCEQ-10325/APAR June 2005 75

Surface Soil - TotSoilComb
Tier 2 EvaluationUse these tables to document the derivation of Tier 2 TotSoilComb PCLs. Show the calculations in this appendix.
Specify if table is for on-site or off-site property On-site Off-siteOff-site land use(s) for purpose of PCL development1: Residential Commercial/industrial
Soil bulk
density b
(g/cm3)
Total porosity
T
(cm3/cm3)
Volumetric water
contentws
(cm3/cm3)
Volumetric air content
as
(cm3/cm3)
Fraction organic carbon
foc(g/g)
Garden soil
fraction organic carbon
foc(g/g)
Fraction vegetative
coverV
Wind speed
Um
(m/s)
Equivalent threshold value of
windspeedUt
(m/s)
Function dependent on
(Ut/Um) F(x)
Averaging timeAT.w
(years)
Exposure duration
ED.w(years)
Exposure frequency
EF.w(days/yr)
Tier 1 defaults 1.67 0.37 0.16 0.21 0.008 0.008 0.50 4.80 11.32 0.224 25 25 250Tier 2 values
COC
Source area size
(acres)
Affected soil
thicknessds
(cm)
Q/CVFss PEF
Carcinogenic NoncarcinogenicTotSoilComb
PCL(mg/kg)
Air
RBELInh-c
Soil
RBELIng-c
Soil
RBELDerm-c
AbgVeg
RBELIng-c
BgVeg
RBELIng-c
PCLAir
RBELInh-nc
Soil
RBELIng-nc
Soil
RBELDerm-nc
AbgVeg
RBELIng-nc
BgVeg
RBELIng-nc
PCL(mg/m3/mg/kg)
1 Repeat the table if needed for different off-site land uses.
TCEQ-10325/APAR June 2005 76

Surface and Subsurface Soil - GWSoil
Tier 2 Evaluation
Specify media to which tables apply Surface soil Subsurface soil
Specify if table is for on-site or off-site property On-site Off-siteOff-site land use(s) for purpose of PCL development1: Residential Commercial/industrial
Soil bulk density
b
(g/cm3)
Volumetric water
contentws
(cm3//cm3)
Volumetric air content
as
(cm3//cm3)
Fraction organic carbon
foc(g/g)
Groundwater Darcy
velocityUgw
(cm/year)
Aquifer thickness
bgw
(m)
Ground-water
gradienti
(m/m)
Hydraulic conductivity
K(m/day)
Average annual precipitation
P(cm/yr)
Net infiltration
rateIf
(cm/yr)
Saturated hydraulic
conductivity of vadose zone
soilsKvs
(cm/s) Tier 1 defaults 1.67 0.16 0.21 0.002 NA NA NA NA NA NA NATier 2 values
COC Critical GW PCL(from Table 12A)
Affected soil thickness
L1
(cm)
Depth from top of affected soil
to gw tableL2
(cm)
Source area width parallel
to gw flowWs
(m)
GW mixing zone
thicknessgw
(m)
Soil-leachate partition factor
Ksw
(mg/L/mg/kg)
Lateral dilution factorLDF
GWSoil PCL(mg/kg)
(mg/L) pathway2
1 Repeat the table if needed for different off-site land uses.2 Specify the pathway for the critical groundwater PCL (GWGWIng, GWGWClass3, AirGWInh-V , ecological PCL (eco), SWGW, etc.)
TCEQ-10325/APAR June 2005 77

Subsurface Soil – AirSoilInh-VTier 2 Evaluation
Specify if table is for on-site or off-site property On-site Off-siteOff-site land use(s) for purpose of PCL development1: Residential Commercial/industrial
Soil bulk density
b
(g/cm3)
Total porosityT
(cm3/cm3)
Volumetric water content
ws
(cm3/cm3)
Volumetric air content
as
(cm3/cm3)
Averaging time2
AT.w(years)
Exposure duration2
ED.w(years)
Exposure frequency2
EF.w(days/yr)
Tier 1 defaults 1.67 0.37 0.16 0.21 25 25 250Tier 2 values
COCSource area
size(acres)
Affected soil thicknessds (cm)
Q/CKd
(cm3-water/g-soil)
VFss(mg/m3/mg/kg)
Carcinogenic Noncarcinogenic AirSoilInh-V PCL(mg/kg)AirRBELInh-c PCL AirRBELInh-nc PCL
1 Repeat the table if needed for different off-site land uses.2 Prior approval from the TCEQ Executive Director is required for the variance (see §350.74(j)(2)).
TCEQ-10325/APAR June 2005 78

Theoretical Soil Saturation Limit (Csat)
Use these tables to determine a property-specific theoretical soil saturation limit in order to demonstrate the volatilization pathways are not applicable for a particular COC. See §350.75(i)(8) for applicability. Support non-default parameters by providing supporting documentation, the equation, and calculations in this appendix.
Specify media to which tables apply Surface soil Subsurface soil
Volumetric water content in vadose
soilsws
(cm3/cm3)
Volumetric air content in
vadose soilsas
(cm3/cm3)
Fraction organic carbon in soil/gw
Foc
(g/g)
Soil bulk densityb
(g/cm3)
Tier 1 0.16 0.21 0.002 1.67Tier 2
COC Aqueous solubility of pure COC
S(mg/L)
Henry’s Law Constant (air-water partition
coefficient)H
Soil-water partition
coefficientKd
(cm3/g)
Organic carbon partition
coefficientKoc
(cm3/g)
Csat PCL(mg/kg)
Residual Soil Saturation Limit
Use these tables to determine the presence of NAPL and estimate the concentration of an organic COC at which NAPL becomes mobile. See §350.75(i)(9) for applicability. Support non-default parameters by documentation and explanation. Support non-default parameters by providing supporting documentation, the equation, and calculations in this appendix.
Specify media to which tables apply Surface soil Subsurface soil
Residual saturation
Ressat
(cm3/cm3)
Total soil porosity
(cm3/cm3)
Density of NAPLNAPL
(g/cm3)
Soil bulk densityb
(g/cm3)
Tier 1 0.045141 0.37 1 1.67Tier 2
COC SoilRes PCL(mg/kg)
1 The value listed in the rule is in error.
TCEQ-10325/APAR June 2005 79
Risk Level and Hazard Check
Specify media to which table applies Surface soil Subsurface soil Groundwater
Use this table to document the adjustment of a PCL based on cumulative risk. Repeat this table for each complete or reasonably anticipated to be complete exposure pathway in the medium for which there are 10 or more carcinogens or 10 or more noncarcinogens acting through a single exposure pathway. When adjusting the TotSoilComb PCL using exposure areas, specify the exposure area to which the adjustment applies. Do not use this table for GWSoil, GWGWClass3, or SWGW.
Complete this form for both the carcinogenic and noncarcinogenic effects for each COC for each human health exposure pathway using PCLs calculated at chosen tier. For example, for a given exposure pathway, if a Tier 1 PCL is calculated for COC “X,” a Tier 2 PCL is calculated for COC “Y,” and a Tier 3 PCL is calculated for COC “Z,” those PCLs are included in the table together and are not segregated by tier. This is a precursor to establishing critical PCLs. If a PCL was not established because of lack of an applicable toxicity factor, input “NA” for the COC in the applicable column. For TPH, complete only the noncarcinogenic portion and do not handle concurrently with the other non-TPH COCs. TPH is treated in isolation. See TCEQ guidance document Risk Levels and Hazard Indices (RG-366/TRRP-18) for specific information on cumulative adjustments and Development of Human Health PCLs for Total Petroleum Hydrocarbon Mixtures (RG-366/TRRP-27) for TPH.
COC` Carcinogenic Endpoint Non-Carcinogenic Endpoint
PCLi-adj PCLi
(mg/kg or mg/L)
PCLi-adj/PCLi
(ratio)PCLi-adj PCLi
(mg/kg or mg/L)
PCLi-adj/PCLi
(ratio)
Cumulative Risk Level (RL): Hazard Index (HI):
TCEQ-10325/APAR June 2005 80

Groundwater Non-Default Affected Property Parameters
Name(s) of groundwater-bearing unit(s):
COC-Specific Affected Property ParametersCOC Cross sectional area of
air emissions source A (m2)
Length of air emissions source parallel to wind
direction L (m)
Affected Property ParametersTerm Affected property parameters Tier 1 defaults Value used for
Tier 2/3GW pH Measured groundwater pH NA
y Transverse air dispersion coefficient (m)(dispersion estimates based on the Pasquill-Gifford system adopted by U.S. Public Health Service, Turner, 1970, EPA Workbook of Atmospheric Dispersion Estimates; see Cooper & Alley, 1994, Air Pollution Control)
NA
z Vertical air dispersion coefficient (m)(dispersion estimates based on the Pasquill-Gifford system adopted by U.S. Public Health Service, Turner, 1970, EPA Workbook of Atmospheric Dispersion Estimates; see Cooper & Alley, 1994, Air Pollution Control)
NA
Q Air volumetric flow through mixing zone (m3/s) NA
TCEQ-10325/APAR June 2005 81

Groundwater – GWGWIng1 or GWGWClass3
1 and AirGWInh-V
Groundwater-bearing unit: Repeat tables for each groundwater-bearing unit.Specify if table is for on-site or off-site property On-site Off-siteOff-site land use(s) for purpose of PCL development2: Residential Commercial/industrial
Tier 2 EvaluationTotal
porosity(vadose zone)
T
(cm3/cm3)
Volumetric water content(vadose zone)
ws
(cm3/cm3)
Volumetric air content of vadose zone
soilsws
(cm3/cm3)
Volumetric water
content(capillary
fringe)wcap
(cm3/cm3)
Volumetric air content(capillary
fringe)acap
(cm3/cm3)
Vadose zone
thicknesshv
(cm)
Capillary fringe
thicknesshcap
(cm)
Depth to gwLgw
(cm)
Average windspeed
Uair
(cm/sec)
Ambient air mixing zone
heightair
(cm)
Averaging time3
AT.w(years)
Exposure durationErr
or:Referencesource not
foundED.w
(years)
Exposure frequencyError:
Reference source not
found
EF.w(days/yr)
Tier 1 defaults 0.370 0.16 0.21 0.333 0.037 300 5 305 240 200 25 25 250Tier 2 values
COC Source area width
Wg
(cm)
VFwamb
(mg/m3/mg/
L)
Carcinogenic Noncarcinogenic MCL, MCL2 or
EPA4
GWGWIng or GWGWClass3
PCL
AirGWInh-V PCLGWRBELIng or GWRBELClass3
PCL GWRBELInh PCL GWRBELIng or GWRBELClass3
PCL GWRBELInh PCL
(mg/L) >S5 (mg/L) >S
1 Only applies for COCs for commercial/industrial land use without an MCL and those for which a variance under §350.74(j)(2) is obtained.2 Repeat the table if needed for different off-site land uses.3 Prior approval from TCEQ Executive Director for the variance is required (§350.74(j)(2)).4 Specify whether the PCL is based on the MCL, secondary MCL, or other EPA value.5 Specify if PCL exceeds the aqueous solubility limit.
TCEQ-10325/APAR June 2005 82

Groundwater - SWGW and SedGWProvide a map that illustrates how the input parameters were measured or determined.
Groundwater-bearing unit:Repeat tables for each affected GWBU discharging to surface water.Surface water body:
Parameter Selection for Tier 2 Dilution Factor ModelsTerm Description Defaults Value Used
7Q2 flow rate Seven-day low-flow occurring on average every two years (cm/s) NAUgw Groundwater Darcy velocity (cm/yr) NAK Hydraulic conductivity (cm/s) NAi Lateral hydraulic flow gradient (cm/cm) NAp Thickness of affected groundwater (cm) in excess of the SWRBEL
or the SWeco1
NA
pi Thickness of affected groundwater in excess of SWRBEL discharging to surface water stream1 (cm)
NA
Lm Influent width of groundwater PCLE zone at point of discharge to surface water1 (cm)
NA
Qigw Average influent flow of affected groundwater to surface water1 (cm3/s)
NA
Vsw Average surface water velocity in groundwater discharge mixing area (cm/s)
lake: 0.5 cm/stidal water: 1 cm/slarge river (>100 cfs): 3.5 x (7Q2)0.5 cm/s
Wsw Distance from the shore extending into the surface water body through which affected groundwater discharges through sediment into surface water1 (cm)
NA
hsw Depth of surface water mixing area above the affected groundwater discharge to surface water (cm)
30
Qsw Flow of surface water through the surface water mixing area - 7Q2 flow for a stream with 7Q2 ≤ 100 cfs or mixing area flow for other water body (cm3/s)
NA
sed Sediment bulk density (g/cm3) 1.67T Total sediment porosity (cm3/cm3) 0.37foc Fraction organic carbon in sediment (g/g) 0.01
Ksed-w Sediment-groundwater partition coefficient (mg/L/mg/kg) NASWMF Surface water mixing factor 1
COC SWRBEL or SWeco
(mg/L)DF SWGW
(mg/L)Tier
COC Sediment RBEL
kd kocSedGW(mg/L)
Tier
1 This value may be determined for each COC if desired. If so, attach separate table listing the value used for each COC.TCEQ-10325/APAR June 2005 83
Appendix 10 Laboratory Data Packages and Data Usability SummaryUse this appendix to provide lab reports and supporting information. Print lab reports double-sided and also include with the report a CD with the lab reports in pdf format. Submit one data usability summary for all the data (field and laboratory) used in this APAR. Report data in conformance with the TCEQ guidance document Review and Reporting of COC Concentration Data (RG-366/TRRP-13). For each laboratory data package submitted with the APAR, provide a signed laboratory data package cover page (LDCP) and the items listed on the LDCP. The LDCP form is provided in Appendix A of Review and Reporting of COC Concentration Data (RG-366/TRRP-13).
Appendix 11 Miscellaneous Assessment Include the results of assessment or sampling activities that are not included in the media sections. This section may be used to describe geophysical investigations such as seismic surveys, ground-penetrating radar surveys, and resistivity surveys; wipe samples; waste sampling (other than for waste classification purposes); concrete slab sampling; biota sampling (flora or fauna); food sampling; and other topics applicable to the assessment. Include tables and figures as necessary to summarize and illustrate assessment results.
Appendix 12 Waste Characterization and Disposition Documentation Use this appendix to document waste characterization and disposition of wastes associated with an assessment or remediation, including investigation derived waste and other wastes generated during field activities. Describe the wastes generated and the results from the completed waste classification and disposal/treatment activities. Supporting documentation may include written documentation and process knowledge. Provide copies of waste characterization sample analytical data packages.
Appendix 13 Photographic DocumentationIf not provided elsewhere, include relevant dated and oriented photographs depicting the affected property and field activities (e.g., potential source areas, surrounding properties, abatement activities, etc.).
Appendix 14 Standard Operating ProceduresUse this appendix to provide copies of the standard operating procedures followed during field activities (for example, sampling methods, drilling methods).
Appendix 15 OSHA Health and Safety Plan (§350.74(b)(1))Use this appendix only for documentation supporting the use of an available eight-hour time weighted average occupational inhalation criteria as the air inhalation RBEL. Provide documentation of the health and safety plan, a certification that the plan is followed, and the demonstration that offsite receptors are protected per §350.74(b)(1).
Appendix 16 Reference ListIn order to document the sources of information included in this report, provide a complete list of references, including personal communications, reports, books, published and unpublished documents, databases, maps, and other sources of information used in this report. Specify for each reference, as applicable, the author, date, title of the article, book, periodical, or report, publisher, date of publication, issue information (edition, volume, issue number, date); page reference, and URL. Specify for database references the source of the database, the name of the database, and the date the information was acquired. Include for personal communication references the name of the person contacted, the date of contact, and the method of contact (phone, letter, etc). Clearly identify each item in the report that has a reference in this appendix using either superscript numbers or author-date citation (for example, Adams 1999). List references in the order in which they appear. Note that unsubstantiated information may be considered invalid.
TCEQ-10325/APAR June 2005 84