viewpoints edf measures as overlays to credit ratings
TRANSCRIPT

VIEWPOINTS
NOVEMBER 20, 2017
CREDITEDGE RESEARCH
Moody’s Analytics markets and distributes all Moody’s Credit Risk Analytics Group materials. Moody’s Analytics does not provide investment advisory services or products. For further detail, please see the last page.
EDF Measures as Overlays to Credit Ratings
A Way to Enhance Performance and Control Credit Risk in Corporate Bond Portfolios
Using credit risk dispersion to find mispriced bonds Corporate bond fund managers have long used credit ratings to assess credit risk and to segment assets within their portfolios. This approach has obviously worked well, as evidenced by ratings’ deeply entrenched roles in investors’ asset selection and risk management processes. In this paper we show how combining credit ratings with Expected Default Frequency (EDFTM) probability of default measures from Moody’s Analytics provides a way for investment grade and high yield investors to generate alpha and control credit risk, the latter measured by rates of downgrade and default. The success of the strategy is driven by two factors. The first is that the risk of credit deterioration, as captured in this instance by EDF metrics, is often not fully factored into corporate bond prices. Fund managers can thus use EDFs to identify opportunities both to acquire cheap assets and to shed expensive ones. Secondly, the granular nature of EDF measures means that there are wide ranges of default risk per rating category — even deep in the realm of high yield, some entities have one-year default rates of 1-2 bp. This provides considerable scope for constructing portfolios with bonds sold by issuers with low EDF measures, while excluding securities with high metrics. And as the bar chart below shows, the former outperform the latter by a considerable margin, and with lower realized downgrade rates.
US Investment grade average annualized total returns and downgrade/upgrade ratios for issues sold by entities with low and high EDF measures (2006-2017)
3.0%
3.7%
4.4%
5.1%
5.8%
6.5%
Low High Low High Low High
Aa A Baa
Total Returns
0
5
10
15
20
Low High Low High Low High
Aa A Baa
Downgrade/Upgrade ratios
Moody’s CreditEdge Research
Authors: David W. Munves, CFA Managing Director 1.212.553.2844 [email protected] Yukyung Choi Associate Director 1.212.553.0906 [email protected]
Editor: Dana Gordon Associate Director 1.212.553.0398 [email protected]

CREDITEDGE RESEARCH
2 NOVEMBER 20, 2017 CREDITEDGE RESEARCH / VIEWPOINTS / MOODYS.COM
TABLE OF CONTENTS
1. Introduction 3 2. The EDF scale: getting granular 4 3. Comparing the performance of bonds sold by low and high EDF entities in the US market 5 4. Using a yield-tilted strategy to boost average portfolio yields 8 5. Results by year and rating category 10 6. Conclusion 11

CREDITEDGE RESEARCH
3 NOVEMBER 20, 2017 CREDITEDGE RESEARCH / VIEWPOINTS / MOODYS.COM
1. Introduction Credit ratings have long supplied investors with valuable insights about the relative creditworthiness of their holdings, in the form of a rank order of default risk across time.1 They have been tremendously successful in this regard, as Figure 1 shows. It’s noteworthy that the Figure contains five-year default rates, meaning that Moody’s Investors Service ratings at the beginning of a given five-year period provide reliable signals of relative creditworthiness over the next 60 months. This is quite an achievement. The Figure also makes clear how realized default rates per rating category fluctuate with credit cycles. But as readers can infer from the Figure, at any point in time, credit ratings don’t provide information on the levels of the default rates per rating category in the years to come.
Figure 1. Five-year default rates per Moody’s broad rating category
A second point is that there are only 21 ratings in the rating scale. Given the wide range of issuer credit quality, this means that there is scope for a lot of variation within these bands.
Public firm Expected Default Rate (EDF) probability of default metrics2 from Moody’s Analytics address are quite different from ratings, which allows them to complement agency metrics in two ways. Firstly, they range from 0.01% to 50%, so are thus much more granular than ratings.3 Secondly, in addition to being relative rankings of creditworthiness, they provide absolute signals of credit risk as well. For example, if there are 100 firms, each with a 1% 1-year EDF measure, we can expect one of the firms to default over the next 12 months. Figure 2 illustrates this by showing the average 1-year EDF and average 1-year realized default rate across time for the US high yield market. There are two key takeaways from it. The first is that the peaks in the two time series are at about the same level, reflecting EDFs’ calibration to historical default rates. Secondly, the peaks in the average EDF occur before the peaks in
1 To be precise, ratings from Moody’s Investors Service rank order the risk of expected loss (probability of default multiplied by loss-given default), rather than PD alone. In practice, this is usually only a consideration in the nether regions of the high yield category, so the general statement that”ratings rank order default risk” is a valid one for this purpose.
2 “EDF” is Moody’s Analytics’ brand name for “probability of default”. The metrics are derived from information about companies’ capital structures and their share prices and price volatility, and are contained in the CreditEdge platform. We publish EDFs at the entity and bond levels. EDFs are available for almost all the bonds in the major corporate indices sold by issuers with publicly traded equity. Because they incorporate market information they are forward-looking and up to date (they are produced on a daily basis). EDF measures are calibrated to reflect realized default rates. For further details about EDFs, please see the Modeling Methodology paper Credit Risk Modeling of Public Firms: EDF 9 (Nazeran and Dwyer, June 2015). EDFs and related data, including their drivers, are available via the CreditEdge website, an Excel add-in, an XML feed, an ATP interface, and a daily data file. Moody’s Analytics also produces EDFs for privately held firms. The modeling approach for private firms differs substantially from that used for publicly held entities. Private firm EDFs are available via the RiskCalc platform. In this paper all references to “EDF measures” are to public firm metrics.
3 The 50% cap for EDF metrics is for non-financial entities. The maximum value for financial institutions is 35%.

CREDITEDGE RESEARCH
4 NOVEMBER 20, 2017 CREDITEDGE RESEARCH / VIEWPOINTS / MOODYS.COM
the average default rate, underlining EDFs’ forward-looking nature. Thus, in the summer of 2000 the average 1-year EDF for high yield entities was around 12%, meaning that the model forecast a 12% cumulative default rate over the next year. The subsequent peak in the realized default rate, a metric that can only be calculated with the passage of time, confirmed that.
As we explain in this paper, EDF measures’ fine-grained nature, combined with their predictive power of default levels, provide corporate bond4 investors with tangible ways to generate alpha while reducing credit risk in their portfolios.
Figure 2. Average US high yield EDF and average US high yield default rate
0%
4%
8%
12%
16%
Jan95 Apr98 Jul01 Oct04 Jan08 Apr11 Jul14 Oct17
Average EDF US Speculative Default Rate
2. The EDF scale: getting granular We begin the exercise by examining the distribution of 1-year EDF measures for North American industrial and utility entities rated single-A to single-B (Figure 3, which contains the count of entities per 0.25% EDF bucket, ranging from 0.00%-0.25% to 49.26%-50.00%). The spread of EDFs per rating category is striking. For example, the probability of default for Ba rated industrial/utility issuers stretches from 0.01% to 5.18%, as of August 2017.
4 In this paper the term “corporate bonds” refer to issues in the major corporate bond indices. In the main, these are sold by industrial, financial, and utility entities.

CREDITEDGE RESEARCH
5 NOVEMBER 20, 2017 CREDITEDGE RESEARCH / VIEWPOINTS / MOODYS.COM
A second thing that stands out from the Figure is that there are issuers with 1-year EDFs of 0.01% to 0.02% in all the rating categories in the Figure — even single-B. Recall that EDFs are designed and calibrated to provide the same probability of default information regardless of risk level, sector or the location of an issuer. The metrics are rigorously backtested to confirm this.5 Given the vastly different spread levels associated within each rating category, this alone implies that EDFs provide very useful information for relative value investors.
A final point is the “long tail” nature of the distribution of EDF measures per rating bucket. That is, even in high yield, most EDFs — and thus levels of company-level default risk — are concentrated at the low end of the scale. Only a relatively small number are in the higher buckets to the right. This pattern is consistent across credit cycles: even when times are tough, most EDFs per rating category remain relatively low. However, the tail of the distribution becomes longer and fatter. The practical implication for investors and risk managers is that even in sectors or rating categories with reputations for poor credit quality, most entities have relatively low default risk.6
Of course, alphanumeric rating categories provide more information than broad ones. And indeed, median and average EDF levels are correctly rank ordered on this basis (Figure 4, which uses the single-B category as an example of this). However, the Figure also shows that the B1, B2, and B3 buckets all contain entities with extremely low and extremely high 1-year EDFs.
Having established that there are considerable ranges of EDF measures by rating category, we now turn to demonstrating how this insight can be translated into improving the performance of corporate bond portfolios.
3. Comparing the performance of bonds sold by low and high EDF entities in the US market The question we address is whether bonds sold by issuers with low EDFs per rating category have more attractive characteristics than those issued by entities with high EDFs. As we explain in the following paragraphs, we do this by rank-ordering the issues by their issuers’ 1-year EDF metrics to see if, all else being equal, bonds sold by low EDF entities outperform those sold by high EDF issuers. We find that they do, and with lower levels of credit risk.
The study covers the US investment grade, US high yield, and euro investment grade markets for 2006-2017. The universe consists of bonds eligible for inclusion in the major broad corporate bond indices for 5 Moody’s Analytics Quantitative Research Group, “Validating the EDF9 Model”, Moody’s Analytics White Paper, 2017 6 We have examined this phenomenon in other research papers. See, for example, “Energy Sector EDF Measures Improve, Even as Oil Prices Remain Depressed” (Munves and Choi, June 2017).

CREDITEDGE RESEARCH
6 NOVEMBER 20, 2017 CREDITEDGE RESEARCH / VIEWPOINTS / MOODYS.COM
their respective markets. Such benchmarks contain securities that are relatively liquid, and those that are relatively illiquid. However, there is limited, if any, connection between entity EDF and bond liquidity, especially in the aggregate, so we don’t think liquidity is a factor in the performance of our EDF-based strategy.
At the beginning of study we rank order the entities per broad ratings bucket (having combined Aaa and AA) by their one-year EDF metrics. We then identify divide them into five duration buckets and two sector buckets (the latter for investment grade only). The sector buckets are 1) industrial, utilities, and non-bank financial institutions; and 2) banks.
We separate banks into their own bucket because their EDFs are relatively high, when normalized for their senior debt ratings. This reflects the fact that a firm’s EDF represents its default risk across the capital structure. Entities with complex, multi-layered, capital structures such as banks can have higher default risk for securities deep in their capital structures, even though the bulk of their bonds are more senior in nature. Thus, if we rank-ordered all financial firms by their EDFs, banks would be strongly overrepresented in the high EDF portfolios. We found that putting banks in their own bucket resulted in better backtest results, and in low and high EDF portfolios that more closely resembled the market on a sector basis — and were thus more realistic for investors to construct.
Next, we rank order the entities in each bucket by their EDFs and selected the top and bottom 30% on an entity count basis.
We then calculate the monthly total returns of the bonds in these buckets, and combine them on a duration and sector-matched (to the broad index) basis to get total returns for the two portfolios across time. To limit bond turnover — and thus make the exercise more realistic — we re-rank and rebalance the portfolios only twice a year. We charge transaction costs of 50 bp for turnover arising from both the re-ranking exercises and bond turnover reflecting issues that enter and exit the relevant indices on a monthly basis.
Figure 5. US Investment grade average annualized total returns and downgrade/upgrade ratios for issues sold by entities with low and high EDF measures (2007-2017)
3.0%
3.7%
4.4%
5.1%
5.8%
6.5%
Low High Low High Low High
Aa A Baa
Total Returns
0
5
10
15
20
Low High Low High Low High
Aa A Baa
Down/Upgrade ratios
Figure 5 summarizes the performance for the US investment grade market (all results are after accounting for transaction costs). The key takeaway is that portfolios of bonds sold by issuers with low EDFs within each broad rating category have higher total returns and lower downgrade/upgrade ratios than groups of issues sold by entities with relatively high EDF measures.
What’s driving the EDF measure’s alpha generation in the study? It would seem that many low risk (“risk”, in this context, meaning default risk) bonds are being undervalued by the market, in that they are trading cheaply to their levels of credit risk as signaled by the EDF metrics. This boosts the performance of the low EDF portfolio. Conversely, many high risk bonds are being overvalued. This is recognized by the market after they are added to the high EDF portfolios, leading to their underperformance compared to their low EDF counterparts.

CREDITEDGE RESEARCH
7 NOVEMBER 20, 2017 CREDITEDGE RESEARCH / VIEWPOINTS / MOODYS.COM
The greater downgrade/upgrade ratio for the high EDF portfolio is consistent with this. To be clear, downgrades don’t usually lead to losses in value: in most cases, bond prices move before the rating agencies act. So what seems to be happening, for the high EDF bonds, is that the market is trading them expensively for their “true” level of default/credit risk. As noted, market participants subsequently realize this, leading to the relative underperformance of the high EDF portfolios. And somewhere in the process the Moody’s Investors Service ratings analysts often confirm the issuers’ lower credit quality by downgrading many of them.
It might seem surprising that credit/default risk is often not fully priced into corporate bonds. After all, lower rated issues on average trade at higher credit spreads, and credit risk assessment is one of the foundations of the corporate bond market. To this we can add that default risk is a remote possibility for most investment grade bonds, so shouldn’t seem to play a large role in determining the value of securities.
A number of qualitative and quantitative factors drive corporate bond prices. Our hypothesis is that a systematic and accurate view of default risk, such as that provided by EDF measures over a range of horizons, is not being fully factored into this mix. This paves the way for corporate bond portfolio managers to use EDFs to take advantage of the resulting inefficiencies to generate better performance.
Figure 6. US high yield average annualized total returns and downgrade/upgrade ratios for issues sold by entities with low and high EDF measures (2007-2017)
-25%
-20%
-15%
-10%
-5%
0%
5%
10%
Low High Low High Low High
Ba B Caa
Total Returns
0
2
4
6
8
10
Low High Low High Low High
Ba B Caa
Down/Upgrade ratios
We extend the study to US high yield issuers in Figure 6. The results are the same: bonds sold by entities with low EDFs per rating category have higher returns and lower downgrade risk than their high EDF counterparts. And as we would expect, given EDF measures’ ability to rank order default risk, the low EDF portfolio has a much lower level of realized defaults than its high EDF counterpart (Figure 7).
Figure 7. High yield 1-year default rates for issues sold by entities with low and high EDF measures (2007-2017)
0%
2%
4%
6%
8%
10%
Low High Low High Low High
Ba B Caa
22% ↑
CREDITEDGE RESEARCH
8 NOVEMBER 20, 2017 CREDITEDGE RESEARCH / VIEWPOINTS / MOODYS.COM
We think much of EDFs’ success in high yield comes from this ability to separate defaulters from non-defaulters. This is especially clear in the Caa and below ratings bucket, where the performance differential between the two groups is striking. The safer bonds did well, with a 10.0% annualized total return, while the risky bonds generated a return of -24.4% per annum. Moreover, the credit quality of the risky portfolio within the Caa and below bucket rapidly deteriorated. The average annual default rate for high EDF issuers with ratings of Caa and below is extremely high at 21.8%.
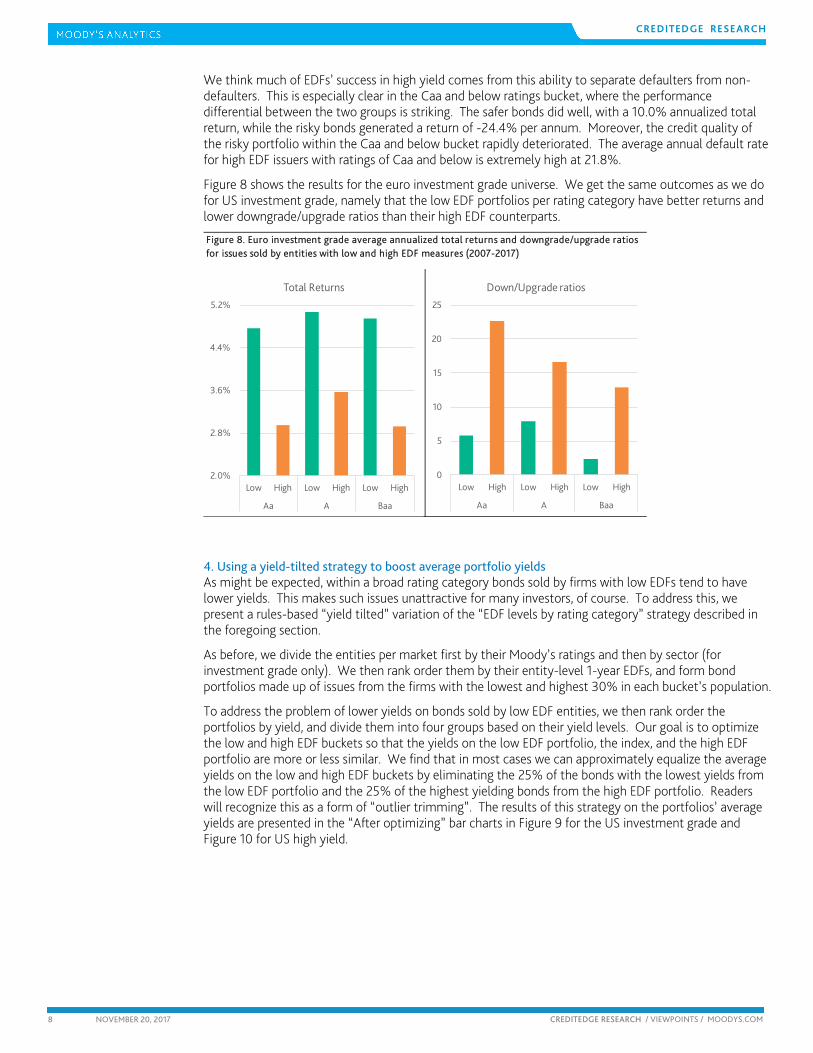
Figure 8 shows the results for the euro investment grade universe. We get the same outcomes as we do for US investment grade, namely that the low EDF portfolios per rating category have better returns and lower downgrade/upgrade ratios than their high EDF counterparts.
Figure 8. Euro investment grade average annualized total returns and downgrade/upgrade ratios for issues sold by entities with low and high EDF measures (2007-2017)
2.0%
2.8%
3.6%
4.4%
5.2%
Low High Low High Low High
Aa A Baa
Total Returns
0
5
10
15
20
25
Low High Low High Low High
Aa A Baa
Down/Upgrade ratios
4. Using a yield-tilted strategy to boost average portfolio yields As might be expected, within a broad rating category bonds sold by firms with low EDFs tend to have lower yields. This makes such issues unattractive for many investors, of course. To address this, we present a rules-based “yield tilted” variation of the “EDF levels by rating category” strategy described in the foregoing section.
As before, we divide the entities per market first by their Moody’s ratings and then by sector (for investment grade only). We then rank order them by their entity-level 1-year EDFs, and form bond portfolios made up of issues from the firms with the lowest and highest 30% in each bucket’s population.
To address the problem of lower yields on bonds sold by low EDF entities, we then rank order the portfolios by yield, and divide them into four groups based on their yield levels. Our goal is to optimize the low and high EDF buckets so that the yields on the low EDF portfolio, the index, and the high EDF portfolio are more or less similar. We find that in most cases we can approximately equalize the average yields on the low and high EDF buckets by eliminating the 25% of the bonds with the lowest yields from the low EDF portfolio and the 25% of the highest yielding bonds from the high EDF portfolio. Readers will recognize this as a form of “outlier trimming”. The results of this strategy on the portfolios’ average yields are presented in the “After optimizing” bar charts in Figure 9 for the US investment grade and Figure 10 for US high yield.

CREDITEDGE RESEARCH
9 NOVEMBER 20, 2017 CREDITEDGE RESEARCH / VIEWPOINTS / MOODYS.COM
Figure 9. Yield-enhanced strategy: US IG, average yields before and after optimization, divided between all issues and those sold by low EDF and high EDF entities (2007-2017)
0
1
2
3
4
5
6
Aa A Baa
yld (%)
Before optimization
Low All High
0
1
2
3
4
5
6
Aa A Baa
yld (%)
After optimization
Low All High
Figure 10. Yield-enhanced strategy: US HY, average yields before and after optimization, divided between all issues and those sold by low EDF and high EDF entities (2007-2017)
0
5
10
15
20
Ba B Caa
yld (%)
Before optimization
Low All High
0
6
12
18
Ba B Caa
yld (%)
After optimization
Low All High
For investment grade, eliminating the low-yielding issues means that the average yields on the low EDF portfolios are considerably higher than those for the broad market. This obviously reflects the large number of high grade issues trading at very depressed yields. A second point is that in speculative grade, the very large yield differentials that exist in the single-B and Caa and below buckets mean that the “outlier trimming” approach narrowed the gap between the yields on the low and high EDF portfolios, but doesn’t eliminate the differentials.
The key question, of course, is how this yield-targeted rebalancing affects the strategy’s performance. Happily, the low EDF portfolios have higher average yields and generate greater returns than the non-yield tilted alternatives in both markets (Figure 11).

CREDITEDGE RESEARCH
10 NOVEMBER 20, 2017 CREDITEDGE RESEARCH / VIEWPOINTS / MOODYS.COM
Figure 11. Yield-enhanced strategy: Total returns differential (low EDF vs. high EDF), before/after optimization
0.0%
0.7%
1.4%
2.1%
2.8%
3.5%
4.2%
Aa A Baa
Investment Grade
Before After
0%
7%
14%
21%
28%
35%
Ba B Caa
High Yield
Before After
5. Results by year and rating category In this section we provide details on our “EDF by rating category” performance in the form of returns broken down by year and broad rating category (Figure 12 for US investment grade, Figure 13 for US high yield, and Figure 14 for euro investment grade). 7 We find that the strategy “works”, in the sense that the low EDF portfolios outperform their riskier counterparts, in the majority of the years and in the majority of the rating categories. That the track record is less than perfect isn’t surprising — no strategy is successful in all the cases all the time. The key point in this connection is that we can analyze the drivers of the periods of underperformance. For example, for US investment grade, the strong rally in bank bonds in 2013 was the main reason for the strategy’s underperformance, while in high yield in 2016 the volatile energy sector led to the underperformance in the Ba bucket. With such insights, CE users can, based on their views of future developments in high profile sectors, determine how aggressively to apply an EDF overlay to their asset selection and portfolio surveillance processes.
Figure 12. US IG Low and high EDF US IG portfolios: result by year and rating category
Low High Low High Low High Aa A Baa
2007 7.2% 4.9% 6.8% 4.4% 6.8% 3.2% 2.3% 2.3% 3.6%
2008 2.0% 2.7% 3.4% -7.4% -0.7% -19.6% -0.6% 10.8% 18.9%
2009 11.0% 9.7% 12.7% 12.6% 17.6% 16.2% 1.3% 0.1% 1.5%
2010 7.7% 7.6% 8.1% 9.0% 9.0% 11.0% 0.1% -0.9% -2.0%
2011 8.0% 4.3% 8.1% 4.4% 10.1% 6.1% 3.7% 3.7% 4.0%
2012 6.7% 7.3% 7.1% 6.5% 7.0% 8.3% -0.7% 0.6% -1.2%
2013 -1.6% -0.5% -1.8% -1.1% -0.9% 0.8% -1.1% -0.7% -1.7%
2014 6.3% 4.5% 7.5% 6.3% 8.5% 6.4% 1.9% 1.1% 2.1%
2015 1.3% 1.6% 0.9% 0.6% -1.1% -2.7% -0.4% 0.2% 1.6%
2016 3.0% 4.1% 4.2% 4.8% 6.1% 5.8% -1.1% -0.7% 0.2%
avg. 5.2% 4.6% 5.7% 4.0% 6.3% 3.5% 0.5% 1.7% 2.7%
Aa A Baa Low EDF - High EDFTotal Returns
7 The data in this section is for the non-yield enhanced portfolios.

CREDITEDGE RESEARCH
11 NOVEMBER 20, 2017 CREDITEDGE RESEARCH / VIEWPOINTS / MOODYS.COM
Figure 13. US HY Low and high EDF US HY portfolios: result by year and rating category
Low High Low High Low High Ba B Caa
2007 4.7% -3.6% 4.9% 0.8% 0.1% -7.3% 8.3% 4.1% 7.5%
2008 -4.5% -22.0% -8.1% -39.2% 1.4% -71.0% 17.4% 31.0% 72.4%
2009 24.6% 5.9% 31.8% 6.4% 32.5% -44.0% 18.7% 25.4% 76.4%
2010 10.1% 9.9% 9.7% 10.4% 16.6% 0.9% 0.2% -0.8% 15.7%
2011 8.1% 3.3% 6.6% 3.4% 4.5% -14.7% 4.7% 3.2% 19.2%
2012 8.9% 9.0% 9.2% 10.4% 10.6% -21.2% -0.1% -1.2% 31.9%
2013 4.4% 6.0% 4.3% 5.1% 6.3% 7.2% -1.5% -0.8% -0.9%
2014 5.9% 3.5% 4.1% -6.6% 5.4% -27.1% 2.4% 10.7% 32.5%
2015 0.8% -9.8% 2.9% -30.4% 4.3% -51.1% 10.6% 33.3% 55.4%
2016 6.9% 9.4% 8.1% 7.4% 18.1% -15.7% -2.5% 0.7% 33.9%
avg. 7.0% 1.2% 7.3% -3.2% 10.0% -24.4% 5.8% 10.6% 34.4%
Total ReturnsBa B Caa Low EDF - High EDF
Figure 14. Euro IG Low and high EDF Euro IG portfolios: result by year and rating category
Low High Low High Low High Aa A Baa
2007 2.3% 1.5% 1.9% 2.4% 1.8% 1.2% 0.8% -0.5% 0.6%
2008 4.9% -1.9% 5.0% 1.1% 1.9% -5.3% 6.7% 3.9% 7.2%
2009 9.4% 7.1% 11.8% 9.5% 13.3% 6.9% 2.3% 2.3% 6.4%
2010 3.9% 2.1% 3.6% 2.5% 4.6% 4.9% 1.8% 1.1% -0.2%
2011 4.6% 0.9% 3.7% 1.2% 4.2% 2.3% 3.7% 2.4% 1.9%
2012 9.5% 8.1% 10.2% 8.3% 9.8% 7.9% 1.4% 1.9% 1.9%
2013 1.7% 1.1% 2.1% 1.0% 2.9% 2.9% 0.6% 1.1% 0.0%
2014 7.1% 6.5% 7.8% 5.9% 6.3% 5.5% 0.6% 1.9% 0.8%
2015 1.5% 1.1% 1.4% 1.5% 1.9% 1.4% 0.3% -0.1% 0.5%
2016 2.9% 3.0% 3.2% 2.2% 2.9% 1.7% -0.1% 1.0% 1.2%
avg. 4.8% 3.0% 5.1% 3.6% 4.9% 2.9% 1.8% 1.5% 2.0%
Total ReturnsAa A Baa Low EDF - High EDF
6. Conclusion For corporate bond portfolio managers, combining ratings, a tried and true input to their asset selection and portfolio monitoring routines, with EDF metrics can provide a way to enhance returns while reducing credit risk. At a time when reaching for yield is a dominant investment theme, incorporating EDFs into existing processes offers a way to buy higher yielding assets, but with lower levels of default risk. Our backtests confirm the intuition that, for a given rating category, such bonds have better returns, with lower risk of downgrade and default (the latter for high yield only). And by employing a simple outlier-trimming approach, we largely eliminate a key disadvantage of focusing on issues sold by entities with low EDF measures, namely that they have tend to have lower yields.

CREDITEDGE RESEARCH
12 NOVEMBER 20, 2017 CREDITEDGE RESEARCH / VIEWPOINTS / MOODYS.COM
References Munves, David W. and Yukyung Choi, “Generating Bond Portfolio Outperformance Using Fair Value Spreads”, Moody’s Analytics White Paper, 2014.
Munves, David W. and Yukyung Choi, “Probability of Default: An Undervalued Driver of Corporate Bond Prices”, Moody’s Analytics White Paper, 2015.
Munves, David W. and Yukyung Choi, “Using CreditEdge to build Corporate Bond Portfolios”, Moody’s Analytics White Paper, 2016.
Munves, David W. and Yukyung Choi, “Energy Sector EDF Measures Improve, Even as Oil Prices Remain Depressed”, Moody’s Analytics topics@CreditEdge publication, June, 2017.
Chen, Nan, James Edward, Sergey Maslennikov, and Douglas Dwyer, “Moody’s Analytics EDF-based Bond Spread Model”, Moody’s Analytics White Paper, 2016.
Chen, Nan, Houman Dehghan, Min Ding, Jian Du, James Edwards, Danielle Ferry, Pooya Nazeran, Sue Zhang, Douglas Dwyer, and Jing Zhang, “EDF9: Introduction Overview”, Moody’s Analytics White Paper, February 2015.
Nazeran, Pooya and Douglas Dwyer, “Credit Risk Modeling of Public Firms:EDF9”, Moody’s Analytics White Paper, 2015.
Moody’s Analytics Quantitative Research Group, “Validating the EDF9 models”, 2017

CREDITEDGE RESEARCH
13 NOVEMBER 20, 2017 CREDITEDGE RESEARCH / VIEWPOINTS / MOODYS.COM
To order reprints of this report (100 copies minimum), please call 212.553.1658.
Report Number: 1101335 Contact Us
Editor Dana Gordon
Americas : 1.212.553.4399
Europe: +44 (0) 20.7772.5588
Asia: 813.5408.4131

CREDITEDGE RESEARCH
14 NOVEMBER 20, 2017 CREDITEDGE RESEARCH / VIEWPOINTS / MOODYS.COM
© 2017 Moody’s Corporation, Moody’s Investors Service, Inc., Moody’s Analytics, Inc. and/or their licensors and affiliates (collectively, “MOODY’S”). All rights reserved.
CREDIT RATINGS ISSUED BY MOODY'S INVESTORS SERVICE, INC. (“MIS”) AND ITS AFFILIATES ARE MOODY’S CURRENT OPINIONS OF THE RELATIVE FUTURE CREDIT RISK OF ENTITIES, CREDIT COMMITMENTS, OR DEBT OR DEBT-LIKE SECURITIES, AND CREDIT RATINGS AND RESEARCH PUBLICATIONS PUBLISHED BY MOODY’S (“MOODY’S PUBLICATIONS”) MAY INCLUDE MOODY’S CURRENT OPINIONS OF THE RELATIVE FUTURE CREDIT RISK OF ENTITIES, CREDIT COMMITMENTS, OR DEBT OR DEBT-LIKE SECURITIES. MOODY’S DEFINES CREDIT RISK AS THE RISK THAT AN ENTITY MAY NOT MEET ITS CONTRACTUAL, FINANCIAL OBLIGATIONS AS THEY COME DUE AND ANY ESTIMATED FINANCIAL LOSS IN THE EVENT OF DEFAULT. CREDIT RATINGS DO NOT ADDRESS ANY OTHER RISK, INCLUDING BUT NOT LIMITED TO: LIQUIDITY RISK, MARKET VALUE RISK, OR PRICE VOLATILITY. CREDIT RATINGS AND MOODY’S OPINIONS INCLUDED IN MOODY’S PUBLICATIONS ARE NOT STATEMENTS OF CURRENT OR HISTORICAL FACT. MOODY’S PUBLICATIONS MAY ALSO INCLUDE QUANTITATIVE MODEL-BASED ESTIMATES OF CREDIT RISK AND RELATED OPINIONS OR COMMENTARY PUBLISHED BY MOODY’S ANALYTICS, INC. CREDIT RATINGS AND MOODY’S PUBLICATIONS DO NOT CONSTITUTE OR PROVIDE INVESTMENT OR FINANCIAL ADVICE, AND CREDIT RATINGS AND MOODY’S PUBLICATIONS ARE NOT AND DO NOT PROVIDE RECOMMENDATIONS TO PURCHASE, SELL, OR HOLD PARTICULAR SECURITIES. NEITHER CREDIT RATINGS NOR MOODY’S PUBLICATIONS COMMENT ON THE SUITABILITY OF AN INVESTMENT FOR ANY PARTICULAR INVESTOR. MOODY’S ISSUES ITS CREDIT RATINGS AND PUBLISHES MOODY’S PUBLICATIONS WITH THE EXPECTATION AND UNDERSTANDING THAT EACH INVESTOR WILL, WITH DUE CARE, MAKE ITS OWN STUDY AND EVALUATION OF EACH SECURITY THAT IS UNDER CONSIDERATION FOR PURCHASE, HOLDING, OR SALE.
MOODY’S CREDIT RATINGS AND MOODY’S PUBLICATIONS ARE NOT INTENDED FOR USE BY RETAIL INVESTORS AND IT WOULD BE RECKLESS FOR RETAIL INVESTORS TO CONSIDER MOODY’S CREDIT RATINGS OR MOODY’S PUBLICATIONS IN MAKING ANY INVESTMENT DECISION. IF IN DOUBT YOU SHOULD CONTACT YOUR FINANCIAL OR OTHER PROFESSIONAL ADVISER.
ALL INFORMATION CONTAINED HEREIN IS PROTECTED BY LAW, INCLUDING BUT NOT LIMITED TO, COPYRIGHT LAW, AND NONE OF SUCH INFORMATION MAY BE COPIED OR OTHERWISE REPRODUCED, REPACKAGED, FURTHER TRANSMITTED, TRANSFERRED, DISSEMINATED, REDISTRIBUTED OR RESOLD, OR STORED FOR SUBSEQUENT USE FOR ANY SUCH PURPOSE, IN WHOLE OR IN PART, IN ANY FORM OR MANNER OR BY ANY MEANS WHATSOEVER, BY ANY PERSON WITHOUT MOODY’S PRIOR WRITTEN CONSENT.
All information contained herein is obtained by MOODY’S from sources believed by it to be accurate and reliable. Because of the possibility of human or mechanical error as well as other factors, however, all information contained herein is provided “AS IS” without warranty of any kind. MOODY'S adopts all necessary measures so that the information it uses in assigning a credit rating is of sufficient quality and from sources MOODY'S considers to be reliable including, when appropriate, independent third-party sources. However, MOODY’S is not an auditor and cannot in every instance independently verify or validate information received in the rating process or in preparing the Moody’s Publications.
To the extent permitted by law, MOODY’S and its directors, officers, employees, agents, representatives, licensors and suppliers disclaim liability to any person or entity for any indirect, special, consequential, or incidental losses or damages whatsoever arising from or in connection with the information contained herein or the use of or inability to use any such information, even if MOODY’S or any of its directors, officers, employees, agents, representatives, licensors or suppliers is advised in advance of the possibility of such losses or damages, including but not limited to: (a) any loss of present or prospective profits or (b) any loss or damage arising where the relevant financial instrument is not the subject of a particular credit rating assigned by MOODY’S.
To the extent permitted by law, MOODY’S and its directors, officers, employees, agents, representatives, licensors and suppliers disclaim liability for any direct or compensatory losses or damages caused to any person or entity, including but not limited to by any negligence (but excluding fraud, willful misconduct or any other type of liability that, for the avoidance of doubt, by law cannot be excluded) on the part of, or any contingency within or beyond the control of, MOODY’S or any of its directors, officers, employees, agents, representatives, licensors or suppliers, arising from or in connection with the information contained herein or the use of or inability to use any such information.
NO WARRANTY, EXPRESS OR IMPLIED, AS TO THE ACCURACY, TIMELINESS, COMPLETENESS, MERCHANTABILITY OR FITNESS FOR ANY PARTICULAR PURPOSE OF ANY SUCH RATING OR OTHER OPINION OR INFORMATION IS GIVEN OR MADE BY MOODY’S IN ANY FORM OR MANNER WHATSOEVER.
MIS, a wholly-owned credit rating agency subsidiary of Moody’s Corporation (“MCO”), hereby discloses that most issuers of debt securities (including corporate and municipal bonds, debentures, notes and commercial paper) and preferred stock rated by MIS have, prior to assignment of any rating, agreed to pay to MIS for appraisal and rating services rendered by it fees ranging from $1,500 to approximately $2,500,000. MCO and MIS also maintain policies and procedures to address the independence of MIS’s ratings and rating processes. Information regarding certain affiliations that may exist between directors of MCO and rated entities, and between entities who hold ratings from MIS and have also publicly reported to the SEC an ownership interest in MCO of more than 5%, is posted annually at www.moodys.com under the heading “Shareholder Relations — Corporate Governance — Director and Shareholder Affiliation Policy.”
For Australia only: Any publication into Australia of this document is pursuant to the Australian Financial Services License of MOODY’S affiliate, Moody’s Investors Service Pty Limited ABN 61 003 399 657AFSL 336969 and/or Moody’s Analytics Australia Pty Ltd ABN 94 105 136 972 AFSL 383569 (as applicable). This document is intended to be provided only to “wholesale clients” within the meaning of section 761G of the Corporations Act 2001. By continuing to access this document from within Australia, you represent to MOODY’S that you are, or are accessing the document as a representative of, a “wholesale client” and that neither you nor the entity you represent will directly or indirectly disseminate this document or its contents to “retail clients” within the meaning of section 761G of the Corporations Act 2001. MOODY’S credit rating is an opinion as to the creditworthiness of a debt obligation of the issuer, not on the equity securities of the issuer or any form of security that is available to retail clients. It would be dangerous for “retail clients” to make any investment decision based on MOODY’S credit rating. If in doubt you should contact your financial or other professional adviser.
For Publications Issued by Moody’s Capital Markets Research, Inc. only:
The statements contained in this research report are based solely upon the opinions of Moody’s Capital Markets Research, Inc. and the data and information available to the authors at the time of publication of this report. There is no assurance that any predicted results will actually occur. Past performance is no guarantee of future results.
The analysis in this report has not been made available to any issuer prior to publication.
When making an investment decision, investors should use additional sources of information and consult with their investment advisor. Investing in securities involves certain risks including possible fluctuations in investment return and loss of principal. Investing in bonds presents additional risks, including changes in interest rates and credit risk.
Moody's Capital Markets Research, Inc., is a subsidiary of MCO. Please note that Moody’s Analytics, Inc., an affiliate of Moody’s Capital Markets Research, Inc. and a subsidiary of MCO, provides a wide range of research and analytical products and services to corporations and participants in the financial markets. Customers of Moody’s Analytics, Inc. may include companies mentioned in this report. Please be advised that a conflict may exist and that any investment decisions you make are your own responsibility. The Moody’s Analytics logo is used on certain Moody’s Capital Markets Research, Inc. products for marketing purposes only. Moody’s Analytics, Inc. is a separate company from Moody’s Capital Markets Research, Inc.