math8atdsa.files.wordpress.com · web viewhow much would you expect a 69 inch-tall basketball...
TRANSCRIPT
Math8 Bivariate Data EOG Prep Name________________________ D#____
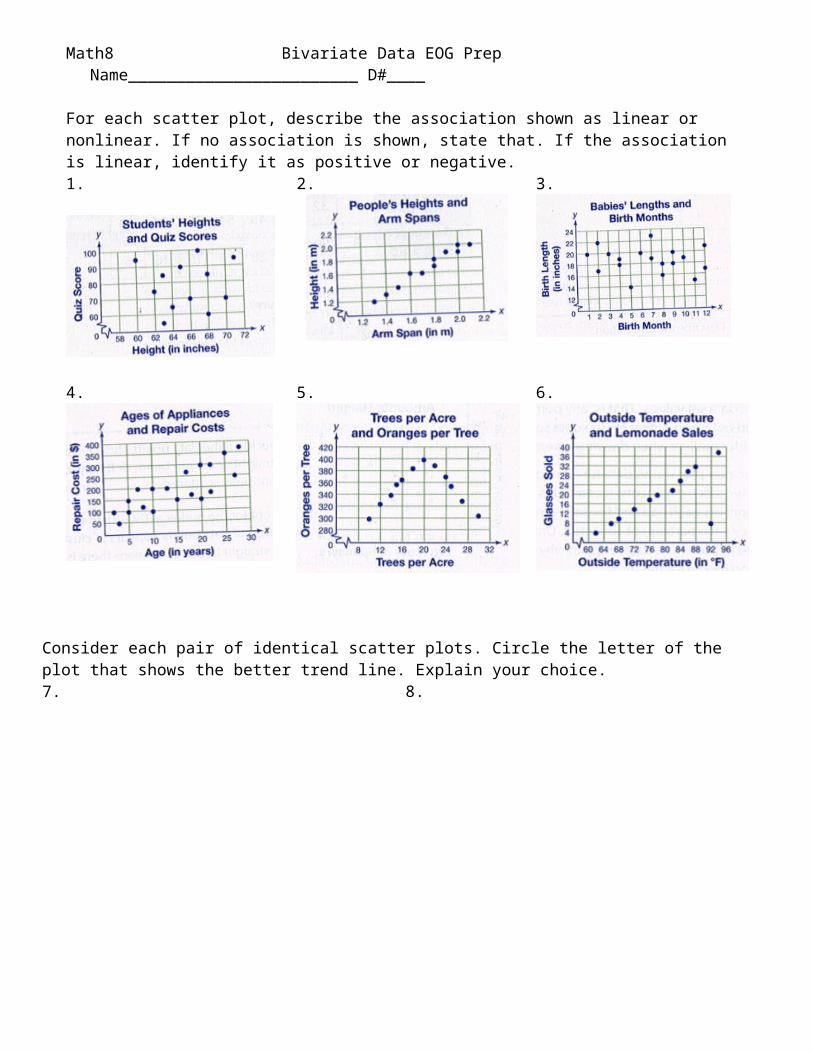
For each scatter plot, describe the association shown as linear or nonlinear. If no association is shown, state that. If the association is linear, identify it as positive or negative. 1.
2.
3.
4. 5. 6.
Consider each pair of identical scatter plots. Circle the letter of the plot that shows the better trend line. Explain your choice. 7.
___________________________________________________
___________________________________________________
8.
___________________________________________________
___________________________________________________

Describe the association shown by the scatter plot and write an equation of the line of best fit drawn. 9.
10.
Draw a line of best fit for each scatterplot and use it to make predictions.
11.
How much would you expect a 69 inch-tall basketball player to weigh?
12.
How much would you expect an 8 year-old car to be worth?
13.
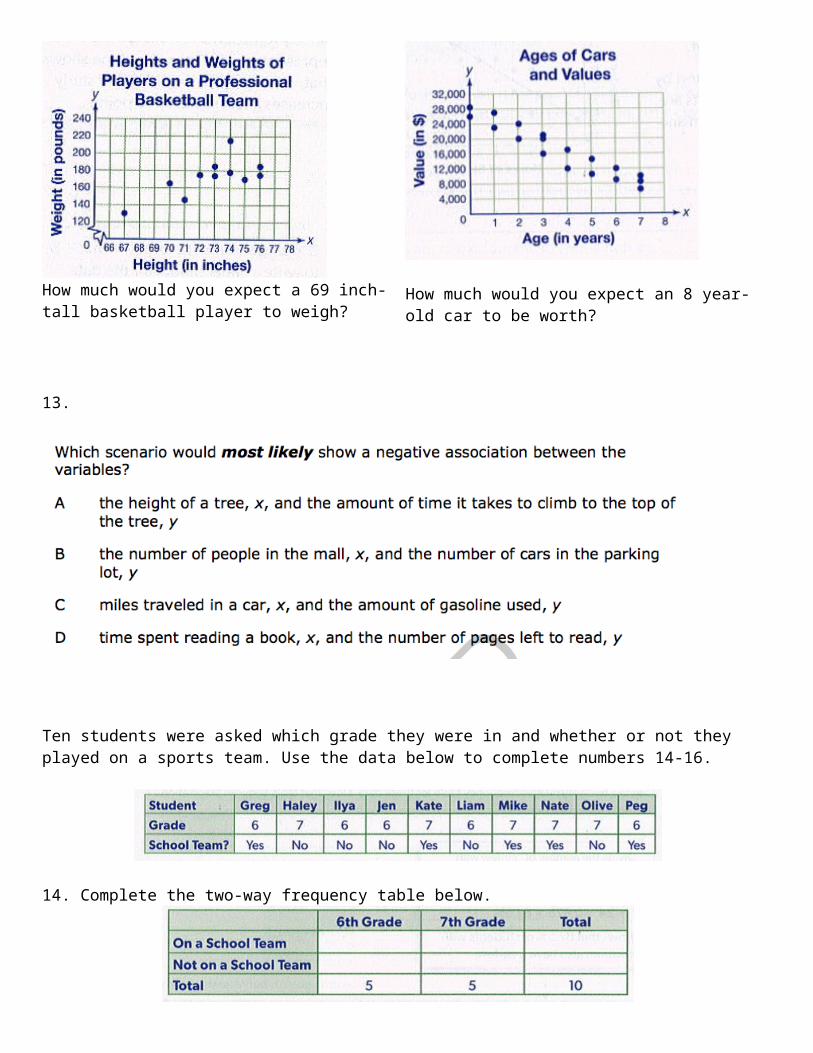
Ten students were asked which grade they were in and whether or not they played on a sports team. Use the data below to complete numbers 14-16.
14. Complete the two-way frequency table below.
15. What is the relative frequency that a 6th grader plays on a school team?
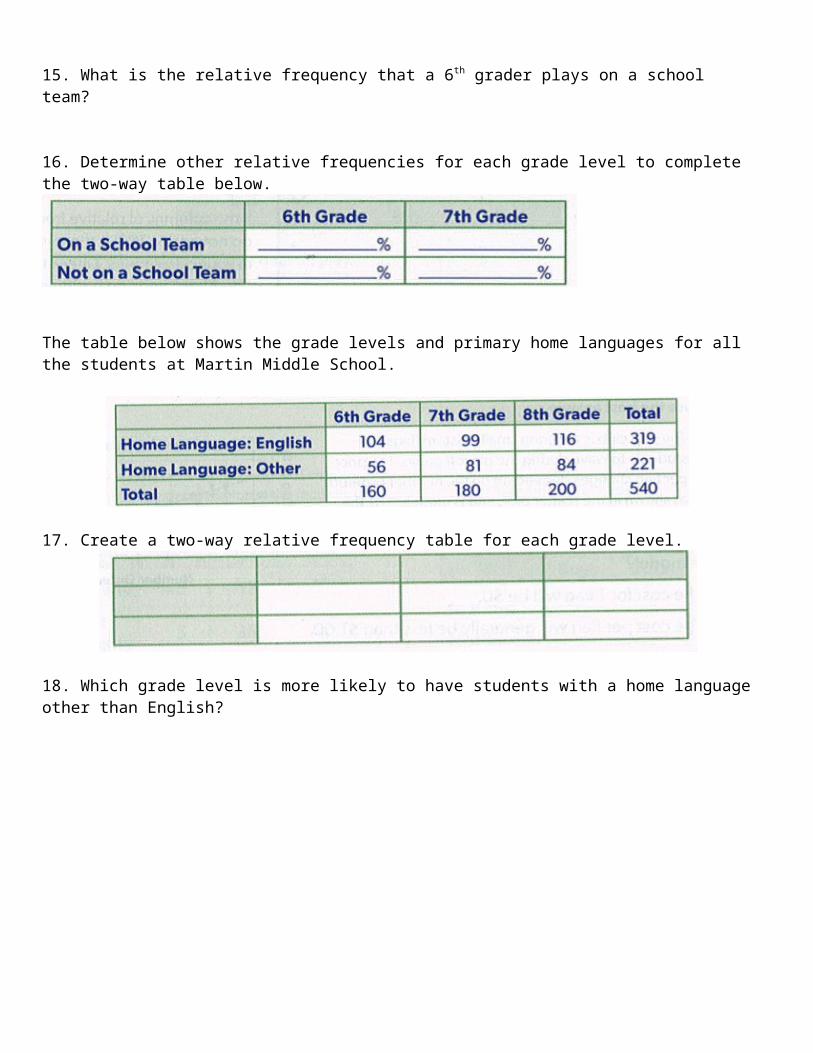
16. Determine other relative frequencies for each grade level to complete the two-way table below.
The table below shows the grade levels and primary home languages for all the students at Martin Middle School.
17. Create a two-way relative frequency table for each grade level.
18. Which grade level is more likely to have students with a home language other than English?
19. 20.
21.