community.boredofstudies.orgcommunity.boredofstudies.org/attachments/462/commerce... · web...
TRANSCRIPT

Prepared for: Mr. Paul Vorbach
University of Technology SydneyGraduate School of Business
Subject Name: Marketing: Concepts and Applications (24746)Prepared for: Paul Vorbach
Semester: Autumn 2004
MARKETING PLAN
Launch of a new health range within Red Rooster Restaurants and increase market share in
Australia
Group Members:Susan Andonovski 10131338
Montri Ployjirachai 10197984Amanda F. Ribeiro 10144830
Poon Han Wong 10010748
28.05.04
UTS: Marketing, Concepts & Applications (24746) Page 28.05.2004 i

Prepared for: Mr. Paul Vorbach
Table of ContentsEXECUTIVE SUMMARY.............................................................................................................................................3
1. INTRODUCTION.....................................................................................................................................................4
1.1 OVERVIEW: RED ROOSTER....................................................................................................................................41.2 MARKETING PLAN SCOPE: NEW PRODUCT LAUNCH............................................................................................4
2. EXTERNAL & INTERNAL ANALYSIS...............................................................................................................5
2.1 MARKET DEFINITION & ‘BROAD SEGMENTATION’...............................................................................................52.1.1 Broad Strategic Market Definition: Shift towards Healthier Variety............................................................52.1.2 Market Potential, Market Penetration and Market Demand.........................................................................6
2.2 MARKET RESEARCH..............................................................................................................................................82.2.1 Secondary Market Research..........................................................................................................................82.2.2 Primary Market Research..............................................................................................................................8
2.3 EXTERNAL ANALYSIS............................................................................................................................................92.3.1 Macro-environmental Situation - PEST Analysis..........................................................................................9
2.3.1.1 Political Factor...........................................................................................................................................................92.3.1.2 Economic Environment..............................................................................................................................................92.3.1.3 Socio-cultural Factor................................................................................................................................................102.3.1.4 Technological Factor................................................................................................................................................10
2.3.2 Porter’s Five Forces Analysis.....................................................................................................................112.3.3 Competitor Analysis.....................................................................................................................................12
2.4 INTERNAL ANALYSIS – COMPANY’S COMPETENCIES..........................................................................................142.4.1 Franchising..................................................................................................................................................152.4.2 Mission Statement........................................................................................................................................152.4.3 Products.......................................................................................................................................................15
2.5 SWOT ANALYSIS................................................................................................................................................17
3. STRATEGIC OBJECTIVES & ISSUES..............................................................................................................18
3.1 TARGET MARKETS: “YOUNG PROFESSIONAL” AND “STUDENT”........................................................................183.1.1 Market Geographic Factors........................................................................................................................183.1.2 Market Demographic and Lifestyle Factors................................................................................................183.1.3 Passion Based Market Segments.................................................................................................................18
3.2 MARKET POSITIONING.........................................................................................................................................193.2.1 Business Performance..................................................................................................................................193.2.2 Market Attractiveness..................................................................................................................................19
4. COMPETITIVE MARKETING STRATEGY....................................................................................................21
4.1 COMPETITIVE ADVANTAGE.................................................................................................................................214.1.1 Cost Advantage:...........................................................................................................................................214.1.2 Differentiation Factors:...............................................................................................................................214.1.3 Marketing Advantage:.................................................................................................................................21
4.2 OFFENSIVE COMPETITIVE STRATEGY: MARKET SHARE GROWTH......................................................................214.3 MARKETING AND FINANCIAL OBJECTIVES..........................................................................................................23
4.3.1 Short-term Marketing Objectives.................................................................................................................234.3.2 Long-term Marketing Objectives.................................................................................................................23
5. MARKETING MIX TACTICS.............................................................................................................................24
5.1 PRODUCT AND SERVICES............................................................................................................................245.1.1 Product Quality............................................................................................................................................245.1.2 Meals and Sizes............................................................................................................................................245.1.3 Packaging....................................................................................................................................................245.1.4 Labelling......................................................................................................................................................255.1.5 Product Line Extensions..............................................................................................................................25
5.2 PRICING...............................................................................................................................................................255.2.1 Market Based Pricing..................................................................................................................................25
5.3 PLACE/DISTRIBUTION..........................................................................................................................................255.3.1 Channel of Distribution/ Sales Territories..................................................................................................25
5.4 PROMOTION: INTEGRATED MARKETING COMMUNICATION MIX........................................................................26
UTS: Marketing, Concepts & Applications (24746) Page 28.05.2004 1
Prepared for: Mr. Paul Vorbach
5.4.1 Advertising: Awareness Building.................................................................................................................265.4.2 Sales Promotions.........................................................................................................................................265.4.3 Public Relations: Reference Group Experience..........................................................................................275.4.4 Direct and Online Marketing: Loyal Customers Contacting......................................................................27
6. MARKETING BUDGET.......................................................................................................................................28
6.1 FORECAST SALES.................................................................................................................................................286.2 SENSITIVITY ANALYSIS.......................................................................................................................................296.3 BREAK-EVEN ANALYSIS.....................................................................................................................................29
7. IMPLEMENTATION & CONTROL GUIDELINES.........................................................................................30
7.1 IMPLEMENTATION PLAN......................................................................................................................................307.1.1 Implementation Milestones and Activities...................................................................................................307.1.2 Development of Goods and Sevices.............................................................................................................307.1.3 Employees Development and Reward s.......................................................................................................307.1.4 Development of Sales Distribution Channels..............................................................................................307.1.5 Development of Systematic Supply Process.................................................................................................307.1.6 Development of Price Strategy....................................................................................................................307.1.7 Development of Promotional Campaign.....................................................................................................31
7.2 PERFORMANCE MONITORING..............................................................................................................................317.2.1 Process Market Metrics...............................................................................................................................317.2.2 End-Result Market and Financial Metrics..................................................................................................31
8. REFERENCES........................................................................................................................................................32
9. APPENDICES.........................................................................................................................................................34
Appendix No. 1: Roy Morgan QSR Marketing and Advertising Planning : April 2002 – March 2003...............34Appendix No. 2: Average Weekly Household Expenditure on Food and Non-alcoholic Beverage.....................37Appendix No. 3: Australian - Market Lifestyle Factors........................................................................................38Appendix No. 4: Australian - Geographic Factors...............................................................................................45Appendix No. 5: Australian - Demographic Factors...........................................................................................46Appendix No. 6: Primary Research – Research Brief and Sample Questionnaire...............................................48Appendix No. 7: Primary Research – Summary of results...................................................................................53Appendix No. 8: Australian Political Environment: Democratic & Stable..........................................................63Appendix No. 9: Government Efficiency...............................................................................................................64Appendix No. 10: Economic Efficiency................................................................................................................64Appendix No. 11: Household Computer and Internet Access...............................................................................65Appendix No. 12: Adults Accessing the Internet...................................................................................................65Appendix No. 13: Current market share per competitor and Sales Forecast for 2004........................................66Appendix No. 14: Competitive Analysis................................................................................................................67Appendix No. 15: Price Comparison – Fast food Competitors............................................................................69Appendix No. 16: Buying Decision Forces - “Young Professional”....................................................................70Appendix No. 17: Buying Decision Forces - “Student”.......................................................................................71Appendix No.18: Red Rooster - PORTFOLIO ANALYSIS...................................................................................72Appendix No. 19: Recipe for Grilled Chicken......................................................................................................73Appendix No. 20: Nutrition for whole chicken.....................................................................................................74Appendix No. 21: Menu for Red Rooster..............................................................................................................76Appendix No. 22: Salad Recipes...........................................................................................................................77Appendix No. 23 Franchise Information..............................................................................................................81Appendix No. 24: Total Media Spend in Australia by QSRs................................................................................82Appendix No. 25: Work Breakdown Structure and Gantt Chart..........................................................................83
UTS: Marketing, Concepts & Applications (24746) Page 28.05.2004 2

Prepared for: Mr. Paul Vorbach
EXECUTIVE SUMMARY
Consumer foodservice transactions grew 18.7% reaching 2,733 million in 2001. These figures are forecast to grow 24.3% to 3,395 million in 2006, accounting for a sales value of AU$34,375 million. As such, the fast food retail industry currently accounts for almost one third of the overall transactions. Thus, indicating the potential growth in this particular industry.(www.euromonitor.com/consumer_foodservice_in _Australia)
Red Rooster has been in the industry for 30 years. It began its business humbly in 1972, with its first store in Perth, suburb of Kelmscott. In May 2002, Red Rooster was purchased by Australian Fast Foods. With currently over 290 stores nation wide Red rooster is preparing to propel towards the future, serving better food for Australians. Red Rooster continually strives to develop innovative products, adopt competitive prices and offer maximum satisfaction and convenience to customers. Recent development in Red Rooster enables it to launch a healthy range of fast food to the growing demand in the Australian population.
A generalised introduction of the conceptual idea of the market information and market position, together with the production scope and objectives is provided in section 1.0. Subsequently, in section 2, details of the market research, primary and secondary will be provided, in addition, competitive analysis and internal and external analysis is carried out. Section 3 describes the market condition in which the product will be penetrating. Section 4 accounts for the overall strategic decisions in which the organisation adopted in penetrating the required market. Section 5 will outline the marketing mix in terms of products, promotions, pricing and distribution strategy used in gaining the desired out come for the product launch. All information in regards to the project budgeting will be account for in section 6. The plan then will be concluded with a strategic implementation and control documentation for the products.
As such, the research which was carried out, indicated that the current Red Rooster chain of stand alone restaurants possess a relatively weak market position (refer to Appendix 13 and Section 2.1.2) and its traditional ideology has restricted its development. The company suffers from lack of market oriented strategy and promotion despite the company’s strong position in providing quality chicken products. With confidence, the results have prompted the need to launch a healthy product range of meals for the market.
The overall marketing strategy presented will highlight the critical issues in product quality, pricing, promotion and distribution to firstly draw new customers in to the products, maintain and reward loyal customers and capturing the competitor’s customers. The approach will only be possible with a systematic budgeting and proper layout of implementation plan.
The introduction of the Red rooster new health food into the Australian market is expected to help grow Red Rooster market share, provide customer value and offer customer satisfaction, 100% of the time.
UTS: Marketing, Concepts & Applications (24746) Page 28.05.2004 3

Prepared for: Mr. Paul Vorbach
1. INTRODUCTION
1.1 Overview: Red Rooster
The Kailis family opened the first Red Rooster store in the Perth suburb of Kelmscott in 1972. Myer purchased the business in July 1981. In 1992, Red Rooster bought the Big Rooster chain to expand into the eastern states. These stores were re-branded as Red Rooster. In May 2002, Red Rooster was purchased by Australian Fast Foods (AFF). Currently there are over 290 Red Rooster stores in Australia represented in New South Wales, Victoria, ACT, Queensland, Western Australia and the Northern Territory. Franchise owners, trading under the Red Rooster brand operate some stores in Queensland and the Northern Territory. These franchises undertake the same policies and procedures as company stores so that a highly consistent standard of quality products and customer service is maintained. As Red Rooster’s mission states that
“Red Rooster will be a leading Australian owned fast food company that is committed to providing innovative products that are consumer and lifestyle focused.”
This mission statement will be achieved by:
Value The ingredients and nutrition information are provide to customers for their health and balanced diet (see Appendices 19 -22)
Quality and hygiene Red Rooster Quality Assurance Officers often visit the suppliers to make sure that the ingredients are in the highest standard. In addition, there is no added MSG in any Red Rooster product.
Efficient service Franchisees undertake the same policies and procedures as company chains so that a highly consistent standard of quality products and customer service is maintained.
1.2 Marketing Plan Scope: New Product Launch
Australians are leading busier lives with less time to cook, as the lifestyles are changing for everyone. Growth in the number of younger, single occupant and non-family households has contributed to the decline in home cooking. This has led to the increase of fast food operators in Australia. In addition, the numbers of people who are more concerned with their health have increased significantly. To attract this market segment and provide more alternatives to the customer a new health range of products will be launched in May. Red Rooster is going to launch as follow;
Grilled Chicken Fresh Salad variety Wholemeal Buns Fruit Juice variety
Consequently, we will focus on creating new-products’ awareness and increase outlets owned by the company and franchisees. Our aim is to accurately analyse the Australian fast food market, find relevant target segments and introduce the health range to dominated acceptance. Red Rooster intends to increase its market share up to 16% and become the market leader in health food in the Australian market.
UTS: Marketing, Concepts & Applications (24746) Page 28.05.2004 4

Prepared for: Mr. Paul Vorbach
2. EXTERNAL & INTERNAL ANALYSIS
As this part of our marketing plan constitutes the critical backbone of all our recommendations for the marketing strategy and subsequent marketing mix tactics, a comprehensive and rigorous analysis of the relevant market environment was critical. Therefore, we defined a broad definition of the market and conducted extensive secondary and primary research to ensure future success of our marketing strategy and recommended marketing tactics.
2.1 Market Definition & ‘Broad Segmentation’
2.1.1 Broad Strategic Market Definition: Shift towards Healthier Variety
Although the Australian eating out culture developed relatively late compared to the US and UK, it is today one of the most dynamic in the world in terms of growth and competition. To avoid a narrow market definition and, hence, its potential to restrict discovery of new market opportunities, Red Rooster has realised that it needs a broader strategic market definition.
According to the 2003 BIS Shrapnel Report, the foodservice market is defined as comprising all eating out establishments including restaurants, cafes, fast food outlets, hotels/pubs, clubs, institutional eating establishments, independent sandwich and hamburger shops, fish and chip shops, Asian food outlets, pizza stores, pubs, supermarkets, convenience stalls and catering. This entire market may be considered indirect competitors for Red Rooster, mainly if we take into account the changing eating habits of the Australians.
The Quick Service Restaurant sub-sector (QSR) represents about 30% of the Australian Foodservice market and comprises the direct competition market for Red Rooster. Roy Morgan (see Appendix no. 1) defines the main fast food chains which make part of the QSR market: KFC, Pizza Hut, Red Rooster, Pizza Haven, Nandos, Dominos, McDonald's, Eagle Boys Pizza, Hungry Jack's and Subway. Given the 11 different fast food product categories in the QSR industry, we can classify them according to temperature and perceived healthiness, as seen in Graph 1. Graph no. 1: Strategic market definition of the fast food industry
Source: Adapted from Best, 2000 in Gudergan, S. P. (2001)
UTS: Marketing, Concepts & Applications (24746) Page 28.05.2004
Perceived as healthy
Cold Food
Perceived as unhealthy
Hot Food
Fries
Desserts Salads
Wraps
Beef Burgers
Pizza PastaDeli-style
SandwichesSubmarine
Sandwiches
Chicken products Fish products
5

Prepared for: Mr. Paul Vorbach
For purposes of comparison, the main direct competitors of Red Rooster are McDonald’s, Subway, KFC and Hungry Jacks. Each of them will be analysed in detail in the following section. Australians spend about 30% of their food budget on eating out. In 1999, Australian households spent an average of $127 each week on food and non-alcoholic beverages, of which $34 are spent on meals out, $19 on fast food and takeaway (ABS, 2000). For more details on household expenditure on food, see Appendix No. 2.
2.1.2 Market Potential, Market Penetration and Market Demand
The foodservice consumer market is worth approximately AU$ 24 billion, and is still recovering from two years of weak growth, in 2000 and 2001, due to the economic slowdown and the introduction of the Goods and Services Tax. The fast food market is worth about AU$ 7.3 billion and is estimated to keep growing in the following years.
Between 1998 and 2002, retail sales of fast foods increased at an annual rate of 3 per cent. In 2002, there was a slight recovery with an increase rate of 5 per cent, achieving AU$ 7 billion. Growth in fast food and takeaways is expected to average only 1.5 per cent per annum in the period to 2005 (at constant prices). However, the major chains are expected to grow at a rate of 5.7 per cent per annum with the introduction of new marketing strategies - such as more comprehensive menus and a proliferation of smaller stores in shopping centres, hospitals and convenience stores. Higher economic growth is expected to drive continued strong demand in 2005.
The food service industry served nearly 4.2 billion meals in 1998 or 222 meals per head compared with 216 in 1996, according to the Hotel, Restaurant and Institutional Food Service Sector Report (2000). There is a potential for substantial growth particularly if we look at the US, where consumers eat out twice as often as Australians. The report forecasts the number of meals served will increase by 4% annually over the next 2 years, benefiting restaurants, cafes and fast-food chains.
The most recent social trends that affect the foodservice market are: Australians are spending more time outdoors (Appendix No. 3); Eating out has been more and more associated with entertainment (HRI Food Service
Report 2000); Customers are eating out more frequently - 2.25 times per week (Roy Morgan) Consumers are more conscious about a healthy diet, what has been translated in an
increasing demand for healthier meals. (Bis Shrapnel Foodservice Report May/June 2003.)
Based on forecasts of secondary sources, we have estimated the following figures for total market potential (assuming that the maximum number of potential customers would increase their fast food consuming from 2.24 to 7 times a week), market penetration of Red Rooster and market demand for the entire fast food market, as summarised in Graph No.2 and No.3.
UTS: Marketing, Concepts & Applications (24746) Page 28.05.2004 6
Prepared for: Mr. Paul Vorbach
Graph no. 2: Market Potential, Penetration and Demand: 1999-2009 (estimates for 2004-2009)
0
5
10
15
20
25
30
AU$ (b)
1999 2000 2001 2002 2003 2004 2005 2006 2007 2008 2009 Year
Total Demand Penetration - Red Rooster Market Potential
Source: Bis Shrapnel Foodservice Report May/June 2003.
Graph no. 3 – Demand of meals per year in the Australian Food Service Market (Estimates 2004-2008)
No. of meals served per year in Australia (Estimates 2004-2008)
0.00
1.00
2.00
3.00
4.00
5.00
6.00
1996 1998 2000 2002 2004 2006 2008
(bill
ions
of m
eals
)
Source: Australia Hotel, Restaurant, Institutional Food Service Sector Report, 2000.
UTS: Marketing, Concepts & Applications (24746) Page 28.05.2004 7

Prepared for: Mr. Paul Vorbach
2.2 Market Research
Our market research process consisted of four recommended steps (Gudergan, 2001, p.183): defining the problem and the research objectives, designing the research, implementing the research plan and interpreting and reporting the findings. Our research can be considered as a descriptive one as we wanted to define the market potential for a product, the demographics and attitudes of potential customers especially in terms of expected benefits of the new products. Our goal was to define a profile of an “innovator/early adopter” buyer of Red Rooster’s new healthy range. Based on our information needs we decided to gather both kinds of data, secondary and primary as well.
2.2.1 Secondary Market Research
We gathered secondary data, mainly from well-known and reliable independent sources such as ABS, Euromonitor International, Roy Morgan, Bis Shrapnel etc. (for the complete list refer to References). This phase was quick and the data was obtained at a lower cost. For more details on the geographic and demographic factors refer to Appendix No. 4 - 5.
2.2.2 Primary Market Research
We decided to conduct primary research, because there was some critical information that could not be extracted from secondary research. Insights about the customers’ acceptability of a new healthy range that has not been launched yet, as well as customer perceptions of Red Roster relative to the main competitors and details about customer behaviour could only be found through direct contact with the customers.
We opted for a mix of quantitative and qualitative research, because it would enable us not only to measure relative satisfaction but also to obtain valuable in-depth insights that could help us identify problems and design a more complete solution. For details concerning our research objective, target group, methodology, location, questionnaire’ sample and a summary list of our findings and their implementation within our marketing mix refer to Appendix No. 6 - 7.
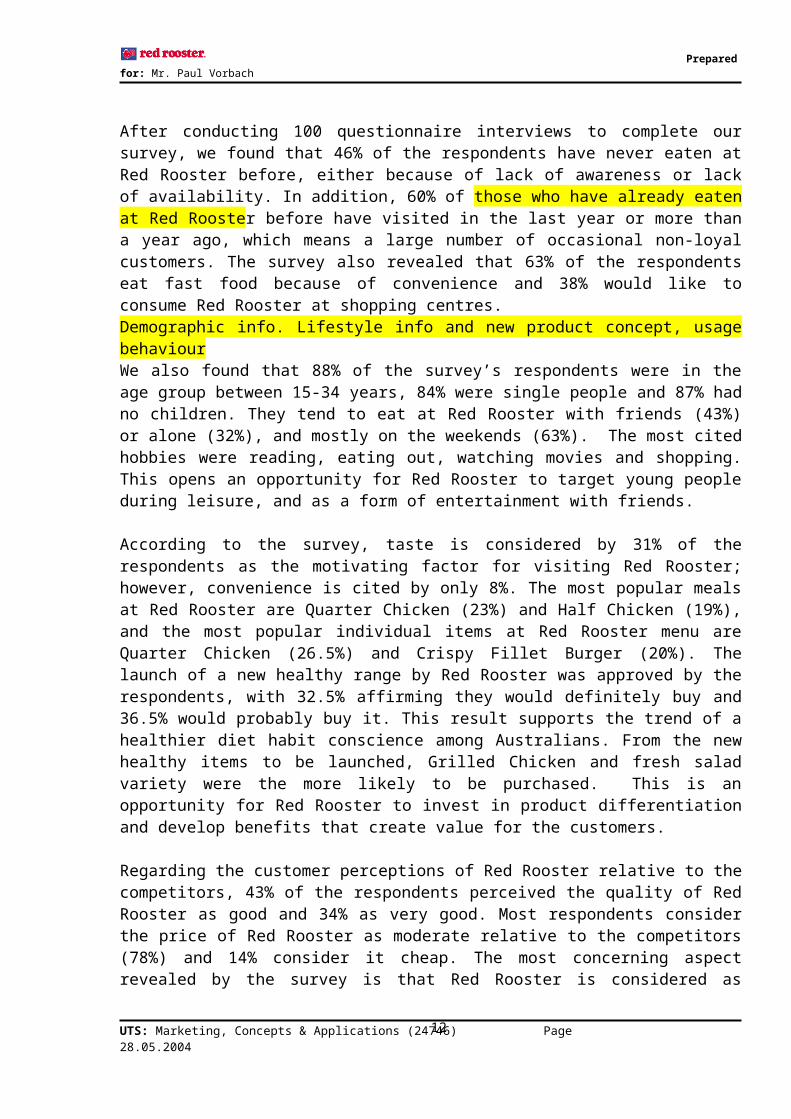
After conducting 100 questionnaire interviews to complete our survey, we found that 46% of the respondents have never eaten at Red Rooster before, either because of lack of awareness or lack of availability. In addition, 60% of those who have already eaten at Red Rooster before have visited in the last year or more than a year ago, which means a large number of occasional non-loyal customers. The survey also revealed that 63% of the respondents eat fast food because of convenience and 38% would like to consume Red Rooster at shopping centres.Demographic info. Lifestyle info and new product concept, usage behaviourWe also found that 88% of the survey’s respondents were in the age group between 15-34 years, 84% were single people and 87% had no children. They tend to eat at Red Rooster with friends (43%) or alone (32%), and mostly on the weekends (63%). The most cited hobbies were reading, eating out, watching movies and shopping. This opens an opportunity for Red Rooster to target young people during leisure, and as a form of entertainment with friends.
According to the survey, taste is considered by 31% of the respondents as the motivating factor for visiting Red Rooster; however, convenience is cited by only 8%. The most popular meals at Red Rooster are Quarter Chicken (23%) and Half Chicken (19%), and the most popular individual items at Red Rooster menu are Quarter Chicken (26.5%) and Crispy Fillet Burger (20%). The launch of a new healthy range by Red Rooster was approved by the respondents,
UTS: Marketing, Concepts & Applications (24746) Page 28.05.2004 8

Prepared for: Mr. Paul Vorbach
with 32.5% affirming they would definitely buy and 36.5% would probably buy it. This result supports the trend of a healthier diet habit conscience among Australians. From the new healthy items to be launched, Grilled Chicken and fresh salad variety were the more likely to be purchased. This is an opportunity for Red Rooster to invest in product differentiation and develop benefits that create value for the customers.
Regarding the customer perceptions of Red Rooster relative to the competitors, 43% of the respondents perceived the quality of Red Rooster as good and 34% as very good. Most respondents consider the price of Red Rooster as moderate relative to the competitors (78%) and 14% consider it cheap. The most concerning aspect revealed by the survey is that Red Rooster is considered as unpopular by the interviewees. The perceived rank of popularity of the fast food chains in Australia is: McDonald’s (45%), KFC (27%), Hungry Jack’s (10%), Pizza Hut (8%), Domino’s (4%), Red Rooster (3%), Subway (2%) and Oporto (1%).
In summary, what can be extracted from these results is that Red Rooster has serious problems of lack of awareness, wrong positioning leading to no identification with the brand, low retention rate (occasional non-loyal customers) and lack of availability, which restricts the demand and penetration of Red Rooster in the market.
2.3 External Analysis
Based on our secondary and primary research results we were then able to summarise the following data relevant for our marketing strategy and marketing mix tactics.
2.3.1 Macro-environmental Situation - PEST Analysis
2.3.1.1 Political FactorAustralia has been recognised as one of the most stable political and social environments in the Asia-Pacific region. Australia is considered more stable than the US, UK and most of the OECD globally (see Appendices. No.8-9)
Introduction of GSTSince the new millennium has begun, the Goods and Services Tax (GST) has been introduced at the rate of 10% to replace several existing indirect tax including Whole Sales Tax (WST). As a result of this, some prices will fall and some will rise. The Australian government wants consumers to receive the benefits from indirect tax reductions. It also wants to avoid exposing them to unreasonably high price rises.
Free Trade AgreementFurthermore, Australia and the US exercise a Free Trade Agreement (FTA). This agreement has the potential to open Australian markets for US goods and services. Its trade policies being unwrapped and a market-oriented regulatory establishment provide a positive environment for growth and investment for its economy.
2.3.1.2 Economic Environment In spite of the effects of the severe acute respiratory syndrome (SARS) epidemic, war in Iraq and security concerns on tourism including economic downturn in Asia and the United State, the Australian economy continues to grow (Appendix 10). This has led to a significant amount of foreign investment in Australia. There are many indicators identifying the performance of the Australian economy, as follows;
UTS: Marketing, Concepts & Applications (24746) Page 28.05.2004 9
Prepared for: Mr. Paul Vorbach
Moody (2003) has recently reported that Australia’s credit rating has been raised from ‘Aa2’ in October 2002 to ‘Aaa’ in January 2003 due to stability in its economy and maintaining the Government’s low debt levels. Credit strengths for the country are:
(1) Strong growth performance over the past few years; and (2) The healthy budget and public debt situation maintained over the medium term.
The unemployment rate dropped to 5.6% in October 2003 compared with 6.3% in June 2002. Similarly, employment rate rose significantly by 2.5% in 2002-03 after a small growth in 2001-02.
By the end of last year, the Reserve Bank of Australia (RBA) raised interest rates for the first time in 17 months, indicating a stronger international economy and concerns over domestic credit growth.
The Wage Cost Index slightly increased to 3.6%. This also refers to a higher amount of payment, on average, in every industry.
2.3.1.3 Socio-cultural Factor Educational change
Australian Bureau Statistics (ABS) states that Australia's population at June 2003 was 19.9 million people, an increase of 240,500 people over June 2002. This represents an annual growth rate of 1.2%, the same as the average annual growth rate for the five years to June 2003. 42% of the working age population has a university degree, diploma or trade qualification. Australia’s higher education enrolment rate, at around 80% of the population, is one of the highest in the world - only Canada and the US have higher rates (Global Competitiveness Report, 2001-02). An example of this figure is new students enrolled in a postgraduate degree was about 110,000 in 2002 compared with 96,691 in the previous year and 74,651 in 2000 (Dodd, 2004). Therefore, Australia is ranked second in the region for the availability of skilled labour.
Health consciousnessMany new diseases have currently taken place around the world, for example, bird flu and mad cow disease, which are the critical health issues that consumers have been concerned with. In addition, consumer behaviour has changed to be more careful in selecting foods for their wellbeing. In order to satisfy the consumers, a large number of fat-free food products have been launched, more so than ever before. Furthermore, surveys conducted by the Australian Supermarket Institute indicate that consumers in 1996 were more concerned about food hygiene compared to a survey in 1992 when consumers pointed out that pesticides and chemicals posed the greatest threat to the safety of food. The incidences of food borne illnesses are increasing globally and are a severe public health issue for Australia. This has resulted in a decrease in the number of Australians which ate out less frequently. In 2002 the number had dropped to 83 times compared with 94 times annually in 2000. Convenience was the major feature of eating fast food in 2000, whereas special occasions, break in routine and meeting friends were the main reasons in 2002 (http://www.c-store.com.au/articles/bis-eatingoutrends.html).
UTS: Marketing, Concepts & Applications (24746) Page 28.05.2004 10

Prepared for: Mr. Paul Vorbach
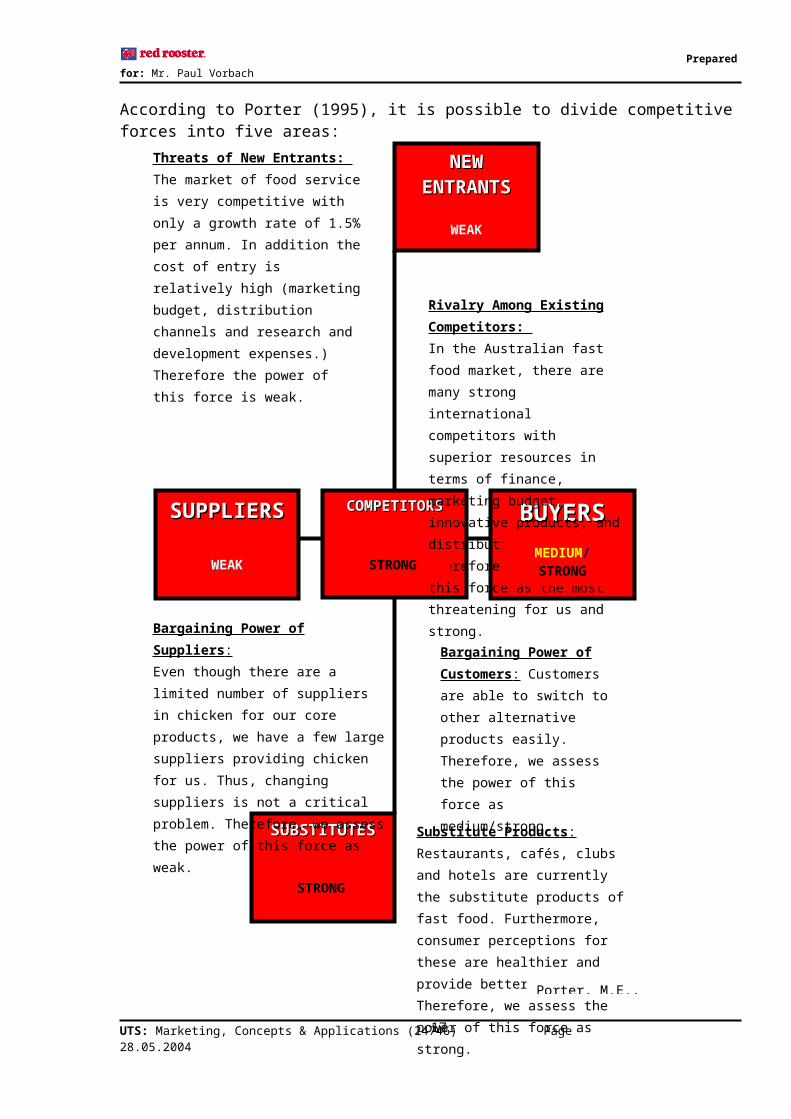
2.3.1.4 Technological Factor 2.3.2 Porter’s Five Forces AnalysisAccording to Porter (1995), it is possible to divide competitive forces into five areas:
UTS: Marketing, Concepts & Applications (24746) Page 28.05.2004
SUPPLIERSUPPLIERSS
SUBSTITUTESSUBSTITUTES
BUYERSBUYERSCOMPETITORSCOMPETITORS
NEW NEW ENTRANTSENTRANTS
Threats of New Entrants: The market of food service is very competitive with only a growth rate of 1.5% per annum. In addition the cost of entry is relatively high (marketing budget, distribution channels and research and development expenses.) Therefore the power of this force is weak. Rivalry Among Existing
Competitors: In the Australian fast food market, there are many strong international competitors with superior resources in terms of finance, marketing budget, innovative products, and distribution channels. Therefore, we consider this force as the most threatening for us and strong.
Bargaining Power of Customers: Customers are able to switch to other alternative products easily. Therefore, we assess the power of this force as medium/strong.
Bargaining Power of Suppliers: Even though there are a limited number of suppliers in chicken for our core products, we have a few large suppliers providing chicken for us. Thus, changing suppliers is not a critical problem. Therefore, we assess the power of this force as weak.
Substitute Products:Restaurants, cafés, clubs and hotels are currently the substitute products of fast food. Furthermore, consumer perceptions for these are healthier and provide better services. Therefore, we assess the power of this force as strong.
WEAK
WEAK STRONGMEDIUM/ STRONG
STRONG
Porter, M.E., 1995
11

Prepared for: Mr. Paul Vorbach
2.3.3 Competitor Analysis
Combined with the concerning levels of obesity in Australia and the changing habits in terms of food intake and exercising, fast-food outlets have been under enormous pressure to adapt. This section analyses the main features of Red Rooster competitors, their recent strategies aiming the healthy food segment and their market positioning. For details about market share and sales forecast per competitor, refer to Appendices No. 14-15.
Healthier livingWorldwide there is a move by consumers to healthier lifestyles. One of the manifestations of this is the shift to healthier fast foods. Expanded menu choice is already underway in many McDonald’s around the world. For example, McDonald’s UK offers sliced fruit; McDonald’s France provides low fat yogurt and the US offer beverage choices that include low fat milk, bottled water, juices and non-carbonated drinks. McDonald’s Australia serves a Happy Meal with toasted cheese and tomato sandwich, raisins and orange juice.Source: www.mcdonalds.com accessed March 2005. Subway has recently changed its positioning to take maximum advantage of the desire to slim. Previously, their marketing had been focused around flavour and customization - the fact that consumers could choose exactly what wanted on their sandwiches – basically a product focus. Now, they are strongly positioned as the healthy option in fast-food – a focus on the customer’s benefit. This shift has proved profitable and has resulted in a rapid expansion of the chain in the USA and Australia. Currently, Subway is on the crest of overtaking McDonald's as the fast-food outlet with the most number of stores throughout Australia. Subway has over 625 stores trading throughout Australia and is opening about four new outlets a week. It expects to overtake McDonald's, which has 726 stores, by year's end.
But McDonald's has also moved forward. Since it introduced the Salads Plus range into its stores, McDonald's Australia has experienced an extraordinary explosion in profit, achieving a record level of sales of $1.8 billion – one of the highest in its 32-year history. McDonald’s Australia was the best performing country in the Asia Pacific, Middle Eastern and African region. Its bumper profits are almost totally due to the new healthy range, which includes a veggie burger, chicken folder, yoghurt and a range of salads. They are about to introduce nutritional labelling on some of its products, outlining fat content, sugar content, total energy content and percentage of saturated fat. The company also has plans to begin using canola oil instead of the current combination of beef tallow combined other oil, and has announced that it will reduce the sugar content of its patties.
McDonald’s positioning has been focused on greater variety, choice and diversity in the tastes offered to customers. One of the ways they have tackled this is through the 36 different items offered since September 2001 on their New Tastes menu. The new healthy range menu does not represent a change in their core focus, but a line extension which allows them to penetrate a new market and expand the demand, which is a really competitive strategy considering the level of competitiveness and saturation of the food market.
McDonald’s Australia has 726 stores with more than 55,000 employees, 1million customers daily and is one of the largest purchasers of Australian products. In an average year McDonald’s Australia purchases 307 million hamburger buns, 88 million kgs of potatoes, 60 million eggs, 24
UTS: Marketing, Concepts & Applications (24746) Page 28.05.2004 12
Prepared for: Mr. Paul Vorbach
million litres of milk, 18 million kgs of beef, 5.5 million kgs of cheese, 11 million kgs of chicken, 5 million kgs of lettuce and 1 million kgs of beetroot.
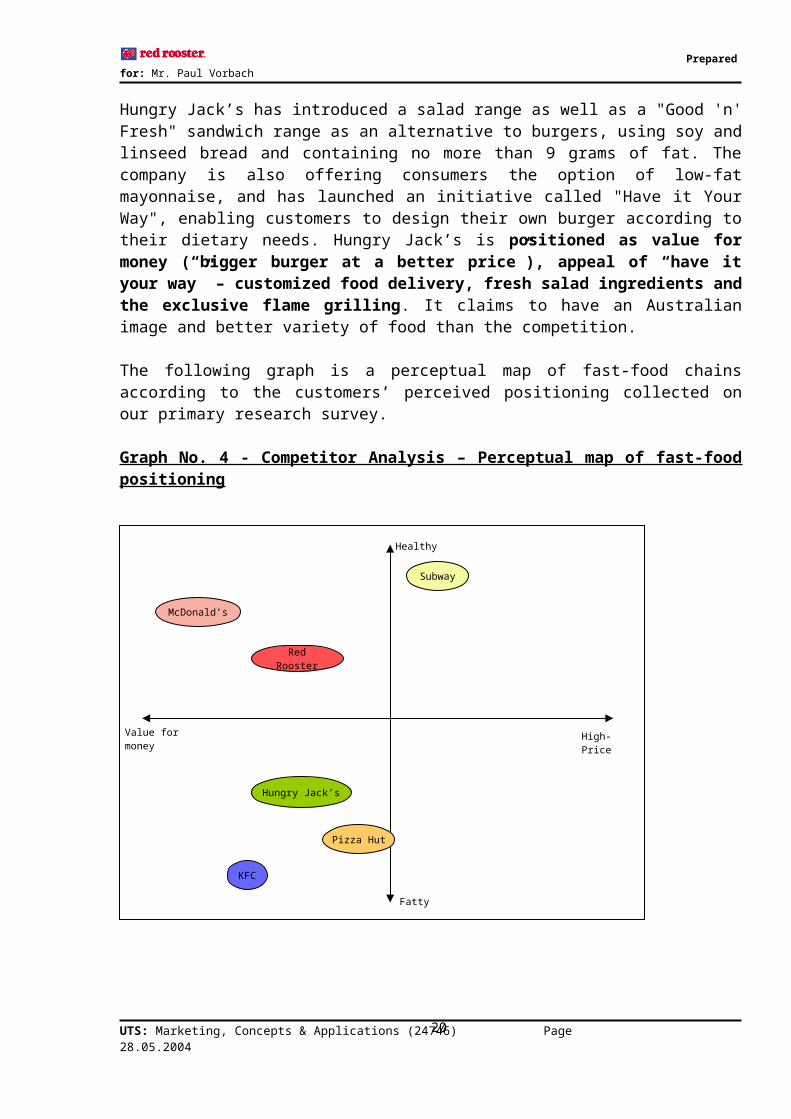
Fast-food pizza chains have been criticized by anti-obesity advocates for launching crusts full of cheese, which substantially increases the fat content. At the same time large pizzas are being offered at discount prices, attracting more price-sensitive customers. KFC and Pizza Hut, both owned by the multinational Yum! Restaurants International, have not announced any plans to make their menus healthier. KFC is showing no signs of changing the high fat, sugar and salt contents of its deep-fried chicken. Hungry Jack’s has introduced a salad range as well as a "Good 'n' Fresh" sandwich range as an alternative to burgers, using soy and linseed bread and containing no more than 9 grams of fat. The company is also offering consumers the option of low-fat mayonnaise, and has launched an initiative called "Have it Your Way", enabling customers to design their own burger according to their dietary needs. Hungry Jack’s is positioned as value for money (“bigger burger at a better price”), appeal of “have it your way” – customized food delivery, fresh salad ingredients and the exclusive flame grilling. It claims to have an Australian image and better variety of food than the competition.
The following graph is a perceptual map of fast-food chains according to the customers’ perceived positioning collected on our primary research survey.
Graph No. 4 - Competitor Analysis – Perceptual map of fast-food positioning
For a detailed comparison of products from these different competitors refer, to Appendices No. 14 -15.
UTS: Marketing, Concepts & Applications (24746) Page 28.05.2004
High-Price
Healthy
McDonald’s
Hungry Jack’s
Value for money
Fatty
Subway
Pizza Hut
KFC
Red Rooster
13

Prepared for: Mr. Paul Vorbach
UTS: Marketing, Concepts & Applications (24746) Page 28.05.2004 14
Prepared for: Mr. Paul Vorbach
2.4 Internal Analysis – Company’s Competencies
The first Red Rooster store was opened by the Kailis family in Perth in 1972. In 1992, Red Rooster bought the Big Rooster chain to expand into the eastern states. These stores were re-branded as Red Rooster. It progressively grew interstate and was sold to the large national retailer Coles-Myer in July 1981. In May 2002, Red Rooster was purchased by the Australian Fast Foods group. Australian Fast Foods, which also owns the Western Australian chain Chicken Treat, is aiming for total sales of about AU$ 700 million next financial year, through an aggressive strategy to penetrate the Eastern markets, where Red Rooster has a large growth potential.Currently Red Rooster employs over 5,500 staff in 335 outlets in Australia. From this total, 277 are company-owned stores - represented in New South Wales, Victoria, ACT, Queensland, Western Australia and the Northern Territory. There are also 58 franchisee-owned outlets trading under the Red Rooster brand in Queensland and the Northern Territory. The aim is for 302 company stores and 76 franchise stores by the end of next financial year and for the next two years there is a target of 132 store openings, including entry into New Zealand.
Product differentiation is the fundamental key to the competitive strategy of Red Rooster. Red Rooster recognizes the importance of employing the right people to provide good service and quality, at the best affordable price. Red Rooster requires a strict one-on-one quality control monitoring, ordering and preparation by a competent and active store manager and team members. It’s positioning stresses on “fresh” as being a concept and promise of the core product. Red Rooster’s chicken, which has lower fat content because of the cooking method, has always provided the competitive edge. The barbequed chicken range was traditionally the only available healthy choice.
The competitive nature of the fast food sector demands confidentiality and flexibility. At Australian Fast Foods the focus is totally on the day-to-day running of the business, complemented with on-line, real time systems that keep people informed and up-to-date to respond quickly to the changing demands. This has enabled Red Rooster to move towards the market needs for innovative alternatives. Recent technological investments such as the installation of new Combi ovens have ensured consistency of products and the development of innovations such as freshly baked rolls. Fresh subs were launched in December 2002 and a new salad selection and a new healthier chicken will be released later in the year. These initiatives will complement the store décor refurbishments as well as a fresh positioning, marketing and advertising strategy.
Red Rooster is very proud of its supply chain management. There are a limited number of suppliers in frozen food, chicken, beverage and packaging and, in 25 years, there has not been any change in the major suppliers. This is justified by the open book policy adopted in Red Rooster, where direct, one-to-one negotiations have been reflected in a transparent and respectful long-term relationship between Red Rooster and its major suppliers.
The initial Franchise fee for a single site is $38,500 AUD. There is a service fee of 5% of the franchisee’s gross weekly sales and there is also an Advertising Contribution of 5% of the franchisee’s gross weekly sales. The minimum working capital requirement (or facility) is $30,000AUD. The required level of start up capital to become a Red Rooster franchisee will depend on such things as store size and facilities, but generally ranges between $450-$550,000 AUD.
UTS: Marketing, Concepts & Applications (24746) Page 28.05.2004 15

Prepared for: Mr. Paul Vorbach
2.4.1 Franchising
With a commitment to expansion and profitability Red Rooster is seeking to spread its franchise network to regional New South Wales, Victoria and South Australia plus the new markets of Tasmania and New Zealand. The length of the franchise agreement is 10 years with an option of a further 10 years subject to the conditions of the Franchise Agreement. The length of a Franchise Agreement may be lesser in circumstances such as shopping centre food courts if the terms of occupancy are less than 10 years
Red Rooster approves all sites, undertakes lease negotiations and in most cases takes the Head Lease on the store. Red Rooster contracts with the builder and manages the project from construction to fit out completion thus providing a turnkey project. There is a Lease / License Fee of $500AUD per annum which is charged in equal instalments.
Red Rooster has developed an extensive training program of up to 16 weeks which covers all aspects of the business. Training is carried out in a certified training store and there is a training fee for up to 3 people of $6600AUD.
Under the new management of Australian Fast Foods, Red Rooster is on the way of profitable results. Attention will be given to correct the poor distribution strategy, mainly in New South Wales and Queensland, where the company is least represented (e.g., no new Red Rooster was opened in Queensland for two years), adjustments to the positioning will be made to reinforce freshness and health, promotional activities will project the brand nationally and these actions together are intended to drive a projected market share growth to around 16% of the fast food marketplace by the end of 2005.
2.4.2 Mission Statement
Red Rooster will be a leading Australian owned fast food company that is committed to providing innovative products that are consumer and lifestyle focused.They will achieve this by exceeding customer expectations for:- Value- Quality- Efficient Service- Hygiene
2.4.3 Products
Red Rooster offers a wide and varied menu to customers specializing in quality chicken products. Their core product is barbequed chicken, which was developed as a unique recipe when Red Rooster first began thirty years ago. They now offer products that have appeal to all ages and tastes including the Little Red Rooster Meal, Chicken and Chips, Strip Sub and the Crispy Fillet Burger to name a few. Red Rooster continually strives to develop products that are innovative, price competitive and offer maximum enjoyment and convenience to customers. Their most popular products include the following:
UTS: Marketing, Concepts & Applications (24746) Page 28.05.2004 16

Prepared for: Mr. Paul Vorbach
Table 1 – Red Rooster’s list of products:
Chicken MealsBBQ Chicken The highest quality chicken is delivered to stores fresh daily and hand
seasoned using Red Rooster's famous recipe. Each and every chicken is marinated then cooked to perfection.
Quarter Chicken and Chips
Satisfy your appetite with a quarter BBQ Chicken and our famous chips.
Half Chicken and Chips Half BBQ Chicken and Chips.Tropical Pack Quarter BBQ Chicken and Chips and Two Pineapple Fritters.Chicken Dinner Quarter BBQ Chicken and Chips, Mashed Potato and Gravy and Peas.Burgers, Rolls and SubsCrispy Fillet Burger Crispy coated chicken fillet breast topped with lettuce, tomato, cheese and
mayonnaise in a soft sesame seed bun.Strip Sub Spicy coated tender strips of chicken with creamy garden herb sauce in a
freshly baked bread roll.Flayva Two chicken breast strips coated with our unique spicy crunch coating,
served with a creamy herb sauce, lettuce and tomato all wrapped in a fresh tortilla.
Fresh Sub 97 Tastes great and won't weigh you down. Succulent pieces of tender chicken, fresh lettuce, tomato and cucumber topped with Kraft Free Mayonnaise, in a freshly baked bread roll. 97 percent fat free, 100 percent flavour.
Chicken Roll A soft warm sesame seed roll filled with fresh BBQ Chicken pieces, herb stuffing and creamy mayonnaise.
UTS: Marketing, Concepts & Applications (24746) Page 28.05.2004 17
Prepared for: Mr. Paul Vorbach
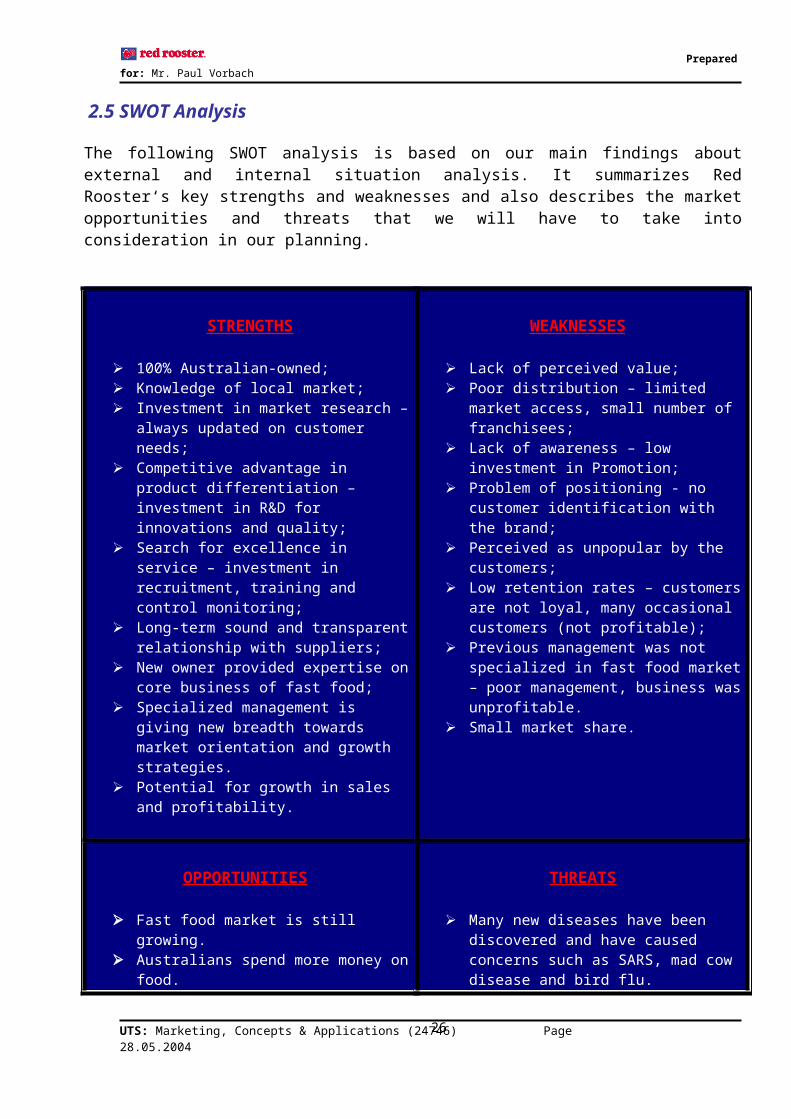
2.5 SWOT Analysis
The following SWOT analysis is based on our main findings about external and internal situation analysis. It summarizes Red Rooster‘s key strengths and weaknesses and also describes the market opportunities and threats that we will have to take into consideration in our planning.
STRENGTHS
100% Australian-owned; Knowledge of local market; Investment in market research – always
updated on customer needs; Competitive advantage in product
differentiation – investment in R&D for innovations and quality;
Search for excellence in service – investment in recruitment, training and control monitoring;
Long-term sound and transparent relationship with suppliers;
New owner provided expertise on core business of fast food;
Specialized management is giving new breadth towards market orientation and growth strategies.
Potential for growth in sales and profitability.
WEAKNESSES S
Lack of perceived value; Poor distribution – limited market access,
small number of franchisees; Lack of awareness – low investment in
Promotion; Problem of positioning - no customer
identification with the brand; Perceived as unpopular by the customers; Low retention rates – customers are not loyal,
many occasional customers (not profitable); Previous management was not specialized in
fast food market – poor management, business was unprofitable.
Small market share.
OPPORTUNITIES S
Fast food market is still growing. Australians spend more money on food. Consumers are more concerned about healthy
food which matches with our new target market.
The survey shows there is a great opportunity to grow in Sydney, especially in the city.
A strong trend for healthy and nutritious products is emerging.
The market is moving towards healthy fast food, becoming increasingly aware of health & nutrition.
THREATS
Many new diseases have been discovered and have caused concerns such as SARS, mad cow disease and bird flu.
The substantial number of substitute products (Asian foods, hotels and cafes)
Competitors are frequently launching innovative products.
Other fast food chains are markedly growing. Asian foods are booming. Australian economic health (strongly
dependant on global economy and the political situation)
UTS: Marketing, Concepts & Applications (24746) Page 28.05.2004 18

Prepared for: Mr. Paul Vorbach
3. STRATEGIC OBJECTIVES & ISSUES
3.1 Target Markets: “Young Professional” and “Student”
3.1.1 Market Geographic Factors
Based on information described in Appendix No.4 we were able to define the following areas and cities where we will focus our sales promotion marketing activities by priorities: NSW, Victoria, Queensland, Western Australia, South Australia, and Northern Territory. In terms of the official launch, we plan to go with it in Sydney and in Melbourne. Advertising campaign is planned on the nation-wide level.
3.1.2 Market Demographic and Lifestyle Factors
The information described in Appendix No.5, together with our primary market research outcome (for detailed list of findings refer back to Appendices 6-7), helped us clearly and accurately define two profiles (segments) of our target group in terms of the following three groups of criteria:
Demographic factors: sex, age, marital status, qualification, and occupation. Market lifestyle factors: attitudes, values, activities, interests of our potential customers Usage behaviour factors: time of use, occasion of usage, repetition of usage etc.
3.1.3 Passion Based Market Segments
Based on the previous market analysis and on our primary and secondary research, we have identified the following two profiles of potential buyers of the new health range at Red Rooster.
UTS: Marketing, Concepts & Applications (24746) Page 28.05.2004 19

Prepared for: Mr. Paul Vorbach
Table No.2: Needs/Passion – Based Market Segments
SEGMENT PROFILE “YOUNG PROFESSIONAL” “STUDENT”Demographics:Age 25-35 15-25Income mid/high lowMarital Status single/engaged/married singleChildren no noQualification secondary/university secondary/universityOccupation information-intensive industries studentLifestyle:Free time activities Mainly with friends/club members
- sport and outdoor activitiesmainly with family and friends
-sport and outdoor activitiesHealth conscious middle/high level middle levelValues friendship friendshipRoy Morgan Values Segments Socially Aware/Something
better/Young Optimism Look at me
Eating Habits:Convenience High LowForm of leisure Low HighEnjoy the taste Medium HighUsage Behaviour:Time of buying health food Lunch breaks Lunch/dinner Occasions Weekdays or weekends Weekdays or weekendsFrequency of buying health products
4 times/week 2 times/week
Buying Decision Forces:Reference group Friends Family members, friends
For factors and reference groups influencing buying decisions of the identified “Student” and “Young Professional” refer to Appendices No.16-17. Those influences will be also taken into consideration within the process of integrated marketing communication mix preparation.
3.2 Market Positioning
The marketing strategy will be based on our portfolio analysis (for details refer to Appendix No. 18). The following factors have been taken into consideration:
3.2.1 Business Performance
Share Position – Red Rooster occupies 9% of the Australian consumer retail food industry
Profitability – Red Rooster’s profitability under Coles Myer was floundering, but with the ownership of Australia Fast Foods, profits are forecast at AUS$700 million
Sales Growth – Red Rooster’s growth is set to rise with a forecast for the next two years, with a target of 132 store openings, including entry into New Zealand
3.2.2 Market Attractiveness
Market Forces:
Market Size: Red Rooster has an average sized market share in the area of retail fast food. There is a great potential to grow, thus enhancing market attractiveness.
UTS: Marketing, Concepts & Applications (24746) Page 28.05.2004 20
Prepared for: Mr. Paul Vorbach
Growth Rate: While launching the new health range, the growth rate will be considered to be of paramount importance, but eventually there would be some stability stage.
Buyer Power: As the health range is new and heavily advertised, the consumers will be receiving ultimate exposure, as well as the extra stores, thus generating a greater amount of interest for the consumer. The buying power is therefore low.
Customer Loyalty: Once a customer is satisfied with the product, he/she will stick to it. Hence, winning the customer loyalty is of utmost importance. Loyalty is very low at the moment, with 60% of patrons visiting Red Rooster on a yearly basis. The lack of loyalty can also be attributed to the fast food market, as the consumer’s tastes are fickle and variety is a feature which fast food retailers can offer easily. Thus lowering the attractiveness of the market.
Competitive Intensity:
Number of Competitors: according to the Porter’s 5 forces, competitors are the strongest force, as there are established international brands, as well as the local and national competitors Red Rooster must take into consideration.
Price Rivalry: In the retail food industry, prices can vary, but are relatively similar. Competitive pricing structures are utilised to enhance wealth.
Easy of Entry: As already mentioned in the Porter’s Five Forces analysis, entry to the market is difficult, as the growth rate is low and the cost of entry is relatively high. R&D costs are high when using an offensive strategy, in order to enter a market. The main players are Macdonald’s, KFC, Hungry Jack’s and Subway. Establishing a name and creating the necessary image is extremely difficult
Substitutes: This factor is most important, as efforts would be made to have a competitive edge over the substitutes.
Market Access:
Customer Familiarity: Customers are not as familiar with Red Rooster, as opposed to their competitors. It is therefore necessary to familiarise customers with Red Rooster as soon as possible, in order to gain acceptance as the market leader of health food. The earlier customers become familiar with the new range, the more profitable the launch will be.
Channel Access: This factor is also very significant. The product range must be distributed properly. As Red Rooster has maintained relations with the same suppliers for the past 25 years, this ensures the reliability of their channels.
Sales Requirement: A high customer service skilled sales force is needed. They will be trained in terms of the food available as well as how to treat the most valuable asset to Red Rooster, its customers.
Company Fit: Red Rooster’s experience with healthy and nutritious products makes a perfect match with their even healthier chicken, salads, wholemeal bread and fruit juices. This launch is extending their image of a health conscious food retailer, concerned for the well being of the customers.
UTS: Marketing, Concepts & Applications (24746) Page 28.05.2004 21
Prepared for: Mr. Paul Vorbach
4. COMPETITIVE MARKETING STRATEGY
4.1 Competitive Advantage
4.1.1 Cost Advantage:
Unit Cost: Red Rooster’s unit costs are low, as they usually are in the food industry. Margin prices are marked up to more than 50%.
Transaction Cost: The best mode of transaction should be chosen to minimize the cost. This factor is important up to a certain level.
Marketing Expenses: Red Rooster’s marketing expenses are high, due to the new health range being new it will undergo heavy advertising and promotion in the initial product launch. Some of the advertising will be for the new health range alone and cost more money. Each time Red Rooster is advertised its brand reaches a higher level of awareness and hence reinforcing the image of Red Rooster as a health food provider for the health conscious consumers.
Overhead Expenses: Overhead expenses are shared among the whole Red Rooster product range and will be a portion of the total costs.
4.1.2 Differentiation Factors:
Product and Service Quality: Product and service quality offered by Red Rooster are excellent, however this excellence remains unrecognised due to poor management by Coles Myer previously, and lack of strategic direction, which has damaged distribution and channelling, which has led to lack of awareness of the great quality offered by Red Rooster, because of the lack of availability of Red Rooster outlets.
Brand Image: Red Rooster is suffering from a non existent brand image, this is one of the weaknesses we aim to target in our strategy to grow market share.
Relative Price: Red Rooster’s price is slightly higher than that of competitors due to superior quality and nutritious value of the food.
4.1.3 Marketing Advantage:
Market Share and Brand Awareness: Red Rooster has a decent share of the market, at 9%, however the brand awareness remains low, due to reasons explained above. This has shown that Red Rooster has a great opportunity to bring its great products to a broader awareness, thus once this is achieved, market share shall naturally go up.
Distribution and Sales Coverage: Red Rooster’s distribution and sales coverage is also a weak point, thus presenting another great opportunity. Once Red Rooster invests in greater distribution and sales coverage, which will in itself increase brand awareness, and included with all the special promotions on offer with the product launch, will improve profits and market share.
4.2 Offensive Competitive Strategy: Market Share Growth
Red Rooster has a certain amount of market share, however it is not (in comparison to its competitors) reached its full potential. Therefore, Red Rooster - in a position of share offender
UTS: Marketing, Concepts & Applications (24746) Page 28.05.2004 22

Prepared for: Mr. Paul Vorbach
– is engaged in a battle to grow its market share in the retail food Industry, specifically food retailers which offer health food products (see Appendix No. 18).
QUESTION-MARK:As can be visually seen in the Boston Consulting Graph Matrix below, the Health Range will initially be in the Question Mark section, as the product requires significant spending - It does not produce positive cash flow at the beginning (mainly because of marketing expenses) but it is expected to shift to the Stars segment. The Cash Cow segment will be the main product offered by Red Rooster, which is its core product - Chicken.
Red Rooster Health Food Range - BOSTON CONSULTING GROUP MATRIX
A key part of Red Rooster’s long-run performance thus relies on its ability to successfully implement a grow share strategy in the fast-growing consumer and food retailing markets. This strategy requires a much greater marketing effort and investment in new products to grow their share of the market, and to become the leaders in producing tasty and nutritious health meals. The company remains thus committed to:
Research and Development; Efforts to improve its products and service quality at a rate faster than competition,
and Fully supporting the marketing budgets needed to gain a high-share position.
The introduction of Red Rooster’s Health Range can be thus considered as an additional step of Red Rooster growing its market share in the Australian market.
UTS: Marketing, Concepts & Applications (24746) Page 28.05.2004
MarketGrowth
10X 1x 0.1x
10%
Competitive Position
Red Rooste
r - Health
Question-marks
Dogs
Stars
Cash Cows
Red Rooster –
Chicken
23

Prepared for: Mr. Paul Vorbach
4.3 Marketing and Financial Objectives
Based on the overall marketing strategy of Red Rooster to enter and grow its market share as a leader in the health products range offered within the Australian retail food industry, the marketing objectives for the new Red Rooster health range are as follows:
4.3.1 Short-term Marketing Objectives
1st PHASE: Product Launch and Awareness Building
Timing: Launch: May 2004, Awareness Building: May 2004 – August 2004Target Group: Innovators and Early AdoptersWhere: Launch events in Sydney, Melbourne and Brisbane
Nation-wide, some sales promotion activities in capital cities of AustraliaHow: For marketing mix tactics see following Section 5.Market Metrics: Build awareness
Initial Market Penetration: 1% of the total market of fast health food. Financial Metrics: Total contribution margin: AU$ 17.56 million
For details concerning market and financial metrics refer to Section 6.
2nd PHASE: Further Market Development and Red Rooster Health Range Market Penetration
Timing: January 2005 - June 2005Target Group: Early Adopters/Early MajorityWhere: Nation-wide, some sales promotion activities in capital cities of AustraliaHow: For marketing mix tactics see following Section 5.Market Metrics: Market Penetration: 8% of the total market of fast food health range.Financial Metrics: Total contribution margin: AU$ 26.23 million. For details concerning
market and financial metrics refer to Section 6.
4.3.2 Long-term Marketing Objectives
3rd PHASE: Lead and Keep the Market (Fast Food Health Range)
Timing: After the Red Rooster Health Range market penetration the long term objective will be to keep the control of the market.
Target Group: Late Majority/LaggardsWhere: Nation-wide, some sales promotion activities in capital cities of AustraliaHow: For marketing mix tactics see following Section 5.Market Metrics: Market Penetration: 20% of the total market of fast food health range in
2009. Financial Metrics: Total contribution margin’s peak in 2009: AU$ 55. 66million.
For additional details concerning market and financial metrics refer to Section 6.
UTS: Marketing, Concepts & Applications (24746) Page 28.05.2004 24

Prepared for: Mr. Paul Vorbach
5. MARKETING MIX TACTICS
The marketing mix determines the ultimate success of the product. This includes the unique blend of pricing, promotion, products offering and distribution system designed to reach our target customers, which are, students and young professionals.
5.1 PRODUCT AND SERVICES
5.1.1 Product Quality
Red Rooster offers a wide and varied menu to customers specialising in quality chicken products. In building the company’s continuous commitment to meet its customer satisfaction, the new health products will emphasise, in several dimensions, in achieving its standard for quality; Taste; Hygiene; Health; Safe
The new grilled chicken was derived from the original recipe made 30 years ago by the Kailis family. Using only natural ingredients freshly obtained from the market, the new grilled chicken is bound to give Red Rooster customers a sense of indulgence, minus the guilt. (Ingredients of new grilled chicken recipe see: Appendix No.19)
The hygiene involved in storage, preparation, serving the new grilled chicken is consistent to the current code of practice set up in the Red Rooster restaurants. These set of practices have been a factor in Red Rooster’s success in promoting overall quality services and goods.
Healthy doesn’t mean low fat. Healthy in Red Rooster products is built on the ideology of a balanced diet. The new grilled chicken meals complete with a wide range of salads, whole meal buns and fresh juices will provide a nutritional food balance suitable for every patron to carry out their regular physical activities without worrying about excessive fats or high sugar contents. (Nutritional facts on the Red Rooster chicken: Appendix No.20)
Customers who feel safe in consuming the new health products will be built upon several facts; nutrition facts which have been discussed and the method of preparation. The new grilled chicken will be prepared under a 2500C oven for 5 hours. And according to the Agriculture Food Safety and Inspection Service, a whole chicken should reach an internal temperature of 180 F. Such procurement will ensure safe consumption of the new grilled chicken. (Complete method of preparation: Appendix No.19)
5.1.2 Meals and Sizes
Red Rooster offers a wide range of meals and sizes suited for the various demands of customers. Nominally, there are 3 different health meals with 3 different sizes available for individuals. In addition there will be a Coupe Meal suited for couples, a Party Pack which is capable of serving 4-6 people and the Family Pack suited for family dining, serving around 6-8 people. (Complete menu: Appendix No. 21).
5.1.3 Packaging
All chicken will be packaged using different sizes of recyclable milk board packaging in accordance to the meal. This is to ensure heat insulation as well as keeping the aroma within the
UTS: Marketing, Concepts & Applications (24746) Page 28.05.2004 25

Prepared for: Mr. Paul Vorbach
packaging. Whole meal buns on the other hand will be packed using a glassine paper. Salads will be packed inside a recyclable paper bowl covered with standard plastic cover and all fruit juice will be supplied to customers in a sealed recyclable bottle specially design by Berri for Red Rooster. All in all the packaging is to build awareness and support the usage of environmental friendly resources.
5.1.4 Labelling
In every package there will be a concise display of the nutritional facts of the food which is served at Red Rooster. This will be done in order to provide as much information to the customer of the balanced diet offered by Red Rooster as well as to build awareness to have a balanced diet.
5.1.5 Product Line Extensions
In extension towards the current offers, the healthy menu would include meals to cater for young children as well as health meals for senior citizens. In addition, more variety of flavour and recipe for chicken will be introduced in order to capture more market demand. A Side Dish Menu will be diversified to include yoghurt as dessert, as well some sandwiches.
5.2 Pricing
5.2.1 Market Based Pricing
The new Red Rooster health food menu will offer a wide range of individual purchases as well as meal packages for individuals, couples, groups and families. Most of the products offered here will come in 3 different sizes, which will provide a variety for customers to choose from.
The product will be schedule to launch in the May 28th .Looking at the price affordability for the given customer’s needs and the competitive offering by the competitors; the market based performance approach is adopted. The initial pricing strategy will be perceived value pricing. This was so, given the price for the products benefits in terms of its large portions of chicken, nutrition’s, superiority value as compared with its competitors and the amount of promotions due to be launch to strengthen the companies image. As the time progress, different strategies will be practice in accordance to the market demand and customers perceptions.
For details concerning the recommended price related to purchase of the new health menu refer to Appendix No.21. For details concerning the competitors´ prices of “substitute products” refer back to Appendices No. 15.
5.3 Place/Distribution
5.3.1 Channel of Distribution/ Sales Territories
Historically, the Kailis family opened the first Red Rooster store in the Perth suburb of Kelmscott in 1972. From this store, Red Rooster expanded its chain towards the east, and currently there are over 290 Red Rooster stores, with an extra 50 franchises across Australia. Under the new management, Australian Fast Foods, Red Rooster has intended to expand its stores further by 150. Such expansion in strategic locations provides a good foundation for Red Rooster to position its self in the health fast food market, thus distributing its products to health conscious consumers.
UTS: Marketing, Concepts & Applications (24746) Page 28.05.2004 26
Prepared for: Mr. Paul Vorbach
As our target customers are working young professionals and students, the suitable store location will be targeted in the city area, shopping malls and university areas. As such, Red Rooster will have to re-position what use to be the country style image with stand alone restaurants to modern and catching fast food restaurants in shopping malls.
The expansion programme will occur through 2 channels. Primary channels, Australian Fast Foods will have to locate most of its new stores in populated areas. Ideally, the new stores should target primary within Westfield shopping malls and properties (Information for Westfield shopping location: http://www.westfield.com/au). As such agreement of tenancy shall be drawn between the two parties.
The secondary channel is concerned with franchising (Appendix No. 23). Capital requirement should be lowered by approximately AU$100,000- $200,000 as the new target area will be a leasing of shop space in Westfield shopping malls, instead of purchase of land for a whole stand alone restaurant. In an attempt to attract more franchisees, initial loyalty fees and advertisement levy will be positioned at 4 % of the gross sales.
5.4 Promotion: Integrated Marketing Communication Mix
5.4.1 Advertising: Awareness Building
Our advertisement campaign is catered towards building brand and product awareness. Thus this forms Red Rooster’s three important advertising objectives; to inform customers of the new products development and sales promotions; to continuously persuade new buyers, as well as to encourage switching of brands from competitors customers; and to gain top- of mind product awareness.
The key message in the advertising campaign includes:
Have a balanced diet with Red Rooster We offers the best value for meals A pleasant place for spending time with friends and family.
Three main medium will be utilize in the advertising campaign; television commercials at Channel 10 and at Hoyts cinema advertisements, radio commercials and advertisements in magazines and newspapers such Good Weekend and Sunday Life, SMH, Sydney Magazine and the Sun Herald.
Nevertheless, a new restructured webpage will provide another medium for advertising as well. Further to this, occasional advertisement will be placed in city area signboards.
5.4.2 Sales Promotions
The sales promotion strategy used serve several purposes. Primarily the promotion was meant to entice consumers to purchase the health meals as a strategy to accelerate market penetration. Secondarily it was to hold loyal consumers and finally the overall intention was to lure consumers away from competitors’ products.
UTS: Marketing, Concepts & Applications (24746) Page 28.05.2004 27

Prepared for: Mr. Paul Vorbach
The initial promotion tactics adopted in satisfying the primary objectives were targeted at our main customers namely, students and health conscious professionals. As such, a discount of 10% will be given to any individuals who buy individual meals with either a health club membership card or a valid student card.
In the customer retention promotion a Red Rooster free meal card will be launched. The usage of this card is similar to what we understand as a coffee card. Every customer who purchases any individual meals will be given a stamp. In collection of 5 stamps, a free small quarter meal will be given free.
All these promotions will be strongly backed by the advertising strategy and medium adopted in this marketing plan.
5.4.3 Public Relations: Reference Group Experience
The product will also be pushed through the specialist reviews of magazines and life styles sections of Sydney’s major newspapers. These include Good Weekend and Sunday Life. Successful individuals who find Red Rooster products being advantageous in maintaining their healthy lifestyle will be interviewed and published in the news papers, magazines and foremost in the restaurant newsletter.
5.4.4 Direct and Online Marketing: Loyal Customers Contacting
The current webpage designed for Red Rooster was rather simplified, providing only the basic information in regards to the restaurant products. (http://www.redrooster.com.au/DefaultMain.htm). A design restructure will be carried out, bringing new ideas and an online marketing strategy to:
Build awareness of all the current available products as well as future promotions Provides information in regards to the products nutrition and facts for healthy lifestyles in
consuming Red Rooster products Build up the company image and culture To secure and reward loyal customers A medium to seek new ideas and constructive feedback
Thus, Red Rooster Discount Club members will be established through the webpage for many innovators and early adopters who seek to enjoy and try our products. Periodically, emails will be sent out to them to keep them informed of our recent developments in any form. In addition a feedback form concerning their recent experience in Red Rooster restaurant will be attached with the emails.
A discussion forum for members and non- members will be set up to enhance discussions between individuals, bringing together ideas and opinions of the health products. A discount card of 10% will also be issued to any new members. In addition a discount card of 20% will be issued to loyal members who have actively participated in the forum as well as given constructive feedback to Red Rooster.
The Web page will be updated to include all recent developments in products as well as news regarding new restaurant openings in the neighbourhood, restaurants of the month, new promotions and so on. Facts on nutrition of all products as well as information regarding healthy lifestyle practices will be provided
UTS: Marketing, Concepts & Applications (24746) Page 28.05.2004 28

Prepared for: Mr. Paul Vorbach
6. MARKETING BUDGET6.1 Forecast SalesAs identified in PEST analysis, consumers are more concerned with their health. The forecast market share of Red Rooster after launching new health-range products is expected to increase from 9% in 2004 to reach $1079 millions with 16% of market share in 2009 and remain stable thereafter, despite the fact that overall growth rate of fast food industry will grow constantly at 1.5% over the forecast period.
Sales forecast for Red Rooster 2004 - 2009Actual/Forecast Sales 2004 2005 2006 2007 2008 2009 NotesMarket potential (millions) $24,349 $24,853 $25,367 $25,891 $26,427 $26,974 1 Market demand - fast food industry (millions) $7,619 $7,877 $8,143 $8,417 $8,702 $8,995 2Year on year growth rate 53.30% 3.37% 3.37% 3.37% 3.37% 3.37%Market share - Red Rooster 9.00% 10.00% 10.50% 11.00% 11.50% 12.00%Total revenue - Red Rooster $724 $788 $855 $926 $1,001 $1,079
1. www.euromonitor.com2. Adapted from wwweuromonitor.com and www.theage.com.au/articles/2003/06/12/1055220711406.html
Business PerformanceRevenue for new health range products will doubly increases over the forecast period, from A$57.92 million reaching A$102.6 million within 2 years and then gradually rise to A$161.85 million in 2009. Because of the fact that consumers perceive that fast food is a non-healthy food, marketing expenses will be spent, in particular, for advertisements in the first two years, calculated by 35% of the previous year’s advertising budget (see Appendix No. 24). Consequently, net marketing contribution grows markedly to AU$79.32 million in 2009.
Business performance 2004-2009Business Performance 2004 2005 2006 2007 2008 2009 NotesTotal revenue - Red Rooster $724 $788 $855 $926 $1,001 $1,079 Market share - health-range products 8% 10.50% 12.00% 13.50% 15.00% 15%Total customers (millions) 10.95 11 11.06 11.12 11.17 11.22 1 Revenue per customer $5.29 $7.52 $9.28 $11.24 $13.44 $14.43 Revenue -health-range products(millions) $57.92 $82.74 $102.60 $125.01 $150.15 $161.85 Variable cost per customer $3.44 $4.89 $6.03 $7.31 $8.74 $9.38 2Total variable cost (millions) $37.66 $53.81 $66.65 $81.31 $97.65 $105.19 Margin per customer $1.85 $2.63 $3.25 $3.93 $4.70 $5.05 Total contribution (millions) $20.26 $28.93 $35.95 $43.70 $52.50 $56.66 Marketing expenses (millions) $2.70 $2.70 $2.00 $1.20 $1.20 $1.00 3 Net marketing contribution (millions) $17.56 $26.23 $33.95 $42.50 $51.30 $55.66
UTS: Marketing, Concepts & Applications (24746) Page 28.05.2004 29

Prepared for: Mr. Paul Vorbach
1. Assumed these figures based on the number of outlets of Red Rooster and market share2. Assumed cost based on pricing of Red Rooster's overall products3. Adapted from overall advertisement expenses in 2003
6.2 Sensitivity AnalysisThe major risk associated with the financial estimates are due to sales forecast risks. A sensitivity analysis for sales volume shows that a 20% variance in forecasted sales volumes would still result in a positive net contribution margin. The results of the sensitivity analysis are demonstrated below.
Sensitivity analysis and net marketing contribution
6.3 Break-Even Analysis
Break-even analysis based on 2004 costs and pricing per customer shows a break-even as demonstrated below. This corresponds to a payback period of about 6 months.
Break-even analysis
UTS: Marketing, Concepts & Applications (24746) Page 28.05.2004
Millions
Total cost
Net
mar
ketin
g co
ntrib
utio
n
30
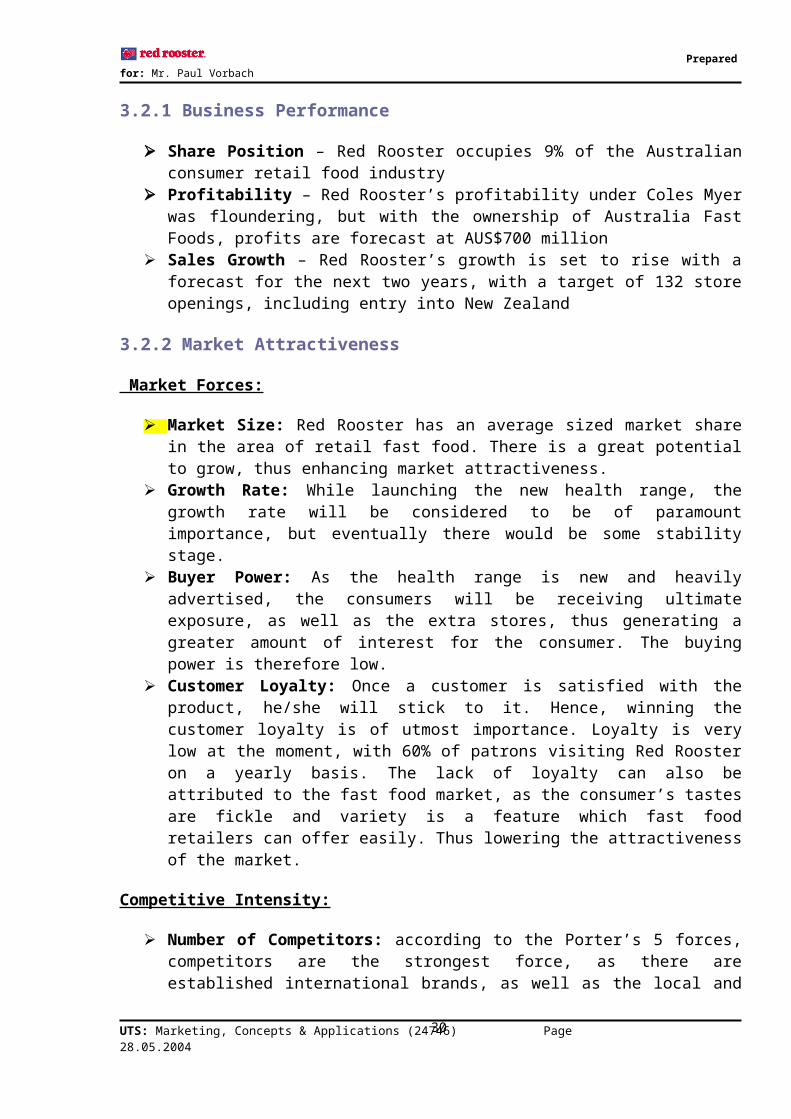
Prepared for: Mr. Paul Vorbach
7. IMPLEMENTATION & CONTROL GUIDELINES
7.1 Implementation Plan
The overall marketing project involves a systematic cycle which adopts the PDCA, cycle (Gray and Larson, 2003) or simply known as Plan, Do Check and Act. In meeting all crucial requirements, a proper implementation plan has to be carried out. This serves several important purposes in this project:
To ensure all critical activities are being carried out Provide an overview of the project Provide a basis for scheduling activities to ensure activities datelines are met. Understanding the relationships of activities. Ensure responsibility of management
Thus, the work breakdown structure and the scheduling plan for the Red Rooster marketing project is clearly shown in Appendix No. 25.
7.1.1 Implementation Milestones and Activities
7.1.2 Development of Goods and SevicesAs such this task involves several collaborations with several departments within the organisation in regards to the product bundling, additions to the menu, product packaging and so on. Setting up a specification for control of quality such as determining sizes and portion of each meals, method of preparation, determining the equipment needed and determinig approximate service time and code of practice and so on.
7.1.3 Employees Development and Reward sEmployees and Franchisees will receive training in all aspects of the new product begining from the order process to receival, storage, preparation methods and servicing to customers at the head office training centers. In addition practical training and assessment will be carried out in selected restaurants in assurance of quality services. A premium rewarding system shall also be developed to reward not only loyal but contributing employees.
7.1.4 Development of Sales Distribution ChannelsFuture developments of restaurants location will emphasise mostly in Westfield shopping malls, city areas, and locations close to schools and universities. Thus, the Development and Franchise Departments bear the responsibility in negotiations and spotting these strategic locations.
7.1.5 Development of Systematic Supply ProcessReviewing the order process provides the basis of improving the current system in providing supplies for the restaurants. Negotiation by the Head office with Berri has to carry out in provision of the new health drinks. Such then, a supply appropriate system is crucial that raw material is sufficiently provided to all restaurants.
7.1.6 Development of Price StrategyDepartments involved bear the responsibility to establish and continuously review the pricing strategy for the new products and subsequent new products introduced. This involves cost analysis and break even analysis for the new products.
UTS: Marketing, Concepts & Applications (24746) Page 28.05.2004 31

Prepared for: Mr. Paul Vorbach
7.1.7 Development of Promotional CampaignTask involves redesign and updates on web pages, design of relevant membership card, establishing advertising activities with television, radio and associated printing media. Such then, the Department involved needs to deal with public relationships in order to create a good company image.
7.2 Performance Monitoring
7.2.1 Process Market MetricsThe management tasks of planing and organisation cannot be effective without precise measurements and controls. Red Rooster utilizes its performance matrix as a standard in
Tracking the market-based performance; Measuring the marketing profit by products; and Organise its products around market demands.
Therefore, the company will use the following metrics to calculate and analyse the performance of the market as to provide indicators to ensure our marketing program is carried out efficiently and effectively and the level of customer satisfaction is assured;
Customer awareness,Product preference;Customer interest and intent;Customer satisfaction;Perceptions of product and service quality; Perceptions of customer value;Market shareFinancial performance
This information will be acquired through market surveys, post-sales surveys of customers, feed back information from the web and complaints. Variances against these targets will be monitored, analysed and provided back to the Marketing Department as part of the ongoing product management process.
7.2.2 End-Result Market and Financial MetricsIn addition to the process metrics above, the following end-result metrics will be regularly monitored against planned targets,
Market share Demand; Product price; Variable cost; Volume; Marketing expenses; Margin and, Net marketing contribution.
Variances against these targets will be monitored and provided to the Marketing Department as part of the ongoing product management process.
UTS: Marketing, Concepts & Applications (24746) Page 28.05.2004 32
Prepared for: Mr. Paul Vorbach
8. REFERENCES
ABS – Australian Bureau of Statistics (2004),Australian Social Trends, Health Related Actions: Food and energy intake, 1998.Census, 2001.Household Expenditure Survey, Australia, 2000.How Australians Use Their Time, 1998.National Health Survey, 2001.National Nutrition Survey: Nutrient Intakes and Physical Measurements Australia, 1998.Population by Age and Sex, Australian States and Territories, 2003.
Communications and Information Technology, 2003 Household use of information technology, 2003
ACNielsen (2003), All Media Competitive Expenditure Estimates, Sep. 3, 2003.
Asian Food Information Centre (AFIC), (2003) “What should you know about food borne illness” http://www.afic.org/What%20you%20should%20know%20about%20Foodborne%20Illness.htm accessed 4 May 2004
Axis Australia, (2004) “Australian’s attractions” http://www.axiss.com.au/content/attractions/ accessed 6 May 2004
Bis Shrapnel (2003), Bis Shrapnel Foodservice Report – Trends in Foodservice and Eating Out, May/June 2003, http://www.c-store.com.au/articles/bis-eatingoutrends.html, accessed: 25/03/2004.
Dodd, T., (2004), “On course for the master’s”, The Australian Financial Review, 19 Apr., p.32-34
Elliot, G., 2003, The couch economy, The Australian, 02 Jan 2003, p. 27-30.
Euromonitor (2003), Consumer Foodservice in Australia, 2003, http://www.euromonitor.com/Consumer_Foodservice_in_Australia, accessed: 25/03/2004.
“Fast Foods plucks Red Rooster”, Sydney Morning Herald, June 1, 2002www.news.com.au/common/story_page accessed 20 April 2004
Foreign Agricultural Service/USDA (2000), Australia Hotel, Restaurant, Institutional Food Service Sector Report 2000, Global Agricultural Information Network Report #AS0012, Mar 12, 2000.
Gudergan, S. P. (2001), Contemporary Marketing Management, Pearson Custom Publishing, Sydney, 2001.
Hungry Jack’s (2004), Hungry Jack’s Website, http://www.hungryjacks.com.au/AboutSchool.aspx, accessed: 25/03/2004.
“Hungry Jack in talks to buy Burger King”, Sydney Morning Herald, April 11, 2002, http://www.smh.com.au/articles/2002/04/10/1018333373150.html, accessed: 25/03/2004.
McDonald’s (2004), McDonald’s Website, http://www.mcdonalds.com.au, accessed: 01/04/2004.
Porter, M.E. (1995). Competitive Strategy: Techniques For Analyzing Industries And Competitors, New York: Free Press; London: Collier Macmillan.
UTS: Marketing, Concepts & Applications (24746) Page 28.05.2004 33
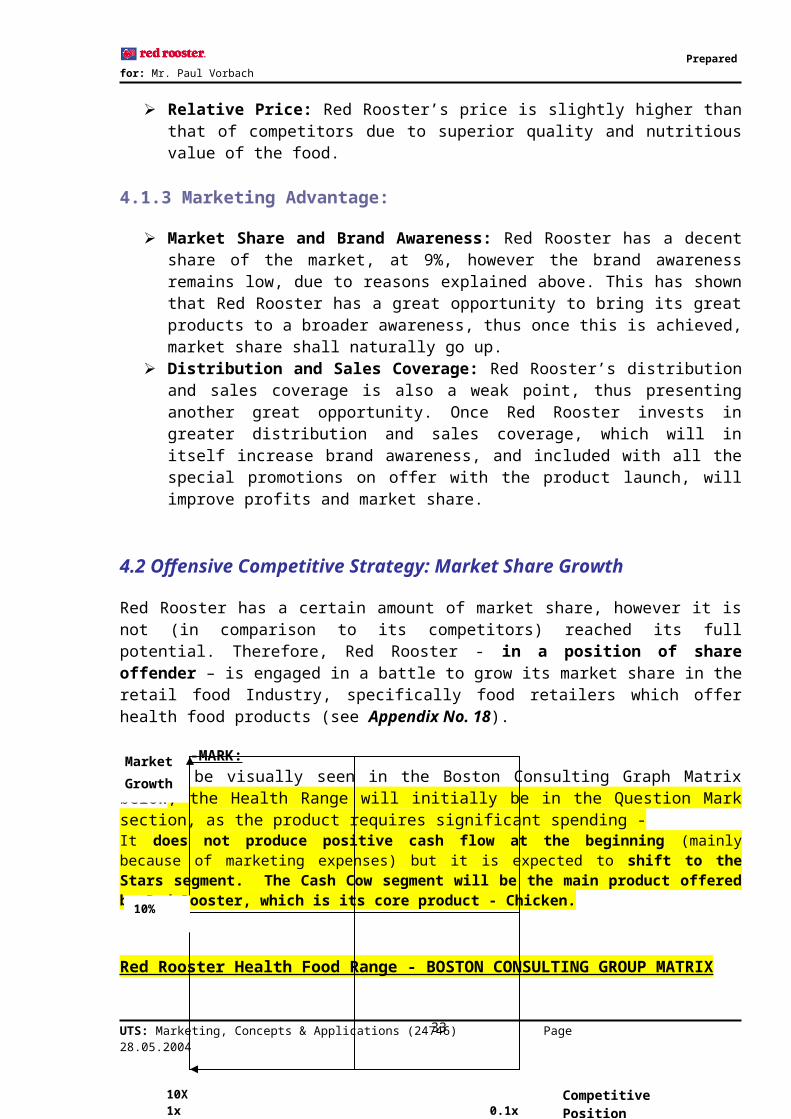
Prepared for: Mr. Paul Vorbach
Red Rooster (2004), Red Rooster Website, http://www.redrooster.com.au, accessed: 05/05/2004.
Reid, M. (2001), Food marketing in the 21st Century: building the consumer–marketer connection, Nature & Society Forum, www.natsoc.org.au/html/papers/reid.pdf, accessed: 05/05/2004.
Robinson, N. (2004), “Can junk food be healthy?”, The Australian, April 24, 2004 http://www.theaustralian.news.com.au/common/story_page/0,5744,9366932%255E23289,00.html, accessed: 14/05/2004.
Roy Morgan (2003), QSR Marketing and Advertising Planning (MAP): April 2002 – March 2003.
Subway (2003), Subway Website, http://www.subway.com.au, accessed: 13/05/2004.
Urquhart, B. (2004) Red Rooster/Chicken Treat – “Hot Stuff”, April 2004, Marketing Focus, Perth, ww.marketingfocus.net.au/Red%2520RoosterChicken%2520Treat%2520Hot%2520Stuff.html+chicken+suppliers&hl=en, accessed: 10/05/2004.
Williams, R. (2003), “Red Rooster ready to fly east and ruffle some feathers” – The Age, June 13 2003,http://www.theage.com.au/articles/2003/06/12/1055220711406.html, accessed: 20/03/2004.
World competitiveness yearbook,Economic performance, 2004Government efficiency, 2004Business efficiency, 2004
http://www01.imd.ch/wcy/factors/ accessed 15 May 2004
UTS: Marketing, Concepts & Applications (24746) Page 28.05.2004 34
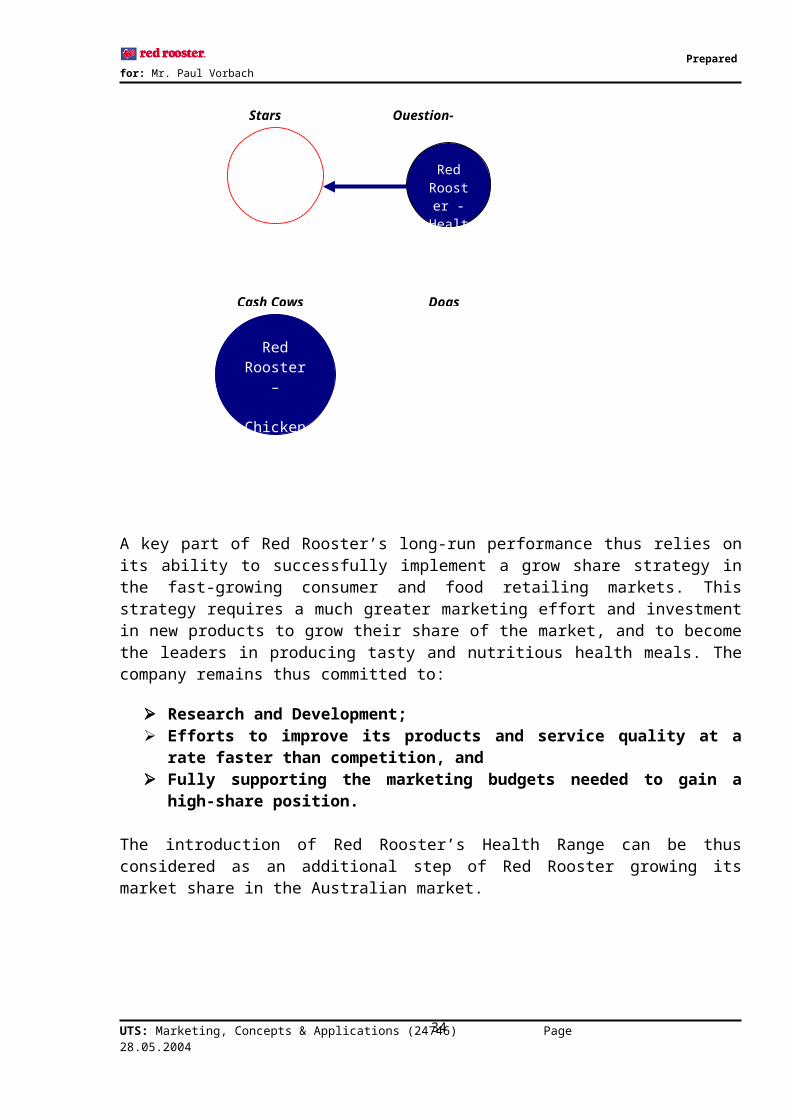
Prepared for: Mr. Paul Vorbach
9. APPENDICES
Appendix No. 1: Roy Morgan QSR Marketing and Advertising Planning : April 2002 – March 2003
The research summarized below is secondary research obtained from Roy Morgan Research, one of Australia’s best known and longest established market research companies. Roy Morgan Research interviews over 1,000 people (aged 14+) throughout Australia (both metro and country areas) every weekend. Research is obtained by both face-to-face interviewing and a self-completion survey.
Fast Food Outlets: KFC, Red Rooster, Nandos, McDonald's, Hungry Jack's, Burger King, Pizza Hut, Pizza Haven, Dominos, Eagle Boys Pizza, SubwayThe sample size for this survey is 12,715 people.
Profile / SegmentREGIONCapital Cities 63.70% (Read as "63.7% of all people who have visited or
purchased from the above fast food outlets in the last 4 weeks live in capital cities”).
Country Areas 36.30%STATESN.S.W. 35.00%Victoria 24.50%Queensland 19.50%South Australia 7.90%Western Australia 10.30%Tasmania 2.20%Darwin - Alice Springs 0.70%SEXMen 48.90%Women 51.10%AGE - summary14-17 7.30%18-24 15.80%TOTAL 14-24 23.10%25-34 22.80%35-49 30.80%TOTAL 50 and Over 23.30%50-64 17.80%65 and Over 5.40%TOTAL 18 and Over 92.70%EDUCATION LEVEL - summaryPrimary School 1.10%Some Secondary/Tech. 16.50%Intermediate/Form 4/Year 10 14.40%5th form/Leaving/Year 11 7.00%Finished Tech./HSC/Year 12 19.80%Some/ Now at University 12.70%Have Diploma or Degree 28.50%WORK STATUS OF RESPONDENT
UTS: Marketing, Concepts & Applications (24746) Page 28.05.2004 35

Prepared for: Mr. Paul Vorbach
Full Time 43.80%Part Time 20.40%TOTAL Now Employed 64.20%Home Duties 10.30%Don't Work 2.60%Looking for Full Time work 2.80%Looking for Part Time Work 2.10%Retired 8.70%Students 9.30%TOTAL Not Employed 35.80%OCCUPATION OF RESPONDENT (All Workers) - summaryProfessional/Manager 16.30%White Collar Workers 24.60%Skilled Workers 8.50%Farm Owner 0.50%Others (incl. Semi/Unskilled) 14.40%Full Time Workers 43.80%Part Time Workers 20.40%TOTAL Not Employed 35.80%TOTAL 100.00%CURRENT LIVING ARRANGEMENTSLive Alone 5.20%Partner And No Children 20.30%Partner And Children 41.90%Single Parent 5.10%With Parents 17.10%Boarder 1.00%Shared Household 9.10%Other 0.50%ROY MORGAN VALUES SEGMENTS (Developed in conjunction with Colin Benjamin of The Horizons Network)Basic Needs 1.20%Fairer Deal 5.00%Traditional Family Life 12.10%Conventional Family Life 10.10%'Look At Me' 12.90%Something Better 9.00%Real Conservatism 4.30%Young Optimism 10.80%Visible Achievement 20.20%Socially Aware 14.30%SOCIO-ECONOMIC SCALEAB Quintile 21.70%C Quintile 21.60%D Quintile 21.40%E Quintile 19.30%FG Quintile 16.10%
UTS: Marketing, Concepts & Applications (24746) Page 28.05.2004 36
Prepared for: Mr. Paul Vorbach
HOUSEHOLD LIFE-CYCLEYoung Singles 12.40%Young Couples 8.30%Young Parents 31.40%Mid-Life Families 14.50%Mid-Life Households 27.10%Older Households 6.40%BODY MASS INDEX (respondents 18+)Respondents 18+ 92.70%Underweight 2.60%Acceptable weight 37.60%Overweight 33.80%Obese 23.00%Not classified 3.00%
Source: Roy Morgan Research Pty. Ltd., Melbourne, Australia
FAST FOOD PLACES EATEN AT/TAKEN AWAY FROM IN LAST 4 WEEKS (using the same sample as above).
Outlet Number who have visited outlet in the last 4 weeks
Number who have visited outlet in the last 4 weeks (%)
Total percentage
K.F.C. 5,759 45.30% (Read as "Of all the people who have been to the above fast food outlets, 45.3% have eaten at/taken away from KFC in the last 4 weeks”).
20%
Red Rooster 2,466 19.40% 9%Nandos 317 2.50% 1%McDonald's 7,870 61.90% 28%Hungry Jack's 3,293 25.90% 12%Burger King 966 7.60% 3%Pizza Hut 2,263 17.80% 8%Pizza Haven 686 5.40% 2%Dominos 1,830 14.40% 6%Eagle Boys Pizza
699 5.50% 3%
Subway 2,390 18.80% 8%TOTAL 28,539 100%
Source: Roy Morgan Research Pty. Ltd., Melbourne, Australia
Note: Out of a sample of 12,715 people, there were 28,539 visits made to the outlets listed above. This is an average of 2.24 visits per person.
UTS: Marketing, Concepts & Applications (24746) Page 28.05.2004 37

Prepared for: Mr. Paul Vorbach
Appendix No. 2: Average Weekly Household Expenditure on Food and Non-alcoholic Beverage
0 5 10 15 20 25 30 35 40
Egg and egg products
Edible oils and fat
Fish and seafood
Fruit
Vegetables
dairy producs
non-alcoholic beverages
confectionery, condiments, prepared meals
bakery products, flours and cereals
meat (excluding fish and seafood)
meals out and fast foods
($)
Source: ABS, 2000, Household Expenditure Survey, Australia.
Evolution in Average Weekly Household Expenditure in Fast Food and Take Away 1994 – 2009: (Forecast 2004-2009):
0
20
40
60
80
100
120
140
160
180
1994 1999 2004 2009
($)
Expenditure on Fast Food Total Expenditure on Food
Source: ABS, 2000, Household Expenditure Survey, Australia.The growth on Fast Food expenditure (14% in 5 years, in average) is a business opportunity for Red Rooster.
UTS: Marketing, Concepts & Applications (24746) Page 28.05.2004 38
Prepared for: Mr. Paul Vorbach
Appendix No. 3: Australian - Market Lifestyle Factors
When researching on Psychographic aspects, we focus on attitudes, values, activities and interests of our potential customers. In this section, we analyse secondary data on how Australians spend their time, the average time expenditure on free time activities and their attitudes towards a healthier lifestyle.
How Australians spend their timeMen and women spend their day in different ways. On an average day in 1997, men spent 20% of their day on recreation and leisure, 18% in employment related activities and 7% on domestic work, while women spent 18% of their day on recreation and leisure, 13% on domestic work, 9% on employment related and 3% on child care.
Necessary timeIn 1997, Australians spent an average of 46% of their time on necessary time activities (ABS, 1998). Necessary time is the time devoted to personal care activities such as sleeping, eating and personal hygiene. There was an increase of 28 minutes per day in the amount of time spent eating and drinking between 1992 and 1997. Those who spent time eating and drinking in commercial venues spent an average 66 minutes per day in these locations and couples with dependent children were most likely to spend time eating in these locations (see table below). Household Purchasing Meals and Time spent in commercial venues:
Life Stage Restaurant (%)
Takeaway (%) Total (‘000)
Time spent eating and drinking in commercial venues (min/d)
No. of people eating and drinking in commercial venues (‘000)
Couples with dependent children (a)
53.7 75.8 1612.2 67 2,406.9
Couples with non-dependent children
62.6 65.5 751.2 76 447.2
Lone parents 46.8 63.9 631.6 55 387.2
Couples without children 50.8 43.4 1650.2 73 1,959.1
Lone people 48.4 39.9 1652.2 71 942.3
Other 62.3 70.8 636.3 64 1487.1
Total 52.9 56.9 6933.7 66 7629.7
(a) Couples with dependent children include households containing both children aged 0-14 and unmarried children aged 15 and over.
Source: ABS, 1998, How Australians Use Their Time.
Free TimeAccording to ABS (1998), in 1997, Australians aged 15 and over spent an average 22% of their
UTS: Marketing, Concepts & Applications (24746) Page 28.05.2004 39

Prepared for: Mr. Paul Vorbach
time (about 5 hours per day) on free time activities (ABS, 1998). The most common free-time leisure activities and the average number of minutes spent on each per day are:
Audio/visual media: 130 minutes Talking (including phone): 35 minutes Sport and outdoor activities: 27 minutes Reading: 25 minutes Games, hobbies, arts: 17 minutes Other free time activities: 38 minutes
Average weekly household expenditure on Recreation:
0 2 4 6 8 10 12 14 16 18
Home computer equipment
Blank and pre-recorded media
Sports fees and charges
Cultural fees and charges
Animal expenses
Gambling
Audiovisual equipment
Books, newspapers, magazines
Other recreational and educational equipment
Holidays - Overseas
Holidays - Australia
($)
Source: ABS, 2000, Household Expenditure Survey, Australia.
Household spending on recreation averaged $89 per week. Expenditure on holidays accounted for 31% of spending on recreation. Compared to the period of 1993-94, the there was a significant increase in expenditure on sports lessons (up 107%) and culture and recreation lessons (up 55%). This reflects the trend towards a healthier lifestyle and represents a business opportunity for Red Rooster to position itself within the entertainment / healthy market.
Exercise for recreation, sport or fitness
The 2001 National Health Survey collected information on a number of lifestyle behaviours and related characteristics which have been established as risks to health. Among the risk factors are exercise, being overweight and some dietary habits. Compared to previous years, Australian adults are improving against the risk factors, but the proportion of adults who are overweight continues to increase.
Exercise
UTS: Marketing, Concepts & Applications (24746) Page 28.05.2004 40

Prepared for: Mr. Paul Vorbach
In 2001, 70% of adults used to exercise for recreation, sport or fitness (walking, moderate and vigorous exercise). Females were more likely to walk for exercise than males, while males were more likely to undertake moderate and vigorous exercise than females.
Types of exercises practiced by Australian adults in 2001:
50%
40%
20%
58%
33%
11%
Walking Moderate Exercise Vigorous exercise
Men Women
Source: ABS, 2001, National Health Survey.
In terms of exercise level and the frequency and duration of exercise, the majority of both males and females were classified to sedentary (including no exercise) and low exercise levels. Males aged 18-24 years being most likely to be classified to this high exercise level (21%).
Level and frequency of exercises practiced by Australian adults in 2001:
65%
9%4%
74%
Sedentary/low level High level
Men
Women
Source: ABS, 2001, National Health Survey.
UTS: Marketing, Concepts & Applications (24746) Page 28.05.2004 41

Prepared for: Mr. Paul Vorbach
More people are exercising in 2001 than in 1995 and 1990, although differences are small. For example, the proportion of people exercising at low levels increased from 33% in 1990 to 38% in 2001 while those recording a sedentary exercise level fell from 37% in 1990 to 32% in 2001. Proportions exercising at moderate to high levels showed little change (at around 30%).
Increase of exercise practice by Australian adults 1990-2001:
30%33%
37%
30%32%
38%
Sedentary Low level Moderate/high level
1990 2001
Source: ABS, 2001, National Health Survey.
Dietary Habits of Australians
Over the last 20 years there have been improvements in Australians' diets. Even so, the diet of many Australians is far from ideal, as indicated by the high proportion of people overweight or obese and the high incidence of related diseases. Despite an abundant supply of information on what constitutes a healthy diet, in 1995, 57% of all adults were overweight or obese (ABS, 1998). The over consumption of food, coupled with an inactive lifestyle, causes overweight or obesity. This in turn increases a person's chance of developing diseases such as cardiovascular disease, some cancers and diabetes.
There have been changes in the quantities and types of foods consumed by Australians. The consumption of meat products (a main source of saturated fat) has reduced while the consumption of chicken and seafood, which are generally lower in saturated fats, has increased. The consumption of fruit and fruit products, vegetables, and grain products has increased. In addition, the amount of alcohol consumed has declined.
UTS: Marketing, Concepts & Applications (24746) Page 28.05.2004 42
Prepared for: Mr. Paul Vorbach
Daily food intake as a percentage of total food intake for Australians over 18 – 1995:
0% 5% 10% 15% 20% 25% 30%
Others*
Snack foods andsugar products
Fruit
Meat, poultry andgame
Vegetables andlegumes
Milk products
Cereals and cerealproducts
Men Women
*Others include seafood and fish, egg products, fats and oils, sauces and condiments, and miscellaneous foods.Source: ABS, 1998, Australian Social Trends, Health Related Actions: Food and energy intake.
Fat intake and weight
Fat provides the most concentrated source of energy in the human diet, which also contributes to the palatability of foods. High intakes of fat, particularly saturated fat, are associated with elevated levels of cholesterol, obesity and increased mortality from cardiovascular disease in populations where the level of physical activity is low. According to ABS (1998), adults consume more energy, fat, cholesterol and alcohol on the weekend than on weekdays. Besides, on weekdays, intake of vitamins and minerals was generally higher than or similar to that on the weekend.
In 1995 food and beverages purchased and consumed away from home had a higher fat content than those consumed at home. Women were less likely than men to purchase and consume food and beverages away from home (57% compared to 64%). However, when they did, this food on average had a higher fat content than food purchased by men (36% compared to 34%). This difference may be partly explained by men's more frequent and higher consumption of alcoholic beverages which contribute to energy intake but not fat to the diet. Consequently, food purchased and consumed away from home contributed a smaller proportion of total energy for women (22%) than men (26%).
Women were generally more concerned about their body weight and diet. Women were more likely than men to be on a weight-reduction or fat-modified diet (24% compared to 16%). Also,
UTS: Marketing, Concepts & Applications (24746) Page 28.05.2004 43

Prepared for: Mr. Paul Vorbach
of those who consider themselves to be within an acceptable weight range, women were seven times more likely than men to be underweight (21% compared to 3%) and men were nearly three times more likely than women to be overweight or obese (38% compared to 14%).
Overweight and Obesity
On average, males‘weight is higher for males than females in all other age groups. Average weight is greatest in men and women aged 45-64 years, in contrast with the peak in height for 16-24 year olds. This ongoing weight gain, after maximum height is reached, is possibly due to factors such as exercise and diet.
Source: ABS, 1998, National Nutrition Survey: Nutrient Intakes and Physical Measurements Australia.
The ABS National Nutrition Survey (1998) concluded that over 85% of children aged 2-8 years had a normal weight for height. A very small proportion of children of this age had low weight for height (thinness), and approximately 5% had a high weight for height (overweight). The majority of people aged 9-18 years had a normal weight for age (approximately 75%). A small proportion of 9-18 year olds were underweight, and about 23% were overweight or at risk of overweight.
The ABS National Health Survey (2001) concluded that the proportions of adults classified as overweight or obese has increased significantly. For both males and females, increases were recorded in both the overweight and obese groups, and were recorded across all age groups.
UTS: Marketing, Concepts & Applications (24746) Page 28.05.2004 44

Prepared for: Mr. Paul Vorbach
Proportion of adults classified as overweight or obese in Australia (1990-2001):
32%37%
42%46%
52%58%
1990 1995 2001
Women Men
Source: ABS, 2001, National Health Survey.
For both males and females the proportion classified as overweight or obese was highest in the age groups from 45-74 years. At every age, men were more likely than women to be overweight or obese. Overall, 45% of men and 29% of women were considered to be overweight with a further 18% of both men and women being classified as obese. For people aged 45 years and over, only about 25% of men and 35% of women were within an acceptable weight range for their height. Among females aged 18-24 years 13% were classified as being underweight.
Source: ABS, 1998, National Nutrition Survey: Nutrient Intakes and Physical Measurements Australia.
UTS: Marketing, Concepts & Applications (24746) Page 28.05.2004 45

Prepared for: Mr. Paul Vorbach
Appendix No. 4: Australian - Geographic Factors In area, Australia is the sixth largest nation after Russia, Canada, China, the USA and Brazil. Its population, however, is relatively small (now estimated at just over 19.5 million). The profile for Red Rooster’s potential customers consists of the following geographic factors:
Land Area and Population by States and Territories
State/Territory Area in km2 Population (in m)
Population (in %) Capital
New South Wales 800 642 6.7 m 34 Sydney (4.2 m)Victoria 227 416 4.9 m 25 Melbourne (3.5 m)Queensland 1 730 648 3.8 m 19 Brisbane (1.7 m)Western Australia 2 529 875 1.9 m 10 Perth (1.4 m)South Australia 983 482 1.5 m 7.5 Adelaide (1.1 m)Tasmania 68 401 0.5 m 2.5 Hobart (0.2 m)Northern Territory 1 349 129 0.2 m 1 Darwin (0.1 m)Australian Capital Territory 2 431 0.3 m 1 Canberra (0.3 m)
Australia - TOTAL 7 692 024 19.8 m 100
Source: ABS, September, 2003
Australia’s Population Density
90% of Australia’s total population are contained within just 2.2% of the continent.
in average : 2,5 people per km2
Sydney : 8.400 people per km2
Waverley : 6.900 people per km2
North Sydney : 5.700 people per km2
St.Kilda/Melbourne : 5.500 people per km2
The immediate geographic areas for our marketing focus are the capital cities of the
following states:
NSW (Sydney) VIC (Melbourne) QLD (Brisbane) WA (Perth) and SA (Adelaide)
with a population of 11.9 million people (approximately 61% of total population).
UTS: Marketing, Concepts & Applications (24746) Page 28.05.2004 46

Prepared for: Mr. Paul Vorbach
Appendix No. 5: Australian - Demographic Factors
The following information will help us – together with the outputs from our primary market research – clearly and accurately define a profile of our target group in terms of the following criteria: sex, age, income, marital status, qualification, and occupation .
Australia’s Adult Population Age Structure (Source: ABS, 2003)
Total Number of Men: Total Number of Women: 5.489.250 (28.1%) 5.508.750 (28.3%)
UTS: Marketing, Concepts & Applications (24746) Page 28.05.2004 47
Prepared for: Mr. Paul Vorbach
Households and Families:
As the new RED ROOSTER’S healthy range is a “lone person household type” of product, the following information is critical in determining our market potential and the target group.
(Source: ABS, Census 2001)
Of the 7,072,202 households counted in 2001, with average size of 2.6 people,
68.8% = family households, (1.8% decrease from 1996); 22.9% = lone person households (0.8% increase from 1996); 3.7% = group households (0.4% decrease from 1996).
Of all the 4,936,828 families counted in 2001 in Australia:
47.0% = couples with children (0.4% decrease from 1996); 35.7% = couples without children (1.6% increase from 1996); 15.4% = lone parent families (0.9% increase from 1996).
According to the report, there has been an increase in the number of people living alone, decline in fertility rate and delay of marriage.
Living alone
In 2001, men under the age of 50 years were more likely to live alone (6.0%) than women (3.9%), but after the age of 50, women were more likely to live alone (23.3%) than men (13.7%);
While the number of younger people (aged 20-29 years) living alone has almost doubled in the past 30 years -from 4.7% in 1971 to 7.1 in 2001, the majority still live in family households (71.2% in 2001, compared to 88.2% in 1971). This is part of a wider trend, with the proportion of people living alone increasing in each of the five year age groups, from 20-25 years to 60-64 years, since 1971.
UTS: Marketing, Concepts & Applications (24746) Page 28.05.2004 48
Prepared for: Mr. Paul Vorbach
Appendix No. 6: Primary Research – Research Brief and Sample Questionnaire
Market Research Brief – Red Rooster
Primary Qualitative Marketing Research
Aim of the research is to find out:
Who are our potential customers (buyers/influencers, etc.) what are their characteristics (demographic, psychographic) If our potential customers do seek the benefits we offer and WHY? If not, can we force/educate/motivate them to aspire after them? What would be the reaction of the customers to the launch of a healthier alternative? what are the motivators of our potential customers to choose Red Rooster as a fast
food option; What is the customer’s perceived value of Red Rooster as opposed to competitors in
terms of price and product.
Target groups Australian general public – primarily focused on age group between 16-55
Methodology - Survey face to face interview (open and closed-end questions in questionnaires)
Scope of the research 100 questionnaires
Location – Sydney Red Rooster outlets Westfield Shopping Centres University of Technology, Sydney Campus
1 phase To address the general public (questionnaires)
UTS: Marketing, Concepts & Applications (24746) Page 28.05.2004 49

Prepared for: Mr. Paul Vorbach
QUESTIONNAIRE :
Hello, we welcome you to join us in our primary collection of data regarding fast food in Australia, with a focus on Red Rooster. Our aim is to discover your reaction to the possible implementation of a health food menu within Red Rooster and your perceived value of Red Rooster. All information received is highly confidential. This survey will take up to a maximum of 10 minutes.
Section A
Sex identification male female
How old are you? <19 20-55 55<
What is your occupation?..........................................................................
What is your marital status? single engaged married widowed
Do you have children? yes no
Could you name three of your favourite hobbies/pastimes? .................................................................
.........
..........................................................................
..........................................................................
Section B
What word would you use to describe fast food?
convenient fattening tasty indulgement
Have you eaten Red Rooster in the past? YES NO
If not, why? (Skip to Section C) ..........................................................................
If your answer is YES, have you eaten Red Rooster in the last:
UTS: Marketing, Concepts & Applications (24746) Page 28.05.2004 50

Prepared for: Mr. Paul Vorbach
day week month year never
How frequent have your visits been to Red Rooster?
never or less than Irregular, but less Between 1-2 times Between 3-5 times once a month than 1-2 times a per week per week
week
Over 5 times per week
What time of day did you visit Red Rooster?
morning mid morning afternoon evening late evening
Did you visit Red Rooster during the?
weekday weekend
With whom did you visit Red Rooster?
No one Spouse Spouse and children children only friends/relatives
How do you classify the quality of Red Rooster:
Excellent Very Good Good Fair Poor
The pricing of Red Rooster products is?
Very expensive Expensive Moderate Cheap Very cheap
Which item do you regularly buy? (Chips and Drink are included in Meal)
Meal Alone
BBQ Chicken
Quarter Chicken
Half Chicken
Tropical
Crispy Fillet Burger
Strip Sub
Flayva
Fresh Sub 97
Chicken Roll
UTS: Marketing, Concepts & Applications (24746) Page 28.05.2004 51

Prepared for: Mr. Paul Vorbach
Why do you choose Red Rooster and rate each alternative (1-5).
Excellent Very Good Fair Poor Nutrition 1 2 3 4 5 Price 1 2 3 4 5 Taste 1 2 3 4 5 Convenience 1 2 3 4 5 Location 1 2 3 4 5 Other ..........................................................................
Do you prefer to eat Red Rooster in?
Shopping Centre Stand alone restaurant Take home In car
Would you be interested in health food range offered by Red Rooster?
Definitely buy Probably buy Not certain Probably not buy Definitely not buy
Which health food product would you be interested in, rate 1-5 ?
Def. Buy Prob. Buy Not Certain Prob. Not buy Def. Not buy Fresh Salad Variety 1 2 3 4 5 Wholemeal Buns 1 2 3 4 5 Grilled Chicken 1 2 3 4 5 Fruit Juice Variety 1 2 3 4 5 Other................................... 1 2 3 4 5
Do you have any suggestions to improve Red Rooster? .............................................................................................................................................................................................................................................................................................................................................................................................................................................................................................................................................................................................
Section C
For purpose of the survey we will restrict Red Rooster competition to McDonalds, KFC, Hungry Jack’s, Subway, Pizza Hut, Dominos and Oporto.
Please rank these in order of popularity from 1 to 8 (1 being the most popular)KFC _____Red Rooster _____Hungry Jacks _____Subway _____Pizza Hut _____Domino’s _____McDonald’s _____Oporto _____
What do you believe is the most popular fast-food chain in Australia?
..............................................................................
UTS: Marketing, Concepts & Applications (24746) Page 28.05.2004 52

Prepared for: Mr. Paul Vorbach
What are the last 3 fast food stores/outlets have you visited?1.............................................................................2. ...........................................................................3. ...........................................................................
How often do you buy the following fast-food, rate scale 1-5?1 never or less than 2 Irregular, but less 3 Between 1-2 times 4 Between 3-5 times once a month than 1-2 times a per week per week
week 5 Over 5 times per week
Red Rooster 1 2 3 4 5 KFC 1 2 3 4 5 Hungry Jacks 1 2 3 4 5 Subway 1 2 3 4 5 Pizza Hut 1 2 3 4 5 Domino’s 1 2 3 4 5 McDonalds 1 2 3 4 5 Oporto 1 2 3 4 5
What word would you use to describe the following fast food restaurants? (For example, expensive, tasty)KFC .............................................................................Red Rooster .............................................................................Hungry Jacks .............................................................................Subway.............................................................................Pizza Hut .............................................................................Domino’s .............................................................................McDonalds ............................................................................. Oporto .............................................................................
UTS: Marketing, Concepts & Applications (24746) Page 28.05.2004 53

Prepared for: Mr. Paul Vorbach
Appendix No. 7: Primary Research – Summary of results
PRIMARY RESEARCH FINDINGSMARKETING MIX USAGE
PRODUCT PROMOTION PRICE PLACEDemographic Characteristics :54% of the surveys respondents were men and 46% were women Targeted both
Men and Women
55% of our interviewees were Australian residents and 45% were non-residents
X
88% of all interviewees are in the age group between 18-34 years old
Target between age group 18-
34
50% of the respondents were students followed by 35% of professionals.
Target middle Income groups.
Used rapid skimming price
strategy followed by
High-value strategy
84% of the surveys respondents were single people and 87% have no children
Target single people/ no
parental young family
Psychographic Characteristics:The most cited hobbies of the respondents were reading, movies and shopping.
Target entertaining occasions.
32.5% of the interviewees would definitely buy and 36.5% would probably buy a new healthy range launched by Red Rooster Product Usage
Healthier diet habit mindset
XGrilled Chicken and fresh salad variety were the items more likely to be purchased in a new Red Rooster healthy range
Product Features / Benefits
Healthier diet habit mindset
63% of the respondents eat fast food because of the convenience
Improve availability/
market accessUsage behaviour:54% of the interviewees have already eaten at Red Rooster and 46% have never tried Red Rooster before
Improve awareness/
market penetration
60% of those who have eaten at Red Roster before have gone in the last year or more than one year ago.
Improve retention– non-loyal customers
and intensify brand exposure
43% of the surveys respondents used to eat at Red Rooster with friends/relatives and 32% alone
Product Usage Target Friends/ individuals.
58% of the interviewees used to eat at Red Rooster during the afternoons and 63% on weekends
Target entertainment - lunch among
UTS: Marketing, Concepts & Applications (24746) Page 28.05.2004 54
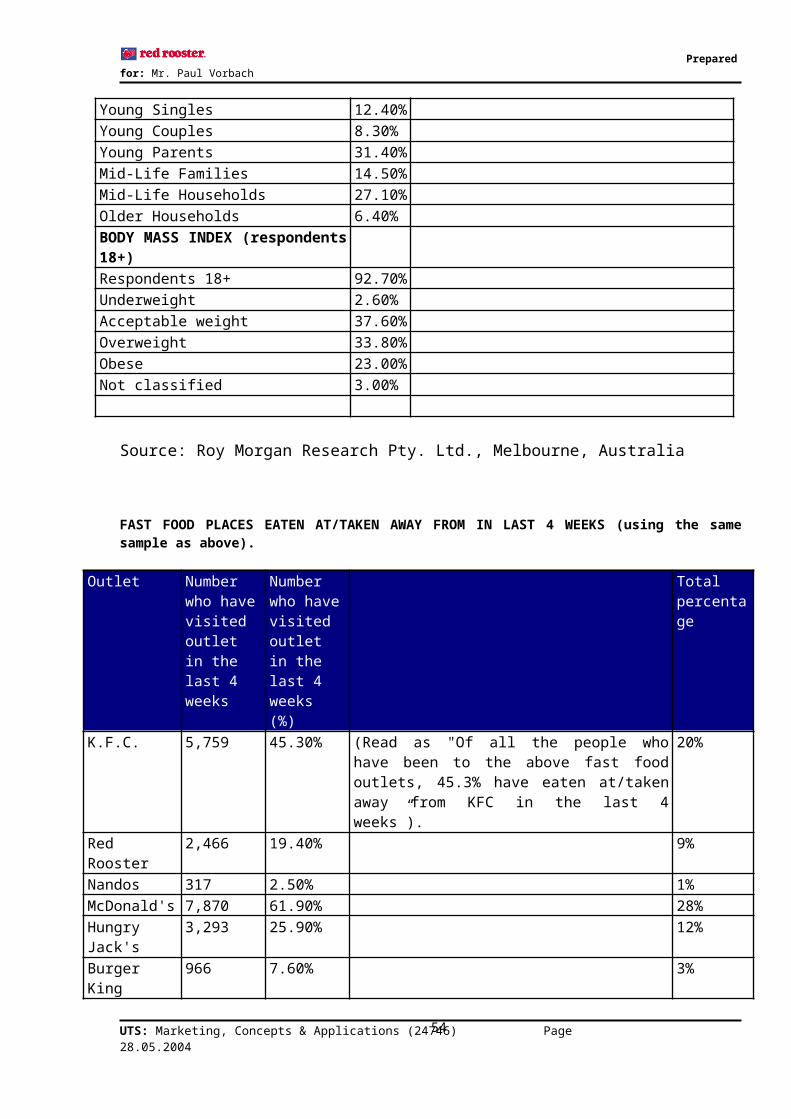
Prepared for: Mr. Paul Vorbach
friends/relatives on spare time
The most popular meals at Red Rooster are Quarter Chicken (23%) and Half Chicken (19%)
Product features
The most popular individual items at Red Rooster menu are Quarter Chicken (26.5%) and Crispy Fillet Burger (20%)
Product features
31% of the respondents visited Red Rooster because of taste and only 8% because of convenience
Product Differentiation
Improve availability/
market access38% would like to consume Red Rooster at shopping centres and 27% would like to take home
Improve availability/
market access
PRIMARY RESEARCH FINDINGS (cont.)MKTG MIX USAGE
PRODUCT PROMOTION PRICE PLACECustomer Perceptions of Red Rooster relative to the competitors: 43% of the respondents perceived the quality of Red Rooster as good and 34% as very good.
Product differentiation: taste and
quality78% of the respondents perceived the price of Red Rooster as moderate and 14% as cheap
Value for money strategy;
economic and product-
performance relative value
Red Rooster was perceived as relatively unpopular by the interviewees. The level of popularity of the fast food chains in Australia was perceived as: McDonald’s (45%), KFC (27%), Hungry Jack’s (10%), Pizza Hut (8%), Domino’s (4%), Red Rooster (3%), Subway (2%) and Oporto (1%).
Lack of perceived benefits
Lack of awareness,
improve exposure;
problem of positioning, no
identification with the brand image.
No perceived value
Lack of availability,
inconvenience
McDonald‘s was perceived as convenient by most respondents (45%). Red Rooster was perceived as the least convenient (0.8%).
Poor distribution /
improve market access..
McDonald’s was the leader in awareness among the interviewees (30%), followed by KFC (23%), Hungry Jack’s (14%) and Red Rooster (10%).
Red Rooster needs more brand
exposure.The customers‘ perceptions about the fast-food chains were:Red Rooster - tasty (23%)KFC - greasy (30%)Subway - fresh (40%)McDonald’s – convenient (45%)Pizza Hut – cheap (6%)Oporto – dry (10%)
Product differentiation: taste and
quality
UTS: Marketing, Concepts & Applications (24746) Page 28.05.2004 55

Prepared for: Mr. Paul Vorbach
Male
Female
Surveyed Genders
0
10
20
30
40
50
60
70
80
90
100
Perc
enta
ge
Gender
Surveyed Genders
Male Female
Permanent residency
Non- permanent residency
Residency in Australia0
10
20
30
40
50
60
Perc
enta
ge
Residency
Residency in Australia
Permanent residencyNon- permanent residency
UTS: Marketing, Concepts & Applications (24746) Page 28.05.2004 56

Prepared for: Mr. Paul Vorbach
<1920-24
25-2930-34
35-3940-44
45-4950-54
55>
Age Spread
0
10
20
30
40
50
60
70
80
90
100Pe
rcen
tage
s
Age spread
Age Spread
Age Spread
Single Married
engagedwidowed
Marital staus
0
10
20
30
40
50
60
70
80
90
100
Perc
enta
ge
Marital status
Marital staus
Marital staus
UTS: Marketing, Concepts & Applications (24746) Page 28.05.2004 57
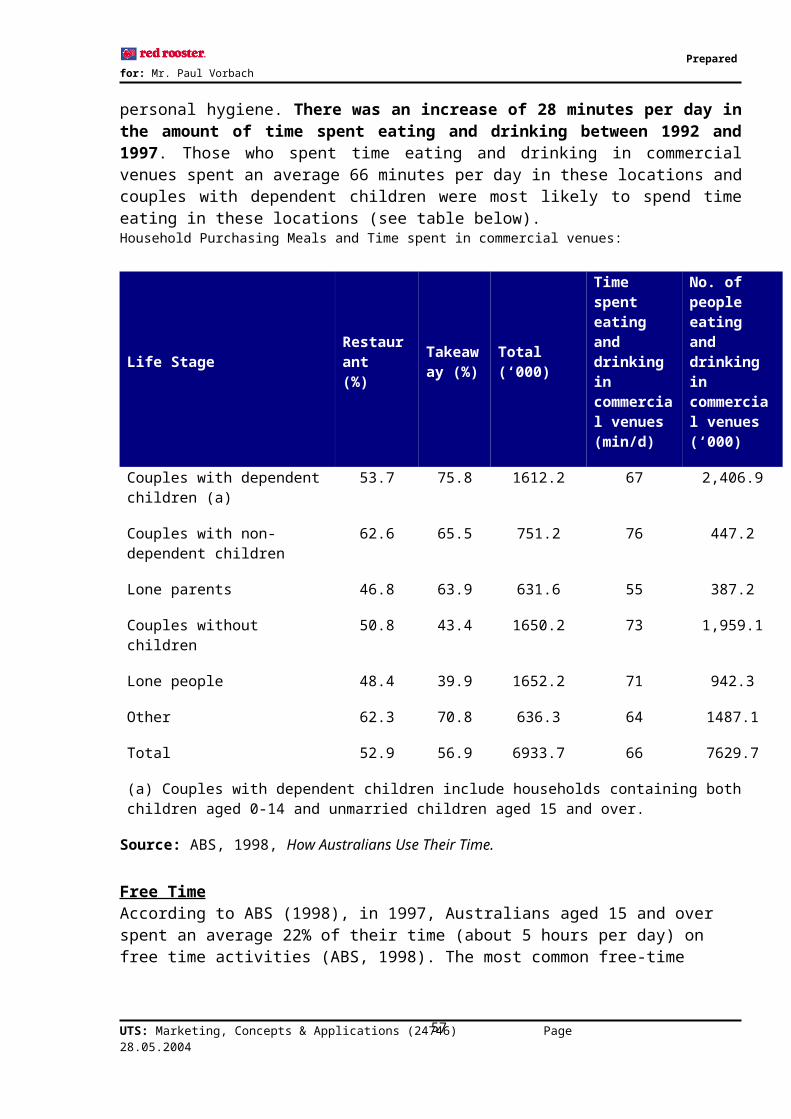
Prepared for: Mr. Paul Vorbach
with children
without children
Children
0
10
20
30
40
50
60
70
80
90
100
Perc
enta
ge
Children
Children
with children without children
StudentsProfessionals
Non-profesionalsRetired
Occupation
0
10
20
30
40
50
60
70
80
90
100
Perc
enta
ge
Occupations
Occupation
StudentsProfessionalsNon-profesionalsRetired
UTS: Marketing, Concepts & Applications (24746) Page 28.05.2004 58

Prepared for: Mr. Paul Vorbach
ConvenientFattening
TastyIndulgement
Reason for eating fast food
0
10
20
30
40
50
60
70
80
90
100
Perc
enta
ge
Reasons
Perception of fast food
ConvenientFatteningTastyIndulgement
Yes
No
Eatan Red rooster Before
0
10
20
30
40
50
60
70
80
90
100
Perc
enta
ge
Eatan Red rooster in past year
YesNo
UTS: Marketing, Concepts & Applications (24746) Page 28.05.2004 59

Prepared for: Mr. Paul Vorbach
DailyWeekly
MonthlyYearly
Frequencies visit to Red rooster
0
10
20
30
40
50
60
70
80
90
100
Perc
enta
ge
Frequency
Frequencies visit to Red rooster
DailyWeeklyMonthlyYearly
MorningMid morning
AfternoonEvening
Late evenings
Time of visit to Red rooster
0
10
20
30
40
50
60
70
80
90
100
Perc
enta
ge
Time
Time of visit to Red rooster
MorningMid morningAfternoonEveningLate evenings
UTS: Marketing, Concepts & Applications (24746) Page 28.05.2004 60
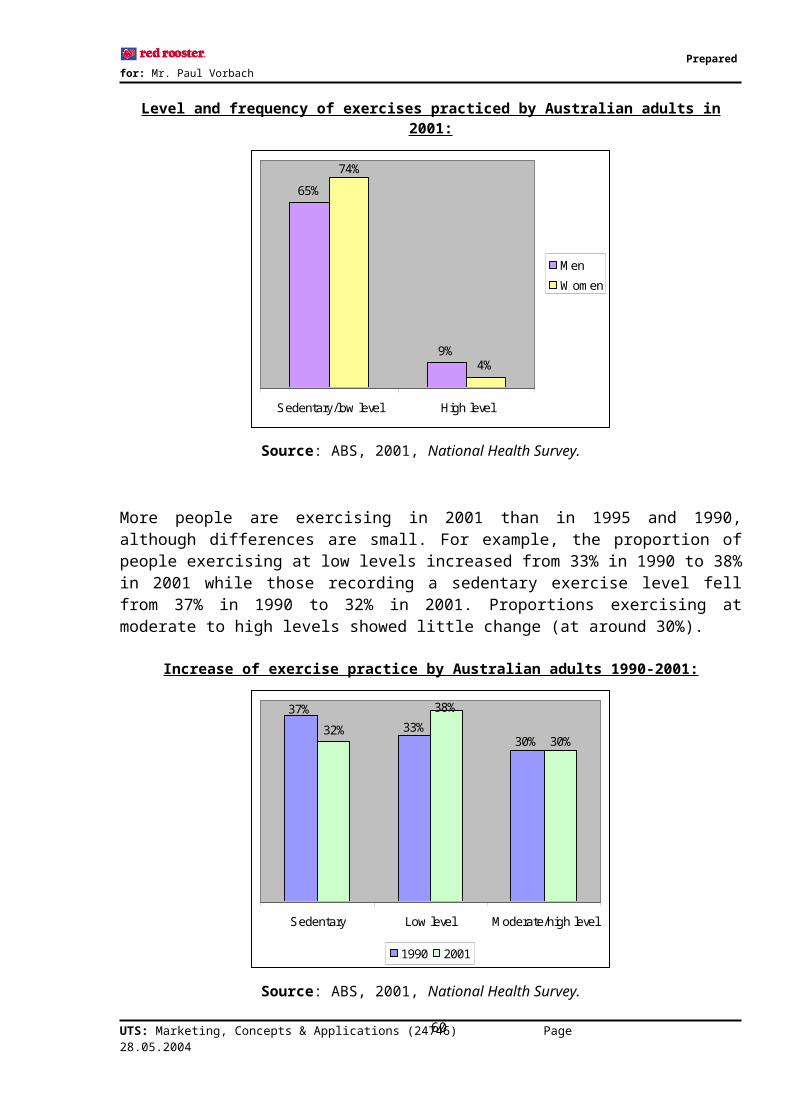
Prepared for: Mr. Paul Vorbach
Weekdays
Weekend
Prefered time of visit in the week0
10
20
30
40
50
60
70
80
90
100
Perc
enta
ge
Time of visit
Prefered time of visit in the week
Weekdays Weekend
AloneSpouse
Spouse andchildred Children only
Friends andRelatives
Companies during visits
0
10
20
30
40
50
60
70
80
90
100
Perc
enta
ge
Companies
Companies during visits
AloneSpouseSpouse and childredChildren onlyFriends and Relatives
UTS: Marketing, Concepts & Applications (24746) Page 28.05.2004 61
Prepared for: Mr. Paul Vorbach
Excellence Very Good
GoodFair
Poor
Quality Perceive of Red rooster
0
10
20
30
40
50
60
70
80
90
100
Perc
enta
ge
Quality Perceived
Quality Perceive of Red rooster
Excellence Very GoodGoodFairPoor
Very expensiveExpensive
ModerateCheap
Very cheap
Perceive Price at Red Rooster
0
10
20
30
40
50
60
70
80
90
100
Perc
enta
ge
Price perceive
Perceive Price at Red Rooster
Very expensiveExpensiveModerateCheapVery cheap
UTS: Marketing, Concepts & Applications (24746) Page 28.05.2004 62

Prepared for: Mr. Paul Vorbach
BB
Q c
hick
en
Hal
f Chi
cken
Qua
rter c
hick
en
Trop
ical
Cris
py F
illet
Bur
ger
Stri
p S
ub
Flay
va
Fres
h S
ub 9
7
Chi
cken
Rol
l
Most Popular food in Red rooster(Meal)
0
5
10
15
20
25Pe
rcen
tage
Meals
Most Popular food in Red rooster (Meal)
Most Popular food in Red rooster (Meal)
UTS: Marketing, Concepts & Applications (24746) Page 28.05.2004 63

Prepared for: Mr. Paul Vorbach
Appendix No. 8: Australian Political Environment: Democratic & Stable
Appendix No. 9: Government Efficiency
UTS: Marketing, Concepts & Applications (24746) Page 28.05.2004
Source: World Competitiveness Yearbook 2002
64

Prepared for: Mr. Paul Vorbach
Extent to which government policies are conductive to effectiveness
Source: http://www02.imd.ch/documents/wcy/content/ge.pdf(a) Government efficiency based on public finance, fiscal policy, institutional framework, business legislation and societal framework(b) Until May 2004
Appendix No. 10: Economic Efficiency
Macro-economic evaluation of domestic economy
(a) Economic efficiency based on domestic economy, international trade, international investment, employment and prices
(b) Until May 2004
UTS: Marketing, Concepts & Applications (24746) Page 28.05.2004 65

Prepared for: Mr. Paul Vorbach
Source: http://www01.imd.ch/documents/wcy/content/ep.pdf
Appendix No. 11: Household Computer and Internet Access
HOUSEHOLD COMPUTER AND INTERNET ACCESS
Computer access(a) Internet access(a)
1998 1999 2000 1998 1999 2000% % % % % %
Households With children under 18 64 66 72 22 31 45 Without children under 18 33 37 43 13 17 26Household income Under $25,000 20 21 24 5 6 10 $25,000-$49,999 44 45 52 12 17 28 $50,000-$74,999 61 64 66 21 31 40 $75,000-$99,999 71 73 78 32 39 55 $100,000 or more 80 81 85 44 52 69All households 45 48 53 16 22 33
(a) Proportions are of all households in each category.
Source: Household Use of Information Technology, Australia, 2000 (8146.0).
Projected data for 2001Source: Household use of information technology, Australia, 2000
Appendix No. 12: Adults Accessing the Internet
ADULTS ACCESSING THE INTERNET(a)(b)
Site of Internet access(c)
Home (%) Work (%) Other sites(%) Any site(%)
Age group (years) 18-24 39 24 59 75 25-34 34 33 33 62 35-44 35 28 19 52
UTS: Marketing, Concepts & Applications (24746) Page 28.05.2004 66
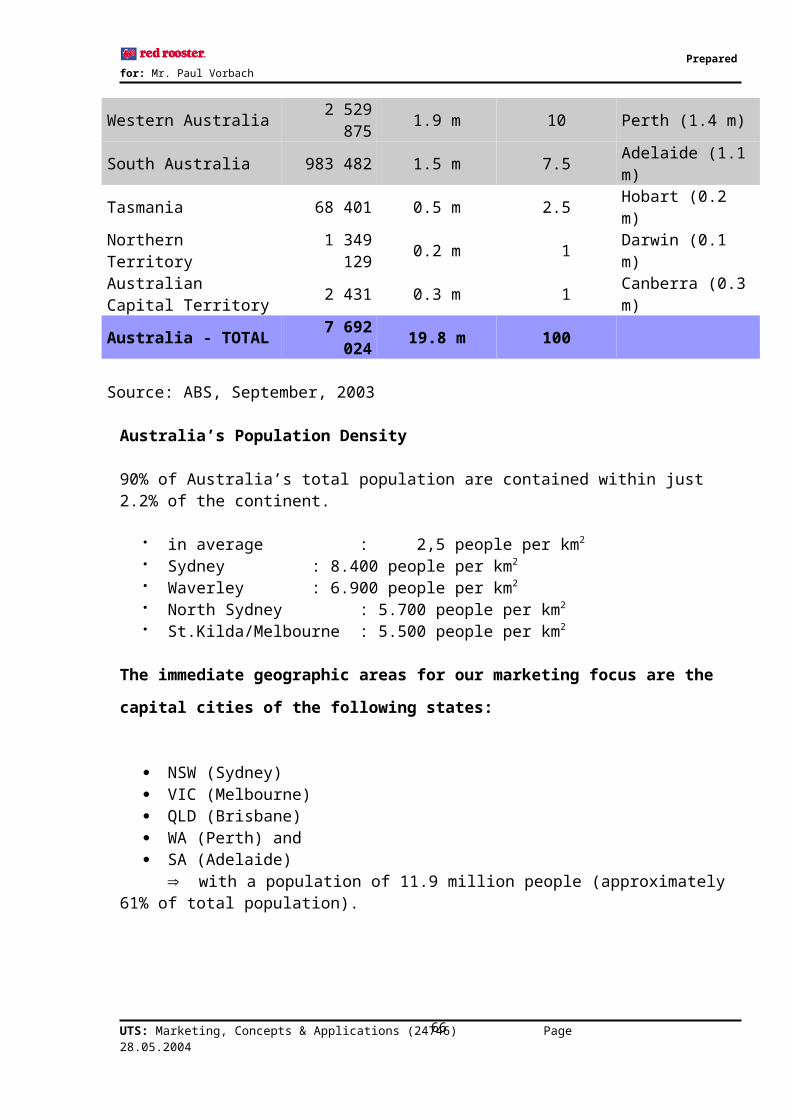
Prepared for: Mr. Paul Vorbach
45-54 33 29 14 47 55-64 18 13 8 26 65 or over 7 2 2 9Sex Males 32 26 24 50 Females 25 20 21 43Region Capital cities 32 25 24 50 Rest of Australia 22 19 20 40All adults 29 23 22 47
(a) Proportions are of all persons in each category.(b) Internet access occurred during the preceding 12 months.(c) Persons may have accessed the Internet at only one or any number of sites.
Source: Household Use of Information Technology, Australia, 2000 (8146.0).
Appendix No. 13: Current market share per competitor and Sales Forecast for 2004
Sources:
1. Roy Morgan Research “QSR Marketing and Advertising Planning” (2003). We have assumed that the number of people who visit each outlet equates to the market share of that outlet.
2. Euromonitor “Consumer Foodservice in Australia”;3. ACNielsen (2003) Individual sales figures have been calculated using the average market share and
total projected sales.
Market share per Competitor (2003) and Sales Forecast for 2004 (AU$ bi)
Roy Morgan Market Share
ACNielsen Market Share
Euromonitor Market Share
Calculated Average Market Share
Estimated Sales 2004 ($bi)
McDonalds 28% 26% 27% 27% 2.1KFC 20% 18% 18% 18% 1.4Hungry Jacks 15% 11% 13% 13% 1.0Red Rooster 9% 8% 9% 9% 0.7Subway 8% 5% 6% 6% 0.5Pizza Hut 8% 4% 6% 6% 0.5Dominos 6% 7% 4% 5% 0.4Others 6% 21% 18% 14% 1.2Total 100% 100% 100% 100% 7.6
UTS: Marketing, Concepts & Applications (24746) Page 28.05.2004 67

Prepared for: Mr. Paul Vorbach
Market Share Fast Food Chains (2003)
16% Others
5% Dominos
27% McDonald's
18% KFC13% Hungry
Jack's9% Red Rooster
6% Subway
6% Pizza Hut
Appendix No. 14: Competitive Analysis
Competitor Products Wei
ght (
g)
Cal
orie
s
Fat c
alor
ies
Fat (
g)
Satu
rate
d fa
t (g)
Cho
lest
erol
(mg)
Sodi
um (m
g)
Car
bohy
drat
es (g
)
Die
tary
Fib
re (g
)
Suga
r (g
)
Prot
ein
(g)
McDonald's Chicken Chicken McNuggets (20 pieces) 320 840 440 49 11 125 2240 51 0 1.7 50Chicken McNuggets (9 pieces) 160 420 220 24 5 60 1120 26 0 0.8 25Chicken McNuggets (6 pieces) 96 250 130 15 3 35 670 15 0 0.5 15Chicken McNuggets (3 pieces) 64 170 90 10 2 25 450 10 0 0.3 10Crispy Chicken Sandwich 219 510 230 26 5 50 1090 47 3 7 22McChicken 147 430 200 22 6 45 803 41 3 4.5 18Chicken Foldover n/a 439 n/a 8.9 3.4 n/a n/a n/a n/a n/a n/aSalads Crispy Chicken Caesar Salad 249 310 140 16 5 50 890 20 3 3 23Garden Mixed Salad 200 73.4 n/a 3.9 2.3 n/a n/a n/a n/a n/a n/aRoast Chicken Salad 249 208 n/a 6.5 2.9 n/a n/a n/a n/a n/a n/aKFC Chicken Popcorn Chicken Lge 170 660 400 44 10 75 1530 37 0 0 29Popcorn Chicken Individual 114 450 270 30 7 50 1030 25 0 0 19Popcorn Chicken Kids 71 270 160 18 4 30 640 16 0 0 12HBBQ Wings Sauced (6) 157 540 300 33 7 150 1130 36 1 15 25HBBQ Sauce Boneless Wings (7) 250 600 260 29 5 75 1950 49 2 7 35Hot Wings (6) 134 450 260 29 6 145 1120 23 1 1 24Extra Crispy Chicken-Breast 162 460 250 28 8 135 1230 19 0 0 34
UTS: Marketing, Concepts & Applications (24746) Page 28.05.2004 68

Prepared for: Mr. Paul Vorbach
Extra Crispy Chicken-Thigh 114 370 230 26 7 120 710 12 0 0 21Extra Crispy Chicken-Whole Wing 52 190 110 12 4 55 390 10 0 0 10Extra Crispy Chicken-Drumstick 60 160 90 10 2.5 70 420 5 0 0 12Hot and Spicy Chicken - Thigh 128 400 250 28 8 125 1240 14 0 0 22Hot and Spicy Chicken - Breast 179 460 240 27 8 130 1450 20 0 0 33Hot and Spicy Chicken - Whole Wing 55 180 100 11 3 60 420 9 0 0 11Hot and Spicy Chicken - Drumstick 60 150 80 9 2.5 65 380 4 0 0 13Original Recipe Chicken - Thigh 126 360 230 25 7 165 1060 12 0 0 22Original Recipe Chicken - Breast 161 380 170 19 6 145 1150 11 0 0 40Original Recipe Chicken - Whole Wing 47 150 80 9 2.5 60 370 5 0 0 11Original Recipe Chicken - Drumstick 59 140 70 8 2 75 440 4 0 0 14Original Recipe Chicken - Breast w/o skin or breading 108 140 25 3 1 95 410 0 0 0 29Crispy Strips (3) 151 400 220 24 5 75 1250 17 0 0 29Hungry Jacks Chicken Chicken Tenders (8 pieces) 123 340 170 19 5 50 840 20 <1 0 22Chicken Tenders (5 pieces) 77 210 110 12 3.5 30 530 13 <1 0 14Chicken Tenders (4 pieces) 62 170 90 9 2.5 25 420 10 0 0 11Salads Caesar Salad with Chicken & Dressing 249 445 60 27.9 8 n/a 1820 22.9 2 8.1 25.2Caesar Salad with Dressing 183 327 n/a 21.3 5.9 n/a 1260 20.8 n/a 7.3 12.8Garden Salad with Chicken & French Dressing 279 180 n/a 7.3 2.2 n/a 1020 13.2 n/a 8.7 14.6Garden Salad with Chicken & Thousand Island Dressing 264 287 n/a 17.4 3.7 n/a 833 17 n/a 4.3 15.4Red Rooster Chicken Chicken - BBQ (Whole) n/a 1271 n/a 65.5 n/a n/a 3578 41.2 n/a 18.2 130Chicken - BBQ (Half) n/a 650 n/a 33.5 n/a n/a 1829 21 n/a 9.3 66.2Chicken - BBQ (Quarter) n/a 339 n/a 17.5 n/a n/a 954 11 n/a 4.9 34.6Nugget Chicken (one) n/a 48 n/a 2.9 n/a n/a 88 2.9 n/a 0.2 2.6Chicken Roll n/a 677 n/a 34.1 n/a n/a 1397 58.6 n/a 15.7 33.8Chicken Strip (one) n/a 163 n/a 9.6 n/a n/a 422 10.7 n/a 1.9 8.5Rooster Burger n/a 513 n/a 29 n/a n/a 1445 41.4 n/a 8.3 23.5Crispy Fillet Burger n/a 583 n/a 29.8 n/a n/a 1456 49.6 n/a 7.4 27.3Flayva n/a 688 n/a 42.3 n/a n/a 1348 53.6 n/a 8.5 22.6Fresh Sub 97 n/a 434 n/a 5.6 n/a n/a 1291 65.1 n/a 7.5 26.4Strip Sub n/a 785 n/a 40.3 n/a n/a 1584 87.6 n/a 14.7 29.1Subway Chicken Roasted Chicken Breast 236 320 50 5 2 45 1000 47 5 8 23Sweet Onion Chicken Teriyaki 269 380 45 5 1.5 50 1100 59 4 18 26Double Meat Chicken 322 410 70 8 3 90 1500 50 5 9 37Buffalo Chicken 279 400 130 15 3.5 50 1420 45 4 8 25Chicken Pizziola 320 460 190 17 7 75 1700 51 5 9 29Mediterranean Chicken 306 470 170 19 7 70 1550 48 5 6 29Salads Roasted Chicken Breast Salad 303 140 30 3 1 45 300 12 3 2 16Veggie Delite Salad 233 50 10 1 0 0 310 9 3 0 2Tuna Salad 314 240 140 16 4 40 380 11 3 0 13Turkey Breast Salad 289 110 20 2 0 20 320 11 3 1 11
UTS: Marketing, Concepts & Applications (24746) Page 28.05.2004 69

Prepared for: Mr. Paul Vorbach
Appendix No. 15: Price Comparison – Fast food Competitors
Primary research was conducted at restaurant locations to determine the following prices. In each category below, the price reflects the average of the different products within that category.
Table of PricesKFC Hungry Jacks Mega Feast 22.00 Aussie Burger 6.95Family Feast 16.00 Bacon Deluxe meal 6.35Variety Bucket 9.00 Grilled chicken 6.35Dinner for Two 8.70 Whopper Meal 6.25Dinner for one 5.75 Whopper Junior 4.95Whole Fillet Burger 4.50 Chicken Fillet Burger 3.75Original Fillet Burger 4.50 Fish Burger 3.75Club Burger 4.50 Side salads 1.95Bacon & Cheese Burger 4.00 Chips 1.50Works Burger 4.00 Average 4.64Twister: 3.75 Lowest Price 1.50Pop Corn Chicken 2.00 Highest Price 6.95Chips: 1.50 Average 6.94 Pizza Hut Lowest Price 1.50 Family Pizzas 11.95Highest Price 22.00 Large Pizzas 9.95 Regular Pizzas 6.75Red Rooster Chicken Wings 2.75Crowd Pleaser 22.95 Garlic Bread 1.75Chicken Double up 10.95 Average 6.63Dinner Double 8.00 Lowest Price 1.75Chicken Meal 5.95 Highest Price 11.95¼ chicken meal 5.95 Mega Chicken meal 5.95 McDonalds Strip Sub Combo 4.95 Garden Mix Salad 5.95¼ chicken & chips combo 4.95 Big Mac Meal 5.45Fillet Burger Combo 4.95 Chicken Salad 4.95Chicken Dinner Combo 4.95 Big Mac 3.95Chicken Roll 3.95 Quarter Pounder 3.25Average 7.59 Vege Burger 3.25Lowest Price 3.95 Average 4.47Highest Price 22.95 Lowest Price 3.25 Highest Price 5.95
The summary of average prices follows below:
Prices (A$) Lowest Price Average Price Highest PriceRed Rooster 3.95 7.59 22.95KFC 1.50 6.94 22.00Pizza Hut 1.75 6.63 11.95Hungry Jack's 1.5 4.64 6.95McDonald's 3.25 4.47 5.95
Price Comparison – Lowest, Average and Highest Price for each fast-food competitor:
UTS: Marketing, Concepts & Applications (24746) Page 28.05.2004 70
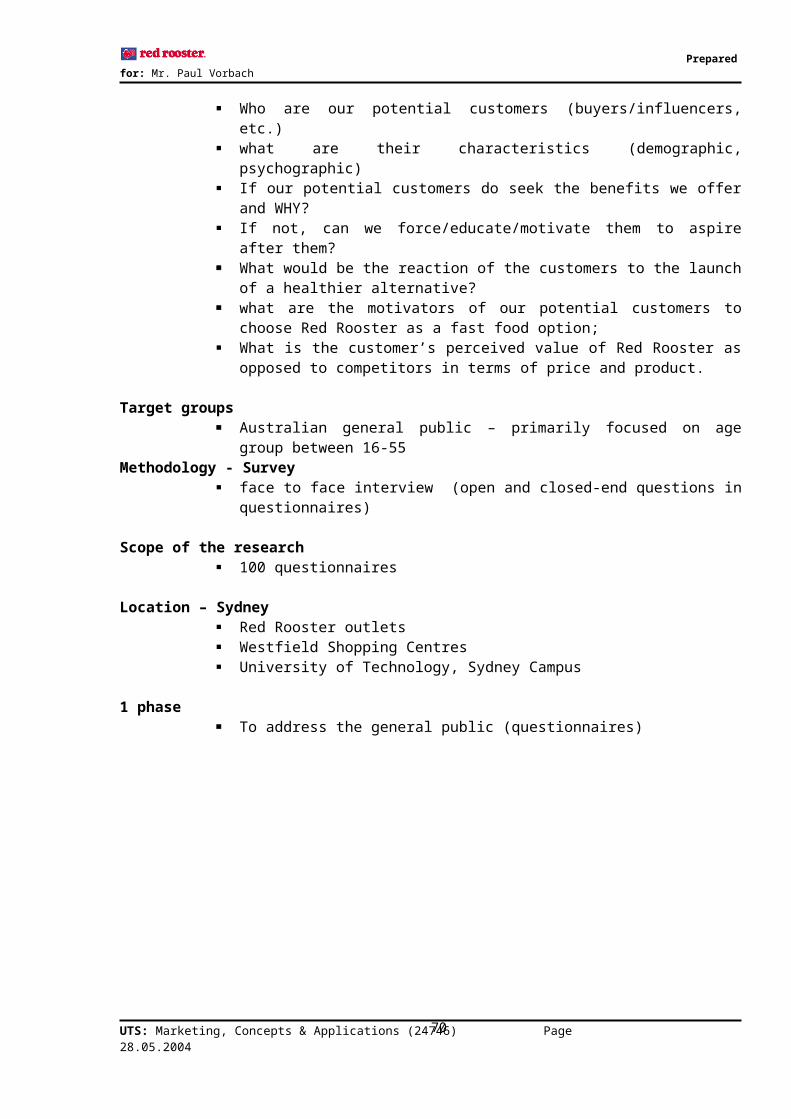
Prepared for: Mr. Paul Vorbach
Red Roo
ster
KFC
Pizza H
ut
Hungry
Jack
's
McDon
ald's
0
5
10
15
20
25
Price (A$)
Lowest Price
Average Price
Highest Price
Appendix No. 16: Buying Decision Forces - “Young Professional”Decision
UTS: Marketing, Concepts & Applications (24746) Page 28.05.2004
Buyer
Self
Initiator
Self
User
Self
Young Professional
Decider
Self or Friends
Influencer
Self or Friends
Source: Adapted from Kotler, Brown, Adam, Armstrong, 2004, in Gudergan (2001) p257
BuyingDecision
71

Prepared for: Mr. Paul Vorbach
Appendix No. 17: Buying Decision Forces - “Student”
Appendix No.18: Red Rooster - PORTFOLIO ANALYSIS
UTS: Marketing, Concepts & Applications (24746) Page 28.05.2004
BuyerSelf or Family
InitiatorSelf,
Family or Friends
User
Self
Student
DeciderSelf,
Family or Friends
InfluencerSelf,
Family or Friends
Source: Adapted from Kotler, Brown, Adam, Armstrong, 2004, in Gudergan (2001) p257
BuyingDecision
Competitive
Advantage
Market Attractivenes
Red Rooster OFFENSIVE
STRATEGY (Entry): As we are entering a new market in health food products we aim for market share growth. We need to invest heavily to establish a competitive advantage
33.3 66.73
33.3
66.7
72

Prepared for: Mr. Paul Vorbach
Source: Adapted from Best, 2004, p. 279, in Gudergan (2001)
Appendix No. 19: Recipe for Grilled Chicken
Grilled Chicken Recipe:
Whole ChickenWhole marinated chicken, wood fire roasted to enhance flavour, melt away unwanted fat and provide a healthy alternative to fried food and other "fast food". Chicken is quartered or left whole.
Ingredients include:salt paprikacayenne pepper onion powder thyme white pepper garlic powder black pepper roasting chicken onions, peeled and quartered
Methods of Preparation:
1. Blend all spices together and set aside.2. Remove neck and giblets from chicken cavity, rinse well inside and out, and pat dry with paper
towels.3. Rub with spice mixture, both inside and out, then stuff cavity with onions.4. Wrap in a resealable "food grade" plastic bag and tie closed.
UTS: Marketing, Concepts & Applications (24746) Page 28.05.2004 73
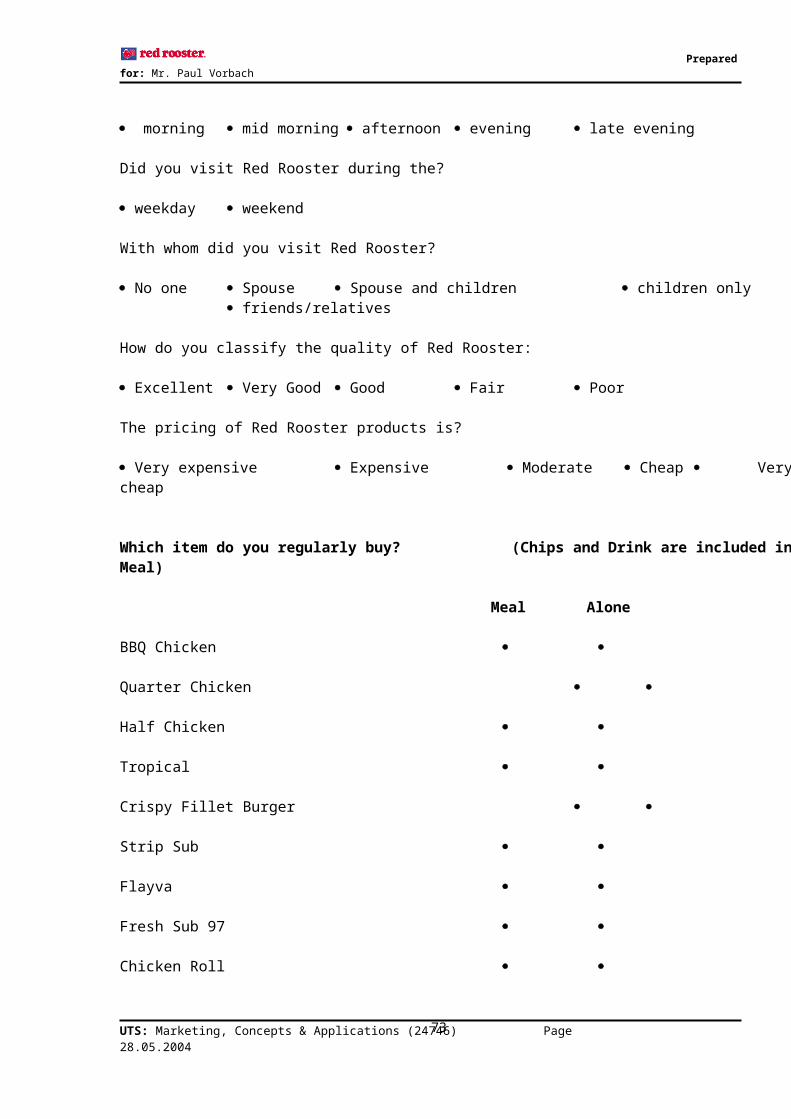
Prepared for: Mr. Paul Vorbach
5. Remove from plastic bag and place in a shallow baking pan.6. Roast uncovered in a 250 F oven 5 hours.7. According to Agriculture Food Safety and Inspection Service, a whole chicken should reach an
internal temperature of 80°C.8. Baste with drippings every 30 minutes after the first hour.9. Let rest for 10 minutes before carving.
Nutrition Facts:
Calories 360Calories from Fat 160
Amount per Serving (165g)
Total Fat 15gSaturated Fat 3gPolyunsaturated Fat 0.4gMonounsaturated Fat 0.1g
Cholesterol 115mgSodium 440mgPotassium 331mg
Total Carbohydrate 1gDietary Fibre 0gProtein 22gSugar 1g
Vitamin A 1657mcgVitamin B6 0.3mgVitamin B12 0.0mcgVitamin C 12mgVitamin E 0mcgCalcium 49mgMagnesium 24mgIron 1mg
Appendix No. 20: Nutrition for whole chicken
salt paprikacayenn
e pepper
onion powde
r
thyme
white peppe
r
garlic powde
r
black peppe
r
roasting chicken onions Total
Protein 0 0.62 0.22 0.24 0.04 0 0.24 0.11 228.99 3.48 233.94Total lipid (fat) 0 0.54 0.31 0.03 0.01 0 0.01 0.03 211.76 0.48 213.17Carbohydrate, by difference 0 2.34 1.02 1.94 0.2 0 1.02 0.68 0 25.89 33.08
Ash 23.95 0.29 0.11 0.08 0.03 0 0.05 0.05 11.62 1.11 37.28Energy 0 12.14 5.72 8.33 0.81 0 4.65 2.68 2885.76 114 3034.08
Water 0.05 0.4 0.14 0.12 0.52 0 0.09 0.11 875.08 269.04 1145.56
UTS: Marketing, Concepts & Applications (24746) Page 28.05.2004 74
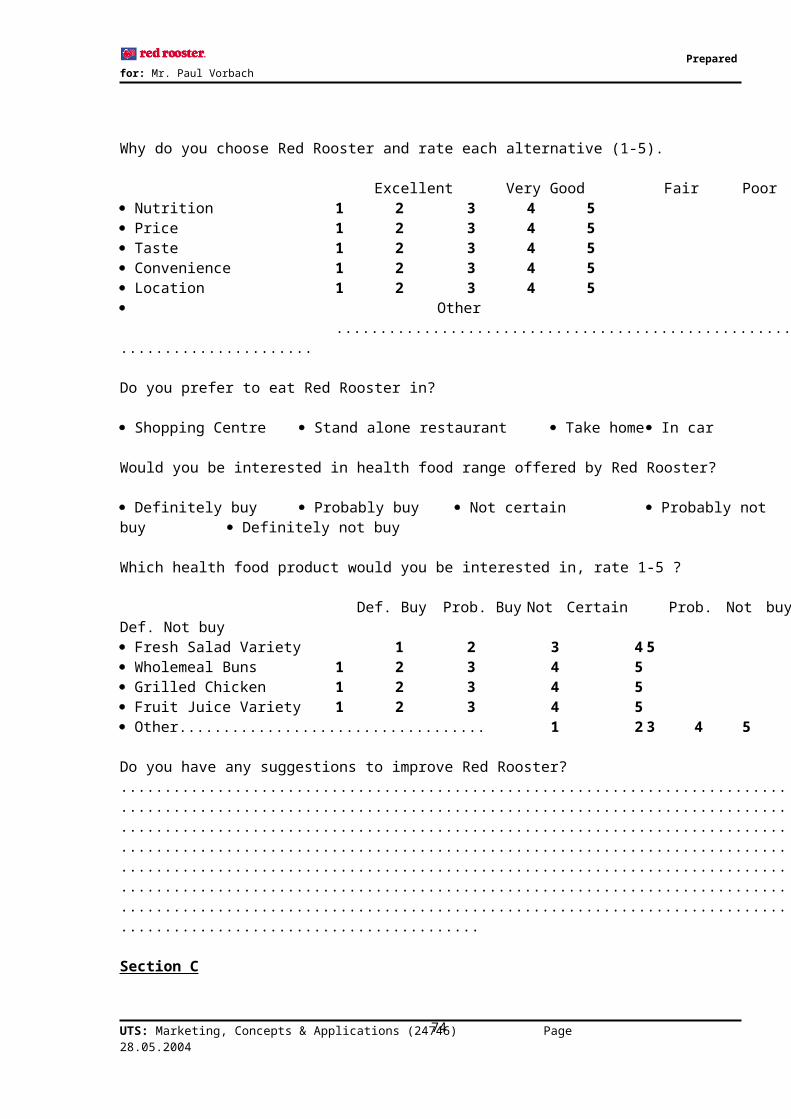
Prepared for: Mr. Paul Vorbach
Caffeine 0 0 0 0 0 0Theobromine 0 0 0 0 0 0
Energy 0 50.78 23.96 34.82 3.38 0 19.46 11.2 12077.44 477 12698.0
5Fibre, total dietary 0 0.88 0.49 0.14 0.11 0 0.14 0.28 0 5.4 7.43
Calcium, Ca 5.76 7.43 2.66 8.71 3.24 0 1.12 4.59 133.6 60 227.12Iron, Fe 0.08 0.99 0.14 0.06 0.14 0 0.04 0.3 13.49 0.66 15.91Magnesium, Mg 0.24 7.77 2.74 2.93 1.28 0 0.81 2.04 253.84 30 301.64Phosphorus, P 0 14.49 5.27 8.16 0.85 0 5.84 1.82 2217.76 99 2353.19Potassium, K 1.92 98.45 36.25 22.63 4.87 0 15.41 13.22 2618.56 471 3282.32
Sodium, Na 9301.92 1.43 0.54 1.3 0.07 0 0.36 0.46 908.48 9 10223.5
6Zinc, Zn 0.02 0.17 0.04 0.06 0.01 0 0.04 0.01 14.3 0.57 15.23Copper, Cu 0.01 0.03 0.01 0 0 0 0 0.01 0.61 0.18 0.86Manganese, Mn 0.02 0.04 0.04 0.01 0.01 0 0.01 0.06 0.24 0.41 0.84Selenium, Se 0.02 0.17 0.16 0.05 0 0.53 0.03 204.41 1.8 207.17
Vitamin A, IU 0 2545.37 748.98 0 38.02 0 0 1.99 1750.16 0 5084.52
Retinol 0 0 0 0 0 0 0 0 521.04 0 521.04Vitamin A, RAE 0 127.26 37.46 0 1.9 0 0 0.1 521.04 0 687.77
Tocopherol, alpha 0.93 0.93
Vitamin E 0 0.03 0.09 0 0 0 0.01 0.93 1.06Vitamin C, total ascorbic acid 0 2.99 1.38 0.35 1.28 0 0.25 0.22 20.04 19.2 45.71
Thiamine 0 0.03 0.01 0.01 0 0 0.01 0 0.77 0.13 0.95Riboflavin 0 0.07 0.02 0 0 0 0 0 1.54 0.06 1.7Niacin 0 0.64 0.16 0.02 0.01 0 0.01 0.01 87.8 0.44 89.1Pantothenic acid 0.07 0 11.82 0.32 12.22Vitamin B-6 0 0.17 0.04 0.03 0 0 0.04 0 4.28 0.35 4.91Folate, total 0 4.45 1.91 3.98 0.36 0 0.03 0.1 80.16 57 148Vitamin B-12 0 0 0 0 0 0 0 0 4.14 0 4.14Folic acid 0 0 0 0 0 0 0 0 0 0 0Folate, food 0 4.45 1.91 3.98 0.36 0 0.03 0.1 80.16 57 148Folate, DFE 0 4.45 1.91 3.98 0.36 0 0.03 0.1 80.16 57 148Tryptophan 0 0 0 0 2.54 0.05 2.6Threonine 0 0 0 0.01 9.43 0.08 9.53Isoleucine 0 0.01 0 0.01 11.37 0.12 11.51Leucine 0 0.01 0 0.01 16.62 0.12 16.77Lysine 0 0.01 0 0.01 18.57 0.16 18.76Methionine 0 0 0 6.07 0.03 6.1Cystine 0 0 0 3.07 0.06 3.14Phenylalanine 0 0.01 0.01 8.88 0.09 8.99Tyrosine 0 0.01 0 7.35 0.09 7.44Valine 0 0.01 0 0.01 11.1 0.08 11.2Arginine 0 0.03 0.02 14.4 0.47 14.93Histidine 0 0 0 6.69 0.06 6.76Alanine 0 0.01 0 13.43 0.1 13.53
UTS: Marketing, Concepts & Applications (24746) Page 28.05.2004 75

Prepared for: Mr. Paul Vorbach
Aspartic acid 0 0.01 0.02 20.43 0.19 20.65Glutamic acid 0 0.05 0.03 33.4 0.56 34.04Glycine 0 0.01 0.01 15.11 0.14 15.27Proline 0 0.01 0 11.25 0.11 11.37Serine 0 0.01 0.01 8.1 0.1 8.21Cholesterol 0 0 0 0 0 0 0 0 975.28 0 975.28Fatty acids, total saturated 0 0.09 0.06 0 0 0 0 0.01 60.52 0.08 60.77
4:0 0 0 0 0 0 0 0 06:0 0 0 0 0 0 0 0 08:0 0 0 0 0 0 0 0 0 010:0 0 0 0 0 0 0 0 0 0 012:0 0 0.01 0 0 0 0 0 0.27 0 0.2814:0 0 0.02 0 0 0 0 0 1.74 0 1.7616:0 0 0.04 0.04 0 0 0 0.01 44.36 0.07 44.5318:0 0 0.01 0.01 0 0 0 0 12.02 0.01 12.0518:1 undifferentiated 0 0.05 0.05 0 0 0 0.01 73.35 0.07 73.52
18:2 undifferentiated 0 0.31 0.14 0.01 0 0 0.01 40.61 0.18 41.27
18:3 undifferentiated 0 0.04 0.01 0 0 0 0 2 0.01 2.07
20:4 undifferentiated 0 0 0 0 0 0 1.07 0 1.07
22:6 n-3 0 0 0 0 0 0 0.4 0 0.416:1 undifferentiated 0 0.01 0 0 0 0 11.89 0 11.9
18:4 0 0 0 0 0 0 0 020:1 0 0 0 0 0 0 2.27 0 2.2720:5 n-3 0 0 0 0 0 0 0.13 0 0.1322:1 undifferentiated 0 0 0 0 0 0 0 0 0
22:5 n-3 0 0 0 0 0 0 0.13 0 0.13Phytosterols 0 7.35 1.49 2.09 0 0.11 0.97 45 57.01Fatty acids, total monounsaturated
0 0.05 0.05 0 0 0 0 0.01 88.71 0.07 88.9
Fatty acids, total polyunsaturated 0 0.35 0.15 0.01 0 0 0.01 0.01 45.42 0.19 46.14
Sources: http://www.redrooster.com.au/DefaultMain.htm.
Appendix No. 21: Menu for Red Rooster
Menu for Red Rooster
UTS: Marketing, Concepts & Applications (24746) Page 28.05.2004 76
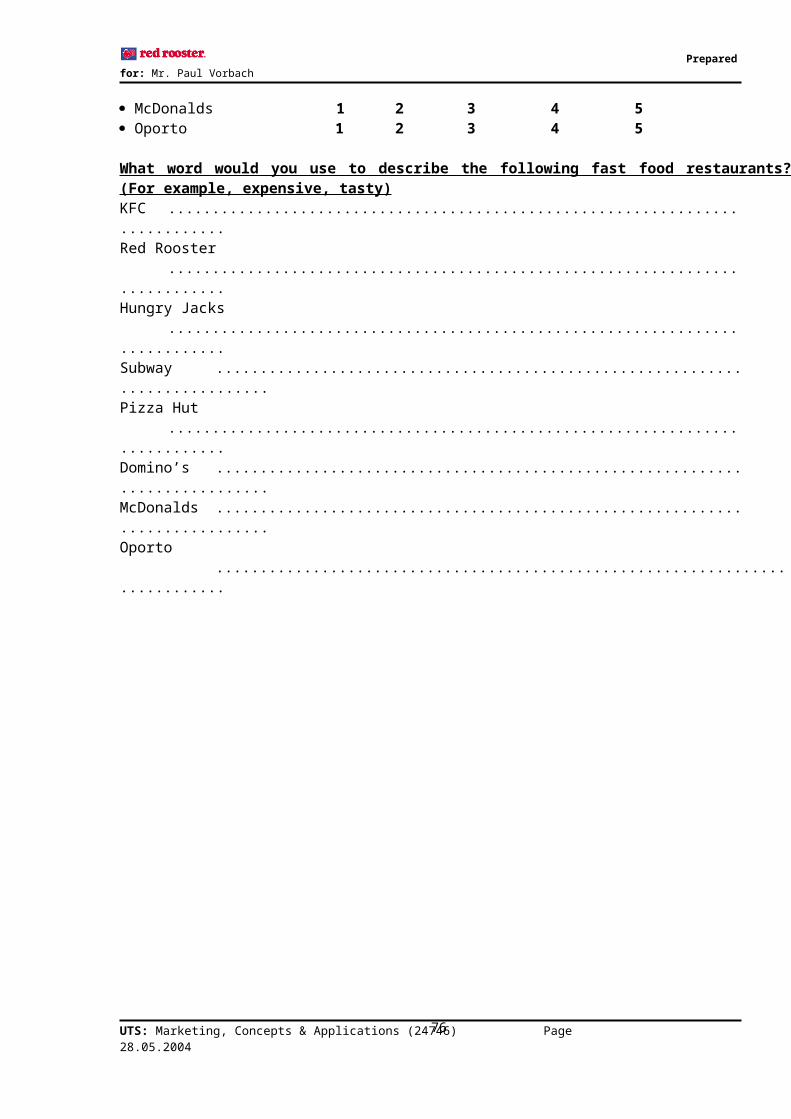
Prepared for: Mr. Paul Vorbach
Chicken Quarter Chicken $4.45Half Chicken $6.45Whole chicken $10.45
Salads Small Medium Large MegaGarden green salad $3.95 $4.95 $5.45 $7.45Caesar salad $3.95 $4.95 $5.45 $7.45Pasta salad $3.95 $4.95 $5.45 $7.45Greek salad $3.95 $4.95 $5.45 $7.45
Buns Small Medium LargeWhole meal Buns $0.95 $1.45 $1.95
Fresh fruit juice Small Medium Large$1.45 $2.45 $2.95
Individual meals Small Medium LargeQuarter meals $5.95 $6.95 $7.45Half meals $7.95 $8.95 $9.45Whole meals $12.45 $13.95 $14.45
All small/medium/large individuals meals comes with a standard size chicken comes with a small/medium/large salad of choice, a small/medium/large whole meal bun and a small/medium/large fresh juice. Go Super with addition piece of quarter chicken with only $4.00 with all meals.
Coupe meals (serve 1-2 individuals) $18.95All coupe meals come with two pieces of quarter chicken with 2 medium choices of salads, 2 medium whole meal buns and 2 small fresh fruit juices.
Party Pack (serve 3-4 individuals) $29.95All Party pack comes with a whole chicken and a half chicken with 2 choices of Mega salads, 4 large whole meal buns and 4 large Fresh fruit juice.
Family Pack (serve 4-6 individuals) $39.95All Party pack comes with 2 whole chickens with 3 choices of Mega salads, 4 large whole meal buns and 6 large Fresh fruit juice.
Appendix No. 22: Salad RecipesGarden Green Salad
Our salads are perfectly suitable for healthy diets. It consists of fresh ingredients. It is a mixture of a variety of vegetables.
UTS: Marketing, Concepts & Applications (24746) Page 28.05.2004 77

Prepared for: Mr. Paul Vorbach
Ingredients include:OnionsGreen bell peppersMixed greensTomatoOnion powderGarlic powderGround black pepperSaltBalsamic vinaigrette salad dressing
Method of Preparation:1. Sauté onion and bell pepper until soft; set aside to cool.2. Combine the onion, pepper, salad greens, deli meat and tomato.3. Sprinkle with the onion powder, garlic powder, black pepper and salt.4. Toss to mix.5. Pour on enough salad dressing or vinegar to coat, toss again and serve.
Nutrition Facts:
Calories 436Calories from Fat 218Amount Per Serving 1
Total Fat 24.3gSaturated Fat 6.8gPolyunsat. Fat 5.3gMonounsat. Fat 9.5g
Cholesterol 156mgSodium 177mgPotassium 466mg
Total Carbohydrate 2.4gDietary Fibre 0.6gProtein 49g
Vitamin A 441mcgVitamin B6 0.8mgVitamin B12 0.5mcgVitamin C 11mgVitamin E 0mcgCalcium 30mgMagnesium 44mgIron 2mg
Caesar Salad
A fresh mix of fresh lettuce, olive oil, parmesan cheese, and Caesar dressing.
Ingredients include:Olive oilLemon juicePrepared mustardGarlicRomaine lettuce
UTS: Marketing, Concepts & Applications (24746) Page 28.05.2004 78

Prepared for: Mr. Paul Vorbach
Parmesan cheeseGround black pepperCaesar dressing
Methods of Preparation:1. Mix oil, lemon juice, mustard and garlic well.2. Combine romaine, croutons, parmesan, and pepper.3. Drizzle with dressing.4. Toss to coat.
Nutrition Facts:
Calories 192Calories from Fat 130Amount Per Serving 1
Total Fat 14.6gSaturated Fat 3.9gPolyunsat. Fat 1.1gMonounsat. Fat 8.8g
Cholesterol 9mgSodium 292mgPotassium 278mg
Total Carbohydrate 8.9gDietary Fibre 1.9gProtein 7.6g
Vitamin A 2272mcgVitamin B6 0.1mgVitamin B12 0.2mcgVitamin C 22mgVitamin E 1mcgCalcium 211mgMagnesium 14mgIron 1mg
Pasta Salad
A colourful pasta salad full of flavour.
Ingredients include:Penne pastaItalian salad dressingGreen pepperWhite onionsTomatoCucumberBlack olivesParmesan cheeseSaltPepperGarlic powder
UTS: Marketing, Concepts & Applications (24746) Page 28.05.2004 79
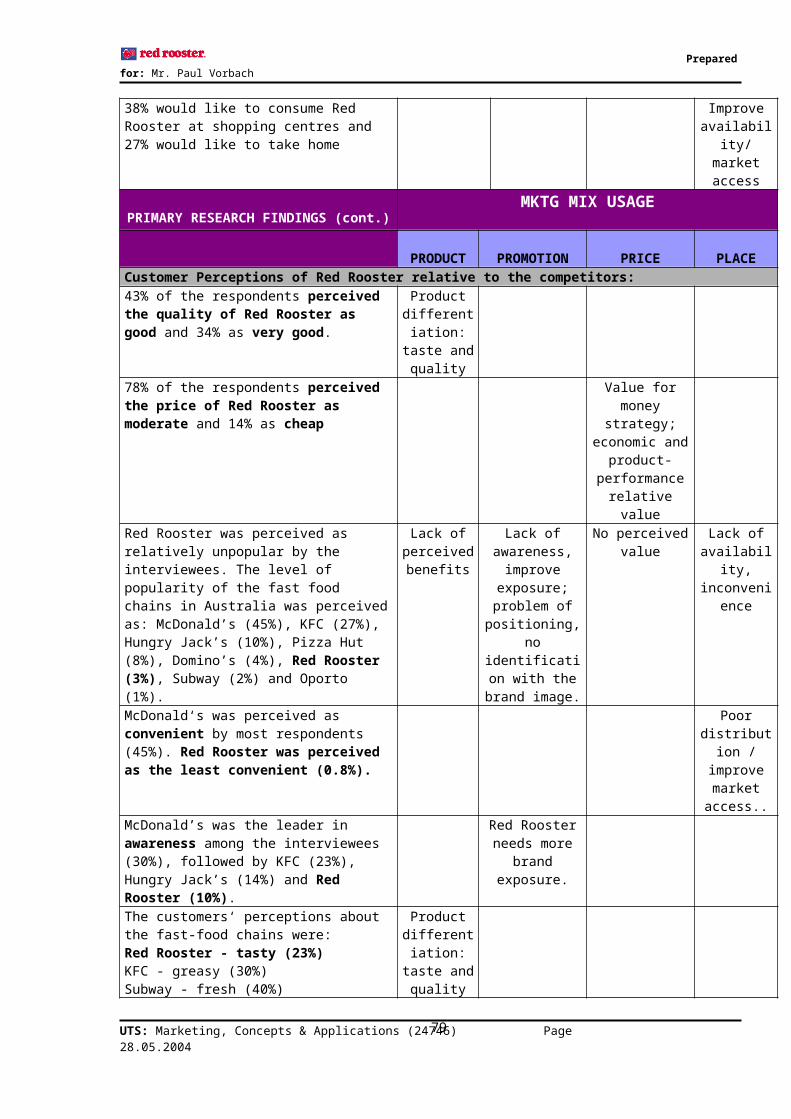
Prepared for: Mr. Paul Vorbach
Methods of Preparation:1. Boil pasta, drain well.2. Chop all vegetables and place them together.3. Mix pasta in with vegetables.4. Add both cheeses, mix well.5. Add salad dressing.
Nutrition Facts:
Calories 159Calories from Fat 92Amount Per Serving 1
Total Fat 10.3gSaturated Fat 5.7gPolyunsat. Fat 0.4gMonounsat. Fat 3.7g
Cholesterol 22mgSodium 665mgPotassium 108mg
Total Carbohydrate 4.6gDietary Fibre 1.1gProtein 12.5g
Vitamin A 420mcgVitamin B6 0.1mgVitamin B12 0.4mcgVitamin C 18mgVitamin E 0mcgCalcium 415mgMagnesium 20mgIron 0mg
Greek Salad
A delicious salad that is absolutely healthy.
Ingredients include:Boiling potatoesGreen bell pepperParsleyGreen onionsSalad dressingHead of lettuceWatercressTomatoesCucumberAvocadoFeta cheeseBeetsGreek olives
UTS: Marketing, Concepts & Applications (24746) Page 28.05.2004 80

Prepared for: Mr. Paul Vorbach
Methods of Preparation:1. Boil potatoes in skins for 30 minutes.2. Drain, cool and cut into slices.3. Add peppers, onions and parsley.4. Fold in salad dressing and lightly salt if wanted.5. 1 head of lettuce shredded, saving the good outer leaves 12 sprigs of watercress, 2 tomatoes cut
into 12 wedges, 1 cucumber cut into 8 fingers, 1 avocado cut into 8 wedges, 4 portions of Feta cheese, 1 green pepper cut into 8 rings, 4 slices of cooked 4 anchovy fillets, 12 Greek olives, 12 Salonika peppers, 4 radishes cut into rosettes, 4 whole green onions.
6. Place the 3 cups of potato salad in a mound in the centre of the lettuce. Cover with the remaining shredded lettuce, mounding it up high.
7. Arrange the watercress on top.8. Place the tomato wedges around the bottom outer edge of the lettuce. Place the cucumber fingers
in-between the tomatoes standing upright on the lettuce. Put avocado around the same way so you have tomato, cucumber, avocado repeating all round.
9. Place the 4 fetas around the top in a circle. Add the beets on the feta on the beet. Place the anchovy on top of the beet/feta.
10. Place the olives, peppers, green onions.11. Dressing 1/4 cup white vinegar 1/4 cup olive oil 1/4 cup vegetable oil oregano Blend the two oils.12. Sprinkle the entire salad with the vinegar then with the blended oils.13. Sprinkle oregano all over.14. Ready to be served.
Nutrition Facts:
Calories 809Calories from Fat 537Amount Per Serving 1
Total Fat 59.8gSaturated Fat 36.2gPolyunsat. Fat 3.3gMonounsat. Fat 16.6g
Cholesterol 229mgSodium 2797mgPotassium 1110mg
Total Carbohydrate 34.6gDietary Fibre 7.3gProtein 38.9g
Vitamin A 3331mcgVitamin B6 1.6mgVitamin B12 4.0mcgVitamin C 162mgVitamin E 2mcgCalcium 1210mgMagnesium 104mgIron 3mg
UTS: Marketing, Concepts & Applications (24746) Page 28.05.2004 81
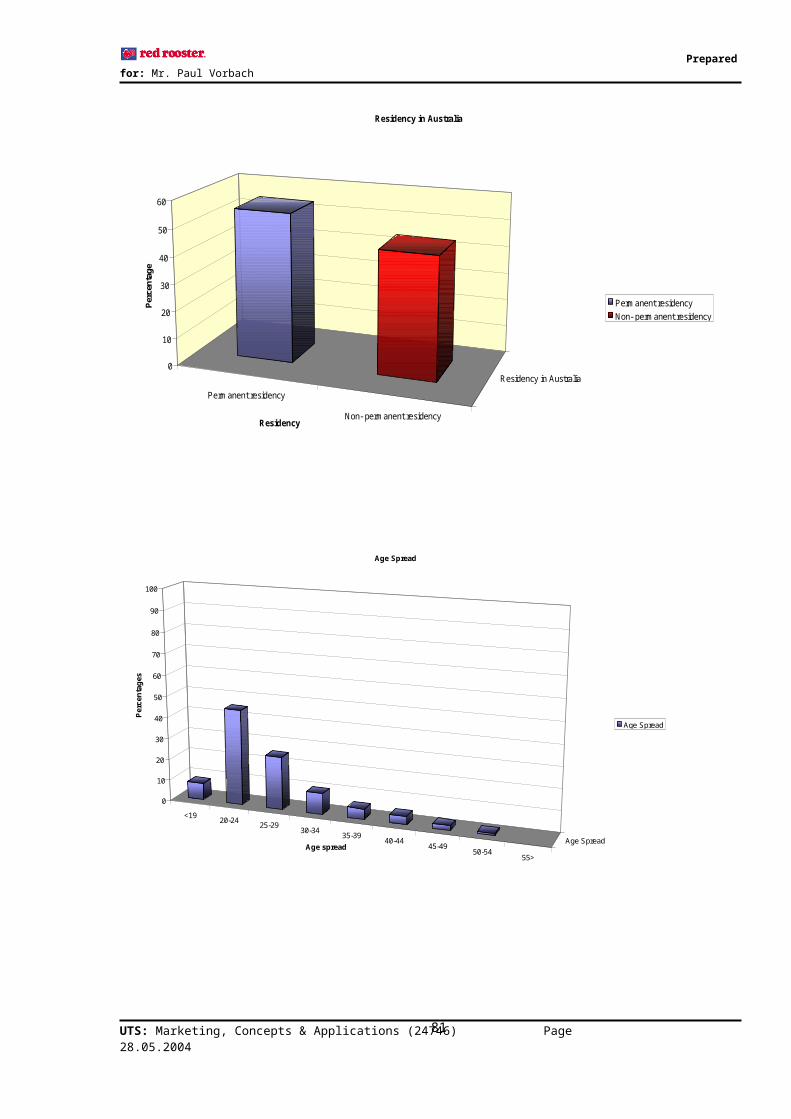
Prepared for: Mr. Paul Vorbach
Appendix No. 23 Franchise InformationFRANCHISE ACTIVITYRed Rooster first opened in Western Australia in 1972. From its humble beginnings it has grown to become Australia's largest BBQ Chicken operator providing their customers with Australia's favourite BBQ chicken, great chicken burgers, subs, wraps and Kids meals and the best chips in the land.
Red Rooster is spreading its franchise network to regional New South Wales, Victoria and South Australia plus the new markets of Tasmania and New Zealand with an aim to add a further 150 outlets in Australia. This expansion presents fantastic opportunities for single and Multi-Site Franchise operators who have the energy, commitment and skill to share in the potential rewards on offer.
FINANCIAL DETAILSCAPITAL REQUIRED: Approximately $500,000-550,000.ROYALTY: 5% gross sales. ADVERTISING LEVY: 5% of gross sales.
FRANCHISOR SUPPORTIncludes assistance finding suitable store location, assistance in negotiating contracts and lease arrangements, turnkey approach to store construction, design and fit out, extensive twelve week training program and access to all Operation Manuals, Videos and associated material with ongoing updates, assistance with planning the opening and successful running of your store, ongoing support including performance and operational evaluation, management of advertising funds to maximize outcomes and assist you with planning local marketing ideas and activities.
CONTACTAlan Tulloch, National Franchise Manager15 Dalmore Drive, Scoresby Victoria Australia 3179PHONE: (03) 9237 8779, 0409 333 303 FAX: (03) 9763 0430EMAIL: [email protected]: WWW.RED-ROOSTER.COM.AU
Appendix No. 24: Total Media Spend in Australia by QSRs
AUD$ 000’sFranchise TV
SpendPress Magazines Radio Cinema Outdoor Total % of total
spend
Pizza Hut 3794 10 0 7 0 6 3818 4%Pizza Haven 389 2 0 1 0 0 392 0%Dominos 5310 21 0 13 0 0 5344 6%
UTS: Marketing, Concepts & Applications (24746) Page 28.05.2004 82

Prepared for: Mr. Paul Vorbach
Eagle Boys Pizza 1192 6 0 0 0 3 1201 1%Subway 3938 153 43 340 42 398 4913 5%KFC 15861 26 0 334 14 259 16493 18%Red Rooster/Chicken Treat
7091 5 21 258 0 78 7453 8%
Nandos 20 0 0 115 0 0 135 0%McDonalds 18481 474 187 2947 481 993 23563 26%Hungry Jacks/Burger King
10014 49 91 37 0 134 10325 11%
Taco Bell 730 0 0 58 0 0 788 1% 66820 746 342 4110 537 1871 Other 16709 18% Total 91134
(ACNielson 2003)
Appendix No. 25: Work Breakdown Structure and Gantt Chart
WBS Activity Owner Success Criteria
Finish Date
1 Implementation project plan 4-Mar-04
1.1 Sponsoring the Project 18-Feb-04
1.1.1 Create project Charter Management Charter created 16-Feb-04
1.1.1 Obtain management commitment ManagementManagement commitment obtained.
18-Feb-04
1.2 Defining the Project 25-Feb-04
1.2.1 Understand objectives and plan defining activities Project Manager 19-Feb-
041.2.2 Develop project scope, deliverables and criteria Project Manager 20-Feb-
UTS: Marketing, Concepts & Applications (24746) Page 28.05.2004 83
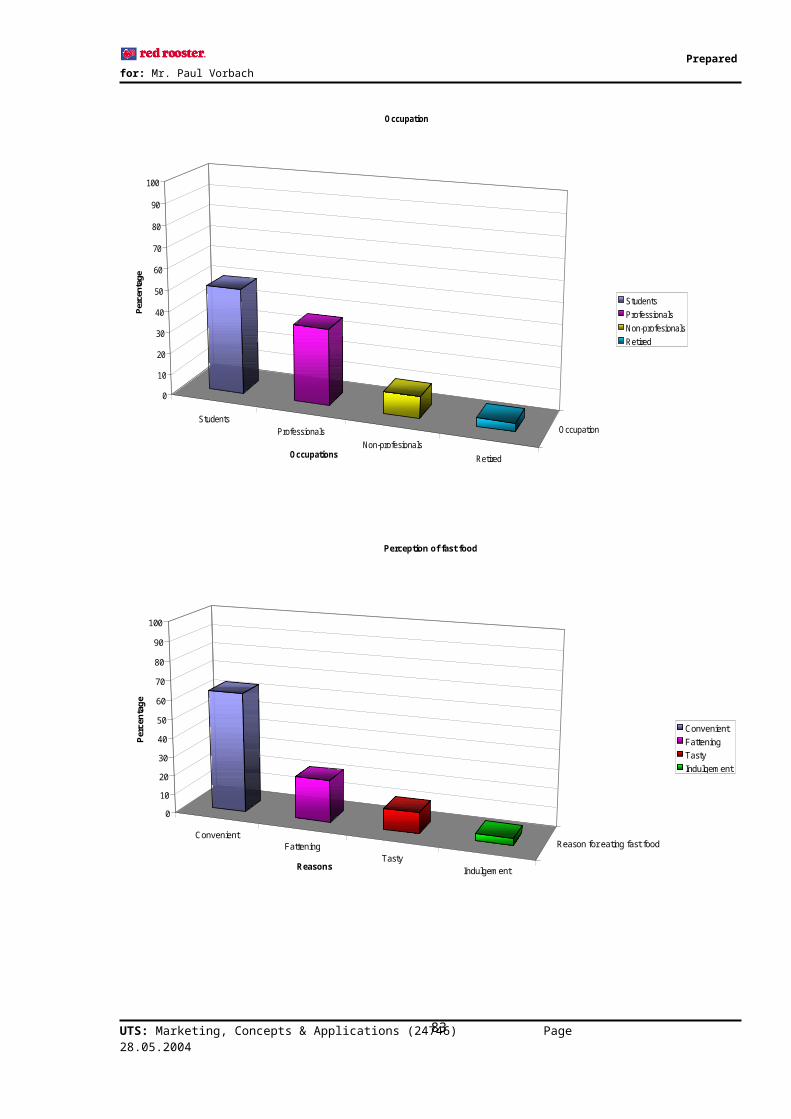
Prepared for: Mr. Paul Vorbach
for success 04
1.2.3 Conduct pre-study of project plan effectiveness Project Manager 22-Feb-04
1.2.5 Assess project plan effectiveness Project Manager 25-Feb-04
1.3 Project Management Plan 4-Mar-04
1.3.1 Define and develop project organisational work units Project Manager 26-Feb-
04
1.3.2 Develop project working units and scheduling tasks. Project Manager 28-Feb-
04
1.3.3 Conduct of risk assessment Project Manager All risk aspect covered
1-Mar-04
1.3.4 Integrate project organisation unit budgets Project Manager Project budget approved
2-Mar-04
1.3.5 Finalise Project Plan Project Manager Project plan approved
4-Mar-04
2 Development of goods and services criteria 22-Mar-04
2.1.2 Set up Menu criteria Marketing Manager 6-Mar-
04
2.1.3 Setting quality specifications for meals R&D/ Marketing 9-Mar-04
2.1.4 Determination of production process R&D/ Marketing 13-Mar-04
2.1.5 Determination of production equipments R&D/ Marketing 14-Mar-04
2.1.4 Setting quality specifications for meals R&D/ Marketing 18-Mar-04
2.1.5 Create Franchise operation system R&D/ Marketing 20-Mar-04
2.1.6 Setting code of practice and service specification R&D/ Marketing 22-Mar-
04
3 Employees and Reward developments 28-May-04
3.1 Employees developments 28-May-04
3.1.1 Recruitments of new employees and Franchisers HR / Franchise 30-Mar-
04
3.1.2 Determine employees job analysis and job design HR Job analysis and
design finalise31-Mar-04
3.1.3 Conduct Training on current employees and Franchisers HR / Franchise 21-Apr-
04
3.1.4 Conduct Training on new employees and Franchisers HR / Franchise 30-Apr-
04
3.1.5 Practical assessments on all employees and Franchisers HR / Franchise All staff meet
required criteria28-May-04
3.2 Develop Reward System 14-May-04
3.2.1 Develop employees performance criteria HR. Dept 20-Mar-04
3.2.2 Develop employees reward system HR. Dept 12-Apr-04
3.2.3 Integration with overall organisation units HR. Dept 14-May-04
4 Development of Sales Distribution Channels 14-May-04
UTS: Marketing, Concepts & Applications (24746) Page 28.05.2004 84
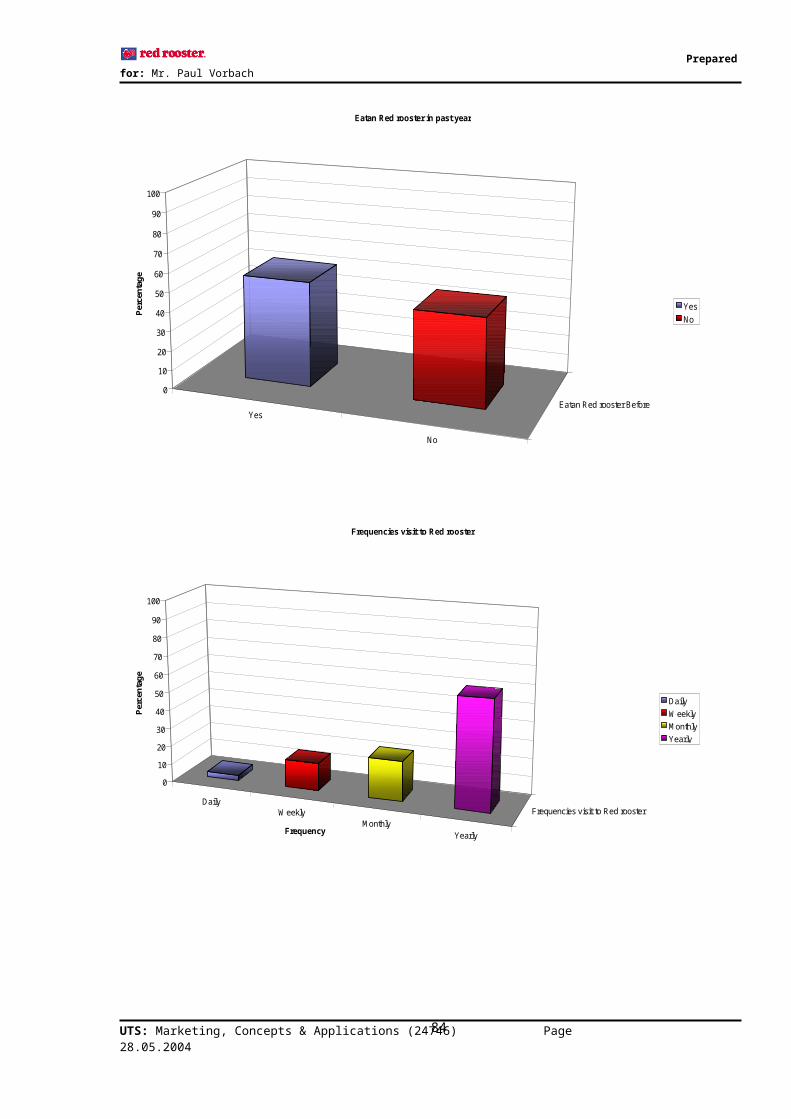
Prepared for: Mr. Paul Vorbach
4.1.1 Activate negotiation with possible property channel
Development Dept 31-Mar-
04
4.1.2 Secure contractual strategic shop units Development Dept
Agreement secured
23-Apr-04
4.1.3 Secure contractual potential Franchiser Development Dept
Agreement secured
23-Apr-04
4.1.4 Prepare shop units for business Development Dept
Meeting required date
14-May-04
5 Development of Systematic Supply Process 17-May-04
5.1.1 Develop contractual agreement with suppliers Purchase/ supply Dept
Agreement secured
31-Mar-04
5.1.2 Develop systematic supply and logistic line Purchase/ supply Dept
Having a systematic process in line
24-Mar-04
5.1.3 Create proper restaurant order process Purchase/ supply Dept
Includes all relevant procedure
23-Apr-04
5.1.4 Assess and validate supply line effectiveness Purchase/ supply Dept 17-May-
04
6 Development of Price Strategy 22-May-04
6.1.1 Assess profitable margin Finance Dept 31-Mar-04
6.1.2 Work out cost of marketing campaign Finance Dept Budget approved
14-Mar-04
6.1.3 Determination of Pay back years and ROI Finance Dept Work out required return
8-May-04
6.1.4 Determination of price Finance Dept 22-May-04
7 Development of Promotion Campaign 31-May-04
7.1 Webpage Restructure MIS Dept 24-May-04
7.1.1 Web page updates MIS Dept 4-Apr-04
7.1.2 Develop forum, memberships and feedback channels MIS Dept 30-Apr-
04
7.1.3 Design initiation MIS Dept Design approved
15-May-04
7.1.4 Assess and validation MIS DeptAll relevant work is carried out
24-May-04
7.2 Advertising campaign 31-May-04
7.2.1 Negotiation advertising concepts with media Marketing Manager 30-Mar-
04
7.2.2 Secure and implement advertising campaign Marketing Manager
All advertising work in place
31-May-04
7.2.3 Design of memberships and Free meal card Marketing Manager 17-Mar-
04
8 Product Launch 31-May-04
3.8.1 Commence sales Project Manager 31-May-04
3.8.4 Commence market performance assessment Project Manager 31-May-04
9 Engagement Close To
UTS: Marketing, Concepts & Applications (24746) Page 28.05.2004 85

Prepared for: Mr. Paul Vorbach
confirm
9.1 Confirm Engagement (PSI) To confirm
9.1.1 Perform project completion process Project Manager To confirm
9.1.2 Reconcile project financials Project Manager To confirm
9.2 Closing the Project To confirm
9.2.1 Release staff Project Manager To confirm
9.2.2 Manage end of project Project Manager To confirm
UTS: Marketing, Concepts & Applications (24746) Page 28.05.2004 86