view/download presentation slides
TRANSCRIPT
Oncology Dose Finding Workshop
June 13, 2016
Walter E. Washington Convention Center
Washington, DC

Welcome and Workshop Objectives
Workshop Co-Chairs: Geoffrey Kim, MD Amy McKee, MD
Pasi Jänne, MD, PhD Eric Rubin, MD
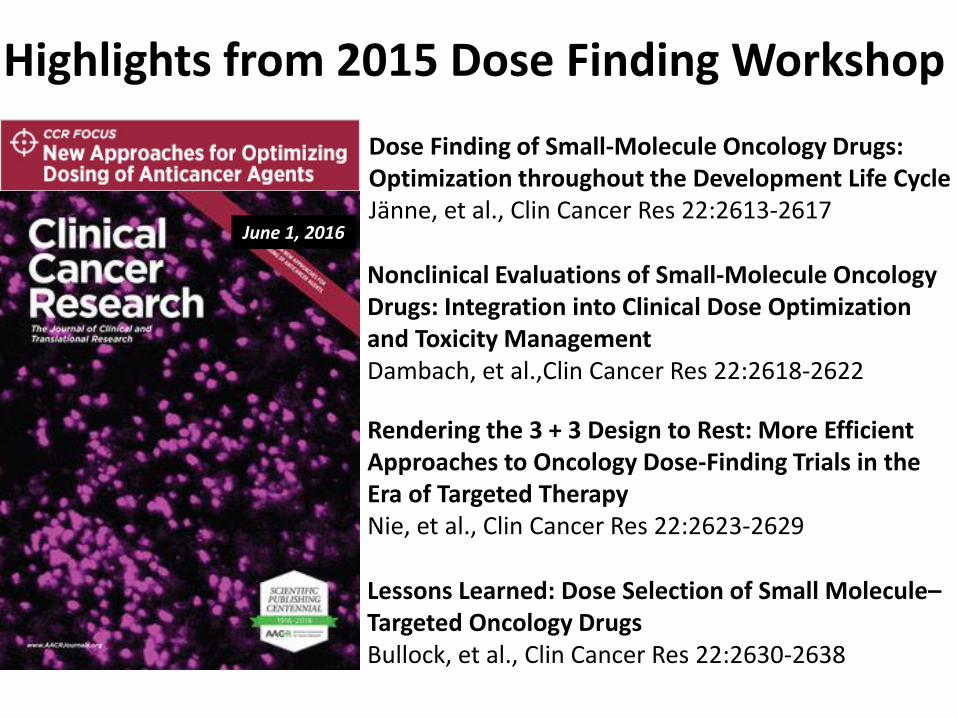
Dose Finding of Small-Molecule Oncology Drugs: Optimization throughout the Development Life Cycle Jänne, et al., Clin Cancer Res 22:2613-2617
Nonclinical Evaluations of Small-Molecule Oncology Drugs: Integration into Clinical Dose Optimization and Toxicity Management Dambach, et al.,Clin Cancer Res 22:2618-2622
Rendering the 3 + 3 Design to Rest: More Efficient Approaches to Oncology Dose-Finding Trials in the Era of Targeted Therapy Nie, et al., Clin Cancer Res 22:2623-2629
Lessons Learned: Dose Selection of Small Molecule– Targeted Oncology Drugs Bullock, et al., Clin Cancer Res 22:2630-2638
June 1, 2016
Highlights from 2015 Dose Finding Workshop
Session I Exposure-Response Relationships and Modeling/Simulation for Dose Finding
Chair: Geoffrey Kim, MD
Speakers: Dinesh De Alwis, PhD Shruti Agrawal, PhD Chyi-Hung Hsu, PhD
Diane Wang, PhD Gabriel Helmlinger, MD, PhD
Panelists: Kelvin Dickenson
Jin Jin, PhD Sumithra Mandrekar, PhD
Lillian Siu, MD Yaning Wang, PhD
5
Optimal Dosing for Targeted
Therapies in Oncology: A focus on
the development of Pembrolizumab.
Dinesh de Alwis, PhD
Quantitative Pharmacology and
Pharmacometrics. Merck
.
6
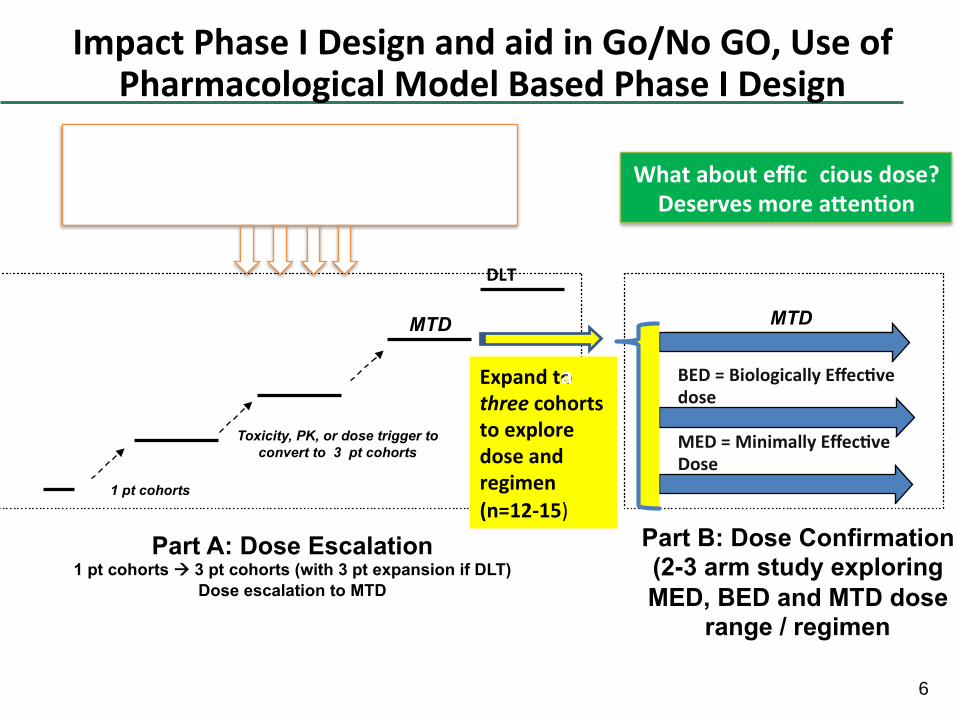
Alla en ononfindingMTD!3+3,CRM,mCRM,TITE-CRM,accelerated
tra on,…
ImpactPhaseIDesignandaidinGo/NoGO,UseofPharmacologicalModelBasedPhaseIDesign
MTD
Part A: Dose Escalation 1 pt cohorts à 3 pt cohorts (with 3 pt expansion if DLT)
Dose escalation to MTD
Part B: Dose Confirmation (2-3 arm study exploring
MED, BED and MTD dose range / regimen
MTD
1 pt cohorts
Toxicity, PK, or dose trigger to
convert to 3 pt cohorts
Expandtothreecohortstoexploredoseandregimen
(n=12-15)
BED=BiologicallyEffec vedose
MED=MinimallyEffec veDose
DLT
Whatabouteffic
a
ciousdose?Deservesmorea en on
7
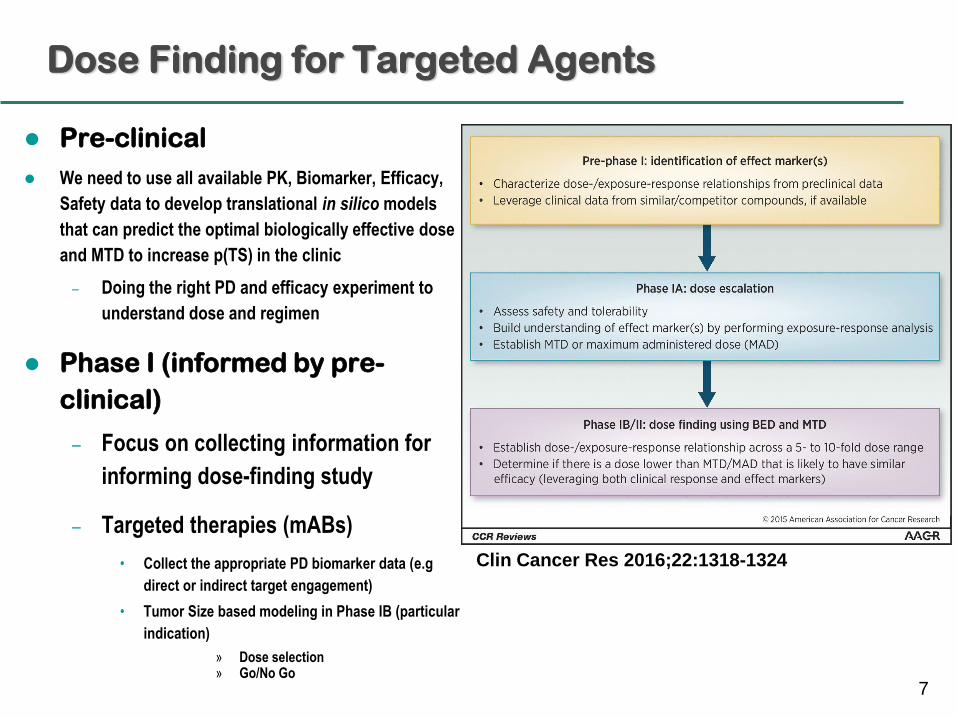
Dose Finding for Targeted Agents
Pre-clinical
We need to use all available PK, Biomarker, Efficacy,
Safety data to develop translational in silico models
that can predict the optimal biologically effective dose
and MTD to increase p(TS) in the clinic
– Doing the right PD and efficacy experiment to
understand dose and regimen
Phase I (informed by pre-
clinical)
– Focus on collecting information for
informing dose-finding study
– Targeted therapies (mABs)
• Collect the appropriate PD biomarker data (e.g
direct or indirect target engagement)
• Tumor Size based modeling in Phase IB (particular
indication)
» Dose selection » Go/No Go
Clin Cancer Res 2016;22:1318-1324
8
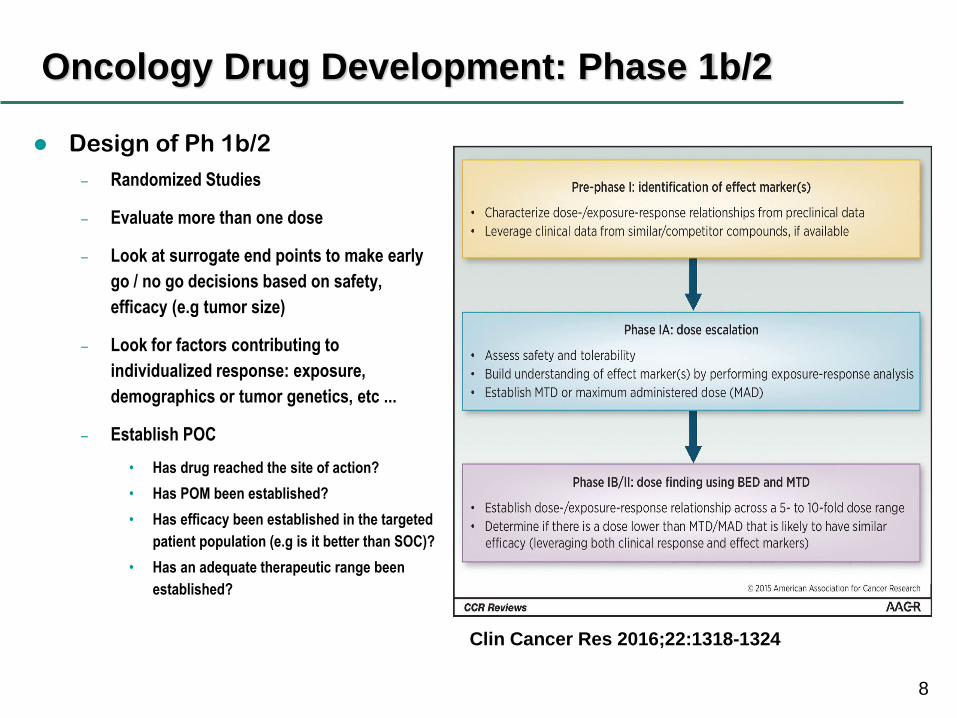
Oncology Drug Development: Phase 1b/2
Design of Ph 1b/2
– Randomized Studies
– Evaluate more than one dose
– Look at surrogate end points to make early
go / no go decisions based on safety,
efficacy (e.g tumor size)
– Look for factors contributing to
individualized response: exposure,
demographics or tumor genetics, etc ...
– Establish POC
• Has drug reached the site of action?
• Has POM been established?
• Has efficacy been established in the targeted
patient population (e.g is it better than SOC)?
• Has an adequate therapeutic range been
established?
Clin Cancer Res 2016;22:1318-1324
9
KEYTRUDA®
(MK-3475, pembrolizumab)
Case Study
.
10
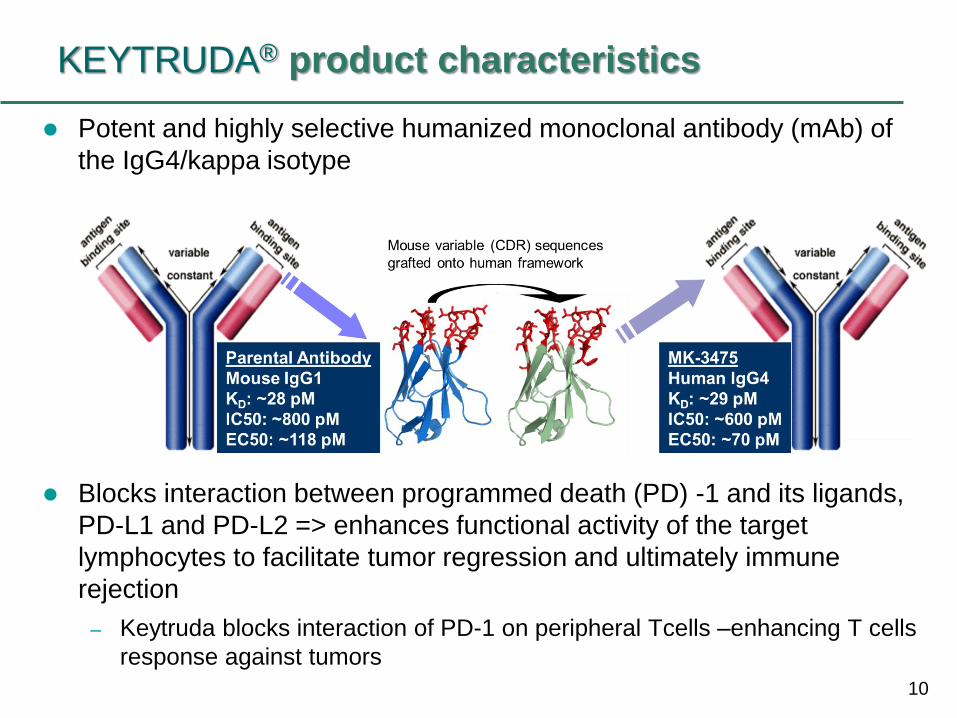
KEYTRUDA® product characteristics
Potent and highly selective humanized monoclonal antibody (mAb) of
the IgG4/kappa isotype
Blocks interaction between programmed death (PD) -1 and its ligands,
PD-L1 and PD-L2 => enhances functional activity of the target
lymphocytes to facilitate tumor regression and ultimately immune
rejection
– Keytruda blocks interaction of PD-1 on peripheral Tcells –enhancing T cells
response against tumors
11
Initiation of KEYTRUDA® Clinical Program
Preclinical data suggested that KEYTRUDA® would
have anti-tumor activity in multiple cancers
US IND was opened on Jan 7, 2011
– A Phase I Study of Single Agent MK-3475 in Patients with
Progressive Locally Advanced or Metastatic Carcinomas and
Melanoma (Protocol 001)
• Initial intent was to define DLT, characterize PK, and establish POC
12
Part A: FIH Dose Escalation and PK/PD Evaluation
Part A-1 dose escalation study
– Objectives:
• To define DLT, MTD (Maximum Administered Dose), and characterize PK
– Design:
• Open label, non randomized traditional 3+3 dose escalation followed by a
small expansion cohort n~32
– 1mg/kg Q2W 3 mg/kg Q2W 10 mg/kg Q2W
– Results
• No DLT at tested doses
• Objective response in 2 out of 3 first melanoma patients
– First response at 3 mg/kg Q2W in melanoma
• Based on a strong activity signal, amendment was issued to
expand melanoma cohort
– 10 mg/kg Q2W (MAD) selected as the first dose
13
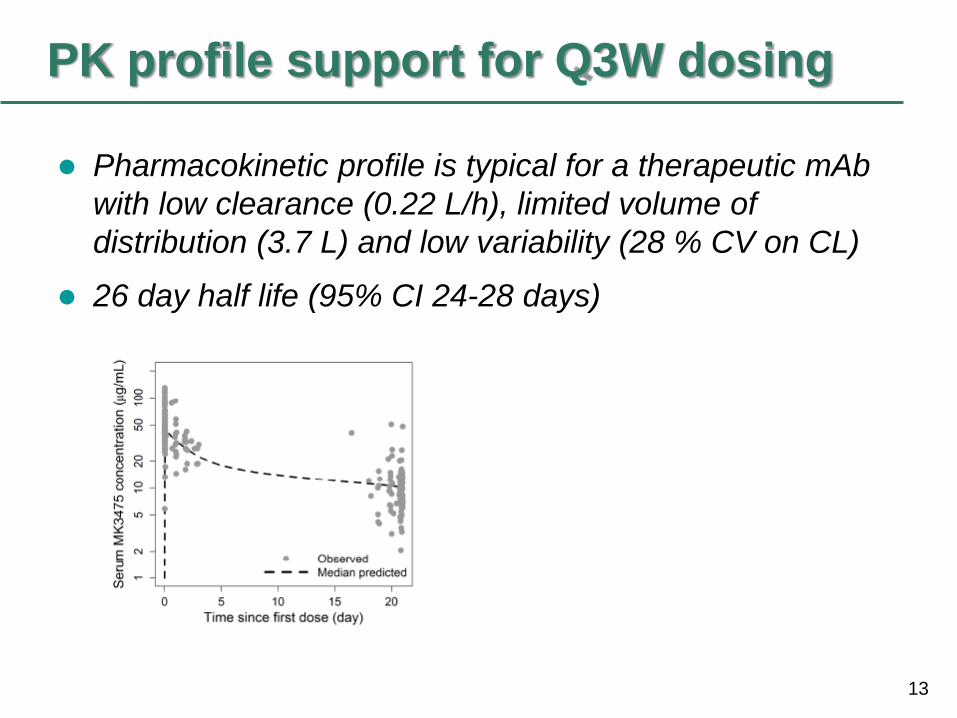
PK profile support for Q3W dosing
Pharmacokinetic profile is typical for a therapeutic mAb
with low clearance (0.22 L/h), limited volume of
distribution (3.7 L) and low variability (28 % CV on CL)
26 day half life (95% CI 24-28 days)
14
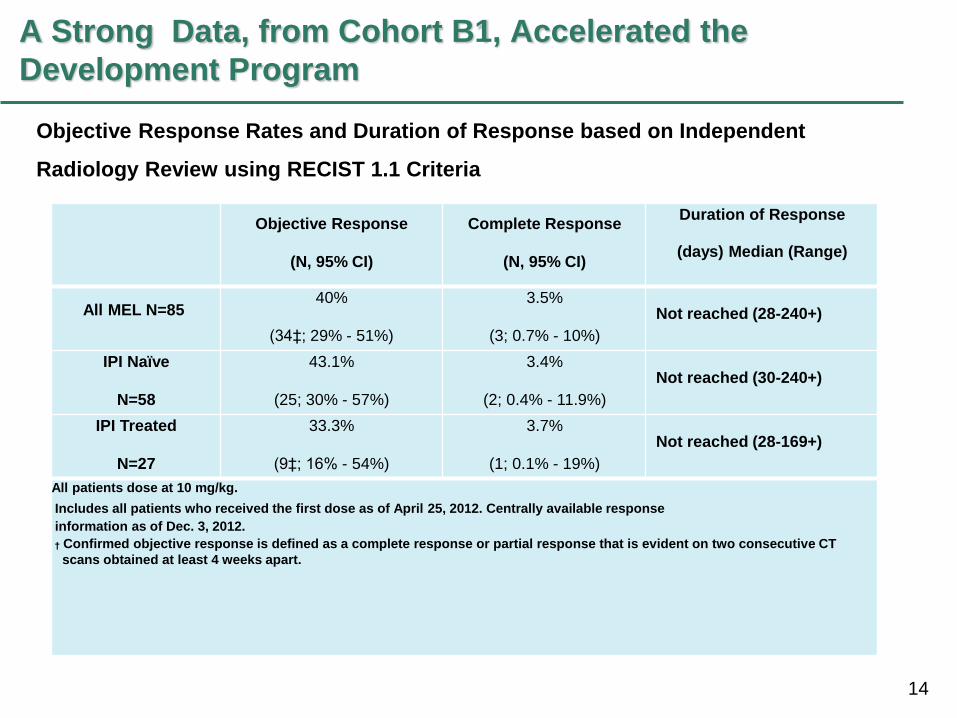
A Strong Data, from Cohort B1, Accelerated the
Development Program
Objective Response
(N, 95% CI)
Complete Response
(N, 95% CI)
Duration of Response
(days) Median (Range)
All MEL N=85 40%
(34‡; 29% - 51%)
3.5%
(3; 0.7% - 10%)
Not reached (28-240+)
IPI Naïve
N=58
43.1%
(25; 30% - 57%)
3.4%
(2; 0.4% - 11.9%)
Not reached (30-240+)
IPI Treated
N=27
33.3%
(9‡; 16% - 54%)
3.7%
(1; 0.1% - 19%)
Not reached (28-169+)
All patients dose at 10 mg/kg.
Includes all patients who received the first dose as of April 25, 2012. Centrally available response
information as of Dec. 3, 2012.
† Confirmed objective response is defined as a complete response or partial response that is evident on two consecutive CT
scans obtained at least 4 weeks apart.
Objective Response Rates and Duration of Response based on Independent
Radiology Review using RECIST 1.1 Criteria
15
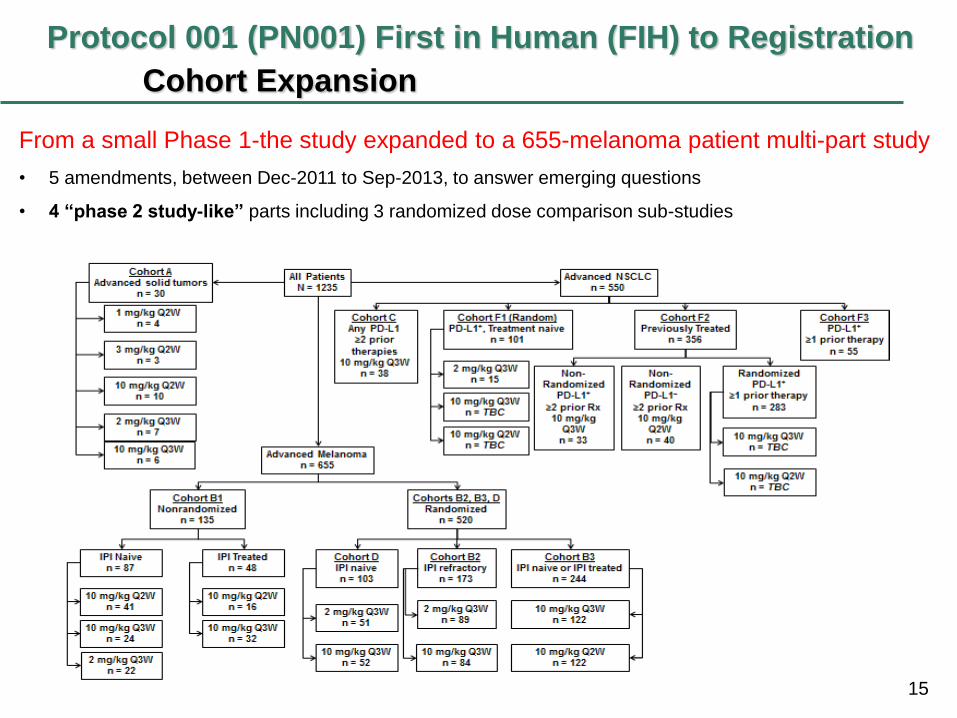
Protocol 001 (PN001) First in Human (FIH) to Registration
Cohort Expansion
From a small Phase 1-the study expanded to a 655-melanoma patient multi-part study
• 5 amendments, between Dec-2011 to Sep-2013, to answer emerging questions
• 4 “phase 2 study-like” parts including 3 randomized dose comparison sub-studies
16
Defining a dose range for the pivotal B2 cohort
Part A-2 dose expansion study
– Objectives:
• To evaluate PK/PD of Q3W dosing schedule
• Intra-patient dose escalation to explore PK PD of
KEYTRUDA® in 0.005 to 10 mg/kg Q3W
– Basis for translational PK/PD to define the efficacious
dose of 2 mg/kg Q3W
– Patients were escalated in 3 steps (at days 1, 8 and 22)
from low (0.005 to 0.06 mg/kg) to high doses (2 and
10mg/kg)
– Ex vivo IL-2 assay developed
» No IL-2 release from lymphocytes with activated PD-1 pathway
» SEB causes release, further enhanced by pembrolizumab effect on
PD-1
17
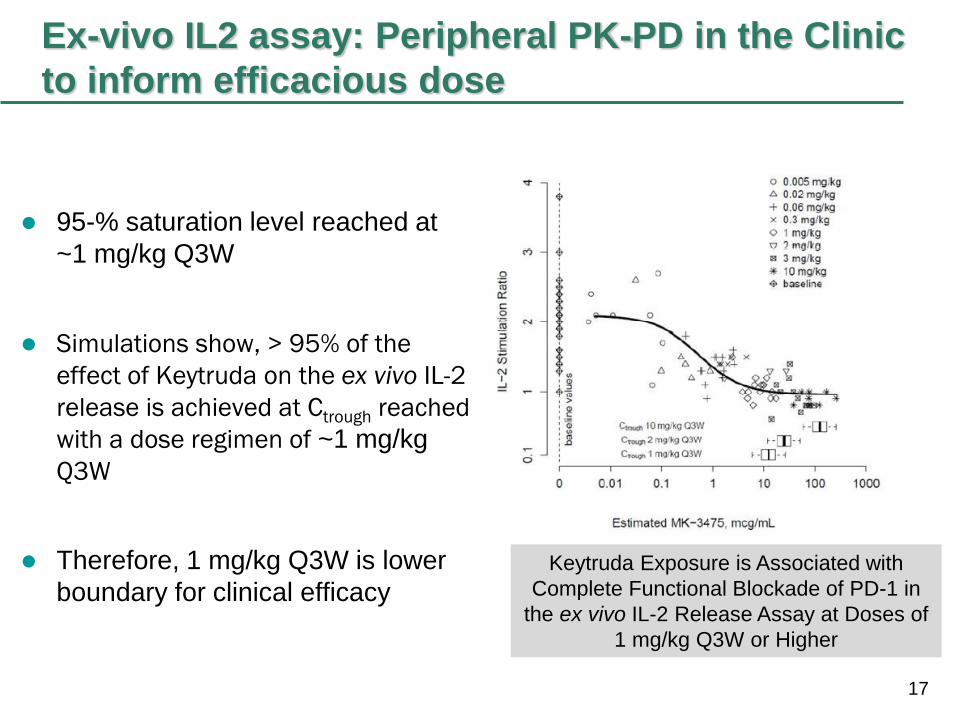
Ex-vivo IL2 assay: Peripheral PK-PD in the Clinic
to inform efficacious dose
95-% saturation level reached at
~1 mg/kg Q3W
Simulations show, > 95% of the
effect of Keytruda on the ex vivo IL-2
release is achieved at Ctrough reached
with a dose regimen of ~1 mg/kg
Q3W
Therefore, 1 mg/kg Q3W is lower
boundary for clinical efficacy
Keytruda Exposure is Associated with
Complete Functional Blockade of PD-1 in
the ex vivo IL-2 Release Assay at Doses of
1 mg/kg Q3W or Higher
18
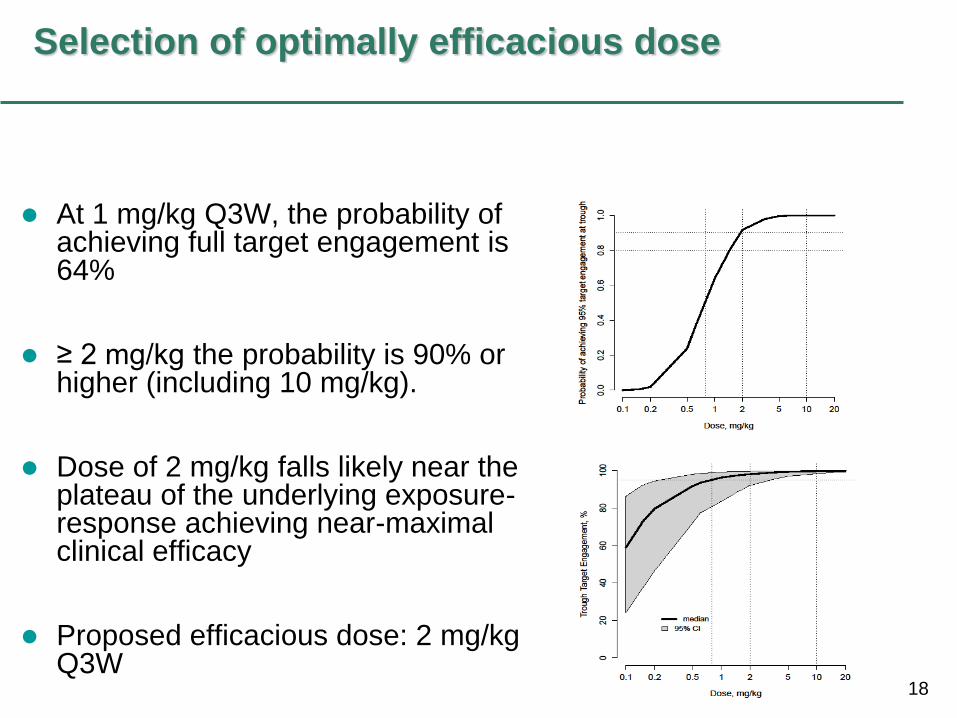
Selection of optimally efficacious dose
At 1 mg/kg Q3W, the probability of achieving full target engagement is 64%
≥ 2 mg/kg the probability is 90% or higher (including 10 mg/kg).
Dose of 2 mg/kg falls likely near the plateau of the underlying exposure-response achieving near-maximal clinical efficacy
Proposed efficacious dose: 2 mg/kg Q3W
19
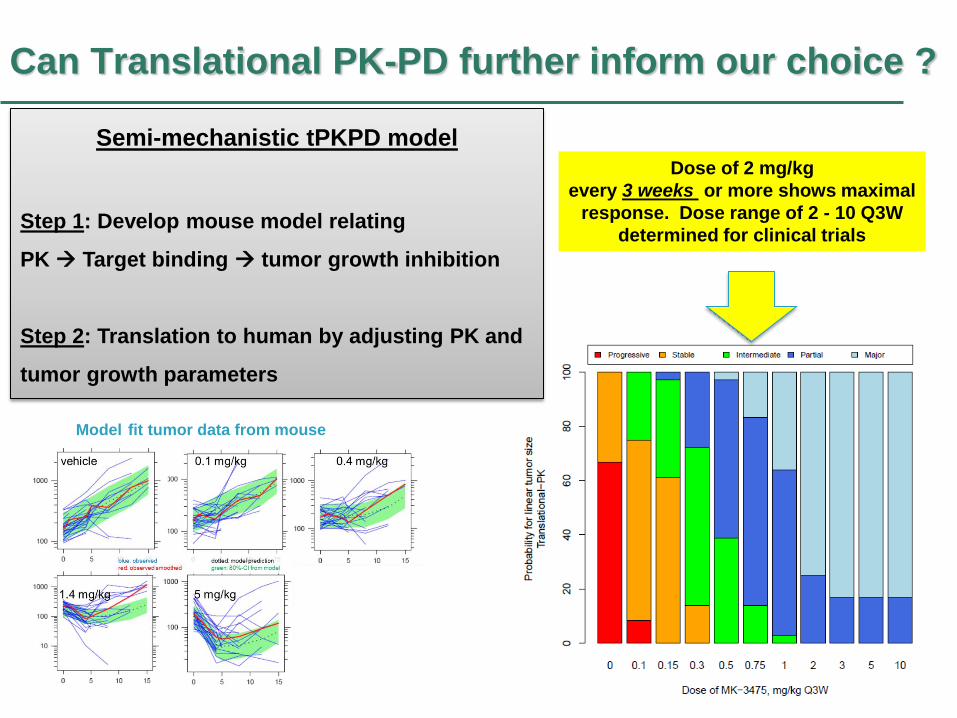
Can Translational PK-PD further inform our choice ?
Model fit tumor data from mouse
Dose of 2 mg/kg
every 3 weeks or more shows maximal
response. Dose range of 2 - 10 Q3W
determined for clinical trials
Semi-mechanistic tPKPD model
Step 1: Develop mouse model relating
PK Target binding tumor growth inhibition
Step 2: Translation to human by adjusting PK and
tumor growth parameters
20
PK-PD modeling guides a critical decision on KEYTRUDA®
Team discussion on what doses to take forward based on results
from non-randomized studies (B1)
– ORR ipi treated 10Q2: 56% > 10Q3: 27%
– ORR ipi naïve 2Q3 : 45%, 10Q3: 37%, 10Q2 :46%
Based on the Translational modeling, ex-
Vivo IL-2 data and observed clinical data,
what dose or doses would you take forward
into B2 pivotal cohort?
21
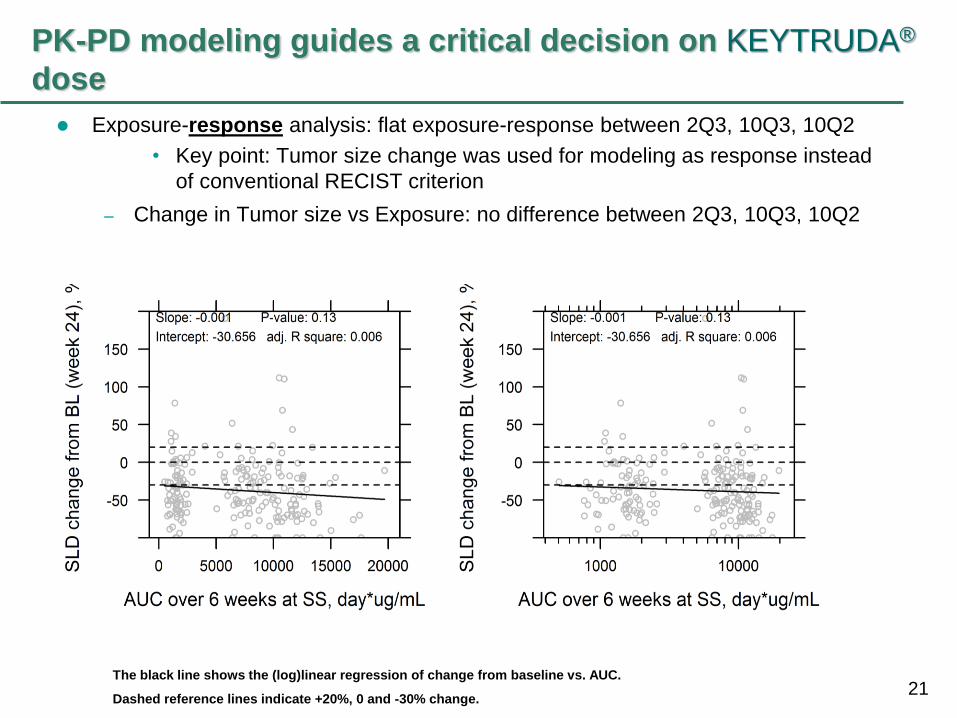
PK-PD modeling guides a critical decision on KEYTRUDA®
dose
Exposure-response analysis: flat exposure-response between 2Q3, 10Q3, 10Q2
• Key point: Tumor size change was used for modeling as response instead
of conventional RECIST criterion
– Change in Tumor size vs Exposure: no difference between 2Q3, 10Q3, 10Q2
The black line shows the (log)linear regression of change from baseline vs. AUC.
Dashed reference lines indicate +20%, 0 and -30% change.
22 22
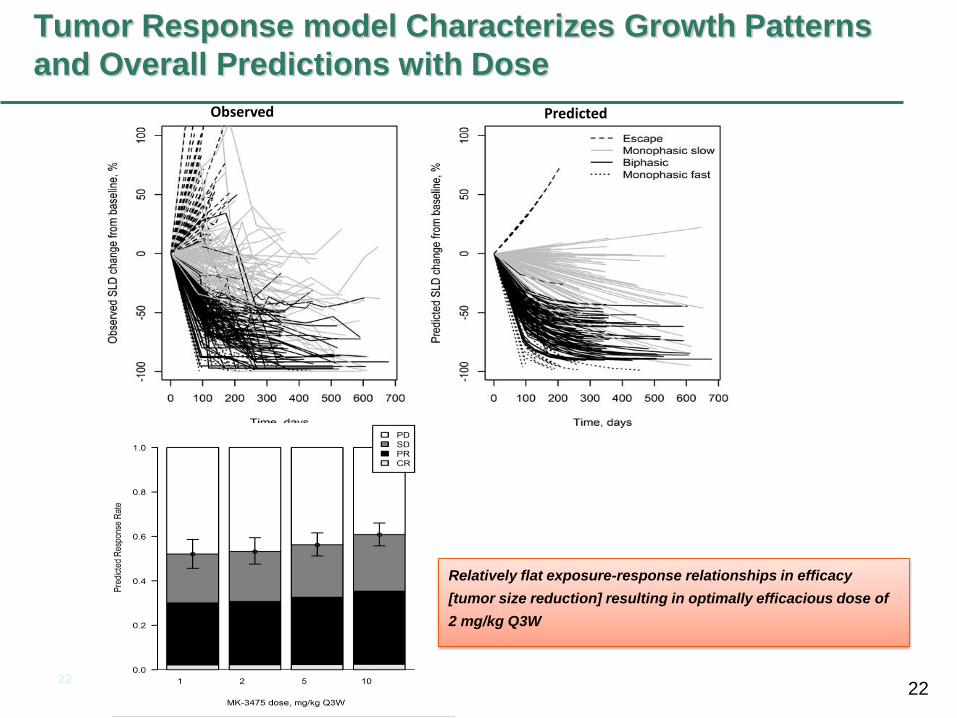
Tumor Response model Characterizes Growth Patterns
and Overall Predictions with Dose
Observed Predicted
Relatively flat exposure-response relationships in efficacy
[tumor size reduction] resulting in optimally efficacious dose of
2 mg/kg Q3W
23
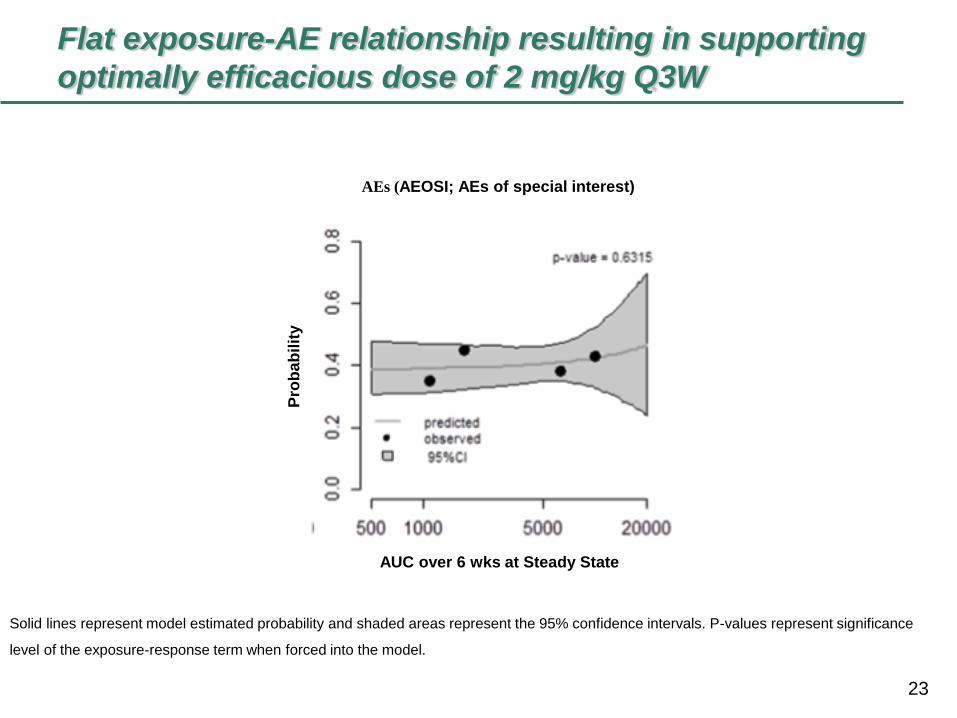
Flat exposure-AE relationship resulting in supporting
optimally efficacious dose of 2 mg/kg Q3W
Solid lines represent model estimated probability and shaded areas represent the 95% confidence intervals. P-values represent significance
level of the exposure-response term when forced into the model.
AEs (AEOSI; AEs of special interest)
AUC over 6 wks at Steady State
Pro
ba
bilit
y
24
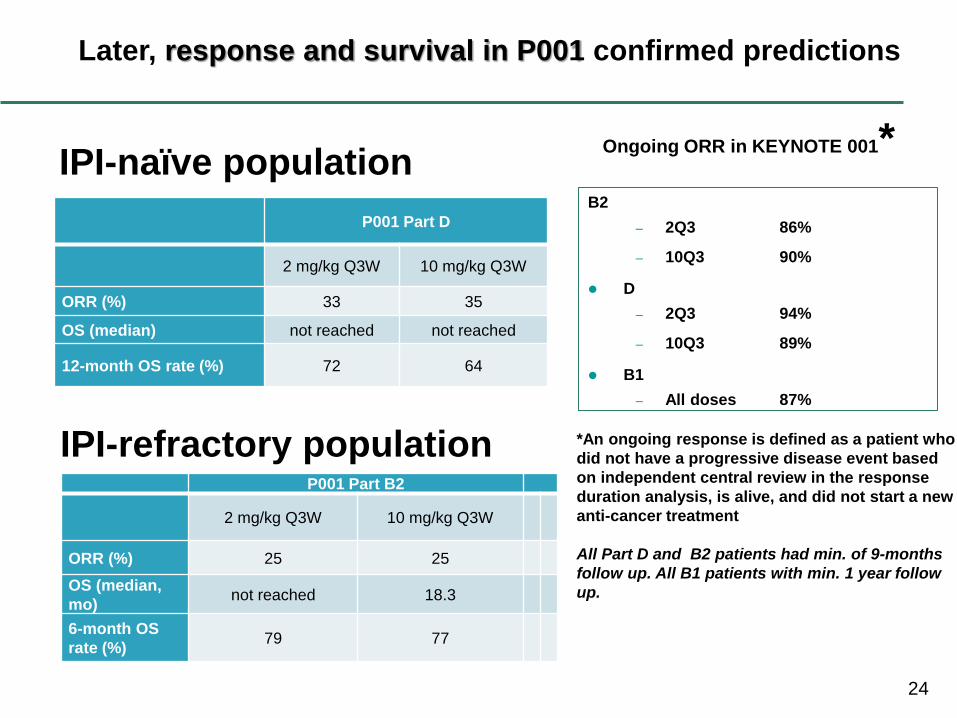
Later, response and survival in P001 confirmed predictions
P001 Part D
2 mg/kg Q3W 10 mg/kg Q3W
ORR (%) 33 35
OS (median) not reached not reached
12-month OS rate (%) 72 64
P001 Part B2
2 mg/kg Q3W 10 mg/kg Q3W
ORR (%) 25 25
OS (median,
mo) not reached 18.3
6-month OS
rate (%) 79 77
IPI-naïve population
IPI-refractory population
B2
– 2Q3 86%
– 10Q3 90%
D
– 2Q3 94%
– 10Q3 89%
B1
– All doses 87%
Ongoing ORR in KEYNOTE 001*
*An ongoing response is defined as a patient who
did not have a progressive disease event based
on independent central review in the response
duration analysis, is alive, and did not start a new
anti-cancer treatment
All Part D and B2 patients had min. of 9-months
follow up. All B1 patients with min. 1 year follow
up.
25
PK/PD Findings supported Development and
Approval
Exposure-Response analysis was key to identifying optimal dose.
A wide therapeutic range was established, based on Exposure-
Response, Exposure-Safety analyses
Approval of KEYTRUDA® based upon positive risk/benefit
– Efficacy based on cohort B2 173 IPI-refractory patients, with 80
patients at the 2 mg/kg recommended dose
Received Accelerated Approval on Sept 4, 2014
Products approved under the accelerated approval regulations, 21 CFR 601.41,
require further adequate and well-controlled studies/clinical trials to verify and
describe clinical benefit.
Two confirmatory trials (P002 (IPI-treated) and P006 (IPI-naïve)) were
conducted to confirm the safety and efficacy of KEYTRUDA
26
Acknowledgements Rik de Greef
Scott Ebbinghaus
Jeroen Elassaiss-Schaap
Peter Kang
Andreas Lindauer
Kapil Mayawala
Khamir Mehta
Alise Reicin
Eric Rubin
Jeff Sachs
V Sriram
Melissa Tice
Chandni Valiathan
Nivolumab Dose Selection: Challenges, Opportunities and Lessons Learned for Cancer
Immunotherapy
Shruti Agrawal, PhD
Outline
- What is cancer immunotherapy?
- Nivolumab monotherapy dose selection
- Effect of disease state on the PK of monoclonal antibodies
- Translational approaches to accelerate immunotherapy development
- Future directions
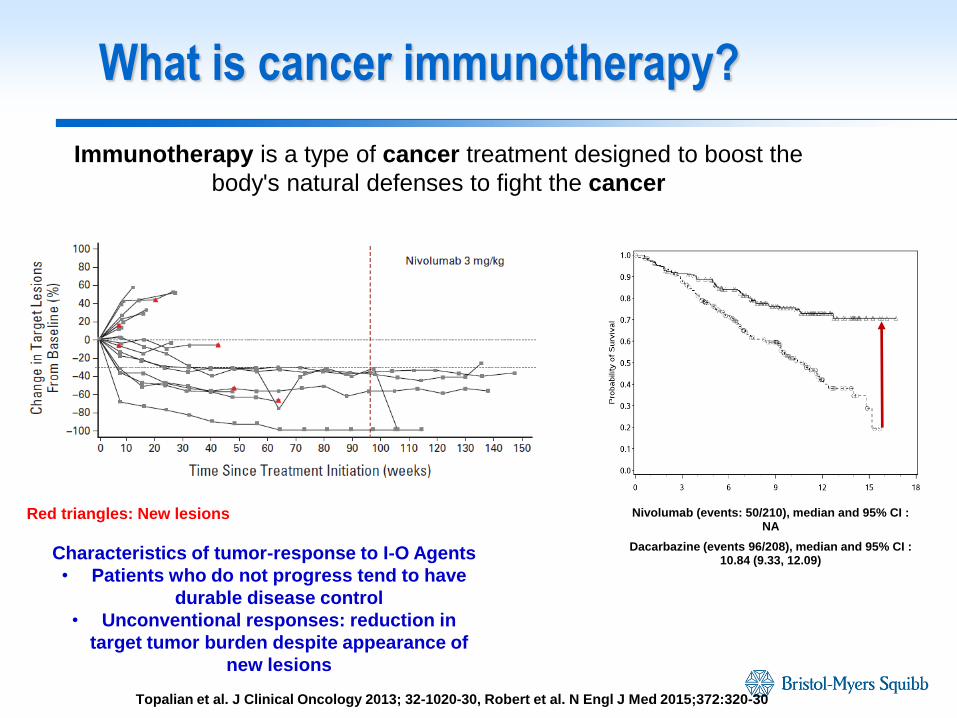
What is cancer immunotherapy?
Immunotherapy is a type of cancer treatment designed to boost the
body's natural defenses to fight the cancer
Nivolumab (events: 50/210), median and 95% CI : NA
Dacarbazine (events 96/208), median and 95% CI : 10.84 (9.33, 12.09)
Topalian et al. J Clinical Oncology 2013; 32-1020-30, Robert et al. N Engl J Med 2015;372:320-30
Red triangles: New lesions
Characteristics of tumor-response to I-O Agents
• Patients who do not progress tend to have
durable disease control
• Unconventional responses: reduction in
target tumor burden despite appearance of
new lesions
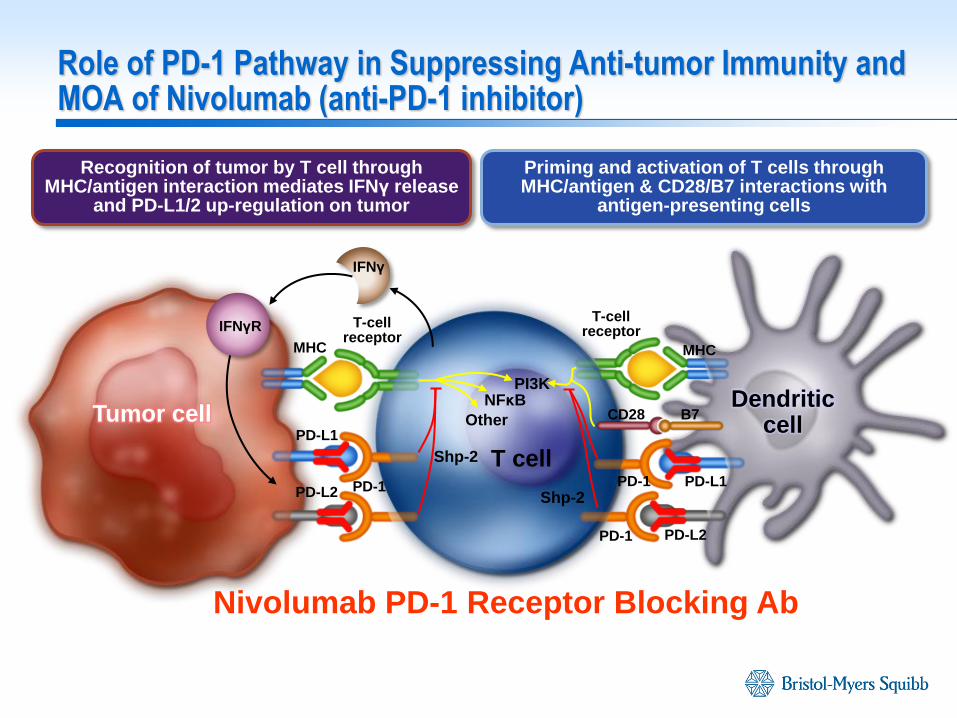
MHC
PD-L1
PD-1 PD-1
PD-1 PD-1
Nivolumab PD-1 Receptor Blocking Ab
Recognition of tumor by T cell through MHC/antigen interaction mediates IFNγ release
and PD-L1/2 up-regulation on tumor
Priming and activation of T cells through MHC/antigen & CD28/B7 interactions with
antigen-presenting cells
T-cell receptor
T-cell receptor
PD-L1 PD-L2
PD-L2
MHC
CD28 B7
T cell
NFκB
Other
PI3K Dendritic
cell Tumor cell
IFNγ
IFNγR
Shp-2
Shp-2
Role of PD-1 Pathway in Suppressing Anti-tumor Immunity and MOA of Nivolumab (anti-PD-1 inhibitor)
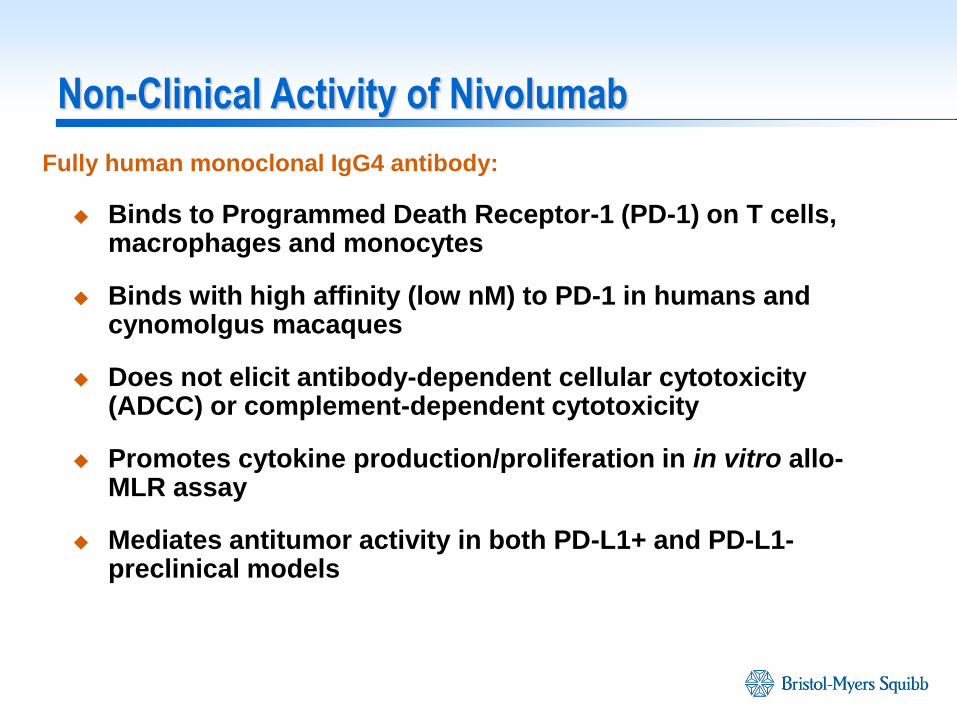
Fully human monoclonal IgG4 antibody:
Binds to Programmed Death Receptor-1 (PD-1) on T cells, macrophages and monocytes
Binds with high affinity (low nM) to PD-1 in humans and cynomolgus macaques
Does not elicit antibody-dependent cellular cytotoxicity (ADCC) or complement-dependent cytotoxicity
Promotes cytokine production/proliferation in in vitro allo-MLR assay
Mediates antitumor activity in both PD-L1+ and PD-L1- preclinical models
Non-Clinical Activity of Nivolumab
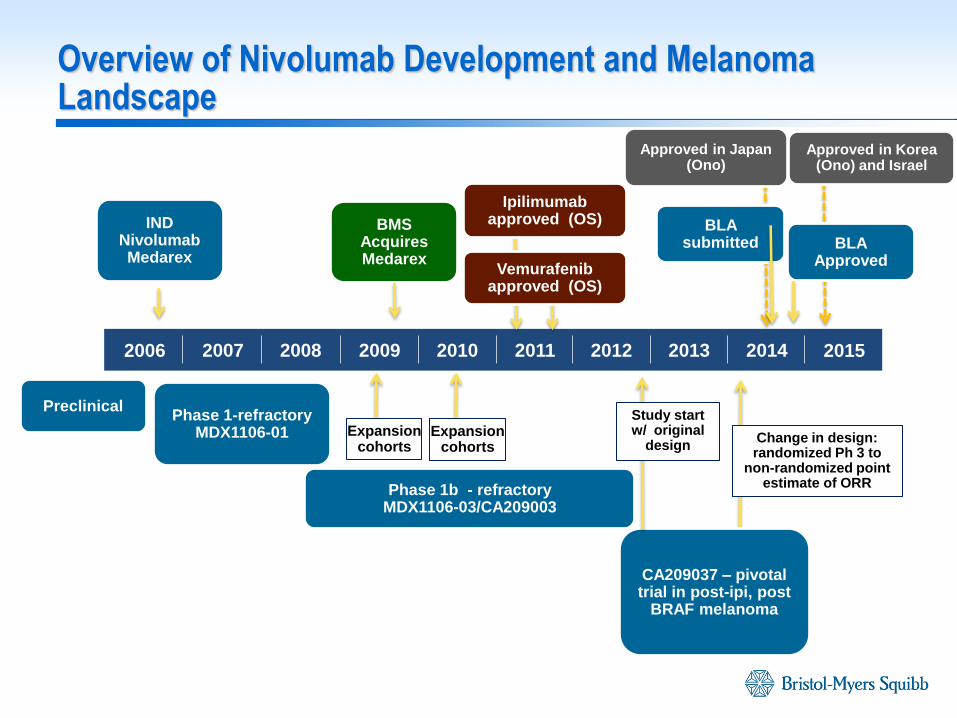
Overview of Nivolumab Development and Melanoma Landscape
2006 2007 2008 2009 2010 2011 2012 2013 2014 2015
IND Nivolumab Medarex
BMS Acquires Medarex
Phase 1-refractory MDX1106-01
Phase 1b - refractory MDX1106-03/CA209003
CA209037 – pivotal trial in post-ipi, post
BRAF melanoma
BLA submitted BLA
Approved
Change in design: randomized Ph 3 to
non-randomized point estimate of ORR
Expansion cohorts
Expansion cohorts
Preclinical Study start w/ original
design
Ipilimumab approved (OS)
Vemurafenib approved (OS)
Approved in Korea (Ono) and Israel
Approved in Japan (Ono)
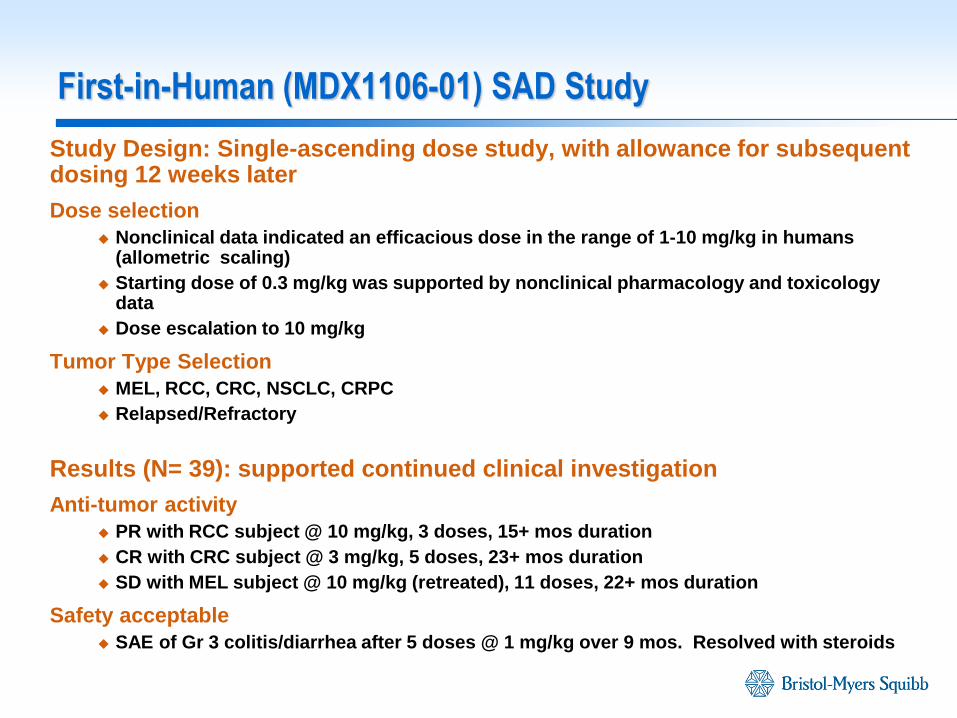
First-in-Human (MDX1106-01) SAD Study
Study Design: Single-ascending dose study, with allowance for subsequent dosing 12 weeks later
Dose selection
Nonclinical data indicated an efficacious dose in the range of 1-10 mg/kg in humans (allometric scaling)
Starting dose of 0.3 mg/kg was supported by nonclinical pharmacology and toxicology data
Dose escalation to 10 mg/kg
Tumor Type Selection
MEL, RCC, CRC, NSCLC, CRPC
Relapsed/Refractory
Results (N= 39): supported continued clinical investigation
Anti-tumor activity
PR with RCC subject @ 10 mg/kg, 3 doses, 15+ mos duration
CR with CRC subject @ 3 mg/kg, 5 doses, 23+ mos duration
SD with MEL subject @ 10 mg/kg (retreated), 11 doses, 22+ mos duration
Safety acceptable
SAE of Gr 3 colitis/diarrhea after 5 doses @ 1 mg/kg over 9 mos. Resolved with steroids
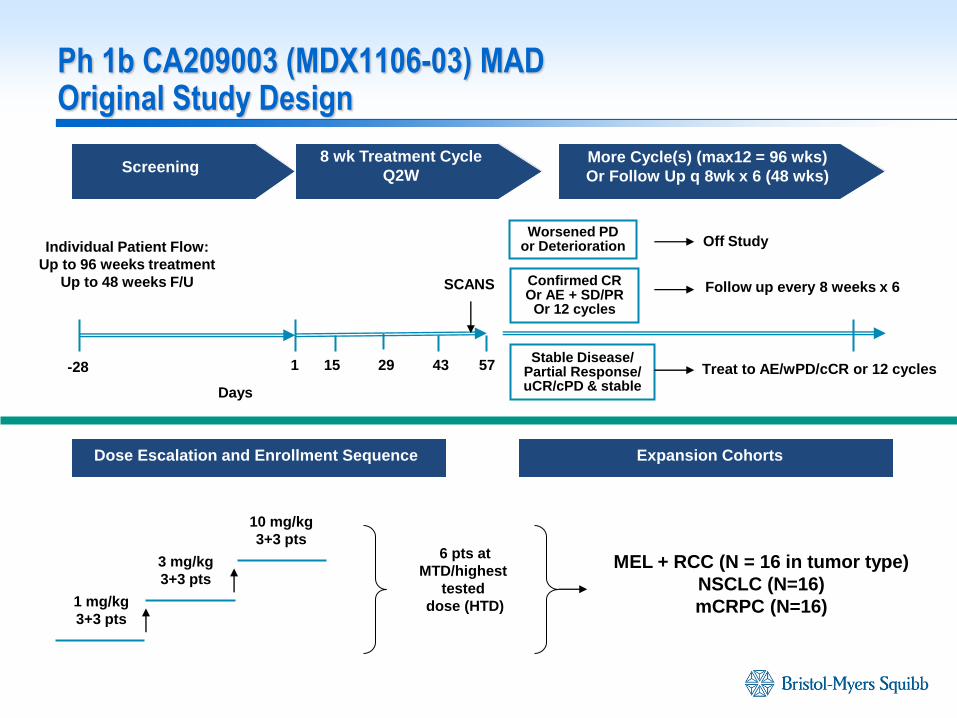
Ph 1b CA209003 (MDX1106-03) MAD Original Study Design
Confirmed CR Or AE + SD/PR
Or 12 cycles
-28 1 15 43 57
Follow up every 8 weeks x 6
Screening 8 wk Treatment Cycle
Q2W More Cycle(s) (max12 = 96 wks)
Or Follow Up q 8wk x 6 (48 wks)
1 mg/kg
3+3 pts
3 mg/kg
3+3 pts
10 mg/kg
3+3 pts
Dose Escalation and Enrollment Sequence Expansion Cohorts
SCANS
MEL + RCC (N = 16 in tumor type)
NSCLC (N=16)
mCRPC (N=16)
29 Stable Disease/
Partial Response/ uCR/cPD & stable
Worsened PD or Deterioration
Treat to AE/wPD/cCR or 12 cycles
Off Study
6 pts at
MTD/highest
tested
dose (HTD)
Individual Patient Flow:
Up to 96 weeks treatment
Up to 48 weeks F/U
Days
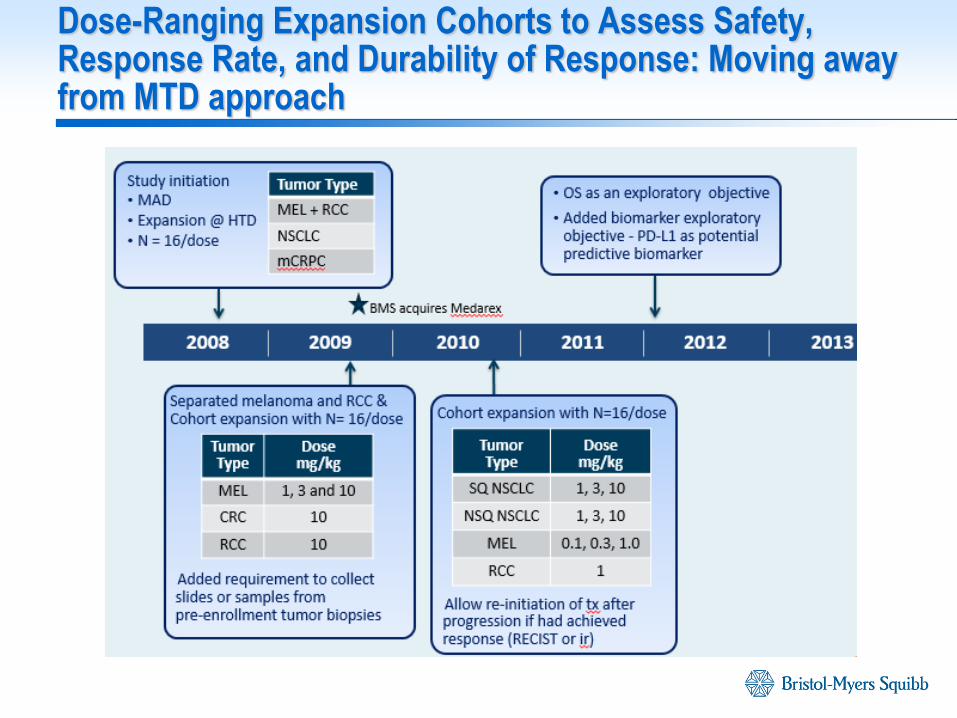
Dose-Ranging Expansion Cohorts to Assess Safety, Response Rate, and Durability of Response: Moving away from MTD approach
2009 2010 2011 2012 2013
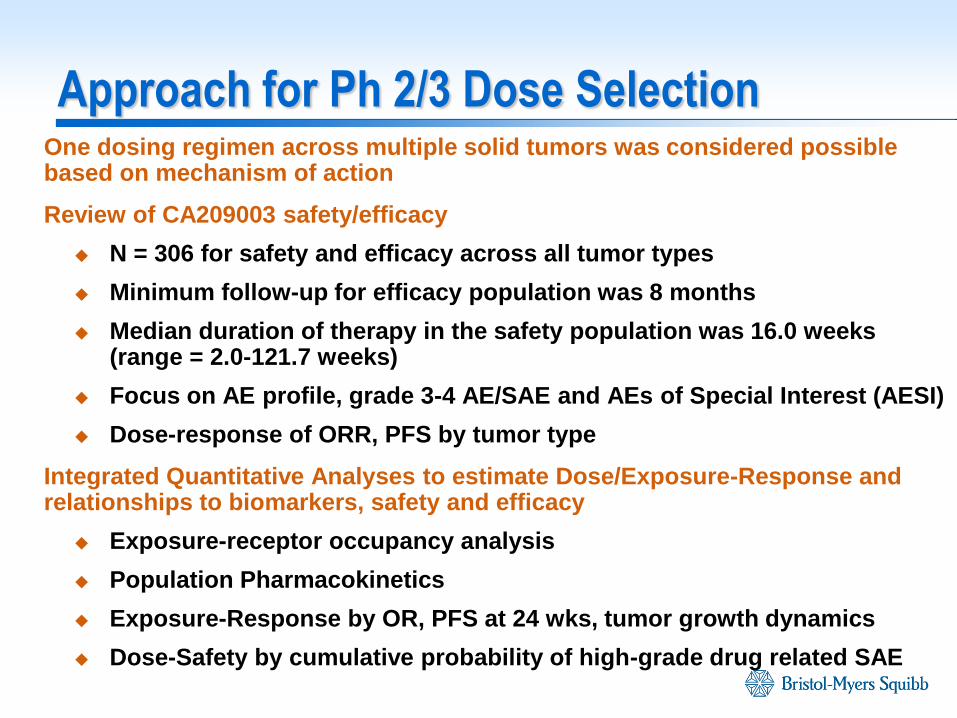
One dosing regimen across multiple solid tumors was considered possible based on mechanism of action
Review of CA209003 safety/efficacy
N = 306 for safety and efficacy across all tumor types
Minimum follow-up for efficacy population was 8 months
Median duration of therapy in the safety population was 16.0 weeks (range = 2.0-121.7 weeks)
Focus on AE profile, grade 3-4 AE/SAE and AEs of Special Interest (AESI)
Dose-response of ORR, PFS by tumor type
Integrated Quantitative Analyses to estimate Dose/Exposure-Response and relationships to biomarkers, safety and efficacy
Exposure-receptor occupancy analysis
Population Pharmacokinetics
Exposure-Response by OR, PFS at 24 wks, tumor growth dynamics
Dose-Safety by cumulative probability of high-grade drug related SAE
Approach for Ph 2/3 Dose Selection
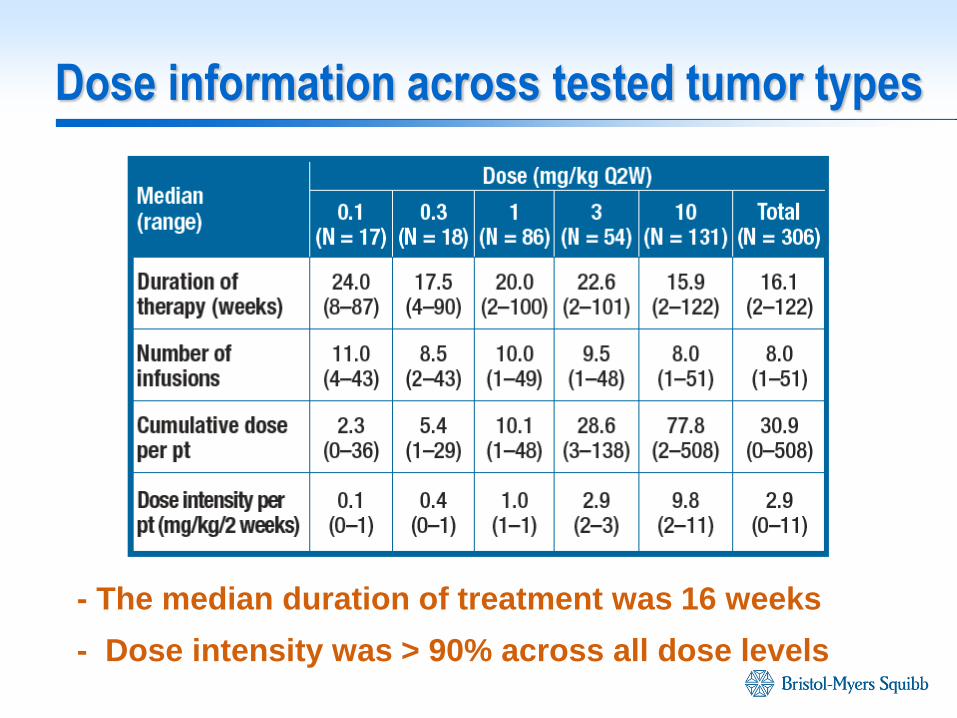
Dose information across tested tumor types
- The median duration of treatment was 16 weeks
- Dose intensity was > 90% across all dose levels
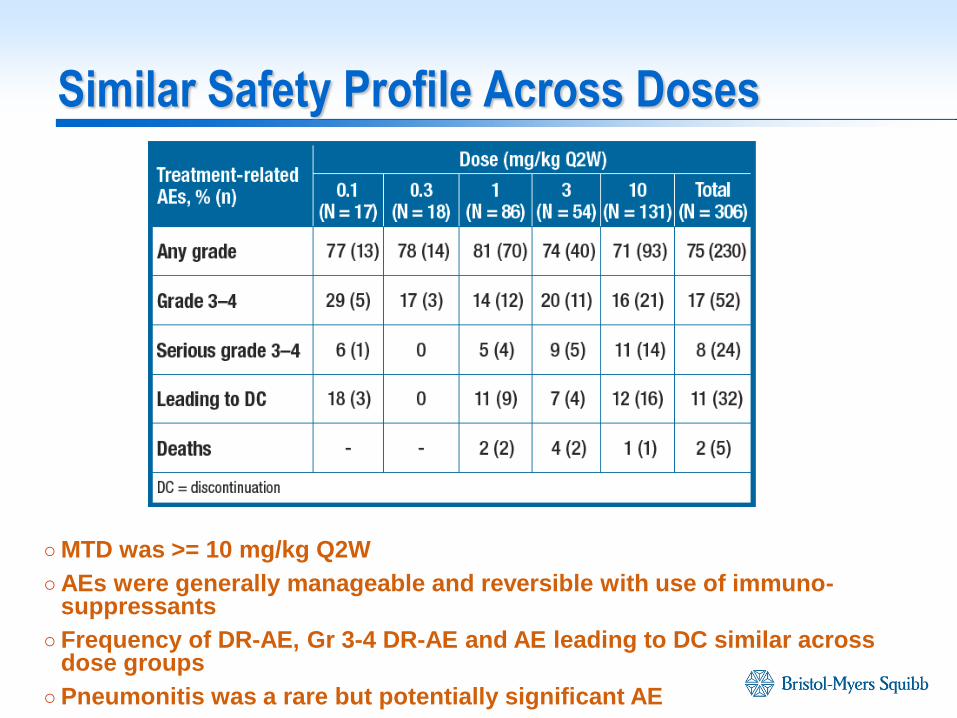
Similar Safety Profile Across Doses
○ MTD was >= 10 mg/kg Q2W
○ AEs were generally manageable and reversible with use of immuno-suppressants
○ Frequency of DR-AE, Gr 3-4 DR-AE and AE leading to DC similar across dose groups
○ Pneumonitis was a rare but potentially significant AE
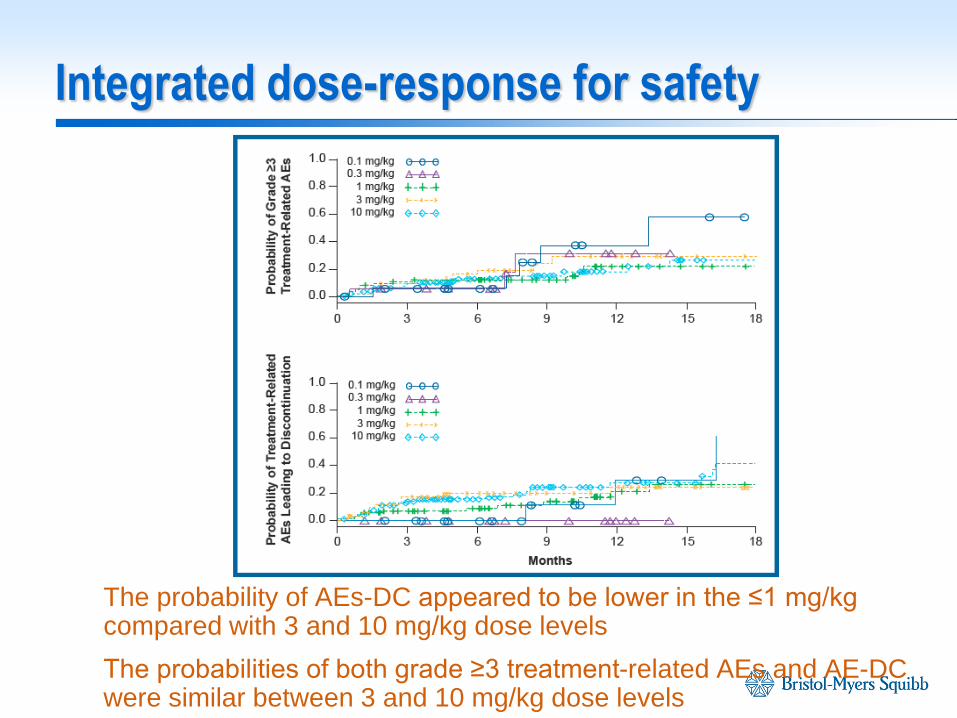
Integrated dose-response for safety
The probability of AEs-DC appeared to be lower in the ≤1 mg/kg compared with 3 and 10 mg/kg dose levels
The probabilities of both grade ≥3 treatment-related AEs and AE-DC were similar between 3 and 10 mg/kg dose levels
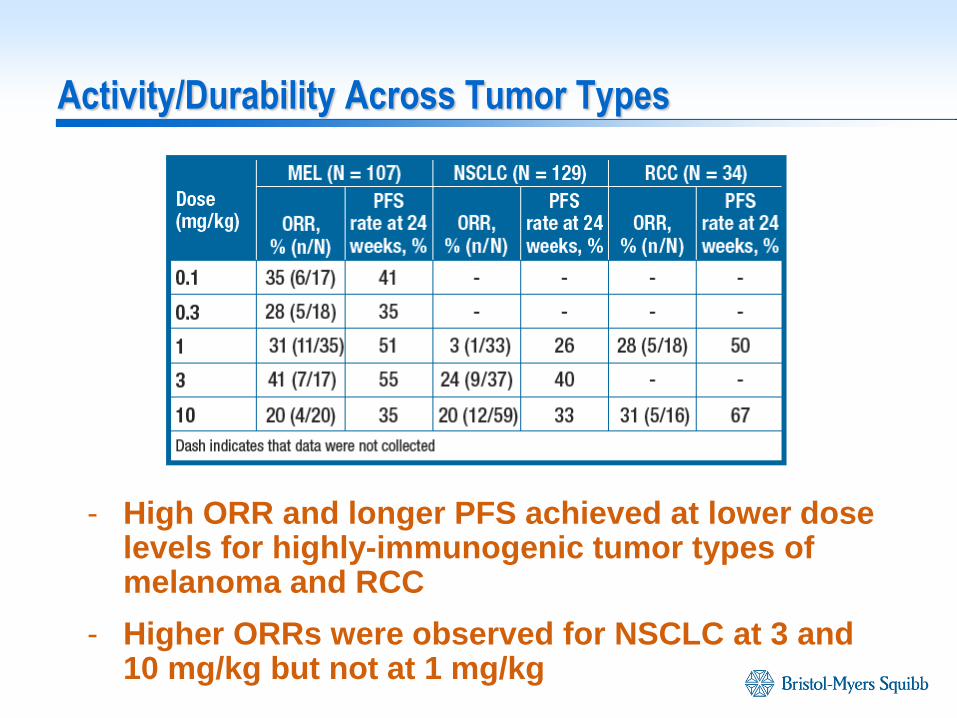
Activity/Durability Across Tumor Types
- High ORR and longer PFS achieved at lower dose levels for highly-immunogenic tumor types of melanoma and RCC
- Higher ORRs were observed for NSCLC at 3 and 10 mg/kg but not at 1 mg/kg
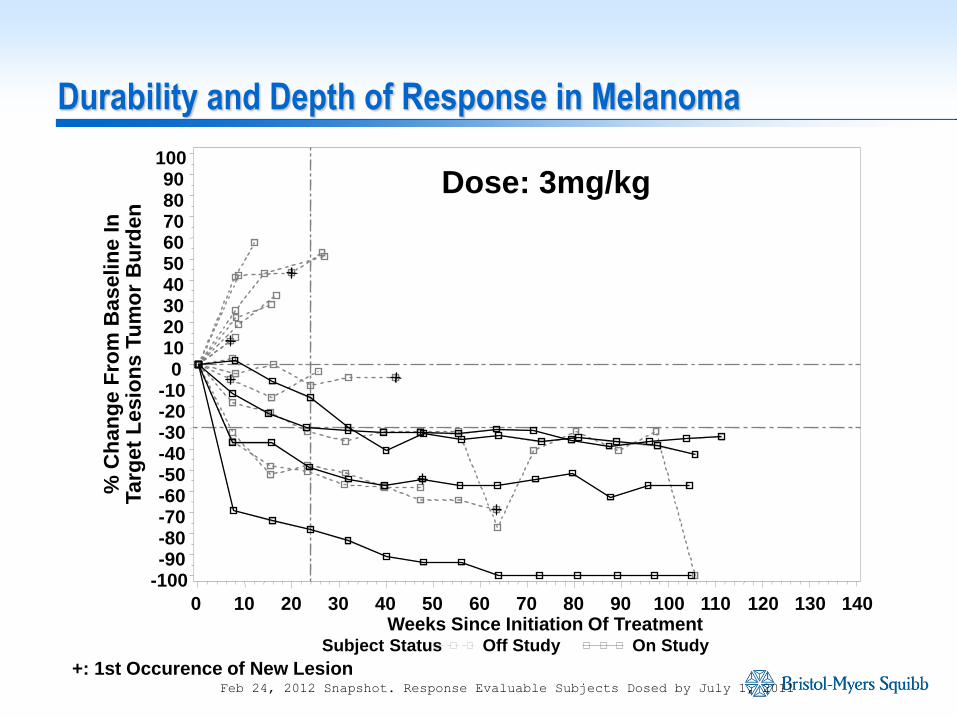
Feb 24, 2012 Snapshot. Response Evaluable Subjects Dosed by July 1, 2011
Dose: 3mg/kg
+: 1st Occurence of New Lesion
Subject Status Off Study On Study
% C
han
ge F
rom
Baselin
e I
n
Targ
et
Lesio
ns T
um
or
Bu
rden
-100 -90 -80 -70 -60 -50 -40 -30 -20 -10
0 10 20 30 40 50 60 70 80 90
100
Weeks Since Initiation Of Treatment 0 10 20 30 40 50 60 70 80 90 100 110 120 130 140
Durability and Depth of Response in Melanoma
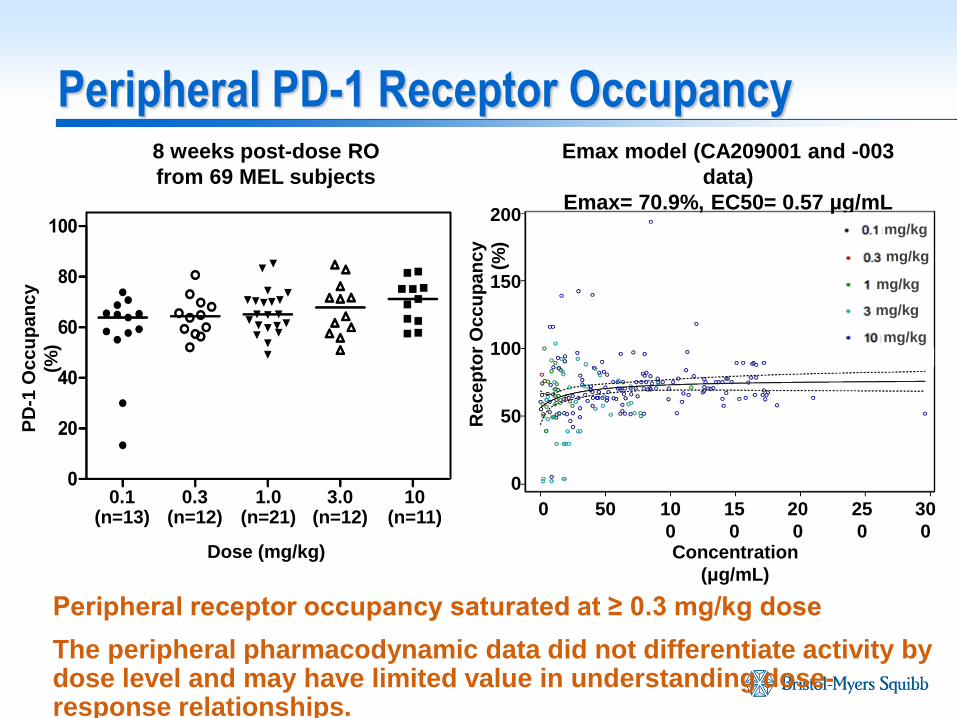
Peripheral PD-1 Receptor Occupancy
Peripheral receptor occupancy saturated at ≥ 0.3 mg/kg dose
The peripheral pharmacodynamic data did not differentiate activity by dose level and may have limited value in understanding dose-response relationships.
8 weeks post-dose RO
from 69 MEL subjects
Emax model (CA209001 and -003
data)
Emax= 70.9%, EC50= 0.57 µg/mL
Dose (mg/kg)
0.1 (n=13)
1.0 (n=21)
0.3 (n=12)
10 (n=11)
3.0 (n=12)
PD
-1 O
cc
up
an
cy
(%)
0
0
Concentration
(μg/mL)
50 10
0
15
0
20
0
25
0
30
0
50
100
150
200
Re
ce
pto
r O
cc
up
an
cy
(%)
mg/kg
mg/kg
mg/kg
mg/kg
mg/kg
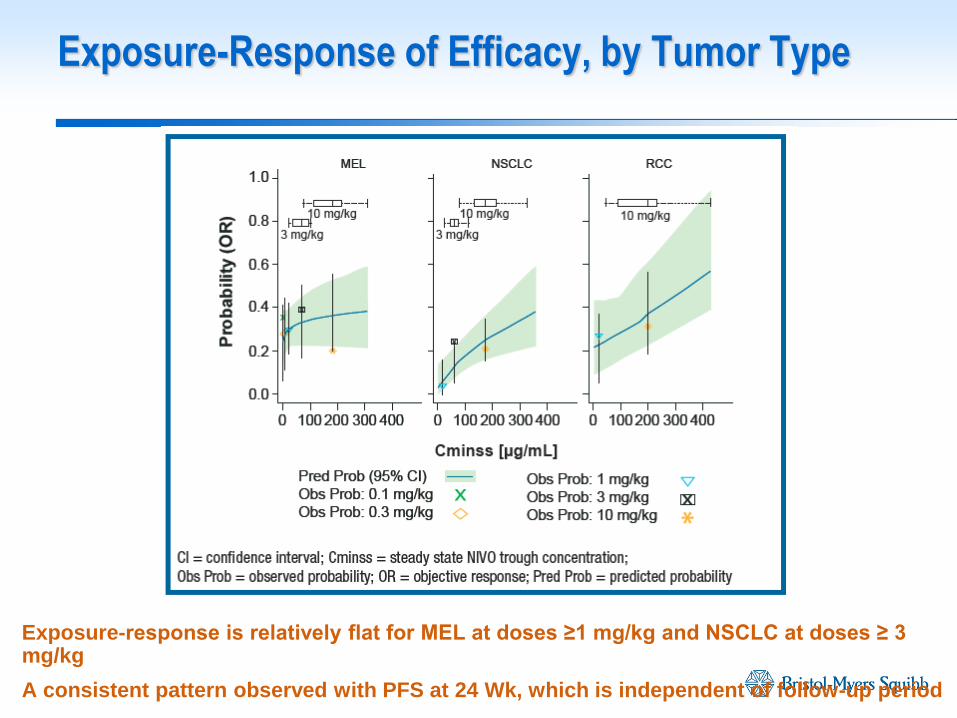
Exposure-response is relatively flat for MEL at doses ≥1 mg/kg and NSCLC at doses ≥ 3 mg/kg
A consistent pattern observed with PFS at 24 Wk, which is independent of follow-up period
Exposure-Response of Efficacy, by Tumor Type
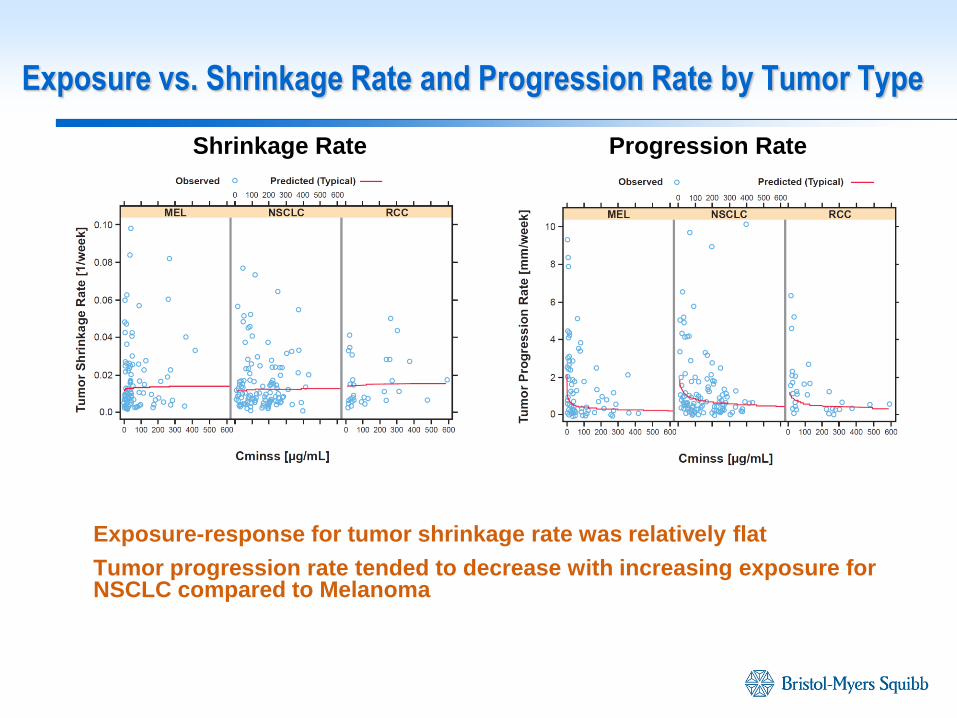
Exposure-response for tumor shrinkage rate was relatively flat
Tumor progression rate tended to decrease with increasing exposure for NSCLC compared to Melanoma
Exposure vs. Shrinkage Rate and Progression Rate by Tumor Type
Shrinkage Rate Progression Rate
Peripheral receptor occupancy saturated at low dose levels; did not provide meaningful differentiation of observed activity
Nivolumab 10 mg/kg Q2W was safe and tolerable
Observed activity and exposure-response analyses for various efficacy response measures (early measure, durability of response and mechanistic tumor growth dynamic modeling) indicated that higher nivolumab doses/exposures are required for low immunogenic tumor types
Based on the totality of the data, nivolumab 3 mg/kg Q2W was selected as the monotherapy dose for further evaluation across all tumor types
This dose was shown to provide long term survival benefit across multiple tumor types irrespective of PD-L1 expression
Summary of Data for Dose Selection for Phase 2/3 in Solid Tumors
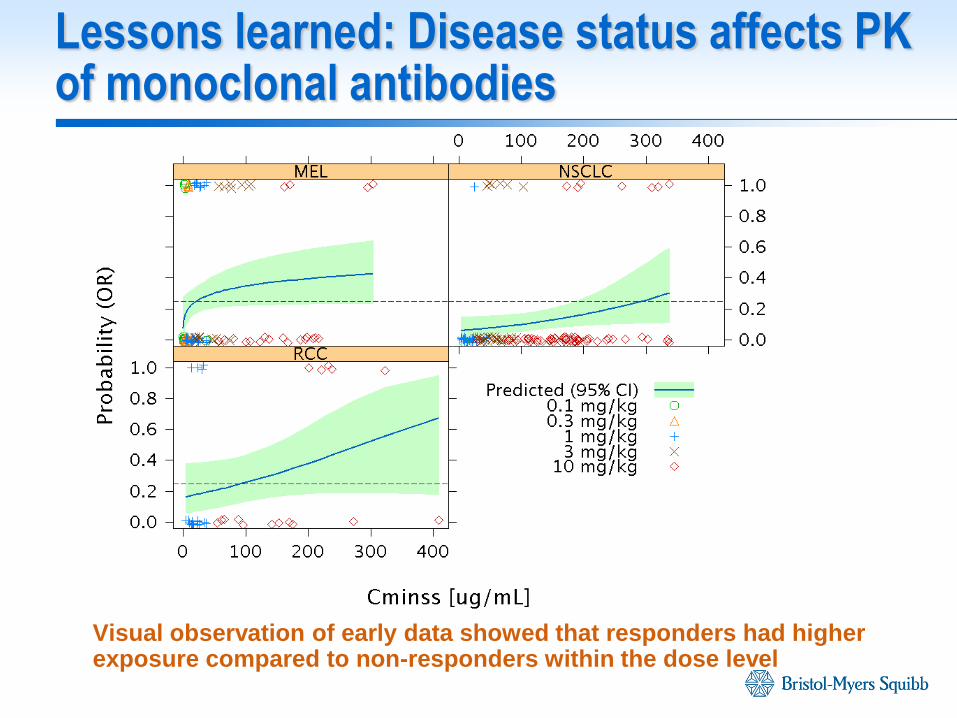
Lessons learned: Disease status affects PK of monoclonal antibodies
Visual observation of early data showed that responders had higher exposure compared to non-responders within the dose level
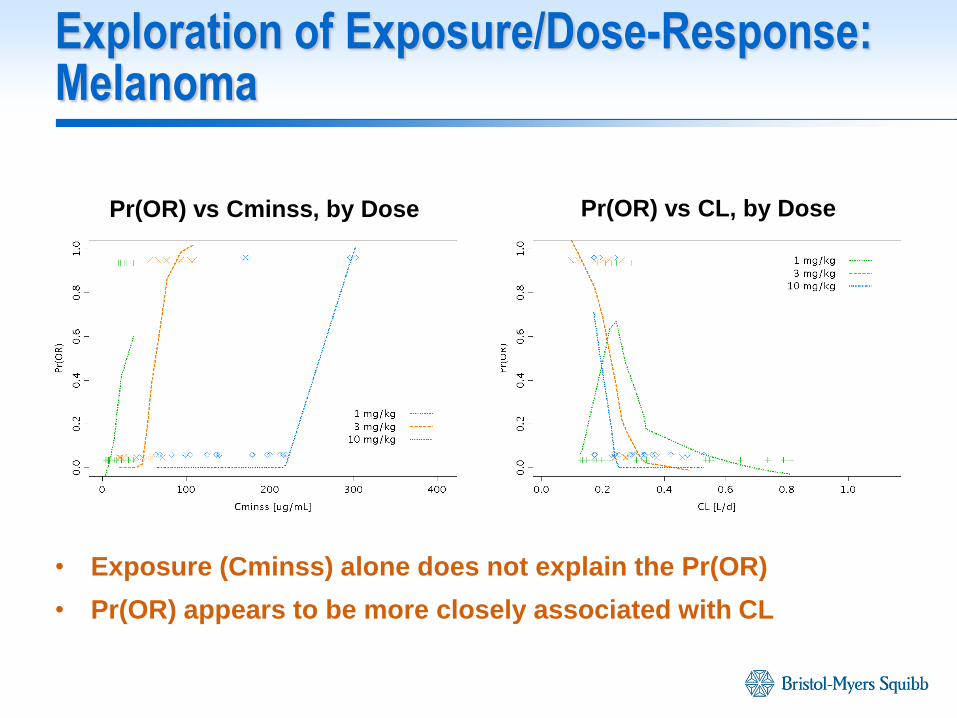
Exploration of Exposure/Dose-Response: Melanoma
• Exposure (Cminss) alone does not explain the Pr(OR)
• Pr(OR) appears to be more closely associated with CL
Pr(OR) vs Cminss, by Dose Pr(OR) vs CL, by Dose
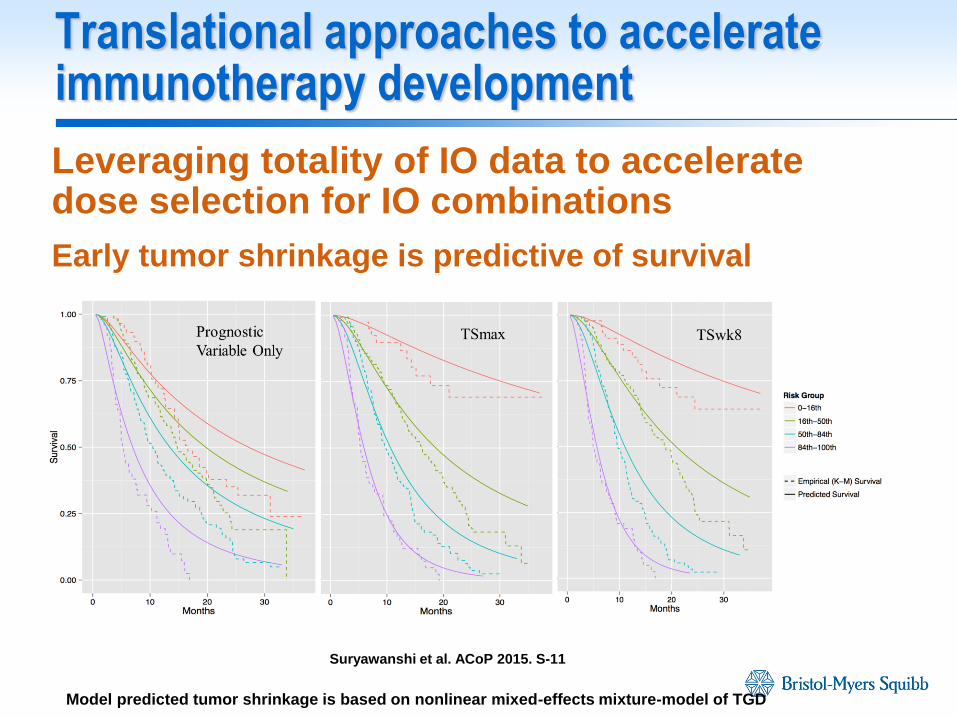
Translational approaches to accelerate immunotherapy development
Leveraging totality of IO data to accelerate dose selection for IO combinations
Early tumor shrinkage is predictive of survival
Prognostic
Variable Only TSmax TSwk8
Suryawanshi et al. ACoP 2015. S-11
Model predicted tumor shrinkage is based on nonlinear mixed-effects mixture-model of TGD
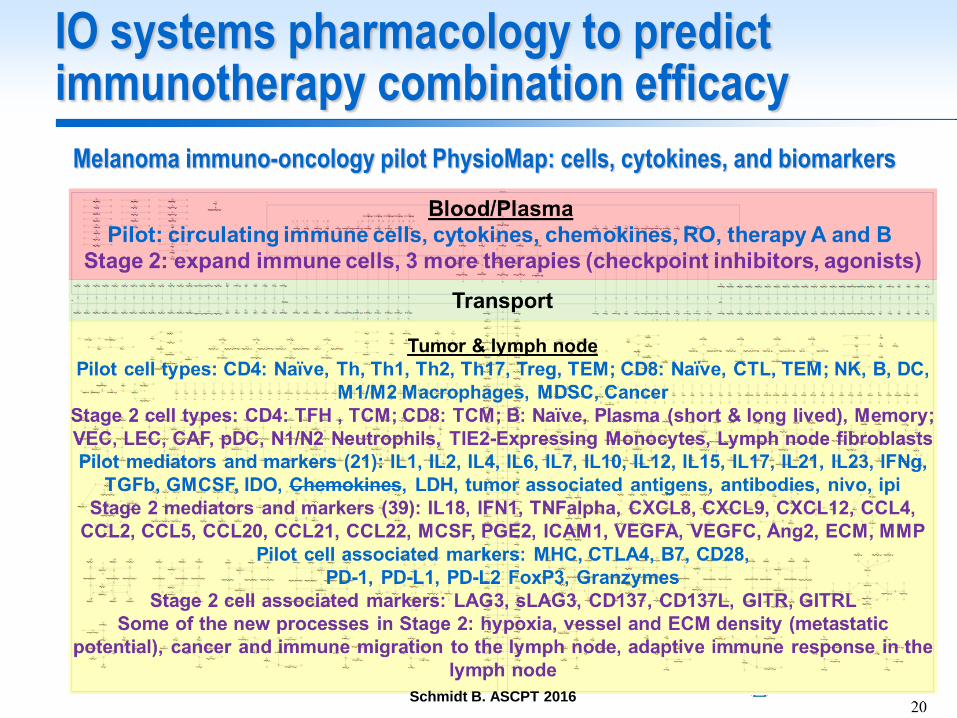
IO systems pharmacology to predict immunotherapy combination efficacy
Melanoma immuno-oncology pilot PhysioMap: cells, cytokines, and biomarkers
Schmidt B. ASCPT 2016
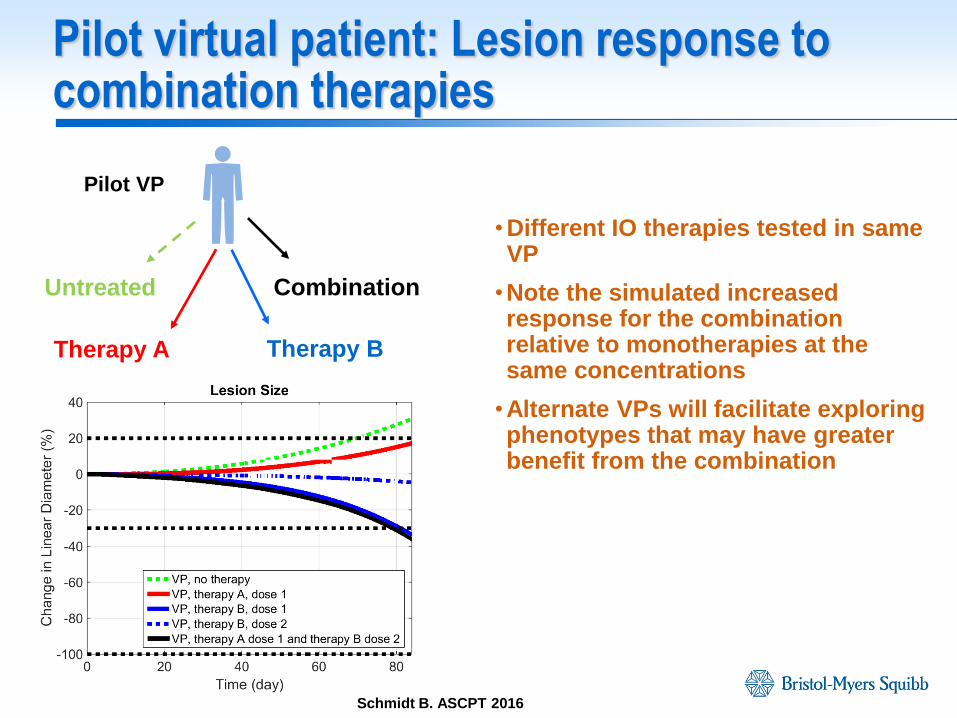
Pilot virtual patient: Lesion response to combination therapies
• Different IO therapies tested in same VP
•Note the simulated increased response for the combination relative to monotherapies at the same concentrations
•Alternate VPs will facilitate exploring phenotypes that may have greater benefit from the combination
Pilot VP
Untreated
Therapy A Therapy B
Combination
Schmidt B. ASCPT 2016
Future directions in optimizing cancer immunotherapy development
- Establishing optimal regimen: sequenced or concurrent administration of combinations
- Dosing frequency
- Duration of treatment/number of combination doses
- Triple combinations
- Combinations with multiple treatment modalities
Acknowledgements
- Patients enrolled in clinical trials
- Clinical Pharmacology and Pharmacometrics group at Bristol-Myers Squibb
- Nivolumab and ipilimumab clinical development teams
Janssen Research & Development
Evaluating and Quantifying Benefit of
Exposure-Response Modeling for Dose Finding
Chyi-Hung Hsu and José Pinheiro
Janssen R&D
FDA-AACR: Oncology Dose-finding Workshop
June 13, 2016
Janssen Research & Development
• Motivation
• Dose-exposure-response modeling framework
• Simulation study comparing DR- and ER-based estimation
in dose selection
• Conclusions
Outline
54
Janssen Research & Development
• Poor understanding of (efficacy and safety) dose response is one
of the root causes of late phase attrition and post-approval
problems
• Difficulties in dose finding
Limitations of current practice:
Few doses
Sample size based on power to detect DR signal (dose vs. placebo)
• Exposure-response modelling could be very helpful and useful
for improving dose selection
How to quantify the potential benefit of ER modelling?
Motivation
55
Janssen Research & Development 56
Dose-Exposure-Response Framework
Utilized in Simulations
‒ Underlying ER model
‒ Sources of Variability
‒ Relating ER model to DR model
Janssen Research & Development
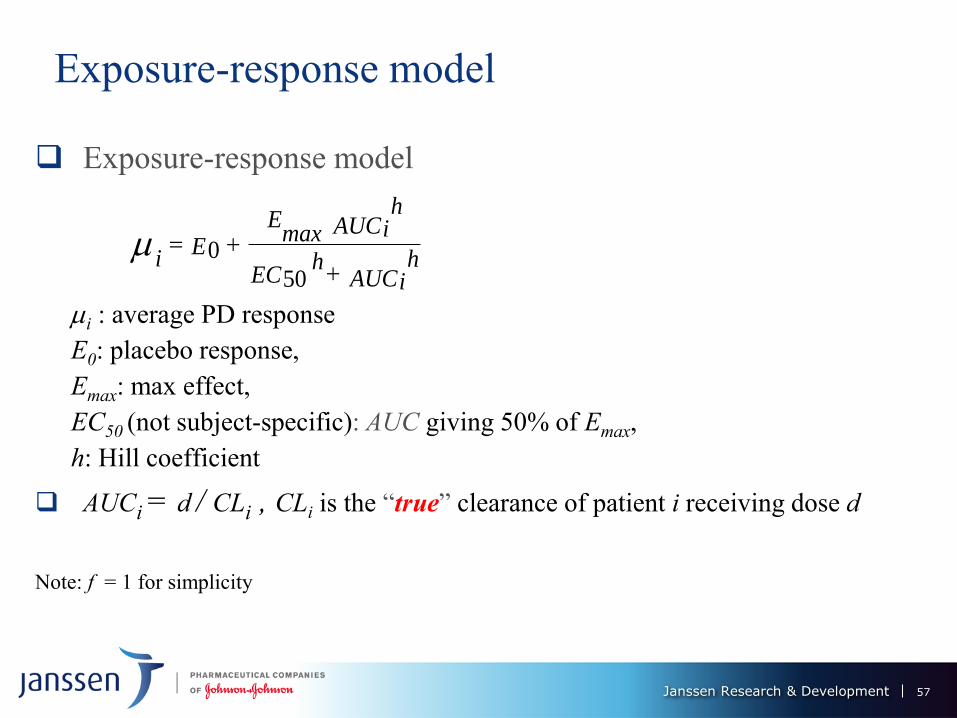
Exposure-response model
Exposure-response model
i : average PD response
E0: placebo response,
Emax: max effect,
EC50 (not subject-specific): AUC giving 50% of Emax,
h: Hill coefficient
AUCi = d / CLi , CLi is the “true” clearance of patient i receiving dose d
Note: f = 1 for simplicity
AUCih
ECh
AUCih
maxE
Ei
50
0
57
Janssen Research & Development
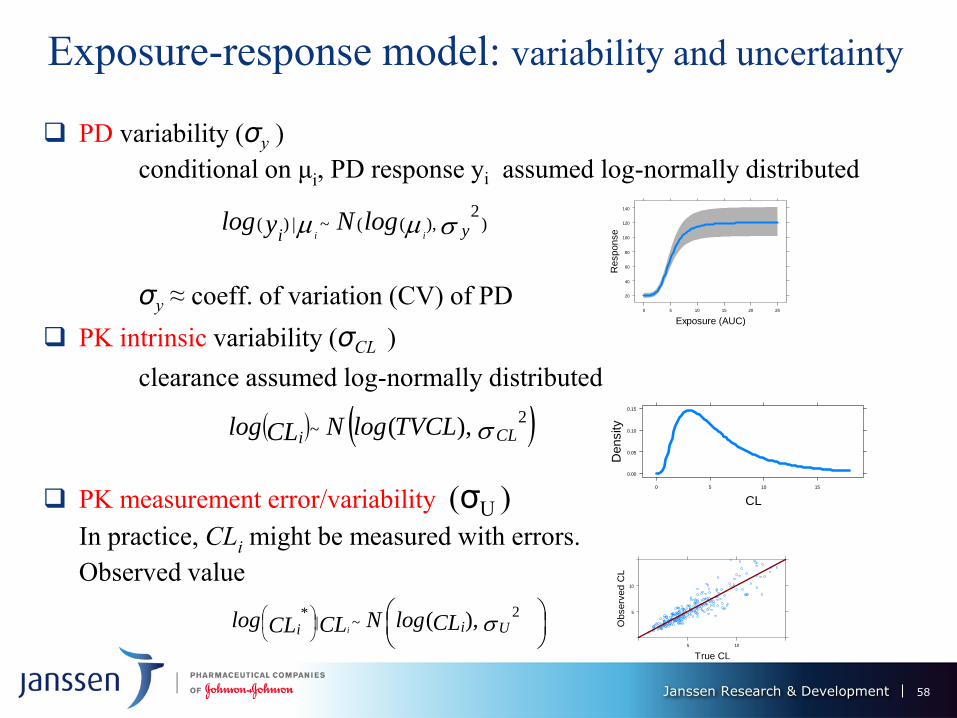
Exposure-response model: variability and uncertainty
PD variability (σy )
conditional on μi, PD response yi assumed log-normally distributed
σy ≈ coeff. of variation (CV) of PD
PK intrinsic variability (σCL )
clearance assumed log-normally distributed
PK measurement error/variability (σU )
In practice, CLi might be measured with errors.
Observed value
CLiTVCLlogNCLlog
2~ ),(
)2
),((~|)( yi iilogNylog
Uii CLlogNCLCLlog
i
2~|
* ),(
Exposure (AUC)
Response
20
40
60
80
100
120
140
0 5 10 15 20 25
CL
Density
0.00
0.05
0.10
0.15
0 5 10 15
True CL
Observ
ed C
L5
10
5 10
58
Janssen Research & Development
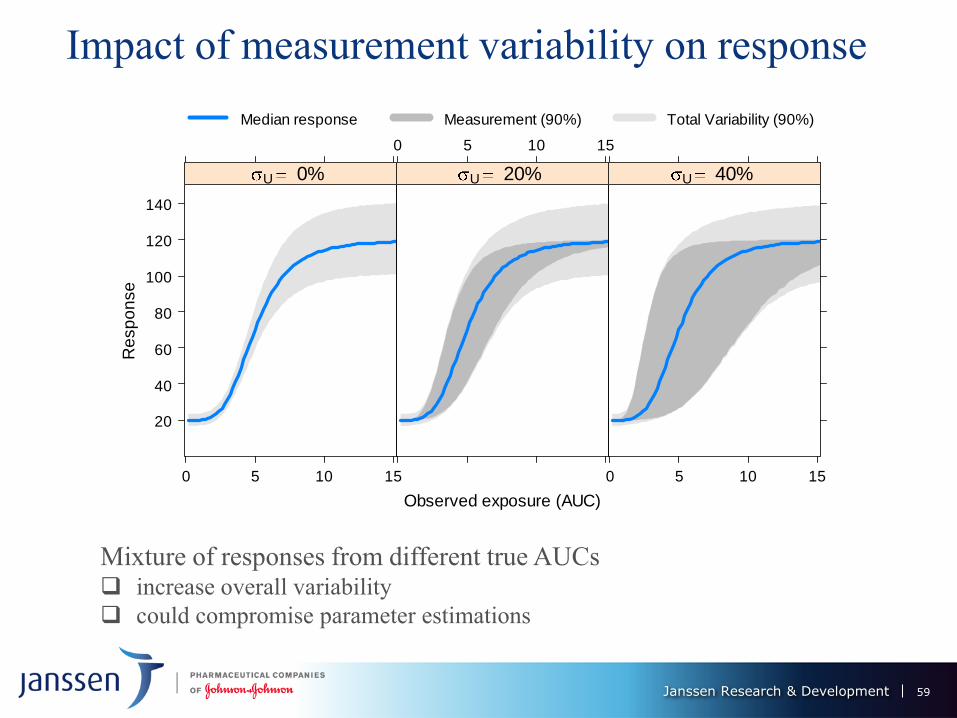
Impact of measurement variability on response
Mixture of responses from different true AUCs increase overall variability
could compromise parameter estimations
Observed exposure (AUC)
Re
sp
on
se
20
40
60
80
100
120
140
0 5 10 15
U 0%
0 5 10 15
U 20%
0 5 10 15
U 40%
Median response Measurement (90%) Total Variability (90%)
59
Janssen Research & Development
d hED i
h
d hEE
CLi
d h
ECh
CLi
d hE
E
AUCih
ECh
AUCih
EEi
50
max0
50
max0
50
max0
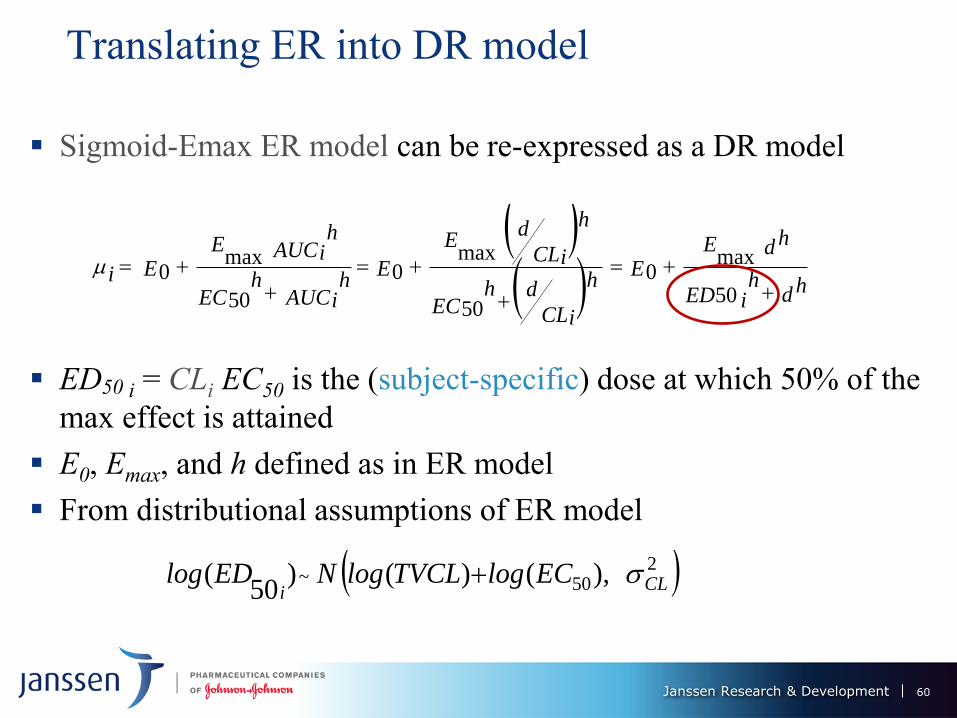
Translating ER into DR model
Sigmoid-Emax ER model can be re-expressed as a DR model
ED50 i = CLi EC50 is the (subject-specific) dose at which 50% of the
max effect is attained
E0, Emax, and h defined as in ER model
From distributional assumptions of ER model
250~ ),()()
50( CL
iEClogTVCLlogNEDlog
60
Janssen Research & Development
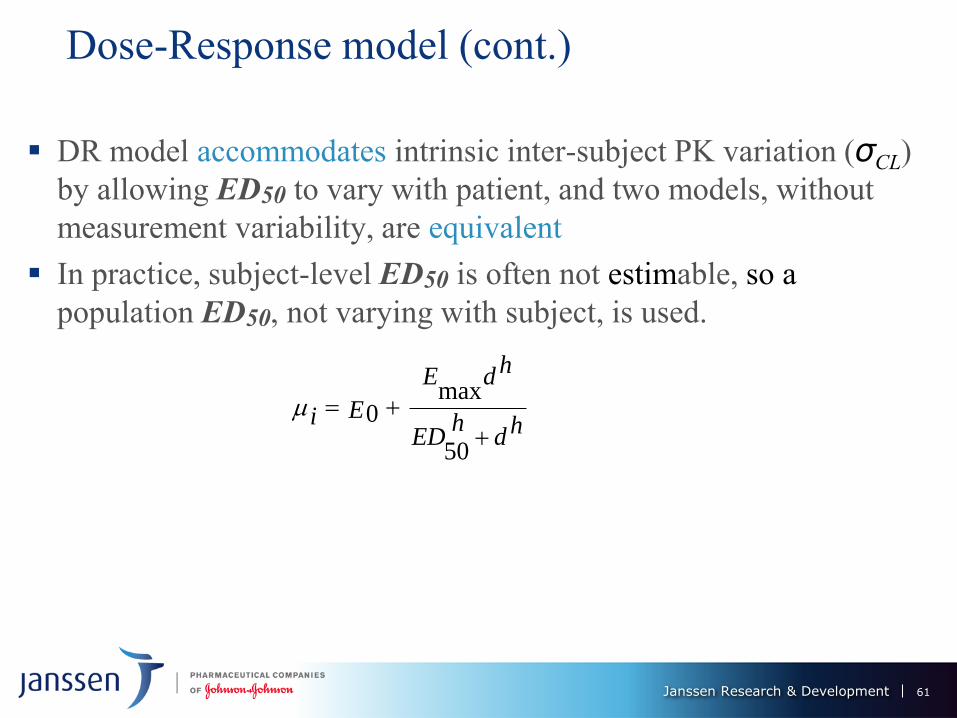
Dose-Response model (cont.)
DR model accommodates intrinsic inter-subject PK variation (σCL)
by allowing ED50 to vary with patient, and two models, without
measurement variability, are equivalent
In practice, subject-level ED50 is often not estimable, so a
population ED50, not varying with subject, is used.
hdh
ED
hdE
Ei
50
max0
61
Janssen Research & Development
Simulation Study
62
Janssen Research & Development
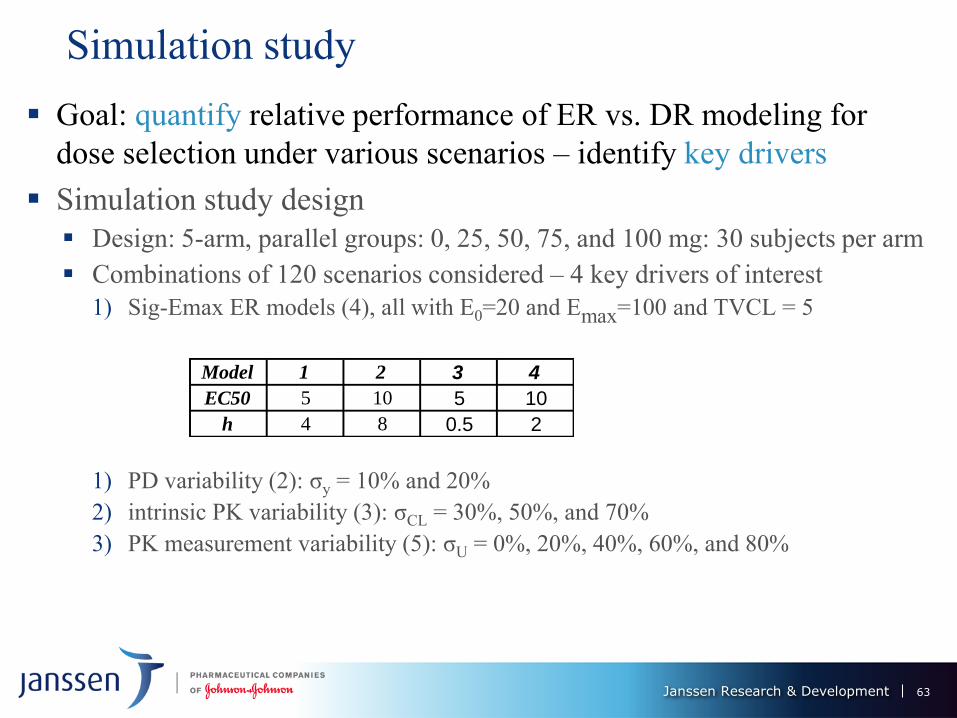
Simulation study
Goal: quantify relative performance of ER vs. DR modeling for
dose selection under various scenarios – identify key drivers
Simulation study design
Design: 5-arm, parallel groups: 0, 25, 50, 75, and 100 mg: 30 subjects per arm
Combinations of 120 scenarios considered – 4 key drivers of interest
1) Sig-Emax ER models (4), all with E0=20 and Emax=100 and TVCL = 5
1) PD variability (2): σy = 10% and 20%
2) intrinsic PK variability (3): σCL = 30%, 50%, and 70%
3) PK measurement variability (5): σU = 0%, 20%, 40%, 60%, and 80%
Model 1 2 3 4
EC50 5 10 5 10
h 4 8 0.5 2
63
Janssen Research & Development
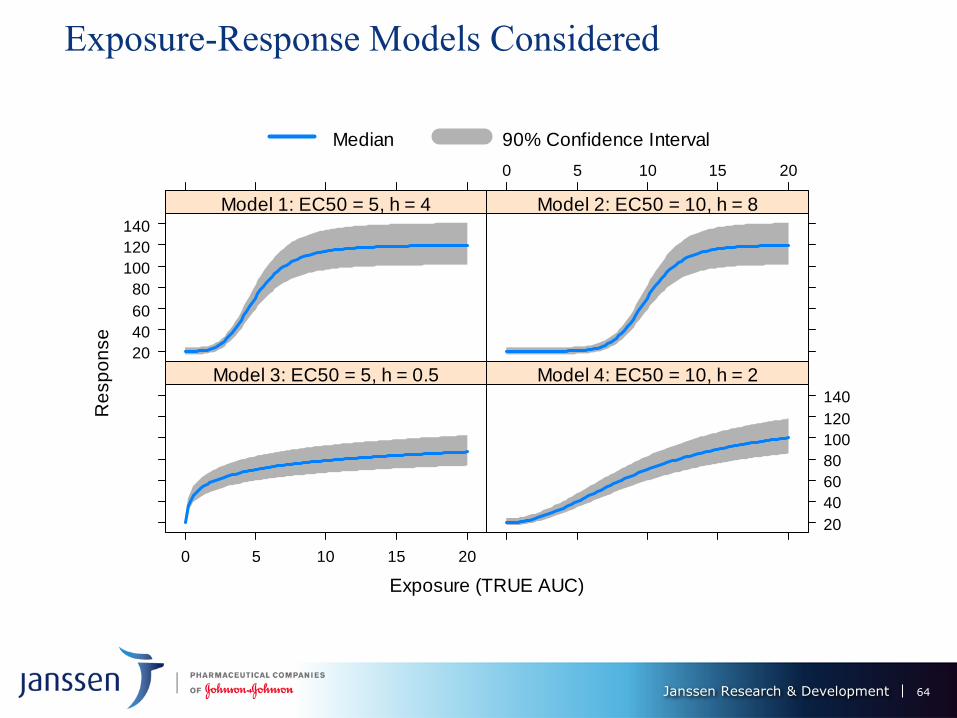
Exposure-Response Models Considered
Exposure (TRUE AUC)
Re
sp
on
se
20
40
60
80
100
120
140
Model 1: EC50 = 5, h = 4
0 5 10 15 20
Model 2: EC50 = 10, h = 8
0 5 10 15 20
Model 3: EC50 = 5, h = 0.5
20
40
60
80
100
120
140
Model 4: EC50 = 10, h = 2
Median 90% Confidence Interval
64
Janssen Research & Development
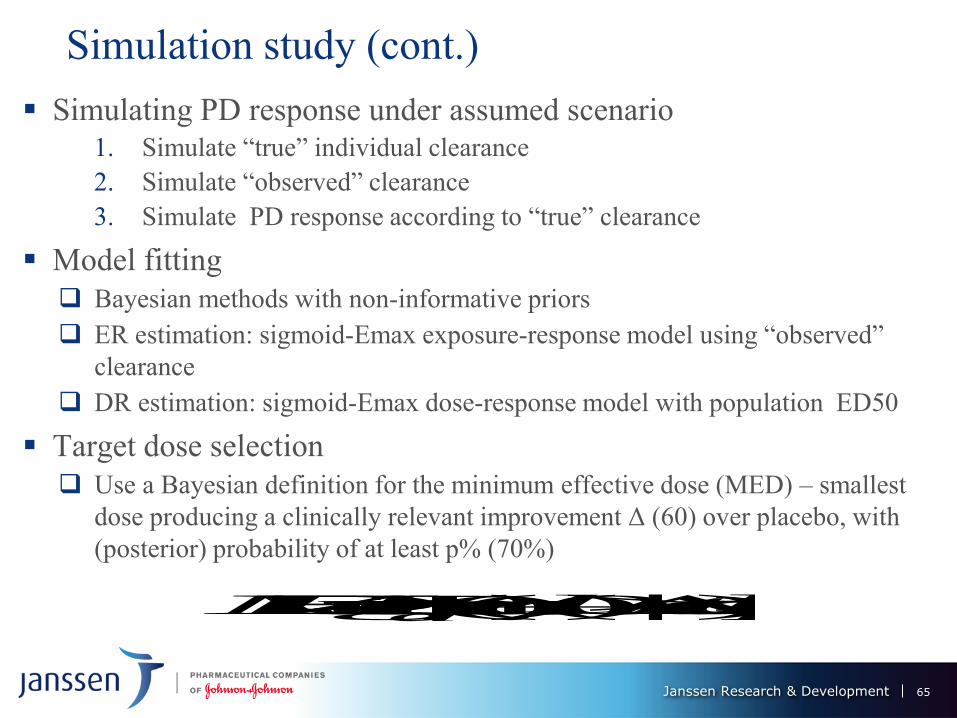
Simulation study (cont.)
Simulating PD response under assumed scenario 1. Simulate “true” individual clearance
2. Simulate “observed” clearance
3. Simulate PD response according to “true” clearance
Model fitting
Bayesian methods with non-informative priors
ER estimation: sigmoid-Emax exposure-response model using “observed”
clearance
DR estimation: sigmoid-Emax dose-response model with population ED50
Target dose selection
Use a Bayesian definition for the minimum effective dose (MED) – smallest
dose producing a clinically relevant improvement Δ (60) over placebo, with
(posterior) probability of at least p% (70%)
pdatadMEDd )|)0()(Pr(minarg
65

Janssen Research & Development
Results
66
Janssen Research & Development
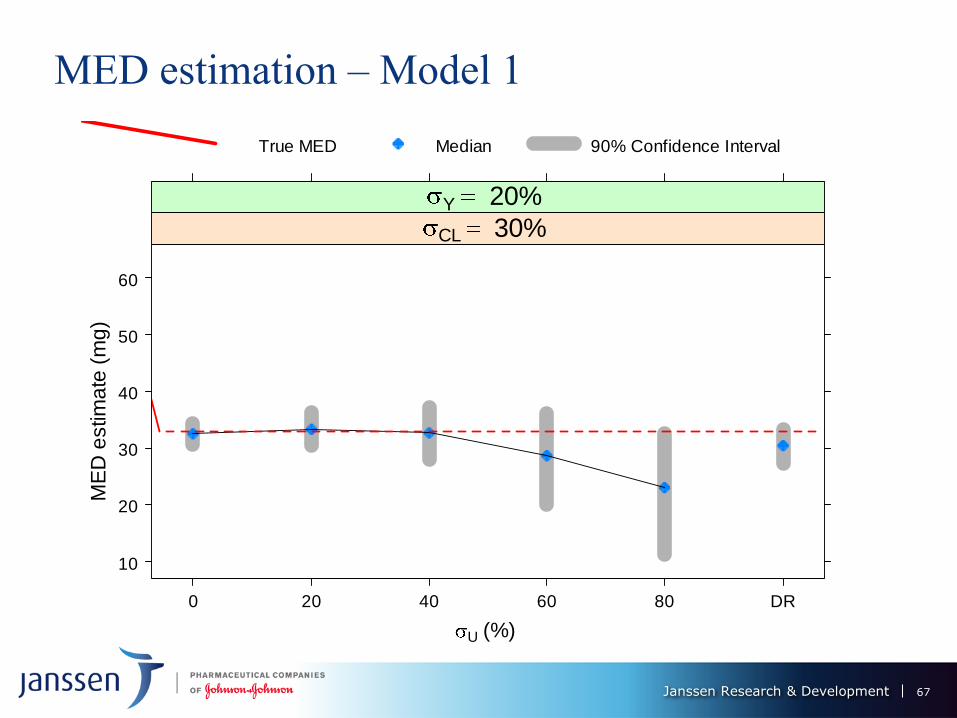
MED estimation – Model 1
U (%)
ME
D e
stim
ate
(m
g)
10
20
30
40
50
60
0 20 40 60 80 DR
CL 30% Y 20%
True MED Median 90% Confidence Interval
67
Janssen Research & Development
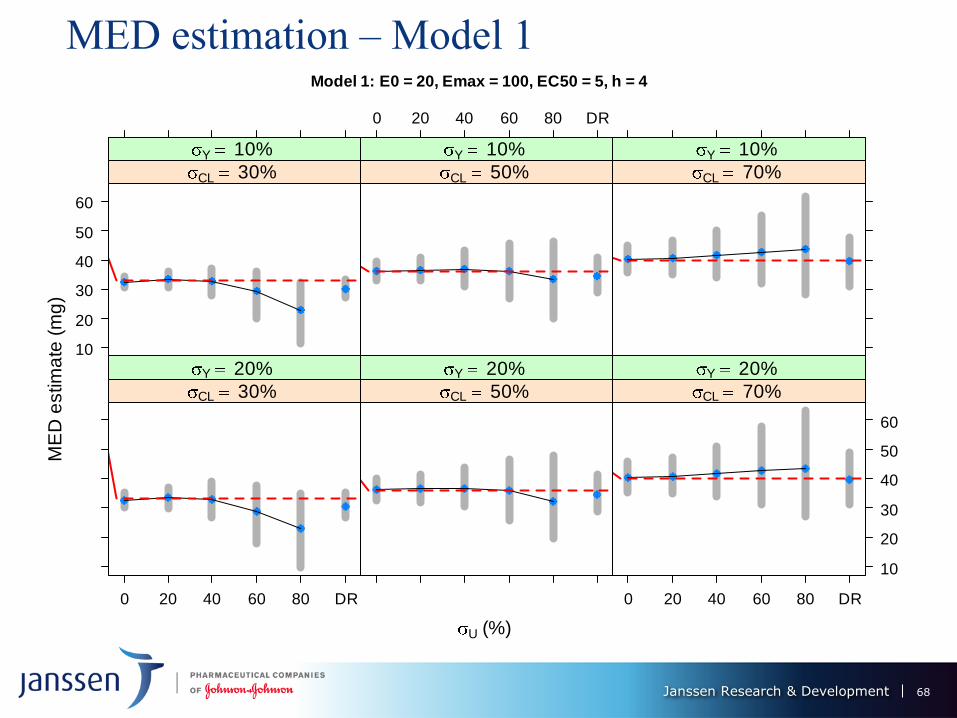
MED estimation – Model 1 Model 1: E0 = 20, Emax = 100, EC50 = 5, h = 4
U (%)
ME
D e
stim
ate
(m
g)
10
20
30
40
50
60
CL 30% Y 10%
0 20 40 60 80 DR
CL 50% Y 10%
CL 70% Y 10%
0 20 40 60 80 DR
CL 30% Y 20%
CL 50% Y 20%
0 20 40 60 80 DR
10
20
30
40
50
60
CL 70% Y 20%
68
Janssen Research & Development
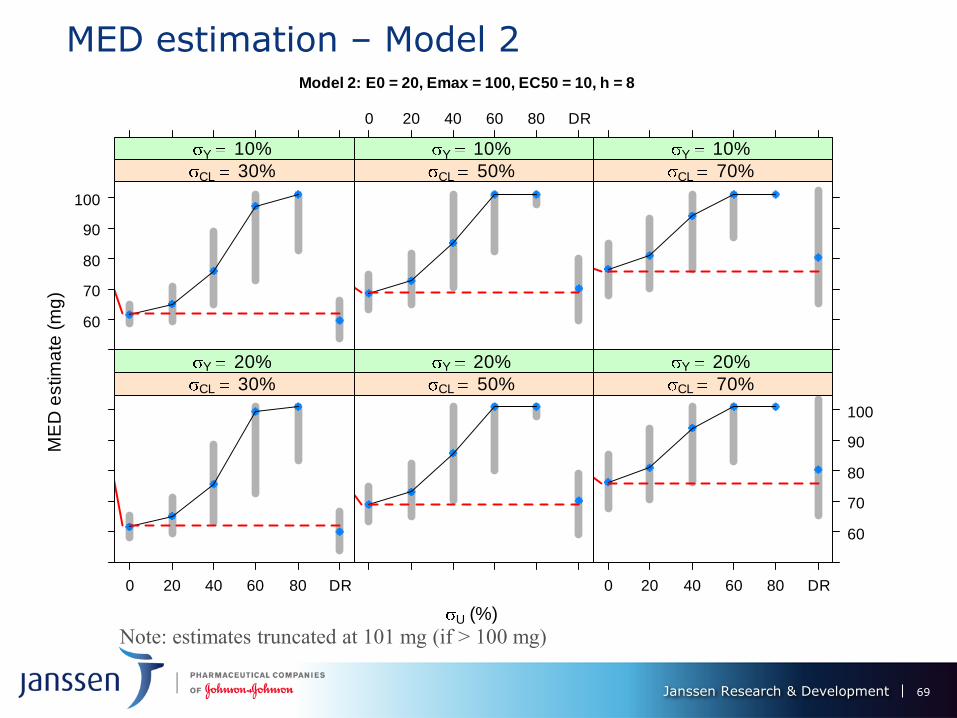
MED estimation – Model 2 Model 2: E0 = 20, Emax = 100, EC50 = 10, h = 8
U (%)
ME
D e
stim
ate
(m
g)
60
70
80
90
100
CL 30% Y 10%
0 20 40 60 80 DR
CL 50% Y 10%
CL 70% Y 10%
0 20 40 60 80 DR
CL 30% Y 20%
CL 50% Y 20%
0 20 40 60 80 DR
60
70
80
90
100
CL 70% Y 20%
Note: estimates truncated at 101 mg (if > 100 mg)
69
Janssen Research & Development
MED Performance of ER vs. DR – models 1 & II
Under 0% PK measurement error, ER provides substantial gains over DR -
smaller bias (≈ 0 for ER) and variability.
MED estimation performance of ER deteriorates as U increases: up to 20%, still
superior to DR, but same, or worse for U = 40%; DR better than ER for U >
40%.
Performance of DR worsens with increase in CL - dose decreases its predictive
power for the response.
Bias of ER MED estimate decreases with CL from 30% to 50%, but increases
(and changes sign) from 50% to 70%. Its variation is not much affected.
ER and DR MED estimates variability ↑ with σY, but not by much
Model 2: estimation features magnified: ER performance worsens more
dramatically with U, DR deterioration with σCL also more severe. ER only
competitive with DR U ≤ 20%
70

Janssen Research & Development
Conclusions
71
Janssen Research & Development
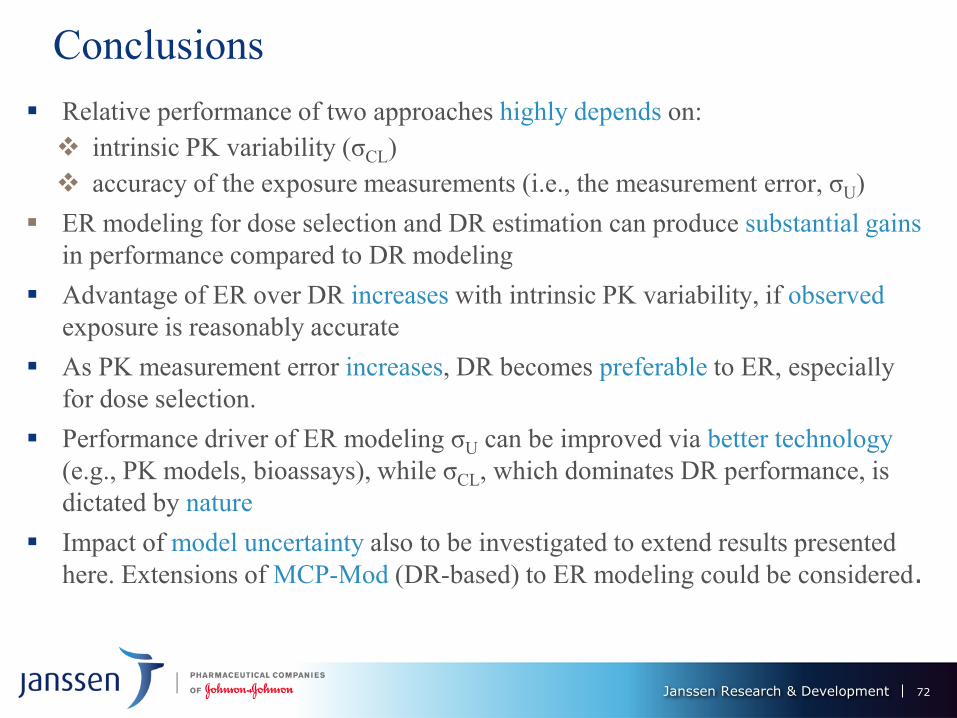
Conclusions
Relative performance of two approaches highly depends on:
intrinsic PK variability (σCL)
accuracy of the exposure measurements (i.e., the measurement error, σU)
ER modeling for dose selection and DR estimation can produce substantial gains
in performance compared to DR modeling
Advantage of ER over DR increases with intrinsic PK variability, if observed
exposure is reasonably accurate
As PK measurement error increases, DR becomes preferable to ER, especially
for dose selection.
Performance driver of ER modeling σU can be improved via better technology
(e.g., PK models, bioassays), while σCL, which dominates DR performance, is
dictated by nature
Impact of model uncertainty also to be investigated to extend results presented
here. Extensions of MCP-Mod (DR-based) to ER modeling could be considered.
72
Janssen Research & Development
Acknowledgements
William Gillespie
Amit Roy
Ashish Sanil
Reference
Bretz F, Pinheiro J, Branson M. (2005). Combining multiple
comparisons and modeling techniques in dose-response studies.
Biometrics. 61, 738-748
Hsu, Chyi-Hung.(2009) “Evaluating Potential Benefits of Dose–
exposure–response Modeling for Dose Finding.” Pharmaceutical
Statistics 8, no. 3: 203–15
73

Janssen Research & Development
Thank you
74
Janssen Research & Development
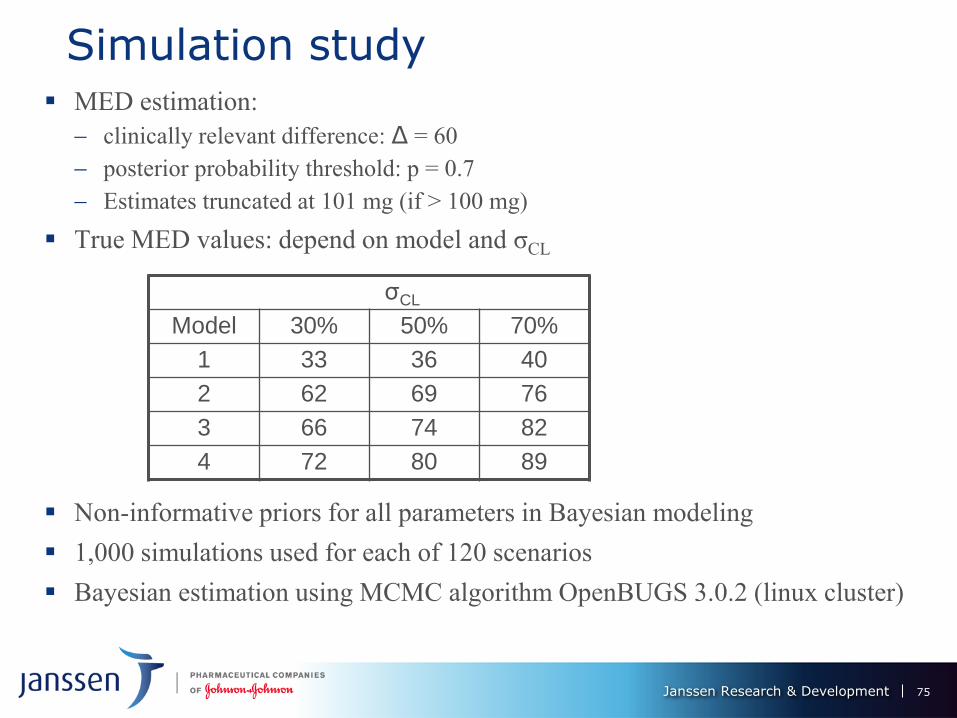
Simulation study MED estimation:
clinically relevant difference: Δ = 60
posterior probability threshold: p = 0.7
Estimates truncated at 101 mg (if > 100 mg)
True MED values: depend on model and σCL
Non-informative priors for all parameters in Bayesian modeling
1,000 simulations used for each of 120 scenarios
Bayesian estimation using MCMC algorithm OpenBUGS 3.0.2 (linux cluster)
σCL
Model 30% 50% 70%
1 33 36 40
2 62 69 76
3 66 74 82
4 72 80 89
75
Break 9:35 – 9:50 am

Model Based Decision
Making in Oncology Dose
Selection and Study Design
Diane Wang, Ph.D
Pfizer, Inc
Oncology Dosing Paradigm
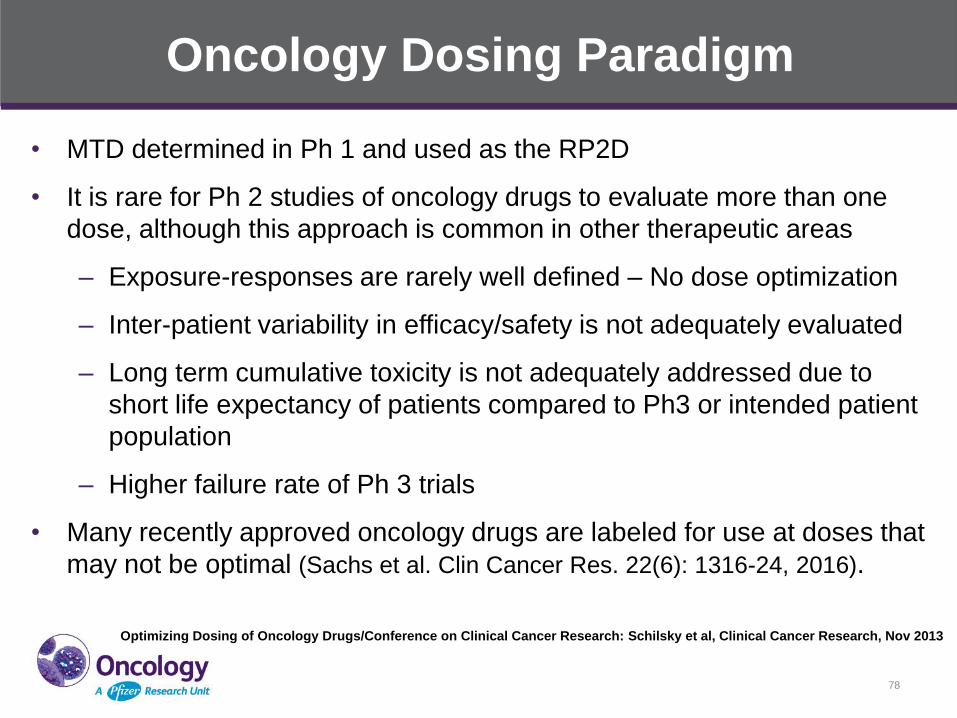
• MTD determined in Ph 1 and used as the RP2D
• It is rare for Ph 2 studies of oncology drugs to evaluate more than one
dose, although this approach is common in other therapeutic areas
– Exposure-responses are rarely well defined – No dose optimization
– Inter-patient variability in efficacy/safety is not adequately evaluated
– Long term cumulative toxicity is not adequately addressed due to
short life expectancy of patients compared to Ph3 or intended patient
population
– Higher failure rate of Ph 3 trials
• Many recently approved oncology drugs are labeled for use at doses that
may not be optimal (Sachs et al. Clin Cancer Res. 22(6): 1316-24, 2016).
Optimizing Dosing of Oncology Drugs/Conference on Clinical Cancer Research: Schilsky et al, Clinical Cancer Research, Nov 2013
78
Challenges in Optimizing Dosing of Oncology Drugs
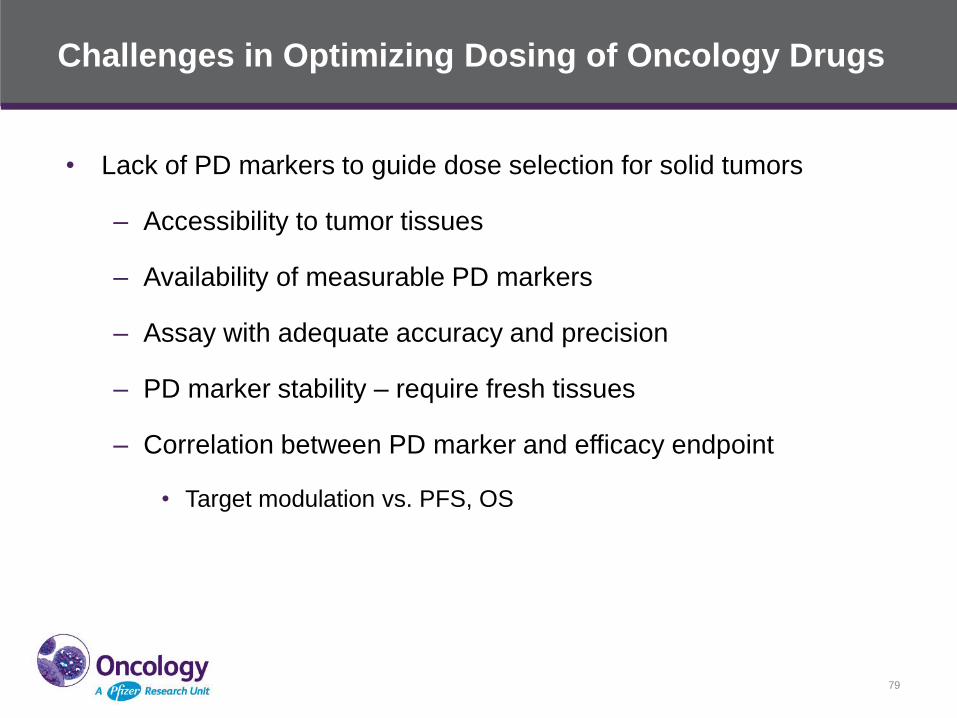
• Lack of PD markers to guide dose selection for solid tumors
– Accessibility to tumor tissues
– Availability of measurable PD markers
– Assay with adequate accuracy and precision
– PD marker stability – require fresh tissues
– Correlation between PD marker and efficacy endpoint
• Target modulation vs. PFS, OS
79
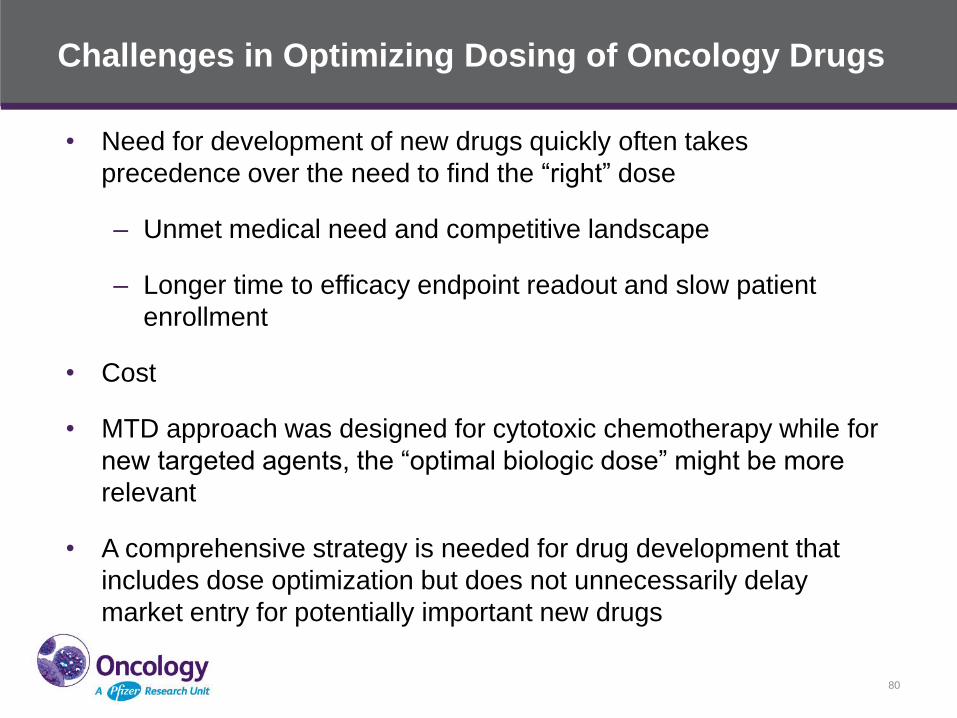
Challenges in Optimizing Dosing of Oncology Drugs
• Need for development of new drugs quickly often takes
precedence over the need to find the “right” dose
– Unmet medical need and competitive landscape
– Longer time to efficacy endpoint readout and slow patient
enrollment
• Cost
• MTD approach was designed for cytotoxic chemotherapy while for
new targeted agents, the “optimal biologic dose” might be more
relevant
• A comprehensive strategy is needed for drug development that
includes dose optimization but does not unnecessarily delay
market entry for potentially important new drugs
80
Strategy to Guide Optimal Dosing Selection for Targeted
Therapies
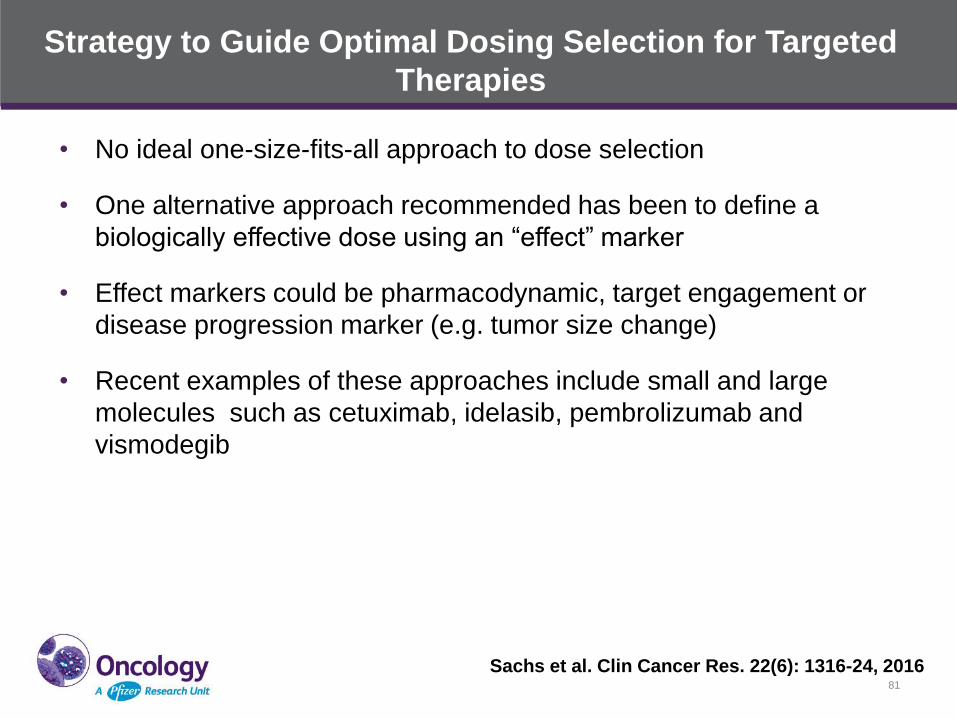
• No ideal one-size-fits-all approach to dose selection
• One alternative approach recommended has been to define a
biologically effective dose using an “effect” marker
• Effect markers could be pharmacodynamic, target engagement or
disease progression marker (e.g. tumor size change)
• Recent examples of these approaches include small and large
molecules such as cetuximab, idelasib, pembrolizumab and
vismodegib
Sachs et al. Clin Cancer Res. 22(6): 1316-24, 2016 81
Model Based Dose Selection and Study Design
• Case 1 - Dose selection for a small molecular inhibitor
– Biomarker modulation
– Dose/Exposure (PK) and potential DDI
– Safety
– Efficacy
• Case 2 – Modified MTD/RP2D determination for a combination
therapy (target therapy + chemo)
– Evaluation of overlapping toxicity by simulation
– Modified MTD/RP2D determination by introducing Granulocyte-
colony stimulating factor (G-CSF) use during MTD determination
and exploring alternative dosing schedules
Pfizer Confidential │ 82
Case 1 - PF-X Evaluation in Phase 1
• PF-X is a small molecule inhibitor currently in Phase 2 development
• Evaluated in hematologic and solid tumor patientss in Phase 1
studies
• First-In-Patient (FIP) study in advanced hematologic malignancies
(AML, MDS, MF, CML) over a dose range of 5-600 mg QD
• Exhibited linear pharmacokinetics over the dose range tested.
Primarily metabolized by CYP3A4/5
• Signs of clinical activity were observed in 23/47 subjects across
different indications and a wide dose range (10-600 mg QD)
• Protocol defined DLT criteria were not met; 400 mg QD was
considered to be the MTD due to a safety finding noted at 600 mg
QD
83
PF-X Evaluation in Phase 1 (continued)
• Skin punch biopsies were collected from 26 patients in three clinical trials
(hematologic and solid tumor studies; dose range: 25-640 mg)
– at baseline and at steady state to measure biomarker expression
• Quantitative real-time polymerase chain reaction used to measure
expression of a transcription factor, which is a marker for pathway
activation/signaling
• Inhibition of signaling results in biomarker remaining inactive and prevents
expression of genes that mediate tumor growth
• Modulation of biomarker gene expression (PD) vs. dose/exposure (PK) of
PF-X evaluated
• Integrated assessment of PK, PD, safety and efficacy used to hone in on
the clinical dose for further evaluation
84
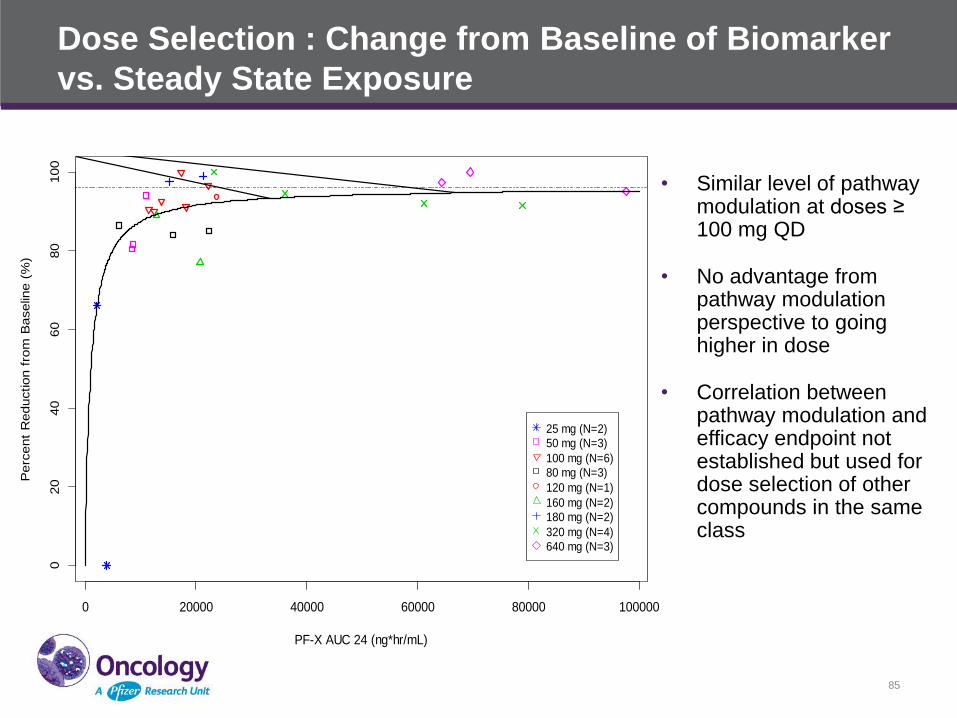
Dose Selection : Change from Baseline of Biomarker
vs. Steady State Exposure
• Similar level of pathway modulation at doses ≥ 100 mg QD
• No advantage from pathway modulation perspective to going higher in dose
• Correlation between pathway modulation and efficacy endpoint not established but used for dose selection of other compounds in the same class
85
0 20000 40000 60000 80000 100000
020
40
60
80
100
PF-X AUC 24 (ng*hr/mL)
Perc
ent
Reduction f
rom
Baselin
e (
%)
GLI1: Change from Baseline vs. Steady State Exposure
25 mg (N=2)
50 mg (N=3)
100 mg (N=6)
80 mg (N=3)
120 mg (N=1)
160 mg (N=2)180 mg (N=2)
320 mg (N=4)
640 mg (N=3)
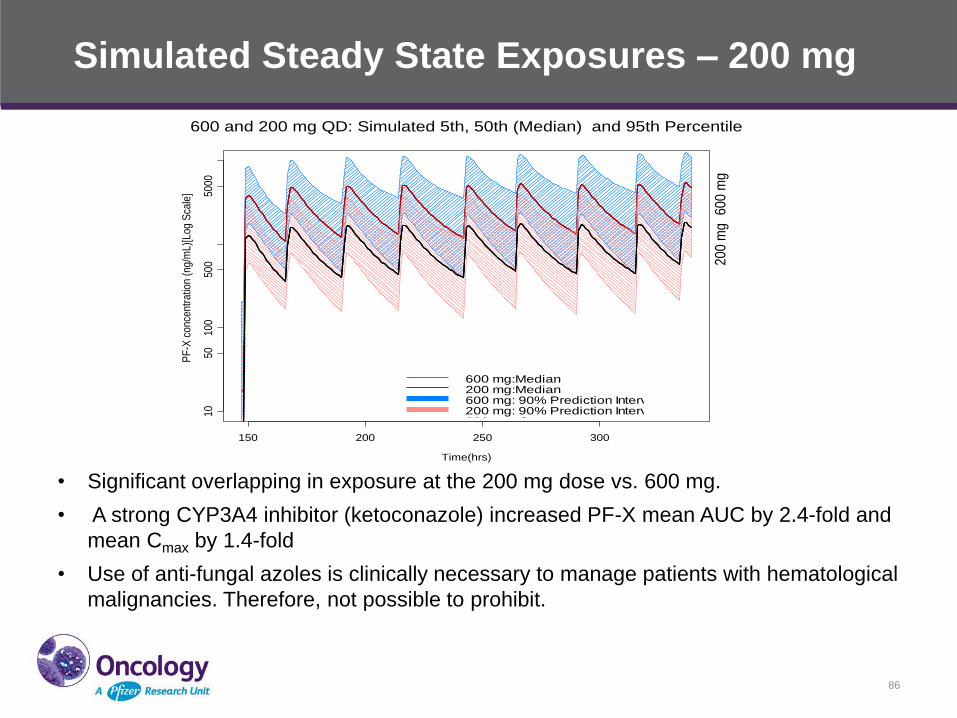
Simulated Steady State Exposures – 200 mg
86
600 and 200 mg QD: Simulated 5th, 50th (Median) and 95th Percentile
Time(hrs)
PF
-X c
onc
ent
ratio
n (n
g/m
L)[L
og S
cale
]
150 200 250 300
1050
100
500
5000
60
0 m
g2
00
mg
600 mg:Median200 mg:Median600 mg: 90% Prediction Interval200 mg: 90% Prediction Interval
600 and 200 mg QD: Simulated 5th, 50th (Median) and 95th Percentile for concentrations based on 1000 simulations
Time(hrs)
PF-
0444
9913
con
cent
ratio
n (n
g/m
L)
150 200 250 300
1050
100
500
1000
5000
1000
0
3-fo
ld
600 mg:Median200 mg:Median600 mg: 90% Prediction Interval200 mg: 90% Prediction Interval600 mg: Cmax200 mg: Cmax
Cmin,eff:62 ng/mL
• Significant overlapping in exposure at the 200 mg dose vs. 600 mg.
• A strong CYP3A4 inhibitor (ketoconazole) increased PF-X mean AUC by 2.4-fold and
mean Cmax by 1.4-fold
• Use of anti-fungal azoles is clinically necessary to manage patients with hematological
malignancies. Therefore, not possible to prohibit.
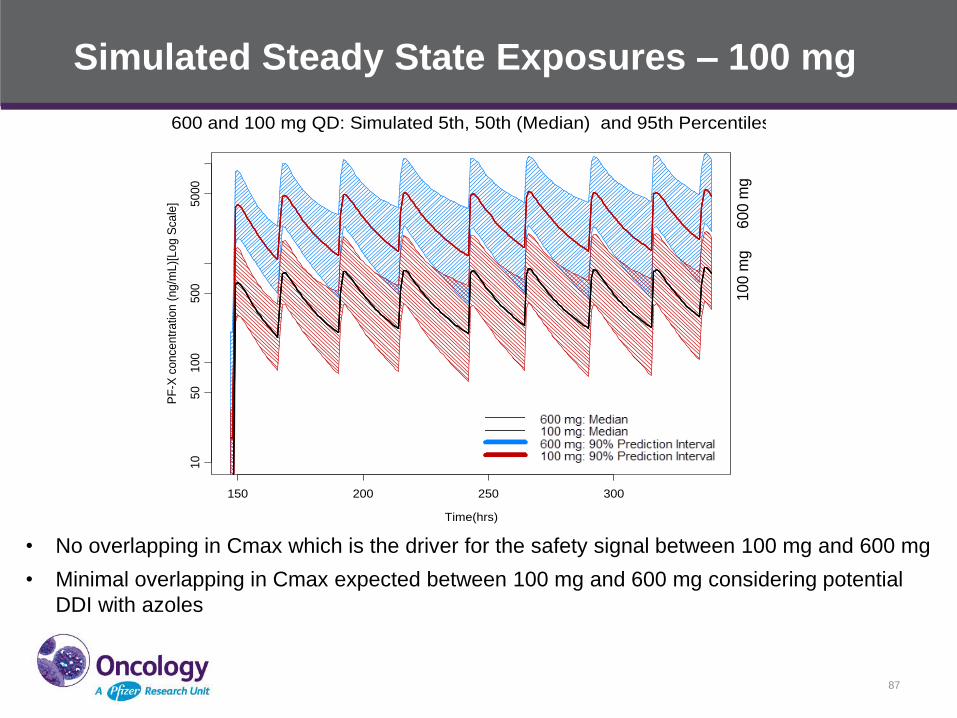
Simulated Steady State Exposures – 100 mg
87
600 and 100 mg QD: Simulated 5th, 50th (Median) and 95th Percentiles
Time(hrs)
PF
-X c
once
ntr
atio
n (
ng
/mL)[
Log
Sca
le]
150 200 250 300
10
50
100
500
5000
60
0 m
g1
00
mg
600 mg: Median100 mg: Median600 mg: 90% Prediction Interval100 mg: 90% Prediction Interval
• No overlapping in Cmax which is the driver for the safety signal between 100 mg and 600 mg
• Minimal overlapping in Cmax expected between 100 mg and 600 mg considering potential
DDI with azoles
• 100 mg dose was selected for further evaluations in Ph 2
clinical trials based on
– Similar down-regulation of pathway activation marker at ≥ 100 mg
– Observation of clinical activity across a wide range of doses in the
FIP study
– Exposure level and DDI potential on co-administration with a
CYP3A4 inhibitor (such as clinically necessary azoles in
AML/MDS) in relation to the exposure range that had safety
signals
– Better safety/tolerability profile of PF-X at lower doses
Pfizer Confidential │ 88
PF-X Phase 2 Dose Selection
Case 2 - Model aided Study Design for MTD/RP2D
Determination
• Drug A (300 mg) was approved for the treatment of solid tumor X
• Drug B was in phase 1 clinical trial as monotherapy and 50 mg was
identified as the MTD
• Pre-clinical model showed synergistic effect in solid tumor X when
Drug B is given in combination with Drug A
• A Phase 1B clinical trial is designed to evaluate the safety, PK, and
early sign of efficacy in patients with solid tumor X
• No available markers of target modulation for dose selection
• MTD approach will be used for RP2D
Pfizer Confidential │ 89
Challenge for the combined therapy of
Drug A and B
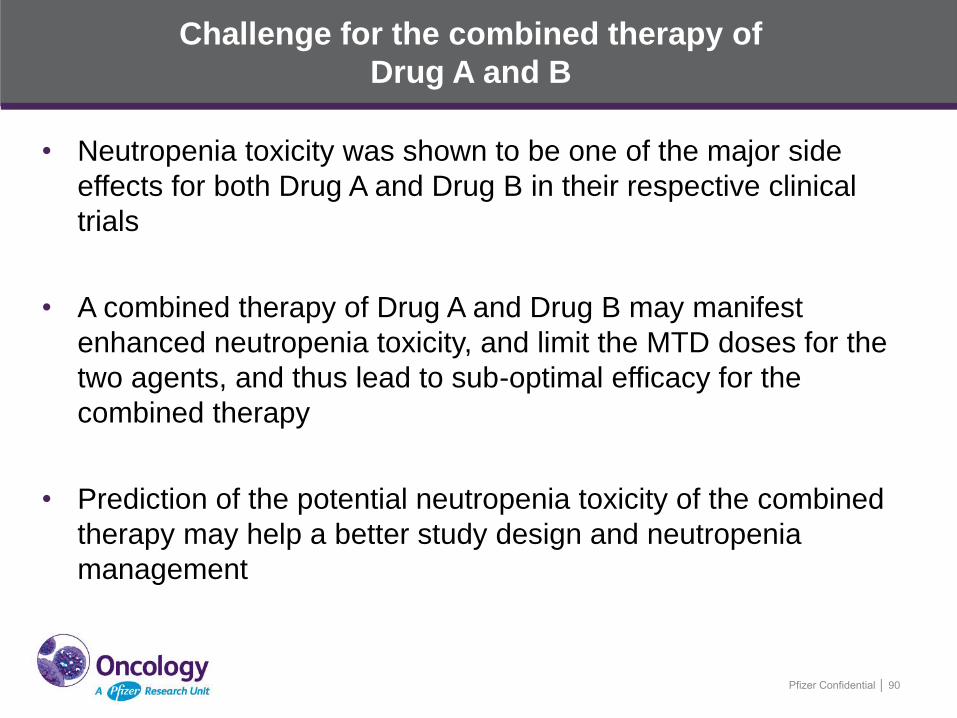
• Neutropenia toxicity was shown to be one of the major side
effects for both Drug A and Drug B in their respective clinical
trials
• A combined therapy of Drug A and Drug B may manifest
enhanced neutropenia toxicity, and limit the MTD doses for the
two agents, and thus lead to sub-optimal efficacy for the
combined therapy
• Prediction of the potential neutropenia toxicity of the combined
therapy may help a better study design and neutropenia
management
Pfizer Confidential │ 90
PK/PD Model for Predicting Neutrophil Profile for the Combined
Therapy of Drug A and Drug B in Solid Tumor X
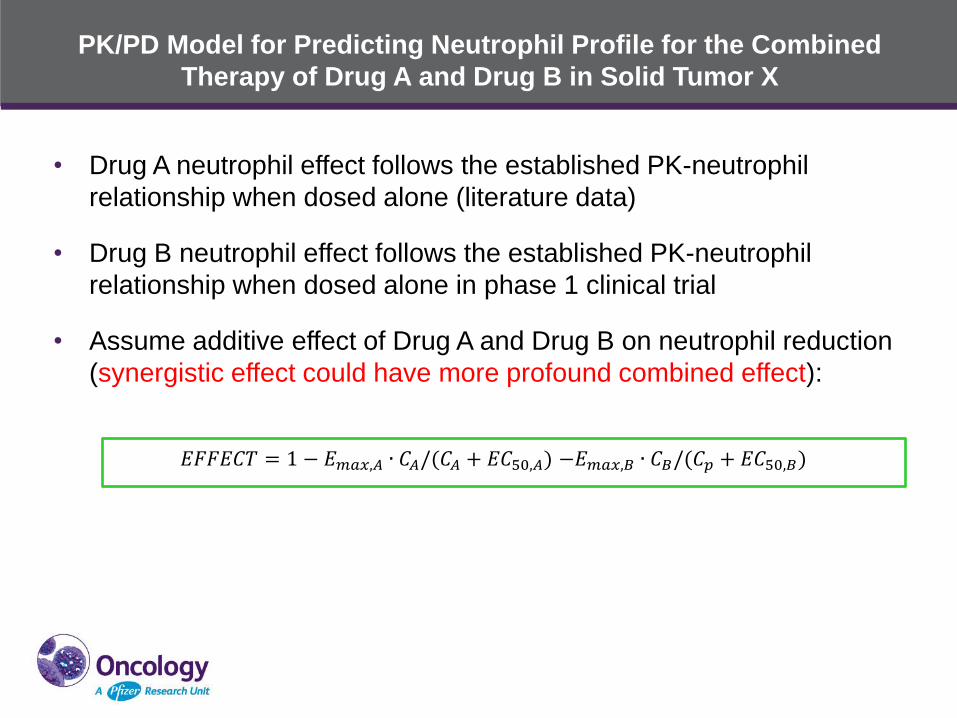
• Drug A neutrophil effect follows the established PK-neutrophil
relationship when dosed alone (literature data)
• Drug B neutrophil effect follows the established PK-neutrophil
relationship when dosed alone in phase 1 clinical trial
• Assume additive effect of Drug A and Drug B on neutrophil reduction
(synergistic effect could have more profound combined effect):
𝐸𝐹𝐹𝐸𝐶𝑇 = 1 − 𝐸𝑚𝑎𝑥,𝐴 ∙ 𝐶𝐴/(𝐶𝐴 + 𝐸𝐶50,𝐴) −𝐸𝑚𝑎𝑥,𝐵 ∙ 𝐶𝐵/(𝐶𝑝 + 𝐸𝐶50,𝐵)
Pfizer Confidential │ 92
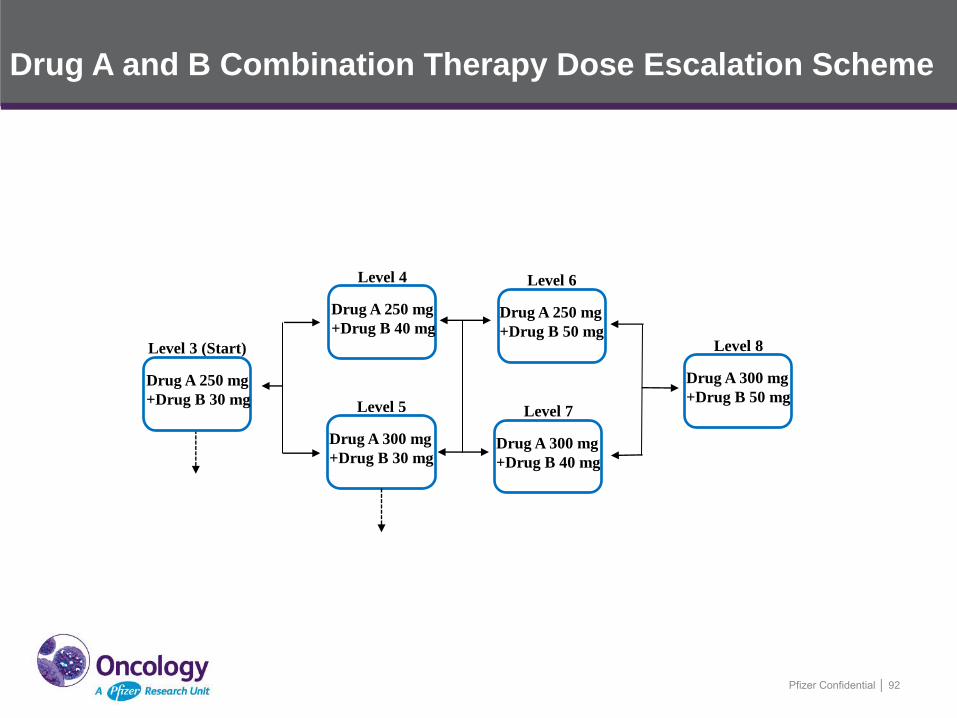
Level 3 (Start)
Drug A 250 mg
+Drug B 30 mg
Level 4
Drug A 250 mg
+Drug B 40 mg
Level 5
Drug A 300 mg
+Drug B 30 mg
Level 6
Drug A 250 mg
+Drug B 50 mg
Level 7
Drug A 300 mg
+Drug B 40 mg
Level 8
Drug A 300 mg
+Drug B 50 mg
Drug A and B Combination Therapy Dose Escalation Scheme
Predicted Neutrophil Profiles of the
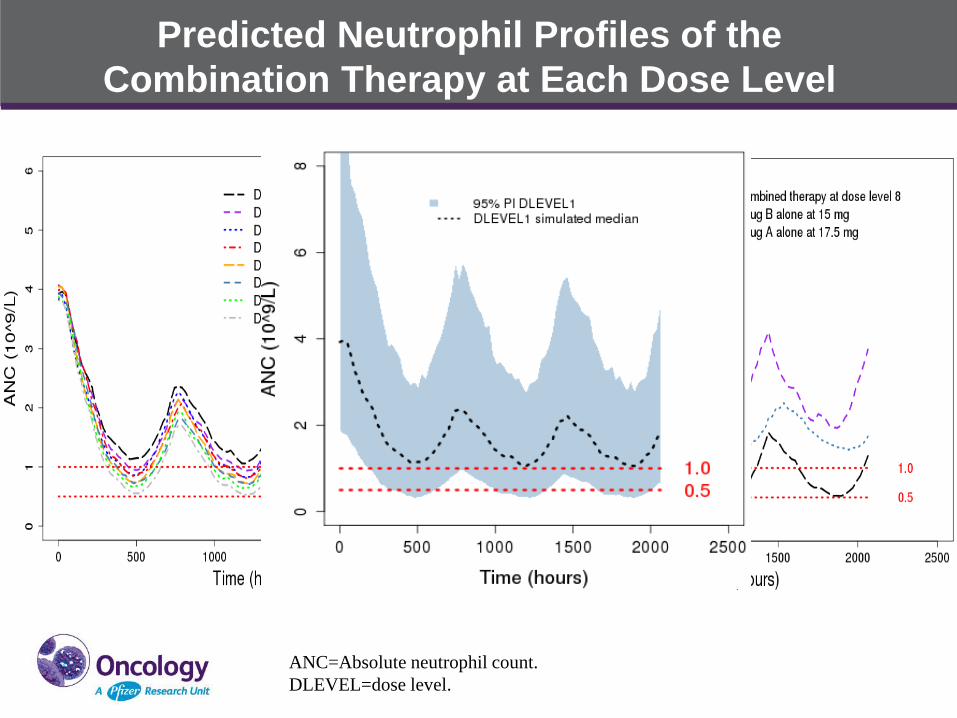
Combination Therapy at Each Dose Level
ANC=Absolute neutrophil count.
DLEVEL=dose level.
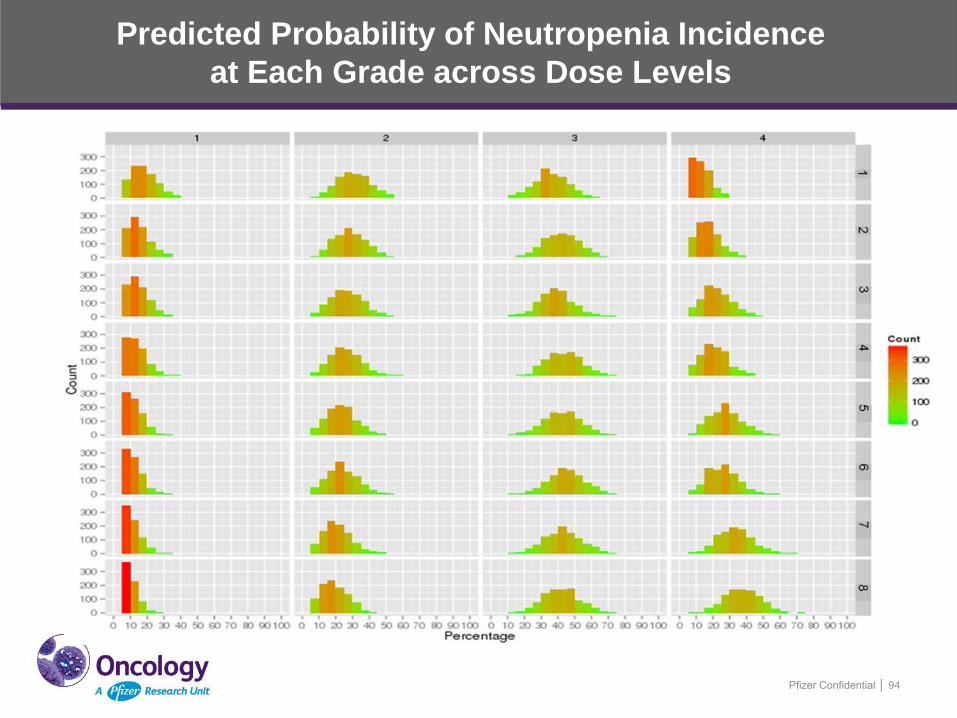
Predicted Probability of Neutropenia Incidence
at Each Grade across Dose Levels
Pfizer Confidential │ 94
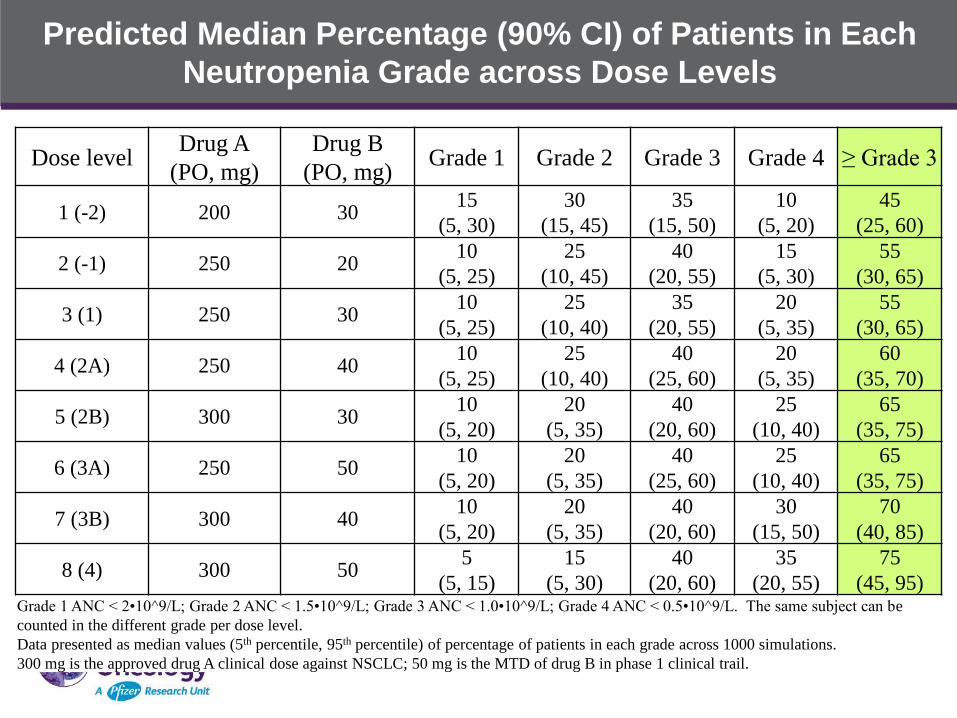
Predicted Median Percentage (90% CI) of Patients in Each
Neutropenia Grade across Dose Levels
Dose level Drug A
(PO, mg)
Drug B
(PO, mg) Grade 1 Grade 2 Grade 3 Grade 4 ≥ Grade 3
1 (-2) 200 30 15
(5, 30)
30
(15, 45)
35
(15, 50)
10
(5, 20)
45
(25, 60)
2 (-1) 250 20 10
(5, 25)
25
(10, 45)
40
(20, 55)
15
(5, 30)
55
(30, 65)
3 (1) 250 30 10
(5, 25)
25
(10, 40)
35
(20, 55)
20
(5, 35)
55
(30, 65)
4 (2A) 250 40 10
(5, 25)
25
(10, 40)
40
(25, 60)
20
(5, 35)
60
(35, 70)
5 (2B) 300 30 10
(5, 20)
20
(5, 35)
40
(20, 60)
25
(10, 40)
65
(35, 75)
6 (3A) 250 50 10
(5, 20)
20
(5, 35)
40
(25, 60)
25
(10, 40)
65
(35, 75)
7 (3B) 300 40 10
(5, 20)
20
(5, 35)
40
(20, 60)
30
(15, 50)
70
(40, 85)
8 (4) 300 50 5
(5, 15)
15
(5, 30)
40
(20, 60)
35
(20, 55)
75
(45, 95) Grade 1 ANC < 2•10^9/L; Grade 2 ANC < 1.5•10^9/L; Grade 3 ANC < 1.0•10^9/L; Grade 4 ANC < 0.5•10^9/L. The same subject can be
counted in the different grade per dose level.
Data presented as median values (5th percentile, 95th percentile) of percentage of patients in each grade across 1000 simulations.
300 mg is the approved drug A clinical dose against NSCLC; 50 mg is the MTD of drug B in phase 1 clinical trail.
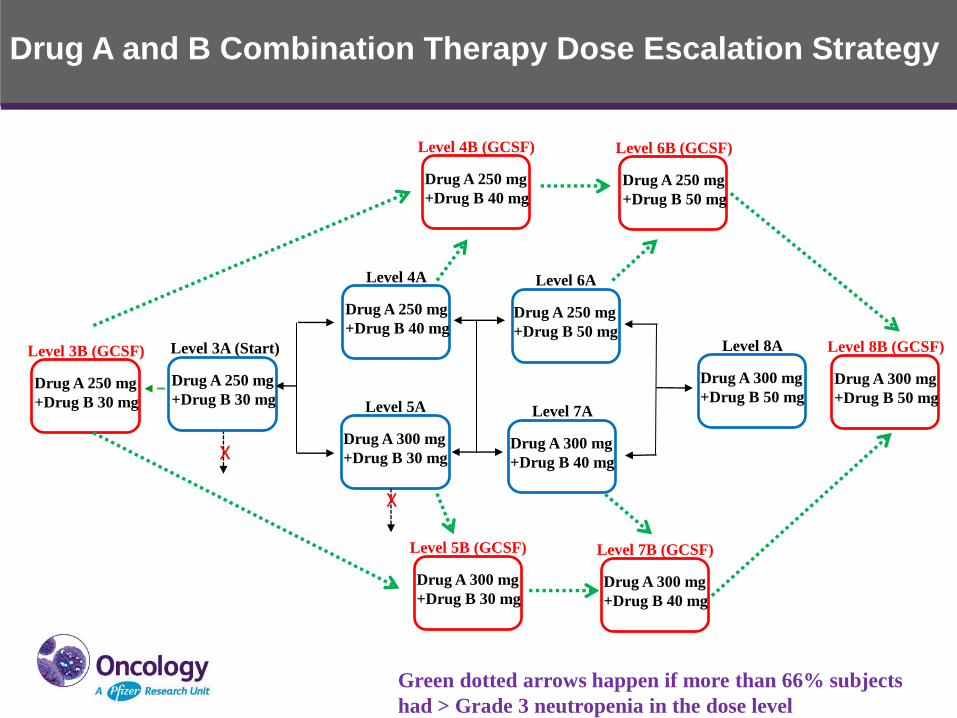
Drug A and B Combination Therapy Dose Escalation Strategy
Level 3A (Start)
Drug A 250 mg
+Drug B 30 mg
Level 4A
Drug A 250 mg
+Drug B 40 mg
Level 5A
Drug A 300 mg
+Drug B 30 mg
Level 6A
Drug A 250 mg
+Drug B 50 mg
Level 7A
Drug A 300 mg
+Drug B 40 mg
Level 8A
Drug A 300 mg
+Drug B 50 mg
Level 4B (GCSF)
Drug A 250 mg
+Drug B 40 mg
Level 5B (GCSF)
Drug A 300 mg
+Drug B 30 mg
Level 6B (GCSF)
Drug A 250 mg
+Drug B 50 mg
Level 7B (GCSF)
Drug A 300 mg
+Drug B 40 mg
Level 8B (GCSF)
Drug A 300 mg
+Drug B 50 mg
Level 3B (GCSF)
Drug A 250 mg
+Drug B 30 mg
Green dotted arrows happen if more than 66% subjects
had > Grade 3 neutropenia in the dose level
X
X
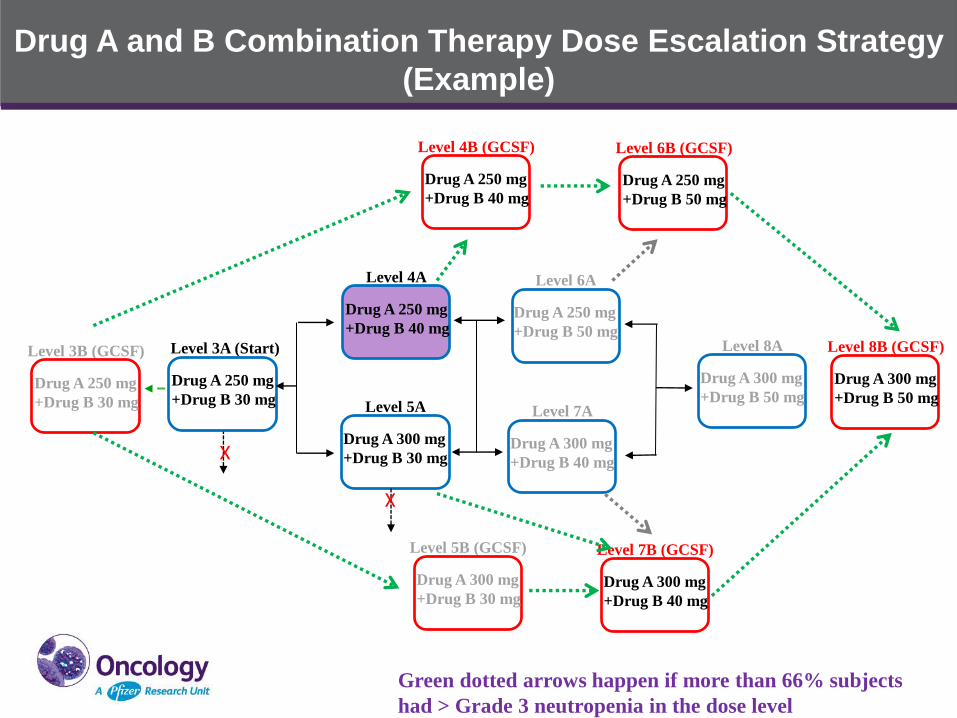
Drug A and B Combination Therapy Dose Escalation Strategy
(Example)
Level 3A (Start)
Drug A 250 mg
+Drug B 30 mg
Level 4A
Drug A 250 mg
+Drug B 40 mg
Level 5A
Drug A 300 mg
+Drug B 30 mg
Level 6A
Drug A 250 mg
+Drug B 50 mg
Level 7A
Drug A 300 mg
+Drug B 40 mg
Level 8A
Drug A 300 mg
+Drug B 50 mg
Level 4B (GCSF)
Drug A 250 mg
+Drug B 40 mg
Level 5B (GCSF)
Drug A 300 mg
+Drug B 30 mg
Level 6B (GCSF)
Drug A 250 mg
+Drug B 50 mg
Level 7B (GCSF)
Drug A 300 mg
+Drug B 40 mg
Level 8B (GCSF)
Drug A 300 mg
+Drug B 50 mg
Level 3B (GCSF)
Drug A 250 mg
+Drug B 30 mg
Green dotted arrows happen if more than 66% subjects
had > Grade 3 neutropenia in the dose level
X
X
Summary
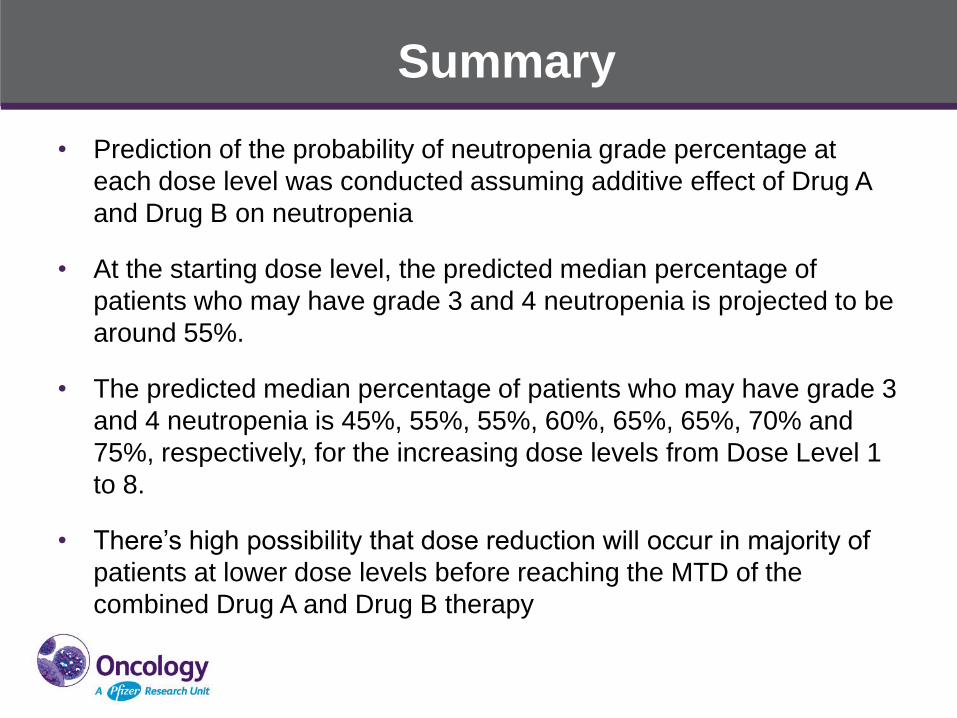
• Prediction of the probability of neutropenia grade percentage at
each dose level was conducted assuming additive effect of Drug A
and Drug B on neutropenia
• At the starting dose level, the predicted median percentage of
patients who may have grade 3 and 4 neutropenia is projected to be
around 55%.
• The predicted median percentage of patients who may have grade 3
and 4 neutropenia is 45%, 55%, 55%, 60%, 65%, 65%, 70% and
75%, respectively, for the increasing dose levels from Dose Level 1
to 8.
• There’s high possibility that dose reduction will occur in majority of
patients at lower dose levels before reaching the MTD of the
combined Drug A and Drug B therapy
Summary (continued)
• Introducing secondary prophylaxis G-CSF use before dose
reduction in DLT evaluation period as a mitigation strategy for
neutropenia management to maximize the potential efficacy of the
Drug A and Drug B combination therapy, the DLT evaluation period
will be extended to 2 cycles for G-CSF dose escalation cohorts
• Other alternative dosing schedules are also being explored to
mitigate neutropenia without G-CSF use
Overall, modeling and simulation is a useful tool in dose selection
and more informed study design
Acknowledgement
• Naveed Shaik
• Yanke Yu
• Kourosh Parivar
Pfizer Confidential │ 100
Gabriel Helmlinger’s slides have been withheld from this presentation.
Session I Panel Discussion
Exposure-Response Relationships and Modeling/Simulation for Dose Finding
Chair: Geoffrey Kim, MD
Speakers: Dinesh De Alwis, PhD Shruti Agrawal, PhD Chyi-Hung Hsu, PhD
Diane Wang, PhD Gabriel Helmlinger, MD, PhD
Panelists: Kelvin Dickenson
Jin Jin, PhD Sumithra Mandrekar, PhD
Lillian Siu, MD Yaning Wang, PhD

Lunch Break 11:50 am – 12:50 pm
Session II Non-Clinical Models Used for
Go/No-Go Decisions
Chair: Todd Palmby, PhD
Speakers: Darren Cross, PhD
Chandni Valiathan, PhD Alan Korman, PhD
Juliet Williams, PhD
Panelists: Hans Loland
Thomas Jaki, PhD Mark Ratain, MD
Amit Roy, PhD Karthick Vishwanathan, PhD
The journey of osimertinib discovery: from the lab to the clinic
Darren Cross, Principal Scientist, AstraZeneca
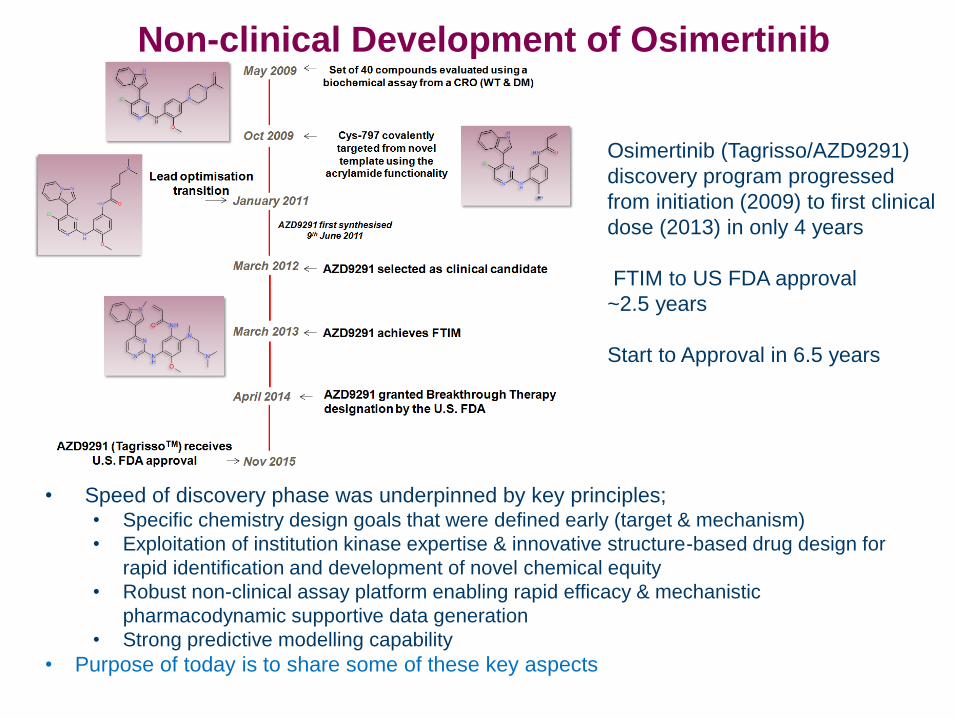
• Speed of discovery phase was underpinned by key principles; • Specific chemistry design goals that were defined early (target & mechanism)
• Exploitation of institution kinase expertise & innovative structure-based drug design for
rapid identification and development of novel chemical equity
• Robust non-clinical assay platform enabling rapid efficacy & mechanistic
pharmacodynamic supportive data generation
• Strong predictive modelling capability
• Purpose of today is to share some of these key aspects
Non-clinical Development of Osimertinib
Osimertinib (Tagrisso/AZD9291)
discovery program progressed
from initiation (2009) to first clinical
dose (2013) in only 4 years
FTIM to US FDA approval
~2.5 years
Start to Approval in 6.5 years
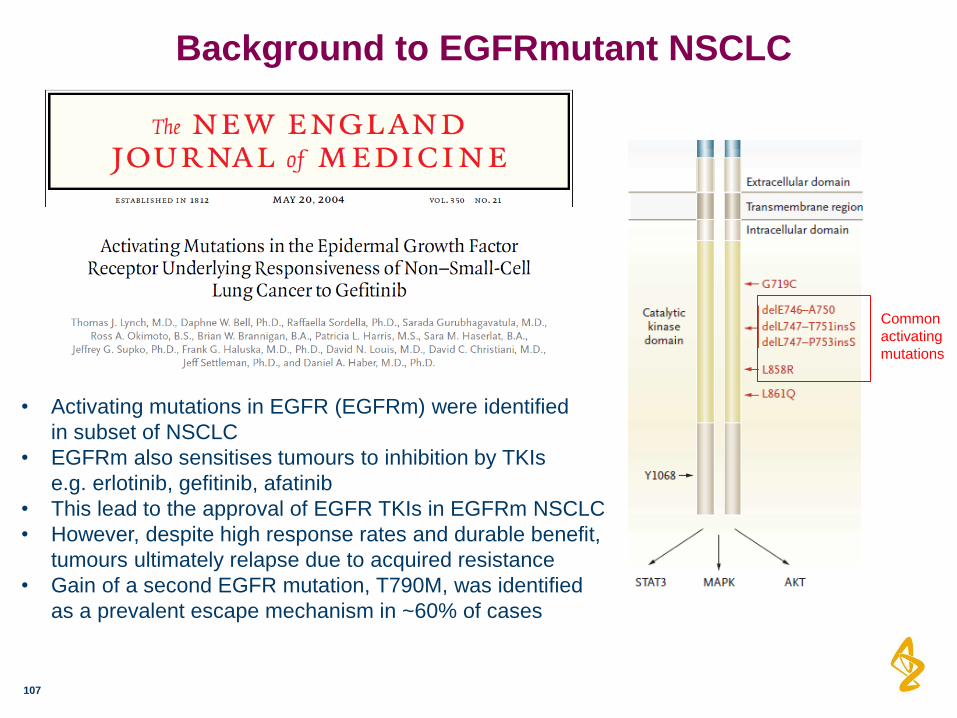
Background to EGFRmutant NSCLC
107
• Activating mutations in EGFR (EGFRm) were identified
in subset of NSCLC
• EGFRm also sensitises tumours to inhibition by TKIs
e.g. erlotinib, gefitinib, afatinib
• This lead to the approval of EGFR TKIs in EGFRm NSCLC
• However, despite high response rates and durable benefit,
tumours ultimately relapse due to acquired resistance
• Gain of a second EGFR mutation, T790M, was identified
as a prevalent escape mechanism in ~60% of cases
Common
activating
mutations
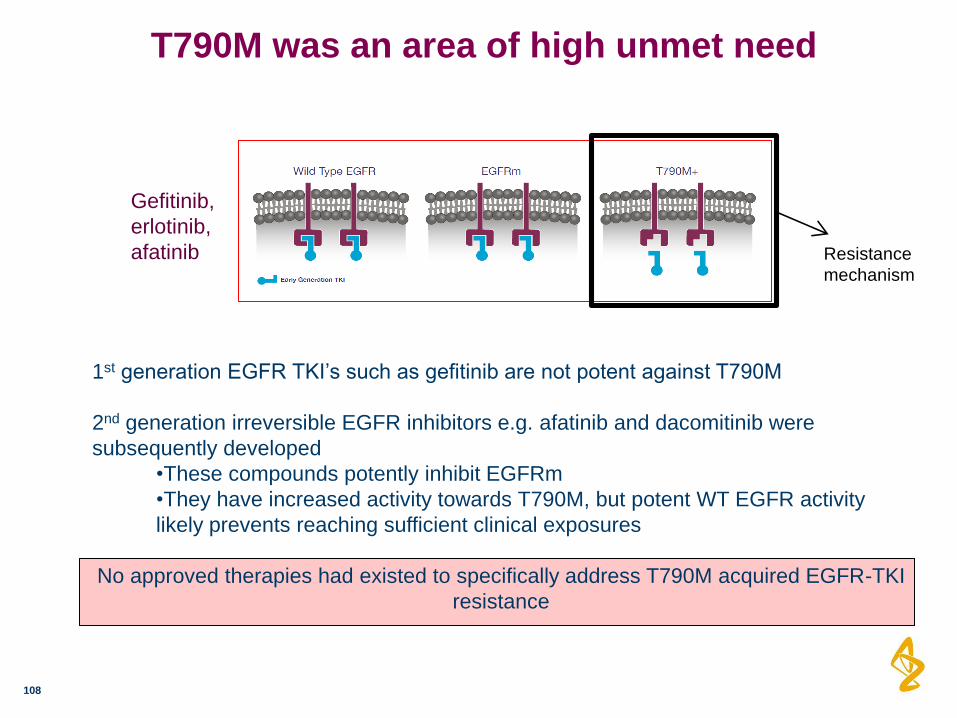
T790M was an area of high unmet need
108
1st generation EGFR TKI’s such as gefitinib are not potent against T790M
2nd generation irreversible EGFR inhibitors e.g. afatinib and dacomitinib were
subsequently developed
•These compounds potently inhibit EGFRm
•They have increased activity towards T790M, but potent WT EGFR activity
likely prevents reaching sufficient clinical exposures
No approved therapies had existed to specifically address T790M acquired EGFR-TKI
resistance
Gefitinib,
erlotinib,
afatinib Resistance
mechanism
109
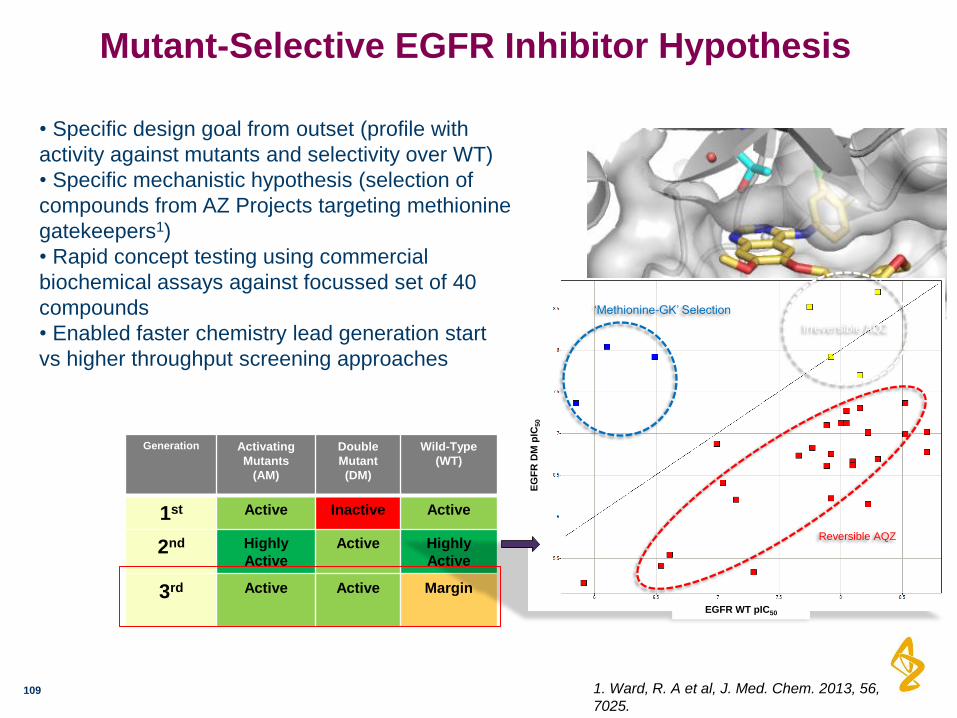
Mutant-Selective EGFR Inhibitor Hypothesis
Generation Activating
Mutants
(AM)
Double
Mutant
(DM)
Wild-Type
(WT)
1st Active Inactive Active
2nd Highly
Active
Active Highly
Active
3rd Active Active Margin
1. Ward, R. A et al, J. Med. Chem. 2013, 56,
7025.
• Specific design goal from outset (profile with
activity against mutants and selectivity over WT)
• Specific mechanistic hypothesis (selection of
compounds from AZ Projects targeting methionine
gatekeepers1)
• Rapid concept testing using commercial
biochemical assays against focussed set of 40
compounds
• Enabled faster chemistry lead generation start
vs higher throughput screening approaches
EG
FR
DM
pIC
50
EGFR WT pIC50
‘Methionine-GK’ Selection
Irreversible AQZ
Reversible AQZ
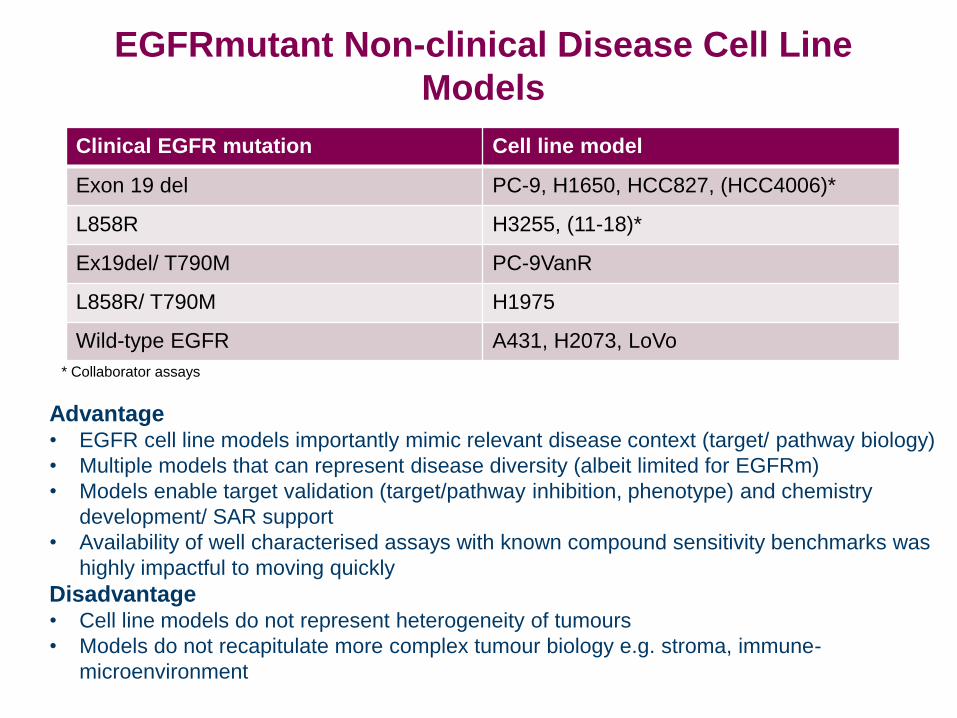
Clinical EGFR mutation Cell line model
Exon 19 del PC-9, H1650, HCC827, (HCC4006)*
L858R H3255, (11-18)*
Ex19del/ T790M PC-9VanR
L858R/ T790M H1975
Wild-type EGFR A431, H2073, LoVo
Advantage • EGFR cell line models importantly mimic relevant disease context (target/ pathway biology)
• Multiple models that can represent disease diversity (albeit limited for EGFRm)
• Models enable target validation (target/pathway inhibition, phenotype) and chemistry
development/ SAR support
• Availability of well characterised assays with known compound sensitivity benchmarks was
highly impactful to moving quickly
Disadvantage • Cell line models do not represent heterogeneity of tumours
• Models do not recapitulate more complex tumour biology e.g. stroma, immune-
microenvironment
EGFRmutant Non-clinical Disease Cell Line
Models
* Collaborator assays
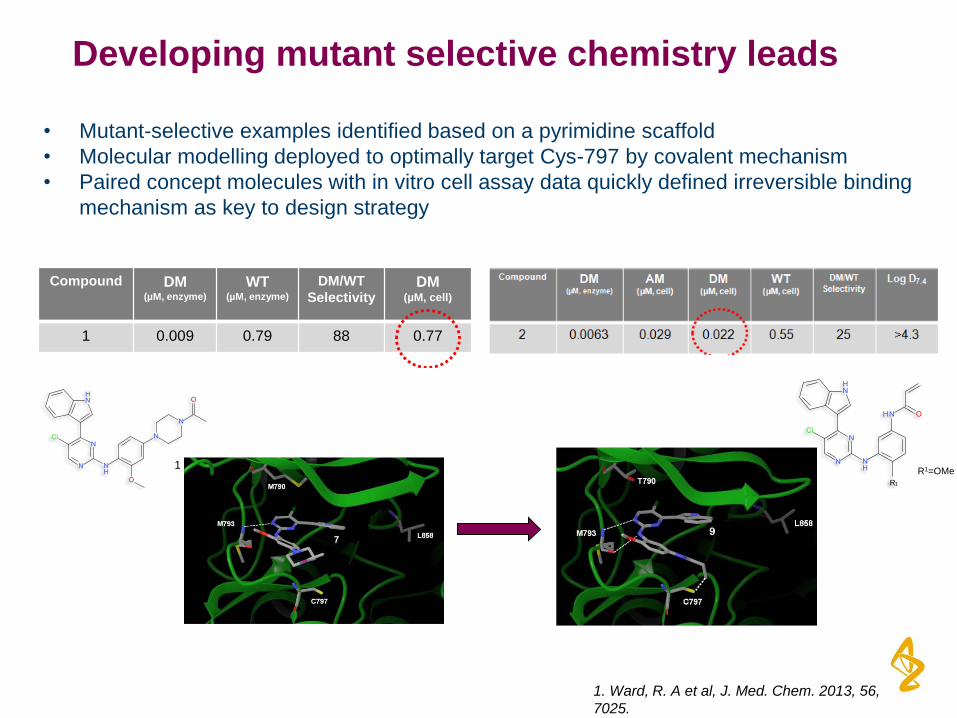
Developing mutant selective chemistry leads
• Mutant-selective examples identified based on a pyrimidine scaffold
• Molecular modelling deployed to optimally target Cys-797 by covalent mechanism
• Paired concept molecules with in vitro cell assay data quickly defined irreversible binding
mechanism as key to design strategy
1
Compound DM (µM, enzyme)
WT(µM, enzyme)
DM/WT
SelectivityDM
(µM, cell)
1 0.009 0.79 88 0.77
R1
R1=OMe2
1. Ward, R. A et al, J. Med. Chem. 2013, 56,
7025.
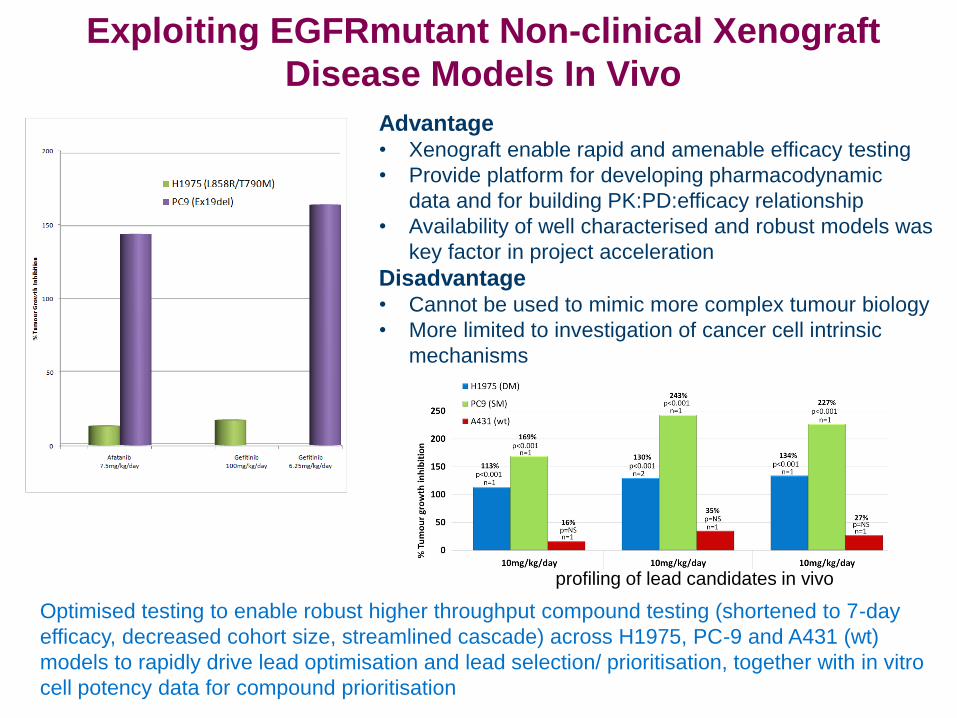
Exploiting EGFRmutant Non-clinical Xenograft
Disease Models In Vivo
Advantage • Xenograft enable rapid and amenable efficacy testing
• Provide platform for developing pharmacodynamic
data and for building PK:PD:efficacy relationship
• Availability of well characterised and robust models was
key factor in project acceleration
Disadvantage • Cannot be used to mimic more complex tumour biology
• More limited to investigation of cancer cell intrinsic
mechanisms
Optimised testing to enable robust higher throughput compound testing (shortened to 7-day
efficacy, decreased cohort size, streamlined cascade) across H1975, PC-9 and A431 (wt)
models to rapidly drive lead optimisation and lead selection/ prioritisation, together with in vitro
cell potency data for compound prioritisation
profiling of lead candidates in vivo
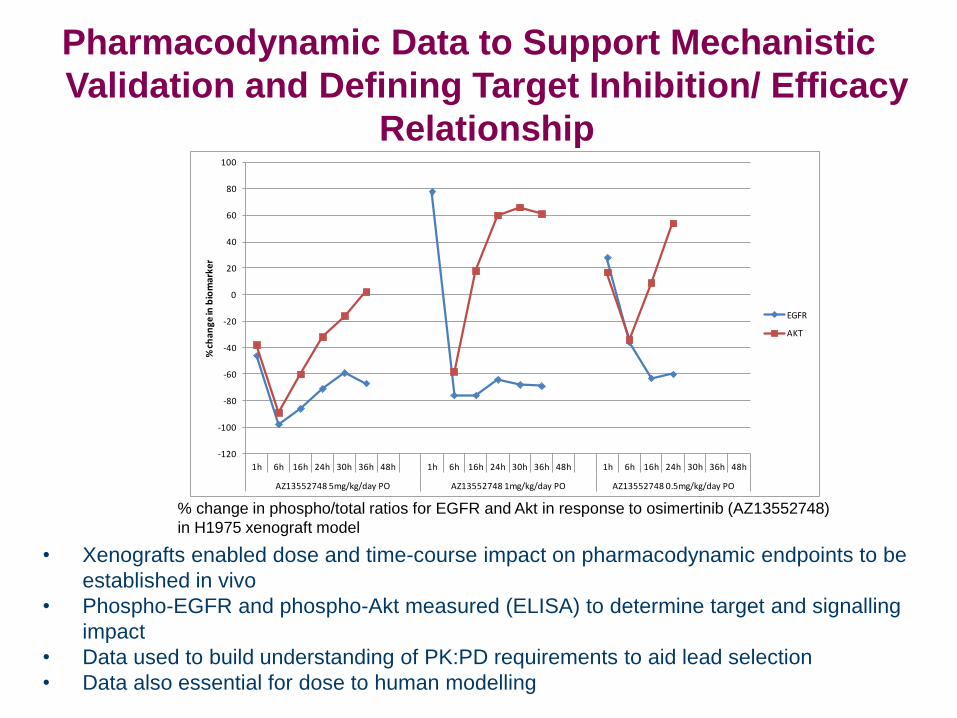
Pharmacodynamic Data to Support Mechanistic
Validation and Defining Target Inhibition/ Efficacy
Relationship
-120
-100
-80
-60
-40
-20
0
20
40
60
80
100
1h 6h 16h 24h 30h 36h 48h 1h 6h 16h 24h 30h 36h 48h 1h 6h 16h 24h 30h 36h 48h
AZ13552748 5mg/kg/day PO AZ13552748 1mg/kg/day PO AZ13552748 0.5mg/kg/day PO
% c
han
ge in
bio
mar
ker
EGFR
AKT
• Xenografts enabled dose and time-course impact on pharmacodynamic endpoints to be
established in vivo
• Phospho-EGFR and phospho-Akt measured (ELISA) to determine target and signalling
impact
• Data used to build understanding of PK:PD requirements to aid lead selection
• Data also essential for dose to human modelling
% change in phospho/total ratios for EGFR and Akt in response to osimertinib (AZ13552748)
in H1975 xenograft model
114
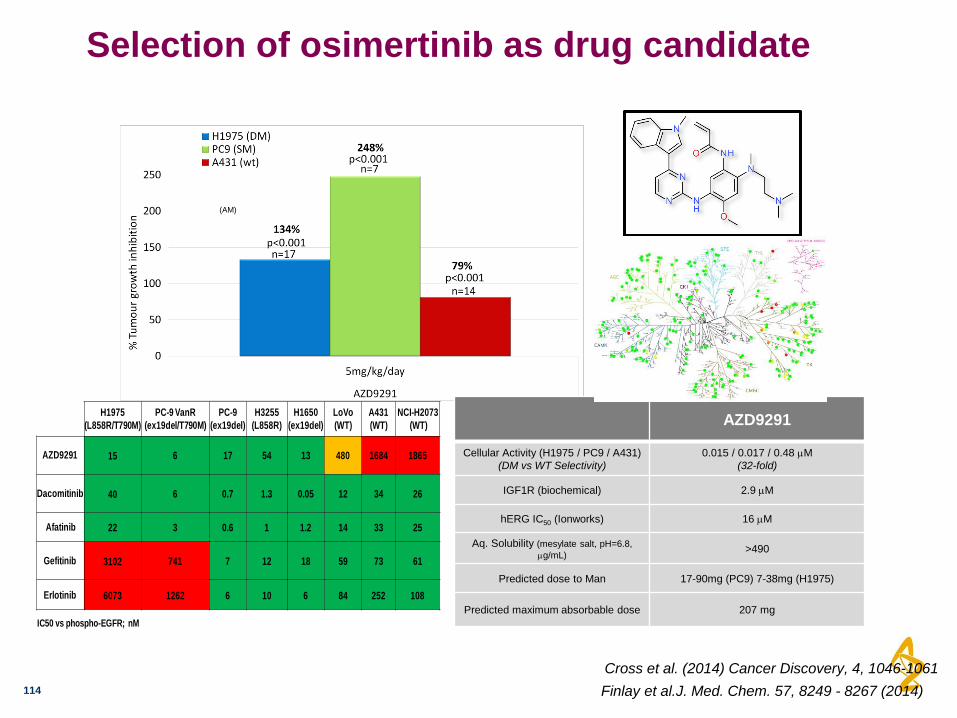
Selection of osimertinib as drug candidate
AZD9291
Cellular Activity (H1975 / PC9 / A431)
(DM vs WT Selectivity)
0.015 / 0.017 / 0.48 M
(32-fold)
IGF1R (biochemical) 2.9 M
hERG IC50 (Ionworks) 16 M
Aq. Solubility (mesylate salt, pH=6.8,
g/mL) >490
Predicted dose to Man 17-90mg (PC9) 7-38mg (H1975)
Predicted maximum absorbable dose 207 mg
(AM)
H1975
(L858R/T790M)
PC-9 VanR
(ex19del/T790M)
PC-9
(ex19del)
H3255
(L858R)
H1650
(ex19del)
LoVo
(WT)
A431
(WT)
NCI-H2073
(WT)
AZD9291 15 6 17 54 13 480 1684 1865
Dacomitinib 40 6 0.7 1.3 0.05 12 34 26
Afatinib 22 3 0.6 1 1.2 14 33 25
Gefitinib 3102 741 7 12 18 59 73 61
Erlotinib 6073 1262 6 10 6 84 252 108
IC50 vs phospho-EGFR; nM
Cross et al. (2014) Cancer Discovery, 4, 1046-1061
Finlay et al.J. Med. Chem. 57, 8249 - 8267 (2014)
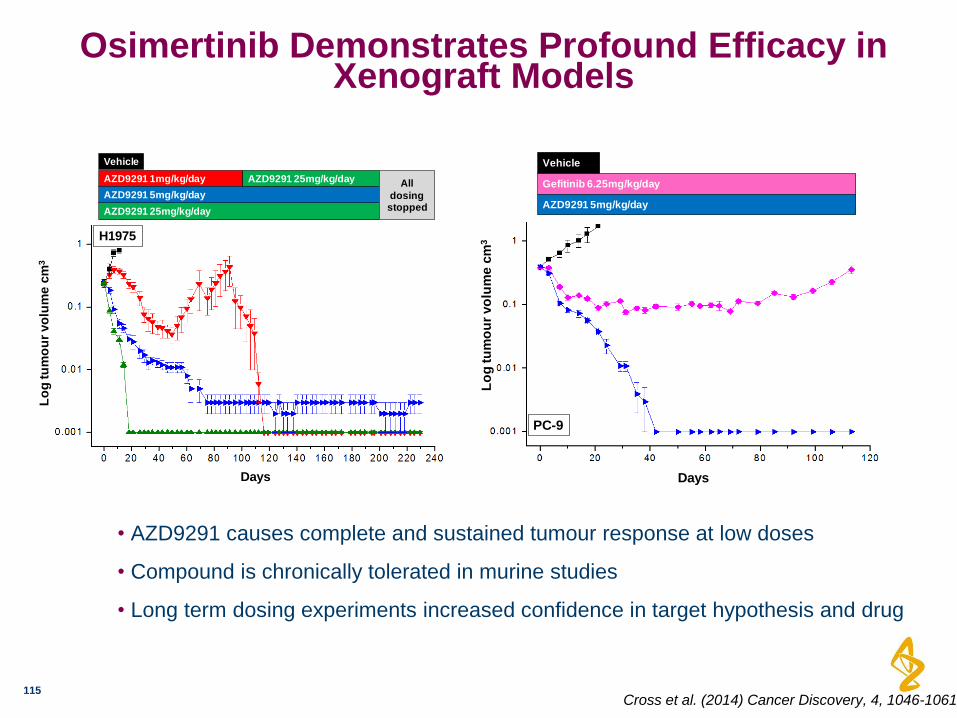
Osimertinib Demonstrates Profound Efficacy in Xenograft Models
115
• AZD9291 causes complete and sustained tumour response at low doses
• Compound is chronically tolerated in murine studies
• Long term dosing experiments increased confidence in target hypothesis and drug
Days
Lo
g tu
mo
ur
vo
lum
e c
m3
H1975
AZD9291 1mg/kg/day
AZD9291 25mg/kg/day
AZD9291 5mg/kg/day
Vehicle
AZD9291 25mg/kg/day All
dosing stopped
DaysL
og
tu
mo
ur
vo
lum
e c
m3
PC-9
Gefitinib 6.25mg/kg/day
AZD9291 5mg/kg/day
Vehicle
Cross et al. (2014) Cancer Discovery, 4, 1046-1061
Pre Post
Vehicle
AZD9291
Afatinib
L858R
H H
H H
H H
C
Vehicle
AZD9291
Afatinib
Pre Post
L858R+T790M
H H
L L
H H
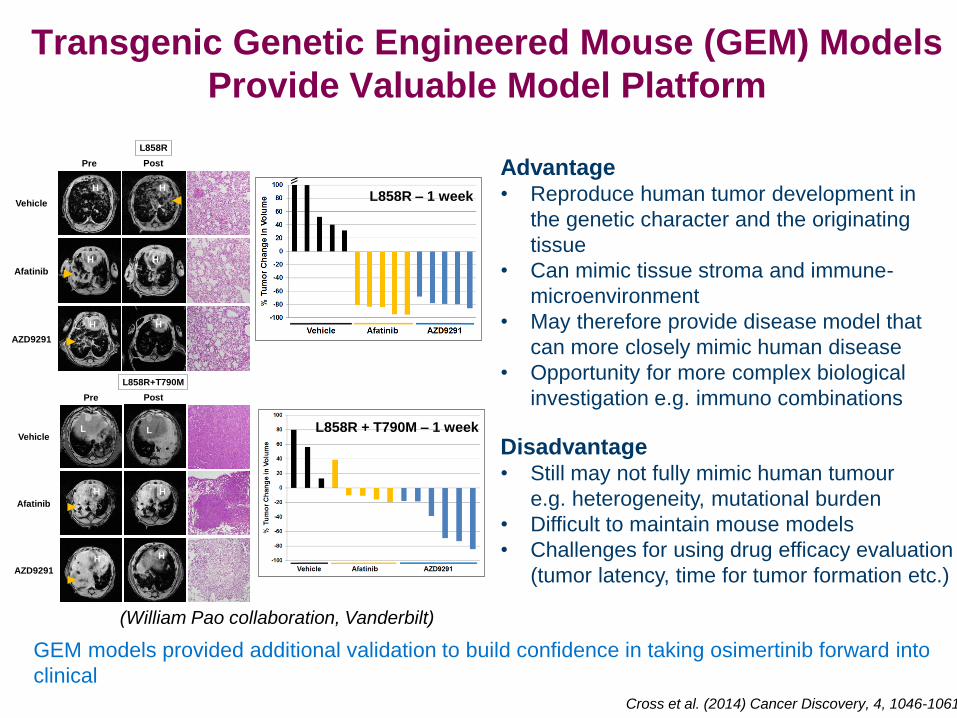
Transgenic Genetic Engineered Mouse (GEM) Models
Provide Valuable Model Platform
L858R – 1 week
L858R + T790M – 1 week
L858R – 1 week
L858R + T790M – 1 week
Advantage • Reproduce human tumor development in
the genetic character and the originating
tissue
• Can mimic tissue stroma and immune-
microenvironment
• May therefore provide disease model that
can more closely mimic human disease
• Opportunity for more complex biological
investigation e.g. immuno combinations
Disadvantage • Still may not fully mimic human tumour
e.g. heterogeneity, mutational burden
• Difficult to maintain mouse models
• Challenges for using drug efficacy evaluation
(tumor latency, time for tumor formation etc.)
GEM models provided additional validation to build confidence in taking osimertinib forward into
clinical
Cross et al. (2014) Cancer Discovery, 4, 1046-1061
(William Pao collaboration, Vanderbilt)
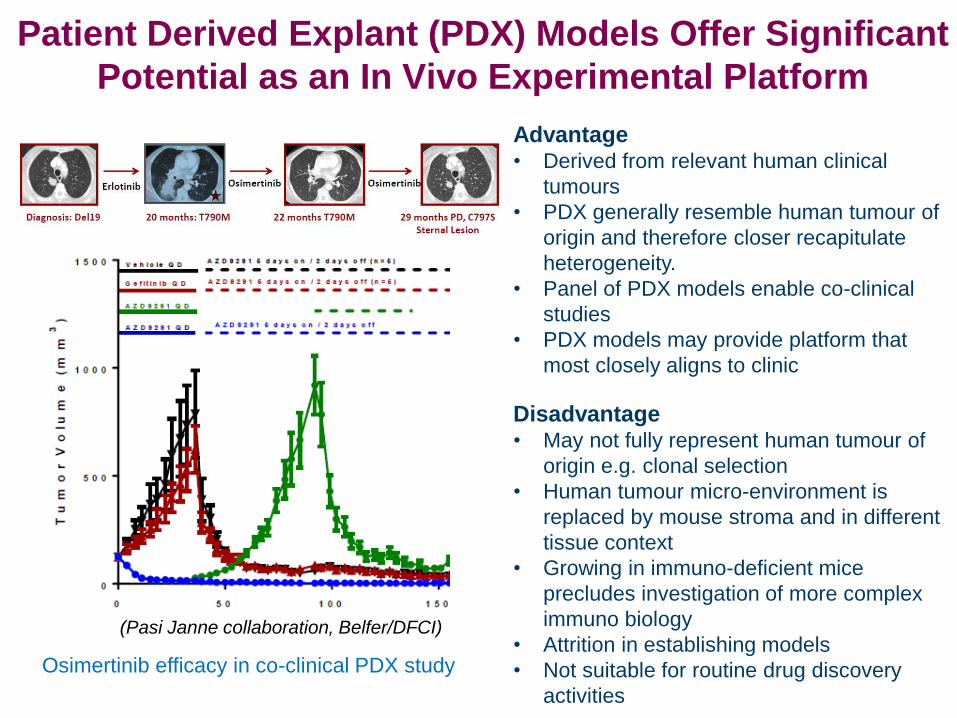
Advantage • Derived from relevant human clinical
tumours
• PDX generally resemble human tumour of
origin and therefore closer recapitulate
heterogeneity.
• Panel of PDX models enable co-clinical
studies
• PDX models may provide platform that
most closely aligns to clinic
Disadvantage • May not fully represent human tumour of
origin e.g. clonal selection
• Human tumour micro-environment is
replaced by mouse stroma and in different
tissue context
• Growing in immuno-deficient mice
precludes investigation of more complex
immuno biology
• Attrition in establishing models
• Not suitable for routine drug discovery
activities
Patient Derived Explant (PDX) Models Offer Significant
Potential as an In Vivo Experimental Platform
(Pasi Janne collaboration, Belfer/DFCI)
Osimertinib efficacy in co-clinical PDX study
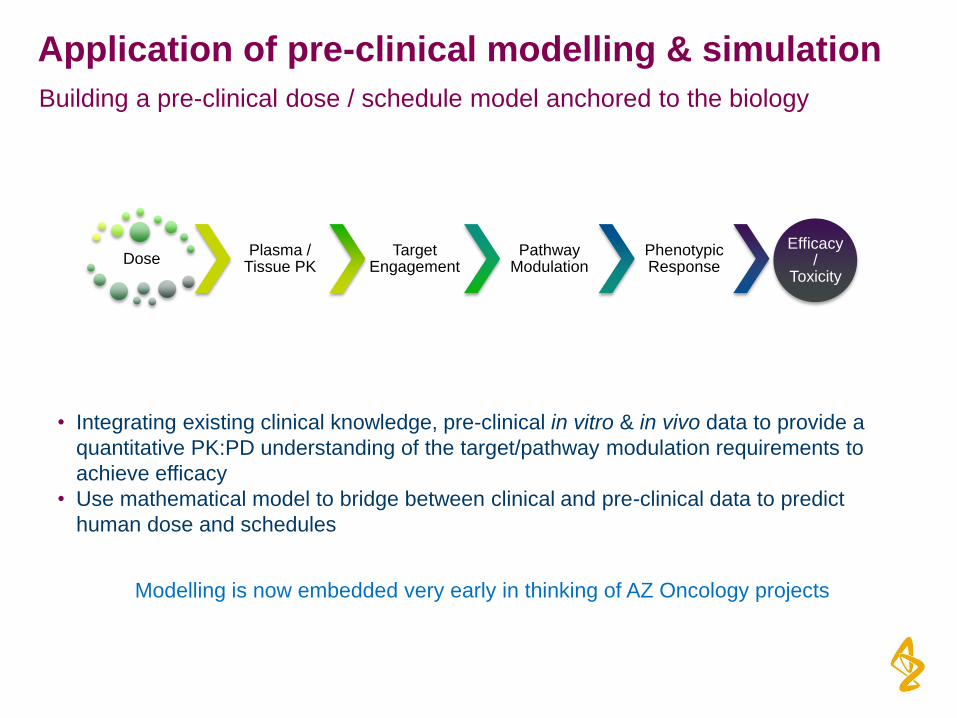
Application of pre-clinical modelling & simulation
Building a pre-clinical dose / schedule model anchored to the biology
• Integrating existing clinical knowledge, pre-clinical in vitro & in vivo data to provide a
quantitative PK:PD understanding of the target/pathway modulation requirements to
achieve efficacy
• Use mathematical model to bridge between clinical and pre-clinical data to predict
human dose and schedules
Dose Plasma /
Tissue PK Target
Engagement Pathway
Modulation Phenotypic Response
Efficacy /
Toxicity
Modelling is now embedded very early in thinking of AZ Oncology projects
Challenges of Predicting Human Dose For Osimertinib
119
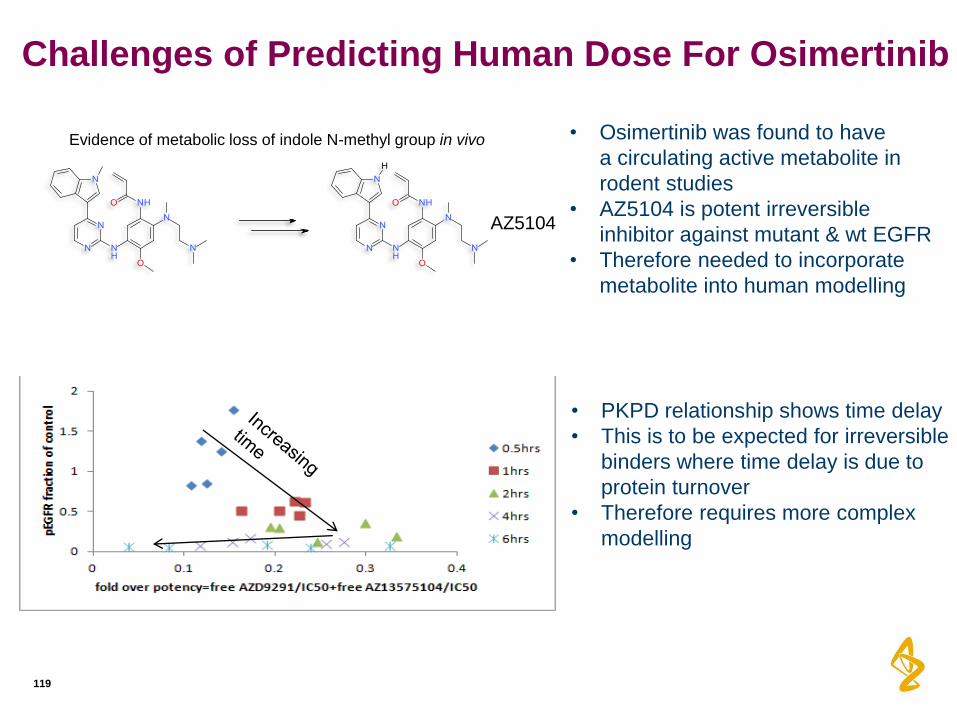
AZ5104
• Osimertinib was found to have
a circulating active metabolite in
rodent studies
• AZ5104 is potent irreversible
inhibitor against mutant & wt EGFR
• Therefore needed to incorporate
metabolite into human modelling
• PKPD relationship shows time delay
• This is to be expected for irreversible
binders where time delay is due to
protein turnover
• Therefore requires more complex
modelling
Evidence of metabolic loss of indole N-methyl group in vivo
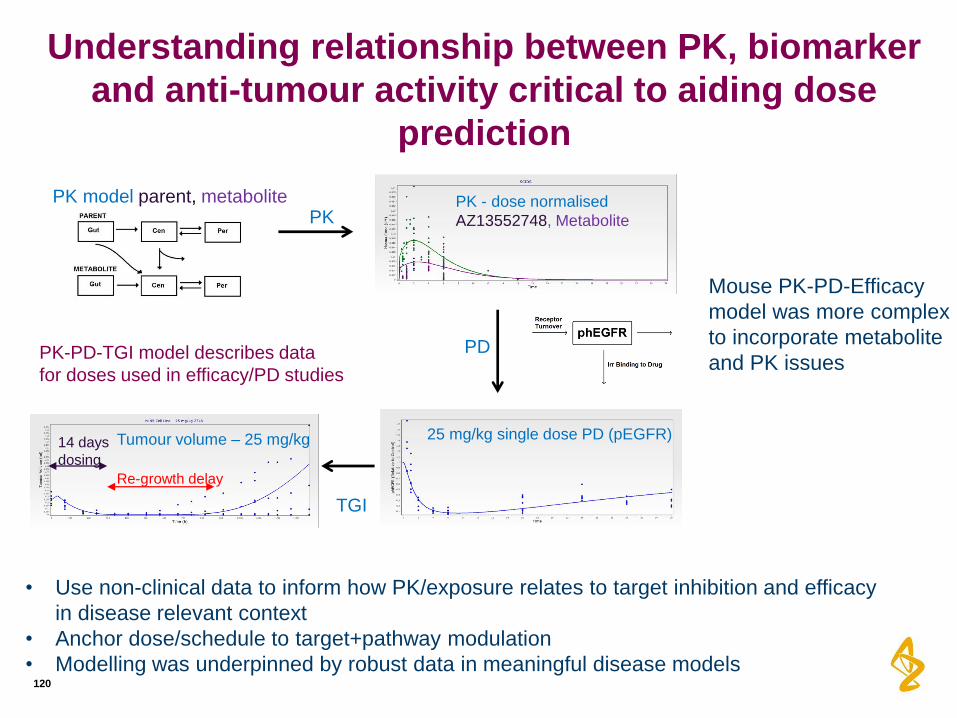
Understanding relationship between PK, biomarker
and anti-tumour activity critical to aiding dose
prediction
120
14 days
dosing
PK model parent, metabolite PK
PD
TGI
25 mg/kg single dose PD (pEGFR) Tumour volume – 25 mg/kg
PK - dose normalised
AZ13552748, Metabolite
Re-growth delay
PK-PD-TGI model describes data
for doses used in efficacy/PD studies
Mouse PK-PD-Efficacy
model was more complex
to incorporate metabolite
and PK issues
• Use non-clinical data to inform how PK/exposure relates to target inhibition and efficacy
in disease relevant context
• Anchor dose/schedule to target+pathway modulation
• Modelling was underpinned by robust data in meaningful disease models
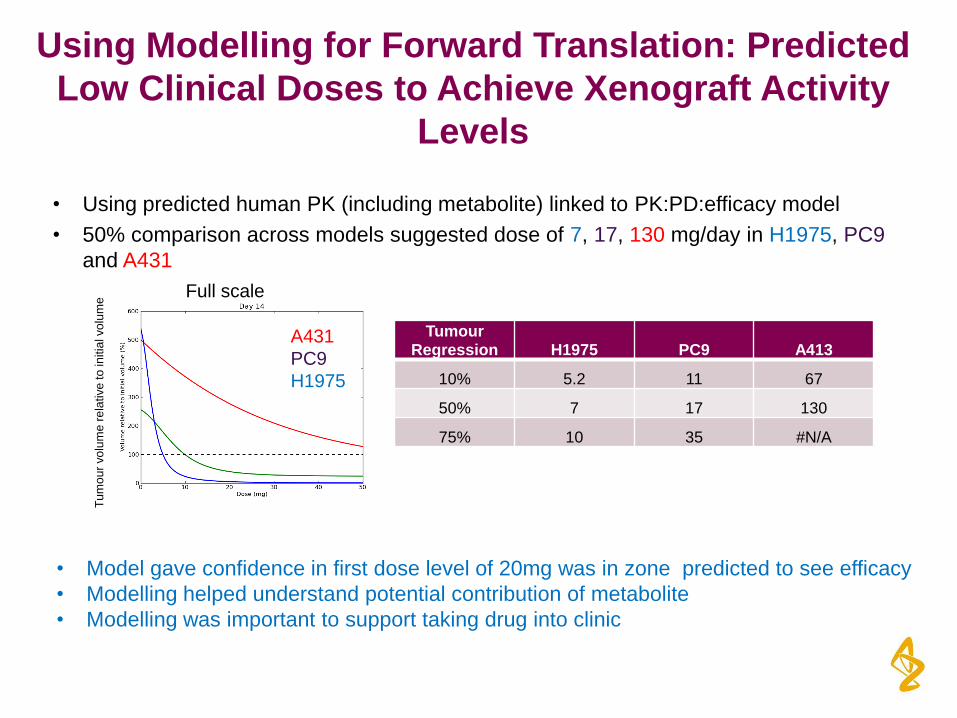
Using Modelling for Forward Translation: Predicted
Low Clinical Doses to Achieve Xenograft Activity
Levels
• Using predicted human PK (including metabolite) linked to PK:PD:efficacy model
• 50% comparison across models suggested dose of 7, 17, 130 mg/day in H1975, PC9
and A431
A431
PC9
H1975
Tu
mo
ur
vo
lum
e r
ela
tive
to
in
itia
l vo
lum
e Full scale
Tumour Regression H1975 PC9 A413
10% 5.2 11 67
50% 7 17 130
75% 10 35 #N/A
• Model gave confidence in first dose level of 20mg was in zone predicted to see efficacy
• Modelling helped understand potential contribution of metabolite
• Modelling was important to support taking drug into clinic
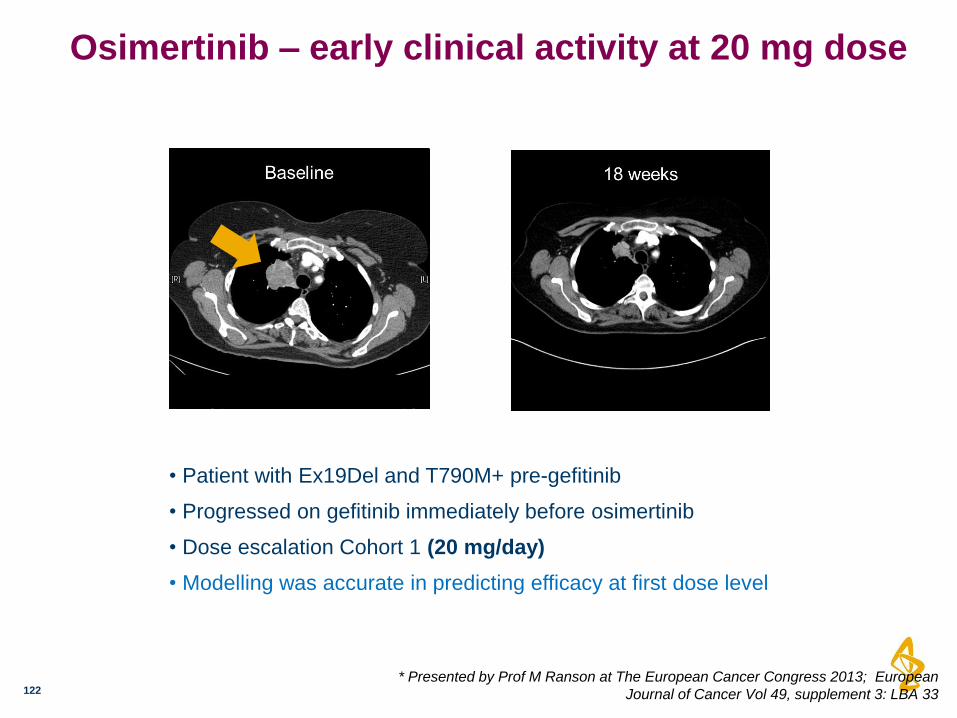
Osimertinib – early clinical activity at 20 mg dose
122
• Patient with Ex19Del and T790M+ pre-gefitinib
• Progressed on gefitinib immediately before osimertinib
• Dose escalation Cohort 1 (20 mg/day)
• Modelling was accurate in predicting efficacy at first dose level
* Presented by Prof M Ranson at The European Cancer Congress 2013; European
Journal of Cancer Vol 49, supplement 3: LBA 33
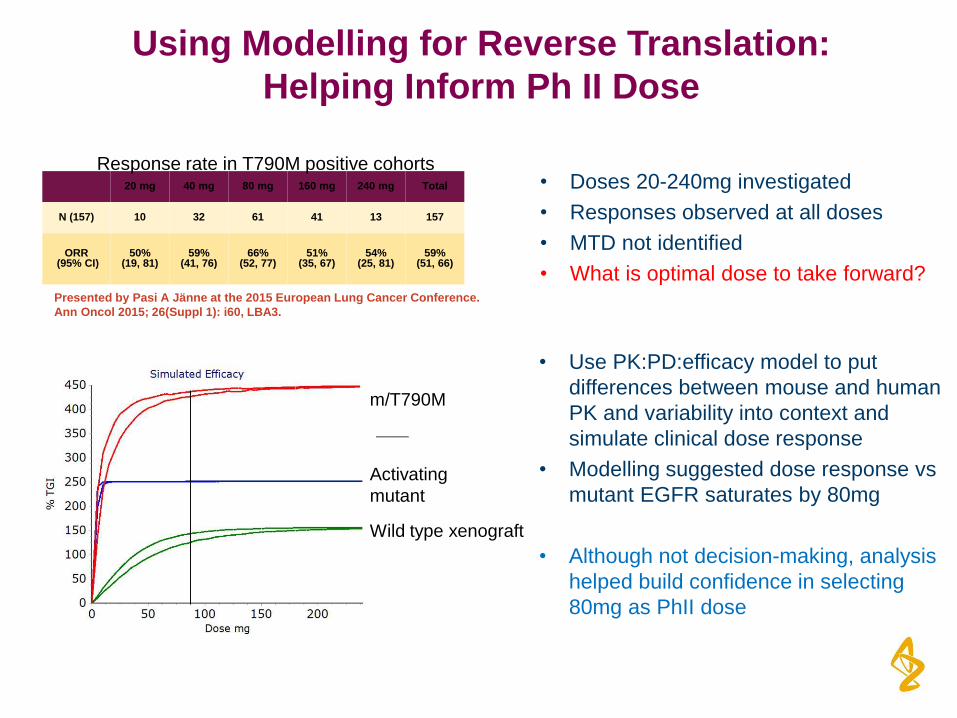
• Doses 20-240mg investigated
• Responses observed at all doses
• MTD not identified
• What is optimal dose to take forward?
Using Modelling for Reverse Translation:
Helping Inform Ph II Dose
20 mg 40 mg 80 mg 160 mg 240 mg Total
N (157) 10 32 61 41 13 157
ORR (95% CI)
50% (19, 81)
59% (41, 76)
66% (52, 77)
51% (35, 67)
54% (25, 81)
59% (51, 66)
Presented by Pasi A Jänne at the 2015 European Lung Cancer Conference.
Ann Oncol 2015; 26(Suppl 1): i60, LBA3.
Activating
mutant
Wild type xenograft
m/T790M
• Use PK:PD:efficacy model to put
differences between mouse and human
PK and variability into context and
simulate clinical dose response
• Modelling suggested dose response vs
mutant EGFR saturates by 80mg
• Although not decision-making, analysis
helped build confidence in selecting
80mg as PhII dose
Response rate in T790M positive cohorts
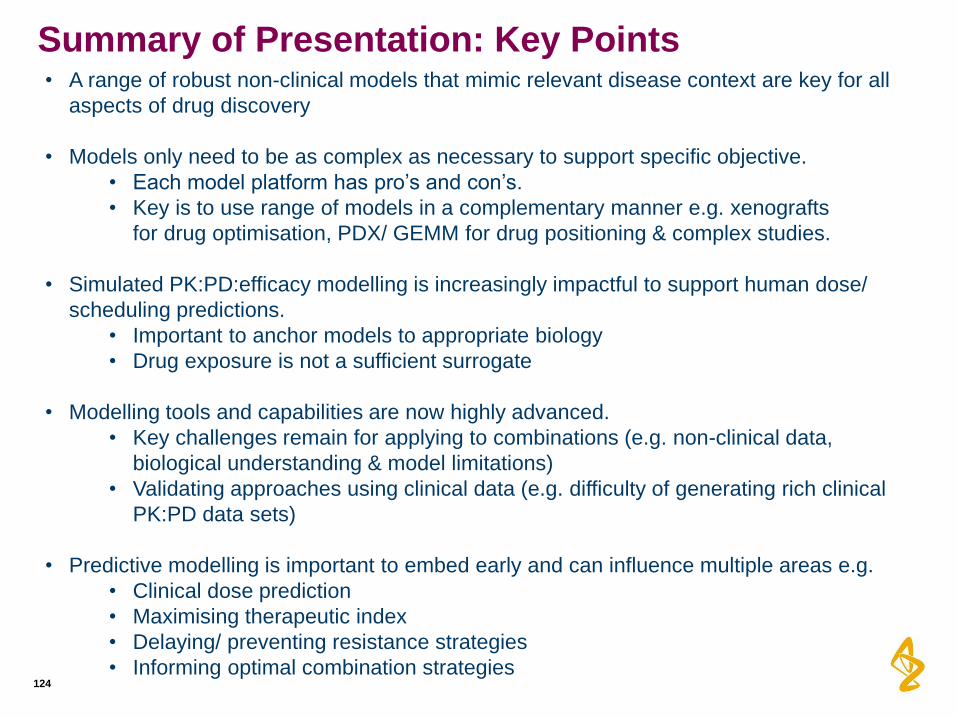
Summary of Presentation: Key Points
124
• A range of robust non-clinical models that mimic relevant disease context are key for all
aspects of drug discovery
• Models only need to be as complex as necessary to support specific objective.
• Each model platform has pro’s and con’s.
• Key is to use range of models in a complementary manner e.g. xenografts
for drug optimisation, PDX/ GEMM for drug positioning & complex studies.
• Simulated PK:PD:efficacy modelling is increasingly impactful to support human dose/
scheduling predictions.
• Important to anchor models to appropriate biology
• Drug exposure is not a sufficient surrogate
• Modelling tools and capabilities are now highly advanced.
• Key challenges remain for applying to combinations (e.g. non-clinical data,
biological understanding & model limitations)
• Validating approaches using clinical data (e.g. difficulty of generating rich clinical
PK:PD data sets)
• Predictive modelling is important to embed early and can influence multiple areas e.g.
• Clinical dose prediction
• Maximising therapeutic index
• Delaying/ preventing resistance strategies
• Informing optimal combination strategies
Acknowledgements
125
Mark J. Anderton
Susan Ashton
Peter Ballard
Paul Bethel
Matthew Box
Rob Bradbury
Kathryn Brown
Simon Brown
Sam Butterworth
Andrew Campbell
Nicola Colclough
Christopher G. Chorley
Claudio E. Chuaqui
Darren A. E. Cross
Gordon Currie
Didier Danillion
Paula Daunt
Judit É. Debreczeni
Cath Eberlein
Susan Galbraith
Anne Galer
Matthew Grist
Lorraine Hassall
George B. Hill
Gareth Hughes
Daniel James
Mike James
Paul Kemmitt
Teresa Klinowska
Gill Lamont
Scott Lamont
Clare Lane
Nat Martin
Scott Martin
Heather McFarland
Martine Mellor
Jonathon P. Orme
Dave Perkins
Paula Perkins
Graham Richmond
Peter Smith
Fengjiang Wang
Richard Ward
Michael J. Waring
David Whittaker
Stuart Wells
Gail Wrigley
James Yates
The Entire AZD9291 Development Team AURA study patients and investigators
Translational model to Establish Dose Range Selection for Pembrolizumab
Chandni Valiathan
Andreas Lindauer, Khamir Mehta, V Sriram, Jeroen Elassaiss-Schaap, Rik de Greef, Dinesh de Alwis
Additional thanks to: Anna Georgieva Kondic and the Pembrolizumab team
June 13th, 2016 FDA-AACR: Oncology Dose Finding Workshop
Outline of talk
127
• Background:
– Immuno-oncology: a novel class of cancer therapy
– Pembrolizumab: mechanism of action
• Criteria and challenges in clinical dose selection and translational model development
• Translational Physiology Based PK-PD model development
• Model simulations for dose selection
• Summary and key points
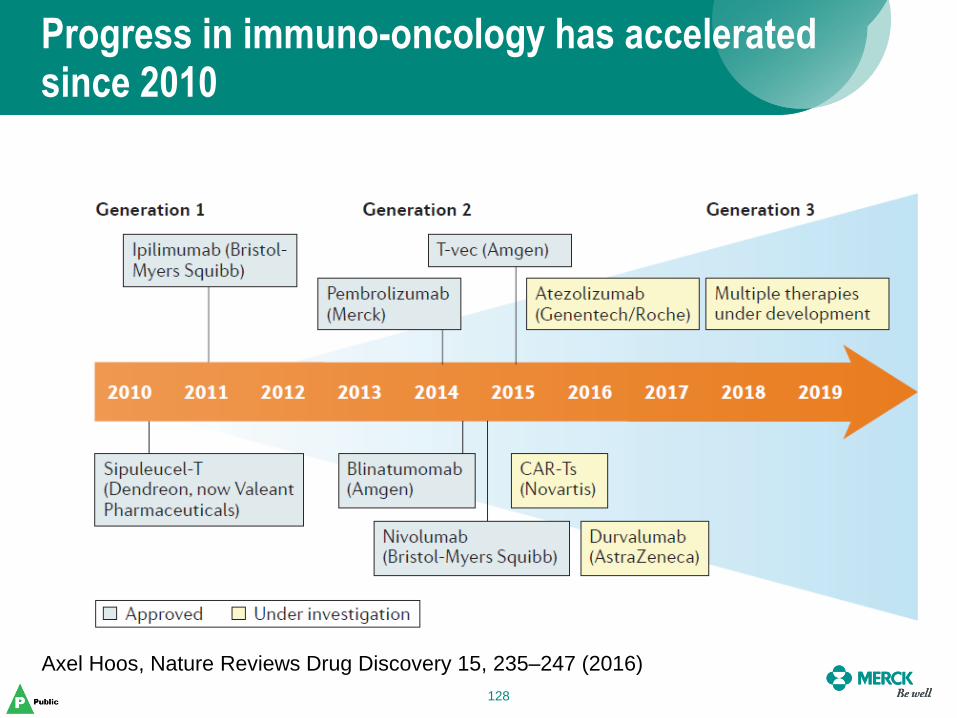
Progress in immuno-oncology has accelerated since 2010
128
Axel Hoos, Nature Reviews Drug Discovery 15, 235–247 (2016)
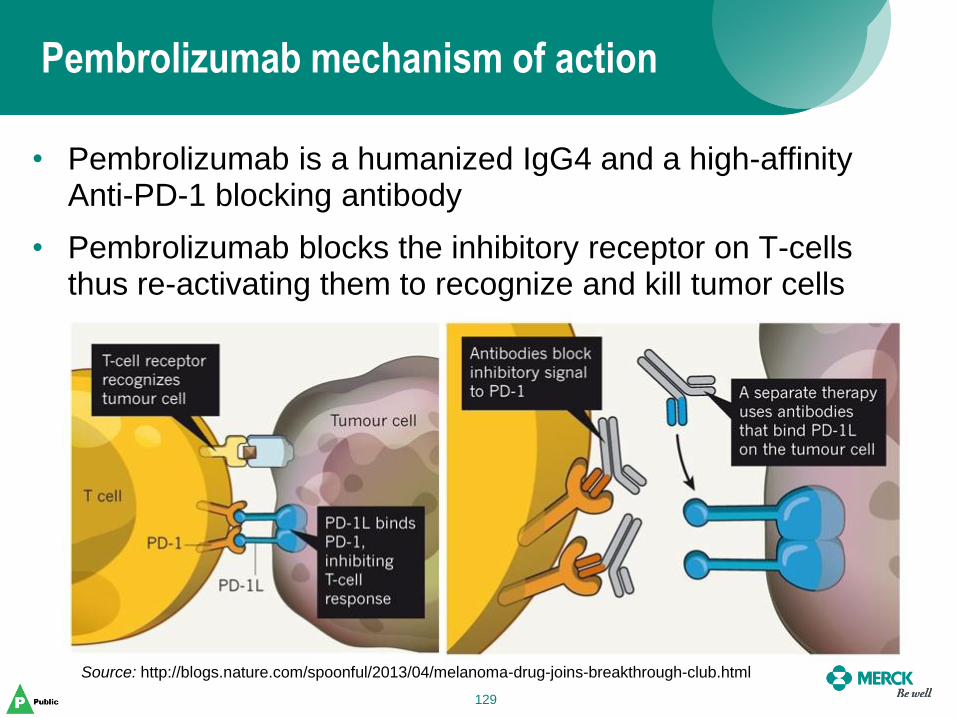
Pembrolizumab mechanism of action
129
• Pembrolizumab is a humanized IgG4 and a high-affinity Anti-PD-1 blocking antibody
• Pembrolizumab blocks the inhibitory receptor on T-cells thus re-activating them to recognize and kill tumor cells
Source: http://blogs.nature.com/spoonful/2013/04/melanoma-drug-joins-breakthrough-club.html

Challenges in dose selection strategy using translational methods
130
PK-PD-Efficacy
relationship
Population
Variability
(not usually known apriori)
Target PK/PD/Efficacy in target population
- Preclinical model for immuno-oncology?
- Translation of efficacy from pre-clinical to clinical?
- PD biomarker?
- PK parameter that correlates with efficacy?
Dose level + Frequency 130
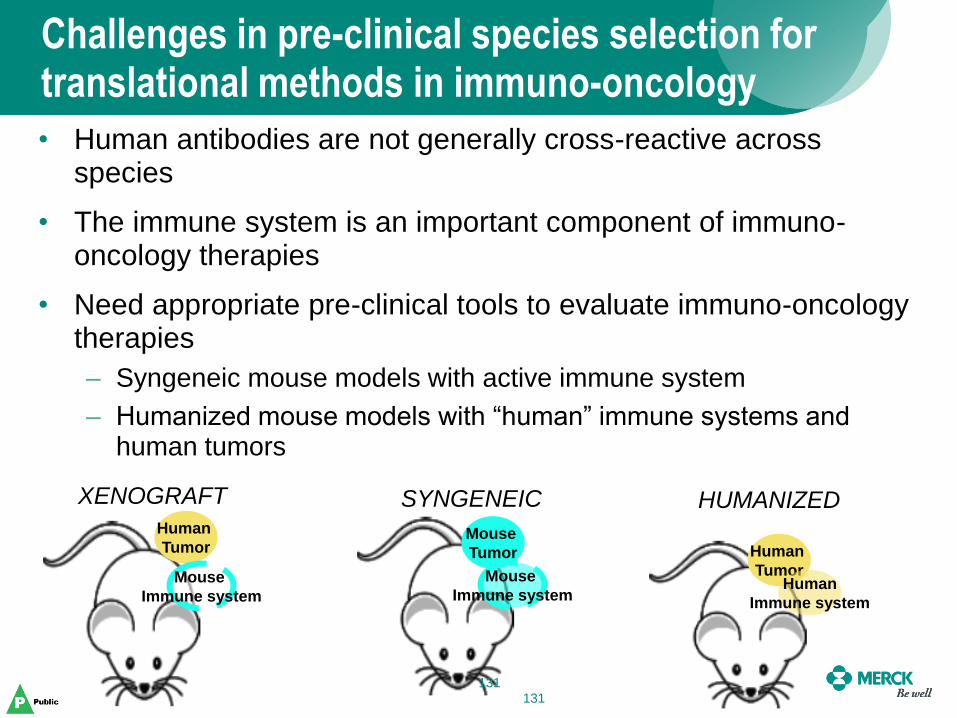
• Human antibodies are not generally cross-reactive across species
• The immune system is an important component of immuno-oncology therapies
• Need appropriate pre-clinical tools to evaluate immuno-oncology therapies
– Syngeneic mouse models with active immune system
– Humanized mouse models with “human” immune systems and human tumors
Challenges in pre-clinical species selection for translational methods in immuno-oncology
Human
Tumor
Mouse
Immune system
Human
Tumor Human
Immune system
Mouse
Tumor
Mouse
Immune system
XENOGRAFT SYNGENEIC HUMANIZED
131 131
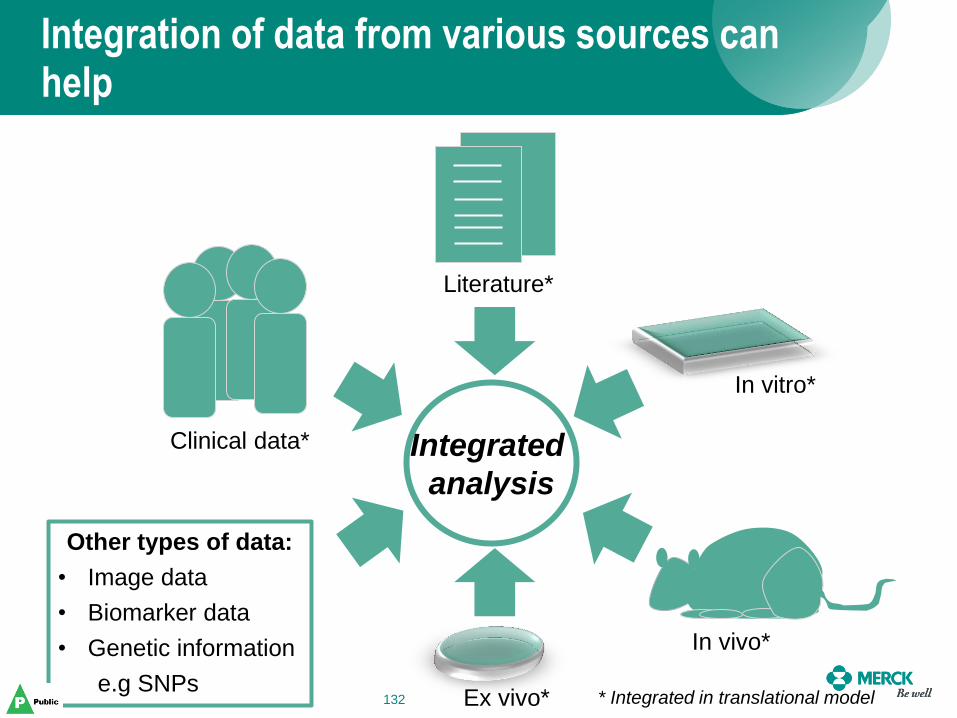
Integration of data from various sources can help
132
Other types of data:
• Image data
• Biomarker data
• Genetic information
e.g SNPs
Clinical data*
Literature*
In vitro*
In vivo*
Ex vivo*
Integrated
analysis
* Integrated in translational model 132
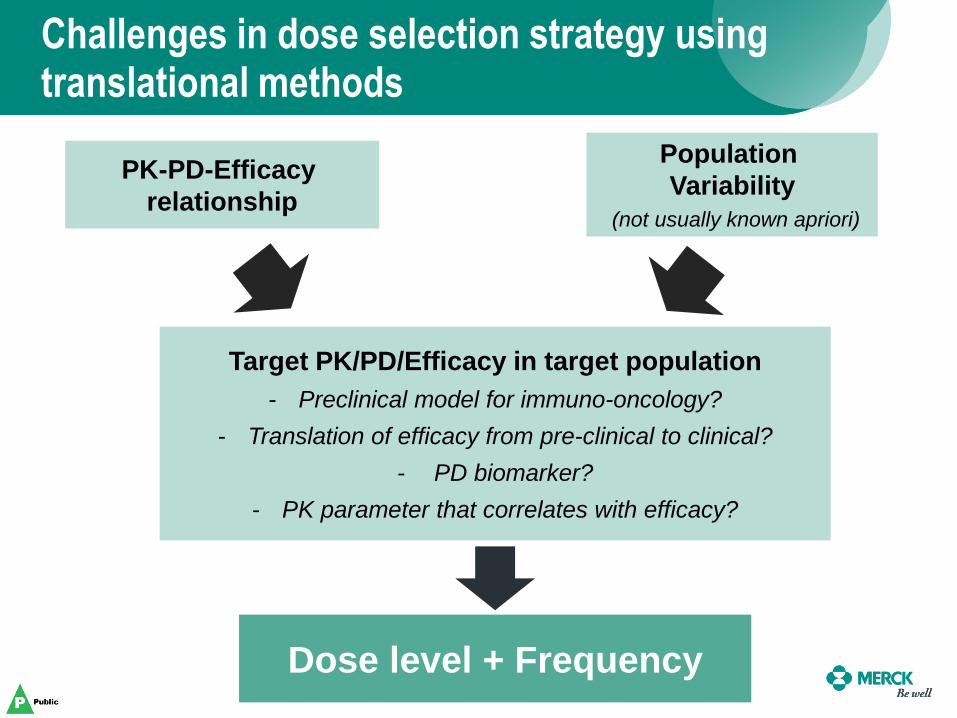
Challenges in dose selection strategy using translational methods
133
PK-PD-Efficacy
relationship
Population
Variability
(not usually known apriori)
Target PK/PD/Efficacy in target population
- Preclinical model for immuno-oncology?
- Translation of efficacy from pre-clinical to clinical?
- PD biomarker?
- PK parameter that correlates with efficacy?
Dose level + Frequency
Dose Selection for Pembrolizumab using a translational PK/PD model
Manuscript submitted:
Lindauer A. et al., Translational Pharmacokinetic/Pharmacodynamic Modeling of Tumor
Growth Inhibition Supports Dose-Range Selection of the Anti–PD-1 Antibody Pembrolizumab
• Dose escalation performed with 1, 3 and 10mg/kg doses on a once every two weeks (Q2W) schedule
• Traditional method of selecting the maximum tolerated dose would have suggested 10mg/kg Q2W as the recommended dose
• Pharmacokinetics was typical of other therapeutic mAb with low clearance, limited volume of distribution and low variability
• 26 day half life led to the proposal of once every 3 week dosing
• Additional IL-2 data suggested that saturation might occur around 1mg/kg Q3W
Phase 1 trials showed promising results and suggested less frequent dosing
135
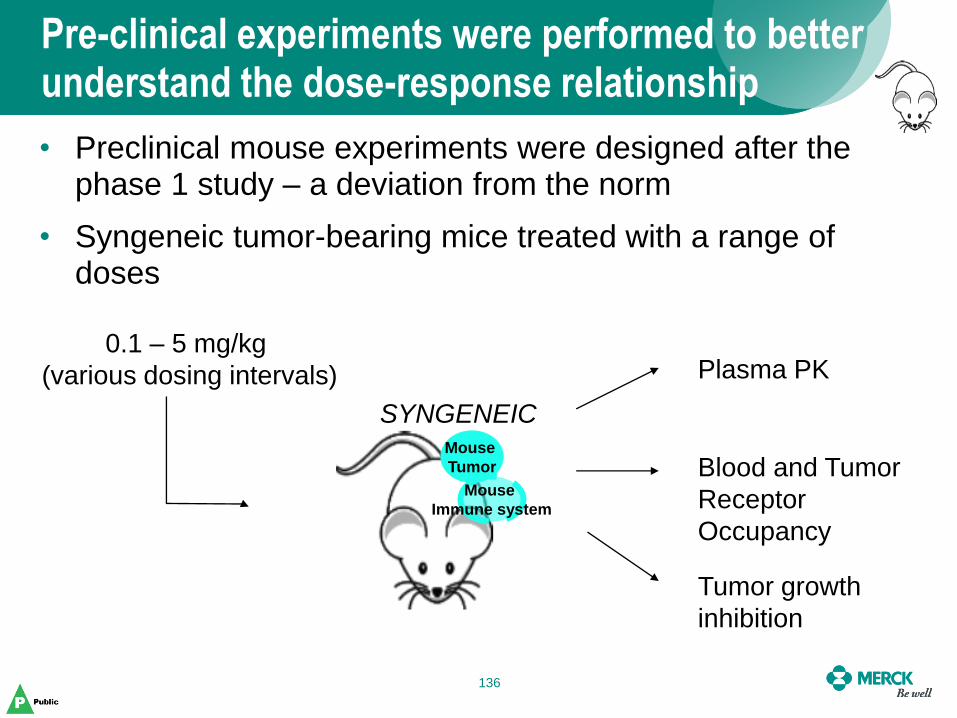
Pre-clinical experiments were performed to better understand the dose-response relationship
136
• Preclinical mouse experiments were designed after the phase 1 study – a deviation from the norm
• Syngeneic tumor-bearing mice treated with a range of doses
Mouse
Tumor
Mouse
Immune system
SYNGENEIC
0.1 – 5 mg/kg
(various dosing intervals) Plasma PK
Blood and Tumor
Receptor
Occupancy
Tumor growth
inhibition
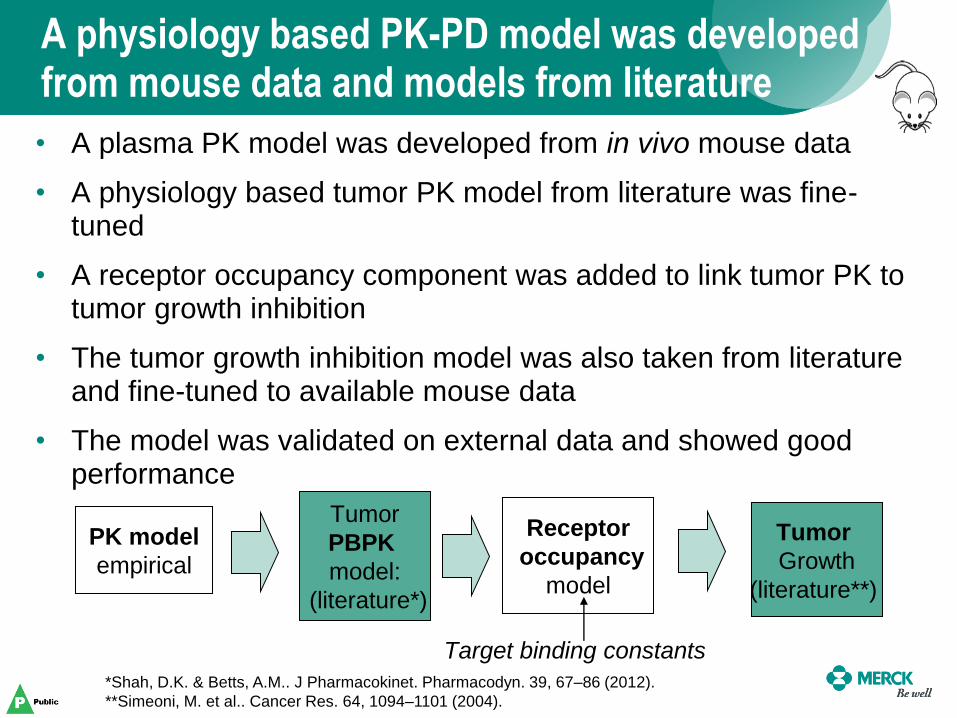
A physiology based PK-PD model was developed from mouse data and models from literature
137 137
PK model
empirical
Tumor
PBPK
model:
(literature*)
Receptor
occupancy
model
Tumor
Growth
(literature**)
Target binding constants
• A plasma PK model was developed from in vivo mouse data
• A physiology based tumor PK model from literature was fine-tuned
• A receptor occupancy component was added to link tumor PK to tumor growth inhibition
• The tumor growth inhibition model was also taken from literature and fine-tuned to available mouse data
• The model was validated on external data and showed good performance
*Shah, D.K. & Betts, A.M.. J Pharmacokinet. Pharmacodyn. 39, 67–86 (2012).
**Simeoni, M. et al.. Cancer Res. 64, 1094–1101 (2004).
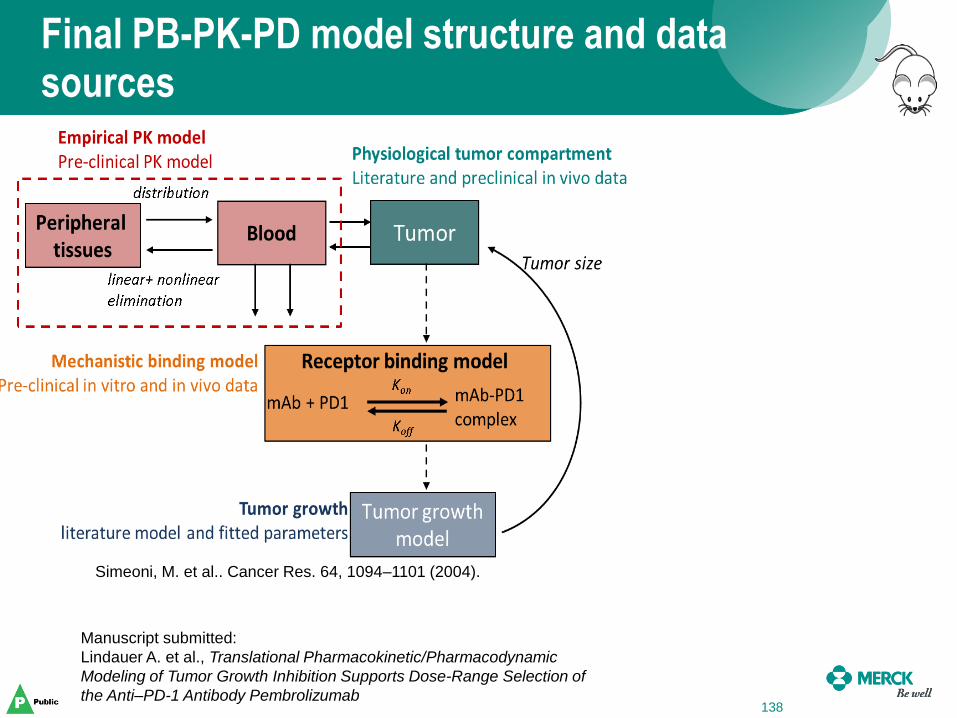
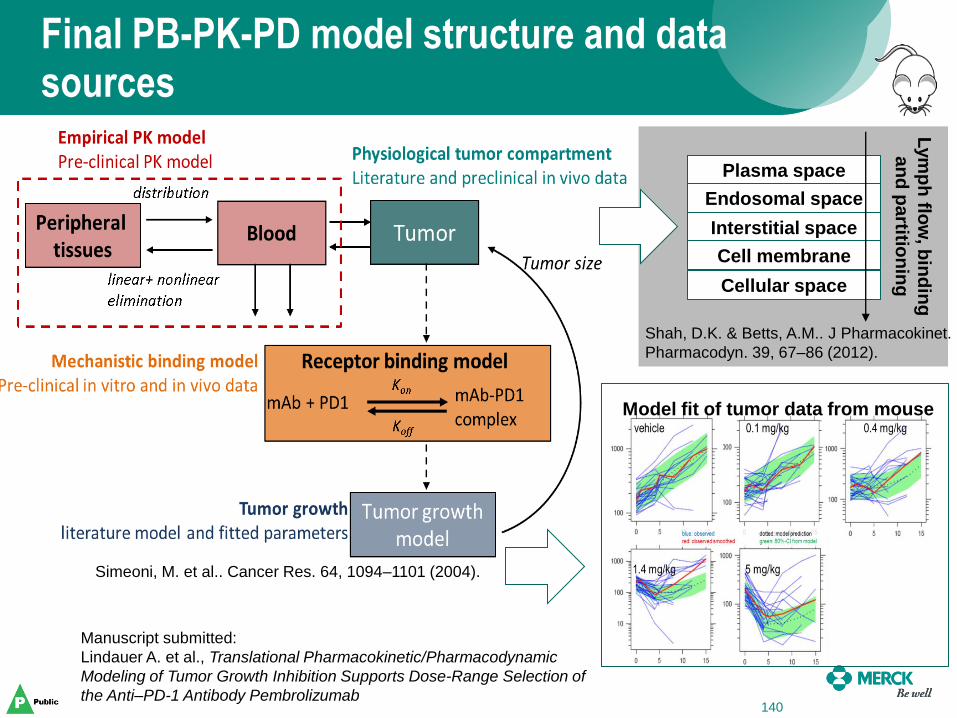
Final PB-PK-PD model structure and data sources
138
Manuscript submitted:
Lindauer A. et al., Translational Pharmacokinetic/Pharmacodynamic
Modeling of Tumor Growth Inhibition Supports Dose-Range Selection of
the Anti–PD-1 Antibody Pembrolizumab
Simeoni, M. et al.. Cancer Res. 64, 1094–1101 (2004).
Interstitial space
Plasma space
Endosomal space
Cellular space
Cell membrane
Lym
ph
flow
, bin
din
g
an
d p
artitio
nin
g
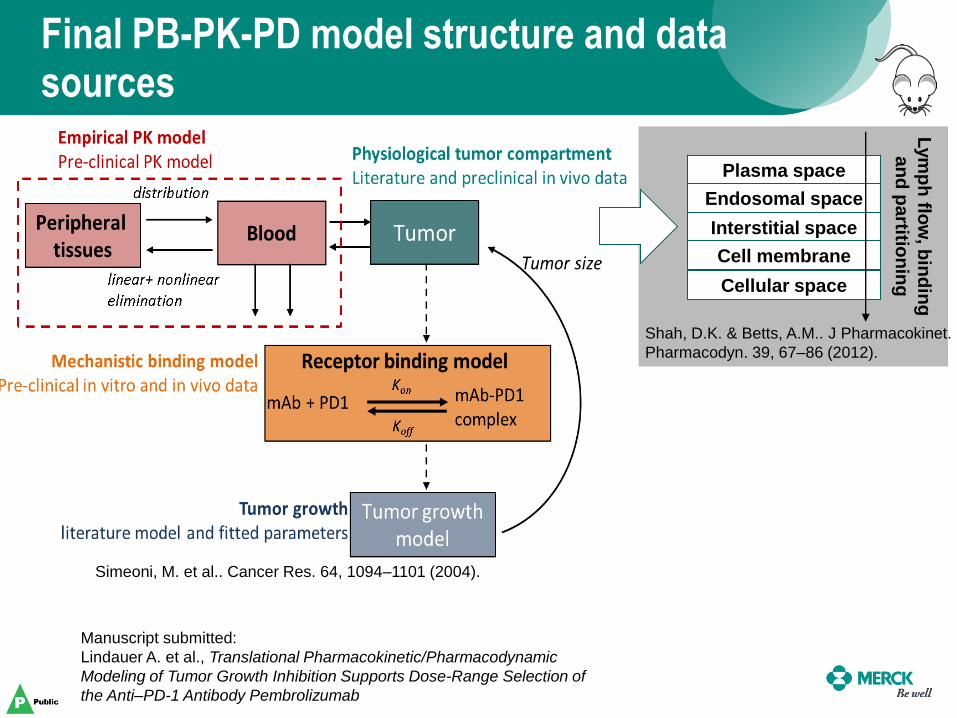
Final PB-PK-PD model structure and data sources
Manuscript submitted:
Lindauer A. et al., Translational Pharmacokinetic/Pharmacodynamic
Modeling of Tumor Growth Inhibition Supports Dose-Range Selection of
the Anti–PD-1 Antibody Pembrolizumab
Shah, D.K. & Betts, A.M.. J Pharmacokinet.
Pharmacodyn. 39, 67–86 (2012).
Simeoni, M. et al.. Cancer Res. 64, 1094–1101 (2004).
Interstitial space
Plasma space
Endosomal space
Cellular space
Cell membrane
Lym
ph
flow
, bin
din
g
an
d p
artitio
nin
g
Final PB-PK-PD model structure and data sources
140
Model fit of tumor data from mouse
Manuscript submitted:
Lindauer A. et al., Translational Pharmacokinetic/Pharmacodynamic
Modeling of Tumor Growth Inhibition Supports Dose-Range Selection of
the Anti–PD-1 Antibody Pembrolizumab
Shah, D.K. & Betts, A.M.. J Pharmacokinet.
Pharmacodyn. 39, 67–86 (2012).
Simeoni, M. et al.. Cancer Res. 64, 1094–1101 (2004).
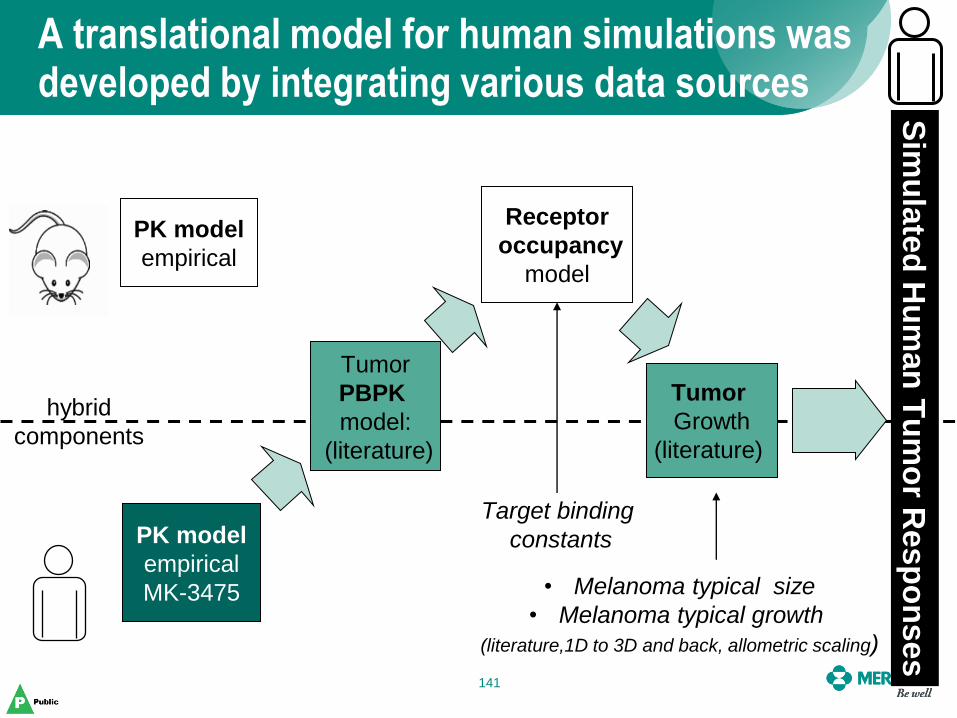
A translational model for human simulations was developed by integrating various data sources
141
PK model
empirical
Tumor
PBPK
model:
(literature)
Receptor
occupancy
model
Tumor
Growth
(literature)
PK model
empirical
MK-3475
Target binding
constants
• Melanoma typical size
• Melanoma typical growth
(literature,1D to 3D and back, allometric scaling)
Sim
ula
ted
Hu
man
Tu
mo
r Resp
on
ses
hybrid
components
• The physiology based tumor PK model had a parameter structure that was species independent
• Where available, clinical data and models were used directly
• Allometric scaling and assumptions were made where applicable in order to bridge to the clinical setting
• Literature sources were used to augment and understand the range of responses that might be seen
• Converted one-dimensional tumor measurements in literature to volume measurements for model simulations
Various techniques were used to bridge between mouse and man
142
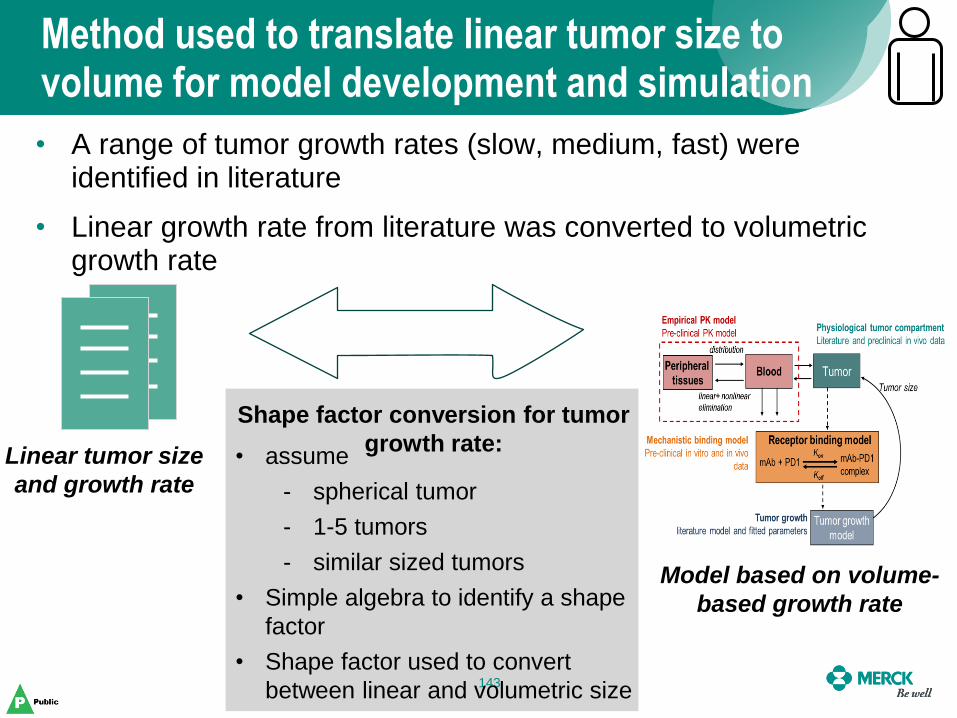
Method used to translate linear tumor size to volume for model development and simulation
143
Linear tumor size
and growth rate
Model based on volume-
based growth rate
• assume
- spherical tumor
- 1-5 tumors
- similar sized tumors
• Simple algebra to identify a shape
factor
• Shape factor used to convert
between linear and volumetric size
• A range of tumor growth rates (slow, medium, fast) were identified in literature
• Linear growth rate from literature was converted to volumetric growth rate
Shape factor conversion for tumor
growth rate:
Simulations provided guidance for the effect of increasing dose on tumor growth inhibition
144
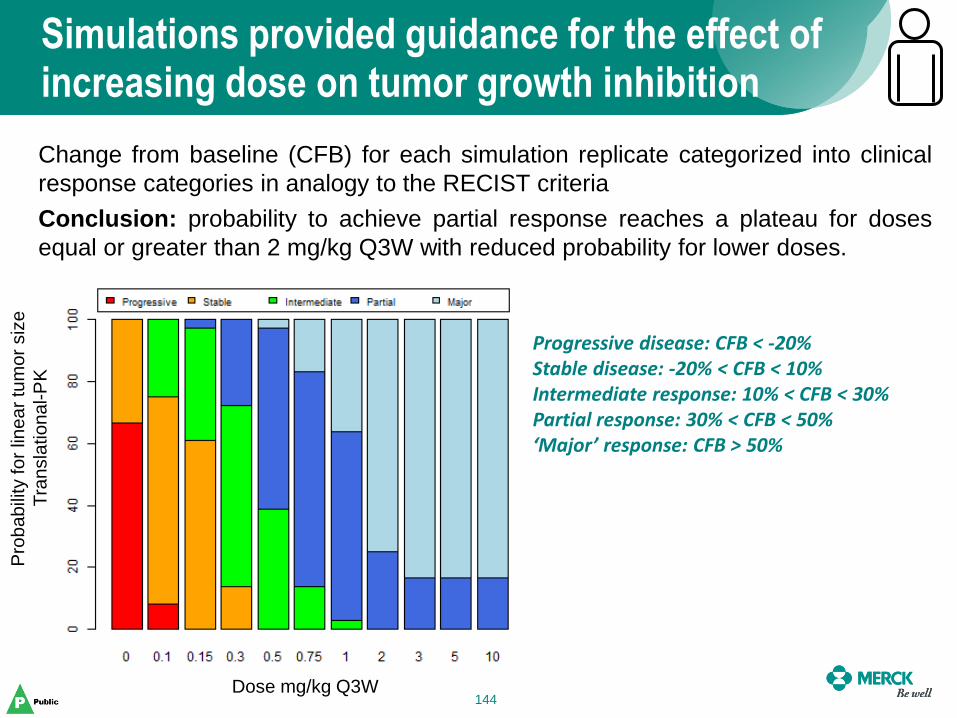
Change from baseline (CFB) for each simulation replicate categorized into clinical
response categories in analogy to the RECIST criteria
Conclusion: probability to achieve partial response reaches a plateau for doses
equal or greater than 2 mg/kg Q3W with reduced probability for lower doses.
Progressive disease: CFB < -20% Stable disease: -20% < CFB < 10% Intermediate response: 10% < CFB < 30% Partial response: 30% < CFB < 50% ‘Major’ response: CFB > 50%
Dose mg/kg Q3W
Pro
ba
bili
ty fo
r lin
ea
r tu
mo
r siz
e
Tra
nsla
tio
nal-P
K
144
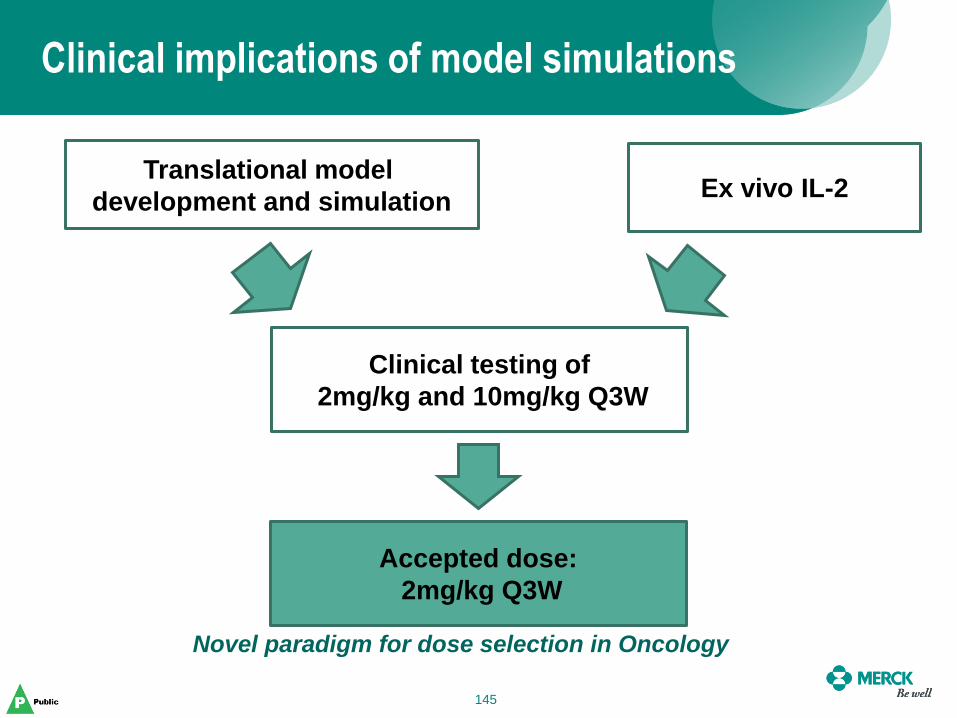
Clinical implications of model simulations
145
Translational model
development and simulation Ex vivo IL-2
Clinical testing of
2mg/kg and 10mg/kg Q3W
Accepted dose:
2mg/kg Q3W
Novel paradigm for dose selection in Oncology
145
• Developed a translational model that integrated data from various sources to provide recommendations
• Key steps:
– Designing and performing pre-clinical experiments to understand and develop a translational model after clinical efficacy was observed
– Innovative ways to integrate literature information
• Still learning – some techniques might be applicable to other programs and new techniques will also be needed
Summary and key steps
146
Alan Korman’s slides have been withheld from this presentation.

Juliet Williams’s slides have been withheld from this presentation.
Session II Panel Discussion Non-Clinical Models Used for
Go/No-Go Decisions
Chair: Todd Palmby, PhD
Speakers: Darren Cross, PhD
Chandni Valiathan, PhD Alan Korman, PhD
Juliet Williams, PhD
Panelists: Hans Loland
Thomas Jaki, PhD Mark Ratain, MD
Amit Roy, PhD Karthick Vishwanathan, PhD
Break 2:35– 2:50 pm
Session III Designs for Dose Optimization Studies:
Pre-Market and Post-Market
Chair: Eric Rubin, MD
Speakers: Haleh Saber, PhD
Pasi Jänne, MD, PhD Ying Lu, PhD
Chao Liu, PhD Matthew Guo, PhD
Panelists: Kelvin Dickenson
Serban Ghiorghiu, MD Hans Loland
Sumithra Mandrekar, PhD Lie Nie, PhD
Nam Atiqur Rahman, PhD Lillian Siu, MD
Dose selection: MABEL for immune oncology products
Haleh Saber Deputy Director
CDER/OHOP/DHOT
152
Questions to answer
• What have we learned thus far?
• How FIH doses compare to doses given safely to patients: too low or too high?
• What has been the basis of FIH dose selection?
• Is there a FIH dose approach that is safe for all products examined?
• Is there a need to optimize the Phase 1 clinical trial design?
153
Abbreviations • AE: adverse event
• CRS: cytokine release syndrome
• DHOT: Division of Hematology Oncology Toxicology
• DLT: dose-limiting toxicity
• FIH: first-in-human
• IND: Investigational New Drug application
• IRR: infusion-related reaction
• KD: dissociation constant
• MABEL: minimally anticipated biological effect level
• MOA: mechanism of action
• MTD: maximum tolerated dose
• NOAEL: no-observed adverse effect level
• PA: pharmacologic activity
• RO: receptor occupancy
154
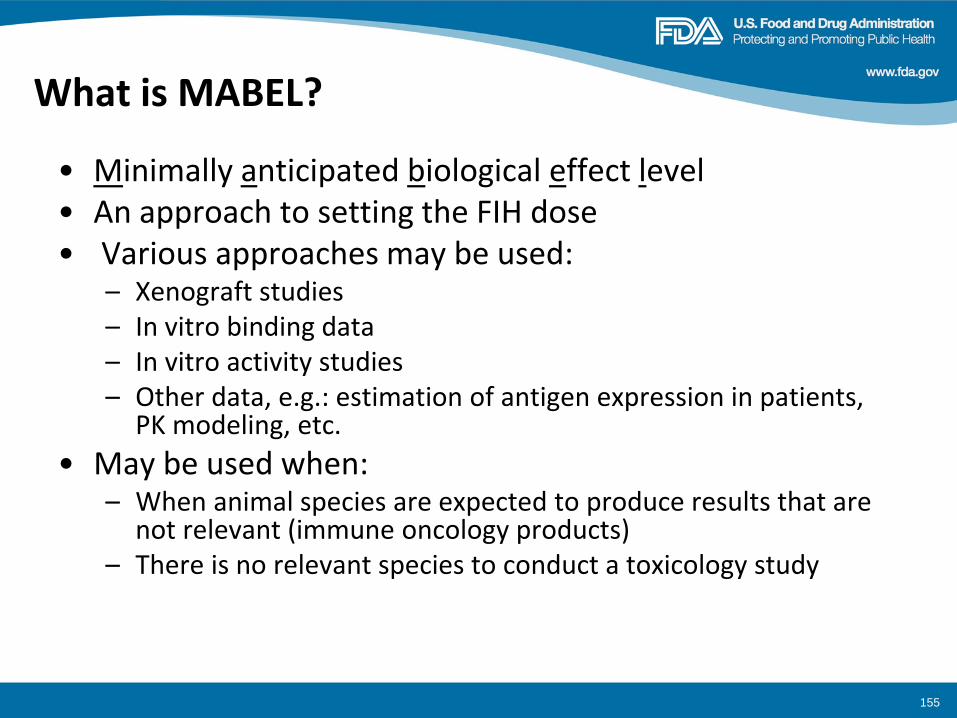
What is MABEL?
• Minimally anticipated biological effect level • An approach to setting the FIH dose • Various approaches may be used:
– Xenograft studies – In vitro binding data – In vitro activity studies – Other data, e.g.: estimation of antigen expression in patients,
PK modeling, etc.
• May be used when: – When animal species are expected to produce results that are
not relevant (immune oncology products) – There is no relevant species to conduct a toxicology study
155
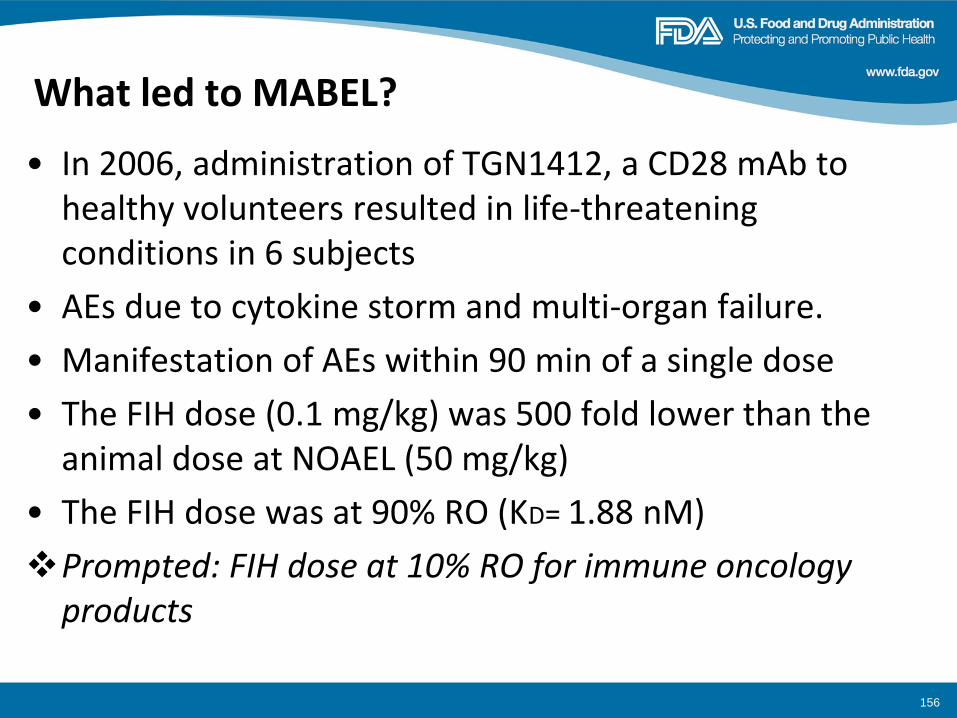
What led to MABEL?
• In 2006, administration of TGN1412, a CD28 mAb to healthy volunteers resulted in life-threatening conditions in 6 subjects
• AEs due to cytokine storm and multi-organ failure.
• Manifestation of AEs within 90 min of a single dose
• The FIH dose (0.1 mg/kg) was 500 fold lower than the animal dose at NOAEL (50 mg/kg)
• The FIH dose was at 90% RO (KD= 1.88 nM)
Prompted: FIH dose at 10% RO for immune oncology products
156
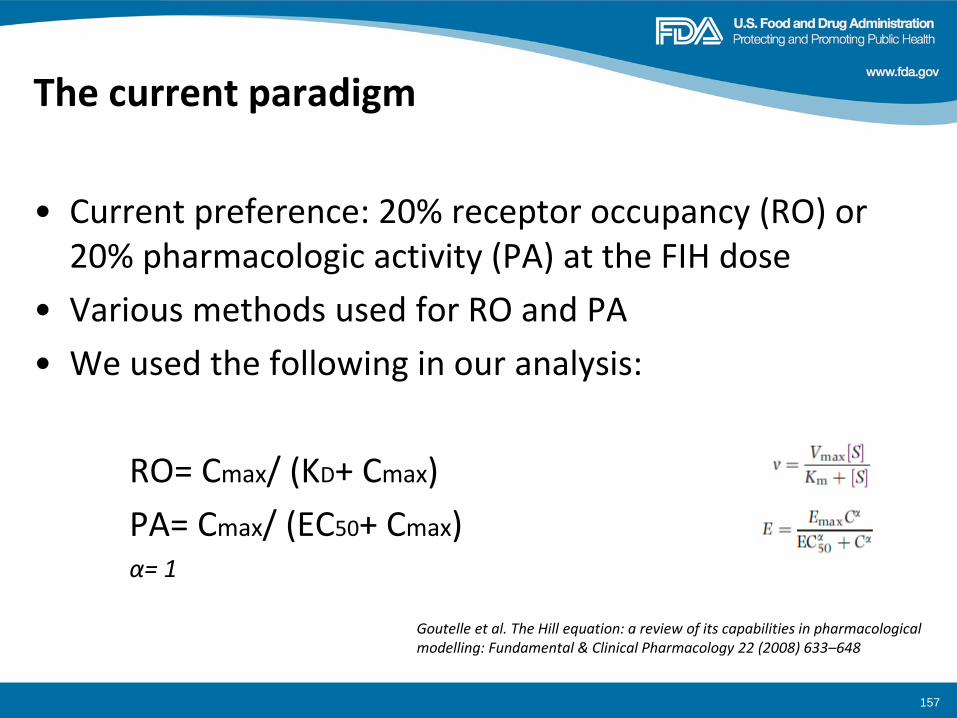
The current paradigm
• Current preference: 20% receptor occupancy (RO) or 20% pharmacologic activity (PA) at the FIH dose
• Various methods used for RO and PA
• We used the following in our analysis:
RO= Cmax/ (KD+ Cmax)
PA= Cmax/ (EC50+ Cmax) α= 1
Goutelle et al. The Hill equation: a review of its capabilities in pharmacological modelling: Fundamental & Clinical Pharmacology 22 (2008) 633–648
157
DHOT analysis
• Collected INDs that used MABEL: >100 INDs
• Oncology indications only
• Included only antibodies and CD3-XX bispecifics
• Products
– With risk of T-cell activation, e.g.: checkpoint inhibitors, stimulators, CD3-XX bispecifics, poorly understood MOA but may be involved in activation of immune system
– With sufficient human data, e.g. : availability of MTD or human recommended dose, or multiple cohorts tested
• N= 31 INDs (5 bispecifics and 26 antibodies)
158
Target of antibodies
• CD40, OX40, OX40L, GITR, CTLA-4, PD-1, PD-L1, B7 family, CD19, CD33, CD38, CSF-R, etc
159
Collected the following data
• Pharmacology: binding and activity data
• Toxicology: conducted in animals? If so, was the data used to set the FIH dose?
• Phase 1 trial design
– FIH dose and rationale
– Dose escalation scheme
– Single patient vs 3+3
– Intra-patient dose escalation
– Treatment for IRRs/CRS • Prophylactically vs post-occurrence
160
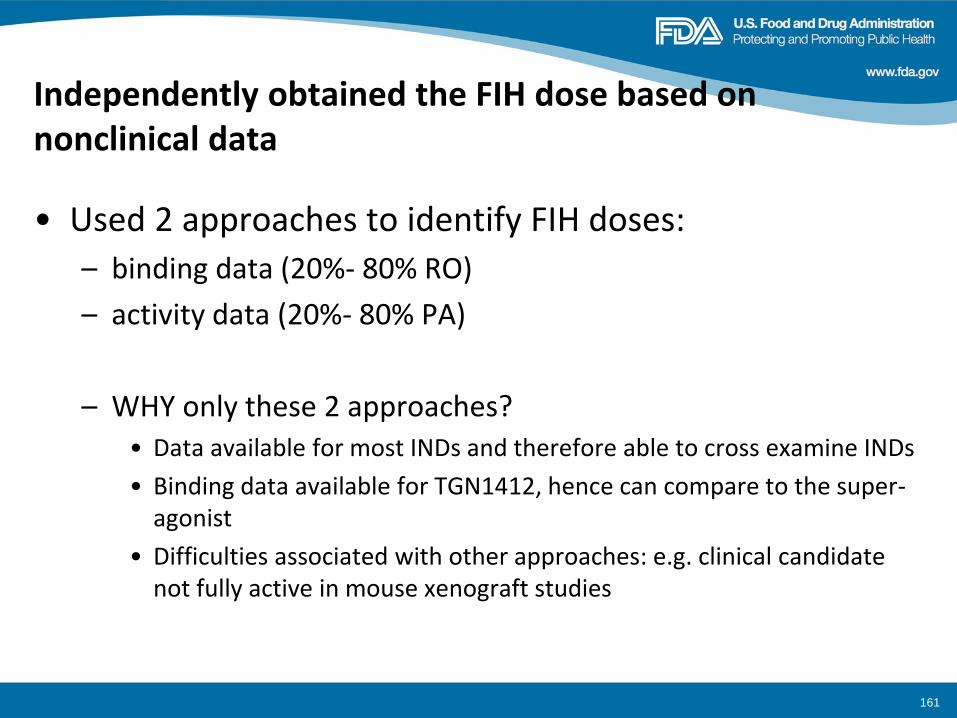
Independently obtained the FIH dose based on nonclinical data
• Used 2 approaches to identify FIH doses:
– binding data (20%- 80% RO)
– activity data (20%- 80% PA)
– WHY only these 2 approaches? • Data available for most INDs and therefore able to cross examine INDs
• Binding data available for TGN1412, hence can compare to the super-agonist
• Difficulties associated with other approaches: e.g. clinical candidate not fully active in mouse xenograft studies
161
Preliminary Conclusions (bispecifics)
• Not enough bispecifics to make firm conclusions
162
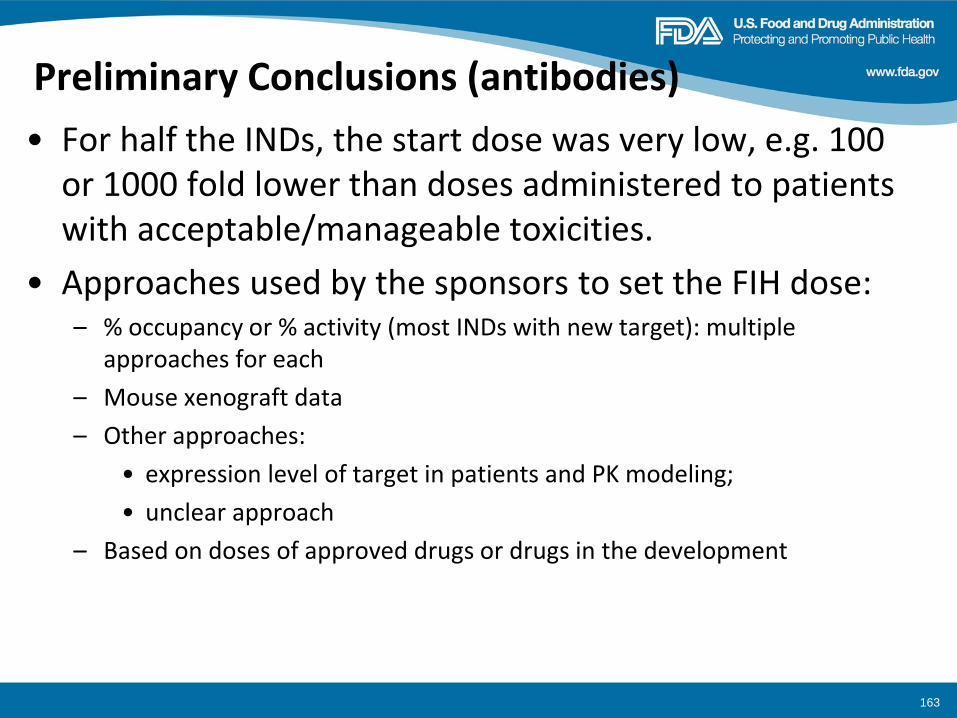
Preliminary Conclusions (antibodies)
• For half the INDs, the start dose was very low, e.g. 100 or 1000 fold lower than doses administered to patients with acceptable/manageable toxicities.
• Approaches used by the sponsors to set the FIH dose: – % occupancy or % activity (most INDs with new target): multiple
approaches for each
– Mouse xenograft data
– Other approaches:
• expression level of target in patients and PK modeling;
• unclear approach
– Based on doses of approved drugs or drugs in the development
163
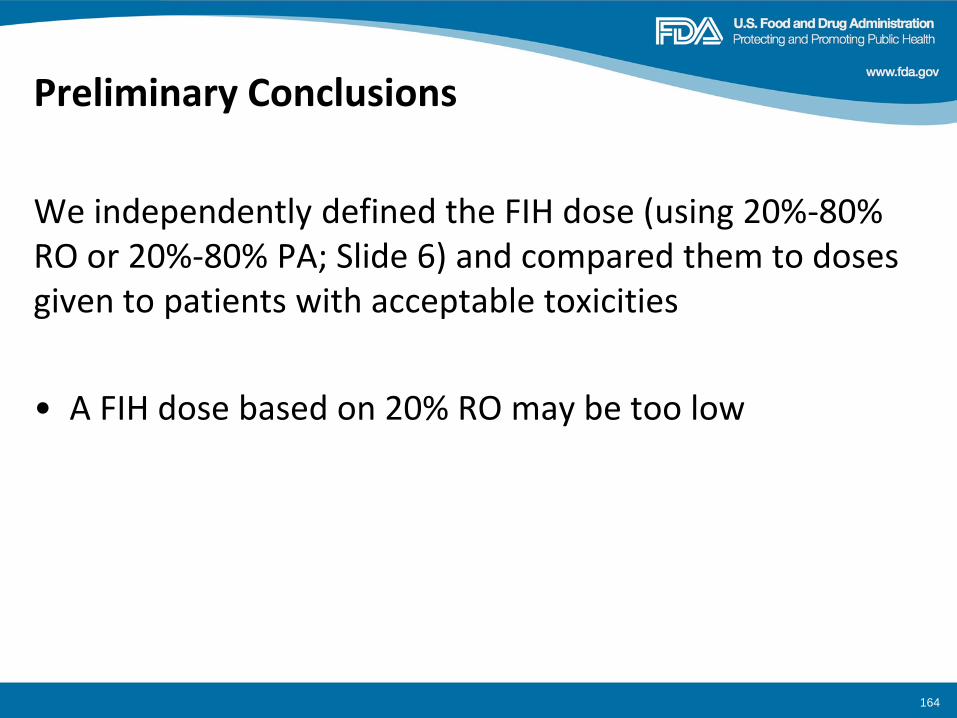
Preliminary Conclusions
We independently defined the FIH dose (using 20%-80% RO or 20%-80% PA; Slide 6) and compared them to doses given to patients with acceptable toxicities
• A FIH dose based on 20% RO may be too low
164
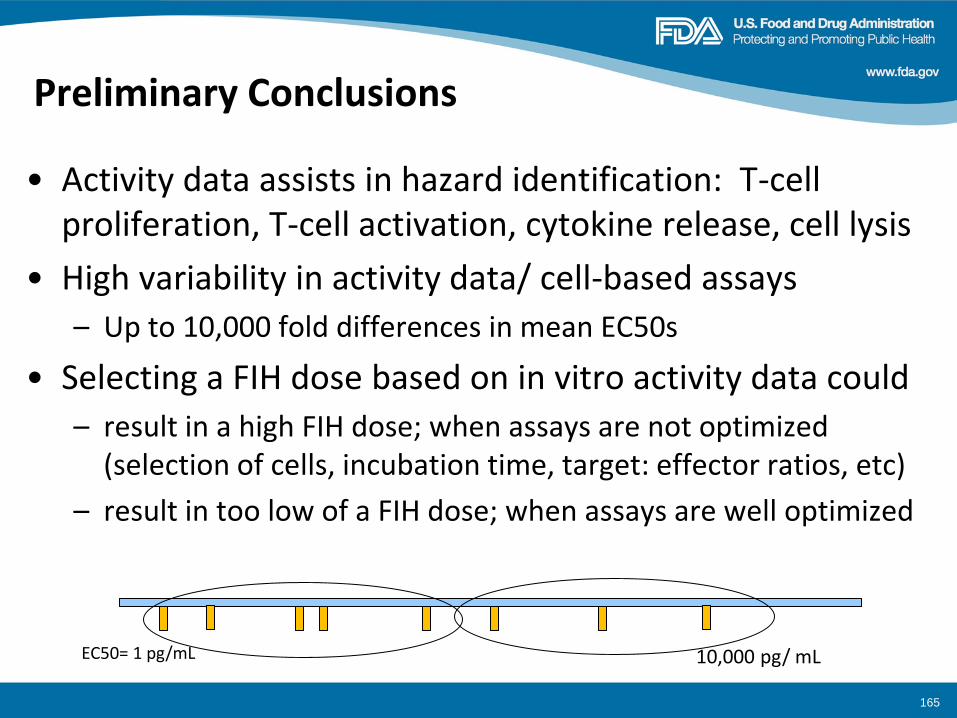
Preliminary Conclusions
• Activity data assists in hazard identification: T-cell proliferation, T-cell activation, cytokine release, cell lysis
• High variability in activity data/ cell-based assays
– Up to 10,000 fold differences in mean EC50s
• Selecting a FIH dose based on in vitro activity data could
– result in a high FIH dose; when assays are not optimized (selection of cells, incubation time, target: effector ratios, etc)
– result in too low of a FIH dose; when assays are well optimized
EC50= 1 pg/mL 10,000 pg/ mL
165
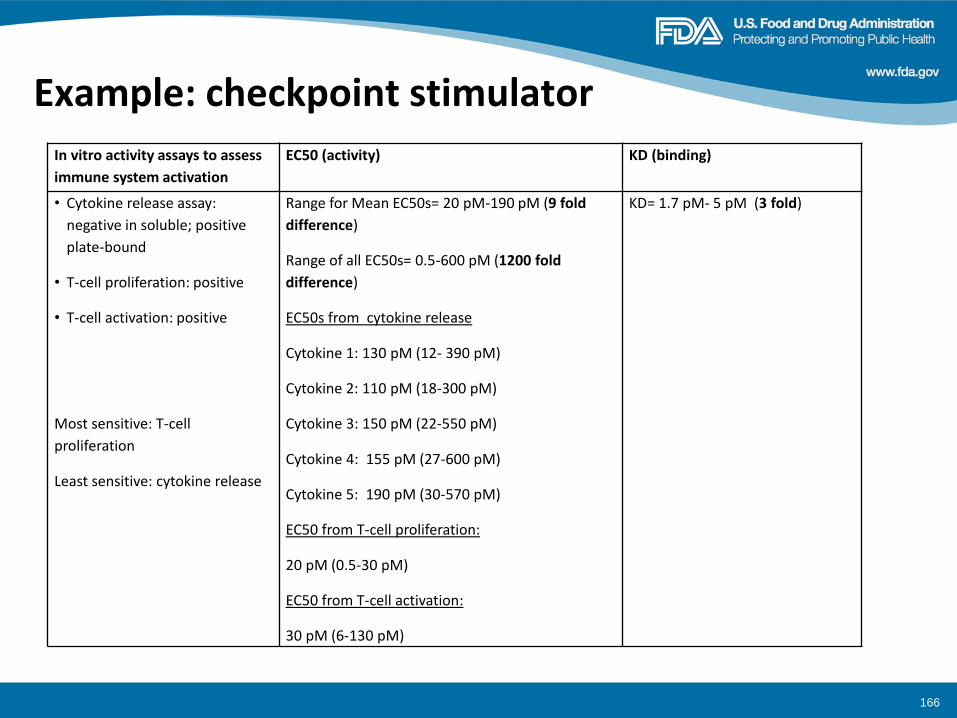
Example: checkpoint stimulator
166
In vitro activity assays to assess
immune system activation
EC50 (activity) KD (binding)
• Cytokine release assay:
negative in soluble; positive
plate-bound
• T-cell proliferation: positive
• T-cell activation: positive
Most sensitive: T-cell
proliferation
Least sensitive: cytokine release
Range for Mean EC50s= 20 pM-190 pM (9 fold
difference)
Range of all EC50s= 0.5-600 pM (1200 fold
difference)
EC50s from cytokine release
Cytokine 1: 130 pM (12- 390 pM)
Cytokine 2: 110 pM (18-300 pM)
Cytokine 3: 150 pM (22-550 pM)
Cytokine 4: 155 pM (27-600 pM)
Cytokine 5: 190 pM (30-570 pM)
EC50 from T-cell proliferation:
20 pM (0.5-30 pM)
EC50 from T-cell activation:
30 pM (6-130 pM)
KD= 1.7 pM- 5 pM (3 fold)
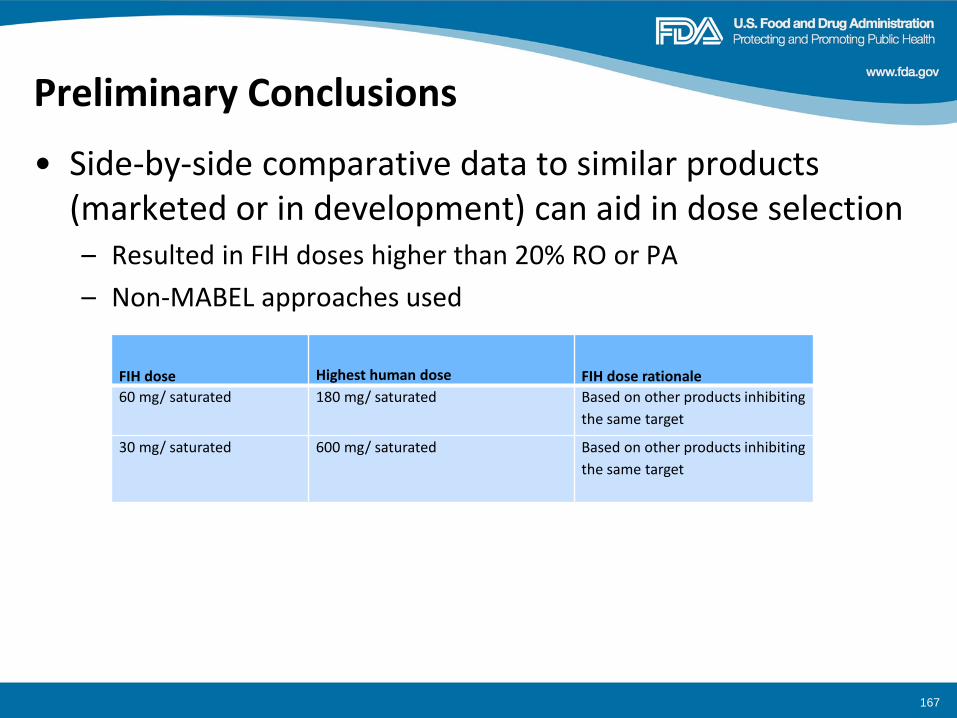
Preliminary Conclusions
• Side-by-side comparative data to similar products (marketed or in development) can aid in dose selection – Resulted in FIH doses higher than 20% RO or PA
– Non-MABEL approaches used
167
FIH dose Highest human dose FIH dose rationale
60 mg/ saturated 180 mg/ saturated Based on other products inhibiting
the same target
30 mg/ saturated 600 mg/ saturated Based on other products inhibiting
the same target
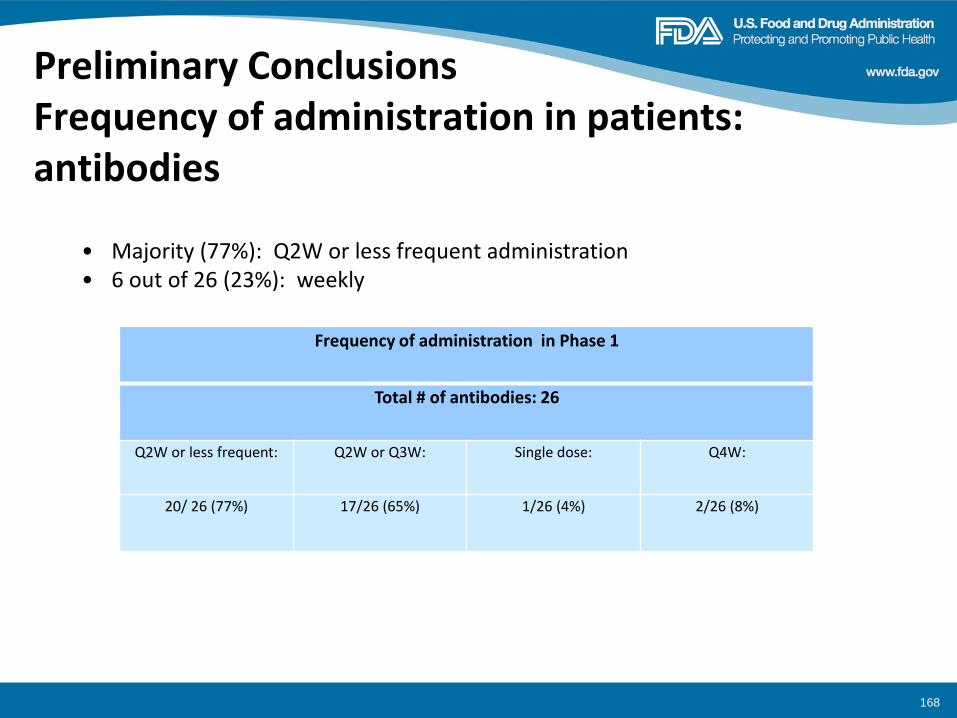
Preliminary Conclusions Frequency of administration in patients: antibodies
168
Frequency of administration in Phase 1
Total # of antibodies: 26
Q2W or less frequent: Q2W or Q3W: Single dose: Q4W:
20/ 26 (77%) 17/26 (65%) 1/26 (4%) 2/26 (8%)
• Majority (77%): Q2W or less frequent administration • 6 out of 26 (23%): weekly
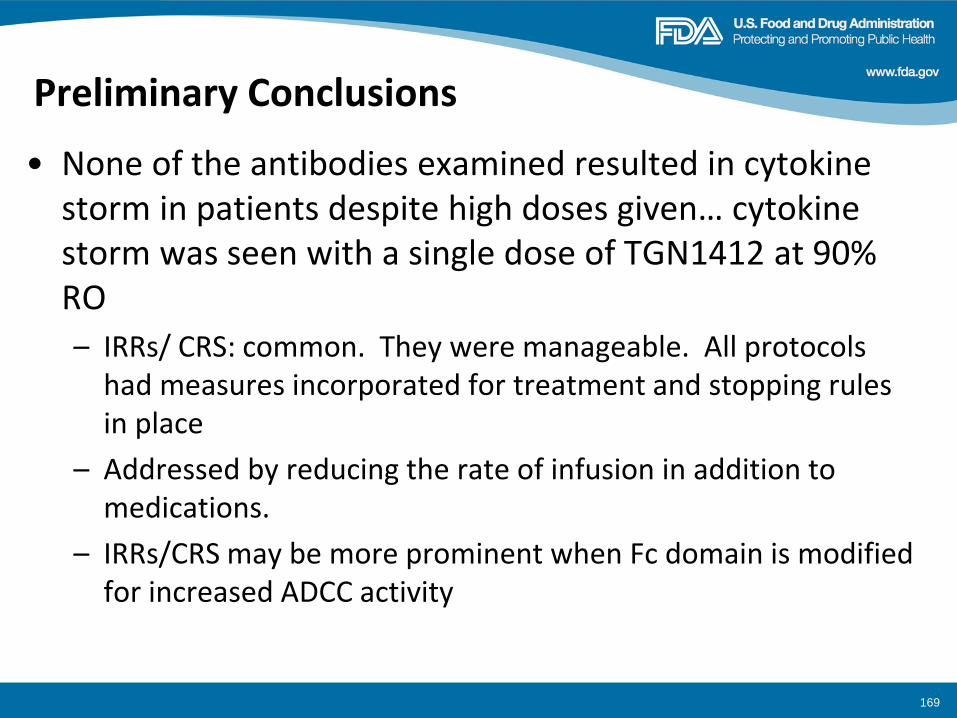
Preliminary Conclusions
• None of the antibodies examined resulted in cytokine storm in patients despite high doses given… cytokine storm was seen with a single dose of TGN1412 at 90% RO
– IRRs/ CRS: common. They were manageable. All protocols had measures incorporated for treatment and stopping rules in place
– Addressed by reducing the rate of infusion in addition to medications.
– IRRs/CRS may be more prominent when Fc domain is modified for increased ADCC activity
169
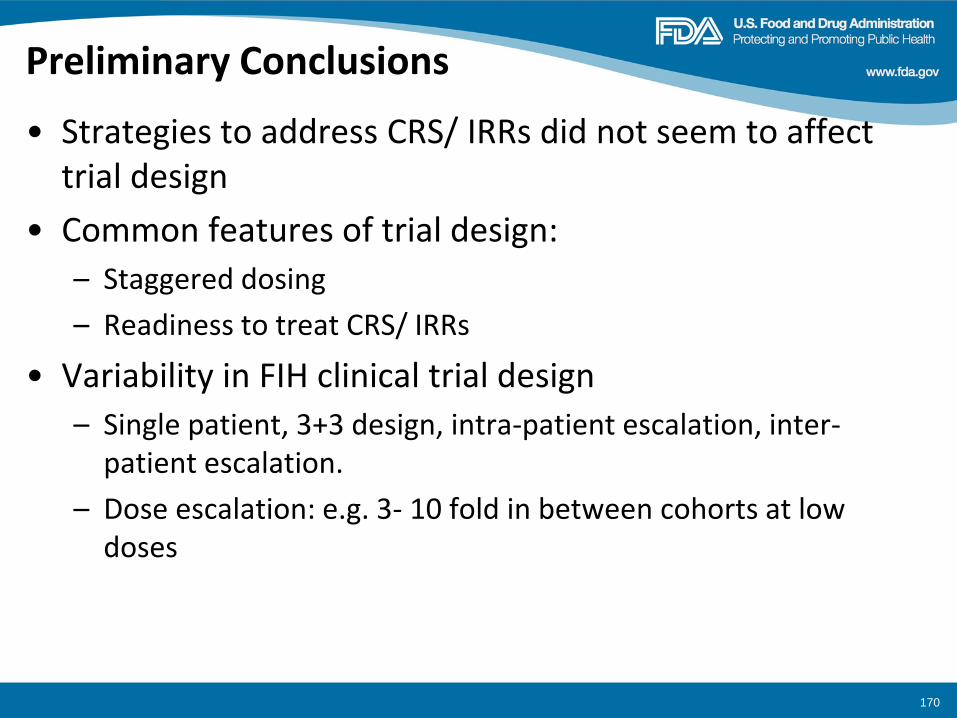
Preliminary Conclusions
• Strategies to address CRS/ IRRs did not seem to affect trial design
• Common features of trial design:
– Staggered dosing
– Readiness to treat CRS/ IRRs
• Variability in FIH clinical trial design
– Single patient, 3+3 design, intra-patient escalation, inter-patient escalation.
– Dose escalation: e.g. 3- 10 fold in between cohorts at low doses
170
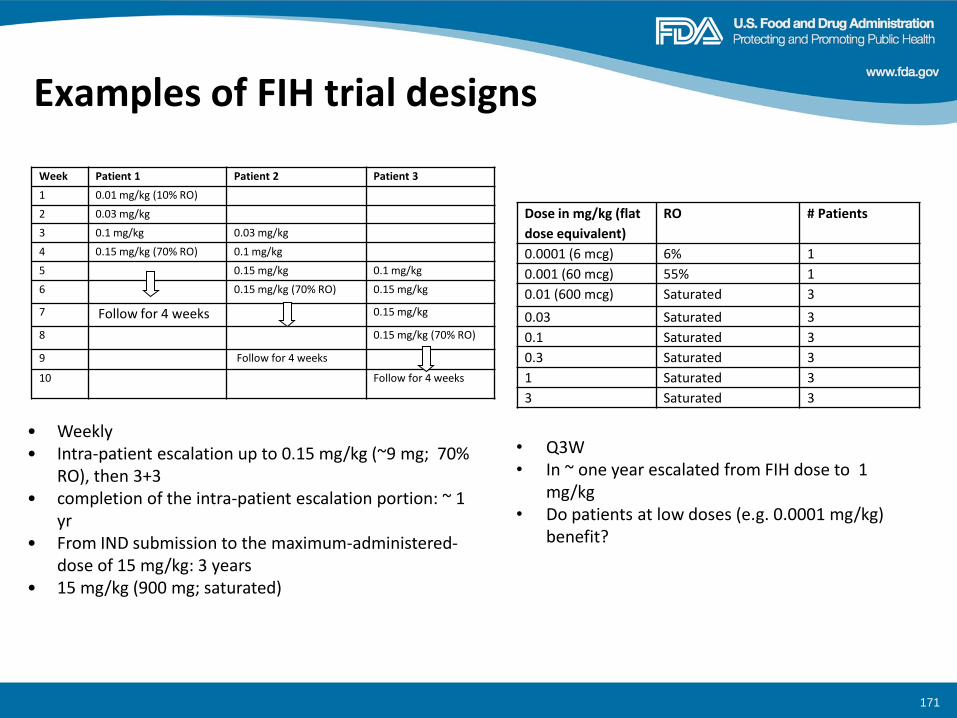
Examples of FIH trial designs
• Weekly • Intra-patient escalation up to 0.15 mg/kg (~9 mg; 70%
RO), then 3+3 • completion of the intra-patient escalation portion: ~ 1
yr • From IND submission to the maximum-administered-
dose of 15 mg/kg: 3 years • 15 mg/kg (900 mg; saturated)
Dose in mg/kg (flat
dose equivalent)
RO # Patients
0.0001 (6 mcg) 6% 1
0.001 (60 mcg) 55% 1
0.01 (600 mcg) Saturated 3
0.03 Saturated 3
0.1 Saturated 3
0.3 Saturated 3
1 Saturated 3
3 Saturated 3
• Q3W • In ~ one year escalated from FIH dose to 1
mg/kg • Do patients at low doses (e.g. 0.0001 mg/kg)
benefit?
171
Week Patient 1 Patient 2 Patient 3
1 0.01 mg/kg (10% RO)
2 0.03 mg/kg
3 0.1 mg/kg 0.03 mg/kg
4 0.15 mg/kg (70% RO) 0.1 mg/kg
5 0.15 mg/kg 0.1 mg/kg
6 0.15 mg/kg (70% RO) 0.15 mg/kg
7 Follow for 4 weeks 0.15 mg/kg
8 0.15 mg/kg (70% RO)
9 Follow for 4 weeks
10 Follow for 4 weeks
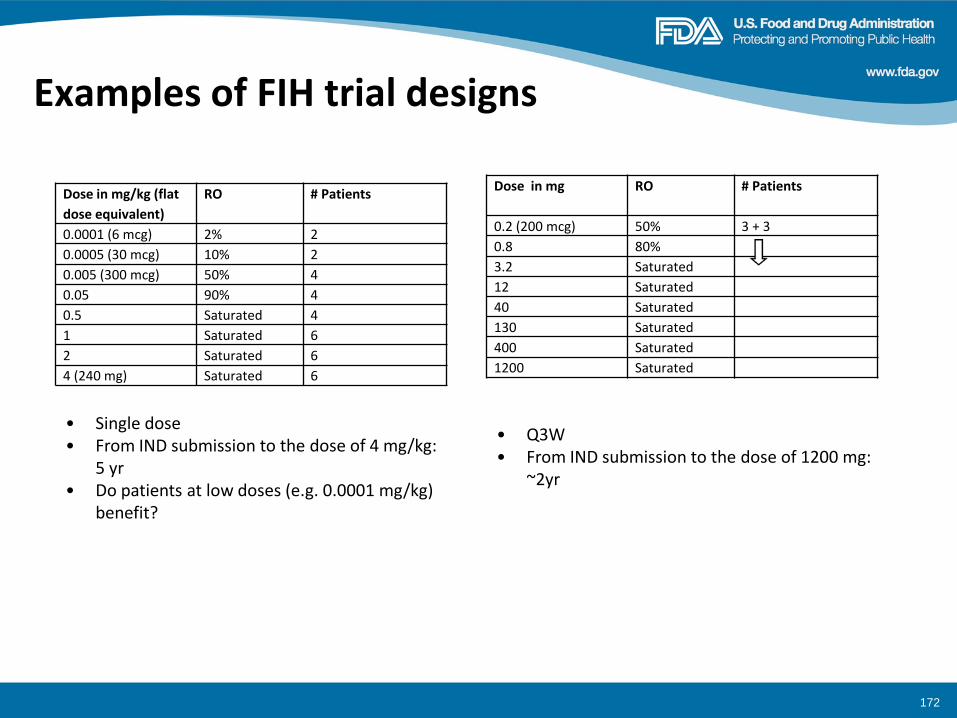
Examples of FIH trial designs
Dose in mg/kg (flat
dose equivalent)
RO # Patients
0.0001 (6 mcg) 2% 2
0.0005 (30 mcg) 10% 2
0.005 (300 mcg) 50% 4
0.05 90% 4
0.5 Saturated 4
1 Saturated 6
2 Saturated 6
4 (240 mg) Saturated 6
• Single dose • From IND submission to the dose of 4 mg/kg:
5 yr • Do patients at low doses (e.g. 0.0001 mg/kg)
benefit?
172
Dose in mg RO # Patients
0.2 (200 mcg) 50% 3 + 3
0.8 80%
3.2 Saturated
12 Saturated
40 Saturated
130 Saturated
400 Saturated
1200 Saturated
• Q3W • From IND submission to the dose of 1200 mg:
~2yr
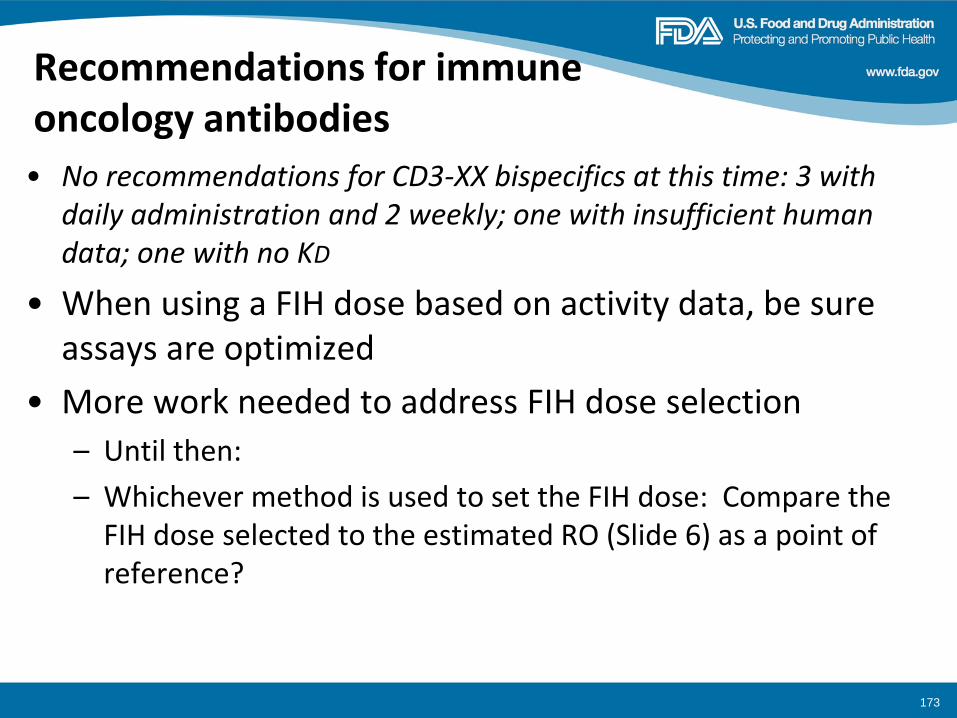
Recommendations for immune oncology antibodies
• No recommendations for CD3-XX bispecifics at this time: 3 with daily administration and 2 weekly; one with insufficient human data; one with no KD
• When using a FIH dose based on activity data, be sure assays are optimized
• More work needed to address FIH dose selection
– Until then:
– Whichever method is used to set the FIH dose: Compare the FIH dose selected to the estimated RO (Slide 6) as a point of reference?
173
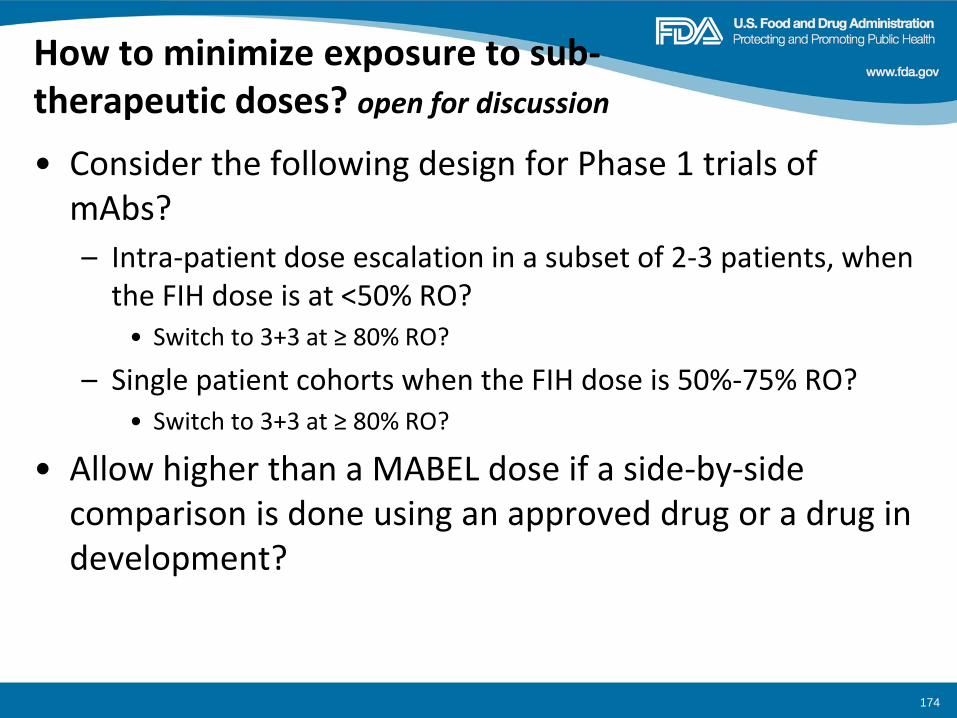
How to minimize exposure to sub-therapeutic doses? open for discussion
• Consider the following design for Phase 1 trials of mAbs?
– Intra-patient dose escalation in a subset of 2-3 patients, when the FIH dose is at <50% RO?
• Switch to 3+3 at ≥ 80% RO?
– Single patient cohorts when the FIH dose is 50%-75% RO? • Switch to 3+3 at ≥ 80% RO?
• Allow higher than a MABEL dose if a side-by-side comparison is done using an approved drug or a drug in development?
174
Examples of immune oncology mAbs in our database: FIH doses compared to highest human doses
175
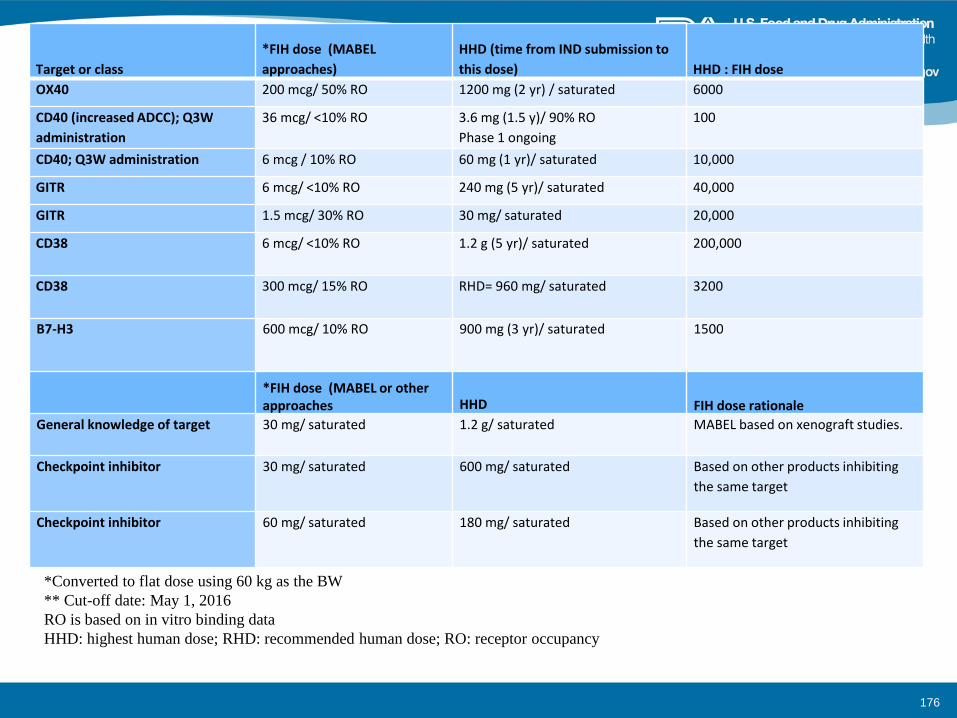
*Converted to flat dose using 60 kg as the BW
** Cut-off date: May 1, 2016
RO is based on in vitro binding data
HHD: highest human dose; RHD: recommended human dose; RO: receptor occupancy
Target or class
*FIH dose (MABEL
approaches)
HHD (time from IND submission to
this dose) HHD : FIH dose
OX40 200 mcg/ 50% RO 1200 mg (2 yr) / saturated 6000
CD40 (increased ADCC); Q3W
administration
36 mcg/ <10% RO 3.6 mg (1.5 y)/ 90% RO
Phase 1 ongoing
100
CD40; Q3W administration 6 mcg / 10% RO 60 mg (1 yr)/ saturated 10,000
GITR 6 mcg/ <10% RO 240 mg (5 yr)/ saturated 40,000
GITR 1.5 mcg/ 30% RO 30 mg/ saturated 20,000
CD38 6 mcg/ <10% RO 1.2 g (5 yr)/ saturated 200,000
CD38 300 mcg/ 15% RO RHD= 960 mg/ saturated 3200
B7-H3 600 mcg/ 10% RO
900 mg (3 yr)/ saturated 1500
*FIH dose (MABEL or other approaches HHD FIH dose rationale
General knowledge of target 30 mg/ saturated 1.2 g/ saturated MABEL based on xenograft studies.
Checkpoint inhibitor 30 mg/ saturated 600 mg/ saturated Based on other products inhibiting
the same target
Checkpoint inhibitor 60 mg/ saturated 180 mg/ saturated Based on other products inhibiting
the same target
176
Working group
• Ramadevi Gudi
• John Leighton
• Michael Manning
• Haleh Saber
• Emily Wearne
177
Pasi A. Jänne, M.D.,Ph.D.
Lowe Center for Thoracic Oncology
Dana Farber Cancer Institute
Development of Osimertinib in
EGFR Mutant Lung Cancer
Disclosure Information Pasi A. Jänne, MD, PhD
Consultant for: Astra Zeneca, Boehringer Ingelheim, Pfizer, Genentech, Roche, Sanofi-Aventis, Clovis Oncology, Chugai Pharmaceuticals, Merrimack Pharmaceuticals Research Support: Astellas, AstraZeneca Stockholder in: Gatekeeper Pharmaceuticals Other: LabCorp – post-marketing royalties from DFCI owned intellectual property on EGFR mutations
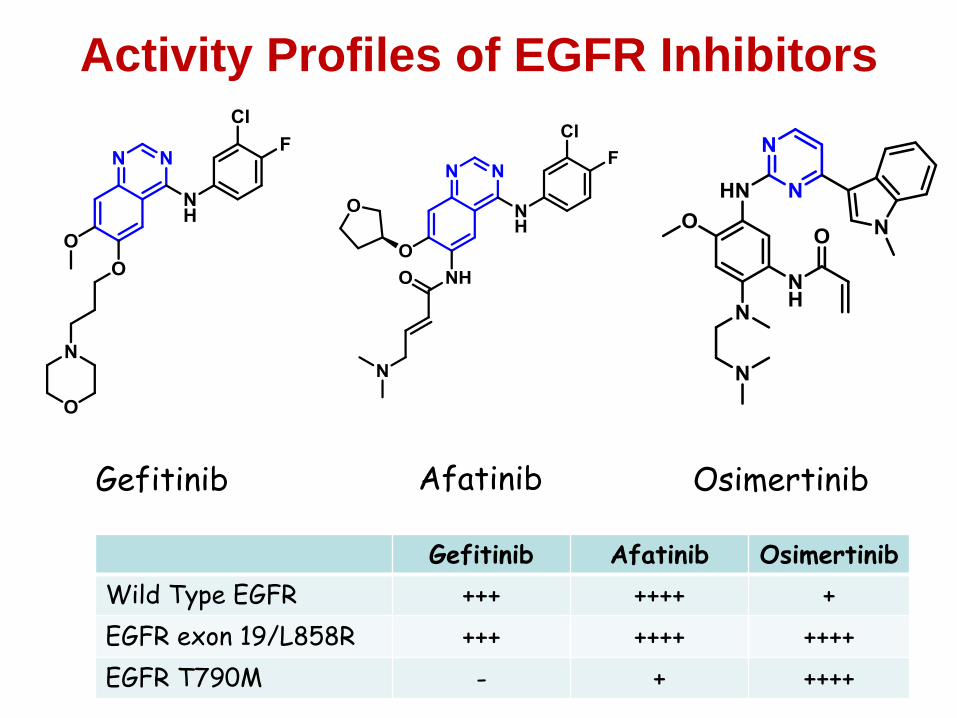
Activity Profiles of EGFR Inhibitors
Gefitinib Afatinib Osimertinib
Gefitinib Afatinib Osimertinib
Wild Type EGFR +++ ++++ +
EGFR exon 19/L858R +++ ++++ ++++
EGFR T790M - + ++++
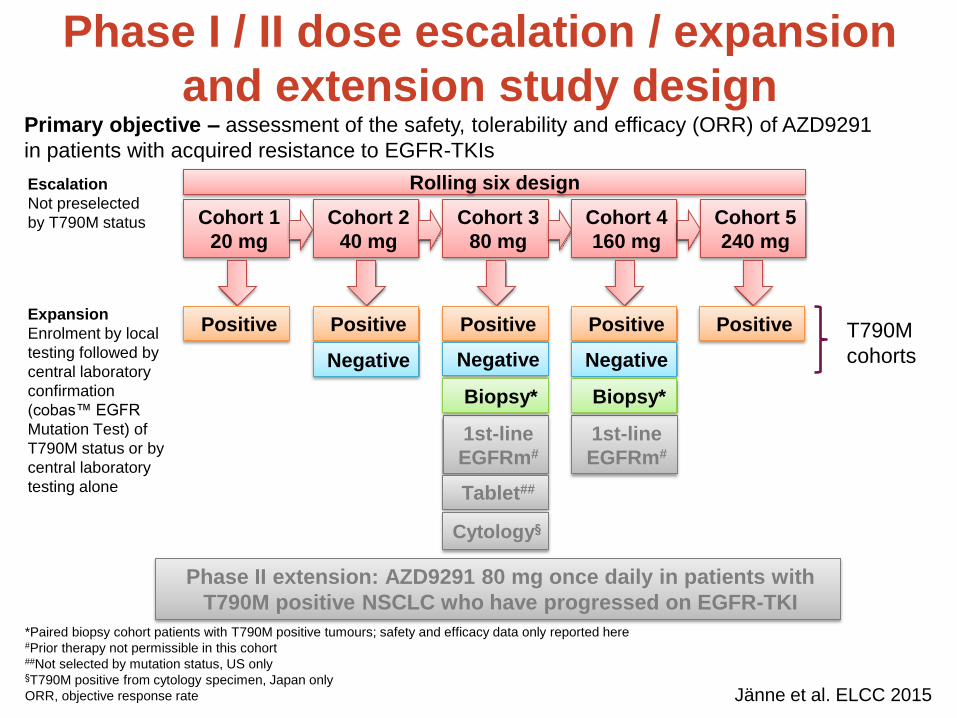
Phase I / II dose escalation / expansion
and extension study design
Cohort 1
20 mg
Positive
Cohort 2
40 mg
Cohort 3
80 mg
Cohort 4
160 mg
Positive
Negative
Positive
Negative
Positive
Negative
Escalation
Not preselected
by T790M status
Expansion
Enrolment by local
testing followed by
central laboratory
confirmation
(cobas™ EGFR
Mutation Test) of
T790M status or by
central laboratory
testing alone
Cohort 5
240 mg
Positive
1st-line
EGFRm#
Rolling six design
Tablet##
1st-line
EGFRm#
Primary objective – assessment of the safety, tolerability and efficacy (ORR) of AZD9291
in patients with acquired resistance to EGFR-TKIs
*Paired biopsy cohort patients with T790M positive tumours; safety and efficacy data only reported here #Prior therapy not permissible in this cohort ##Not selected by mutation status, US only §T790M positive from cytology specimen, Japan only
ORR, objective response rate
T790M
cohorts
Phase II extension: AZD9291 80 mg once daily in patients with
T790M positive NSCLC who have progressed on EGFR-TKI
Cytology§
Biopsy* Biopsy*
Jänne et al. ELCC 2015
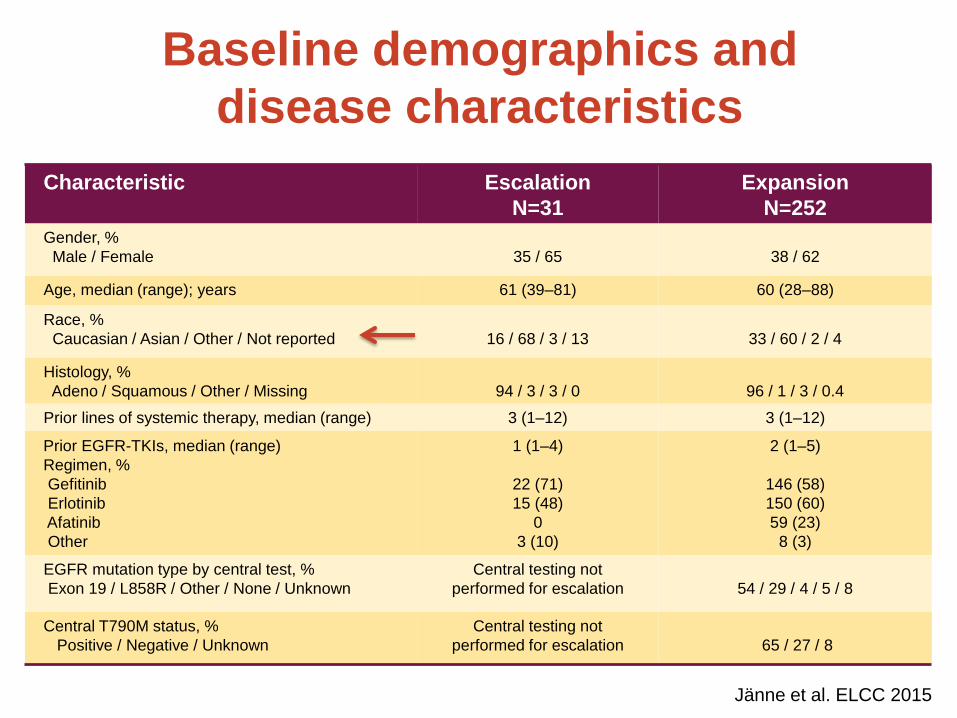
Baseline demographics and
disease characteristics
Characteristic Escalation
N=31
Expansion
N=252
Gender, %
Male / Female
35 / 65
38 / 62
Age, median (range); years 61 (39–81) 60 (28–88)
Race, %
Caucasian / Asian / Other / Not reported
16 / 68 / 3 / 13
33 / 60 / 2 / 4
Histology, %
Adeno / Squamous / Other / Missing
94 / 3 / 3 / 0
96 / 1 / 3 / 0.4
Prior lines of systemic therapy, median (range) 3 (1–12) 3 (1–12)
Prior EGFR-TKIs, median (range)
Regimen, %
Gefitinib
Erlotinib
Afatinib
Other
1 (1–4)
22 (71)
15 (48)
0
3 (10)
2 (1–5)
146 (58)
150 (60)
59 (23)
8 (3)
EGFR mutation type by central test, %
Exon 19 / L858R / Other / None / Unknown
Central testing not
performed for escalation
54 / 29 / 4 / 5 / 8
Central T790M status, %
Positive / Negative / Unknown
Central testing not
performed for escalation
65 / 27 / 8
Jänne et al. ELCC 2015
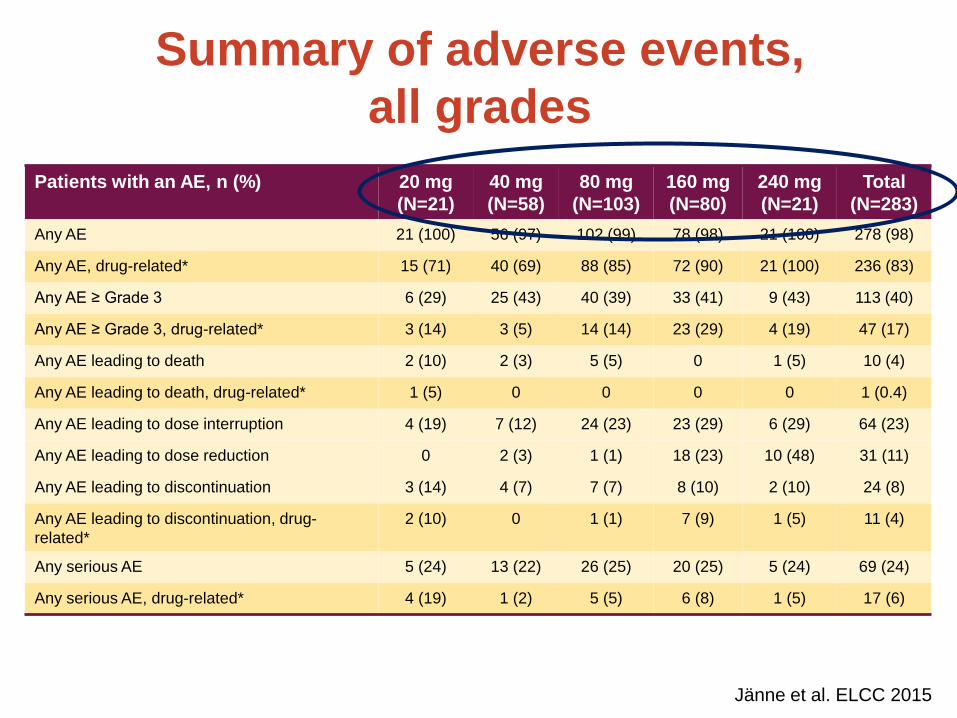
Summary of adverse events,
all grades
Patients with an AE, n (%) 20 mg
(N=21)
40 mg
(N=58)
80 mg
(N=103)
160 mg
(N=80)
240 mg
(N=21)
Total
(N=283)
Any AE 21 (100) 56 (97) 102 (99) 78 (98) 21 (100) 278 (98)
Any AE, drug-related* 15 (71) 40 (69) 88 (85) 72 (90) 21 (100) 236 (83)
Any AE ≥ Grade 3 6 (29) 25 (43) 40 (39) 33 (41) 9 (43) 113 (40)
Any AE ≥ Grade 3, drug-related* 3 (14) 3 (5) 14 (14) 23 (29) 4 (19) 47 (17)
Any AE leading to death 2 (10) 2 (3) 5 (5) 0 1 (5) 10 (4)
Any AE leading to death, drug-related* 1 (5) 0 0 0 0 1 (0.4)
Any AE leading to dose interruption 4 (19) 7 (12) 24 (23) 23 (29) 6 (29) 64 (23)
Any AE leading to dose reduction 0 2 (3) 1 (1) 18 (23) 10 (48) 31 (11)
Any AE leading to discontinuation 3 (14) 4 (7) 7 (7) 8 (10) 2 (10) 24 (8)
Any AE leading to discontinuation, drug-
related*
2 (10) 0 1 (1) 7 (9) 1 (5) 11 (4)
Any serious AE 5 (24) 13 (22) 26 (25) 20 (25) 5 (24) 69 (24)
Any serious AE, drug-related* 4 (19) 1 (2) 5 (5) 6 (8) 1 (5) 17 (6)
Jänne et al. ELCC 2015
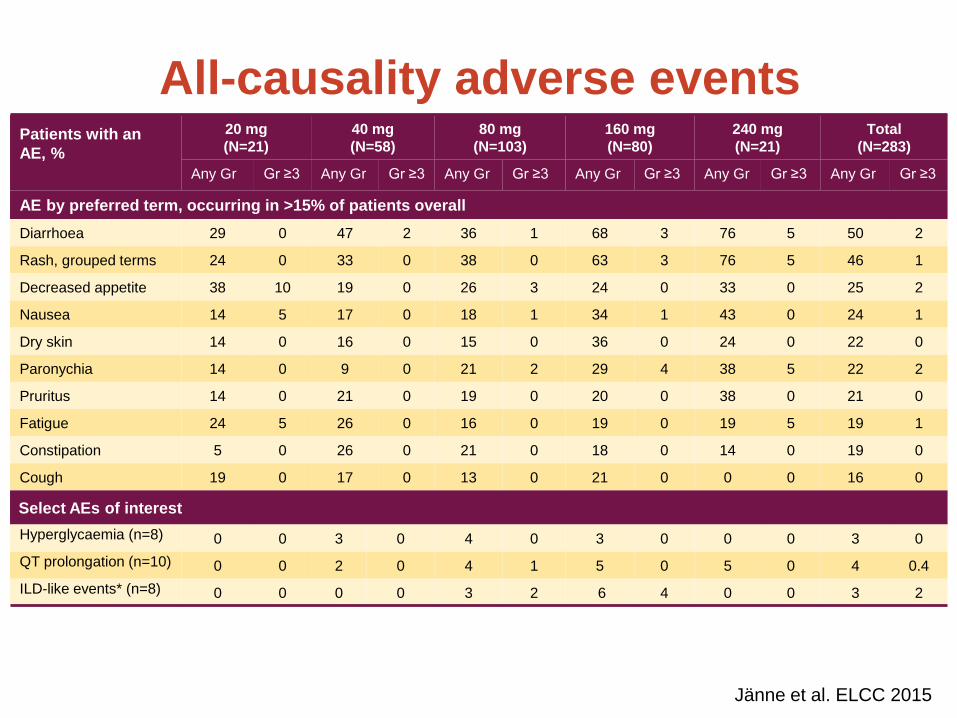
All-causality adverse events
Patients with an
AE, %
20 mg
(N=21)
40 mg
(N=58)
80 mg
(N=103)
160 mg
(N=80)
240 mg
(N=21)
Total
(N=283)
Any Gr Gr ≥3 Any Gr Gr ≥3 Any Gr Gr ≥3 Any Gr Gr ≥3 Any Gr Gr ≥3 Any Gr Gr ≥3
AE by preferred term, occurring in >15% of patients overall
Diarrhoea 29 0 47 2 36 1 68 3 76 5 50 2
Rash, grouped terms 24 0 33 0 38 0 63 3 76 5 46 1
Decreased appetite 38 10 19 0 26 3 24 0 33 0 25 2
Nausea 14 5 17 0 18 1 34 1 43 0 24 1
Dry skin 14 0 16 0 15 0 36 0 24 0 22 0
Paronychia 14 0 9 0 21 2 29 4 38 5 22 2
Pruritus 14 0 21 0 19 0 20 0 38 0 21 0
Fatigue 24 5 26 0 16 0 19 0 19 5 19 1
Constipation 5 0 26 0 21 0 18 0 14 0 19 0
Cough 19 0 17 0 13 0 21 0 0 0 16 0
Select AEs of interest
Hyperglycaemia (n=8) 0 0 3 0 4 0 3 0 0 0 3 0
QT prolongation (n=10) 0 0 2 0 4 1 5 0 5 0 4 0.4
ILD-like events* (n=8) 0 0 0 0 3 2 6 4 0 0 3 2
Jänne et al. ELCC 2015
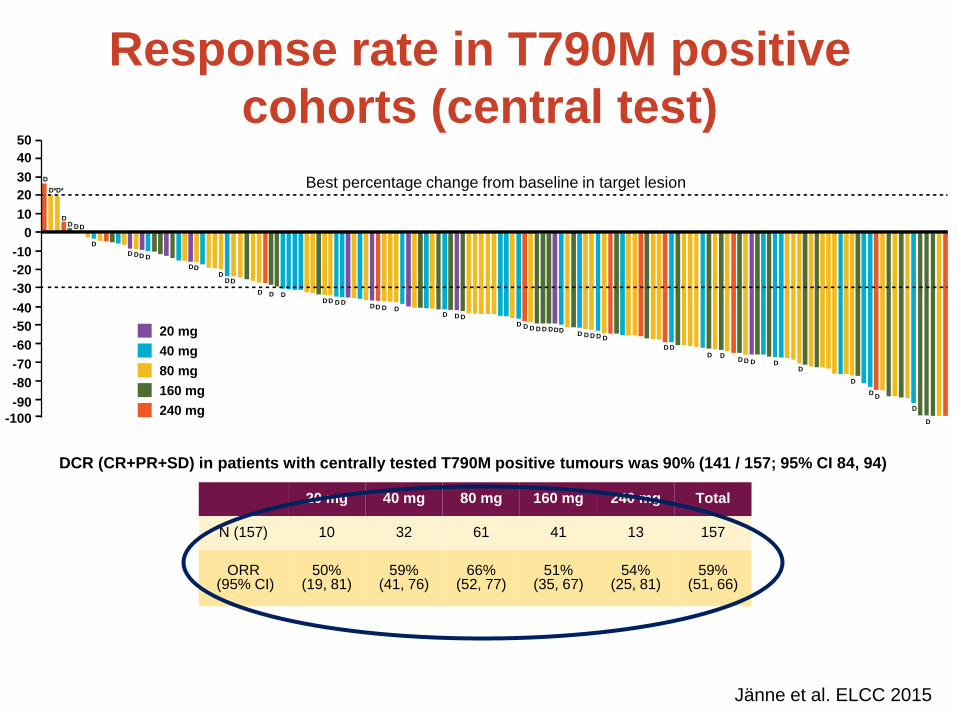
20 mg 40 mg 80 mg 160 mg 240 mg Total
N (157) 10 32 61 41 13 157
ORR (95% CI)
50% (19, 81)
59% (41, 76)
66% (52, 77)
51% (35, 67)
54% (25, 81)
59% (51, 66)
Response rate in T790M positive
cohorts (central test)
DCR (CR+PR+SD) in patients with centrally tested T790M positive tumours was 90% (141 / 157; 95% CI 84, 94)
40 mg
80 mg
160 mg
240 mg
20 mg
-100
-90
-80
-70
-60
-50
-40
-30
-20
-10
0
10
20
30
40
50
D
D* D*
D D D D
D
D D D D
D D D
D D
D
D D
D D D D D D D
D D D D D D D D D D D
D D D D D
D D D D
D D D D D
D
D D
D
D
D
Best percentage change from baseline in target lesion
Jänne et al. ELCC 2015
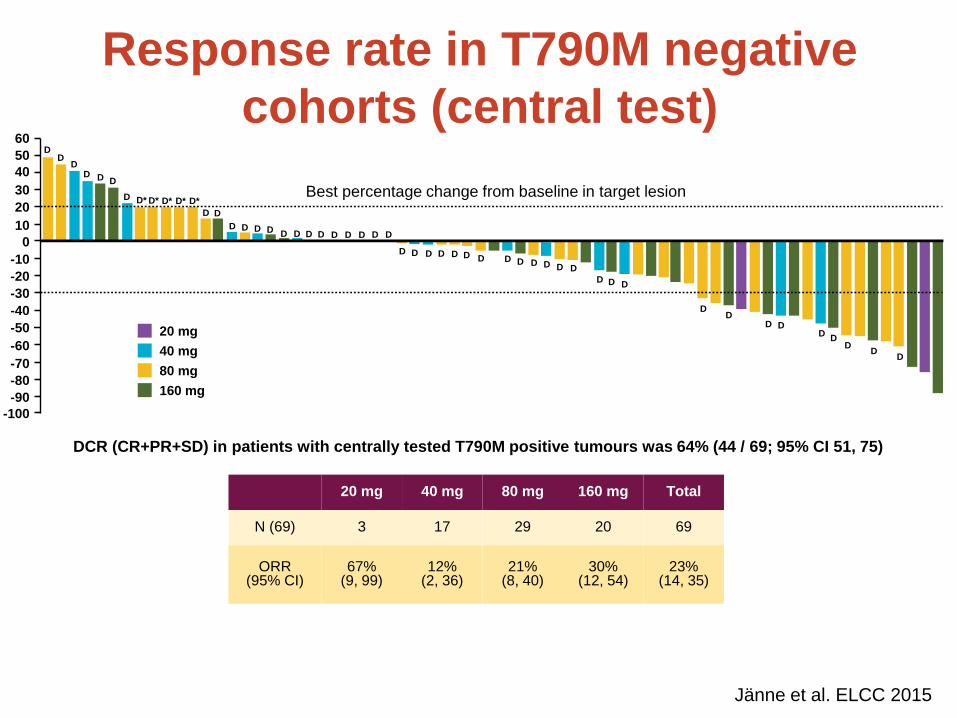
DCR (CR+PR+SD) in patients with centrally tested T790M positive tumours was 64% (44 / 69; 95% CI 51, 75)
20 mg 40 mg 80 mg 160 mg Total
N (69) 3 17 29 20 69
ORR (95% CI)
67% (9, 99)
12% (2, 36)
21% (8, 40)
30% (12, 54)
23% (14, 35)
Response rate in T790M negative
cohorts (central test)
40 mg
80 mg
160 mg
20 mg
-100
-90
-80
-70
-60
-50
-40
-30
-20
-10
0
10
20
30
40
50
60 D
D D
D D D
D D* D* D* D* D*
D D
D D D D D D D D D D D D D
D D D D D D D D D D D D D
D D D
D D
D D D
D D
D D
Best percentage change from baseline in target lesion
Jänne et al. ELCC 2015
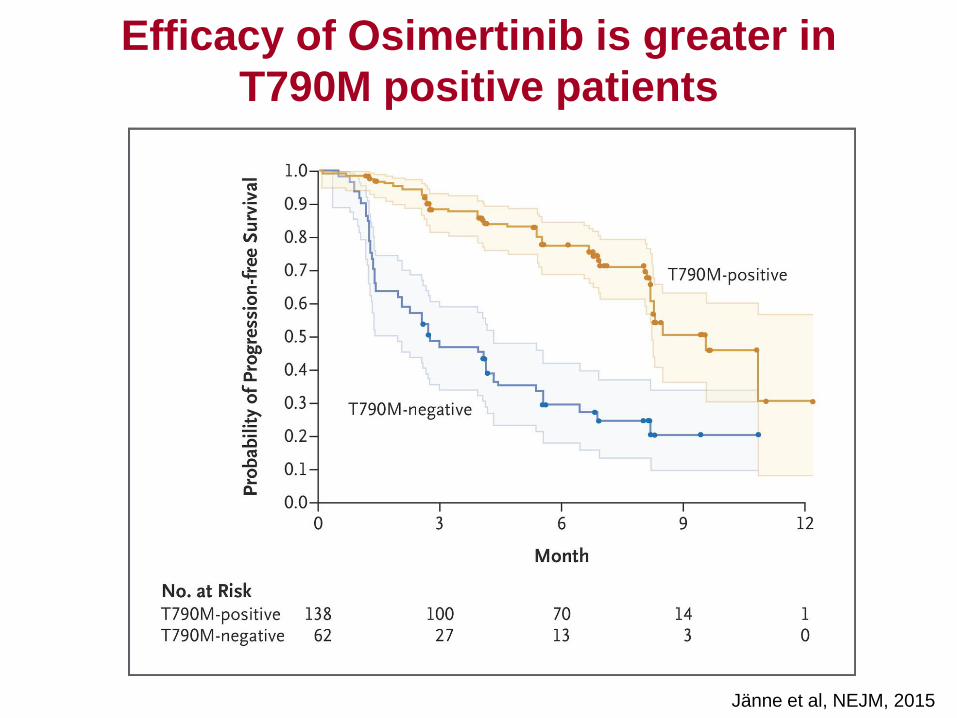
Jänne et al, NEJM, 2015
Efficacy of Osimertinib is greater in
T790M positive patients
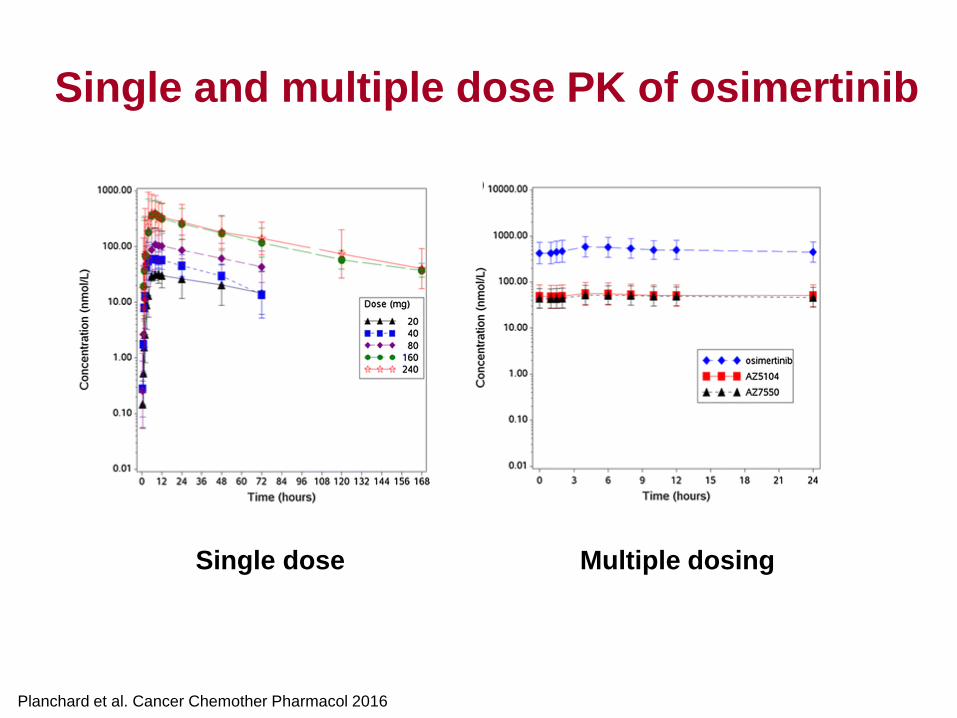
Single dose Multiple dosing
Planchard et al. Cancer Chemother Pharmacol 2016
Single and multiple dose PK of osimertinib
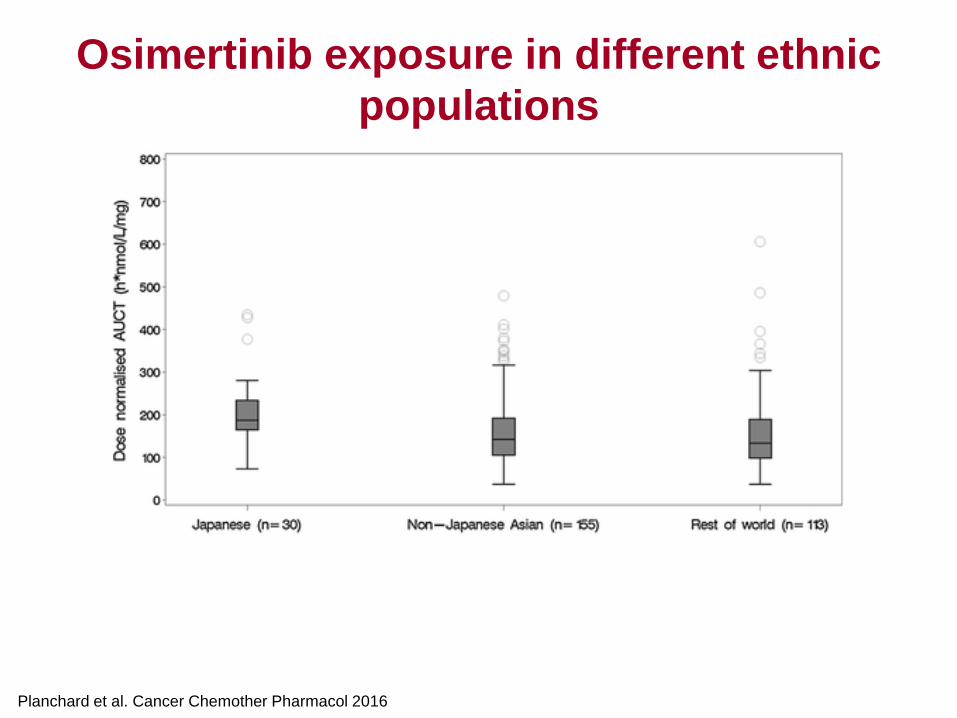
Planchard et al. Cancer Chemother Pharmacol 2016
Osimertinib exposure in different ethnic
populations
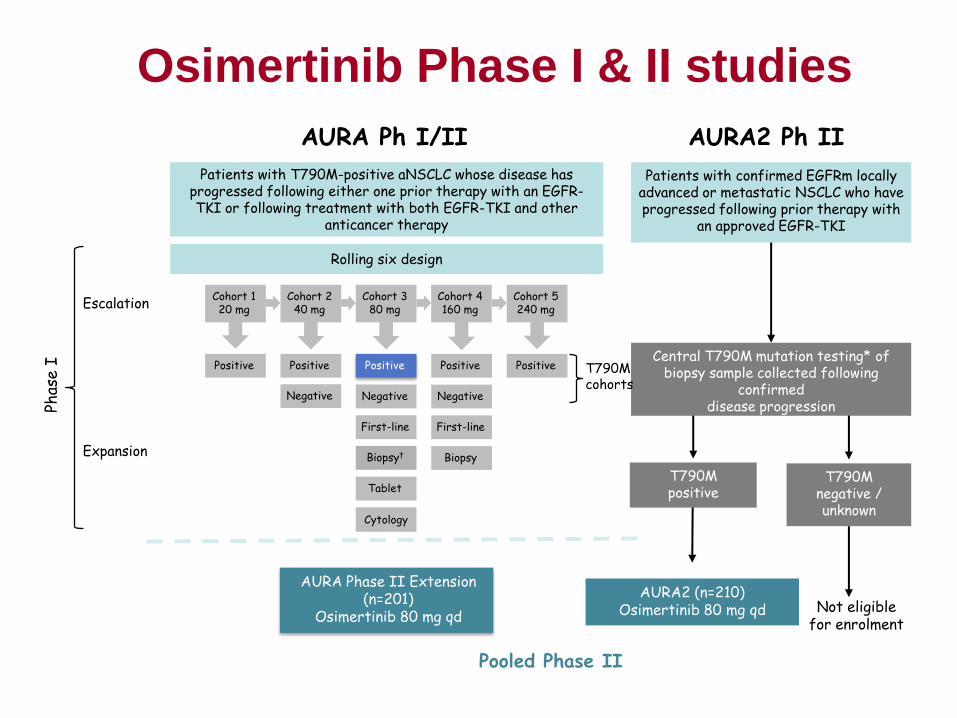
Osimertinib Phase I & II studies
AURA2 (n=210) Osimertinib 80 mg qd
T790M positive
T790M negative / unknown
Central T790M mutation testing* of biopsy sample collected following
confirmed disease progression
Patients with confirmed EGFRm locally advanced or metastatic NSCLC who have progressed following prior therapy with
an approved EGFR-TKI
Escalation
Expansion
Phas
e I
AURA Phase II Extension (n=201)
Osimertinib 80 mg qd
T790M cohorts
Cohort 1 20 mg
Negative
Cohort 2 40 mg
Cohort 5 240 mg
Rolling six design
Cytology
Tablet
Negative
Cohort 3 80 mg
Negative
Cohort 4 160 mg
Positive Positive Positive Positive Positive
Biopsy† Biopsy
First-line First-line
AURA Ph I/II AURA2 Ph II
Not eligible for enrolment
Patients with T790M-positive aNSCLC whose disease has progressed following either one prior therapy with an EGFR-TKI or following treatment with both EGFR-TKI and other
anticancer therapy
Pooled Phase II
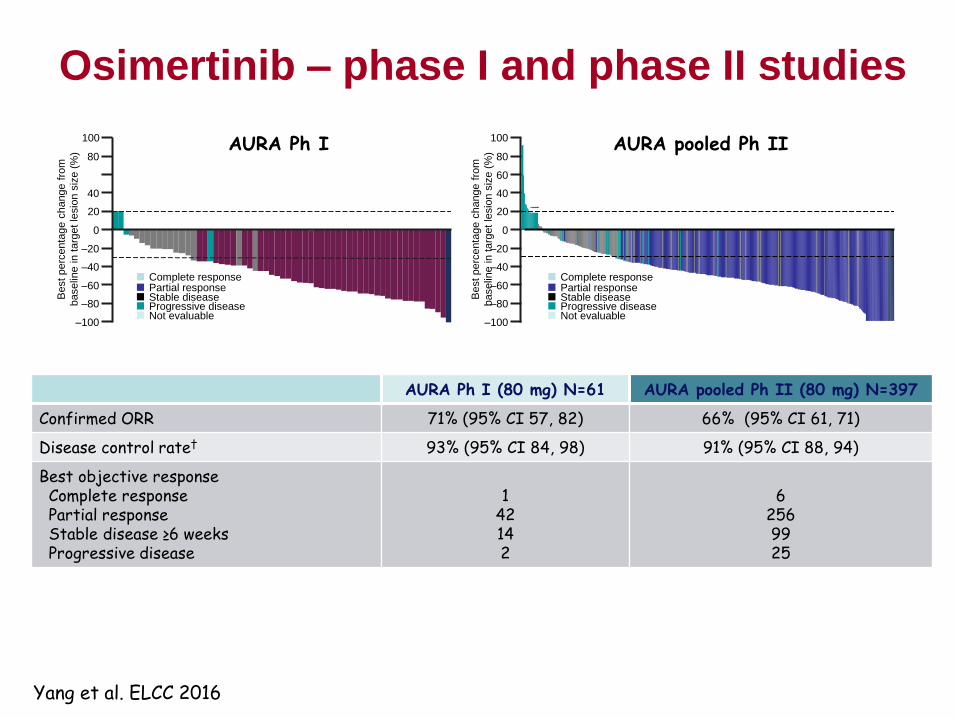
–100
–80
–40
–60
–20
0
20
40
60
80
Osimertinib – phase I and phase II studies
AURA Ph I (80 mg) N=61 AURA pooled Ph II (80 mg) N=397
Confirmed ORR 71% (95% CI 57, 82) 66% (95% CI 61, 71)
Disease control rate† 93% (95% CI 84, 98) 91% (95% CI 88, 94)
Best objective response Complete response Partial response Stable disease ≥6 weeks Progressive disease
1
42 14 2
6
256 99 25
Complete response Partial response Stable disease Progressive disease Not evaluable
Best perc
enta
ge c
hange f
rom
baselin
e in
targ
et
lesio
n s
ize (
%)
* * * * * * * * *
100 AURA pooled Ph II
–100
–80
–60
–40
0
20
40
80
–20
100
Best perc
enta
ge c
hange f
rom
baselin
e in
targ
et
lesio
n s
ize (
%)
AURA Ph I
Complete response Partial response Stable disease Progressive disease Not evaluable
Yang et al. ELCC 2016
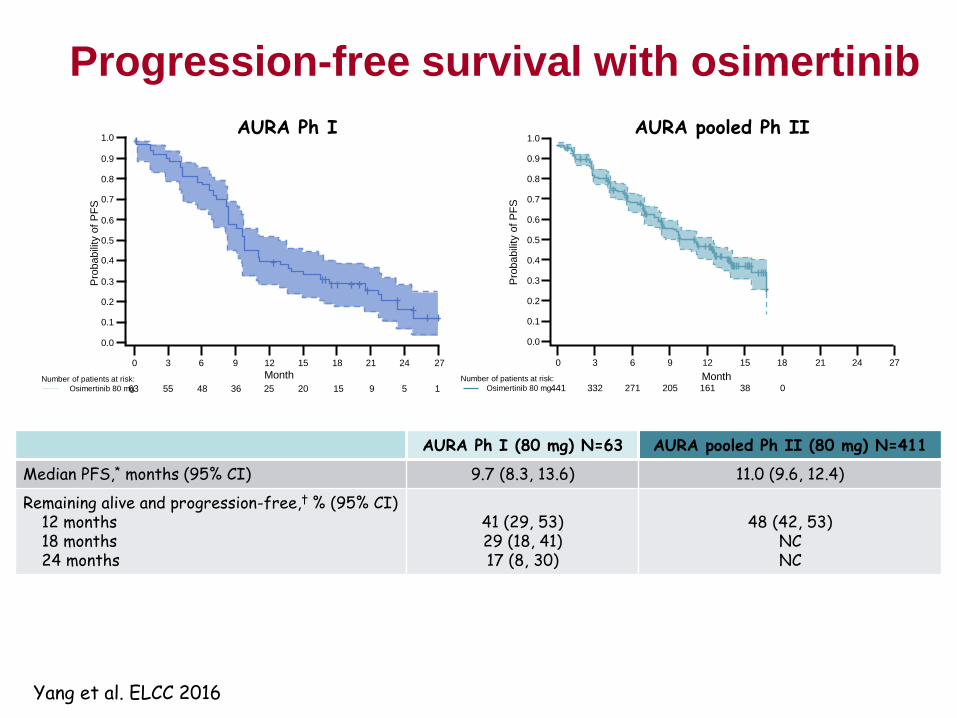
AURA pooled Ph II AURA Ph I
Progression-free survival with osimertinib
0.0
0.1
0.2
0.3
0.4
0.5
0.6
0.7
0.8
0.9
Pro
babili
ty o
f P
FS
441 332 271 205 161 38 0
AURA Ph I (80 mg) N=63 AURA pooled Ph II (80 mg) N=411
Median PFS,* months (95% CI) 9.7 (8.3, 13.6) 11.0 (9.6, 12.4)
Remaining alive and progression-free,† % (95% CI) 12 months 18 months 24 months
41 (29, 53) 29 (18, 41) 17 (8, 30)
48 (42, 53)
NC NC
0.1
0.2
0.3
0.4
0.5
0.6
0.7
0.8
0.9
1.0 1.0
0.0
Pro
babili
ty o
f P
FS
1 Number of patients at risk:
Osimertinib 80 mg
Month 0 3 6 9 12 15 18
63 55 48 36 25 20
21 24 27
15 9 5 Number of patients at risk:
Osimertinib 80 mg
0 3 6 9 12 15 18 21 24 27
Month
Yang et al. ELCC 2016
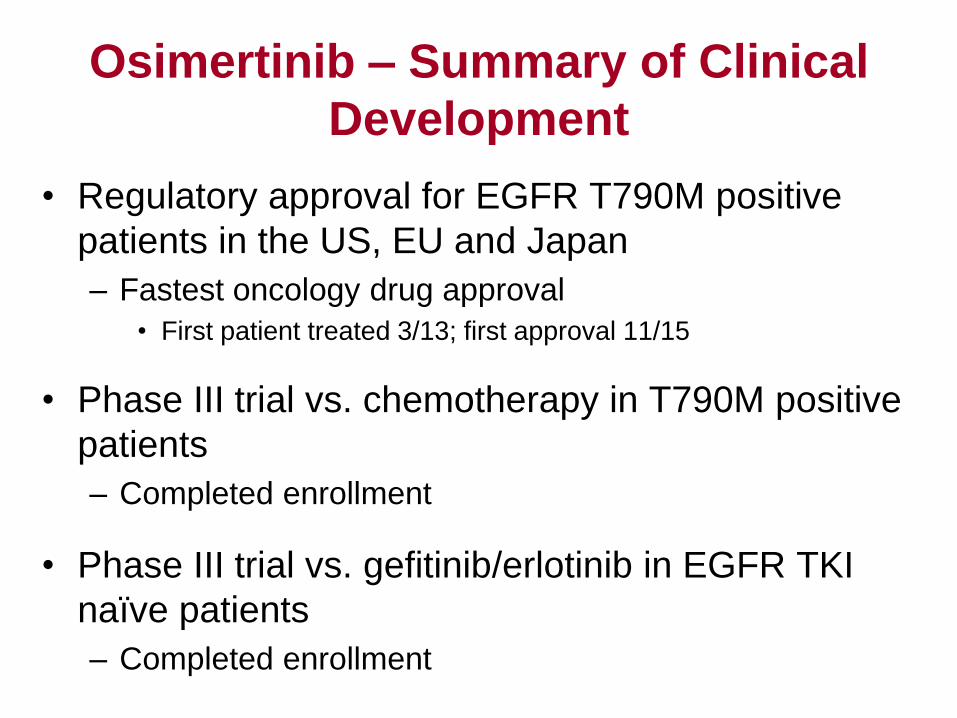
Osimertinib – Summary of Clinical
Development
• Regulatory approval for EGFR T790M positive
patients in the US, EU and Japan
– Fastest oncology drug approval
• First patient treated 3/13; first approval 11/15
• Phase III trial vs. chemotherapy in T790M positive
patients
– Completed enrollment
• Phase III trial vs. gefitinib/erlotinib in EGFR TKI
naïve patients
– Completed enrollment
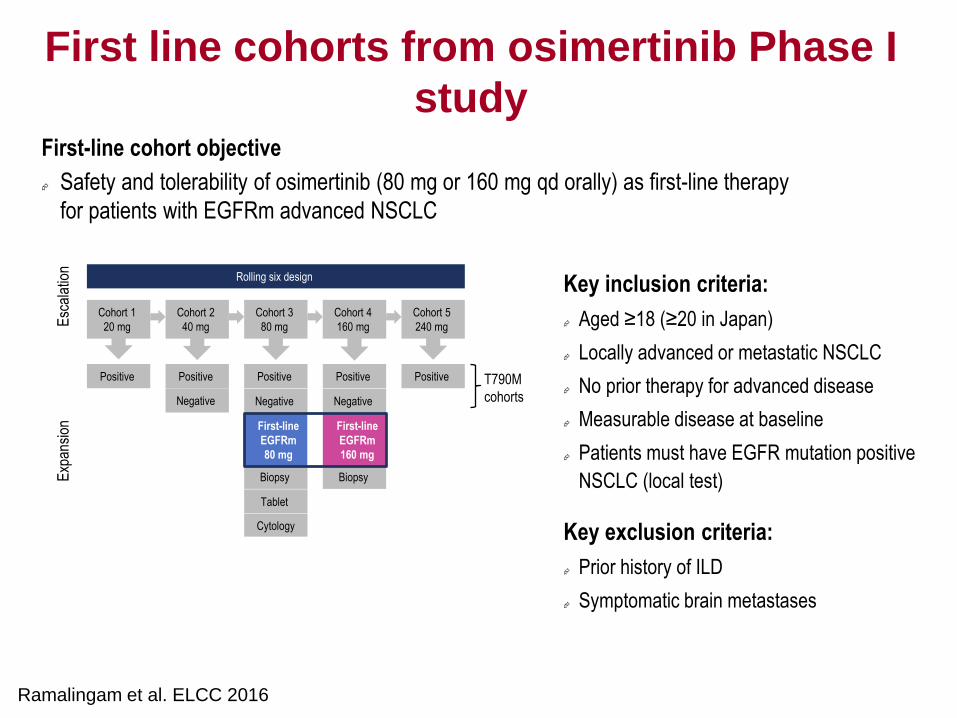
First line cohorts from osimertinib Phase I
study
Key inclusion criteria:
Aged ≥18 (≥20 in Japan)
Locally advanced or metastatic NSCLC
No prior therapy for advanced disease
Measurable disease at baseline
Patients must have EGFR mutation positive
NSCLC (local test)
Key exclusion criteria:
Prior history of ILD
Symptomatic brain metastases
Esc
alat
ion
Cohort 1
20 mg
Negative
Cohort 2
40 mg
Cohort 5
240 mg
Rolling six design
Cytology
Tablet
Negative
Cohort 3
80 mg
Negative
Cohort 4
160 mg
Positive Positive Positive Positive Positive
Biopsy Biopsy
T790M
cohorts
First-line
EGFRm
80 mg
First-line
EGFRm
160 mg
Exp
ansi
on
Ramalingam et al. ELCC 2016
First-line cohort objective
Safety and tolerability of osimertinib (80 mg or 160 mg qd orally) as first-line therapy
for patients with EGFRm advanced NSCLC
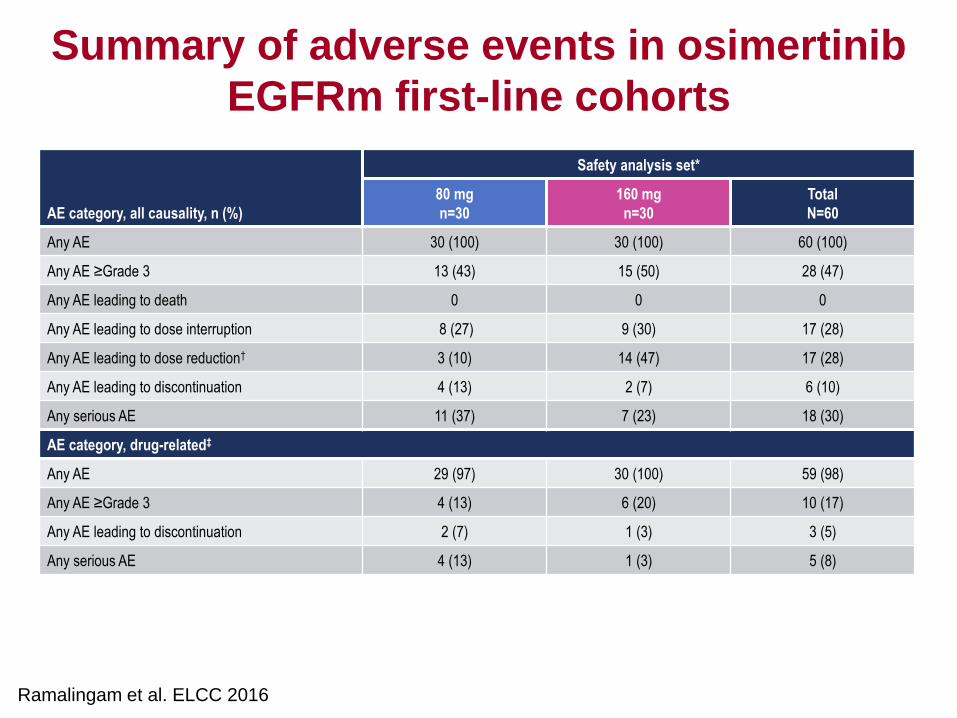
Summary of adverse events in osimertinib
EGFRm first-line cohorts
AE category, all causality, n (%)
Safety analysis set*
80 mg
n=30
160 mg
n=30
Total
N=60
Any AE 30 (100) 30 (100) 60 (100)
Any AE ≥Grade 3 13 (43) 15 (50) 28 (47)
Any AE leading to death 0 0 0
Any AE leading to dose interruption 8 (27) 9 (30) 17 (28)
Any AE leading to dose reduction† 3 (10) 14 (47) 17 (28)
Any AE leading to discontinuation 4 (13) 2 (7) 6 (10)
Any serious AE 11 (37) 7 (23) 18 (30)
AE category, drug-related‡
Any AE 29 (97) 30 (100) 59 (98)
Any AE ≥Grade 3 4 (13) 6 (20) 10 (17)
Any AE leading to discontinuation 2 (7) 1 (3) 3 (5)
Any serious AE 4 (13) 1 (3) 5 (8)
Ramalingam et al. ELCC 2016
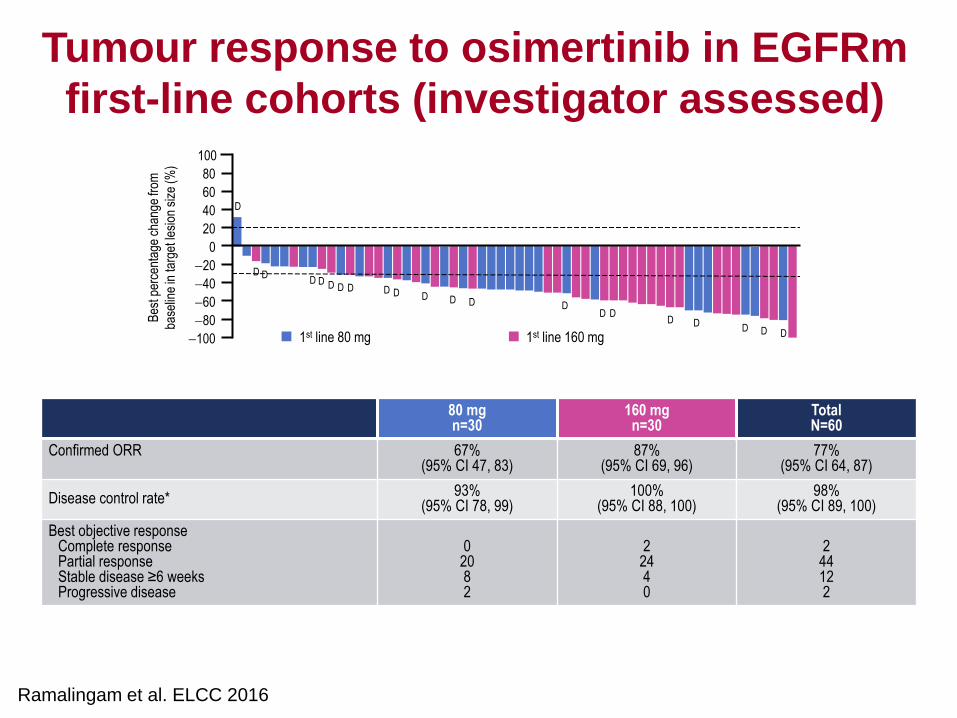
Tumour response to osimertinib in EGFRm
first-line cohorts (investigator assessed)
80 mg n=30
160 mg n=30
Total N=60
Confirmed ORR 67% (95% CI 47, 83)
87% (95% CI 69, 96)
77% (95% CI 64, 87)
Disease control rate* 93%
(95% CI 78, 99) 100%
(95% CI 88, 100) 98%
(95% CI 89, 100)
Best objective response Complete response Partial response Stable disease ≥6 weeks Progressive disease
0
20 8 2
2
24 4 0
2
44 12 2
D
100
80
60
40
20
0
20
40
60
80
100
Bes
t per
cent
age
chan
ge fr
om
base
line
in ta
rget
lesi
on s
ize
(%)
1st line 80 mg 1st line 160 mg
D D D D D D D D D D D D D
D D D D D
D D
Ramalingam et al. ELCC 2016
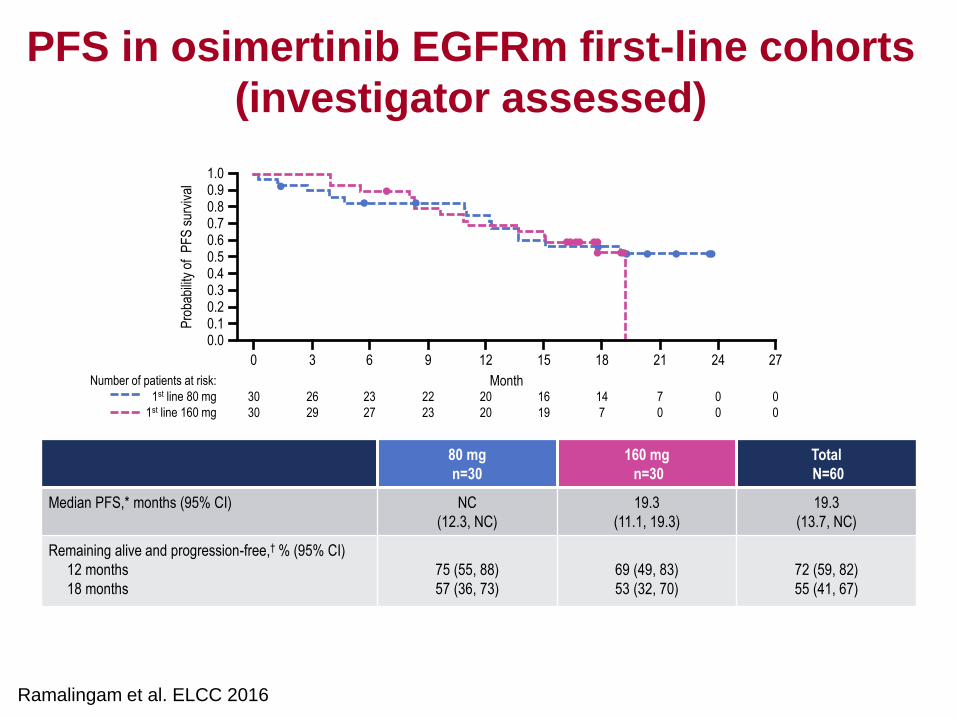
PFS in osimertinib EGFRm first-line cohorts
(investigator assessed)
Pro
babi
lity
of P
FS
sur
viva
l
Number of patients at risk:
1st line 80 mg
1st line 160 mg
30
30
26
29
1.0 0.9 0.8 0.7 0.6 0.5 0.4 0.3 0.2 0.1 0.0
0 3 6 9 12 15 18 21 24 27
23
27
22
23
20
20
16
19
14
7
7
0
0
0
0
0
Month
80 mg
n=30
160 mg
n=30
Total
N=60
Median PFS,* months (95% CI) NC
(12.3, NC)
19.3
(11.1, 19.3)
19.3
(13.7, NC)
Remaining alive and progression-free,† % (95% CI)
12 months
18 months
75 (55, 88)
57 (36, 73)
69 (49, 83)
53 (32, 70)
72 (59, 82)
55 (41, 67)
Ramalingam et al. ELCC 2016
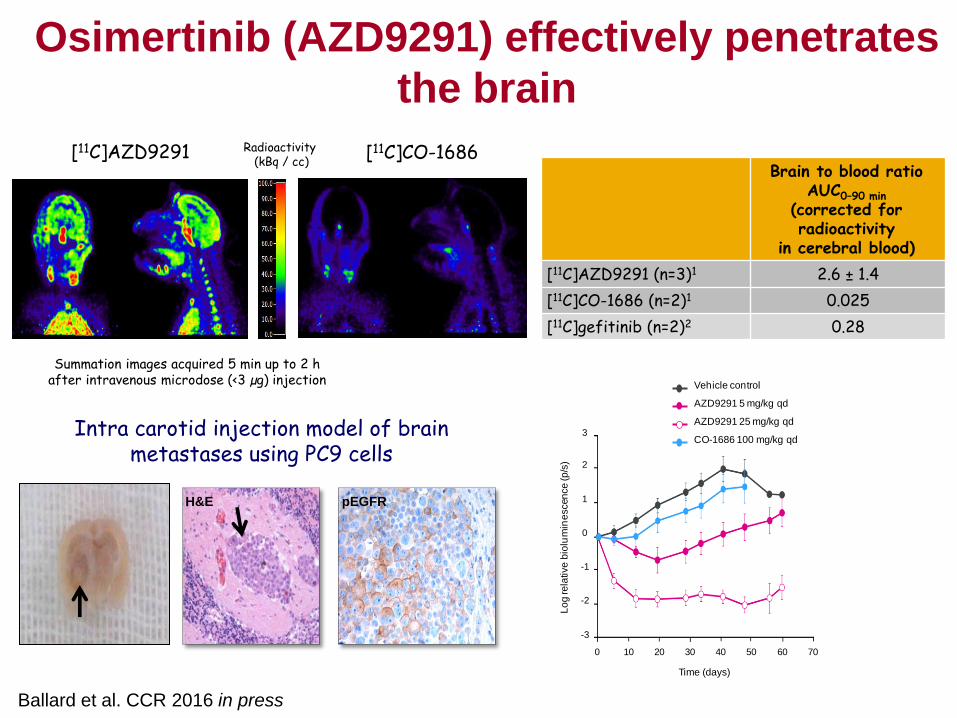
Ballard et al. CCR 2016 in press
Osimertinib (AZD9291) effectively penetrates
the brain
Brain to blood ratio AUC0–90 min
(corrected for radioactivity
in cerebral blood)
[11C]AZD9291 (n=3)1 2.6 ± 1.4
[11C]CO-1686 (n=2)1 0.025
[11C]gefitinib (n=2)2 0.28
[11C]AZD9291
Summation images acquired 5 min up to 2 h after intravenous microdose (<3 µg) injection
Radioactivity (kBq / cc)
[11C]CO-1686
Brain
-3
-2
-1
0
1
2
3
Vehicle control
AZD9291 5 mg/kg qd
AZD9291 25 mg/kg qd
CO-1686 100 mg/kg qd
Lo
g re
lative
bio
lum
ine
scen
ce
(p
/s)
Time (days)
706040 503020100
H&E pEGFR
Intra carotid injection model of brain metastases using PC9 cells
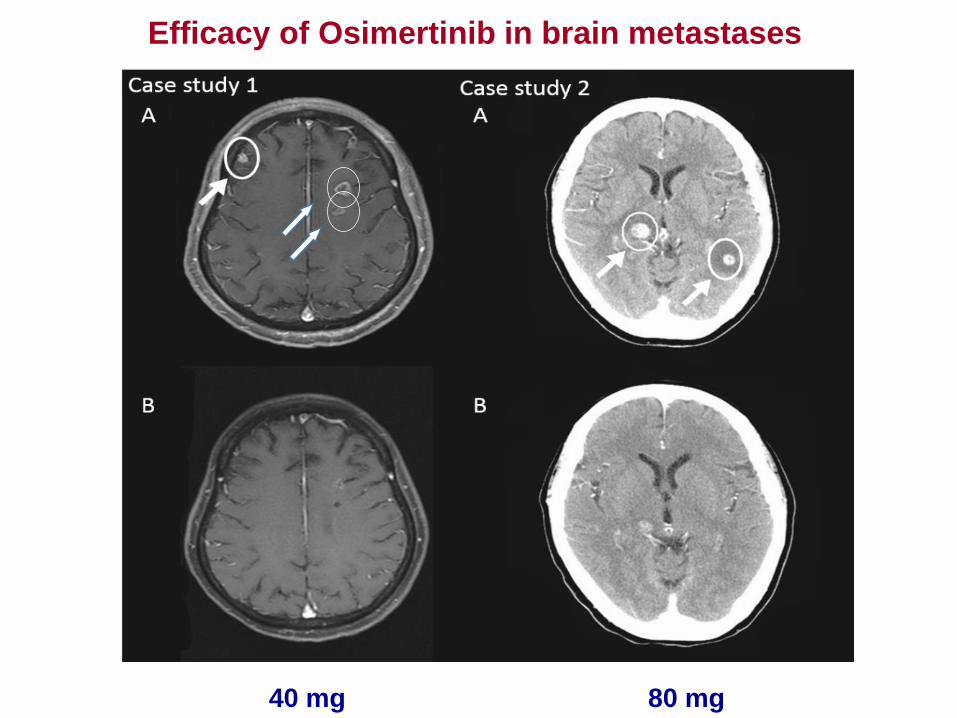
Efficacy of Osimertinib in brain metastases
40 mg 80 mg
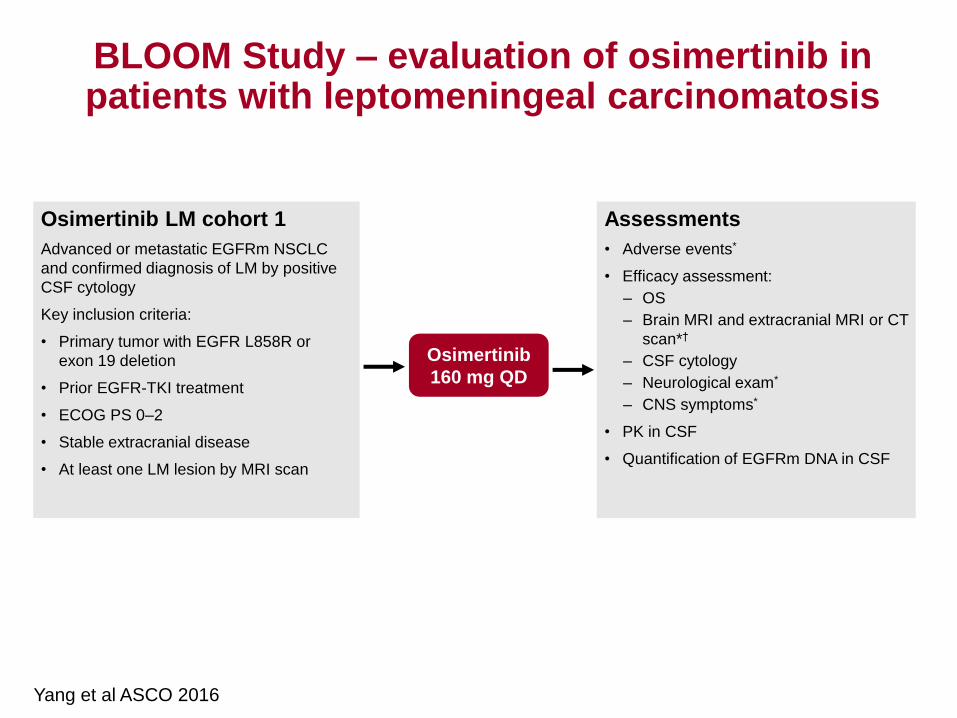
BLOOM study design: osimertinib LM cohort 1
BLOOM Study – evaluation of osimertinib in patients with leptomeningeal carcinomatosis
Osimertinib LM cohort 1
Advanced or metastatic EGFRm NSCLC
and confirmed diagnosis of LM by positive
CSF cytology
Key inclusion criteria:
• Primary tumor with EGFR L858R or
exon 19 deletion
• Prior EGFR-TKI treatment
• ECOG PS 0–2
• Stable extracranial disease
• At least one LM lesion by MRI scan
Assessments
• Adverse events*
• Efficacy assessment:
– OS
– Brain MRI and extracranial MRI or CT
scan*†
– CSF cytology
– Neurological exam*
– CNS symptoms*
• PK in CSF
• Quantification of EGFRm DNA in CSF
Osimertinib
160 mg QD
First patient dosed: April 14, 2015 Data cut-off: March 10, 2016
Yang et al ASCO 2016
NCT02228369
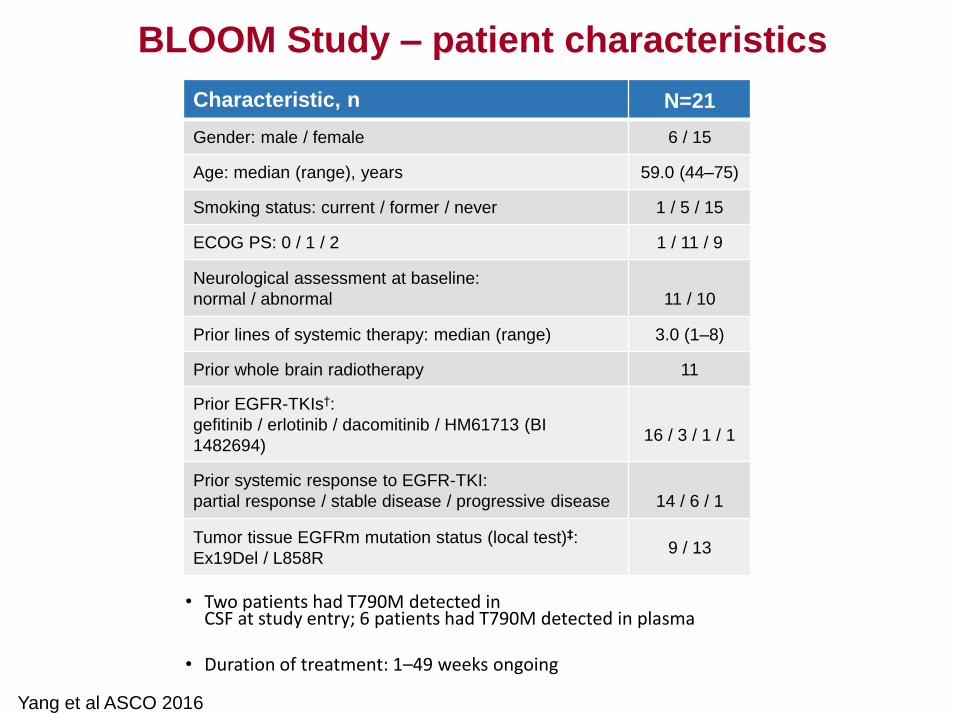
• Two patients had T790M detected in CSF at study entry; 6 patients had T790M detected in plasma
• Duration of treatment: 1–49 weeks ongoing
Characteristic, n N=21
Gender: male / female 6 / 15
Age: median (range), years 59.0 (44–75)
Smoking status: current / former / never 1 / 5 / 15
ECOG PS: 0 / 1 / 2 1 / 11 / 9
Neurological assessment at baseline:
normal / abnormal
11 / 10
Prior lines of systemic therapy: median (range) 3.0 (1–8)
Prior whole brain radiotherapy 11
Prior EGFR-TKIs†:
gefitinib / erlotinib / dacomitinib / HM61713 (BI
1482694)
16 / 3 / 1 / 1
Prior systemic response to EGFR-TKI:
partial response / stable disease / progressive disease
14 / 6 / 1
Tumor tissue EGFRm mutation status (local test)‡:
Ex19Del / L858R 9 / 13
Yang et al ASCO 2016
BLOOM Study – patient characteristics
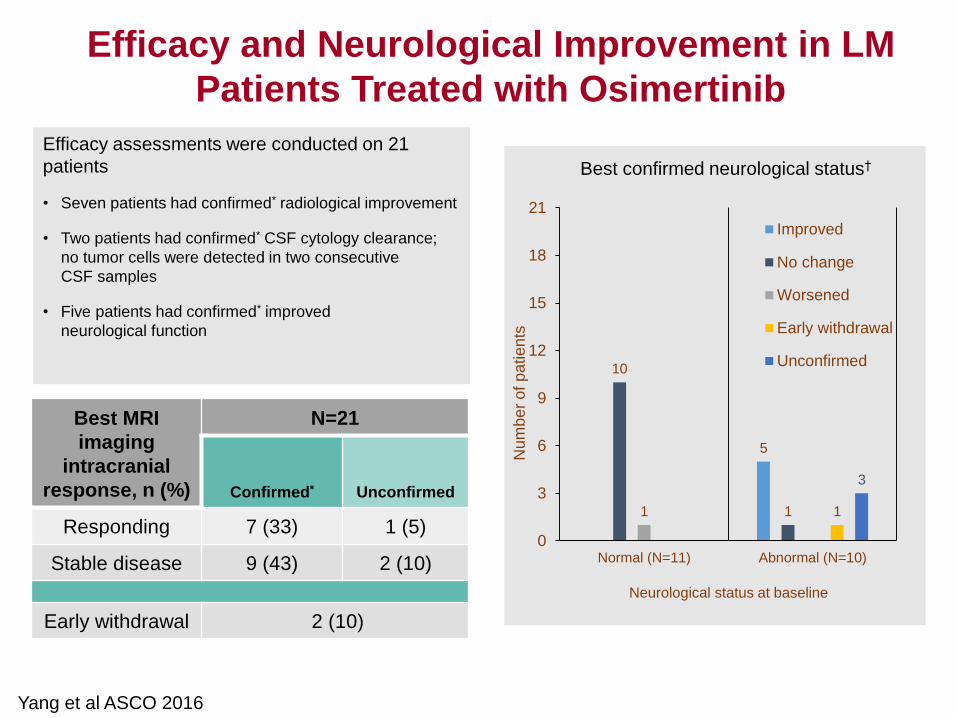
Efficacy assessments were conducted on 21
patients
• Seven patients had confirmed* radiological improvement
• Two patients had confirmed* CSF cytology clearance;
no tumor cells were detected in two consecutive
CSF samples
• Five patients had confirmed* improved
neurological function
Osimertinib activity across LM assessments
Best MRI
imaging
intracranial
response, n (%)
N=21
Confirmed* Unconfirmed
Responding 7 (33) 1 (5)
Stable disease 9 (43) 2 (10)
Early withdrawal 2 (10)
5
10
1 1 1
3
0
3
6
9
12
15
18
21
Normal (N=11) Abnormal (N=10)
Improved
No change
Worsened
Early withdrawal
Unconfirmed
Neurological status at baseline
Num
be
r o
f p
atie
nts
Best confirmed neurological status†
Yang et al ASCO 2016
Efficacy and Neurological Improvement in LM
Patients Treated with Osimertinib
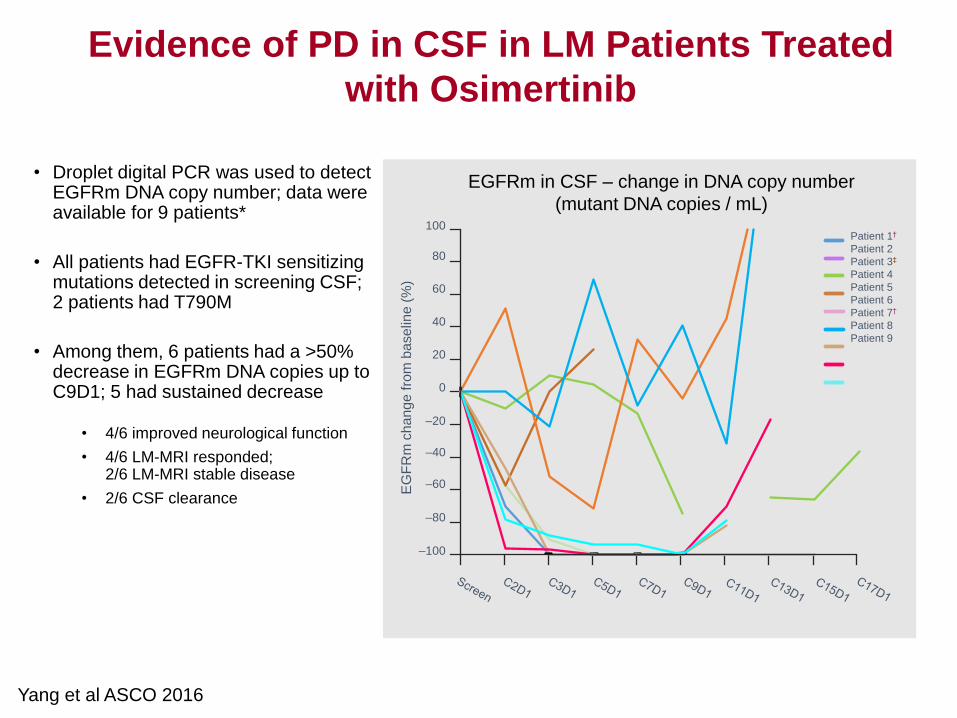
Changes in EGFRm DNA copy number in CSF with osimertinib treatment
• Droplet digital PCR was used to detect EGFRm DNA copy number; data were available for 9 patients*
• All patients had EGFR-TKI sensitizing mutations detected in screening CSF; 2 patients had T790M
• Among them, 6 patients had a >50% decrease in EGFRm DNA copies up to C9D1; 5 had sustained decrease
• 4/6 improved neurological function
• 4/6 LM-MRI responded; 2/6 LM-MRI stable disease
• 2/6 CSF clearance
EG
FR
m c
ha
ng
e fro
m b
ase
line
(%
)
EGFRm in CSF – change in DNA copy number
(mutant DNA copies / mL) 100
80
40
20
0
–20
–40
–60
–80
–100
Patient 1†
Patient 2
Patient 3‡
Patient 4
Patient 5
Patient 6
Patient 7†
Patient 8
Patient 9
60
Yang et al ASCO 2016
Evidence of PD in CSF in LM Patients Treated
with Osimertinib
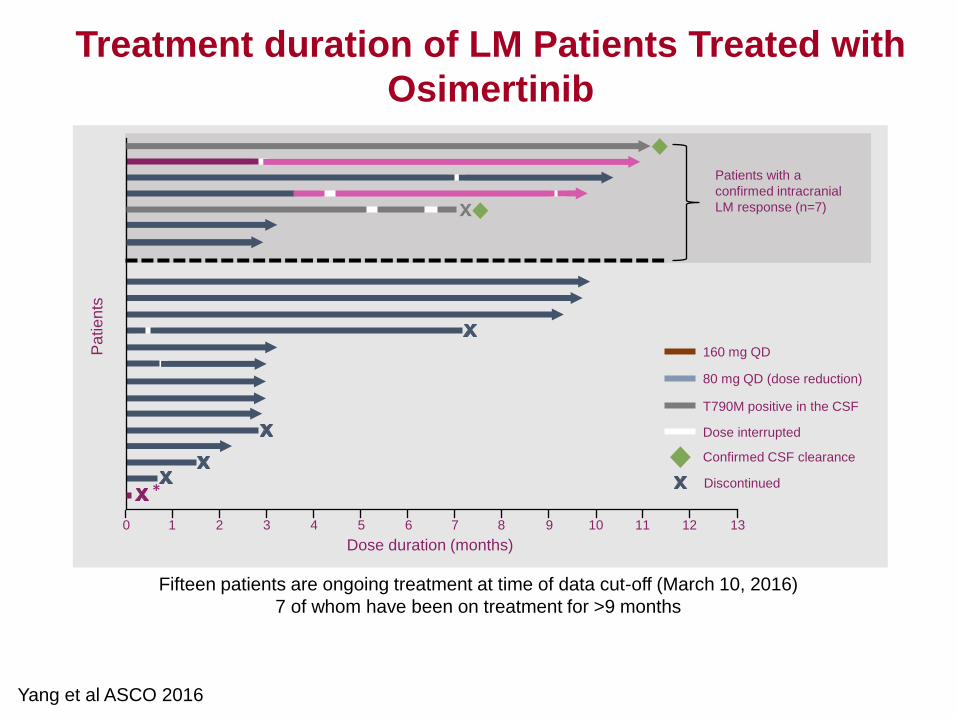
0 1 2 3 4 5 6 7 8 9 10 11 12 13
80 mg QD (dose reduction)
160 mg QD
Dose interrupted
T790M positive in the CSF
Dose duration (months)
Fifteen patients are ongoing treatment at time of data cut-off (March 10, 2016)
7 of whom have been on treatment for >9 months
Pa
tie
nts
*
Patients with a
confirmed intracranial
LM response (n=7)
Confirmed CSF clearance
Discontinued
Yang et al ASCO 2016
Treatment duration of LM Patients Treated with
Osimertinib
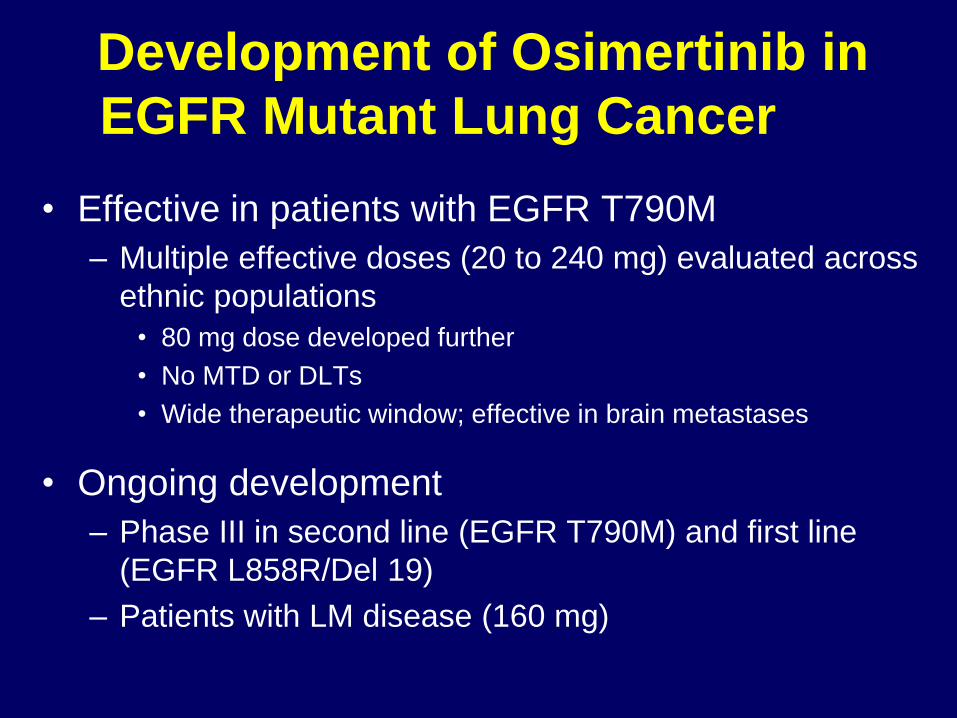
• Effective in patients with EGFR T790M
– Multiple effective doses (20 to 240 mg) evaluated across
ethnic populations
• 80 mg dose developed further
• No MTD or DLTs
• Wide therapeutic window; effective in brain metastases
• Ongoing development
– Phase III in second line (EGFR T790M) and first line
(EGFR L858R/Del 19)
– Patients with LM disease (160 mg)
Development of Osimertinib in
EGFR Mutant Lung Cancer
Finding Safe and Efficacious Dose Using Sequential Generalized
Likelihood Ratio Statistics
Ying Lu, Ph.D.
VA Cooperative Studies Program Palo Alto Coordinating Center
Stanford Cancer Institute and Center for Innovative Study Design
Department of Biomedical Data Science, Stanford University
Joint work with T.L Lai, B. Narasimhan@Stanford, J. Bartoff@USC
and A. Gewitz@UCSF, Y. Song@SJTU
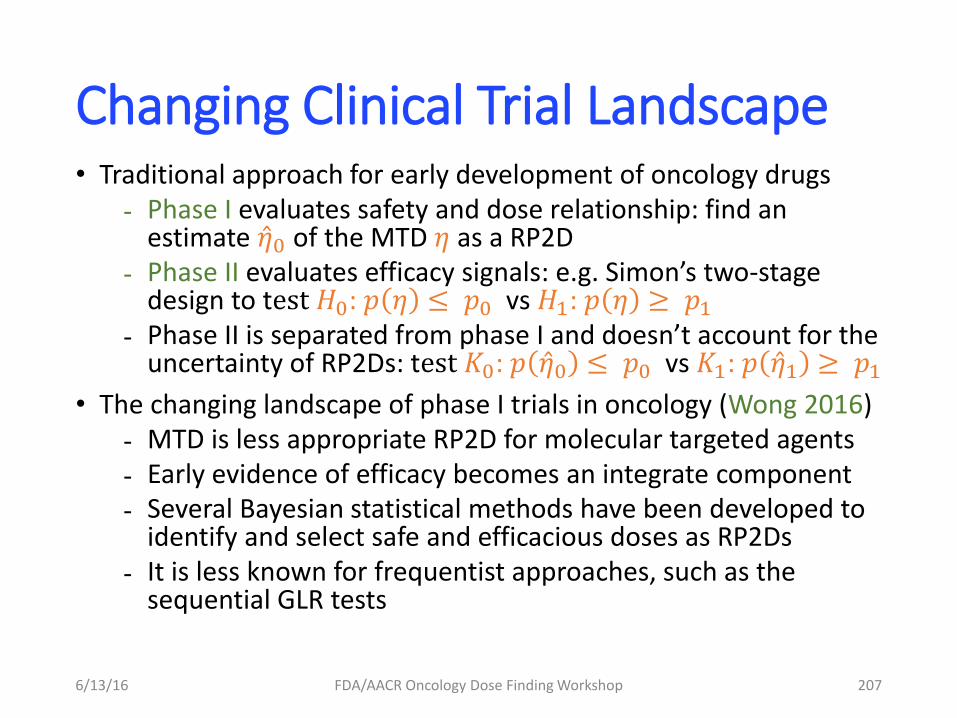
Changing Clinical Trial Landscape • Traditional approach for early development of oncology drugs - Phase I evaluates safety and dose relationship: find an
estimate 𝜂 0 of the MTD 𝜂 as a RP2D - Phase II evaluates efficacy signals: e.g. Simon’s two-stage
design to test 𝐻0: 𝑝 𝜂 ≤ 𝑝0 vs 𝐻1: 𝑝 𝜂 ≥ 𝑝1 - Phase II is separated from phase I and doesn’t account for the
uncertainty of RP2Ds: test 𝐾0: 𝑝 𝜂 0 ≤ 𝑝0 vs 𝐾1: 𝑝 𝜂 1 ≥ 𝑝1
• The changing landscape of phase I trials in oncology (Wong 2016) - MTD is less appropriate RP2D for molecular targeted agents - Early evidence of efficacy becomes an integrate component - Several Bayesian statistical methods have been developed to
identify and select safe and efficacious doses as RP2Ds - It is less known for frequentist approaches, such as the
sequential GLR tests
6/13/16 FDA/AACR Oncology Dose Finding Workshop 207
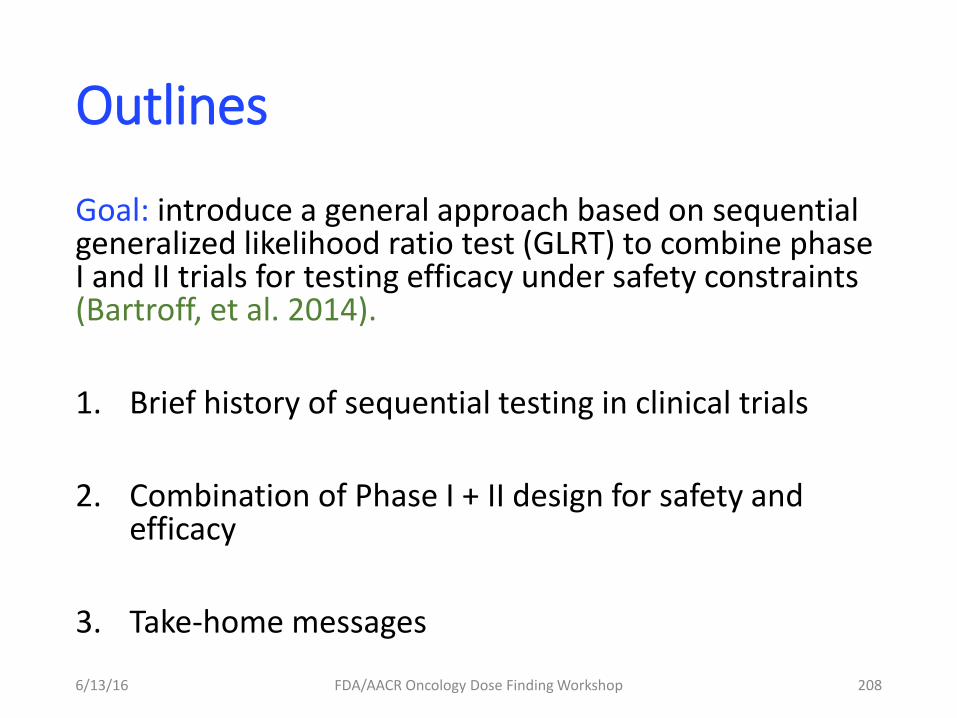
Outlines
Goal: introduce a general approach based on sequential generalized likelihood ratio test (GLRT) to combine phase I and II trials for testing efficacy under safety constraints (Bartroff, et al. 2014).
1. Brief history of sequential testing in clinical trials
2. Combination of Phase I + II design for safety and efficacy
3. Take-home messages
6/13/16 FDA/AACR Oncology Dose Finding Workshop 208
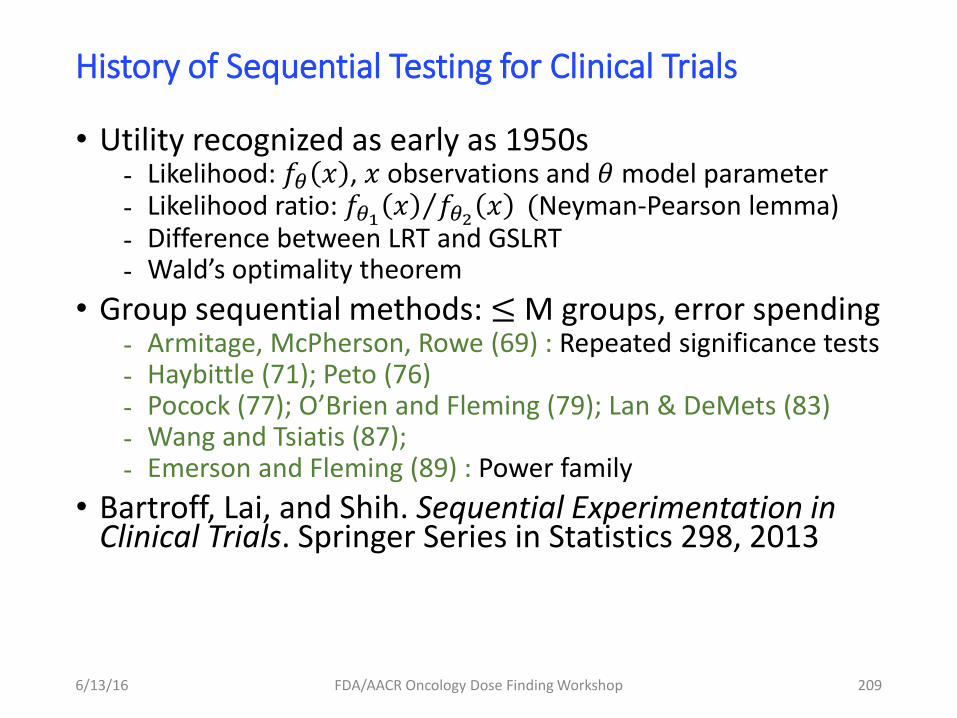
History of Sequential Testing for Clinical Trials
• Utility recognized as early as 1950s - Likelihood: 𝑓𝜃 𝑥 , 𝑥 observations and 𝜃 model parameter - Likelihood ratio: 𝑓𝜃1
𝑥 𝑓𝜃2𝑥 (Neyman-Pearson lemma)
- Difference between LRT and GSLRT - Wald’s optimality theorem
• Group sequential methods: ≤ M groups, error spending - Armitage, McPherson, Rowe (69) : Repeated significance tests - Haybittle (71); Peto (76) - Pocock (77); O’Brien and Fleming (79); Lan & DeMets (83) - Wang and Tsiatis (87); - Emerson and Fleming (89) : Power family
• Bartroff, Lai, and Shih. Sequential Experimentation in Clinical Trials. Springer Series in Statistics 298, 2013
6/13/16 FDA/AACR Oncology Dose Finding Workshop 209
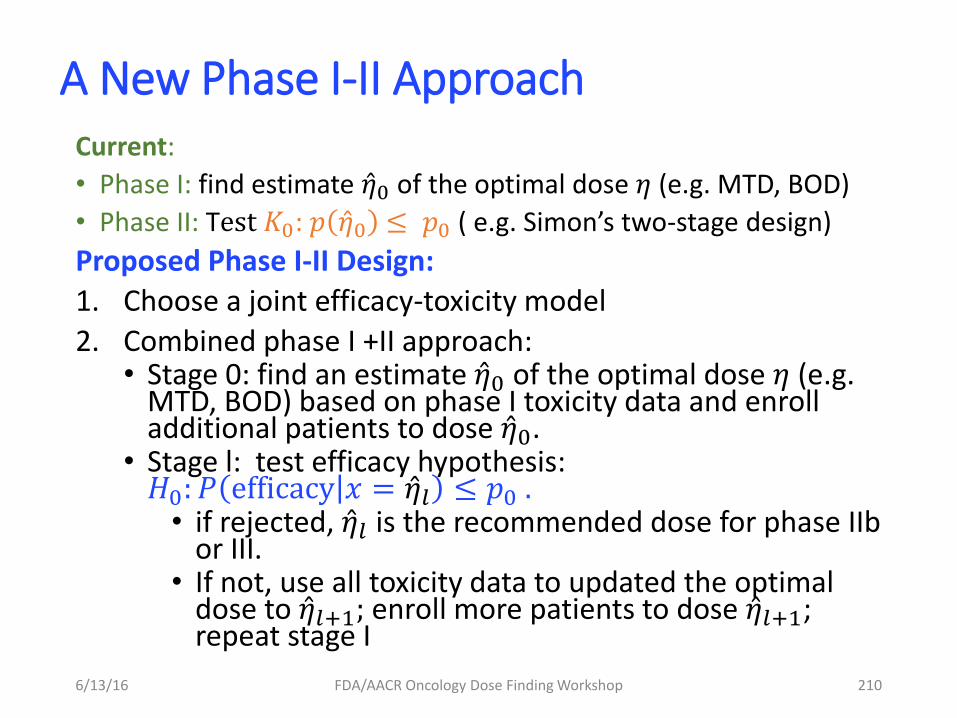
A New Phase I-II Approach Current:
• Phase I: find estimate 𝜂 0 of the optimal dose 𝜂 (e.g. MTD, BOD)
• Phase II: Test 𝐾0: 𝑝 𝜂 0 ≤ 𝑝0 ( e.g. Simon’s two-stage design)
Proposed Phase I-II Design:
1. Choose a joint efficacy-toxicity model
2. Combined phase I +II approach: • Stage 0: find an estimate 𝜂 0 of the optimal dose 𝜂 (e.g.
MTD, BOD) based on phase I toxicity data and enroll additional patients to dose 𝜂 0.
• Stage l: test efficacy hypothesis: 𝐻0: 𝑃 efficacy 𝑥 = 𝜂 𝑙 ≤ 𝑝0 .
• if rejected, 𝜂 𝑙 is the recommended dose for phase IIb or III.
• If not, use all toxicity data to updated the optimal dose to 𝜂 𝑙+1; enroll more patients to dose 𝜂 𝑙+1; repeat stage I
6/13/16 FDA/AACR Oncology Dose Finding Workshop 210
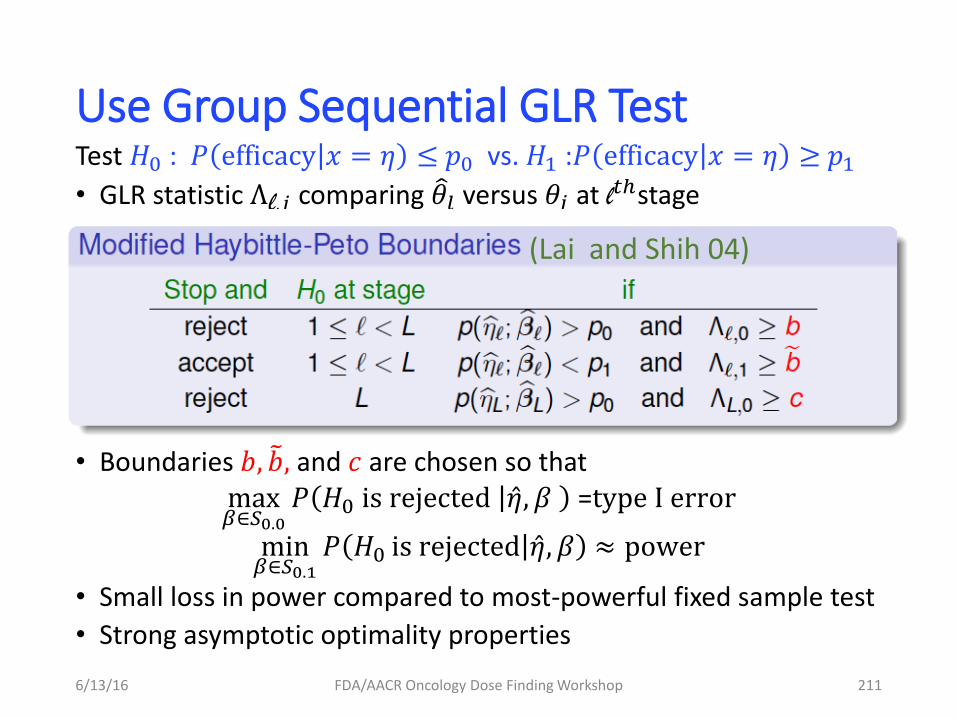
Use Group Sequential GLR Test Test 𝐻0 : 𝑃 efficacy 𝑥 = 𝜂 ≤ 𝑝0 vs. 𝐻1 :𝑃 efficacy 𝑥 = 𝜂 ≥ 𝑝1
• GLR statistic Λl,𝑗 comparing 𝜃 𝑙 versus 𝜃𝑗 at l𝑡ℎstage
• Boundaries 𝑏, 𝑏 , and 𝑐 are chosen so that max𝛽∈𝑆0.0
𝑃 𝐻0 is rejected 𝜂 , 𝛽 =type I error
min𝛽∈𝑆0.1
𝑃 𝐻0 is rejected 𝜂 , 𝛽 ≈ power
• Small loss in power compared to most-powerful fixed sample test
• Strong asymptotic optimality properties
6/13/16 FDA/AACR Oncology Dose Finding Workshop 211
(Lai and Shih 04)
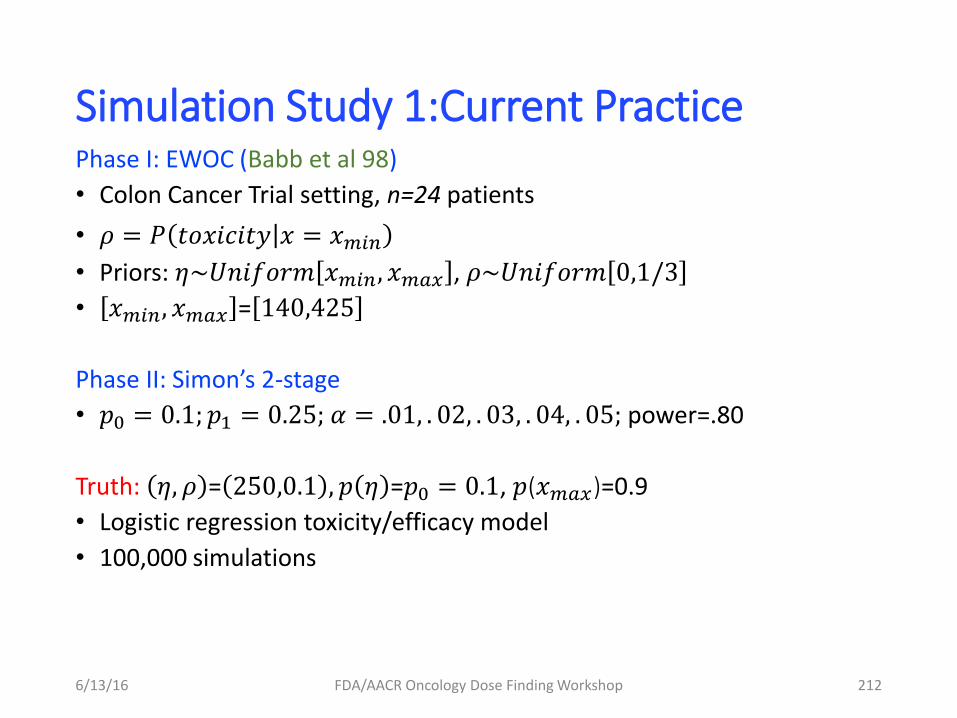
Simulation Study 1:Current Practice Phase I: EWOC (Babb et al 98)
• Colon Cancer Trial setting, n=24 patients
• 𝜌 = 𝑃 𝑡𝑜𝑥𝑖𝑐𝑖𝑡𝑦 𝑥 = 𝑥𝑚𝑖𝑛
• Priors: 𝜂~𝑈𝑛𝑖𝑓𝑜𝑟𝑚 𝑥𝑚𝑖𝑛, 𝑥𝑚𝑎𝑥 , 𝜌~𝑈𝑛𝑖𝑓𝑜𝑟𝑚 0,1/3
• 𝑥𝑚𝑖𝑛, 𝑥𝑚𝑎𝑥 = 140,425
Phase II: Simon’s 2-stage
• 𝑝0 = 0.1; 𝑝1 = 0.25; 𝛼 = .01, . 02, . 03, . 04, . 05; power=.80
Truth: 𝜂, 𝜌 = 250,0.1 , 𝑝 𝜂 =𝑝0 = 0.1, 𝑝(𝑥𝑚𝑎𝑥)=0.9
• Logistic regression toxicity/efficacy model
• 100,000 simulations
6/13/16 FDA/AACR Oncology Dose Finding Workshop 212
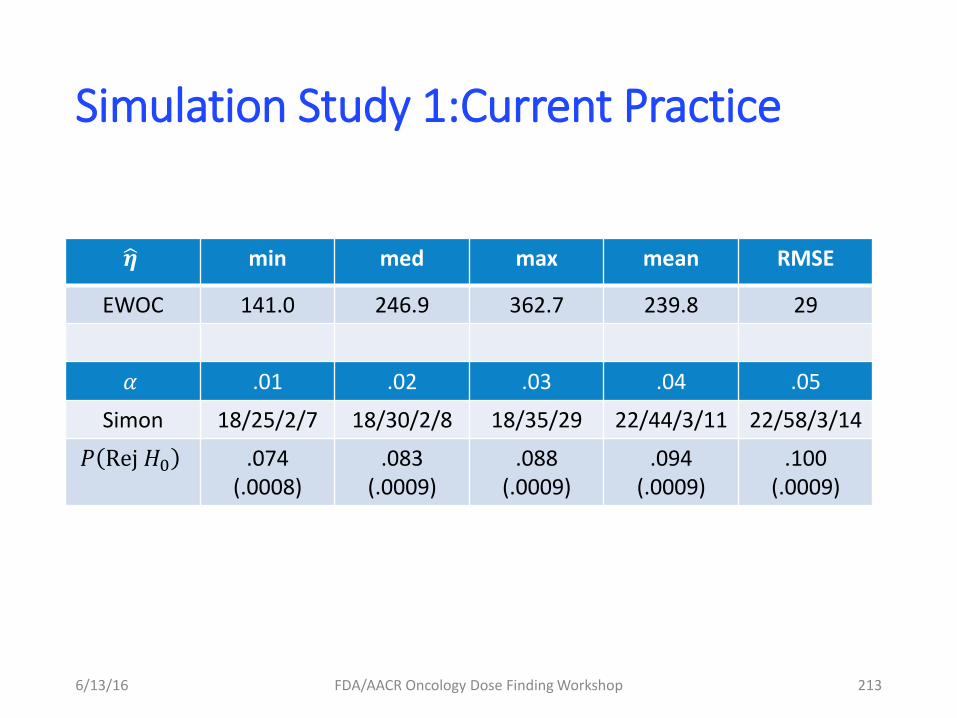
Simulation Study 1:Current Practice
6/13/16 FDA/AACR Oncology Dose Finding Workshop 213
𝜼 min med max mean RMSE
EWOC 141.0 246.9 362.7 239.8 29
𝛼 .01 .02 .03 .04 .05
Simon 18/25/2/7 18/30/2/8 18/35/29 22/44/3/11 22/58/3/14
𝑃 Rej 𝐻0 .074 (.0008)
.083 (.0009)
.088 (.0009)
.094 (.0009)
.100 (.0009)
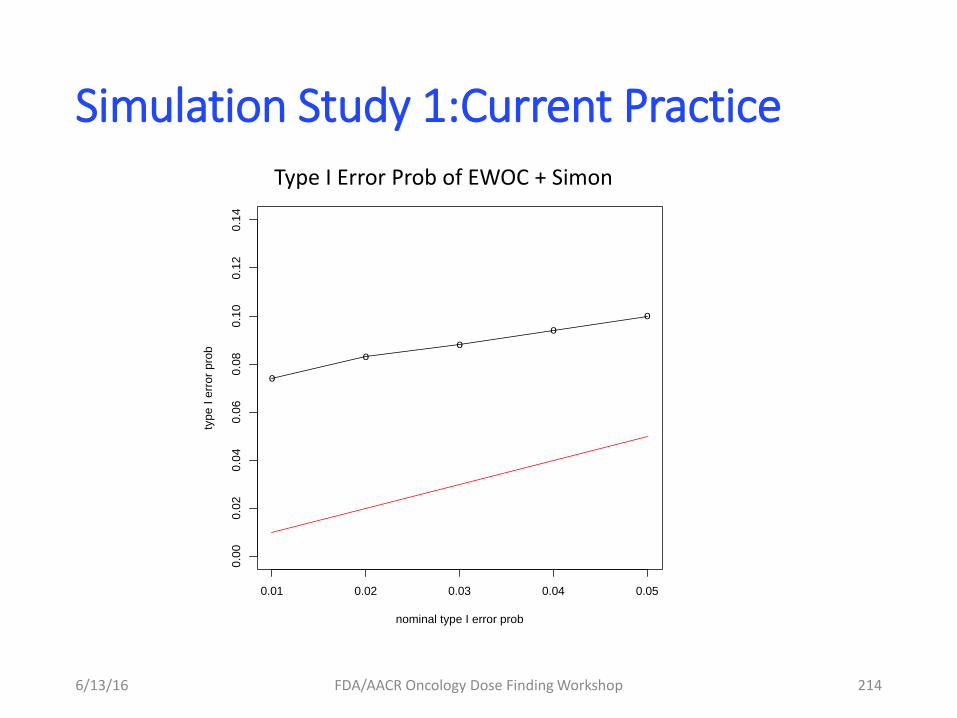
Simulation Study 1:Current Practice
6/13/16 FDA/AACR Oncology Dose Finding Workshop 214
0.01 0.02 0.03 0.04 0.05
0.0
00.0
20.0
40.0
60.0
80
.10
0.1
20.1
4
nominal type I error prob
type I
err
or
pro
b
o
oo
o
o
Type I Error Prob of EWOC + Simon
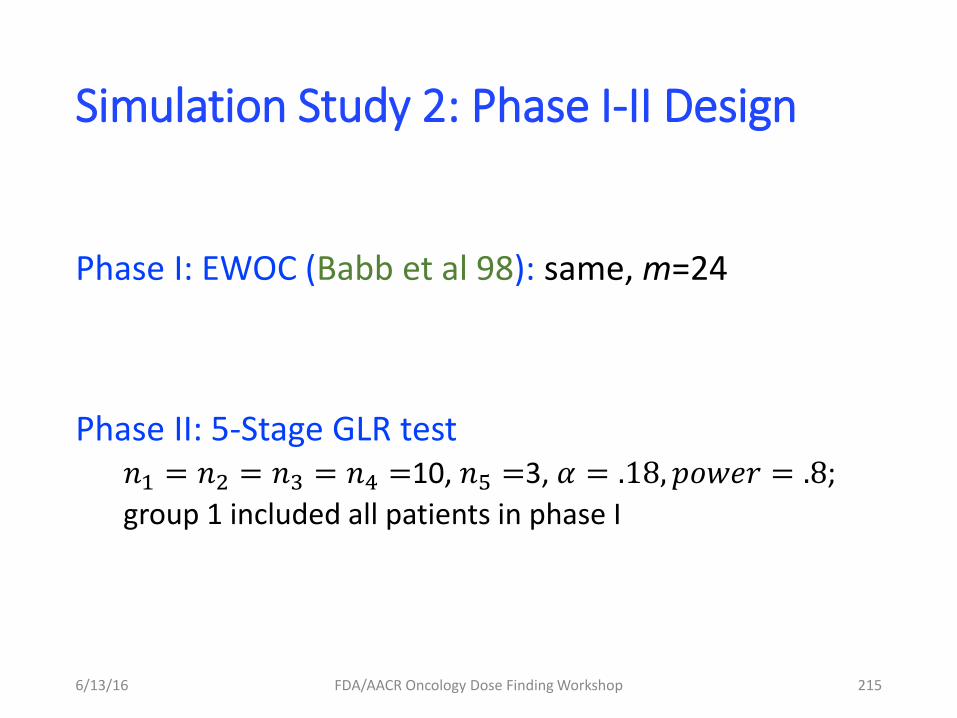
Simulation Study 2: Phase I-II Design
Phase I: EWOC (Babb et al 98): same, m=24
Phase II: 5-Stage GLR test 𝑛1 = 𝑛2 = 𝑛3 = 𝑛4 =10, 𝑛5 =3, 𝛼 = .18, 𝑝𝑜𝑤𝑒𝑟 = .8;
group 1 included all patients in phase I
6/13/16 FDA/AACR Oncology Dose Finding Workshop 215
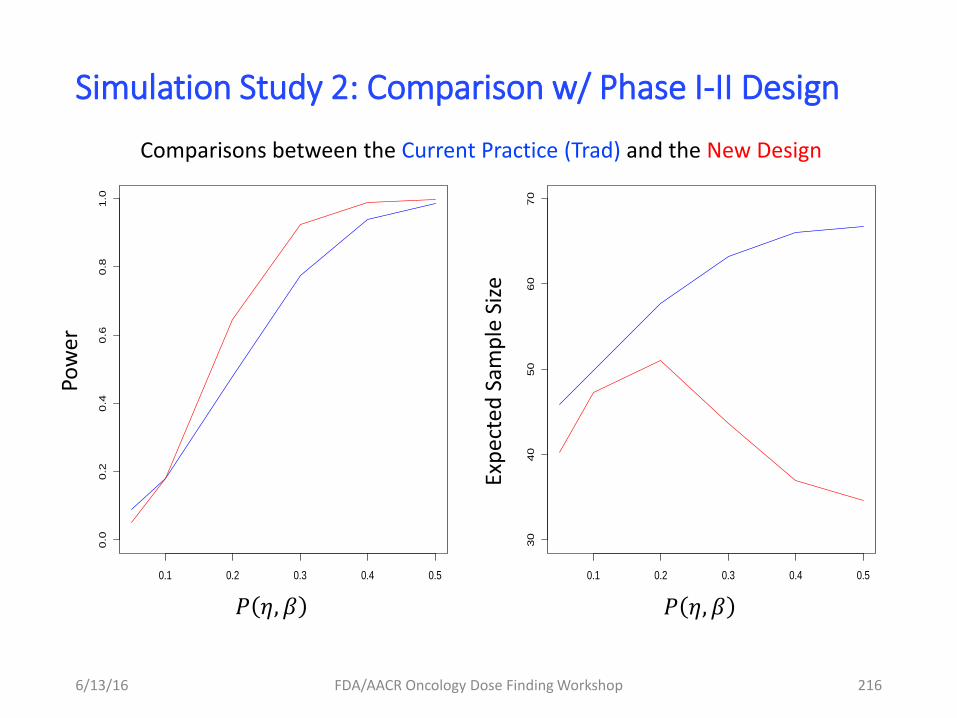
Simulation Study 2: Comparison w/ Phase I-II Design
6/13/16 FDA/AACR Oncology Dose Finding Workshop 216
0.1 0.2 0.3 0.4 0.5
30
40
50
60
70
0.1 0.2 0.3 0.4 0.5
0.0
0.2
0.4
0.6
0.8
1.0
𝑃 𝜂, 𝛽 𝑃 𝜂, 𝛽
Pow
er
Exp
ecte
d S
amp
le S
ize
Comparisons between the Current Practice (Trad) and the New Design
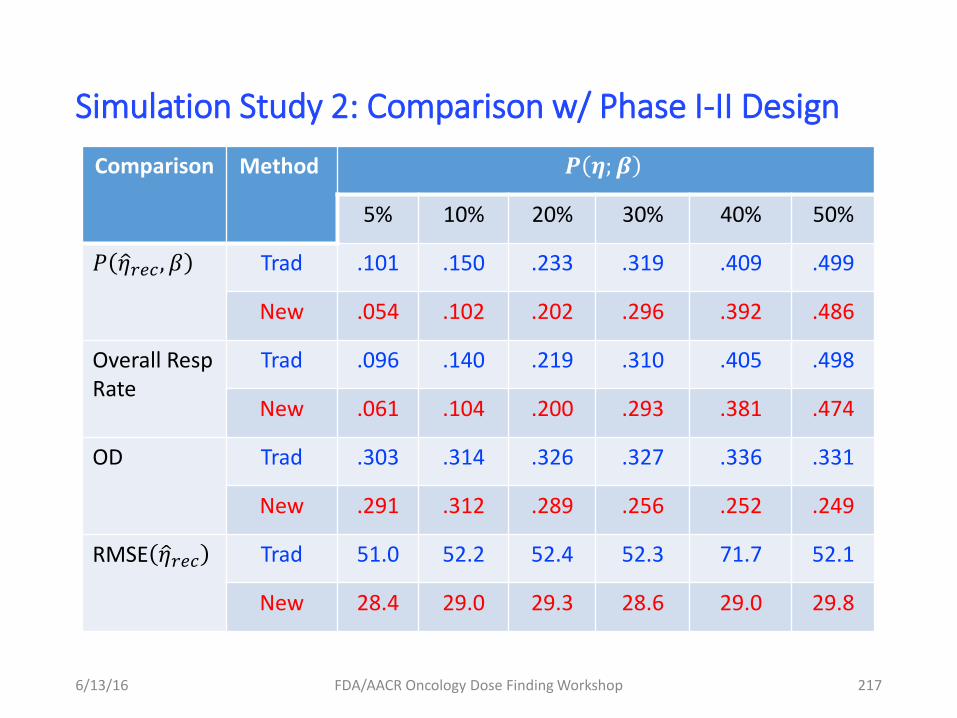
Simulation Study 2: Comparison w/ Phase I-II Design
6/13/16 FDA/AACR Oncology Dose Finding Workshop 217
Comparison Method 𝑷 𝜼;𝜷
5% 10% 20% 30% 40% 50%
𝑃 𝜂 𝑟𝑒𝑐 , 𝛽 Trad .101 .150 .233 .319 .409 .499
New .054 .102 .202 .296 .392 .486
Overall Resp Rate
Trad .096 .140 .219 .310 .405 .498
New .061 .104 .200 .293 .381 .474
OD Trad .303 .314 .326 .327 .336 .331
New .291 .312 .289 .256 .252 .249
RMSE 𝜂 𝑟𝑒𝑐 Trad 51.0 52.2 52.4 52.3 71.7 52.1
New 28.4 29.0 29.3 28.6 29.0 29.8
Simulation Study 3: Discrete Dose Space
Example of discrete dose space and monotonic toxicity and efficacy
• Dosing space: {140,200,250,300,350,425}
• Isotonic MLEs for both toxicity and efficacy
• Traditional, Phase I: m=24; Phase II: Simon’s 2 stage: n=43
• GLR test: matched the type I error for Trad.
• 10,000 simulations
6/13/16 FDA/AACR Oncology Dose Finding Workshop 218
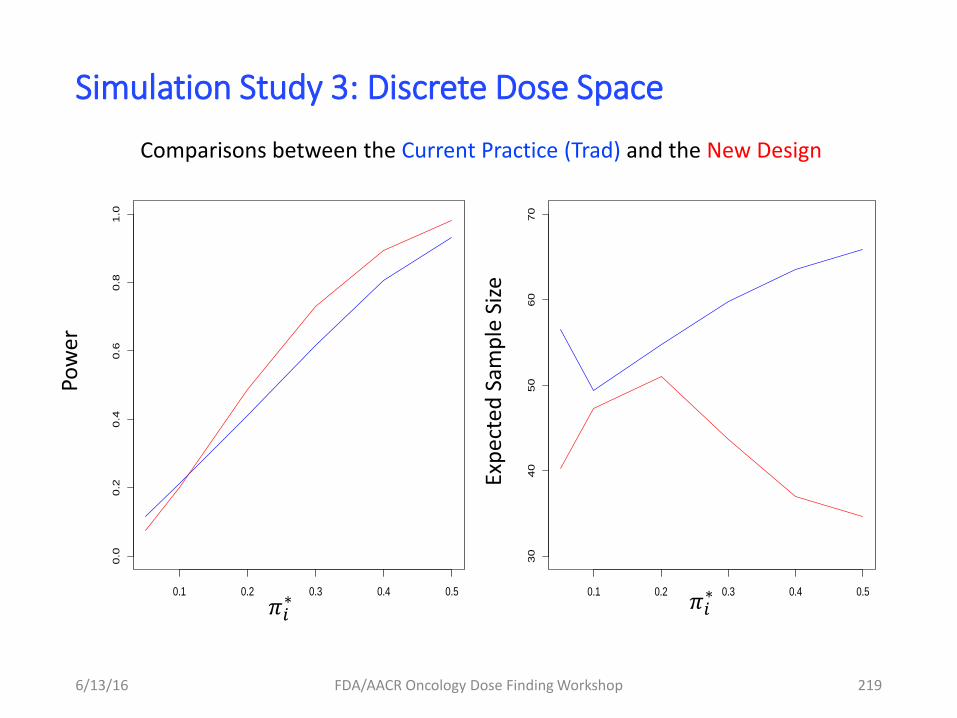
Simulation Study 3: Discrete Dose Space
6/13/16 FDA/AACR Oncology Dose Finding Workshop 219
𝜋𝑖∗
Pow
er
Exp
ecte
d S
amp
le S
ize
Comparisons between the Current Practice (Trad) and the New Design
𝜋𝑖∗
0.1 0.2 0.3 0.4 0.5
30
40
50
60
70
0.1 0.2 0.3 0.4 0.5
0.0
0.2
0.4
0.6
0.8
1.0
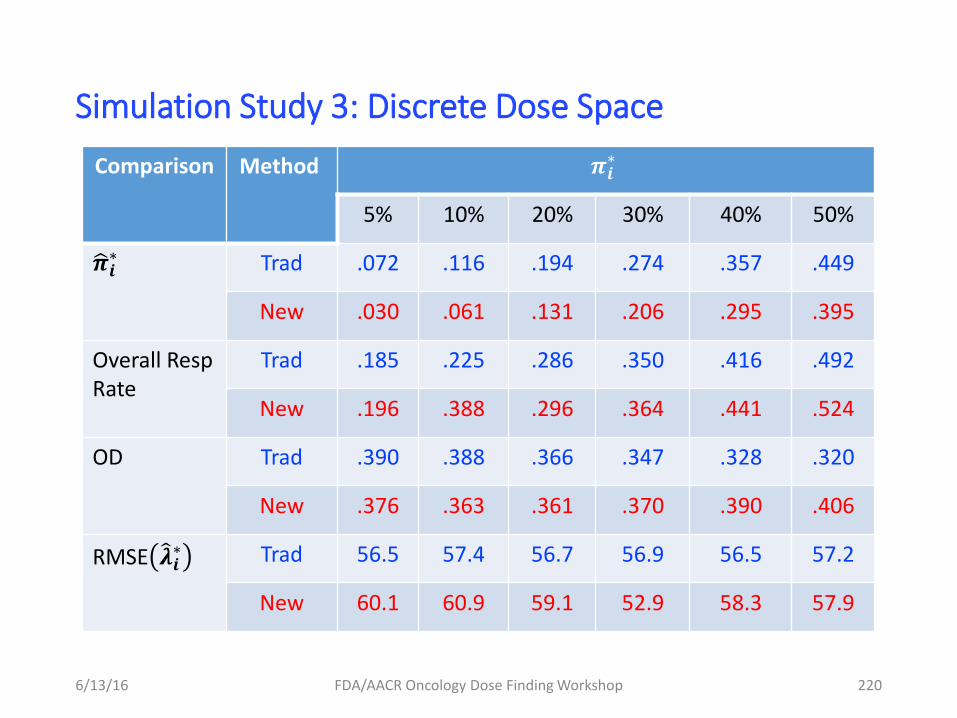
Simulation Study 3: Discrete Dose Space
6/13/16 FDA/AACR Oncology Dose Finding Workshop 220
Comparison Method 𝝅𝒊∗
5% 10% 20% 30% 40% 50%
𝝅 𝒊∗ Trad .072 .116 .194 .274 .357 .449
New .030 .061 .131 .206 .295 .395
Overall Resp Rate
Trad .185 .225 .286 .350 .416 .492
New .196 .388 .296 .364 .441 .524
OD Trad .390 .388 .366 .347 .328 .320
New .376 .363 .361 .370 .390 .406
RMSE 𝝀 𝒊∗ Trad 56.5 57.4 56.7 56.9 56.5 57.2
New 60.1 60.9 59.1 52.9 58.3 57.9
Other Examples and Implementation Details
• Other examples: - Toxicity and response dependent model
• Critical value determinations
• Adaptive extensions
See Bartroff, et al. (SIM 2014 and Springer 2013)
6/13/16 FDA/AACR Oncology Dose Finding Workshop 221
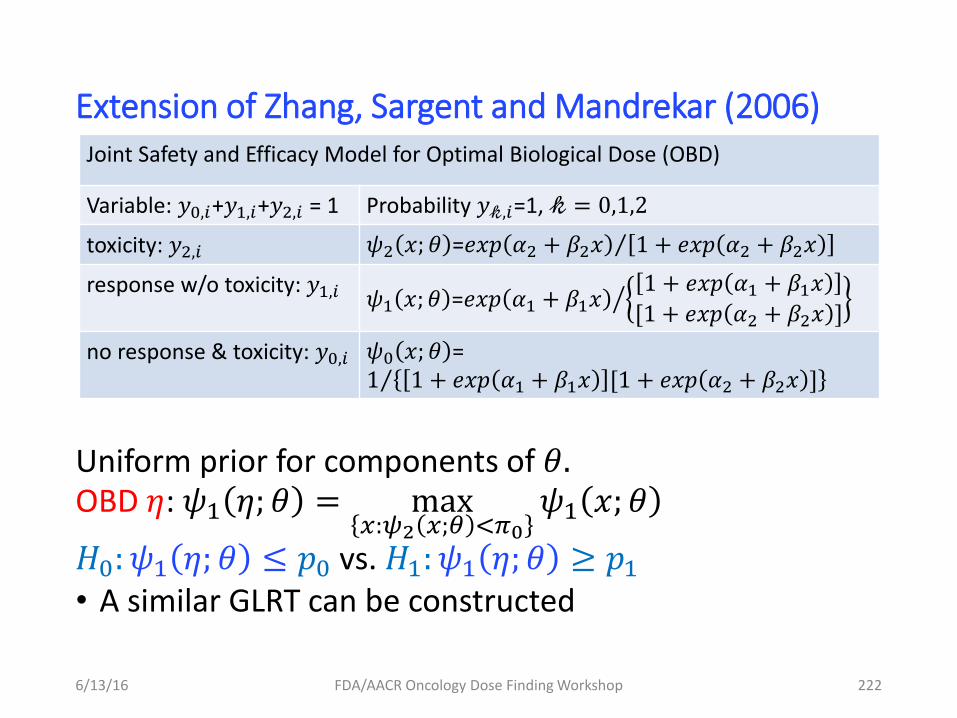
Extension of Zhang, Sargent and Mandrekar (2006)
Uniform prior for components of 𝜃. OBD 𝜂: 𝜓1 𝜂; 𝜃 = max
𝑥:𝜓2 𝑥;𝜃 <𝜋0
𝜓1 𝑥; 𝜃
𝐻0: 𝜓1 𝜂; 𝜃 ≤ 𝑝0 vs. 𝐻1: 𝜓1 𝜂; 𝜃 ≥ 𝑝1 • A similar GLRT can be constructed 6/13/16 FDA/AACR Oncology Dose Finding Workshop 222
Joint Safety and Efficacy Model for Optimal Biological Dose (OBD)
Variable: 𝑦0,𝑖+𝑦1,𝑖+𝑦2,𝑖 = 1 Probability 𝑦𝓀,𝑖=1, 𝓀 = 0,1,2
toxicity: 𝑦2,𝑖 𝜓2 𝑥; 𝜃 =𝑒𝑥𝑝 𝛼2 + 𝛽2𝑥 1 + 𝑒𝑥𝑝 𝛼2 + 𝛽2𝑥
response w/o toxicity: 𝑦1,𝑖 𝜓1 𝑥; 𝜃 =𝑒𝑥𝑝 𝛼1 + 𝛽1𝑥1 + 𝑒𝑥𝑝 𝛼1 + 𝛽1𝑥
[1 + 𝑒𝑥𝑝 𝛼2 + 𝛽2𝑥 ]
no response & toxicity: 𝑦0,𝑖 𝜓0 𝑥; 𝜃 =1 1 + 𝑒𝑥𝑝 𝛼1 + 𝛽1𝑥 [1 + 𝑒𝑥𝑝 𝛼2 + 𝛽2𝑥 ]
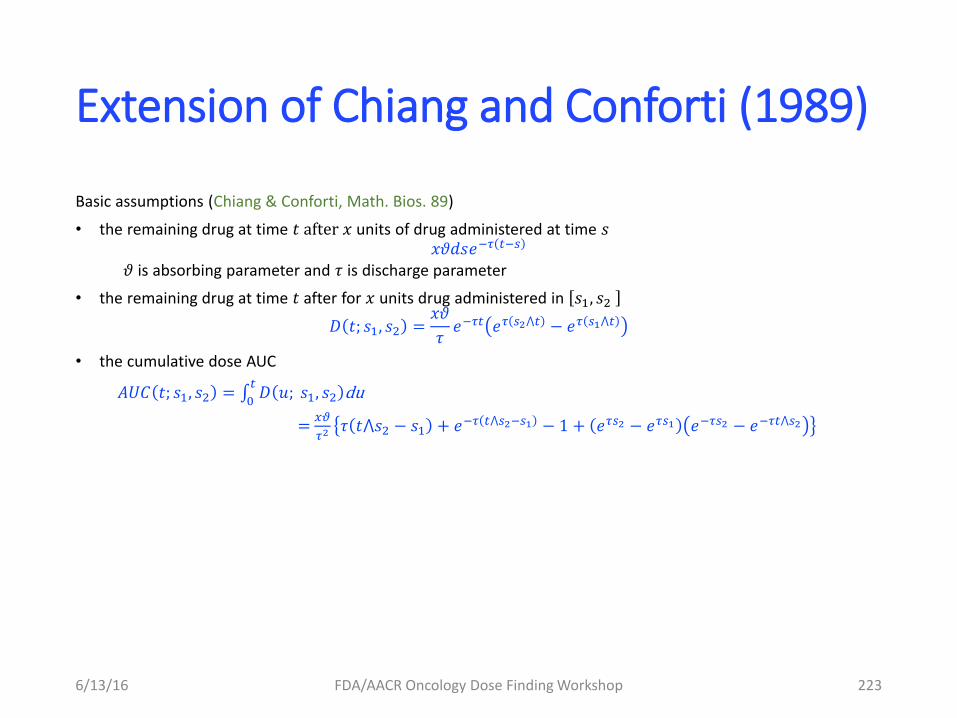
Extension of Chiang and Conforti (1989)
Basic assumptions (Chiang & Conforti, Math. Bios. 89)
• the remaining drug at time 𝑡 after 𝑥 units of drug administered at time 𝑠 𝑥𝜗𝑑𝑠𝑒−𝜏 𝑡−𝑠
𝜗 is absorbing parameter and 𝜏 is discharge parameter
• the remaining drug at time 𝑡 after for 𝑥 units drug administered in 𝑠1, 𝑠2
𝐷 𝑡; 𝑠1, 𝑠2 =𝑥𝜗
𝜏𝑒−𝜏𝑡 𝑒𝜏 𝑠2⋀𝑡 − 𝑒𝜏 𝑠1⋀𝑡
• the cumulative dose AUC
𝐴𝑈𝐶 𝑡; 𝑠1, 𝑠2 = 𝐷 𝑢; 𝑠1, 𝑠2𝑡
0du
= 𝑥𝜗
𝜏2 𝜏 𝑡⋀𝑠2 − 𝑠1 + 𝑒−𝜏 𝑡⋀𝑠2−𝑠1 − 1 + 𝑒𝜏𝑠2 − 𝑒𝜏𝑠1 𝑒−𝜏𝑠2 − 𝑒−𝜏𝑡⋀𝑠2
6/13/16 FDA/AACR Oncology Dose Finding Workshop 223
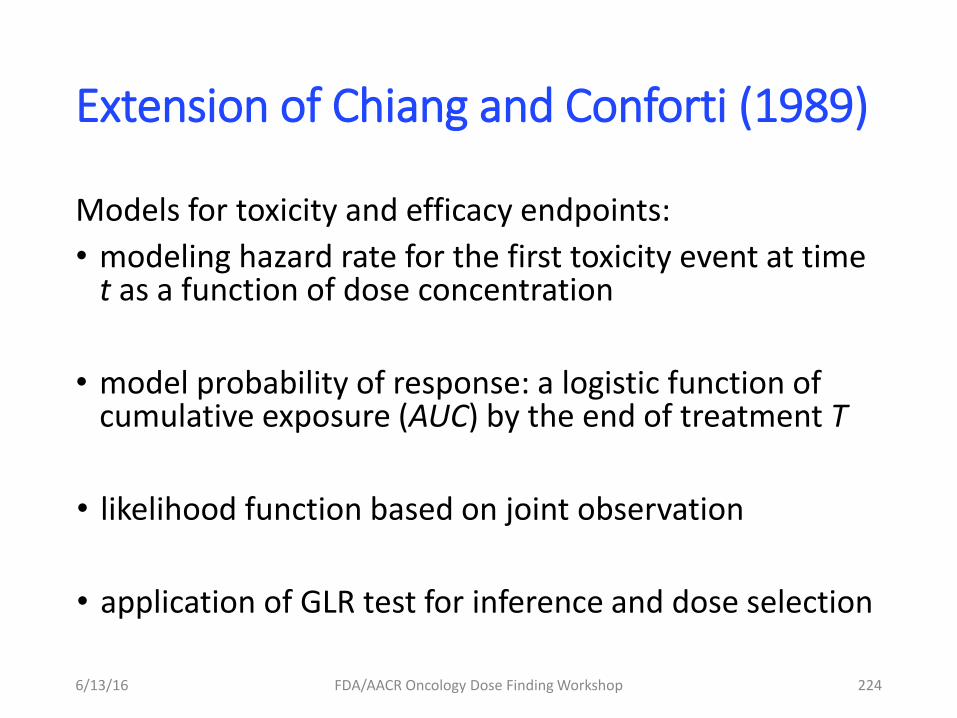
Extension of Chiang and Conforti (1989)
Models for toxicity and efficacy endpoints:
• modeling hazard rate for the first toxicity event at time t as a function of dose concentration
• model probability of response: a logistic function of cumulative exposure (AUC) by the end of treatment T
• likelihood function based on joint observation
• application of GLR test for inference and dose selection
6/13/16 FDA/AACR Oncology Dose Finding Workshop 224
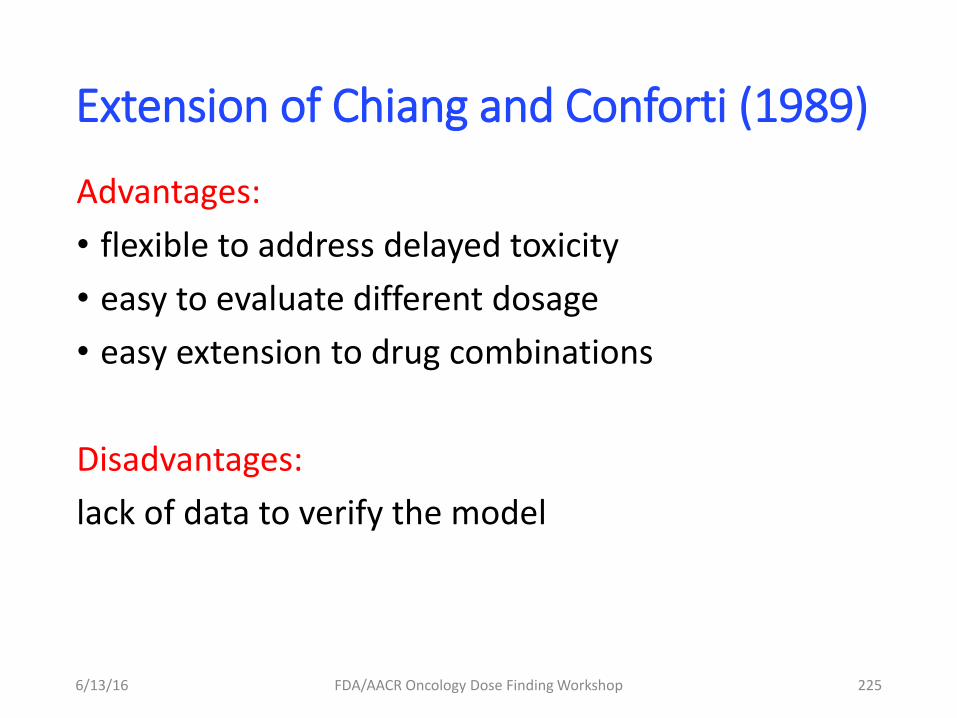
Extension of Chiang and Conforti (1989)
Advantages:
• flexible to address delayed toxicity
• easy to evaluate different dosage
• easy extension to drug combinations
Disadvantages:
lack of data to verify the model
6/13/16 FDA/AACR Oncology Dose Finding Workshop 225
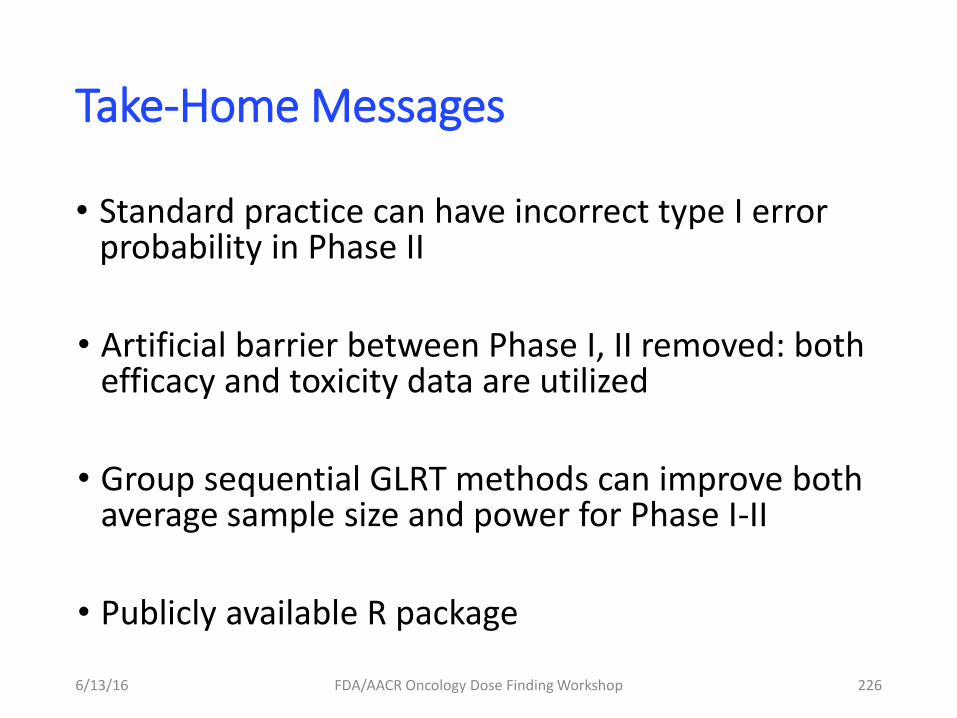
Take-Home Messages
• Standard practice can have incorrect type I error probability in Phase II
• Artificial barrier between Phase I, II removed: both efficacy and toxicity data are utilized
• Group sequential GLRT methods can improve both average sample size and power for Phase I-II
• Publicly available R package
6/13/16 FDA/AACR Oncology Dose Finding Workshop 226

Thanks for Dr. Lei Nie’s helpful suggestions
Thank you for your attention
6/13/16 FDA/AACR Oncology Dose Finding Workshop 227
228
Chao Liu, Ph.D., M.Stat. Division of Pharmacometrics
Office of Clinical Pharmacology OTS/CDER/FDA
June 13th, 2016
Dose Adjustment Integrated Exposure-Response Analysis (DAIER) For Dose Optimization
Lenvatinib in Renal Call Carcinoma
Outline
• Background
– Post-marketing Dose Optimization Trial
– Exposure-Response (E-R) Analysis
• Case Study
– Lenvatinib in Renal Cell Carcinoma
• Summary
229
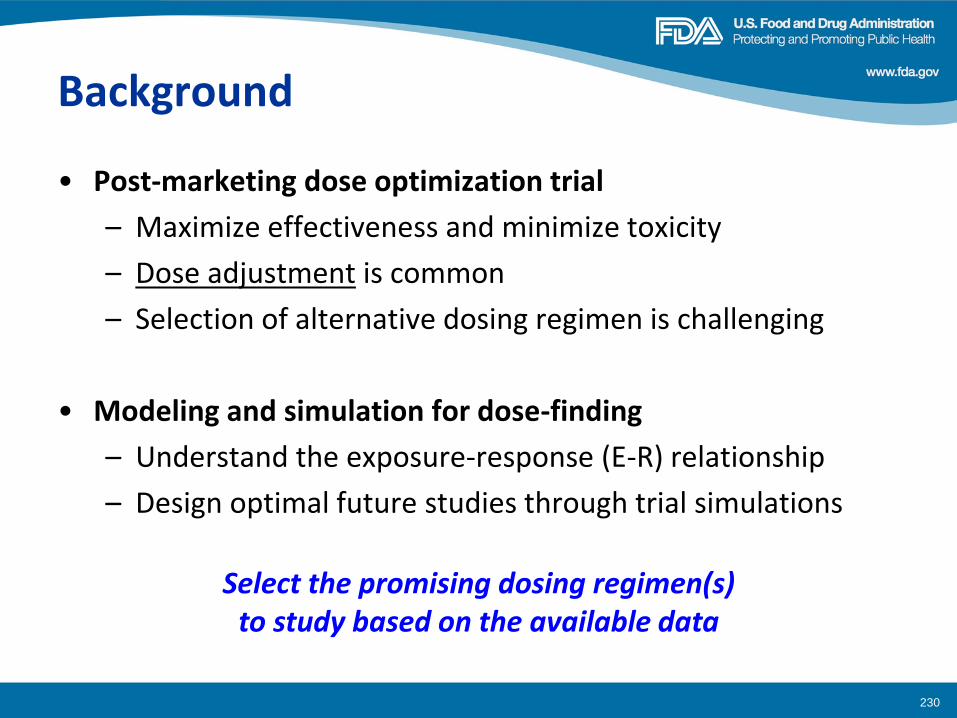
Background
• Post-marketing dose optimization trial
– Maximize effectiveness and minimize toxicity
– Dose adjustment is common
– Selection of alternative dosing regimen is challenging
• Modeling and simulation for dose-finding
– Understand the exposure-response (E-R) relationship
– Design optimal future studies through trial simulations
230
Select the promising dosing regimen(s) to study based on the available data
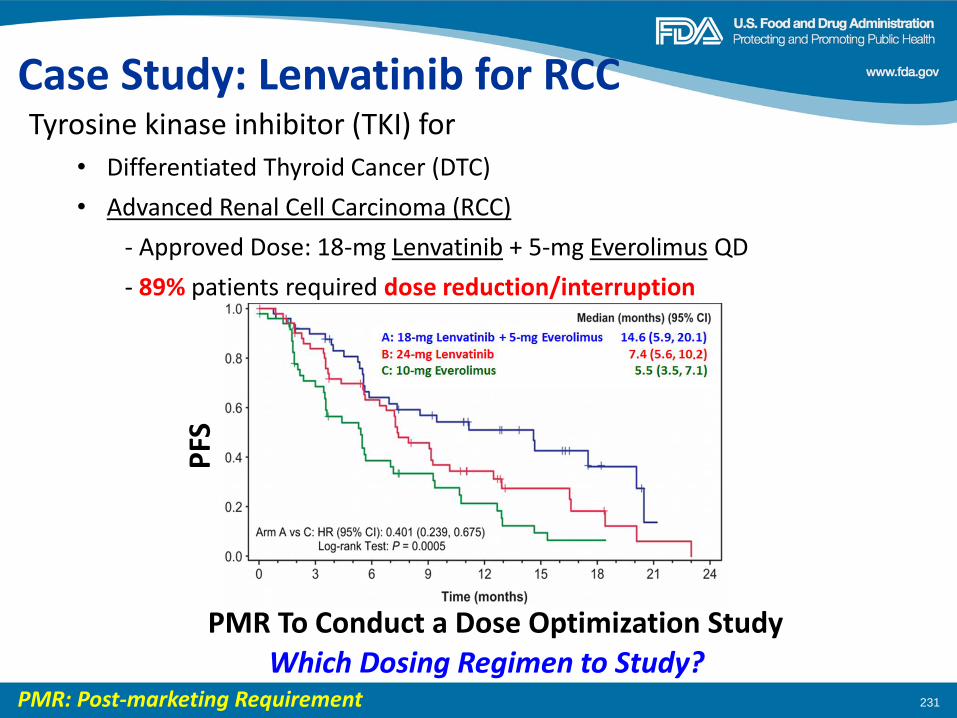
231
Tyrosine kinase inhibitor (TKI) for
• Differentiated Thyroid Cancer (DTC)
• Advanced Renal Cell Carcinoma (RCC)
- Approved Dose: 18-mg Lenvatinib + 5-mg Everolimus QD
- 89% patients required dose reduction/interruption
Case Study: Lenvatinib for RCC
PMR To Conduct a Dose Optimization Study
PMR: Post-marketing Requirement
Which Dosing Regimen to Study?
PFS
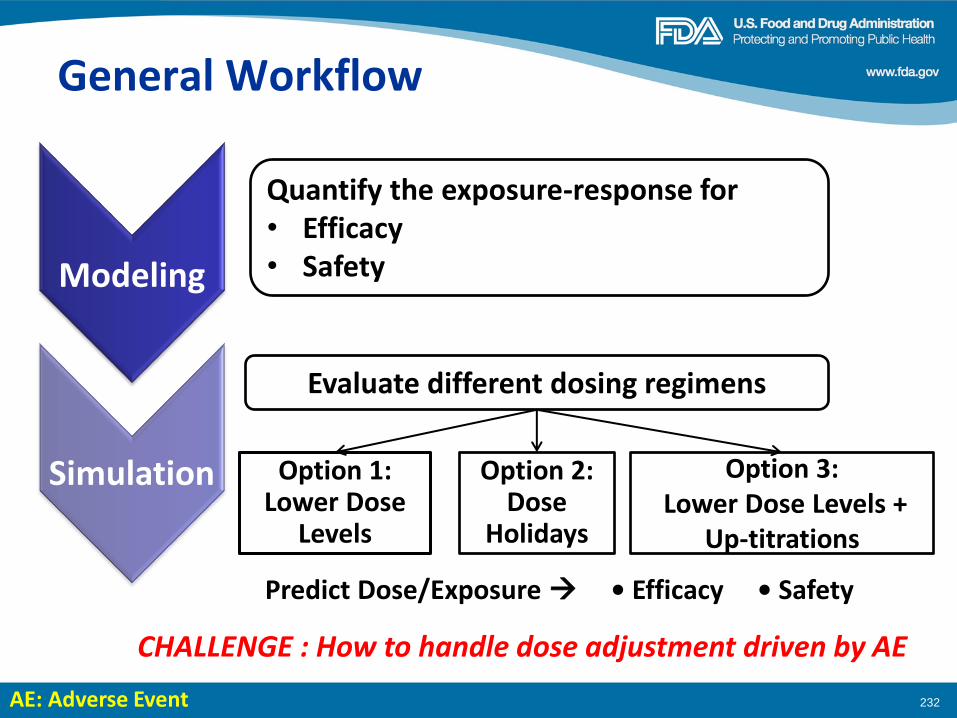
General Workflow
232
Quantify the exposure-response for • Efficacy • Safety Modeling
Simulation
Evaluate different dosing regimens
Option 1: Lower Dose
Levels
Option 2: Dose
Holidays
Option 3: Lower Dose Levels +
Up-titrations
CHALLENGE : How to handle dose adjustment driven by AE
Predict Dose/Exposure • Efficacy • Safety
AE: Adverse Event
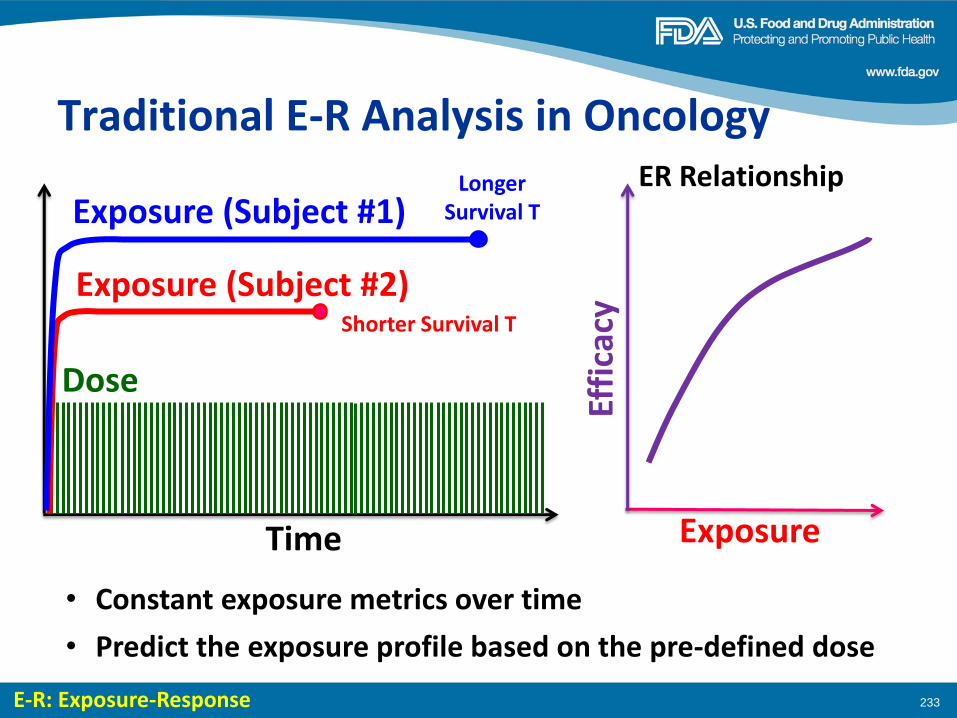
Traditional E-R Analysis in Oncology
233
Time
Dose
Exposure (Subject #2)
• Constant exposure metrics over time
E-R: Exposure-Response
Exposure (Subject #1)
Shorter Survival T
Longer Survival T
Exposure
Effi
cacy
ER Relationship
• Predict the exposure profile based on the pre-defined dose
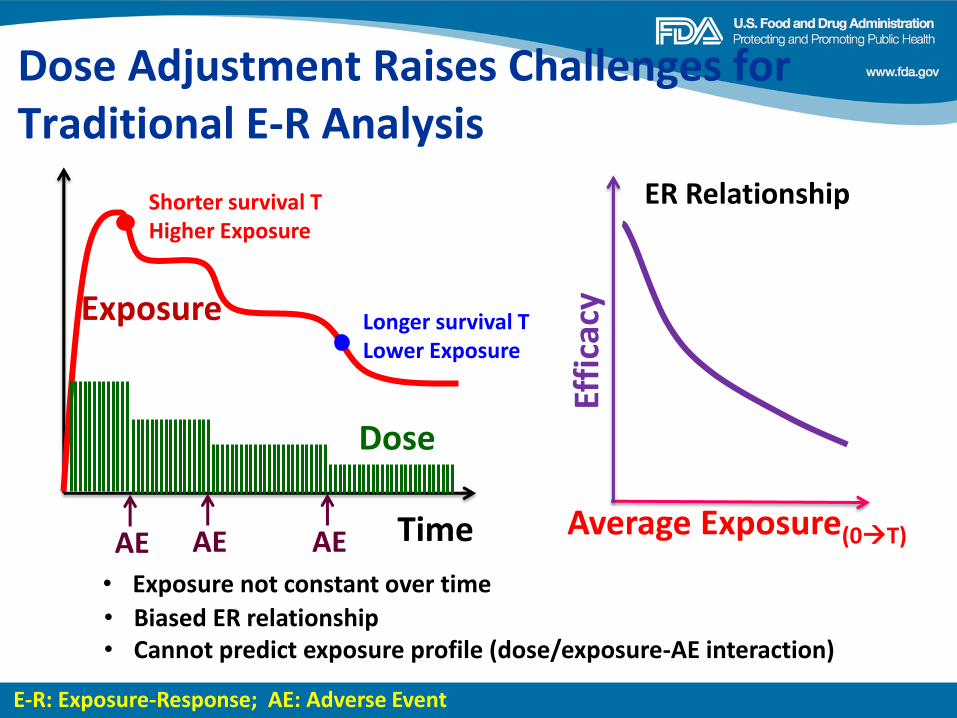
234
Dose
Exposure
Time
Longer survival T Lower Exposure
Shorter survival T Higher Exposure
AE AE AE Average Exposure(0T)
Effi
cacy
ER Relationship
• Biased ER relationship
• Exposure not constant over time
• Cannot predict exposure profile (dose/exposure-AE interaction)
Dose Adjustment Raises Challenges for Traditional E-R Analysis
E-R: Exposure-Response; AE: Adverse Event
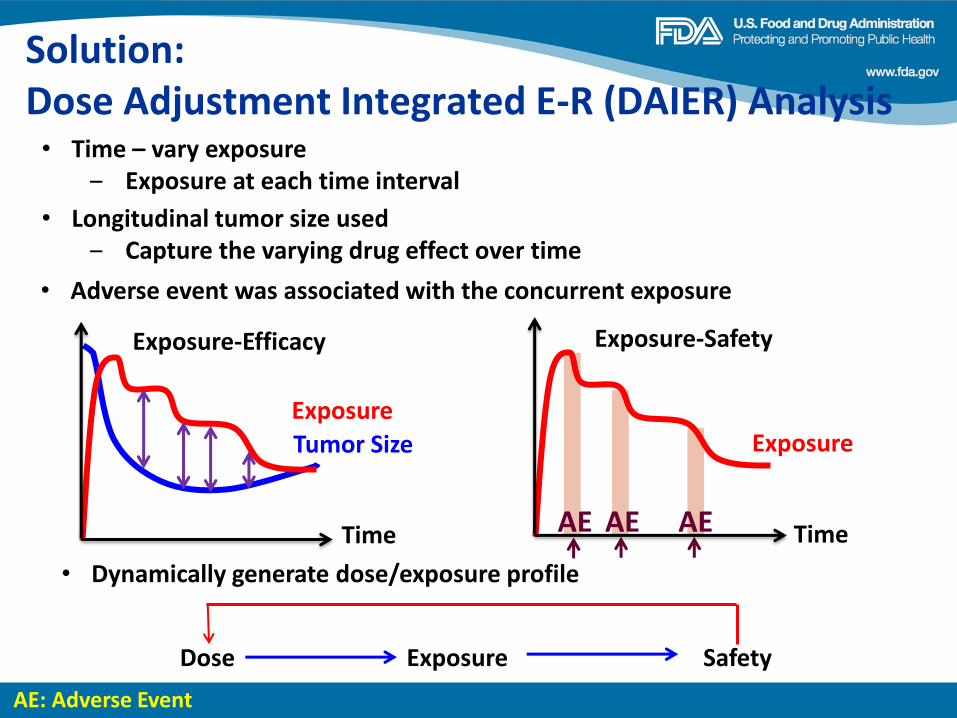
Solution: Dose Adjustment Integrated E-R (DAIER) Analysis
Exposure
AE AE AE Time
Exposure-Safety
AE: Adverse Event
• Time – vary exposure ‒ Exposure at each time interval
Tumor Size
Exposure
Time
Exposure-Efficacy
Dose Exposure Safety
• Dynamically generate dose/exposure profile
• Longitudinal tumor size used ‒ Capture the varying drug effect over time
• Adverse event was associated with the concurrent exposure
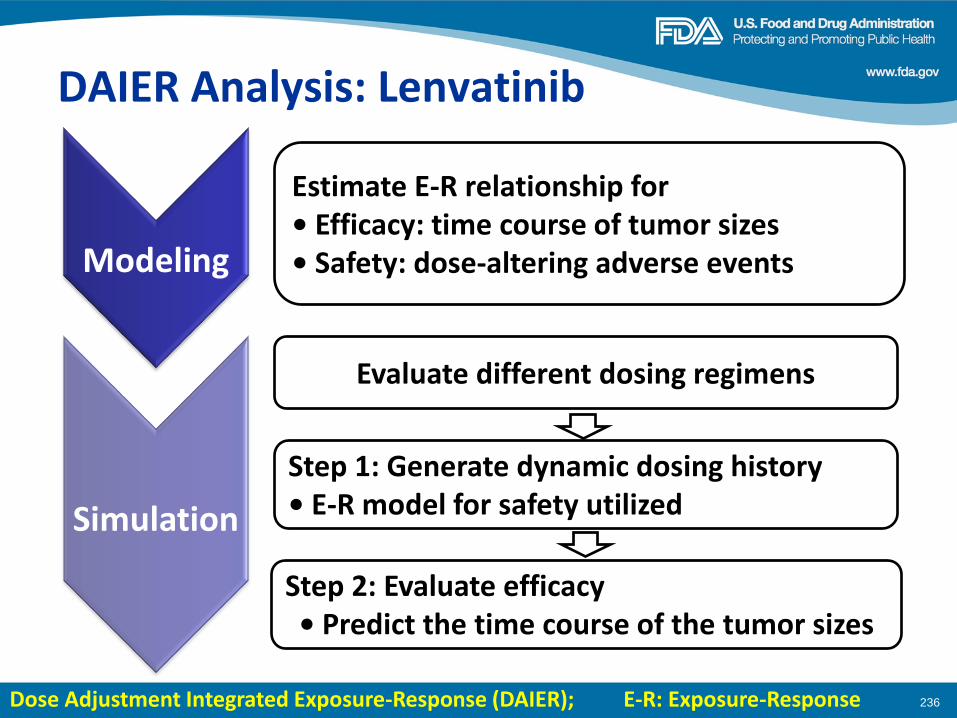
236
Estimate E-R relationship for • Efficacy: time course of tumor sizes • Safety: dose-altering adverse events Modeling
Simulation
Evaluate different dosing regimens
DAIER Analysis: Lenvatinib
Step 2: Evaluate efficacy • Predict the time course of the tumor sizes
Step 1: Generate dynamic dosing history • E-R model for safety utilized
Dose Adjustment Integrated Exposure-Response (DAIER); E-R: Exposure-Response
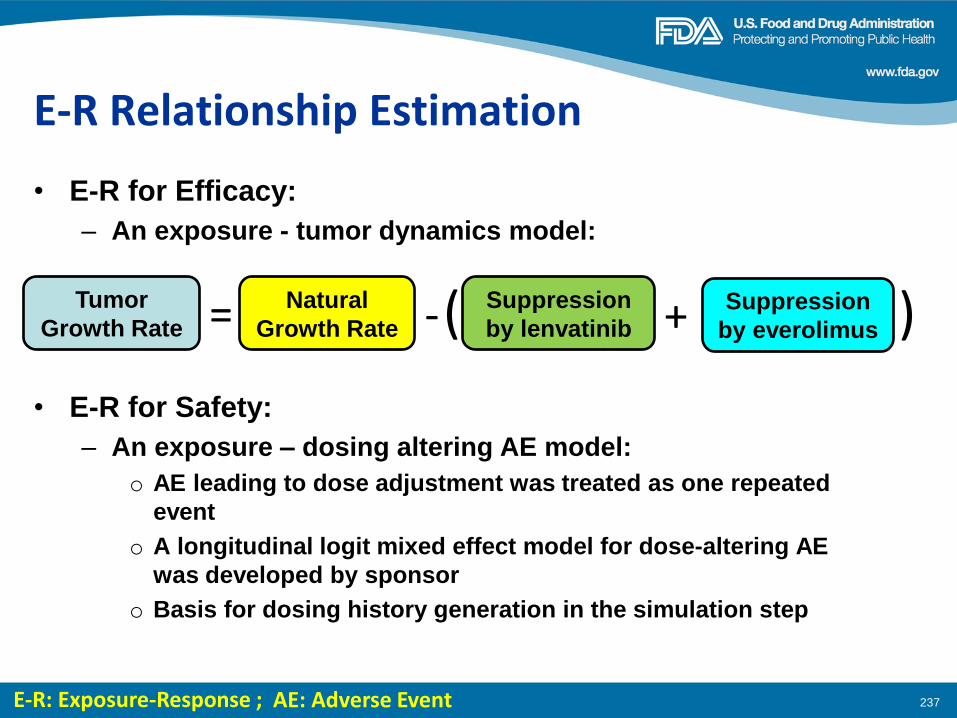
E-R Relationship Estimation
• E-R for Efficacy:
– An exposure - tumor dynamics model:
237
Natural
Growth Rate
Tumor
Growth Rate = - Suppression
by lenvatinib Suppression
by everolimus + ( )
• E-R for Safety:
– An exposure – dosing altering AE model:
o AE leading to dose adjustment was treated as one repeated
event
o A longitudinal logit mixed effect model for dose-altering AE
was developed by sponsor
o Basis for dosing history generation in the simulation step
E-R: Exposure-Response ; AE: Adverse Event
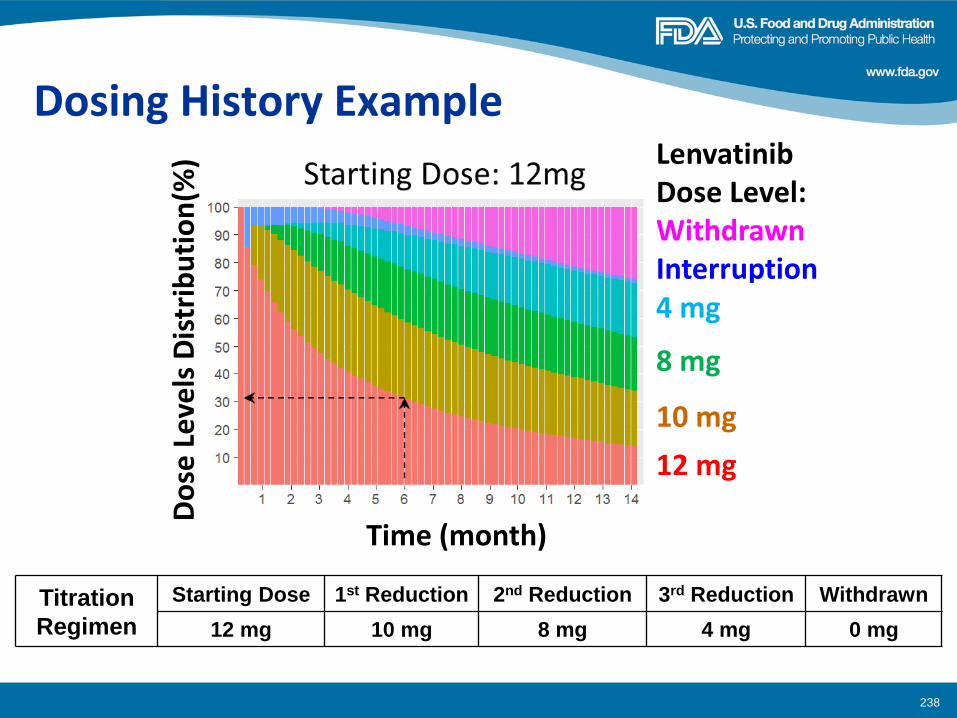
238
Dosing History Example
Titration
Regimen
Starting Dose 1st Reduction 2nd Reduction 3rd Reduction Withdrawn
12 mg 10 mg 8 mg 4 mg 0 mg
Time (month)
Do
se L
eve
ls D
istr
ibu
tio
n(%
) Lenvatinib Dose Level: Withdrawn Interruption 4 mg
8 mg
10 mg
12 mg
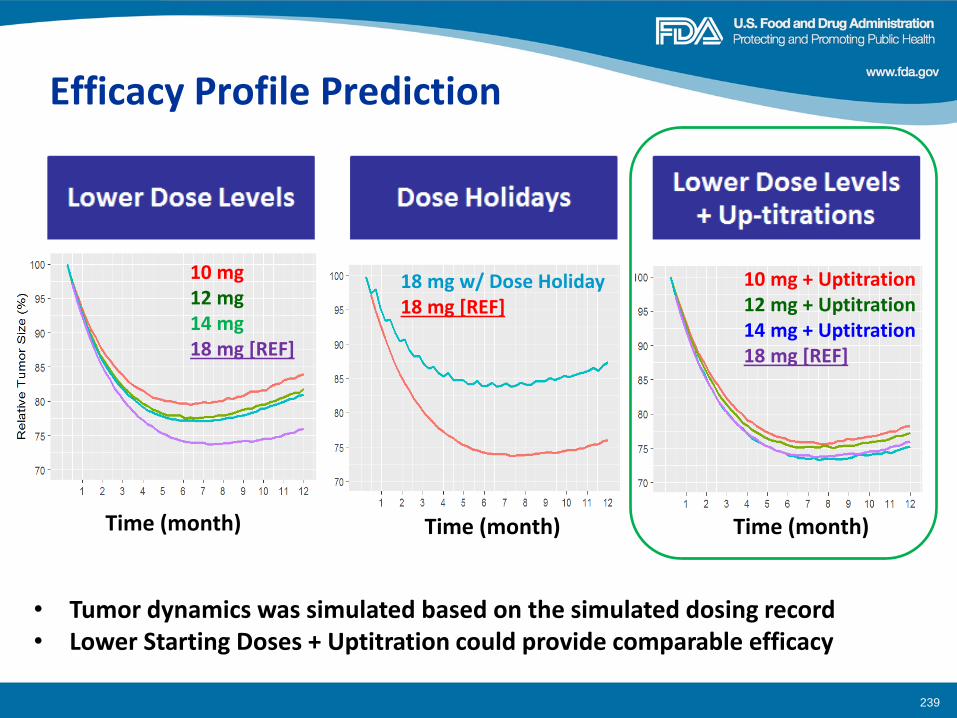
Efficacy Profile Prediction
239
Time (month) Time (month) Time (month)
10 mg 12 mg 14 mg 18 mg [REF]
18 mg w/ Dose Holiday 18 mg [REF]
10 mg + Uptitration 12 mg + Uptitration 14 mg + Uptitration 18 mg [REF]
• Tumor dynamics was simulated based on the simulated dosing record • Lower Starting Doses + Uptitration could provide comparable efficacy
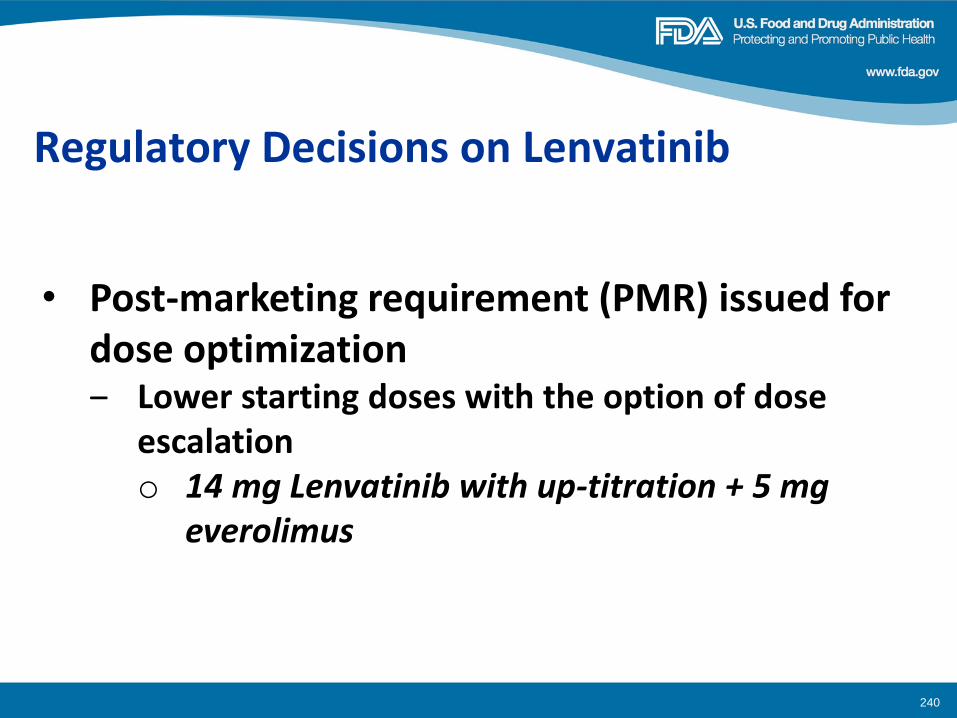
Regulatory Decisions on Lenvatinib
240
• Post-marketing requirement (PMR) issued for
dose optimization ‒ Lower starting doses with the option of dose
escalation o 14 mg Lenvatinib with up-titration + 5 mg
everolimus
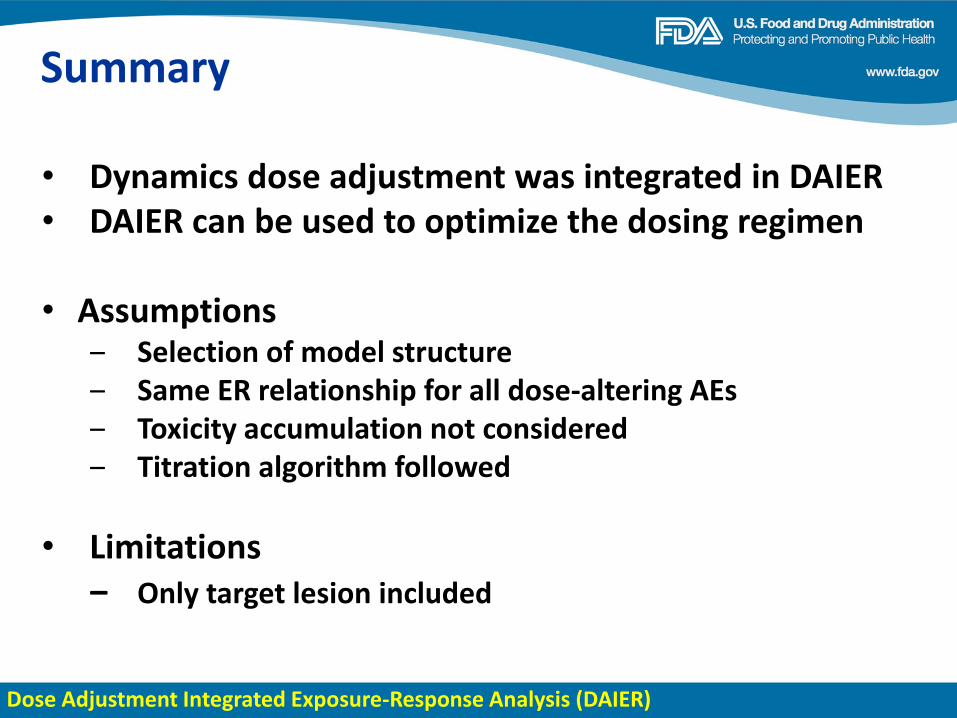
Summary
241
• Dynamics dose adjustment was integrated in DAIER • DAIER can be used to optimize the dosing regimen
• Assumptions
‒ Selection of model structure ‒ Same ER relationship for all dose-altering AEs ‒ Toxicity accumulation not considered ‒ Titration algorithm followed
• Limitations ‒ Only target lesion included
Dose Adjustment Integrated Exposure-Response Analysis (DAIER)
Acknowledgements
242
• Medical Review Team ‒ James Xu ‒ Virginia Maher ‒ Pamela Balcazar ‒ Geoffrey Kim
• Eisai Co., Ltd.
• Office of Clinical Pharmacology ‒ Yaning Wang ‒ Jingyu Yu ‒ Qi Liu ‒ Christy John ‒ Pengfei Song ‒ Yuan Xu ‒ Brian Booth ‒ Atiqur Rahman
THANK YOU
243

Back-up
244
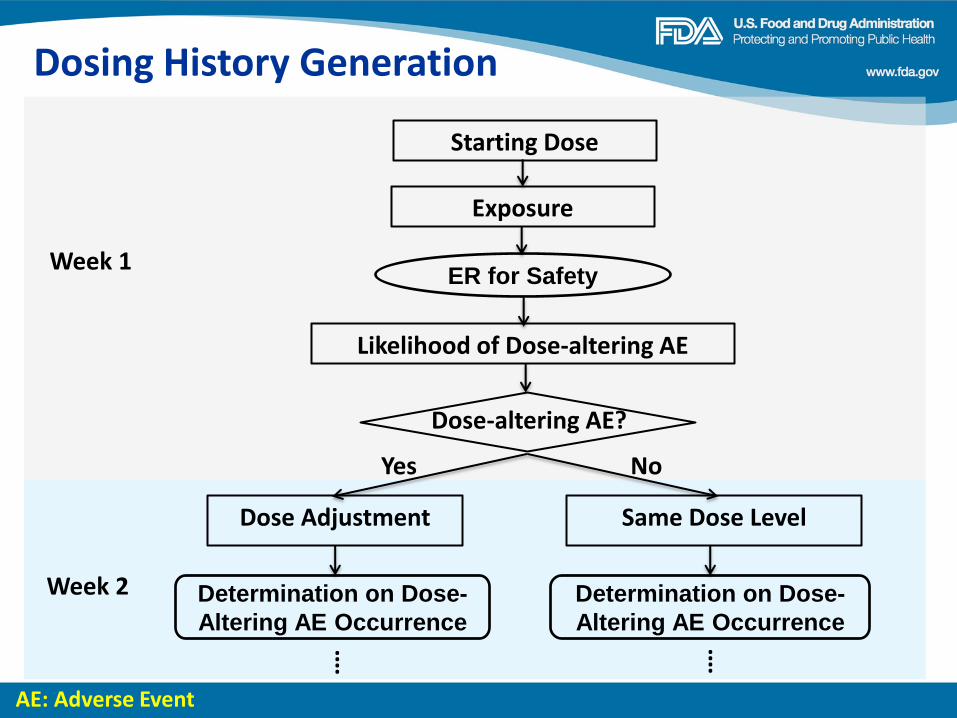
245
AE: Adverse Event
Week 1
Dose Adjustment Same Dose Level
⁞ ⁞
Week 2
Dosing History Generation
Starting Dose
Yes No
Exposure
Likelihood of Dose-altering AE
Dose-altering AE?
ER for Safety
Determination on Dose-
Altering AE Occurrence
Determination on Dose-
Altering AE Occurrence
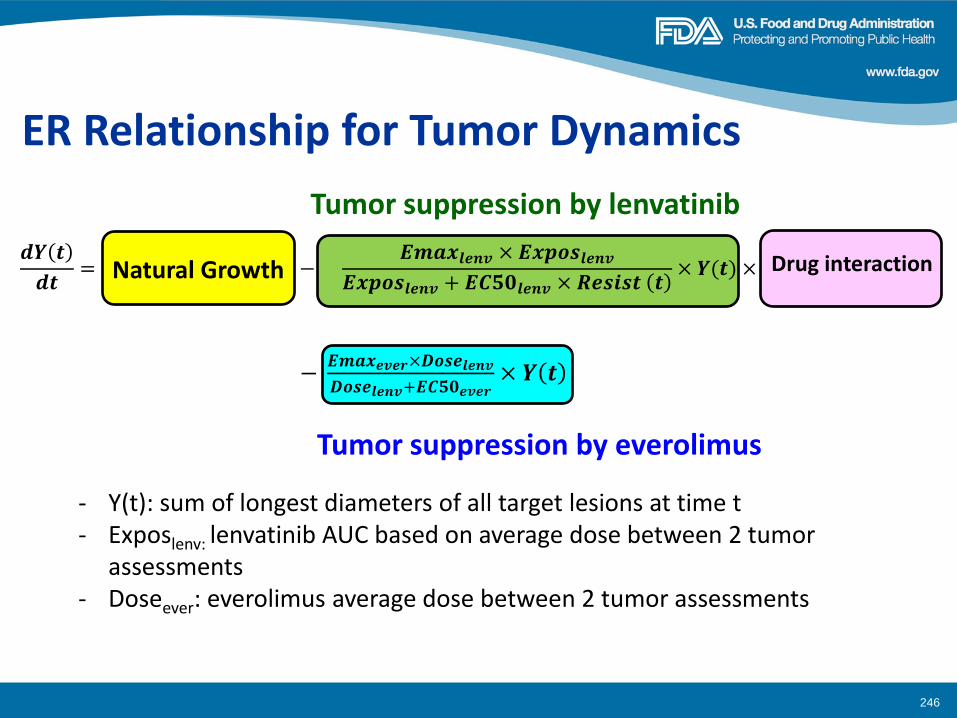
246
ER Relationship for Tumor Dynamics
- Y(t): sum of longest diameters of all target lesions at time t - Exposlenv: lenvatinib AUC based on average dose between 2 tumor
assessments - Doseever: everolimus average dose between 2 tumor assessments
Tumor suppression by lenvatinib
Tumor suppression by everolimus
𝒅𝒀 𝒕
𝒅𝒕= 𝐾𝐺 × ( −
𝑬𝒎𝒂𝒙𝒍𝒆𝒏𝒗 × 𝑬𝒙𝒑𝒐𝒔𝒍𝒆𝒏𝒗
𝑬𝒙𝒑𝒐𝒔𝒍𝒆𝒏𝒗 + 𝑬𝑪𝟓𝟎𝒍𝒆𝒏𝒗 × 𝑹𝒆𝒔𝒊𝒔𝒕 𝒕× 𝒀(𝒕) × 𝑰𝑵𝑻𝒆𝒗𝒆𝒓→𝒍𝒆𝒏𝒗
− 𝑬𝒎𝒂𝒙𝒆𝒗𝒆𝒓×𝑫𝒐𝒔𝒆𝒍𝒆𝒏𝒗
𝑫𝒐𝒔𝒆𝒍𝒆𝒏𝒗+𝑬𝑪𝟓𝟎𝒆𝒗𝒆𝒓× 𝒀 𝒕
Natural Growth Drug interaction
Dose Optimization Study
E7080-G000-218
FDA-AACR Dose Finding Workshop
June 13, 2016
Presented by Matthew Guo
Agenda
• Background
– Pivotal study (HOPE 205) design and key outcomes
– Regulatory timeline
• Dose Optimization Study Design – Interactions with FDA modeling/simulation and Biostatistics groups,
and External Bayesian experts
– Study design
248
BACKGROUND
249
Pivotal study (HOPE 205)
• An Open-Label, Multicenter Phase 1b/2 Study of E7080
Alone, and in Combination with Everolimus, in Subjects
with Unresectable Advanced or Metastatic Renal Cell
Carcinoma Following One Prior VEGF-Targeted
Treatment – Phase 1b: 3+3 design for sequential dose escalation to determine MTD;
cohort expansion to confirm the MTD and determine the recommended
Phase 2 (RP2) doses for E7080 in combination with everolimus
– Phase 2: To compare the progression free survival (PFS) of 1) E7080 in
combination with everolimus at the RP2 dose once daily and 2) single agent
E7080 24 mg once daily to single agent everolimus 10 mg once daily in
subjects with unresectable advanced or metastatic RCC and disease
progression following one prior vascular endothelial growth factor
(VEGF)-targeted treatment
250
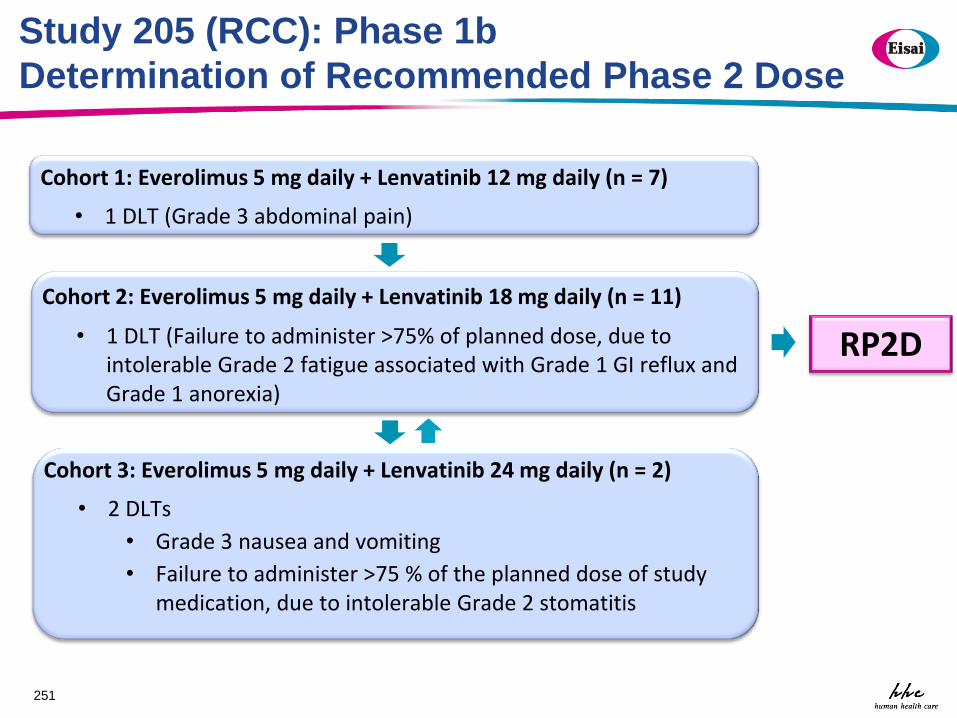
Study 205 (RCC): Phase 1b
Determination of Recommended Phase 2 Dose
251
• 2 DLTs
• Grade 3 nausea and vomiting
• Failure to administer >75 % of the planned dose of study medication, due to intolerable Grade 2 stomatitis
Cohort 3: Everolimus 5 mg daily + Lenvatinib 24 mg daily (n = 2)
• 1 DLT (Grade 3 abdominal pain)
Cohort 1: Everolimus 5 mg daily + Lenvatinib 12 mg daily (n = 7)
• 1 DLT (Failure to administer >75% of planned dose, due to intolerable Grade 2 fatigue associated with Grade 1 GI reflux and Grade 1 anorexia)
Cohort 2: Everolimus 5 mg daily + Lenvatinib 18 mg daily (n = 11)
RP2D
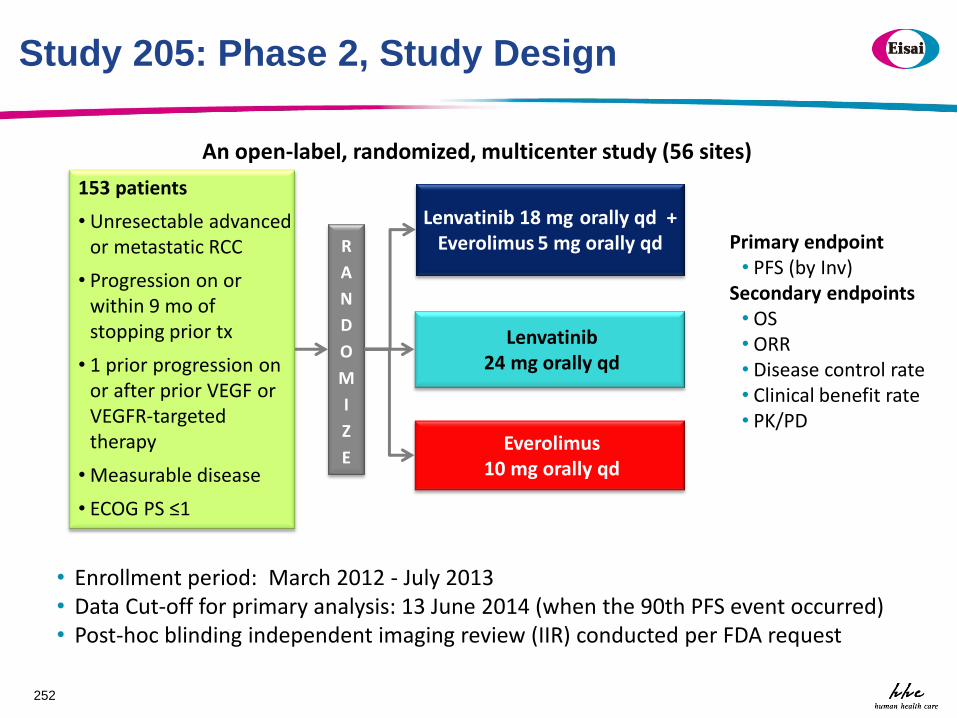
Study 205: Phase 2, Study Design
252
153 patients
• Unresectable advanced or metastatic RCC
• Progression on or within 9 mo of stopping prior tx
• 1 prior progression on or after prior VEGF or VEGFR-targeted therapy
• Measurable disease
• ECOG PS ≤1
Primary endpoint • PFS (by Inv)
Secondary endpoints • OS • ORR • Disease control rate • Clinical benefit rate • PK/PD
An open-label, randomized, multicenter study (56 sites)
R
A
N
D
O
M
I
Z
E
Everolimus 10 mg orally qd
Lenvatinib 24 mg orally qd
Lenvatinib 18 mg orally qd + Everolimus 5 mg orally qd
• Enrollment period: March 2012 - July 2013 • Data Cut-off for primary analysis: 13 June 2014 (when the 90th PFS event occurred) • Post-hoc blinding independent imaging review (IIR) conducted per FDA request
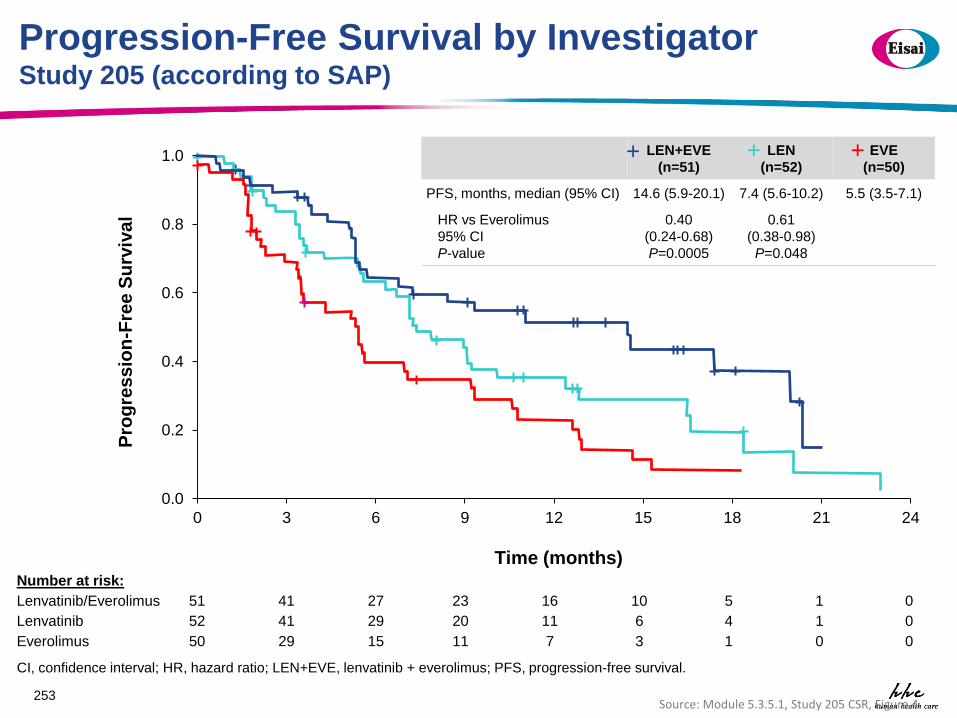
Progression-Free Survival by Investigator Study 205 (according to SAP)
253 Source: Module 5.3.5.1, Study 205 CSR, Figure 4
0.0
0.2
0.4
0.6
0.8
1.0
0 3 6 9 12 15 18 21 24
Pro
gre
ss
ion
-Fre
e S
urv
iva
l
Time (months) Number at risk:
Lenvatinib/Everolimus 51 41 27 23 16 10 5 1 0
Lenvatinib 52 41 29 20 11 6 4 1 0
Everolimus 50 29 15 11 7 3 1 0 0
+ +
LEN+EVE
(n=51)
LEN
(n=52)
EVE
(n=50)
PFS, months, median (95% CI) 14.6 (5.9-20.1) 7.4 (5.6-10.2) 5.5 (3.5-7.1)
HR vs Everolimus
95% CI
P-value
0.40
(0.24-0.68)
P=0.0005
0.61
(0.38-0.98)
P=0.048
+ + +
CI, confidence interval; HR, hazard ratio; LEN+EVE, lenvatinib + everolimus; PFS, progression-free survival.
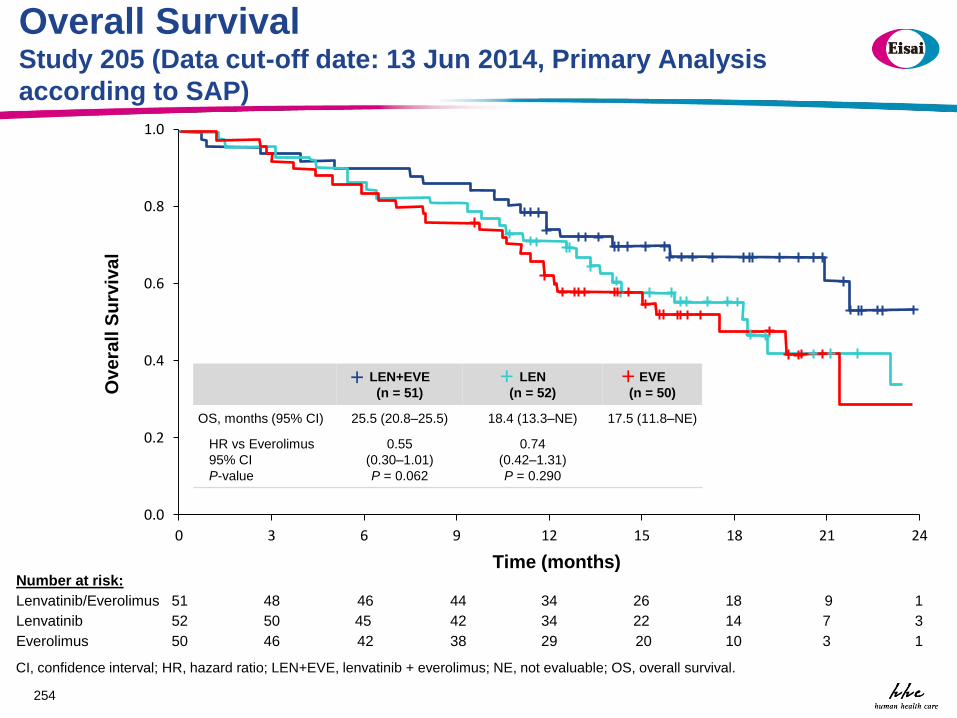
Overall Survival Study 205 (Data cut-off date: 13 Jun 2014, Primary Analysis
according to SAP)
254
Number at risk:
Lenvatinib/Everolimus 51 48 46 44 34 26 18 9 1
Lenvatinib 52 50 45 42 34 22 14 7 3
Everolimus 50 46 42 38 29 20 10 3 1
0.0
0.2
0.4
0.6
0.8
1.0
0 3 6 9 12 15 18 21 24
Ove
rall
Su
rviv
al
Time (months)
+
LEN+EVE
(n = 51)
LEN
(n = 52)
EVE
(n = 50)
OS, months (95% CI) 25.5 (20.8–25.5) 18.4 (13.3–NE) 17.5 (11.8–NE)
HR vs Everolimus
95% CI
P-value
0.55
(0.30–1.01)
P = 0.062
0.74
(0.42–1.31)
P = 0.290
+ + +
CI, confidence interval; HR, hazard ratio; LEN+EVE, lenvatinib + everolimus; NE, not evaluable; OS, overall survival.
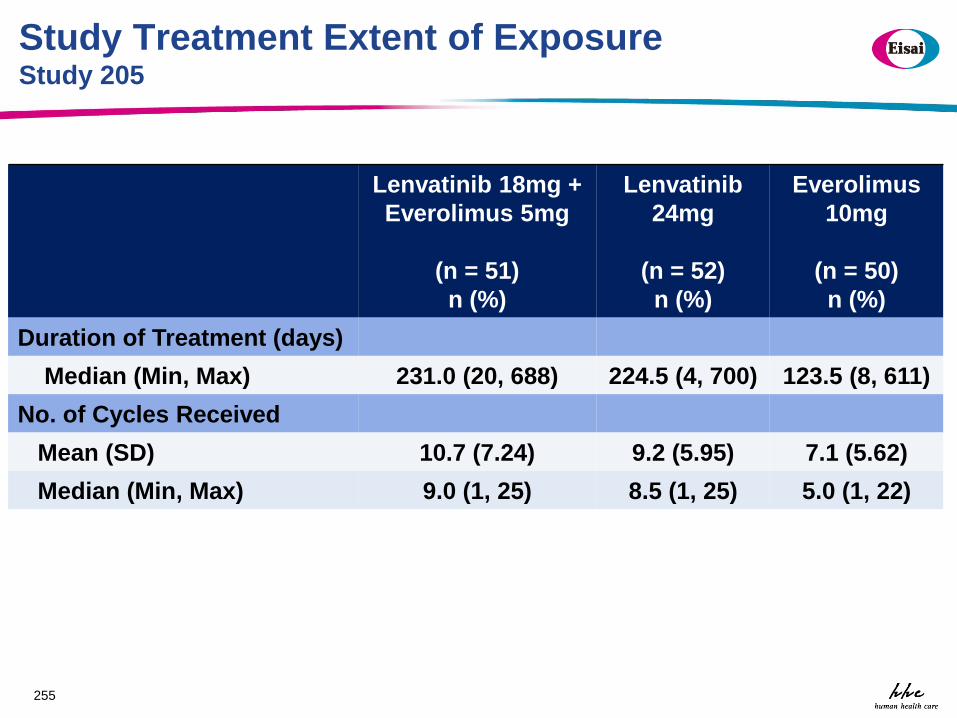
Study Treatment Extent of Exposure Study 205
Lenvatinib 18mg +
Everolimus 5mg
(n = 51)
n (%)
Lenvatinib
24mg
(n = 52)
n (%)
Everolimus
10mg
(n = 50)
n (%)
Duration of Treatment (days)
Median (Min, Max) 231.0 (20, 688) 224.5 (4, 700) 123.5 (8, 611)
No. of Cycles Received
Mean (SD) 10.7 (7.24) 9.2 (5.95) 7.1 (5.62)
Median (Min, Max) 9.0 (1, 25) 8.5 (1, 25) 5.0 (1, 22)
255
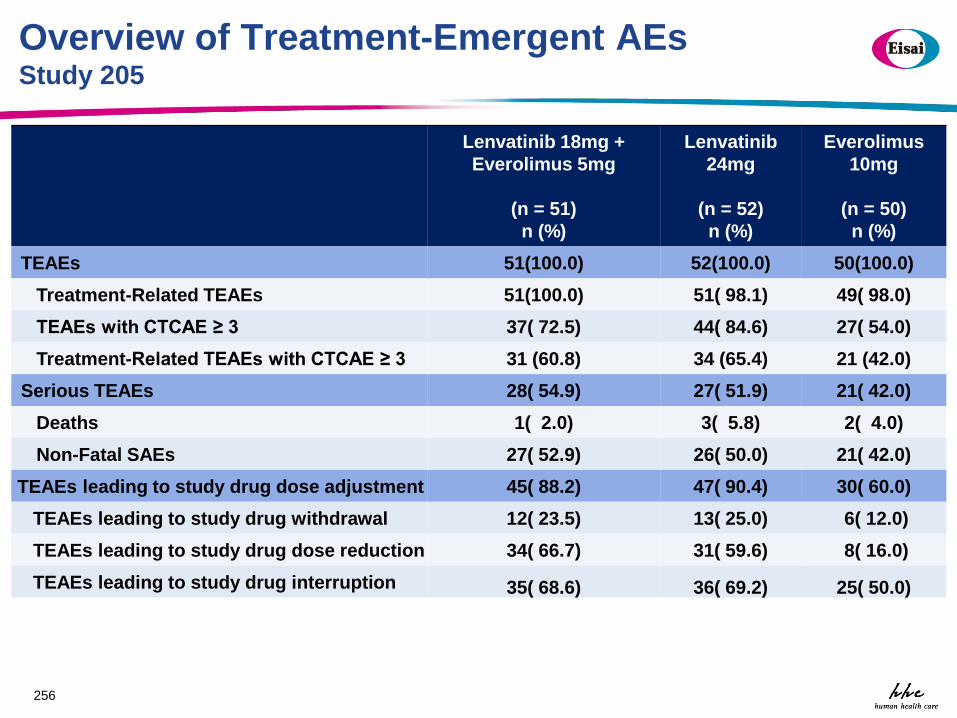
Overview of Treatment-Emergent AEs Study 205
Lenvatinib 18mg +
Everolimus 5mg
(n = 51)
n (%)
Lenvatinib
24mg
(n = 52)
n (%)
Everolimus
10mg
(n = 50)
n (%)
TEAEs 51(100.0) 52(100.0) 50(100.0)
Treatment-Related TEAEs 51(100.0) 51( 98.1) 49( 98.0)
TEAEs with CTCAE ≥ 3 37( 72.5) 44( 84.6) 27( 54.0)
Treatment-Related TEAEs with CTCAE ≥ 3 31 (60.8) 34 (65.4) 21 (42.0)
Serious TEAEs 28( 54.9) 27( 51.9) 21( 42.0)
Deaths 1( 2.0) 3( 5.8) 2( 4.0)
Non-Fatal SAEs 27( 52.9) 26( 50.0) 21( 42.0)
TEAEs leading to study drug dose adjustment 45( 88.2) 47( 90.4) 30( 60.0)
TEAEs leading to study drug withdrawal 12( 23.5) 13( 25.0) 6( 12.0)
TEAEs leading to study drug dose reduction 34( 66.7) 31( 59.6) 8( 16.0)
TEAEs leading to study drug interruption 35( 68.6) 36( 69.2) 25( 50.0)
256
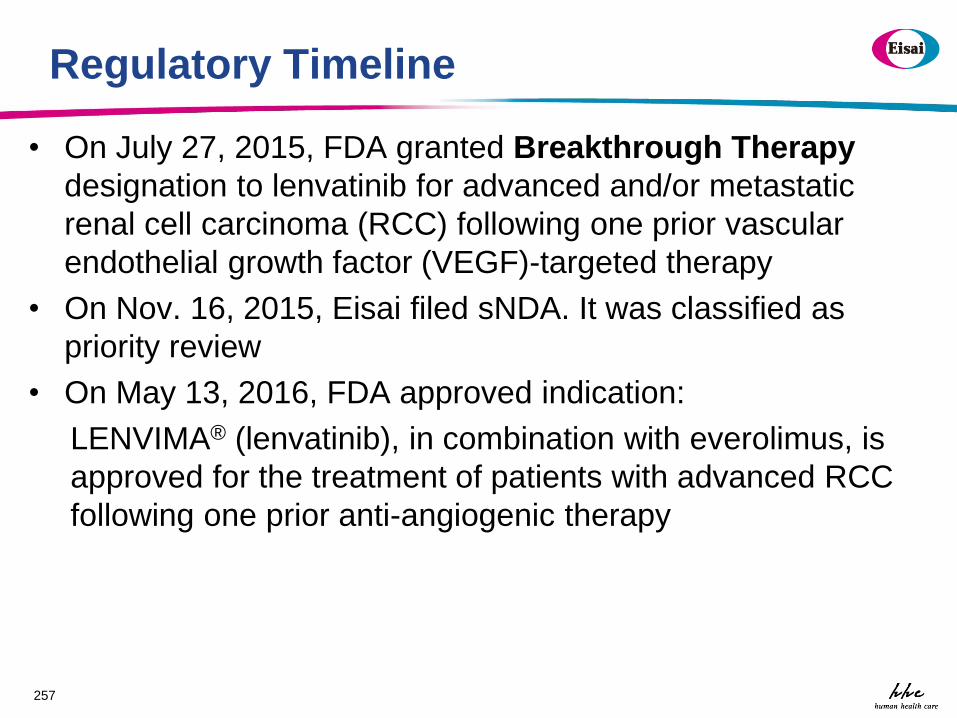
Regulatory Timeline
• On July 27, 2015, FDA granted Breakthrough Therapy
designation to lenvatinib for advanced and/or metastatic
renal cell carcinoma (RCC) following one prior vascular
endothelial growth factor (VEGF)-targeted therapy
• On Nov. 16, 2015, Eisai filed sNDA. It was classified as
priority review
• On May 13, 2016, FDA approved indication:
LENVIMA® (lenvatinib), in combination with everolimus, is
approved for the treatment of patients with advanced RCC
following one prior anti-angiogenic therapy
257
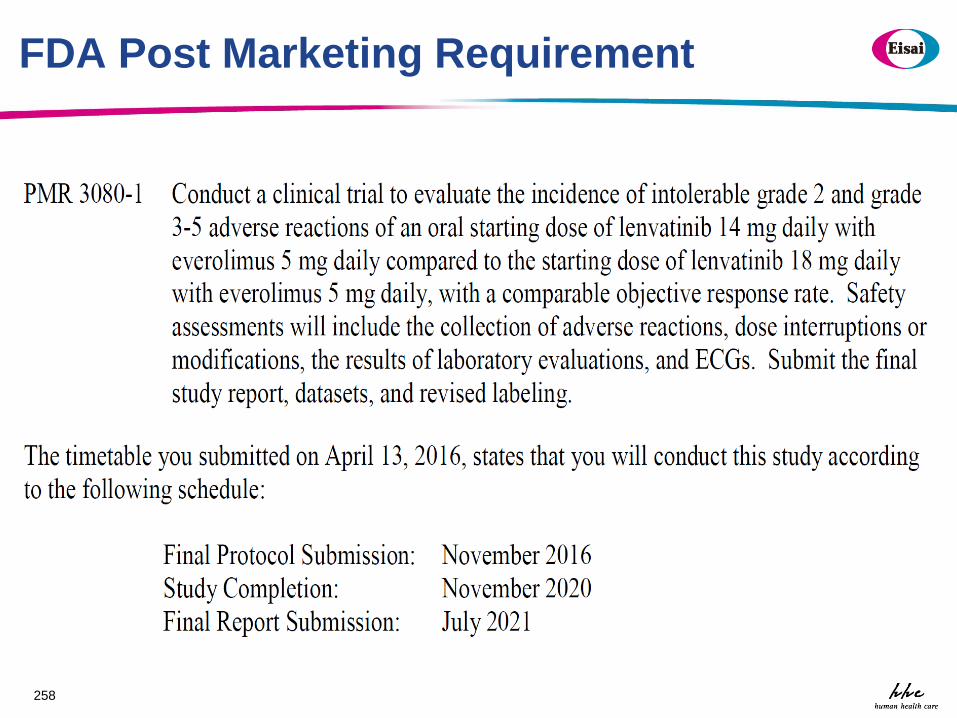
FDA Post Marketing Requirement
258
DOSE OPTIMIZATION STUDY DESIGN
259
Collaboration with FDA and Bayesian expert
• Several teleconferences were conducted
between FDA modeling/simulation group,
biostatistics group and Eisai
• Multiple scenarios regarding dosing schema
were simulated
• External expert were consulted to explore
Bayesian design.
260
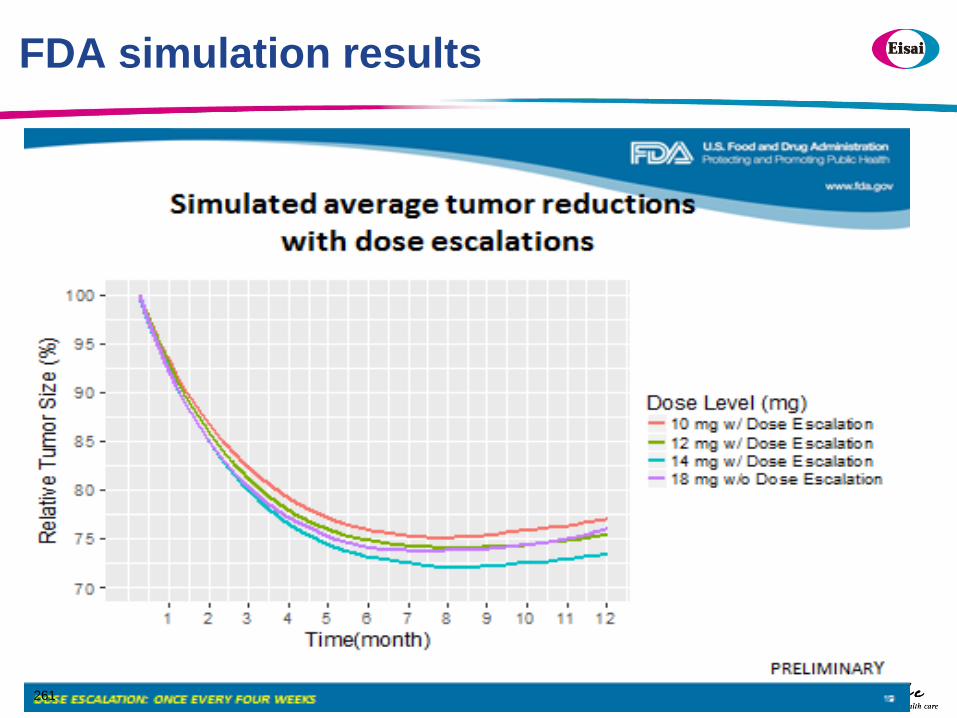
FDA simulation results
261
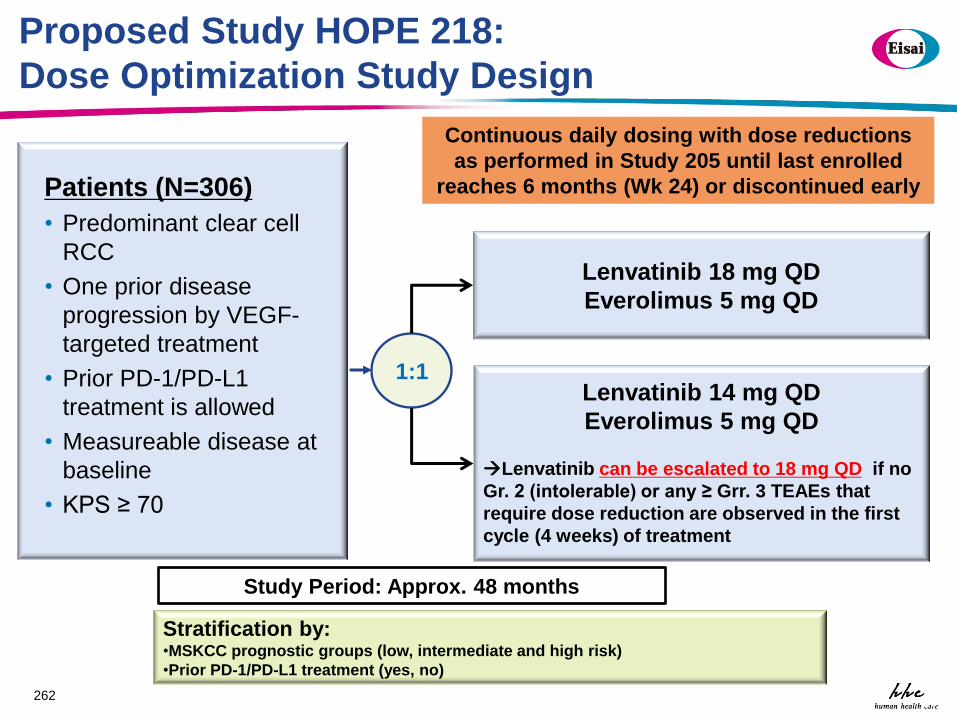
Proposed Study HOPE 218:
Dose Optimization Study Design
262 262
Patients (N=306)
• Predominant clear cell
RCC
• One prior disease
progression by VEGF-
targeted treatment
• Prior PD-1/PD-L1
treatment is allowed
• Measureable disease at
baseline
• KPS ≥ 70
Stratification by: •MSKCC prognostic groups (low, intermediate and high risk)
•Prior PD-1/PD-L1 treatment (yes, no)
1:1 Lenvatinib 14 mg QD
Everolimus 5 mg QD
Lenvatinib can be escalated to 18 mg QD if no
Gr. 2 (intolerable) or any ≥ Grr. 3 TEAEs that
require dose reduction are observed in the first
cycle (4 weeks) of treatment
Lenvatinib 18 mg QD
Everolimus 5 mg QD
Continuous daily dosing with dose reductions
as performed in Study 205 until last enrolled
reaches 6 months (Wk 24) or discontinued early
262
Study Period: Approx. 48 months
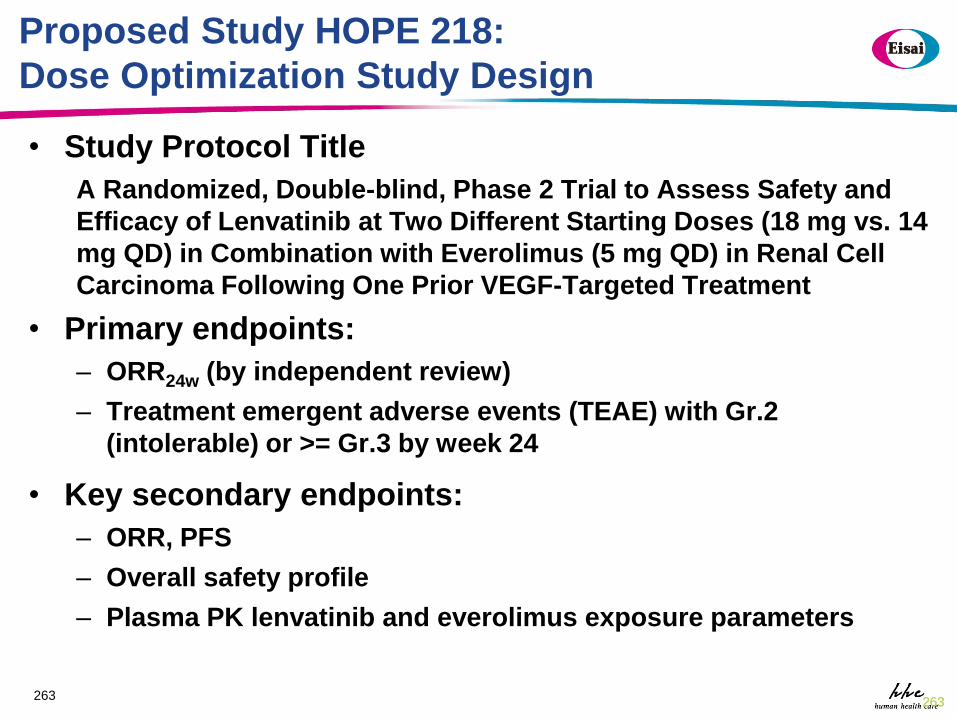
Proposed Study HOPE 218:
Dose Optimization Study Design
• Study Protocol Title
A Randomized, Double-blind, Phase 2 Trial to Assess Safety and
Efficacy of Lenvatinib at Two Different Starting Doses (18 mg vs. 14
mg QD) in Combination with Everolimus (5 mg QD) in Renal Cell
Carcinoma Following One Prior VEGF-Targeted Treatment
• Primary endpoints:
– ORR24w (by independent review)
– Treatment emergent adverse events (TEAE) with Gr.2
(intolerable) or >= Gr.3 by week 24
• Key secondary endpoints:
– ORR, PFS
– Overall safety profile
– Plasma PK lenvatinib and everolimus exposure parameters
263 263 263
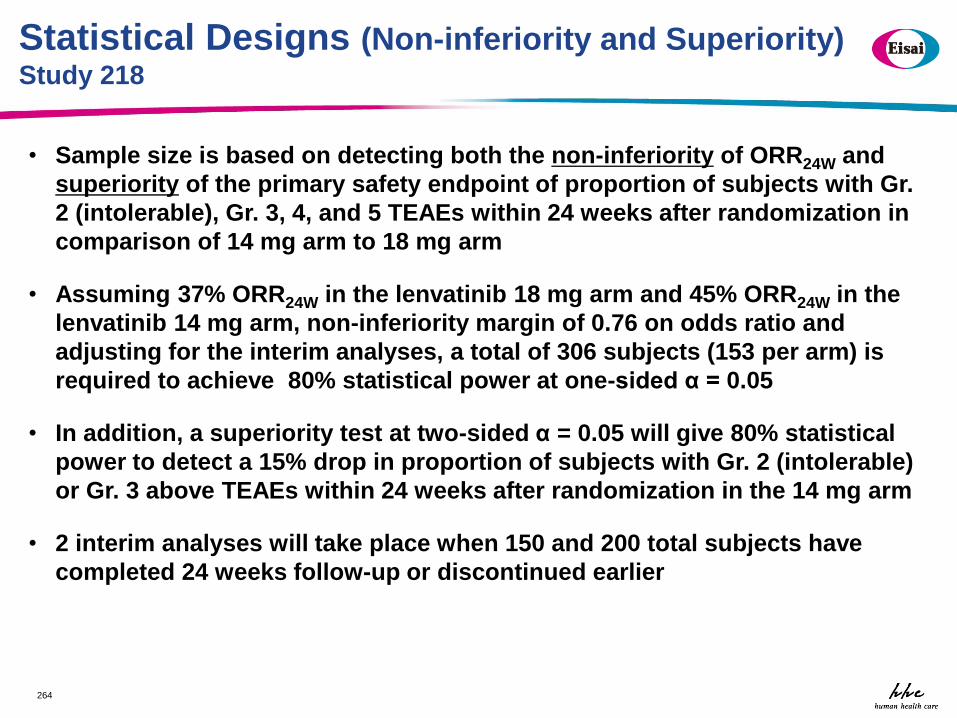
Statistical Designs (Non-inferiority and Superiority) Study 218
• Sample size is based on detecting both the non-inferiority of ORR24W and
superiority of the primary safety endpoint of proportion of subjects with Gr.
2 (intolerable), Gr. 3, 4, and 5 TEAEs within 24 weeks after randomization in
comparison of 14 mg arm to 18 mg arm
• Assuming 37% ORR24W in the lenvatinib 18 mg arm and 45% ORR24W in the
lenvatinib 14 mg arm, non-inferiority margin of 0.76 on odds ratio and
adjusting for the interim analyses, a total of 306 subjects (153 per arm) is
required to achieve 80% statistical power at one-sided α = 0.05
• In addition, a superiority test at two-sided α = 0.05 will give 80% statistical
power to detect a 15% drop in proportion of subjects with Gr. 2 (intolerable)
or Gr. 3 above TEAEs within 24 weeks after randomization in the 14 mg arm
• 2 interim analyses will take place when 150 and 200 total subjects have
completed 24 weeks follow-up or discontinued earlier
264
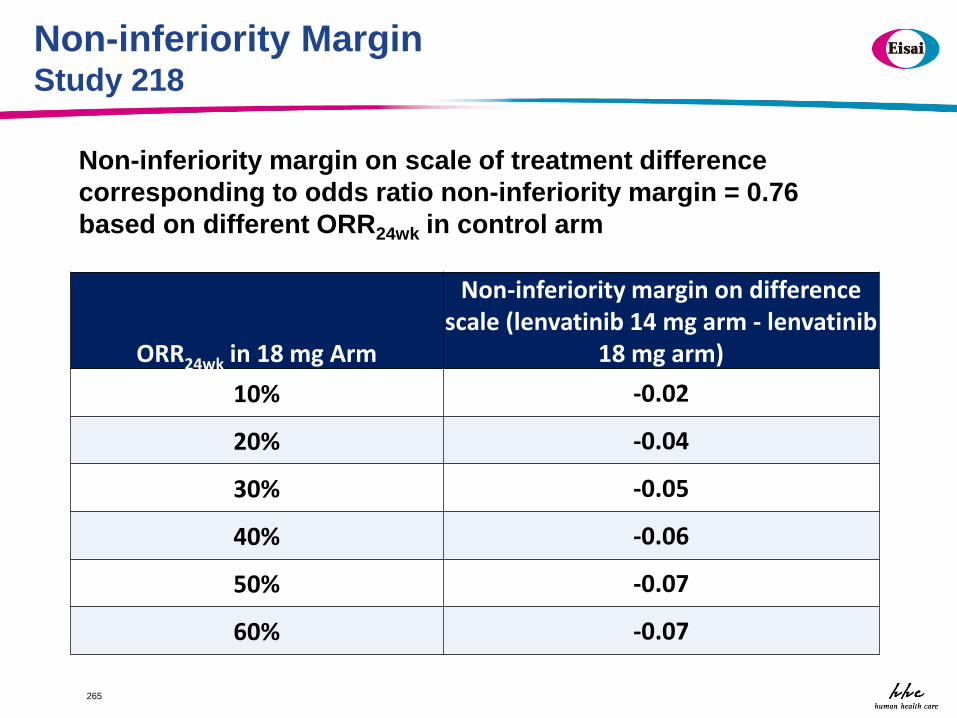
265
Non-inferiority margin on scale of treatment difference
corresponding to odds ratio non-inferiority margin = 0.76
based on different ORR24wk in control arm
ORR24wk in 18 mg Arm
Non-inferiority margin on difference scale (lenvatinib 14 mg arm - lenvatinib
18 mg arm)
10% -0.02
20% -0.04
30% -0.05
40% -0.06
50% -0.07
60% -0.07
Non-inferiority Margin Study 218
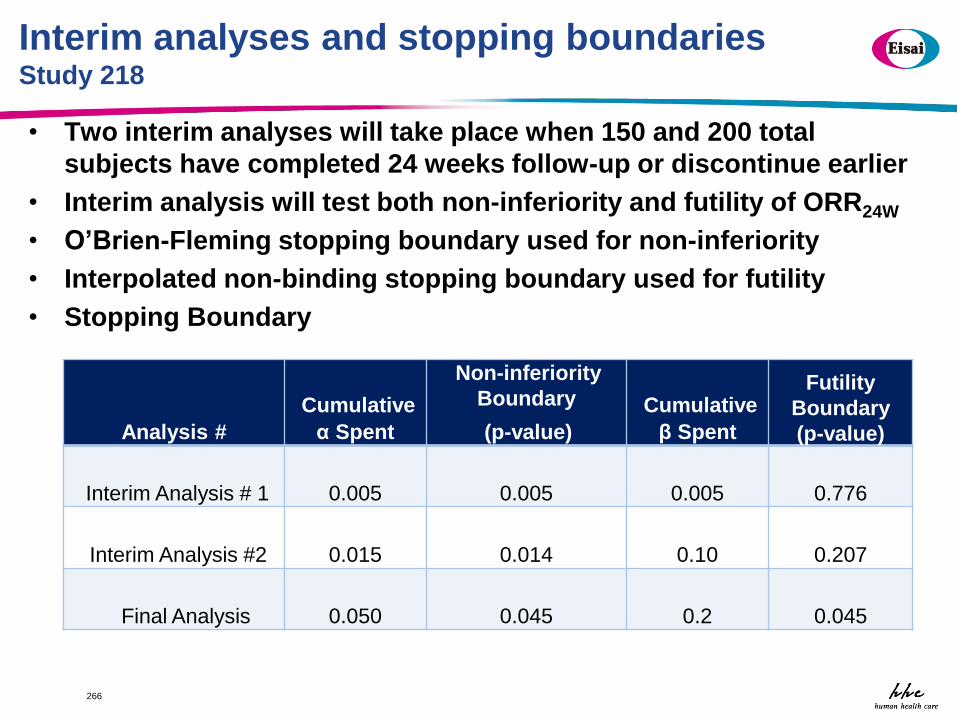
Interim analyses and stopping boundaries Study 218
• Two interim analyses will take place when 150 and 200 total
subjects have completed 24 weeks follow-up or discontinue earlier
• Interim analysis will test both non-inferiority and futility of ORR24W
• O’Brien-Fleming stopping boundary used for non-inferiority
• Interpolated non-binding stopping boundary used for futility
• Stopping Boundary
266
Analysis #
Cumulative
α Spent
Non-inferiority
Boundary
(p-value)
Cumulative
β Spent
Futility
Boundary
(p-value)
Interim Analysis # 1
0.005
0.005
0.005
0.776
Interim Analysis #2
0.015
0.014
0.10
0.207
Final Analysis
0.050
0.045
0.2
0.045
THANK YOU!
267
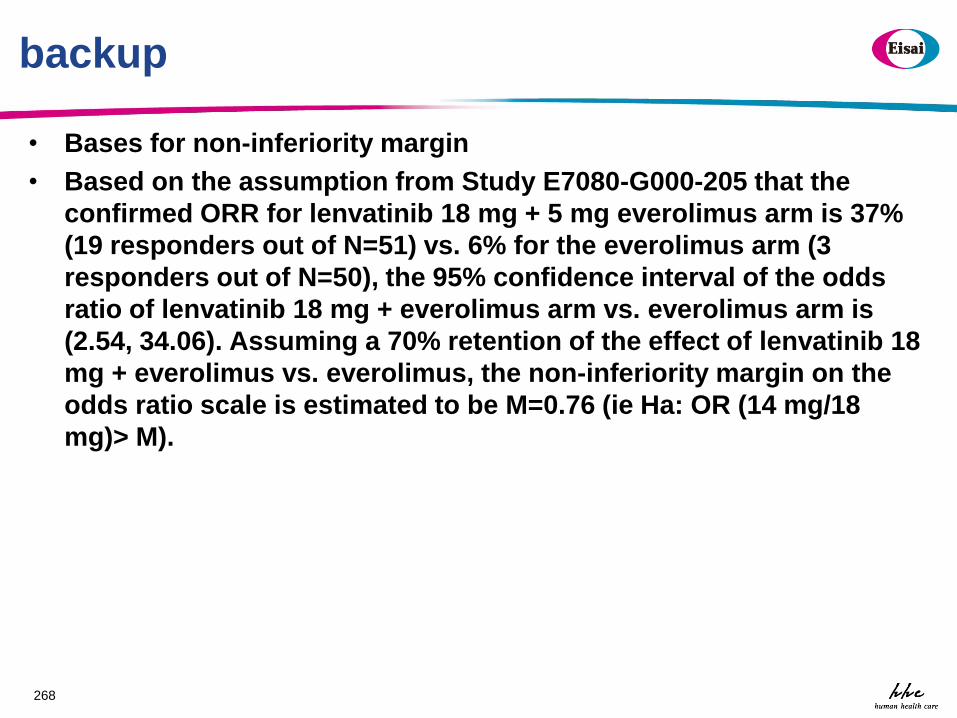
backup
• Bases for non-inferiority margin
• Based on the assumption from Study E7080-G000-205 that the
confirmed ORR for lenvatinib 18 mg + 5 mg everolimus arm is 37%
(19 responders out of N=51) vs. 6% for the everolimus arm (3
responders out of N=50), the 95% confidence interval of the odds
ratio of lenvatinib 18 mg + everolimus arm vs. everolimus arm is
(2.54, 34.06). Assuming a 70% retention of the effect of lenvatinib 18
mg + everolimus vs. everolimus, the non-inferiority margin on the
odds ratio scale is estimated to be M=0.76 (ie Ha: OR (14 mg/18
mg)> M).
268
Session III Panel Discussion Designs for Dose Optimization Studies:
Pre-Market and Post-Market
Chair: Eric Rubin, MD
Speakers: Haleh Saber, PhD
Pasi Jänne, MD, PhD Ying Lu, PhD
Chao Liu, PhD Matthew Guo, PhD
Panelists: Kelvin Dickenson
Serban Ghiorghiu, MD Hans Loland
Sumithra Mandrekar, PhD Lie Nie, PhD
Nam Atiqur Rahman, PhD Lillian Siu, MD

Wrap Up

Adjourn
Thank You for Participating!