repository.out.ac.tzrepository.out.ac.tz/1120/1/chapters_1_to_5_corrected... · web viewcopper is...
TRANSCRIPT

LEVELS OF HEAVY METALS IN SOIL, WATER AND PLANTS AND
VARIATIONS OF WATER QUALITY PARAMETERS AT VIKUGE IN KIBAHA
DISTRICT, TANZANIA
ERASTO MICHAEL GWIMILE
THESIS SUBMITTED IN FULFILLMENT OF THE REQUIREMENTS FOR THE
DEGREE OF MASTER OF SCIENCE (CHEMISTRY) AT THE OPEN
UNIVERSITY OF TANZANIA.
2015

i
CERTIFICATION
The undersigned certify that they have read and hereby recommend for acceptance by the
Open University of Tanzania, a thesis entitled: Levels of Heavy metals in Soil, Water, and
Plants and Variation of water Quality Parameters at Vikuge in Kibaha District, Tanzania.
…………………………
Dr. J. A. Saria
(supervisor)
Date……………………….
……………………………
Dr.G.L. Mhehe
Supervisor
Date: ………………………………

ii
DECLARATION
I, Erasto Michael Gwimile,do hereby declare that, this thesis is my original work and that
has not been presented before and will not be presented to any other university for a
similar or any other degree award.
Signature………………………………….
iii
COPYRIGHT
This thesis is a copyright material protected under the Berne Convention, the Copyright
Act 1999 and other national and international enactments, in that behalf, on intellectual
property. It may not be reproduced by any means, in full or in part except for short
extracts in fair dealing, for research or private study, critical scholarly review, or discourse
with any acknowledgement without written permission of the Directorate of Postgraduate
Studies, on behalf of both the author and the Open University of Tanzania.

iv
ACKNOWLEDGEMENT
A single mind cannot brainstorm and achieve a supreme and scientific work of this kind
unless collective minds work jointly. This is what had happened, many people contributed
to the success of this work. It is indeed very difficult to name all of them due to the big
number. For this reason, i will just mention few of them, but this does not mean that their
contributions have been ignored the appreciations are still in touch to them continuously.
I am mostly indepted to my supervisors Dr’ J. Saria and Dr.G.Mhehe for their heartfull
guidance and endless motivation, advice and encouragement. Their supervision kept me at
high altitude towards completion of this comprehensive work. Mr. O. Ilomo and Mr. L
Mwamtobe of Chemistry Department, University of Dar es salaam, and Mr. J. Ndimbo of
Ardhi University are acknowledged for their tireless assistance during my reseach work.
Other appreciations should go to the following:
My employer, the Ilala Municipal director for allowing me to persue this study.
My staff members Vingunguti Secondary School for being tolerant during my absence.
Mr. M. Yahaya of DAWASCO headquarters (Dar es Salaam) for providing some
important information about production and distribution of safe water.
My wife Mrs. Petty Gwimile for encouraging me in all steps of this work and being
tolerant during my absence.
My personal assistant MrsLovenessChuwa for her readness to perform tasks given.
Deep appreciation should go to the creator and energizer, the Lord and Savior in heaven
without him I would not have reached this stage.

v
DEDICATION
This thesis work is dedicated to ;My beloved wife Petty B. Gwimile for her inspiration
and encouragement, and my children Gladness, Agness, Brightness, Angelina and Angela
for their strength and determination. May God bless you all.
ABSTRACT
vi
The levels of toxic heavy metals ( cadmium, lead, copper, zinc, chromium and iron) were
checked in soil, water, plant leaves, fruits and roots obtained at Vikuge in Kibaha,
Tanzania. The samples of water from the three wells were taken in triplicate, similar to the
samples of plants, fruits and roots. The samples were analyzedusing standard methods.
Majority of samples had higher levels of heavy metals than the acceptable by WHO and
Tanzanian limits. High levels were detected in vegetables compared to fruits and water
samples. In sweet potato leaves lead levels ranged from 0.85 mg/kg to 0.98 mg/kg which
is over 1500 times greater than the WHO acceptable limits (0.02 mg/kg). Highest
alarming levels for Pb in all samples ranged from 0.790 mg/kg to 1.450 mg/glare much
associated with the contamination of water around used to irrigate the plants. Water
samples had high levels of Pb ranging from 1.146 mg/kg – 1.190 mg/kg which were
about 12 times higher than WHO acceptable limits and 40times higher than the Tanzania
acceptable limits (0.100 mg/kg). The highest levels of iron in all samples determined are
not surprising as this may be from the contamination of soil and water due to natural
and anthropogenic sources.
The average of metal concentrations in vegetables i.e cassava leaves, which is commonly
used in Tanzania and Vikuge were Pb1.101 mg/kg, Cu 0.306 mg/kg, Zn 5.640 mg/kg, Cr
0.262 mg/kg and Fe 2.568 mg/kg, then if consumed as recommended the contribution of
heavy metal intake for an average human being from the vegetable diet is approximately
440.4 mg Pb, 122.4 mg Cu, 2.256mg Zn, 104.8mg Cr and 1,027.2mg/kg Fe. The mean
daily intake recommended value of these elements are 2.4 mg Cu, 8.4 mg Zn and 18.0
mg Fe. Regarding the Water Quality Parameters, the results indicated all iterms have their
values below WHO/FAO limits thus brings no health hazards.

vii
TABLE OF CONTENTS
CERTIFICATION............................................................................................................................ i
DECLARATION AND COPYRIGHT...........................................................................................ii
COPYRIGHT.................................................................................................................................. iii
ACKNOWLEDGEMENT..............................................................................................................iv
DEDICATION..................................................................................................................................v
ABSTRACT......................................................................................................................................v
TABLE OF CONTENTS...............................................................................................................vii
LIST OF TABLES...........................................................................................................................xi
LIST OF FIQURES........................................................................................................................xii
LIST OF ABBREVIATIONS AND SYMBOLS..........................................................................xiii
CHAPTERONE...............................................................................................................................1
1.0 GENERAL INTRODUCTION.................................................................................................1
1.1 Introduction................................................................................................................................1
1.1.1 Focus of study..........................................................................................................................3
1.1.2 Human Requirements.............................................................................................................4
1.1.3 The significance of the study...............................................................................................6
1.1.4 Statement of aresearch problem............................................................................................7
1.1.5 GENERAL OBJEJECTIVE..................................................................................................8
1.1.6 SPECIFIC OBJECTIVES......................................................................................................8
1.1.7 HYPOTHESIS.........................................................................................................................9
CHAPTER TWO...........................................................................................................................10
2.0 LITERATURE REVIEW.................................................................................................10
2.1 Environmental Pollution...................................................................................................10
2.2 Heavy Metals...........................................................................................................................11
2.2.1 Heavy Metals in Soils............................................................................................................12
2.2.2 Heavy Metals in Water.........................................................................................................13
2.2.3 Heavy Metals in Plants.........................................................................................................14
2.2.4 Toxicology of Heavy Metals..................................................................................................15
2.2.4.1 Lead (Pb).............................................................................................................................17
2.2.4.2 Cadmium (Cd)....................................................................................................................17
2.2.4.3 Iron ( Fe).............................................................................................................................18
2.2.4.4 Chromium (Cr)...................................................................................................................19
2.2.4.5 Zinc (Zn).............................................................................................................................19

viii
2.2.4.6 Copper (Cu)......................................................................................................................20
2.3.0 Water Quality Parameters.................................................................................................20
2.3.1 The pH...................................................................................................................................21
2.3.2 Electrical Conductivity.........................................................................................................22
2.3.3 Total Dissolved Solids( TDS).............................................................................................22
2.3.4 Hardness................................................................................................................................23
2.3.5 Turbidity...............................................................................................................................24
2.3.6 Chlorides...............................................................................................................................24
2.3.7 Sulphates................................................................................................................................24
2.3.8 Nitrates..................................................................................................................................25
CHAPTER THREE.......................................................................................................................27
3.0 EXPERIMENTAL.............................................................................................................27
3.1 Reagents and Stock Solutions...........................................................................................27
3.2 Instruments and Apparatus....................................................................................................27
3.3 Sampling, Sample Collection and Storage..............................................................................28
3.3.1 Water Sampling.....................................................................................................................29
3.3.2 Soil Samples...........................................................................................................................29
3.3.3 Plant Samples........................................................................................................................30
3.4 SAMPLE ANALYSIS............................................................................................................30
3.4.1 Physico- Chemical Parameters.............................................................................................30
3.4.1.1 Measurement of pH............................................................................................................30
3.4.1.2 Measurement of Conductivity...........................................................................................31
3.4.1.3 Determination of Total Dissolved Solids (TDS)...............................................................32
3.4.1.4 Determination of Turbidity............................................................................................32
3.4.1.5 Determination of Nitrate (NO3).......................................................................................33
3.4.1.6 Determination of Chloride...............................................................................................35
3.4.1.7 Determination of hardness of water.................................................................................36
3.4.1.8 Determination of Heavy Metals in Samples.....................................................................37
3.4.2 Analysis of Heavy Metals by Atomic Absorption Spectrophotometry............................39
3.4.2.1 Instrumentation..................................................................................................................40
3.4.2.2 Measurement......................................................................................................................41
3.4.2.3 Interferences in Atomic Absorption Spectrophotometry................................................42
3.4.2.4 Analysis and Quantification Procedures for AAS........................................................42
CHAPTER FOUR..........................................................................................................................43

ix
4.0 RESULTS AND DISCUSSION...............................................................................................43
4.1 Heavy Metal Concentrations...................................................................................................43
4.2 Heavy Metals in Drinking Water at Vikuge Village..............................................................48
4.2.1 Levels of Cadmium in Drinking Water...............................................................................48
4.2.2 Level of Lead in Drinking Water..................................................................................49
4.2.3 Levels of Copper Metal in Drinking Water.........................................................................49
4.2.4 Levels of Zinc Metal in Drinking Water..............................................................................49
4.2.5 Levels of Chromium Metal in Drinking Water...................................................................50
4.2.6 Levels of Iron in Drinking Water.........................................................................................51
4.3 Heavy Metals in Soils at Vikuge..............................................................................................53
4.3.1 Cadmium levels in soil.........................................................................................................53
4.3.2 Lead Level in Vikuge Soil.....................................................................................................53
4.3.3 Copper level in soil...............................................................................................................54
4.3.5 Chromium level in Vikuge soil.............................................................................................55
4.3.6 Iron levels in Vikuge soil.......................................................................................................56
4.4 Heavy Metals in Vegetables at Vikuge....................................................................................57
4.4.1 Level of Cadmium in Vegetables.........................................................................................57
4.4.2 Levels of Lead in Vegetables...............................................................................................58
4.4.3 Levels of Copper in Vegetables............................................................................................58
4.4.4 Levels of Zinc in Vegetables..............................................................................................58
4.4.5 Levels of Chromium Metal in Vegetables........................................................................59
4.4.6 Level of Iron Metal in Vegetables......................................................................................59
4.5 Heavy Metals in Fruits at Vikuge...........................................................................................59
4.5.1 Levels of Cadmium in Fruits................................................................................................60
4.5.2 Levels of Lead in Vikuge Fruits...........................................................................................60
4.5.3 Levels of Copper Metal in Fruits........................................................................................60
4.5.4 Levels of Zinc Metal in Fruits..............................................................................................61
4.5.5 Levels of Chromium Metal in Fruits.................................................................................61
4.5.6 Levels of Iron Metal in Fruits..............................................................................................62
4.6 Heavy Metals in Roots at Vikuge...........................................................................................62
4.6.1 Level of Cadmium Metal in Roots...................................................................................63
4.6.2 Levels of Lead Metal in Roots.........................................................................................63
4.6.3 Levels of Copper Metal in roots........................................................................................63
4.6.4 Leves of Zinc Metal in Roots...............................................................................................64

x
4.6.5 Levels of Chromium Metal in Roots..................................................................................64
4.6.6 Level of Iron in Roots...........................................................................................................64
4.7 Heavy Metals in Hay at Vikuge...............................................................................................65
4.7.1 Levels of Cadmium in Hay...................................................................................................65
4.7.2 Levels of Lead in Hay............................................................................................................65
4.7.3 Levels of Copper in Hay.......................................................................................................66
4.7.4 Levels of Zinc in Hay............................................................................................................66
4.7.5 Levels of Chromium in Hay.................................................................................................66
4.7.6 Levels of Iron in Hay.............................................................................................................66
4.8 Water Quality Parameters Results.......................................................................................67
4.8.1 pH Variation..........................................................................................................................68
4.8.2 Conductivity of Water..........................................................................................................69
4.8.3 TDS Variation in Domestic Water Sources......................................................................70
4.8.4 Turbidity................................................................................................................................72
4.8.4 Hardness Variation in Domestic Water...............................................................................73
4.8.5 Nitrate Levels in Domestic Water.....................................................................................74
4.8.6 Chloride Levels in Domestic Water...................................................................................76
4.8.8 Sulphates Levels in Domestic Water....................................................................................78
4.9 Comparison of Levels of Heavy Metals among Sample Types.............................................79
4.9.1 The Selected Heavy Metals...................................................................................................79
4.9.1.1. Cadmium...........................................................................................................................81
4.9.1.2 Lead (Pb).............................................................................................................................81
4.9.1.3 Copper.................................................................................................................................82
4.9.1.4 Zinc......................................................................................................................................83
4.9.1.5 Chromium...........................................................................................................................83
4.9.1.6 Iron....................................................................................................................................84
CHAPTER FIVE...........................................................................................................................86
5.0 SUMMARY, CONCLUSIONS AND RECOMMENDATIONS...........................................86
5.1 Summary...................................................................................................................................86
5.2 Conclusion................................................................................................................................87
5.3 Recommendations....................................................................................................................87
REFERENCES...............................................................................................................................90

xi
LIST OF TABLES
Table: 3.1 Possible Interferences in Measurement of Turbidity.........................................33
Table 3.2 interferences in AAS work and their remedies...................................................41
Table 4.1 Heavy metal concentrations (ppm) in various item understudy..........................44
Table 4.2 Average Concentration of Heavy Metals in Selected items................................46
Table 4.3 Heavy metal permissible limits in various items................................................52

xii
Table 4.4 Heavy Metal Levels (ppm) in Drinking Water (Well Water).............................52
Table 4.5 Heavy Metal Levels (ppm) in Soil from Point Source (S000)..............................53
Table 4.6 Data for Water Quality Parameters.....................................................................68
Table 4.7 Mean Value of Water Quality Parameters..........................................................68
LIST OF FIQURES
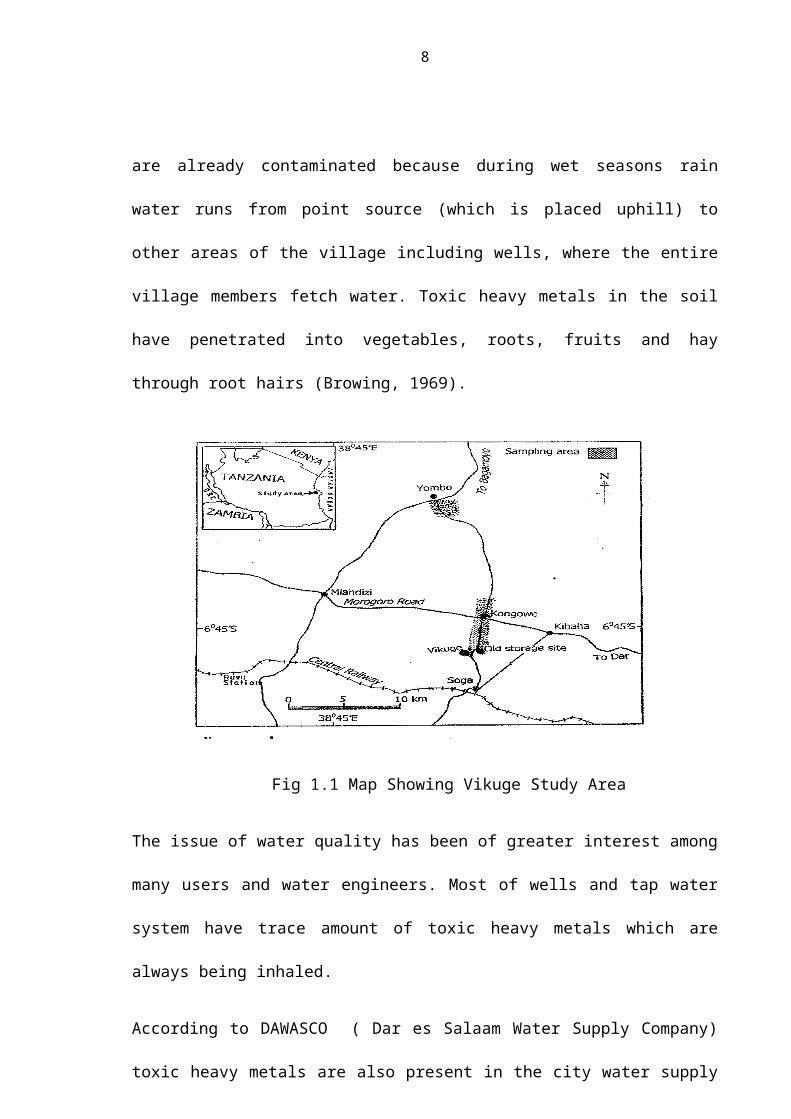
Fig 1.1 Map Showing Vikuge Study Area.........................................................................5
Fig 1.2a Domestic source of water at Vikuge......................................................................8
Fig 1.2b Domestic source of water at Vikuge......................................................................8
Fig 1.2c Domestic source of water at Vikuge......................................................................9
Fig. 2.1 The pH variation...................................................................................................21
xiii
Fig. 2.1 pH values common substances.............................................................................22
Fig. 3.1 Schematic diagram of a double – beam atomic absorption
spectrophotometry.................................................................................................................40
Fig 4.1 Histograms of concentration of iron in roots, vegetable, fruits,
Hay, water and soil...............................................................................................................47
Fig 4.2 Distribution of heavy metals in Vikuge soil...........................................................58
Fig 4.3pH Values of water at Vikuge..................................................................................70
Fig 4.4 Variation of Conductivity of Vikuge water..........................................................71
Fig. 4.5 Levels of TDS in Vikuge Water..........................................................................73
Fig 4.6 Variation of Hardness of Water...........................................................................76
Fig 4.7 Variation of nitrate levels at Vikuge water sources.............................................78
Fig 4.8 Variation of chloride levels at Vikugewatersources.............................................79
Fig 4.9 Variation of sulphate levels at Vikuge water sources......................................................81
LIST OF ABBREVIATIONS AND SYMBOLS
DSM: Dar es Salaam
DAWASCO: Dar es salaam Water Supply Company
NEMC: National Environmental Management Council
WHO: World Health Organization
TDS: Total Dissolved Solids
NTU: Nephelometric Turbidity Unit

xiv
AAS: Atomic Absorption Spectrophotometry
PPM: Parts per million
µg g-1 Microgram (10-6 g) per gram
µS cm-1 Microsiemens per centimeter
V/V Volume by Volume
W/V Weight by Volume
BDL Below Detection Limit
Mg/l Milligram per litre
UNDP United National Development Program
FAO Food and Agriculture Organization
TBS Tanzania Bureau of Standards
Mg/Kg Milligram per Kilogram
PVC Polyvinyl chloride

1
CHAPTERONE
1.0 GENERAL INTRODUCTION
1.1 Introduction
Tanzania is highly vulnerable to climatic changes among south Saharan countries. Due to
this.Varieties of crops are grown all over the country, both annual and perennial. Food
supply can be manifested in different sectors like agriculture, animal husbandry, water
quality and quantity of food as well as food habits, social security and political imbalance
(Mwandosya 1998). Social insecurity and political imbalance always result in migration
and change of living habits among the citizens as well as lack of trust to the government
(Nriagu 1988). However these and many other changes have led to poverty, hunger,
diseases and increase in mortality rate.
Water quality as an example in different parts of Tanzania has deteriorated. Pollution from
various sources has resulted in an increased frequency of water borne diseases. The
availability of water and the access to water are strongly linked to bio-diversity and human
economic development. In Tanzania the availability of fresh water is found to decrease
over half from 1990, (Sharma et al, 1996) meanwhile the quality of the available water is
questionable.
The contamination of water is mainly due to human activities; agricultural practices, for
instance, the use of fertilizers as an attempt to enhance growth and expand yields, and the
use of chemicals in treating crop diseases. On the other hand industrialization is a great
problem (Byrne 2002). Both manufacturing and mining industries contribute a lot in
environmental pollution. These reduce the quality of water. For example, thirty years ago,
people in Tanzania could drink un-boiled or untreated water and still remain safe. Today,

2
drinking water must either be boiled or treated; otherwise it is not safe due to increased
environmental pollution. The growth of human population has increased discharge of waste
effluents into lakes, rivers, streams and wells rendering them environmentally unsuitable.
The garbage accumulated in the streets of Dar es Salaam, has been proven to cause
contamination of the water which runs through the pipes network rendering it to be of very
low quality, not only to taste, smell, appearance and temperature but also due to high
number of pathogenic microorganisms as well as other contaminants including toxic heavy
metals (NEMC 2002).
Most of the researches done were based in urban areas. It has been found out that pollution
is a major problem in urban cities of Tanzania. This is due to improper treatment and
disposal of solid and liquid wastes which are the major contributors to urban area pollution.
The combined results of these problems are that both air and water have been contaminated
with pollutants, which are detrimental to human health (Cano, et al., 2006). In Dar es
Salaam, for example, less than 5% of the population is connected to a sewage system.
Where a sewage system exists, raw sewage is discharged directly into the Indian Ocean.
Apart from big cities like Dar es Salaam, periphery towns have big problems which need
attention. Mihale (2002) in his study indicated that the pesticides contamination at Vikuge
area about 64 Km west of Dar es Salaam city is at alarming level. The level is very high at
this site because of poor storage of unknown and partly expired of about 170m3 of donated
pesticides from Greece to Tanzania in 1986. Dead organisms were common on the site and
neither butterflies nor was earthworms wereobserved on the area and soil barren. This is the
evidence that pesticides still exist on the soil up to now and the remaining soil itself is a
hazardous waste. Like any other farm area agricultural activities such as growing and
processing of hay are done at Vikuge Farm and within the radius of 100 meters from the
old storage site. The area is estimated to have medium population and the water supply is
3
mainly tape water from upper Ruvu and shallow wells which are located in lowlands. The
people living in that area as well as their livestocks and other organisms, continuously
inhale the air and drink the water from the pipes which are possibly contaminated due to
secondary contamination. Probably the leaching of these pesticides goes straight to
consumers. People of Vikuge area grow food crops such as maize, rice and vegetables and
fruits on the lowland areas, for their own consumption. The land periodically becomes
flooded, particularly during the rainy seasons. The floods originate from the hilly areas
such as the very contaminated old storage site. Children also use the surface water from
ponds in the village for recreation (Charlwood, et al., 2000). Earlier studies (Enserick,
2000) has shown that free range eggs at Vikuge showed elevated levels of dioxin and high
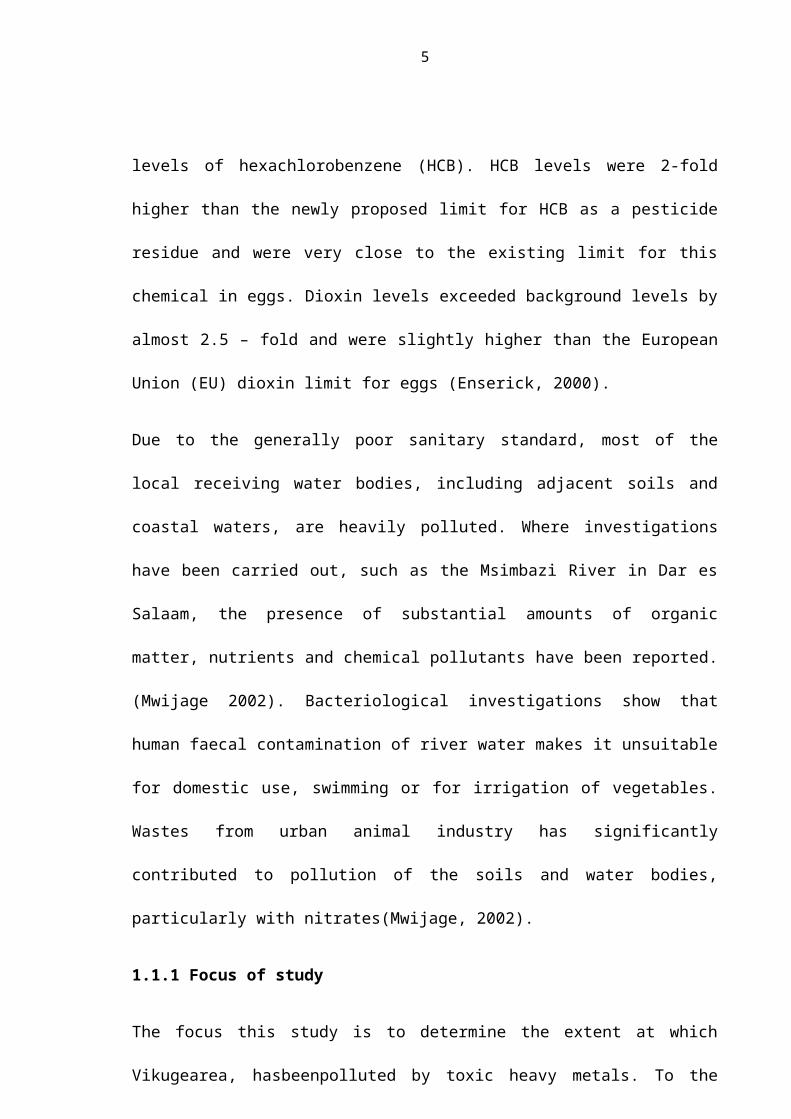
levels of hexachlorobenzene (HCB). HCB levels were 2-fold higher than the newly
proposed limit for HCB as a pesticide residue and were very close to the existing limit for
this chemical in eggs. Dioxin levels exceeded background levels by almost 2.5 – fold and
were slightly higher than the European Union (EU) dioxin limit for eggs (Enserick, 2000).
Due to the generally poor sanitary standard, most of the local receiving water bodies,
including adjacent soils and coastal waters, are heavily polluted. Where investigations have
been carried out, such as the Msimbazi River in Dar es Salaam, the presence of substantial
amounts of organic matter, nutrients and chemical pollutants have been reported.(Mwijage
2002). Bacteriological investigations show that human faecal contamination of river water
makes it unsuitable for domestic use, swimming or for irrigation of vegetables. Wastes
from urban animal industry has significantly contributed to pollution of the soils and water
bodies, particularly with nitrates(Mwijage, 2002).
1.1.1 Focus of study
The focus this study is to determine the extent at which Vikugearea, hasbeenpolluted by
toxic heavy metals. To the best of our knowledge no other research has been done on the

4
site specifically to map the extent of heavy metals and non metal pollution. Sampling area
being Vikuge village in Kibaha District was chosen to be a sampling area for the reason
that the area had stockpiles of expired pesticides being dumped there by the government
since 1986. It is assumed that, those stockpiles might have other cumulative effects apart
from pesticide pollutions. These effects are contaminations by toxic heavy metals,Fig 1.2a-
c. The release of large quantity of heavy, metals into natural environment have resulted into
a number of environmental problems.
1.1.2 Human Requirements
Though living organisms require trace amounts of some heavy metals, such as
Cobalt,Copper, Iron, Manganese, Molybdenum, Vanadium, Strontium and Zinc excessive
levels of essential heavy metals can have environmental effects on aquatic organisms and
other living things. Non-essential heavy metals of particular concern to surface water
systems are cadmium, chromium, mercury lead, arsenic and antimony (Saxena, 1987).
Themain threats to human well being are associated with Lead, Arsenic Cadmium and
Mercury. These metals together with their corresponding compounds are extremely toxic.
For example, Mercury (ii) ions combines with protein in the kidneys and destroy the ability
of kidney to remove waste products from the blood. The mining project, where the
effluents was directed to river Tigithe and Nyabigena, it was reported that, some people
and domestic animals lost their lives and others fell sick after drinking untreated water
from the said rivers (Manfred et al, 2009). The analysis was then done on water and
sediment theresultindicated high levels of some toxic heavy metals such as Cadmium(Cd),
Lead (Pb), Chromium (Cr), Nicked (Ni) and Cyanide (Cy). This could be similar to that of
Vikuge village where the expired pesticides were stored without special precaution
probably they underwent decomposition to release heavy metals found in them as
ingredients. The analysis was done on water from the wells used by the Vikugepeople,

5
toxic heavy metals such as Pb, Cu, Zn etc were seen. The analysis of the sediment could
produce similar results. This suggests that, people and animals living around this areas are
at risk. The analysis was extended to roots, (cassava), leaves (vegetables) fruits (guava) and
hey, toxic heavy metals were detected. This as well suggests that the soil and water of that
area (Vikuge) are already contaminated because during wet seasons rain water runs from
point source (which is placed uphill) to other areas of the village including wells, where the
entire village members fetch water. Toxic heavy metals in the soil have penetrated into
vegetables, roots, fruits and hay through root hairs (Browing, 1969).
Fig 1.1 Map Showing Vikuge Study Area
The issue of water quality has been of greater interest among many users and water
engineers. Most of wells and tap water system have trace amount of toxic heavy metals
which are always being inhaled.
According to DAWASCO ( Dar es Salaam Water Supply Company) toxic heavy metals
are also present in the city water supply system. These heavy metals in water have been
proved to originate from rocks through which water passes before leaching the collection
6
centers. Some rocks contain minerals which include heavy metal elements. When water
flows on them some these elements are washed away as a result they accumulate in water.
(WHO, 2002). Unfortunately, these elements are not easily be removed through ordinary
water purification process, as a result they are being swallowed.
Heavy metal pollution is facilitated by water as the main agent, this is because water has
wide uses compared to any other solvent. The contamination in both soils and crops need
water (Byrne, 2002).As the water move from highly contaminated areas (source) to the
less/not contaminated area, the pollution spreads freely. The pollutants are taken into crops
such as vegetables and fruits etc. through foliage in the form of liquid or dusts .From the
soil to the plants these elements are absorbed in the form of ions. There are a big number of
elements which may be absorbed by the plants to support their growth. The toxic heavy
metals become harmful when they enter human body especially when they exceed safe
levels (Manfred et al, 2009).
Heavy metals enter the human body though vegetables, fruits, roots and cereals we eat, as
well as the water we drink. As stated above, water being the most effective pathway of
toxic heavy metals to food web. The world’s record of large heavy metals poisoning
(mercury) took place in Minamata, Japan during the early 1960s raised a public concern
about health hazard of methlyl mercury. The poisoning was caused by the consumption of
fish that had been contaminated by industrial discharge of mercury compounds. The toxic
effects are more severe in infants both prenatal and postanatal. (Tsubaki and Irukayama,
1977).
1.1.3 The significance of the study
The significance of this study is to increase data base and educate the society near and
within the contaminated areas. Residents in the vicinity of the contaminated areas depend
7
upon the locally extracted ground water from the shallow wells, a situation which is
alarming. Although it is difficult to purify heavy metals polluted water at village level, the
community awareness about the problem is of vital importance. In this study, the
contamination of heavy metals in soil, water, vegetables fruits and roots were checked. The
heavy metals under this study were lead (Pb), copper (Cu), zinc (Zn), chromium (Cr),iIron
(Fe) and cadmium (Cd). Furthermore, the quality of water was checked against anions;
Sulphate (SO42-) Nitrate (NO3
-) chloride (Cl-) and parameters such as total dissolved solids
(TDS) and turbidity were also checked for the reason of checking the presence of toxic
heavy metals.
1.1.4 Statement of a research problem.
The toxic heavy metals such as cadmium, chromium, mercury, lead, arsenic and antimony
are threats to human well-being. The significance of this study is to increase the data base,
and educate the society near and within the contaminated areas. Residents in the vicinity of
the contaminated sites, depend upon the locally extracted ground water from the shallow
wells. These shallow wells are the primary water sources at Vikuge village.
Fig 1.2a Domestic source of water at Vikuge
8
Fig 1.2b Domestic source of water at Vikuge
Fig 1.2c Domestic source of water at Vikuge
1.1.5 GENERAL OBJEJECTIVE.
To analyze the levels of toxic heavy metals in consumable stuff at Vikuge area Kibaha
district.
1.1.6 SPECIFIC OBJECTIVES.
To determine the levels of toxic heavy metals in vegetables and fruits commonly
used by the people at Vikuge area
9
To analyze the levels of heavy metals in water, soil,vegetables, roots and fruits
around Vikugearea.
1.1.7 HYPOTHESIS
The alarming levels of toxic heavy metals are found in consumable stuff in Vikuge
area.
There is a correlation of levels of toxic heavy metals and pesticides, in consumable
goods like fruits and vegetables.

10
CHAPTER TWO
2.0 LITERATURE REVIEW
2.1 Environmental Pollution
Pollution is the action or condition of discharging harmful substances on land, air and water
disturbing the nature of them hence causing damage to the living organisms or general
ecosystem, including human being (American Heritage Dictionary, 2006). Any substance
whose addition to the environment produces a measurable effect on man or his
environment is classified as pollutant (Masteronet al, 1981). The common pollutants in this
modern world are sewage, township garbages, oil, scrappers, heavy metals, expired
chemicals, detergents etc. Unfortunately most of these pollutants will eventually
accumulate in food chain with disastrous toxic effects to human beings, animals and plants
(Daries, 1981).
The environment in which we live, has been polluted continuously by non - biodegradable
solids as a result the entire environment will soon stop supporting live if no global action
taken. The term environment refers to the physical- chemical and biotic condition
surrounding an organisms and influencing its survival and reproduction (Geldreich, 1991).
This means any disturbance in the natural environment will result in disturbing the whole
ecosystem.
In Tanzania like in many other developing countries, sources of pollution are related to
human activities, urbanization, industrialization, mining and the use of fertilizers and
chemicals in agriculture are some of the polluting activities. Population increase and
technological expansion are also other features that contribute to environmental pollution.
(NEP,1997) Various findings in this area indicate that improper treatment of disposal of
solids and liquid wastes, lack of disposing education among urban residents are other

11
contributing factors to increasing rate of environmental pollution. This is because, people
tend to throw piles of solid wastes and chemicals in liquid forms anywhere. Dissemination
of civil education is not common in developing countries, these factors result in combined
air and water pollution which is detrimental to human health. In Dar es Salaam for
example, less than 5% of the population is connected to sewage system, where a sewage
system exists raw sewage is discharged direct into the Indian Ocean without prior
treatment. While chemical discharges from human activities like mining, which contain
poisonous chemicals like mercury are discharged directly into rivers regardless of the
population which depend on that river as a domestic source of water. (Mkuula and
Mpendazoe, 2004)
2.2 Heavy Metals
Heavy metals are those metals having mass number greater than 50 and lacated above 20
in the position of periodic table. In addition, heavy metal tend to form coloured compounds
due to their ability to execise variable valencies. Some heavy metals such as arsenic,
cadmium, chromium, copper, lead, zinc, mercury, iron manganese, nickel and silver are
hazardous substances and many of them are known to act as carcinogens in animals and
presumed to have the same effects in human beings (Nriagn, 1988). Metabolic processes in
organisms do not break down these chemical substances unlike most other organic
contaminants. This means that when the ecosystem is contaminated by these chemicals, the
chemicals will persist and continue poisoning for a number of years. Similarly when human
beings or animals by any means swallow the chemicals, these chemicals will remain toxic
in their bodies for many years. Worse enough when the animals die and decay, the decayed
body will release those chemicals back to the environment.
Heavy metals are introduced into the environment mainly by urban run-off and industrial
effluents, the use of fungicides and pesticides in agriculture (particularly, copper and
12
mercury) and mining activities. The industrialized cities are most likely to be contaminated
by these chemicals where as heavy industries such as metallurgical industries, chemical
industries, textiles, cars and machine manufacturing and mining operations generate large
amounts of effluents containing toxic heavy metals. People who work in these industries
should be protected likewise these industries should not be closer to the human settlements.
2.2.1 Heavy Metals in Soils
Heavy metals are naturally component of soil.Human activities in the environment have
great impacts on soil, the entire life being dependent on soil, For many centuries human
beings have been modifying soil in order to improve its productivity. As stated earlier,
population increase and technological expansion force the increase of human activities on
soil which results in soil contamination, soil degradation and soil formation from
anthropogenic parent materials.. Soil is contaminated buy materials form air and from
direct deposition of pollutants. The accumulation of pollutants on soil has multiple effects;
the usability and the function of soil in the ecosystem especially when these pollutants are
non-biodegradable.. If the heavy metal contamination exceeds the binding capability of the
soil, there is danger that their respective compounds will flow by percolation into ground
water.(Baetz and Kenner, 1975). In most African societies, soil is termed as “capital “ thus,
people try to modify soil with care to avoid spoiling, so that it continues supporting life.
Soil contamination by heavy metals is particularly a problem because heavy metals are not
biodegradable and also they can not be eliminated permanently. Heavy metals in soils can
only be reduced by redistribution in the ecosystem or removed from circulation by
immobilization. The most serious sources of soil contamination by heavy metals are
industrial effluents, chemical production, electroplating and the production of batteries,
metal cutting and welding, mining and extractive industries and service station. Other
sources of soil contamination by heavy metals are paint and pesticide production, corrosive
13
metal wastes, metal scrappers and chemical engineering works. Most of these toxic heavy
metals occur naturally in soil, though the properties of soil such texture and pHhave
marked effects on heavy metals in soil. For example soil with course particles contains 40
to 45 percent of mineral matter, thus have relatively high proportion of heavy metals
(Uriyo, et al, c 1979).
The presence of toxic heavy metals in soil,l affects adversely the soil productivity. These
metals do affect soil natural fertility and microbial activities. It has been reported that, there
is significant relationship between the concentrations of heavy metals in water and soil.
The contamination brings about a long term risk to ecosystem because they can be
transported into the environment, and into food chain. This could pose severe
environmental threat to human beings and animals (Ak’habuhaya and Martin, 1988). On
the other hand, elevated levels of heavy metals in soils may lead into uptake by plant, in
this case the minor part, of metal pollutants which is mobile and bio- available in the soil
raises major environmental and human health concern.
2.2.2 Heavy Metals in Water
Rivers, lakes, streams estuaries and coastal areas of oceans are found to contain heavy
metals, sometimes in higher concentrations than the permissible levels.(TBS,1997) Water
contamination by toxic heavy metals is a threat to life and social welfare this is because
water is the most highly consumable item by all living organisms (TBS,1997). Thus any
pollution by these metals means life of all these organisms will be at danger. The most
dominant heavy metals found in water bodies are lead, mercury, chromium, iron and
manganese. These are toxic to fish and other aquatic organisms as well as human beings
because they usually interfere aquatic ecosystem and the ecological pyramid, to the extent
that there will be no correlation in growth and welfare. Heavy metals in water have been
proved to originate from wearing of rocks through which the water passes (DAWASCO,
14
2O11). Not only rocks being sources of contamination but any medium available between
the source and the consumption.Water pipes sometimes become sources heavy, eg lead
pipes may wear out causing lead contamination passing through it if not changed
periodically. Similarly if wells are bored in or around the contaminated area, automatically
the water will be contaminated.
2.2.3 Heavy Metals in Plants
Plants and parts of plants may be contaminated by heavy metals from various sources such
as contaminated soil.Heavy metals pass into leaves from the contaminated soil through root
hairs as the agent of plant feeding. The consumable leaves such as hybridus, cabbage,
tomatoes, sweetpotato leavesetc, to humans being and hay for domestic animals are easily
contaminated.(Bahemuka, 1995).
Vegetables require varying amount of essential elements such as potassium and calcium in
soil, water and may attain up into 100mg/Kg level. Boron and manganese need to be
present only at about 0.5ppm. while(1- 2) mg/Kg is indicted for molybdenum (Bahemaka,
1995). The range of tolerance for nutrients like copper, boron, molybdenum, manganese
and zinc is quite narrow. Fortunately, the concentrations of essential elements may vary
over a considerable range without greatly altering plant growth and yield. Therefore plants
contain a wide range of concentrations, both essential and toxic elements. Plant roots
absorb relatively less of an element when it is present in high concentration, this is called
equalizing behavior and explains why plants tend to grow equally well over quite a range
of concentrations of various essential elements (Christensen,1987). Elements may enter the
root system by one or a combination processes. In the process of active absorption, the
absorbed ions enter the vacuole or cell sap and for most part tend to remain in vacuoles.
Therefore, the concentrations of various ions may be many times the concentrations of the
same ions in the external solution. Another process is the translocation, one where there is a
15
movement of ions from roots to other parts of the plant. There are several factors which
affect the rate of translocation of the absorbed ions. These include the pH of the medium,
transportation, species of plant and organic molecules. Industrial emissions to the
atmosphere, disposal of wastes on land and certain agricultural practices such as use of
pesticides can lead to a significant increase of metals in plants. Vegetables can absorb
heavy metals from soil through irrigation, fertilizer and manure application, deposits of
parts of vegetables exposed to the polluted atmosphere as well as foliage application. The
extent of heavy metals uptake by plants depends upon many things which include, the
nature of the concentration of the metals in the soil and the soil pH. Metals such as lead,
cadmium and mercury are reported to be exceptionally toxic.(Mwijage, 2002)
When soil of a certain area is contaminated by heavy metals, the plants of any kind grown
in that area are likely to be contaminated because they absorb ions from the soil as part of
their nutrients; as a result the leaves/ vegetables and their corresponding fruits are as well
contaminated. Thus when this happens, human beings and animals are in danger as they
consume these items.
2.2.4 Toxicology of Heavy Metals
Toxic metalseg lead,cadmium,iron,zinc,manganese,chromium etc. are often called “Heavy
Metals” Their corresponding compounds have similar behavior that pose human health
risks. They are very common in areas where water bodies receive sufficient amount of acid
rain or localities of low soil pH. Increased acidity of water, renders metals more soluble
which in turn they are absorbed by plants and aquatic organisms, eventually eaten by
human beings and animals of all species.(WHO,1984). Generally, heavy metals are
dangerous and toxic in the form of their ions (although elemental mercury in vapour form
is highly toxic) and also when bonded to short chain carbon atoms. The mechanisms of
their toxic action arise from the strong affinity of the metal cation to sulphur. Thus

16
“sulphurhydril” groups which commonly occur in the enzymes in the human body, to
readily complex themselves to ingest heavy metalcations or to molecules that to ingest
heavy metal atoms. The resultant metal- sulphurhydril bonding affects the entire enzymes
behavior and it can not act normally, thus the human health is adversely affected and
sometimes fatally. The reaction of heavy metals cations M2+ or M3+ where M=Cd, Cu, Cr,
Fe, Pb and Zn with the sulphurhydril units (R-S-H) in enzymes produce stable systems
such as R-S-M-S-R is analogous to the reaction of the metal cation with simple inorganic
substances, with which they yield an insoble solid MS
M2+ + H+-S-H MS(S) + 2H+
R-S-H + M2++H-S-R R-S-M-S-R + 2H+
For example the behavior of glutathione (a tripeptide of glutanic acid and glycine)
occurring in most tissues with metals illustrates the interaction of a heavy metal ion with
sulphurhydril groups. The metal ion replaces hydrogen in the sulphurhydryl groups on
adjacent molecules and a strong bond results which effectively eliminates two glutathione
from further reaction (Baetz, 1975). Glutathione is involved in maintaining healthy red
blood cells.
2Glutathion + Metal ion (M2+) M(Glutathion)2
Among heavy metals, the most devastating forms are the ones that cause immediate
sickness or death (e,g. a sufficient large dose of mercury vapour) where therapy cannot
exert its effects in time and those which pass through the membrane protecting the brain
(the blood/brain barrier) or that protect the development of the foetus. Some heavy metals
e.g. mercury become more toxic when an alkyl group is attached on them. This is because
many such compounds are soluble in animal tissues and can pass through biological
membranes. (Berman 1988) The toxicity of the selected heavy metals is discussed below:-

17
2.2.4.1 Lead (Pb)
Lead has been used in ancient plumbing systems including those designed to transport
water in cooking utensils, glazed earthenware, ceramic dishes and lead based paints. Lead,
like cadmium, tin, antimony and mercury, when taken into the body it accumulates and
leads to lead poisoning since there is no known good mechanism for removal of lead. In its
mild form lead poisoning causes process nervousness and mental depression, and in more
severe cases it leads to permanent nerve, brain and kidney damage (Berman 1989). In
adults severe symptoms are caused by 0.4 mg/Kg of lead in the human blood. It is also
known that, lead poisoning impairs biochemical reactions intended to produce the iron –
containing hemegroup in haemoglobin i.e.it impairs hemesynthesis. This is through
blocking the sulphurhydryl groups in the heme biosynthetic pathway of enzyme B-
aminolevulinic acid dehydratase (ALAD) whose activity is subsequently inhibited. Lead is
also dangerous to children and pregnant women as it can impair child’s mental and
physical development reducing a baby’s birth weight and cause premature birth. Prolonged
exposure to increased lead levels can also cause aggressive behavior, hyperactivity and
learning problems in children. In adult, increased levels have been linked to high blood
pressure and hearing damage. Serious lead poisoning can lead to blindness, brain damage
and mental retardation (Calderon,1969).
2.2.4.2 Cadmium (Cd)
Cadmium is a highly toxic metal with no known functions in animal metabolism. Its half-
life in the human body is 10 – 30 years. Cadmium poisoning is therefore cumulative.
Cadmium is also inhibitor of the sulphurhydryl moiety in enzymes and has affinity to other
liquids in cells such as hydroxyl, carboxyl, phosphyl, cysteinyl, and histidyl side chain in
protein, purines and porphyrins. Some symptoms of cadmium poisoning (after some few
hours of exposure) include dryness of throat, a sense of constriction and difficulty in

18
breathing, headache, vomiting and muscle cramps. Placental destruction, fetal death and
severe malformation of the body can result from high doses of cadmium (Calderon,1993).
The symptoms of chronic cadmium poisoning include emphysema (of the lungs), mild liver
damage, anaemia and impairment of sense of smell. Like lead, cadmium is also frequently
encountered in drinking water. Though the metal itself is insoluble in water but the ability
to form ion (Cd2+) makes it partly soluble thus brings about severe poisoning. This is to say
drinking water should be treated before use.
2.2.4.3 Iron ( Fe)
Iron is a very essential element to all living organisms. In most cases, it is bound to protein,
both a porphyrin or heme compound (haemoglobin and myoglobin) and to a lesser extent
as a non-heme protein bound in compounds (Jones, et al 1983) e, g. ferritin, transferring
and hemosiderin.
The heme pigments,haemoglobin in erythrocytes and myoglobin in muscles function as
oxygen carrier and heme containing enzymes such as the cytochromes in mitochondria are
concerned with electron transport system in the generation of ATP molecule (Jacobs and
Wormwood, 1974). Non-heme iron containing proteins are also known. These include
enzymes such as aconitase which is involved in the citric acid cycle (TCA). Succinic acid
dehydrogenase and NADH dehydrogenase that is concerned with iron transport and the
xanthine oxidase involved in uric acid metabolism. Excess iron in the body has been
reported to be toxic (Berman, 1989) however the poisoning is rare in adults but common in
young children. The normal iron intake for children is 10- 30ppm and acute poisoning can
occur followings ingestion in excess of one gram of iron sulphate. The symptoms of iron
poisoning include nausea, vomiting due to gastoinstestinal irritation and necrosis. There
may be pallor, drowisiness and diarrhea, shock and cardio-vascular collapse may follow,
and death has been reported within six hours after intake (Hunt, 1989)
19
2.2.4.4 Chromium (Cr)
Chromium forms compounds which are carcinogenic, the routes of absorption are
inhalation and precutaneous through broken skin. Its toxic action is by irritation, corrosion,
sensitization and carcinogenicity. Acute toxicity causes damage to the cardiovascular
organs, kidney, liver and nervous system. A higher rate of bronchitis, renal damage and
increase in pulmonary malignancy have been reported among the people employed in the
chrominate works.The chronic adverse health effects are respiratory and dermatology.
Ordinary drinking water contains 0.1-0.2mg/Kg which in turn requires elimination(Hunt,
1989).
2.2.4.5 Zinc (Zn)
Zinc metal has wide industrial uses, thus its demand is high. The broad use and high
demand is due to its ability to resist corrosion. The most ancient use of zinc was the
manufacture of bronze and brass.
In the human body, there are zinc dependant enzymes such as alkaline phosphate, aldolase,
dehydrogenase, carboxy, peptidase, carbonic anhydrase and lactic acid dehydrogenase.
(Prasad and Charles, 1996). Zinc is not a cumulative poisoning. The toxic effects
encountered are suspected to have been caused by the presence of other metals such as
cadmium, lead, antimony and arsenic. The acute intoxication due to zinc poisoning is
manifested by severe anaemia, fever, dehydration, electrolyte imbalance, dizziness,
lethargy, muscular in-coordination, gastrointestinal systems malaise, depression, coughing
which might include vomiting, salvation and headache (Berman. 1989). All these have
been reported to occur within 20 minutes or be delayed for as long 12hours after ingestion.
Toxic quantities of zinc can also be brought in to solution when acidic beverages are
prepared or stored in galvanized utensils. A normal adult body contains 1.4- 2.3g of zinc.

20
2.2.4.6 Copper (Cu)
Copper is the second best heat conductor after silver,this is the reason why it widely used in
the manufacture of electrical cables.It is also resistant to corrosion even by acidic foods,
that is why it is used in the manufacture of household utensils. Copper is normally
incorporated in pots and pans to enhance heat conduction efficiency. In trace amount, it is a
useful element in human metabolism. The body of an adult human being is said to contain
approximately 100mg of copper. This amount is distributed to play the function
incorulaplasmin, a glycoprotein synthesized exclusively in liver. A copper deficient diet
produces anaemia because coruloplasmin promotes the release of iron from the liver in
order to form the iron blood protein transferring necessary for haemoglobinbiosynthesis
(Hunt, 1989). Other copper metalloproteins include cytochorome oxidase, tyrosinase,
monoamine,oxidase, superoxide dismutase andlysyl oxidase. However copper in the body
is toxic. It normally affects liver and cause Wilson’s disease. Thalassemia
(mediterraniananaemia), hemachromatosis and carcinoma have also been reported.
2.3.0 Water Quality Parameters
Maintaining water quality is of vital importance as water intake in human body is as
frequent as any other item into the body. This is to say, if the dependable drinking water
has been polluted, the health hazards inevitable. Water being universal solvent it has many
importance in living organisms and in environment. Examples of the importance of include
the following;
Blood plasma is an aqueous solution containing a variety of life supporting substances.
Inhaled oxygen dissolves in blood plasma in the lungs where oxygen combines with
haemoglobin.
In the use of medicine in treatment to both animals and human beings, water is
inevitable

21
Cleaning, washing and waste disposal need water.
Agriculture practices need quality water for quality crops.
2.3.1 The pH
The pH is the measure of hydroxonium ion concentration in a solution. It expresses the
intensity of the acid or alkali condition of a solution. It is a strong determinant of the
solubility and availability of both nutrients and pollutants. Therefore, it is a very important
measure of the quality of water. The pHisusually measured by an instrument called
pHmeter, the values range from 0.0 to 14.0. For our health, we normally need pure water,
this pure water has a pH = 7.0 and it is neutral (Holden, 1970) if the water has apH value
below 7.0, it is acidic while that above 7.0 is alkaline/basic. It is practically certain that any
water with a pHless than 7.0 is acidic and will be corrosive, but it does not necessarily
follow that the water pHabove 7.0 will be free from corrosive properties.
The pH of water is critical to the survival of most aquatic plants and animals. Many species
have trouble surving if the pH drops under 5.0 or rises to above 9.0. Changes in pH can
alter other aspects of the water chemistry, usually to the detriment of the native species.
Even small shifts in water pH can affect the solubility of some metals such as Fe and Cu.
Human activities can cause large short term changes in pH or long term modification of
water bodies are exceedingly harmful for instance; algal blooms that are often initiated by
an overload of nutrients can cause pH value to fluctuate dramatically over a few hour
periods, greatly stressing local organism.(Dahi and Jens, 1992).
Fig. 2.1 The pH variation
Natural water is typically slightly acidic, with pH value about 6.0. This is actually the water
we mostly drink and foods.
Acid rain and fog
1 2 3 4 5 6 8 9 10 11 12 13 14 7
Normal rain
Milk of MagnesiaBlood
Pure waterMilk Lemon JuiceTomato Juice
22
Fig. 2.1 pH values common substances
2.3.2 Electrical Conductivity
Electrical conductivity of water is the ability of water to conduct an electric current. It is
affected by the presence of dissolved inorganic solids such as chlorides, nitrates, sulphates
and phosphates as anions or sodium, magnesium, calcium, iron and aluminium as cations.
The flow of electric current always involves the transport of electric charge. Therefore if
water conducts electricity, it means it contains electrically charged species. This kind of
water is not safe it is detrimental to human health as well as animals (Dahi and Jens 1992).
Organic compounds like oils, alcohol or sugar, when in water have low conductivity as
they do not conduct electricity very well.
A significant change in conductivity could then be used as an indicator for a discharge or
some other sources of pollution entering water bodies for example, a failing sewage system
would rise the presence of chloride, sulphates, phosphates and nitrates, while oil spills
would lower the conductivity (APHA,1992).
2.3.3 Total Dissolved Solids( TDS)
The total dissolved solids refer to the materials left over in a vessel after evaporation of a
filtered liquid sample and the residue dried to a constant weight at a temperature
of( 1800C+ 20C) and it is expressed in milligram per litre (mg/l) (McFeters 1990). This

23
may cause foaming or corrode some metals. The quantity of TDS in a body of water
depends upon several factors, including precipitation contributing to the withdrawal of
TDS from the body of water, the type of soil and rock that water passes over and human
activities. The major dissolved substances found in water that can cause the above
problems are positively charged ions of sodium, calcium, potassium, magnesium and iron
and the anions such as carbonate, bicarbonate, chloride, sulphate and nitrate. Water with
extremely low TDS levels may on the other hand also be unacceptable because of its flat
and insipid taste, odour and affect on corrosion or encrustation in distributive system.
(APHA,1992).
2.3.4 Hardness
Water hardness is a property commonly reported in drinking water supplies. Hard water
contains calcium, magnesium and occasionally iron ions. In water they form chloride,
bicarbonate and sulphate compounds. Ca2+ and Mg2+are present in hard water at high
concentrations. Although they cause no health threats but their presence can attract other
toxic materials e, g. Fe2+ if not removed timely. Water containing Ca2+ can form a hard and
insoluble deposit of calcium carbonate (CaCO3 in water heaters, cooking ware, pipes and
industrial equipment (Dahi and Jens, 1992).
Ca2+(ag)+ CO3
2-(ag) CaCO3(s)
Thus a hardness of 10ppm indicates that 10mg of CaCO3 would be formed from the CO32-
presentin 1 liter of water. the source of hard water is the limestone rock, which is
composed of calcium carbonate or a mixture of calcium carbonate and magnesium
carbonate. Generally hardness of water indicates that, water has been contaminated, this
decreases the quality of it (WHO,1985).

24
2.3.5 Turbidity
Turbidity refers to cloudy appearance of water, which is caused by the suspended
materialsl/particles, erosion, run off and discharge. Turbid water contains particles that are
too small to be seen without magnification but they produce effects that can be detected
with the human eye because they scatter light. The particles may include clay, asbestos,
bacteria, viruses, debris from plants and animals,biocolloids which include proteins and
complex carbohydrates for plants and corrosion products such as rusts, lead and copper
oxide. There is a high turbidity of water at consumer outlet taps compared to the point of
intake into the distribution systems and this may indicate post treatment contamination and
corrosion. Consequently an excessive turbidity can protect microorganisms from the effects
of disinfection and sometimes stimulate the growth of bacteria in the water. Also turbidity
can cause the staining of sinks and fixtures as well as the discovering of fabrics(Greenberg
et al, 1985).
2.3.6 Chlorides
Inland, natural water in general has low concentration of chlorides, often less than that of
carbonates and sulphates. However saline waters, coastal estuarine and sea water are
characterized by moderate to very high chloride content. In natural fresh waters, high
concentration of chlorides is considered to be an indicator of pollution due to organic
wastes of animal origin (animal excreta, especially human excreta has high quantity of
chloride along with nitrogenous wastes). Industrial effluent may also increase the chloride
concentration (Calderon, 1993).
2.3.7 Sulphates

25
Earthly impurities may sometimes contain sulphates which are soluble in water. water,
(APHA, 1992). The bad thing is that metals such as Cu2+ and Fe2+ which are toxic may be
found together with sulphate/sulphite as earthly impurities at trace amount. Generally,
inhaledsulphate may lead to cancer and other body abnormalities. Thus any trace of
sulphates in water especially drinking water must be eradicated (APHA, 1992).
2.3.8 Nitrates
Nitrates associated with organic pollution, are the final products of the oxidation of organic
compounds. Surface or ground waters which receive organic pollution from sewage
discharges or on site sanitation systems may show high nitrate levels. A high concentration
of nitrates can also be an indicator of added faecal pollution and /or a sign of continuing
pollution. Nitrate concentration over 45mg/l in drinking water is potentially hazardous to
health. It is reduced in the body to nitrite and can cause a serious blood condition.
in infants below 6 months of age, particularly if their diet is not rich in vitamin C, resulting
in condition known as methaemoglobinaemia (infantile cyanosis or blue baby syndrome).
Methaemoglobianemia results when the amount of methemoglobin in blood becomes high
enough to manifest clinical symptoms of cyanosis (ie a bluish colour in the skin and lips is
produced) usually 15% of total circulating haemoglobin (Holden, 1970). Methaemoglobin
is formed when Fe in the heme molecules is oxidized from the ferrous (Fe2+) to ferric state
(Fe3+) and is unable to deliver oxygen. However methaemoglobinemia occurs for various
reasons including exposure to oxidant drugs and chemicals such as nitrite. Infants below
6months of age are particularly susceptible to methaemoglobinemia because they have
lower amount of the key enzymes, NADH- cytochrome b5reductase
(methaemoglobinreductase) which converts methaemoglobin back to haemoglobin (APHA,
1992).It has also been suggested that, very high nitrate concentrations may be implicated in
the cause of gastric cancer. Nitrite produced by the reduction of nitrate, reacts with amine

26
and amide in the stomach to form nitrosamines and nitrosamides, respectively which have
shown to include human gastric cancer. Several epidemiological studies have shown a
relationship between high NO3 intake and human gastric cancer (Dahi and Jens, 1992).

27
CHAPTER THREE
3.0 EXPERIMENTAL
In this chapter, all the steps leading to experimentation are discussed. Sampling
methodology and experimental procedures/techniques which include, storage, experiments,
reagents and equipment are described.
3.1 Reagents and Stock Solutions.
The following reagents and stock solutions were made readily available; Anal glacial acetic
acid (assay 99.5%w/v, density 1.048 – 1.051gcm-3 at 2000 C ), acetylaldehyde (assay 99%),
lead (II) nitrate (assy 99%) iron (III) sulphate (assay 98%), Potassium chromate (assay
97%), buffer tablets for pH4 and pH 7, sodium hydroxide (pellets 96% pure), anal nitric
acid (assay 95% density 1.4 g/cm3), phenolphthalein solution (1%; indicator reagent),
sodium sulphate (Na2SO4), dichloromethane (CH2Cl2). cyclorohexane/acetone mixture
(CH3COCH3), methyl acetate (CH3COOCH3), ammonium chloride (NH4Cl), Ammonia
solution (NH4OH), ethyl acetate (CH3CO2CH2CH2), EDTA, potassium nitrate (KNO3),
hydrochloric acid/sodium chloride (HCl/NaCl), NH4SO4, and distilled water (H2O) which
was made available and used to all those reagents which needed dilution.
3.2 Instruments and Apparatus
Thermometer, mortor and pestle E- flask, rotary evaporator, Bunsen burner, test tube, pH-
meter, conductivity and TDS meter (Pw-9526 Philips digital Conductivity/TDS meter),
volumetric flasks, beakers, Atomic Absorption Spectrophotometer (AAS), UV
Spectrophotometer, Muffle furnace, HACH- kit of model DR/820, DR/850 and DR/890.

28
filters of diameter 47mm. Elmer model 300 for heavy metals determination and a Sartorius
basic digital balance model B-1025 for analytical weighing.
3.3 Sampling, Sample Collection and Storage
Polythene bags and plastic bottles were used to store those samples in dust-free area in the
laboratory awaiting for digestion. The physical samples collected from the sampling area
were as follows;soil samples collected at varying distances, three point sources located
were considered and from each point, three samples were collected. Each sample weighed
about 250 g. Animal feed (hay) was as well collected at varying distances. Leaves
(vegetables)such as sweetpotato leaves and cassava leaves were as well collected in the
same way. Fruit samples were the guava, these were abundant in the area and mostly loved
by children. The root samples collected were the cassava which is very common in the area
complementing the staple food. Water samples were taken each in one litre plastic bottle
from the three shallow wells used by Vikuge people as domestic source of water. From
each well three samples were collected. Samples of soil, water, leaves (vegetables) hay,
fruits and roots were collected in triplicate. Since all of those samples were intended to
check the presence of toxic heavy metals, therefore all the devices used in the collection
together with their containers were not of metallic origin. Gloves were used to avoid direct
handling that could affect the net results. All samples except water samples were pre-
cleaned to wash away the earthly impurities.
The choice of these items was based on the facts that , they are highly consumed by the
Vikuge village members. The two wells of water in the village which are situated about
500 m away from the point source are the only source of water in the village.Other items
are as well of high demand (larger portion of the population of the village rely on them as
foodstuff or complementary). These are cassava, sweetpotato leaves and cassava leaves

29
where as guava are consumed mainly by children and hay plants are consumed by domestic
animals such as cows, goats and sheep.
3.3.1 Water Sampling
Beakers were used to transfer water from sampling source to sample bottle. After the
beaker was used several times with the samples, care was taken to discard by washing and
rinsing with fresh sample collected from the same distance. The sampling distances were
100 m, this was for all samples. The sample was finally acidified with 4 M nitric acid
(5ml). The acid was transferred into a clean dry bottle rinsed with 4M nitric acid (5ml). The
acid suppresses hydrolysis of aquocation which otherwise could form hydrated hydroxo
and oxo species which tend to stick to the surfaces leading to negative ion. Then the bottle
was tightly stoppered ready for transportation to the chemistry laboratory at the University
of Dar es Salaam. Standard sampling procedures (Agramund et al, 2005) were adhered to
as to arrive at as representative sample as possible. Additional confirmatory sampling
activity was performed on the site to take care of the water quality variation, wherever
possible. For water bodies best results are achieved by withdrawing samples below the
surface. The surface water film is said to be enriched in heavy metal contaminants. In this
sampling activity, this condition was observed.
3.3.2 Soil Samples
Soil samples were collected from a depth of 10- 15 cm below the surface as recommended
by (Khanet al, 1981). The procedure was done to obtain the representative soil samples.
These samples were randomly collected within the radius of 500m from a point
source.Each sample was collected at an interval of 100 m from each other. From the point
source four directions were considered i,e east, west, north and south. Care was taken much
30
in this area assuming pesticides had its effects on it since it is being spread all over the soil.
This is because the pesticide point source was found to be at relatively uphill this resulted
into the spread to the outside area during rainfalls.
3.3.3 Plant Samples.
Plant samples includes all those samples of vegetables (sweetpotato leaves and cassava
leaves) and hays, fruits (guavas) and roots (cassava). These samples were transferred from
the field (sampling area) to the laboratory in tightly and secured plastic bags. In the
laboratory the plants were washed to free them from adhering dirty and allowed them to
air-dry. Each set of plant samples i, e. the vegetables, hays, roots, and fruits were
subdivided into small components ready for digestion followed by analytical procedures.
For plant samples, sampling distances/interval remained the same as for other samples
which was 100 m.
3.4 SAMPLE ANALYSIS
3.4.1 Physico- Chemical Parameters
The physico – chemical parameters which were stipulated in this study with respect to
water are: pH, conductivity, total dissolved solids, hardness, turbidity, chlorides, sulphates
and nitrates. Water is a good representative object at a given physical environment,
because it can reflect the characteristics of other objects like soil and plants, provided the
water is locally extracted (ground or well water). All living things need water and soil for
their survival. Thus knowing the quality of water and soil is of vital importance. Once
water is contaminated then health hazards to human beings and animals are inevitable
because at village level people are not aware with water treatment.
3.4.1.1 Measurement of pH

31
The pH of samples was measured using a Kent EIL 2020. pH meter which was calibrated
with standard buffer solutions of pH= 4 and pH= 7 making adjustment for the temperature
and the symmetry potential required for the instrument. The electrode was removed from
the buffer and rinsed with the sample and adjusting the pH meter to the temperature of the
sample. The pH of the sample was then recorded. The electrode was rinsed with distilled
water between successive measurements and rechecked against the standard buffer to
ascertain the validity of pre- calibration ( Holden, 1970).
3.4.1.2 Measurement of Conductivity
The conductivity or specific conductance is a measure of the capacity of an aqueous
solution to convey an electrical current and depends solely upon the total concentration of
the ionized substances in water, mobility and the magnitude of the charge of the ionized
species and on the pressure and temperature at which the measurement is
made(Lechevallieret al, 1981). The nature of the dissolved substances, their actual and
relative concentration and the ionic strength of the liquid sample will all affect the specific
conductance (Greenberg et al, 1985). Since electrical current is carried in solution by
migration of ions, the conductivity under standard conditions may be expected to bear
some relationship to the total ion concentrations. The unit of conductivity is micro Siemens
per centimeter (µScm-1) Specific Conductance is denoted by a symbol, K given by the
expression.
K= C/R Where
C= a constant determined by the geometry of the cell
R= is the resistance of a conducting substance.

32
The conductivity meter was calibrated according to the cell constant 0.690 which was set at
a temperature of 250C. About 100mls of water sample was transferred into a beaker of a
capacity 200mls and stirred- the conductivity cell was then immersed and the readings were
taken.
3.4.1.3 Determination of Total Dissolved Solids (TDS)
Total dissolved solids refer to the materials left over in a vessel after evaporation of a liquid
sample and the residue dried to constant weight at 180 0C+ 20C. The total dissolved solids
is expressed in grams per liter (g/l).
Experimental Procedure
100 m/l of the sample was filtered through a fitter paper and the residues were washed with
distilled water. The filtrate was evaporated to near dryness in a pre- weighed 200mls beaker
containing boiling stones. Drying was completed in an oven at 1800C+ 20C for 3 hours,
then cooled and weighed to a constant weight (McFeters, 1990).
3.4.1.4 Determination of Turbidity
Turbidity reflects the amount of suspended solids in water. It is an optical effect stated in
turbidity units of dispersed particles. High levels of turbidity can protect microorganisms
from the effects of disinfectants, stimulate the growth of bacteria and exert significant
chlorine demand (Parker, 1999).
Experimental Procedure
The determinations were performed using HACH kit procedures (HACH, 1997) as follows:
Calibration of the Instrument

33
The instrument was calibrated by taking 10mls of deionizer water (the blank) in a sample
cell. The dry (wiped wit tissue paper) sample cell was placed into the cell holder. The
sample cell was tightly covered with instrument cap. The instrument was zeroed to display
ONTU note INTU= IFAU.
Analysis
The sample (10m/l) was thoroughly mixed before transferring to the instrument (HACH
kit cell holder) the sample was placed into the cell holders and was lightly covered with
instrument cap. The readings were then recorded in NTU. The sample cell was rinsed with
demonized water followed by several rinses with the sample (which was going to be
analyzed) before performing the next measurement.
Table: 3.1 Possible Interferences in Measurement of Turbidity
Interfering Substance Interference levels and treatment
Air bubbles Interfere at all levels. Degass samples using the degassing kit
or an utrasonic bath
Colour Interferes if the colour absorbs sight at λ=520nm
Temperature May interfere by changing the turbidity of the sample
Extremes Analyse as soon as possible after collection.
Analyse at the same temperature.
3.4.1.5 Determination of Nitrate (NO3)
The cadmium reduction method using HACH powder pillows was used in the
determination of nitrate. The determination is in the high range interval (i,e. 0-30 mg/L
34
NO3-N) (HACH, 1997) Nitrate is reduced almost quantitatively to nitrite in the presence of
cadmium sulphate treated with zinc rods. The nitrite produced is determined by diazotizing
with sulphanilamide and coupling with N- (Naphthyl)-Ethylenedianine (NEDD) to form
hightlcolouredazo dye that is measure calorimetrically. A correction may be made for any
nitrite present in the sample by analyzing without the reduction step.
Experimental Procedure for Determination of Nitrate
Preparation of reduction column: A glass wool plug is inserted into the bottom of a
reduction column and the column is filled with water. A sufficient amount of cadmium
granules are added to produce a column of 18.5 cm long. The water level is maintained
above cadmium granules to prevent the intrapment of air. The column is washed with
200mls of dilute NH4Cl- EDTA solution. to activate the column, 50mls of KNO3 solution
which contains 1µg per ml (ie 1.0 ml = 1µgNO3) was passed through the column after the
addition of 5 mls solution of dilute NH4Cl – EDTA at the rate of 7-10mls per minute. If the
column is not in use, it is rinsed with 50 mls of dilute NH4Cl –EDTA solution. The
cadmium column is stored in this solution and never allowed to dry.
Calibration and Analysis of Nitrate
Calibration Curve
A series of standards of concentrations ranging from 0.05 mg/l to 1.0 mg/l were prepared.
To 50 mls of standard, 5 mls of dilute NH4Cl- EDTA solution were added and mixed
thoroughly. The mixed solution was poured into the column and allowed to flow at the rate
of 7-10mls per minute. The first 25mls were discarded to rinse the column with distilled
water after each run for better results. As soon as possible (not more than 15minutes after
the reduction 0.5 mls of the collected sample. The reagent was left to react for about 5
minutes. Then 0.5 mls of NEDD reagent was added and mixed immediately. After 10mls
and not later than 2 hours the absorbant was measured at 543 nm with a UV

35
spectrophotometer against water reagent as a blank using a 1cm cell.(Skoog and West,
1982).
Sample Analysis
If the turbidity of suspended solids are present in the water sample, they can be removed by
filtering using a 0.4nm pore diameter membranes although they are very expensive, or by
glass fibre filters or any other filtration materials which can filter the sample properly. With
the pH adjusted between 7 and 9 by either HCl or NaCl. The sample is then treated in a
similar way as standards. The concentration of the sample is directly computed from the
standard curve (Perkin 1984)
3.4.1.6 Determination of Chloride
This anion was determined titremetrically using classical wet techniques as described in the
literature (Saxena, 1987).
The mohr method was used for the determination of chloride concentration in the water
sample.
Ag+(aq) + Cl-(aq) AgCl(s) (White)
2Ag+(aq)+ CrO4
2-(ag) Ag CrO4(s (Red)
In neutral or slightly alkaline solution, potassium chromate can indicate the point of Silver
nitrate for chloride. Silver Chloride is precipitated quantitatively before silver chromate is
36
formed. Employing a mixture of AR potassium chromate – dichromate in the ratio of 6:1 as
indicator enhances the sharpness of the end point.(Perkin 1984)
Experimental procedures
A 10mls water sample was transferred into a conical flask and 5-6 drops of potassium
chromate indicator added. On turning yellow the sample in the conical flask was titrated
against a silver nitrate solution until a persistent brick red colour appeared (end point)
(APHA 1992). The chlorine concentration in the sample was then calculated using the
following formula.
Chloride ( in mg/l) = V x N x 35.457 x 1000/S
Where V = Volume of the titrate (ml)
N = Normality of the titrant
S = Volume of the sample.
3.4.1.7 Determination of hardness of water
Dissolve about 10g of soap in 50 mls of ethanol (CH3CH2OH) dilute with water up to 100
mls.
This is a standard soap solution.
The volume of standard soap solution, needed to give a permanent lather with a known
quantity of the sample of hard water is found.
Experimental procedure
A known volume of water was titrated with an ethylenediaminetetraacetate (EDTA2-)
solution. 0.01 M of (EDTA2-) was used.

K1
K6 K5
K3
37
Ca2+ (aq) + EDTA2- (aq)……………………………………………………………CaEDTA
(aq)
A solution of EDTA2-was slowly added to a sample of water until the indicator in solution
changed colour from purple to colourless. This reaction indicates that, there were Ca2+ions
in water sample which has completely reacted with EDTA2- ions. According to the equation
above, the completion of the reaction have attained after equal number of moles of Ca2+
ions have reacted with equal number of moles of EDTA2-.
Since the hardness of water is expressed as the presence of Ca2+ and Mg2+ ions in water,
thus the above reaction indicates that the sample of water used in this reaction was hard.
3.4.1.8 Determination of Heavy Metals in Samples
Soil sample (10g of air dried soil sample) was placed in an Erlenmeyer flask 20ml of
extracted solute were added (0.05M NH4C1 + 0.025M (NH4)2SO4). (Zurera et al, 1989).
The mixture was shaken for 15 minutes. Filtered in 100 ml volumetric flask and diluted to
the mark. Water sample 100 ml was acidified with 5ml of 4.M pure nitric acid and retained
in a tightly stoppered plastic container for about 2 hours. The function of nitric acid in this
process is to suppress hydrolysis of acquisitions, which would otherwise form hydrated
hydroxo and oxo species on standing.
M(H2O)6 3+ + H2 O M(H2O)s (OH) 2+ + H3O+
M(H2O)3 (OH)32+ + H3O M(H2O)4 (OH)2
+ + H3O+
H20 K2

38
M(H20)2 (OH)4 + H3O+ M(OH)43- + H3O+
The digestion of vegetables and grasses was done as follows: Each sample of vegetables
sweetpotatoleaves(p),cassava leaves(c) and the animal grasses hay(h) was taken and
washed thoroughly with distilled water to remove dusts and other adhered material. After
this process, each sample was dried in an oven at a temperature of 1100C for a day. Each
dried sample was kept in plastic bag for grinding. The grinding was done using motor and
pestle to pass through a 60 mesh sieve. Each ground sample was ashed in a furnace at
5000C for about 12 hours. Each ashed sample was dissolved in 5 ml of 20% V/V Anal grad
hydrochlolic acid and the resulting solution was then diluted with deionized water to 50 ml.
Finally the diluted solution of each sample was analyzed in Atomic Absorption
Spectrophotometer (Perkin, 1984).
The digestion/extraction of cassava, root sample was done as follows: The sample was
washed with distilled water to remove impurities and all the unknown and unwanted
material probably adhered to it. The samples were then allowed to dry at room temperate
for a day, the samples (pieces of cassava) were chopped into small pieces and dried in an
oven equipped with fresh air facilities at 1050C for about 2 days. The oven dried samples
was ground using mortor and pestle to powder. The powder (2g) was placed in a porcelain
crucible, then the crucible and its contents were placed in a cool muffle furnace and dry
ashed to a temperature of 5000C for 12 hours. The ash was allowed to cool at room
temperature in a desiccator. After cooling, 20% (analar grade) hydrochloric acid solution
was added and warmed slowly. The resulting mixture was then filtered into 50 ml
volumetric flask using a whatman filter paper no. 41 and made to mark with deionized
water. Finally the resulting solution was analyzed using Atomic Absorption
Spectrophotometer.(Perkin, 1984).
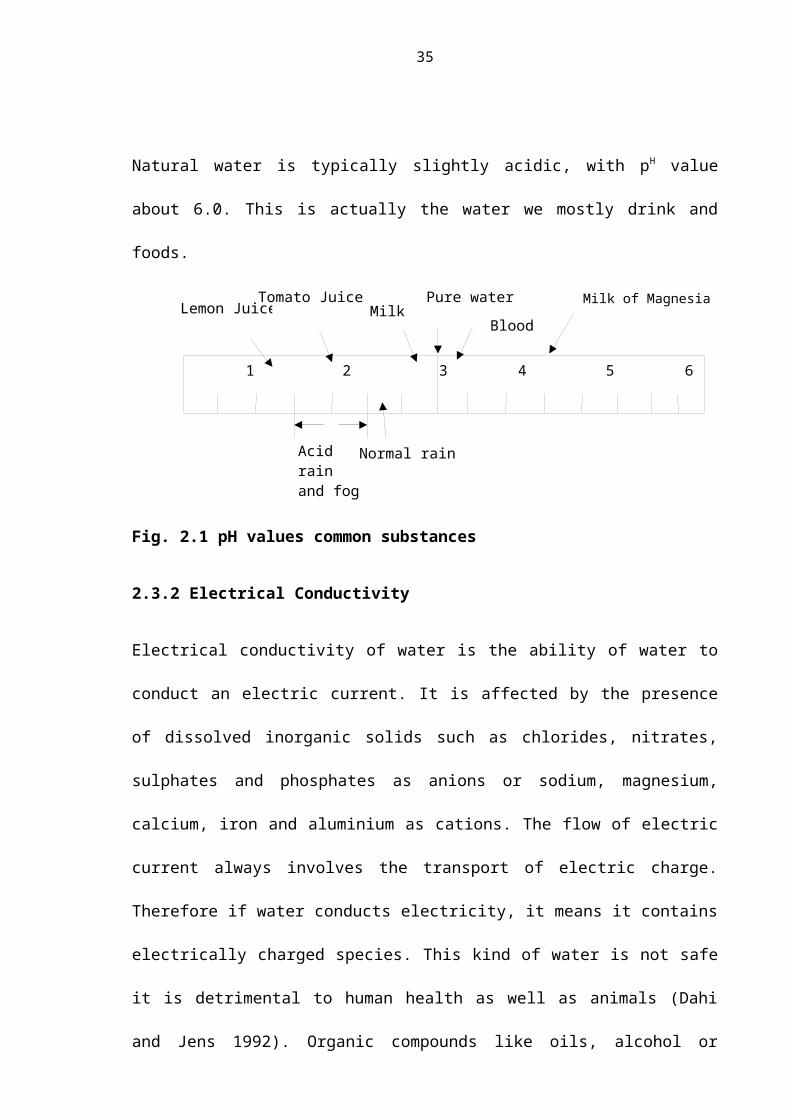
39
The digestion/extraction of fruit samples (guava) was done as follows: The samples were
washed with distilled water to remove the surface impurities and then left for at least one
hour. Then each sample (a piece of guava) was chopped into small pieces without peeling.
The small pieces obtained were then squeezed tightly using a squeezer and the juice part of
it was collected in a clean dry beaker and filtered. The juice was diluted using distilled
water to a ratio of 1:1. The diluted juice (100mls) was acidified with 5 ml of4.0 M nitric
acid and retained in a tightly stoppered plastic container for at least 2 hours. Finally the
mixture was analyzed using Atomic Absorption Spectrophotometer(AAS)( Perkin, 1984).
In AAS each sample for each item was taken in triplicate. Each digested sample (in
triplicate) was put into an Atomic Absorption Spectrophotometer to check the
concentration levels of copper, cadmium, chromium, zinc, lead and iron.
3.4.2 Analysis of Heavy Metals by Atomic Absorption Spectrophotometry
Atomic absorption is the process that occurs when a ground state of an atom absorbs
energy in the form of light of a specific wavelength and is elevated to an excited state. The
amount of energy absorbed at this wavelength will increase as the number of atoms of a
selected element in which the light passes increase (Perkin – Elmer 1984). By measuring
the amount of light absorbed, a quantitative determination of the amount of theanalyte can
be made. The use of special light sources and careful selection of wavelengths allows the
specific determination of individual elements. This light passes through a cloud of atoms
inside the flame which is released by burning the sample solution in the flame. Only the
atoms of a specific element will absorb this light. The absorbance is converted into an
electrical signal and recorded as a measure of concentration. The relation between the
quantity of radiant energy absorbed and the concentration of a standard analyte can be used
to determine the concentration of an unknown sample. Atomic absorption is highly specific
and selective enabling elements to be determined in a concentration range of trace to mean

40
quantities. Spectral interferences are usually very few and easily removed. As a powerful
analytical method, AAS gives the total metal content in liquid samples, since it is almost
independent on the molecular form of the metal in the liquid. Another advantage of this
method is that, it is accurate and highly sensitive (Varian, 1989).
3.4.2.1 Instrumentation
The basic components of AAS include a primary source of radiation, atom reservoir or
flame, monochromator, photo-multiplier and a signal processor or readout device.
The primary source of radiation is either a hollow cathode lamp or an electrode discharge
lamp. The sample is introduced into the flame as aerosol which is usually a nebulizer
connected to the flame burner by a spray chamber (Perkin – Elmer 1984). The air –
acetylene flame was employed in the determination of the metals ( lead, cadmium, iron,
copper, chromium and zinc) which were in examination, in this research. The metals
require less energy for the excitation of their atoms. A monochromator is required for
proper light dispersion for which the detector measures light intensity and amplifies the
signal. An electric current is produced depending on the light intensity and processed by
the instrument’s electronics. The electric current will measure the amount of light
attenuation in the sample cell and covert the readings to the actual sample concentration
(Varian, 1984).

41
Fig. 3.1 Schematic diagram of a double – beam atomic absorption spectrophotometry.
3.4.2.2 Measurement
The relationship between the quantity of radiant energy absorbed and the concentration of
standard analyte can be used to determine the concentration of the unknown sample. The
intensity of the transmitted light is related to the incident radiation by the Beer’s law
(Varian 1989).
A = log Io/Itєlc …………………………………………………..(1)
Where: It = the intensity of the transmitted light
Io = the intensity of the incident light
є = the absorption coefficient at the particular wavelength
c = the concentration of absorbing atoms in moles per litre
l = the absorption path length in centimeter
A= Absorbance
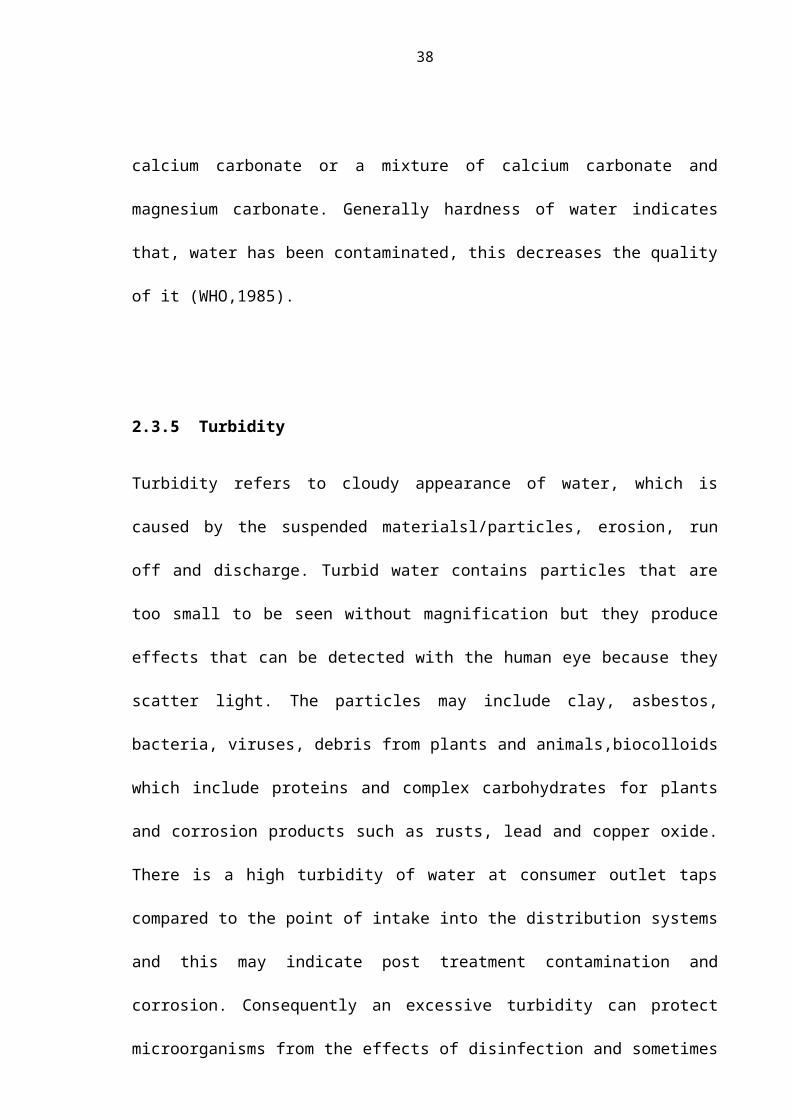
42
This implies that, the absorbance A, is directly proportional to the concentration of the
analyte. For most elements, particularly at high concentrations the relationship between the
concentration and the absorbance deviate from Beer’s Law and is not linear. There are
several reasons for this, including non-homogeneities of temperature and space in the
absorbing cell, line broadening and in some cases absorption at nearby lines (Skoogand
West, 1982). Three calibrations of standards in the linear range were made up. Analyte
concentrations of the test samples were designed (appropriate dilution sometimes required)
so as to fall within linear range. It was sometimes assumed within this linear region that
one calibration standard could suffice.
3.4.2.3 Interferences in Atomic Absorption Spectrophotometry
The various types of interferences occurring in atomic absorption spectroscopy are well
defined and can easily be compensated eliminated as summarized in Table 2.
Table 3.2 interferences in AAS work and their remedies
Interference Elimination
Chemical Use a higher temperature flame addition of releasing agent to the
sample, standard and a blank.
Ionization Addition of excess of easily ionized element to the standard
samples and blank e.g. K,Na, Rb and Cs.
Matrix Dilution of the sample to as close as possible to the standard.
Emission Decreasing the slit width, increasing the lamp current, diluting the
sample and using a cooler flame.
Spectral Use of smaller slit or selecting an alternative wavelength
Background
absorption
Use of background corrector which utilizes a continuum source
i.e. a deuterium are lamp in the ultraviolet or tungsten – iodine
lamp for visible wavelength.

43
3.4.2.4 Analysis and Quantification Procedures for AAS
For each element, its hollow cathode lamp was placed in the AAS instrument, properly
aligned and adjusted for correct wavelength, current and energy. Distilled water was
aspirated for zeroing the instrument and standard solutions for a selected element run to
calibrate the instrument, and the result logged in the instrument memory. The sample
solutions, pre-diluted to lie within the linear range, were run with the instrument calibrates
to display directly into concentrations. The values obtained were then multiplied with the
appropriate dilution factors to get the actual concentration in test solutions (Ebdon, 1986).
CHAPTER FOUR
4.0 RESULTS AND DISCUSSION
4.1 Heavy Metal Concentrations
The results of heavy concentrations in fruits and vegetables can not be underestimated as
these foodstuffs are important components of human diet. We all know that fruits and
vegetables are rich sources of vitamins and minerals and also have significant importance
in antioxidative process. However, the intake of heavy metal contaminated fruit and
vegetable may pose a risk to human health because the body does not have mechanism of
removing them, hence the heavy metal contamination of food is one of the most important
aspects of food quality assurance (Radwan and Salama, 2006). Heavy metals, in general are
not biodegradable, have long biological half-lives, and have the potential for accumulation
in different body organs, leading to unwanted side effects (Khan et al., 2008). Plants take
up heavy metals by absorbing them from airborne deposits on the parts of the plants
exposed to the air from the polluted environments as well as from contaminated soils

44
through root systems. Also, the heavy metal contamination of fruits and vegetables may
occur due to irrigation with contaminated water (Jarup, 2003),
Table 4.1 Heavy metal concentrations (ppm) in various item understudy
tem Sample Cd Pb Cu Zn Cr FeCassava C1 BDL 0.772 0.027 1.410 BDL 0.592
C2 BDL 0.789 0.049 1.522 BDL 0.503C3 BDL 0.907 0.023 1.404 BDL 0.520Average
BDL 0.823 0.033 1.445 BDL 0.538
Cassava leaves
K1 BDL 1.047 0.326 5.901 BDL 2.898K2 BDL 1.170 0.312 5.498 0.27
42.471
K3 BDL 1.088 0.281 5.520 0.249
2.336
Average
BDL 1.101 0.306 5.640 0.262
2.568
Sweetpotato leaves
T1 0.018 0.850 0.502 3.453 0.500
2.236
T2 0.018 0.861 0.510 3.650 0.621
2.310
T3 0.015 0.981 0.508 3.549 0.695
3.295
Average
0.017 0.897 0.507 5.551 0.605
2.614
guava P1 BDL 1.134 0.193 8.169 0.166
0748
P2 BDL 1.157 0.196 8.824 0.130
0.866
P3 0.01 1.146 0.215 8.590 0.099
0.841
Average
0.01 1.146 2.01 8.368 0.112
0.813
Hey H1 0.044 1.224 0.172 1.415 0.720
0.785
H2 0.040 1.453 0.162 1.646 0.848
0.955
H3 0.044 1.309 0.142 1.440 1.779
0.645
Average
0.043 1.329 0.159 1.500 0.782
0.793

45
Water W1 0.013 1.178 BDL 0.633 0.500
1.931
W2 0.010 1.146 BDL 0.748 0.490
1.931
W3 0.010 1.190 BDL 0.604 0.447
1.952
Average
0.011 1.171 BDL 0.662 0.479
1.938
Soil S1 BDL 0.830 0.120 4.000 BDL 16.200S2 BDL 0.810 0.100 4.400 BDL 16.600S3 BDL 0.740 0.130 4.300 BDL 15.800Average
BDL 0.793 0.117 4.233 BDL 16.200
WHO Std 0.05 0.10 1.50 15.00 - 1.00TZ Std 0.05 0.05 3.00 15.00 0.05 1.00
BDL=Below detection limit, usually described when the concentration of heavy metal in a
sample is less than 0.010 ppm.(0.010 mg/Kg) or 0.010 mg/L for liquid material.
Majority of samples had higher levels of heavy metals concentrations than the acceptable
WHO and Tanzanian limits. Vegetables had high levels compared to fruits and water
samples. In sweetpotato leaves,Pb level was detected to range from 0.85 – 0.98mg/Kg
which is over 5 times the acceptable WHO limit (0.20 mg/Kg).
The High alarming level for Pbin all samples (ranging from 0.740 to 1.453 mg/Kg), is
much associated with the contamination of water around used to irrigate the plants. Also it
is possible that the contamination was due to naturally occurring lead in soil and in
atmospheric deposites. Water samples have high levels of Pb ranging from 1.146 – 1.190
mg/Kg which is about 12 times higher than WHO acceptable limits, (0.100 mg/Kg).
Copper was observed to have the lowest level of contamination in comparison with WHO
and Tanzania Standards. The high level of iron contamination in all samples determined is
not surprising as this may be from the contamination of both soil sample and the water

46
samples with iron. It has been indicated the average diets per person per day for
vegetables and fruits is 400 g, respectively (Hoffmann 2003; Mohamed, 2007). The daily
intake of heavy metals through the consumption of fruit and vegetables tested was
calculated according to the equation:
Daily Consumed Heavy Metal = Recommended amount (400mg/day) x Conc of Heavy
Metal in Sample.
If the average of metal in vegetables, sweetpotato leaves which is commonly used
inTanzania and atVikuge in particular are Pb1.101 mg/kg, Cu 0.306 mg /kg, Zn 5.640
mg/kg, Cr 0.262mg/kg, and Fe 2.568 mg/kg, then if consumed as recommended the
contribution of heavy metal intake for an average human being from the vegetable diet is
approximately Pb 440.4 mg, Cu 122.4 mg, Zn 2.256 mg, Cr 104.8 mg and Fe 1,027.2 mg
The mean daily intake recommended values of these elements are copper 2.4 mg zinc 8.4
mg and Fe 18 mg (Ellen, 1990). Safe value for lead, and cadmium in fruits and vegetables
recommended by the WHO/FAO are 120 mg, and 80mg, respectively (Hoadland, 1994).
This shows that, except for Zn which is lower than the recommended levels, vegetables at
Vikuge are highly contaminated to the extent of the alarming levels. Copper level were 51
times higher(2.50 mg) while iron level were 57 times higher than the recommended
amount(425 mg). Other non essential elements Pb is approximately four higher than the
recommended values(0.30 mg) (FAO/WHO, 1996).
The high levels of heavy metals in fruits is comparable to results of other research done
elsewhere (Mohamed, 2000) as shown in table 4.2). The high levels of heavy metal
contaminations found in some fruits and vegetables could be closely related to the
pollutants in irrigation water, farm soil, and pesticidesor alternatively could be due to

47
pollution which include atmospheric deposition and to a small extent from traffic on the
highways (ibid).
This could be the reason of having high levels of concentration in the samples.
Based on the persistence and cumulative behaviour of heavy metals as well as the
probability of potential toxicity effects, the absorption of heavy metals in human diets as a
result of the consumption of vegetables and fruits means that there is a requirement for the
analysis of food items to ensure that the levels of trace heavy metals meet the agreed
international standards.
Table 4.2 Average Concentration of Heavy Metals in Selected items
Items Cd Pb Cu Zn Cr Fe
C(Casava) BDL 0.823 0.033 1.445 BDL 0.538
CL(Kasava
leaves)
BDL 1.101 0.306 5.640 0.178 2.568
P(Sweetpotato
leaves)
0.017 0.897 0.506 3.551 0.605 2.614
G(Guava) BDL 1.145 0.201 8.528 0.112 0.818
H(Hay) 0.012 1.329 0.159 1.502 0.782 0.795
W(Water) 0.011 1.191 BDL 0.662 0.476 1.958
S(Soil) BDL 0.793 0.117 4.230 BDL 16.200
Combining the data above, to get the average value, the results indicate that, heavy metal
concentrations were significantly observed for zinc, chromium and iron.
48
Casava
Cassava
leaves
Sweet
potato le
aves
Guava Heywate
rsoil
02468
1012141618
Fig 4.1 Histograms of concentration of iron in roots, vegetable, fruits, Hay, water and
soil.
From the diagram above the concentration of iron seems to exceed others,
Iron is a very essential element in all living things in most cases. It bounds to protein both
porphyrins or heme compounds (haemoglobin and myoglobin) and to a lesser extent a non-
heme protein bound in compounds as ferritin, transferin and hemosiderin. The heme
pigments, haemoglobin and myoglobin in muscle function as oxygen carriers and hence
containing ezymes such as the cutochromes in mitochondria are concerned with the
electron transport system in generation of ATP molecules. Non-heme iron containing
proteins are also known.(Zurera et al, 1989).
On the other hand, excess iron in the body has been proved toxic. The poisoning however
is rare in adults, but common in children.The normal iron intake for children (0.1 - 0.2)
x10-4g/kg which is the same as 10-20 ppm and acute poisoning can occur following the
ingestion in excess of iron or iron sulphate (above one gram). The symptoms of iron
poisoning include nausea, vomiting due to gastrointestinal irritation and necrosis. If no
action is taken death may occur within six hours after ingestion (WHO, 2OOO).
4.2 Heavy Metals in Drinking Water at Vikuge Village
49
From the table of results (Table 4.1), heavy metals in drinking water at vikugeranges as
follows; cadmium 0.010 to 0.013 mg/L, lead 1.146 mg/L to 1.190 mg/L, copper not
detected, zinc 0.604 mg/L to 0.748 mg/L, chromium 0.447mg/L to 0.500 mg/L. and iron
1.931 mg/L to 1.952 mg/L. Sources of heavy metals in these water sources apart from the
stated point source due to the expired chemicals, is the storm water runoff. Seasonal water
channels from up hills, human activities around water sources including cultivation and the
related activities; animal grazing around the water sources as is the case for Vikuge.
Domestic water supply (including drinking water) does not bear special treatment. In this
case human being as well as trouble as the environment are affected. Plants absorb the
pollutants from the contaminated environment (soil) and it has been observed that pants
absorb both essential and toxic metals over a wide range of concentration. (Mugasha,
1995).
4.2.1 Levels of Cadmium in Drinking Water
The levels of Cadmium metal in drinking water ranged from 0.010 mg/L to 0.013 mg/L.
The table 4.4 column indicates that all the three wells where water was fetched in total
produced mean value of 0.011 mg/L which nearly 5times less than the WHO/TBS
standards (0.050mg/L).Having low level of cadmium in Vikuge water is probably caused
by the area itself being far away from the industrial influence since the main source of
cadmium pollution in water is municipal wastes and industrial discharge into the water
bodies. In Vikuge these conditions do not exist. Through the admium metal is very toxic
but with the levels in Vikuge samples were generally very low.
4.2.2 Level of Lead in Drinking Water
50
The level of lead metal in drinking water at Vikuge village was found to range from 1.146
mg/L to 1.190 mg/L with an average value of 1.171 mg/L. (table 4.4 column ii) This value
is above the permissible values, according to WHO/TBS standards (0.100) mg/L. The
Vikuge people and animals are exposed to health risk by drinking this polluted water. This
situation to them is unavoidable since the three shallow wells are the only sources of water
in the village. Lead enters water bodies either through unban run off or discharges such as
sawege treatment plants and industrial plants.It may also be transfered from the air to the
surface water through precipitation (rain). Some traces of lead are naturally found in human
body. Lead is toxic to both animals (including human being) and plants. Lead’s toxicity
depends upon its solubility and this in turn depends on pH and it is affected by hardness.
Other sources of lead include herbicides, insecticides, pesticides, mining, metallurgical
activities, glass making and the manufacture of lead used paints and plastics.
4.2.3 Levels of Copper Metal in Drinking Water
The levels of copper in Vikuge drinking water were below the detection limit.(Table 4.4
column iii).
4.2.4 Levels of Zinc Metal in Drinking Water
The level of zinc metal in drinking water at vikunge village ranged from 0.533 mg/L to
0.948 mg/L detected to have an average value of 0.662 mg/L,( table 4.4 column iv). The
average value is nearly 75 times less than the recommended safe level, according to
WHO/TBS standards (15.00 mg/L). The sources of zinc in the environment include:
galvanized metal ware, oil refining, smoke generators, lubricants points, steel manufacture,
adhesives, disinfectants, electroplating and dehydrating agents. Relating the location of the
village and the sources, it is realized you that, Vikuge village is out of many of these
sources. However the little zinc detected in Vikuge drinking water may be caused by the

51
naturally occurring zinc in the environment e g soil which is transferred into water. The
results suggest that Vikuge community members may be safe from health risks caused by
zinc metal.
4.2.5 Levels of Chromium Metal in Drinking Water
The level of chromium metal in drinking water at Vikuge village was found to range from
0.088 mg/L to 1.140 mg/L with an average value of 0.479 mg/L (table 4.4 column v). This
value is nearly 10times greater than the recommended value which is safe (0.050 mg/L)
according to WHO/TBS standard. The toxicity of chromium puts the Vikuge people and
animals in a health risks. The sources of chromium in the environment are: batteries, dyes,
leather tanning, paints, catalyst use, chemical synthesis, steel making, electroplating,
welding and wood preservatives.(WHO, 1984).
The mentioned materials can be purchased by any of the Village member, but due to lack
of knowledge on how to keep and dispose them, they might end up polluting the
environment including water. Until recently, interest in chromium was confined to its toxic
effects. However, the element is now considered essential. Chromium is thought to play
some functional role in regulating glucose in metabolism probably a potential of insulin
function. Chromium is used in the manufacture of stainless steel. The concentration of
chromium in the human blood is estimated to be (0.5 – 5.0 μg/L) and in urine 5.0-10.0
μg/L. The daily chromium intake by man ranges from 5.0 to 100.0 μg/L. Hexavalent
chromium is much more toxic than the trivalent form. Oxidizing agent chromic acid and
the dichromate salts are irritating to mucous membrane, skin and conjunctiva. Allergies
dermatitis are included through exposure to these compounds (Nriagn, 1988).
4.2.6 Levels of Iron in Drinking Water

52
The levels of iron metal in Vikuge drinking water was found to range from 1.571 ppm to
2.351 mg/L with an average value of 1.938 mg/L, (table 4.4 column vi) This value is
nearly two times greater than the recommended value according to WHO/TBS standards
(1.000 mg/L). This figure puts the Vikuge people in health risks.
The main sources of iron in the environment include the natural occurance, polishing
agents, welding and metallurgical activities. Other source could be the scattered auto-
garages and workshop around the water bodies. Considering the location of Vikuge, two
sources might have contributed to this high level iron.
First the naturally occurring in atmosphere and soil which end up entering water bodies
through natural processes and human activities. Iron is widely distributed and responsible
for the color of most soils. It occurs in the Earth’s crust at a concentration of 5%. The iron
content of an animal body varies with its state of health, nutrition, age sex and species. A
normal adult weighing 70kg contain about 3-4 g of iron. The greatest need of iron however
occurs in infancy and adolescency
The levels of iron do not indicate point source contamination. Certainly they are due to
contamination from iron occuring naturally in the soil aqnd other minor sources.
Whereas iron deficiency in adult men is usually attributed to substantial bleeding in infants,
adolescents and menstruating women it is attributed to dietary inadequacy.
Acute iron poisoning, while rare in adults, is common among young children. The normal
iron intake for children is 10-20 mg/kg per person. An ingestion in excess of 1g of iron in
children can result into acute poisoning.
Table 4.3 Heavy metal permissible limits in various items
53
Metals Concentration ppm (mg/kg)
In water In
soil
In vegerables
(leaves)
In fruits In
roots
In
foods
Lead 0.10 50.0 0.30 0.30 6.95 0.1
Cadmium 0.05 0.43 0.20 0.20 8.86 0.25
Copper 0.05 11.00 2.50 2.50 100 1.50
Zinc 15.0 11.00 99.40 99.40 71.73 150
Iron 1.00 1500 425 425 500 150
Source FAO/WHO/1996 respectively.
Table 4.4 Heavy Metal Levels (ppm) in Drinking Water (Well Water)
HEAVY METALS
Well Cd Pb Cu Zn Cr Fe
W1 0.013 1.178 BDL 0.533 0.088 1.571
W2 0.010 1.146 BDL 0.948 0.199 2.351
W3 0.010 0.190 BDL 0.504 1.140 1.952
Mean
value
0.011 1.171 BDL 0.662 0.479 1.938
Table 4.5 Heavy Metal Levels (ppm) in Soil from Point Source (S000)
Soil (m) Cd Pb Cu Zn Cr Fe
S000 BDL 0.830 0.120 3.000 BDL 16.200
S200 BDL 0.810 0.100 5.000 BDL 18.200
S400 BDL 0.790 0.125 5.400 BDL 18.600
S600 BDL 0.820 0.130 4.300 BDL 13.800
S800 BDL 0.740 0.110 4.100 BDL 13.700
S1000 BDL 0.780 0.102 4.105 BDL 14.000
Average BDL 0.790 0.115 4.318 BDL 15.755
BDL= Belowdetection limit (Cr, Cu, Cd 0.010 ppm)
4.3 Heavy Metals in Soils at Vikuge
54
Three samples were used for each interval starting from point source (S000) Thus the value
shown in each interval the table is just an average ( table 4.5 ).
Levels of heavy metals in soil at Vikuge as from the observed data indicate significant
variations from one type of metal to another. This is probably due to varying sources
available in the soil. Iron which is present in large quantity compare to all other metals
under study. However copper is as well significantly observed in vikuge soil. The two
metals iron and copper though found in large quantity in Vikuge soil, they were not greatly
absorbed in the vegetables, fruits and roots ( table 4.2) plants absorb these pollutants
(heavy metals) from the soil and has been observed that plants absorb both essential and
non- essential elements (toxic metals) over a wide range of concentration [Mugasha, 1995].
The absorption of toxic metals by plants depend upon many factors, including the pH of
soil, soil type and other metals that are already present in the plant.
4.3.1 Cadmium levels in soil
Cadmium was not observed in Vikuge soil, this does not mean that there is no cadmium in
the soil but it was below the detection limit (Fig 4.5 column i ). The results shows that, the
Vikuge soil is free from Cadmium contamination, this is because the area is free from the
mentioned sources of Cadmium. Though Cadmium is more toxic when inhaled but the
maximum limit according to FAO/WHO without bringing severe effects to both human
being and animal is 0.43 mg/Kg.
4.3.2 Lead Level in Vikuge Soil
The value of lead metal distribution in Vikugesoil ranged from 0.740 mg/Kg to 0.830
mg/Kg. (table 4.5 column ii ) with average value of 0.790 mg/Kg .
This value indicated relatively low concentration of lead in the given soil. Thus the lead
observed is from other sources such as leaching during rain season which is facilitated by
soil microbial activities. Natural soil also may contain lead material. However the sources

55
of lead metal in soil may be discharged as run off and natural decomposition of plants and
animals. Lead’s toxicity depends upon its solubility and this in turn depends on pH other
sources of lead include herbicides. Insecticides mining metallurgical activities glass making
and manufacture of lead based plants and plastics(Browing, 1969).
The mean value of lead contamination in Vikuge soil is nearly 220 times less than the
maximum permissible value according to FAO/WHO standard (50 ppm). This shows that,
the mentioned sources of lead into environment are not widely distributed in Vikuge area.
The value obtained is probably caused by the natural environmental activities.
4.3.3 Copper level in soil.
The concentration of copper metal in Vikuge soil was found to range from 0.100 mg/Kg to
0.130 mg/Kg with a mean value of 0.115 mg/Kg (Fig 4.5 column iii). This value indicate
that, copper metal is low in the area. It is even lower than the permissible value of 270
mg/Kg.The copper found is believed to be naturally bound to the soil as from ordinary soil
microbial activities or weathering of rock material containing copper. The common sources
of copper are mining activities, metal cutting and welding industrial activities, alloying and
metal scrappers.
The small value of copper in Vikuge soil suggests that; the physical activities which lead to
the release of copper into environment are very limited. As the value is very small nearly
2000 times lower than to the permissible maximum value. However the presence of copper
in soil does not bring much threats to human being animal rather than increasing soil
fertility. The soil rich in copper ions is usually reddish brown(Daries, 1981).
4.3.4 Zinc level in Vikuge soil

56
The level of zinc in Vikuge soil was found to range from 4.100 mg/Kg to 5.400 mg/Kg
(table 4.5 column iv) the average value of 4.320 mg/Kg. This value is below the
permissible value as per FAO/WHO standard (1100mg/Kg) nearly 250 times less. This
shows that, the Vikuge soil does not seem to be a threat in human and other living
organismsincourse of zinc pollution. The low level of zinc in Vikuge soil may be due to the
fact that the area has no industrial sources apart form the natural phenomena. The sources
or zinc in the environment include: galvanized metal ware, oil refining, smoke generators
lubricants, paints, steel manufacture, adhesives disinfectants, electroplating and
dehydrating agents (Manfred et al, 2009).
4.3.5 Chromium level in Vikuge soil
The level of chromium in Vikuge soil was not detected (Fig 4.5 column v). this is not
necessarily true that there was no chromium metal in soil but the fact is the level was too
low to be detected. This mean that the natural and human activities have no contribution in
chromium concentration inVikuge soil. The pollution sources responsible for chromium
include batteries, dyes, leather tanning, paints, catalyst use, chemical synthesis, steel-
making electroplating, welding and wood preservatives(Neilesn et al, 1990).
Although chromium was not detected in Vikuge soil but in nature it is permitted up to a
maximum value of 11.00 mg/Kg. ( FAO/WHO standards). In this case Vikuge soil is free
from that kind of contaminants which means there is no health threat to human being and
other living organisms.
4.3.6 Iron levels in Vikuge soil

57
The concentrations of iron in Vikuge soil ranged from 13.700 mg/Kg to 18.600 mg/Kg .
(table 4.5 column vi)
The results indicate that, the level of iron in Vikuge soils higher then any other metal. The
average value is 15.755 mg/Kg. It is not easy that this value can be attained without an
abundant source. As described in the literature, this higher concentration of iron can be
from the natural activities. The level seem to be within the range of iron levels occuring
naturally in the soil.
Although, the results indicate the value of Iron metal in Vikuge soil are greater than those
of other metals under study due to the mentioned reasons, but still the levels are less than
the maximum permissible standard according to FAO/WHO (1500 mg/Kg). With this value
of FAO/WHO it means that the Vikuge people and animals and other living organisms are
safe (free from being poisoned).
However, the soil enriched with iron is dark brown in colour and serves as a house of
many other microbes and fertilizer to many crops.
The most common source of iron include mining industry, metal cutting and wedding,
painting and dying, metallurgy industry, alloying and steel industry. The common
compounds of ironare : iron oxide FeO Fe2O3 iron sulphate FeSO4 iron chloride FeCl2,
FeCl3 iron carbonate (FeCO3) and iron sulphide (FeS). Iron metal together with its
corresponding compound is extremely toxic especially when exceed the recommended
level. On the other hand, iron is useful in human welfare as it constituteS the hemoglobin
(source of blood in the body) most metal industries on Earth use iron as rough material
since it is the most abundant metal(Mwijage 2002).

58
Cd Pb Cu Zn Cr FE0
2
4
6
8
10
12
14
16
18
.
Fig 4.2 Distribution of heavy metals in Vikuge soil
4.4 Heavy Metals in Vegetables at Vikuge
The vegetables which were taken in this study are cassava leaves and sweet potato leaves.
The results show close relationships of the two types of vegetable. Looking on the trend
throughout all metals under study, it is found that,iron and zincare highly concentrated in
these vegetables.
4.4.1 Level of Cadmium in Vegetables
The level of cadmium metal in Vikuge vegetables was not detected in cassava leaves but
was detected in sweetpotato leaves (0.017 mg/Kg) table 4.3. This value is nearly 15 times
less than the permissible maximum FAO/WHO standard 0.20 mg/Kg. This low value of
cadmium contaminants in Vikuge vegetables shows that the Vikuge community members
are safe when using these vegetable no cadmium was detected in cassava leaves, this means
the absorption of cadmium ions was not possible in cassava leaves but in sweetpotato
leaves. The distance between the roots (absorption centre) and the leaves in the factor of

59
having less value of cadmium in cassava leaves and sweetpotato leaves. However, the
majority of vegetables of similar nature have nearly the same cadmium contaminants.
4.4.2 Levels of Lead in Vegetables
The mean levels of lead metal in Vikuge vegetables were fond to be 1.10 mg/Kg in cassava
leaves and 0.90 mg/Kg in sweetpotato leaves (table 4.3). These values are much higher
than the recommended FAO/WHO standard (0.30 mg/Kg).
These results show that the Vikuge community members eat a lot of lead through these
vegetables. However, the level of intoxication depends on the amount of vegetable intake
and the frequency. This means the health hazards can not be avoided, what can be avoided
is the extent of intoxication due to the above reasons.
4.4.3 Levels of Copper in Vegetables
The mean values of the results show that the level of copper metal in Vikuge vegetables
under study are 0.31 mg/Kg for cassava leaves and 0.51 mg/Kg in sweet potato leaves
(table 4.3). These values all together are very far below the recommended maximum safe
level in vegetables according to FAO/WHO standard (40.00 mg/Kg). The relatively lower
values of copper contamination in vegetables shows that, the Vikuge people are safe from
using these vegetables, no health hazards to both human being and animals. The lower
level of copper metal in vegetables is caused by the low trend in absorption by root hairs.
4.4.4 Levels of Zinc in Vegetables
The results show that the mean concentration of zinc metal in vegetables cassava leaves
and sweetpotato leaves, were 5.64 mg/Kg and 3.55mg/Kg respectively (table 4.3). These
values all together are for less below the recommended maximum safe level according to
FAO/WHO which is (99.40mg/Kg). This indicates that, the pollutants of zinc in Vikuge

60
vegetables do not bring about threat to human being and animals interms of health. For this
reason Vikuge community members were not be much affected by zinc metal as toxic
material.
4.4.5 Levels of Chromium Metal in Vegetables.
The results indicate that the meanconcentrations of chromium metal in vegetables under
study cassava leaves and sweetpotato leaves were 0.18mg/Kg and 0.16mg/Kg respectively.
(tables 4.3). These values all together are below the recommended maximum standard
according to FAO/WHO standards which is 2.50mg/Kg. This realizes that the Vikuge
people upon using these vegetable yet are safe. As explained earlier that the extent of being
safe depend upon the frequency of vegetable in take since chromium is very toxic. That
means even a small value can bring a long term poisoning.
4.4.6 Level of Iron Metal in Vegetables
According to the results, the concentration of iron metal in Vikuge vegetables which are
cassava leaves and sweetpotato leaves were 2.57mg/Kg and 2.61 mg/Kg respectively (table
4.3) these two values all together are below the maximum recommended standard
according to FAO/WHO which is 425mg/Kg. Iron is highly demanded by our body but it
should be not above the recommended safe level. Most green vegetables contains
considerable amount of iron. In case of Vikuge they are getting good amount of iron
through vegetables but still are safe as the amount is far lesser than the maximum
recommended level.
4.5 Heavy Metals in Fruits at Vikuge
The fruits under study were only guava the selection of these types of fruits was based on
the fact that, they are more available in the place and highly loved mainly by children.

61
Thus we wanted to assessthe extend of health hazards in children. In the past, this fruit was
grouped as a wild fruit but today is loved to the extent it became commercial fruits
especially in towns. The fruit is rich in Vitamin A. constant taking this fruit will improve
human eyesight (Ryall and Lipton, 1982)
4.5.1 Levels of Cadmium in Fruits
The results show that the concentration of cadmium inguavawas not detected (BDL)
(tables 4.2) This means the value is very small to the extent that can not be detected by a
machine. Health records show that cadmium is very toxic when inhaled, yet the World
Health organization ( WHO) set a standard value which should not be exceeded which is
0.30mg/Kg. Many fruits have cadmium concentrations below this value thus, they are safe
with these results, Vikuge people are safe upon taking this type of fruit. Cadmium is
selective to some fruits due to its toxic nature. This is a balance of nature to make people
(not only of Vikuge but also of other places) be safe.
4.5.2 Levels of Lead in Vikuge Fruits
The concentration of lead in fruit guava according to the results is 1.15 mg/Kg tables 4.5).
This value is higher than the recommended maximum limit according to FAO/WHO
standard which is 0.3 mg/Kg, this means the Vikuge people especially children are in
halling a lot of lead through these fruits (guava). For this reasons they are automatically
exposed to health hazards.
4.5.3 Levels of Copper Metal in Fruits
The mean results show that the levels of copper metal in fruit under study (guava is
0.201mg/Kg (table 4.2).

62
This values is very small below the maximum recommended level according to FAO/WHO
standard which is (40.00mg/Kg). This means there is no significant copper poisoning in
Vikuge people via fruit (guava). This statement does not mean that those people are
absolutely free from being contaminated since the little traces may be accumulated after a
long period of time and become toxic. Usually WHO/FAO set a maximum limit that one
should not exceed that but yet any value below that may be toxic. What makes difference is
the extent of intoxication and the time. The recommendations are placed following the
magnitude of toxicology more toxic less level and vice versa.
4.5.4 Levels of Zinc Metal in Fruits
The mean results indicate that the concentrations of zinc metal in fruits, guava in Vikuge
area is 5.53 mg/Kg (table 4.3). This level is below the maximum recommended standard
according to FAO/WHO which is 99.40 mg/Kg. In this case it can be assumed that, the
Vikuge people especially children will remain safe from being contaminated by zinc metal
through fruits. However the contamination by 8.53 mg/Kg can’t be ignored completely
since the accumulation over a long time of period is hazardous. FAO/WHO set a
maximum limit by which the effect is instantly below that slow poisoning may continue.
4.5.5 Levels of Chromium Metal in Fruits
The mean experimentalresults for chromium in fruits, guava indicated that, the
concentration of chromium metal is 0.11 mg/Kg (table 4.3) this amount is below the nearly
20 times below the FAO/WHO recommended maximum standard which is 2.50 mg/Kg.
This means the community at Vikuge area cannot be very much affected by chromium
poisoning through eating guava periodically.
The reasons for the less value of chromium contamination have been explained above in
section 4.2.5 Geographical location of the place is one of the factors. The frequent use of

63
guava may lead to accumulation of toxic material of the metal leading to health hazards
among the Vikuge people as well as animals.
4.5.6 Levels of Iron Metal in Fruits
The mean results show that the concentration of iron metal in fruits guava which was taken
as a sample fruit is 0.82mg/Kg (table 4.2) this value is very much below the recommended
maximum standard according to FAO/WHO which is (425 mg/Kg) (table 4.3) looking on
the trend of metal contamination in guava, iron stand third behind lead and zinc (table 4.2).
The low levels of iron at the area are due to the fact that the external sources of iron are
limited where as the natural sources of iron are the mainly dependable sources. With this
results it can simply be said that,Vikuge people are safe from being poisoned by iron metal.
However, iron metal is essential in human body which is taken into the body through green
vegetables and fruits guava contains relatively less iron, this may be observed through its
colour (yellowish) when ripe. Iron seems to accumulate in green vegetables and fruits
(Ryall and Lipton, 1982).
4.6 Heavy Metals in Roots at Vikuge
The selected roots under this study were cassava. The reason for taking this type of roots is
the demand of it at place where a big number of the Vikuge community members rely on it,
and take this as second staple food after maize.
The results therefore show the trend of distribution of heavy metal contaminants vary from
negligible (BDL) value to a significant level, where zinc being the leading (table 4.3). This
means that among all metals under study involving roots (cassava) zinc seems to dominate
because the environment had a source of zinc both naturally and due to ordinary human
activities.

64
4.6.1 Level of Cadmium Metal in Roots
The results show that the concentration of cadmium was not detected (BDL) (table 4.3).
This does not mean that there is no contamination in roots, only that the level was so small
to the extent the instrument could not detect. In this case we can say the people of Vikuge
are safe when using cassava as a second staple food and free form cadmium contamination.
According to FAO/WHO the maximum permissible value of cadmium in fruit is 8.86
mg/Kg. This means when a person eats above this value will be affected instantly. For this
reason it can simply be said that, the Vikuge people are out of the line of health hazard as
well as animals.
4.6.2 Levels of Lead Metal in Roots
The results indicate that the mean concentration of lead in roots (cassava) in Vikuge farm is
0.82 mg/Kg (table 4.3). This level is below the recommended maximum permissible value
according to FAO/WHO which is 6.95 mg/Kg. This big difference between the
experimental value and the standard value shows that the Vikuge people are safe.
Generally cassava in Vikuge area is abundant and there is no way one can escape from
eating this kind of food stuff since it can be eaten in three ways; as rough cassava (fresh
cassava) as boiled cassava (preferred by majority as snack during breakfast or evening meal
and the last form where cassava is used is cassava stiffporridge where dried cassava are
reduced to flour.
4.6.3 Levels of Copper Metal in roots
The results show that the mean concentration of copper in Vikuge roots (cassava) is very
small which is 0.03 mg/Kg (table 43.) This value is nearly 1000 times below the
recommended maximum permissible value as per FAO/WHO standard which is 300
mg/Kg. This means the Vikuge people are much safe from exposure to copper through
65
cassava, which is normally eaten daily in average. The low levels of copper in Vikuge
cassava may be due to the source of the metal in Vikuge environment which is not readily
available through human activities only the little from nature.
4.6.4 Leves of Zinc Metal in Roots
The results show that themeanconcentration of zinc metal in roots (cassava) is 1.45 mg/Kg
(table 4.3). This level is less than the recommended maximum permissible level which is
71.73 mg/Kg. This (FAO/WHO standards). Considering this difference between the
experimental value and the FAO/WHO standard, the consumption of cassava as a meal to
Vikuge people does not seem to pose health hazards. As stated earlier, the sources of zinc
in the area are so limited and the one found in the results is the one available in the natural
environment.
4.6.5 Levels of Chromium Metal in Roots
The experimental results for chromium metal in cassava at Vikuge village show that the
metal was not detected. This means the amount of chromium in the roots were below
detection limit. As stated earlier that any value below 0.01 mg/Kg could not be detected .
According to FAO/WHO standards the maximum permissible level of chromium in roots
(cassava in this case) is 100mg/Kg. This is to say the people at Vikuge are free form health
hazards which could be brought by chromium contamination in cassava, food.
4.6.6 Level of Iron in Roots
The results show that, the mean concentration of iron metal inVikuge roots (cassava) is
0.54 mg/Kg (table 4.3). This value is nearly 9000 times below the recommended
permissible maximum value according to FAO/WHO standard which is 5000mg/Kg. The
difference between the experimental value and the standard value suggests that the Vikuge

66
people are free to continue with the consumption of cassava, since the level does not seem
to pose health risks. As stated earlier the amount of iron into human body is essential for
the health especially when it doesnot exceed the permissible level for cassava, which is
again a very important crop at Vikuge and probably else where.
4.7 Heavy Metals in Hay at Vikuge
Hay plants were included in this study due to the facts that , in the area there is a state farm
for animals especially cows. The farm have hay plants for the purpose, the cows kept in
this farm rely on the well grown and cared hay plant. The concentrations of heavy metals in
hay seem to vary from 0.043 mg/Kg to 1.500 mg/Kg in cadmium and zinc respectively.
4.7.1 Levels of Cadmium in Hay
The mean value of cadmium concentrations in hay were 0.043 mg/Kg( table 4.1). This
value is nearly 50 times the minimum permissible value recommended by WHO/FAO,
taken in vegetables/leaves as there is no current record for hay. With this value it mean
there is no health threats for animals consuming the hay at Vikuge.
4.7.2 Levels of Lead in Hay
The mean value of lead metal concentration in hay plants at Vikuge is 1.329 mg/Kg (table
4.2). This level is nearly 40 times higher than the minimum permissible level according to
WHO/FAO which 0.300 mg/Kg. Lead is severely toxic to animals especially when
exceeds permissible level. In this case, these will be health hazards to Vikuge animals due
to lead contaminations in hay.

67
4.7.3 Levels of Copper in Hay
The results show that ,the mean level of copper in Vikuge hay were 0.159 mg/Kg (table
4.2) This value is nearly 15 times lower than the minimum permissible level which is 2.50
mg/Kg as per WHO/FAO standards. Again this value does not bring health threats to
Vikuge animals kept in state farm.
4.7.4 Levels of Zinc in Hay
The results show that the mean concentration of zinc metal in hay were 1.500 mg/Kg
(table 4.1) This value is nearly 60 times lower than the minimum permissible value (99.40
mg/Kg) as per WHO/FAO standards. This value does not bring health threats to Vikuge
animals.
4.7.5 Levels of Chromium in Hay
The results indicate that the mean concentrations of chromium metal in Vikuge hay were
0.782 mg/Kg (table 4.1) This level is nearly 30 times lower the minimum permissible value
( 2.50 mg/Kg ) as per WHO/FAO standards. Thus no health hazards to Vikuge animals.
4.7.6 Levels of Iron in Hay
The results indicate that the mean concentrations of iron metal in Vikuge hay were 0.79
mg/Kg (table 4.1). This value is nearly 500 times lower than the minimum permissible
level (425 mg/Kg) as per WHO/FAO standards. Therefore there is no health threats to
Vikuge animals.
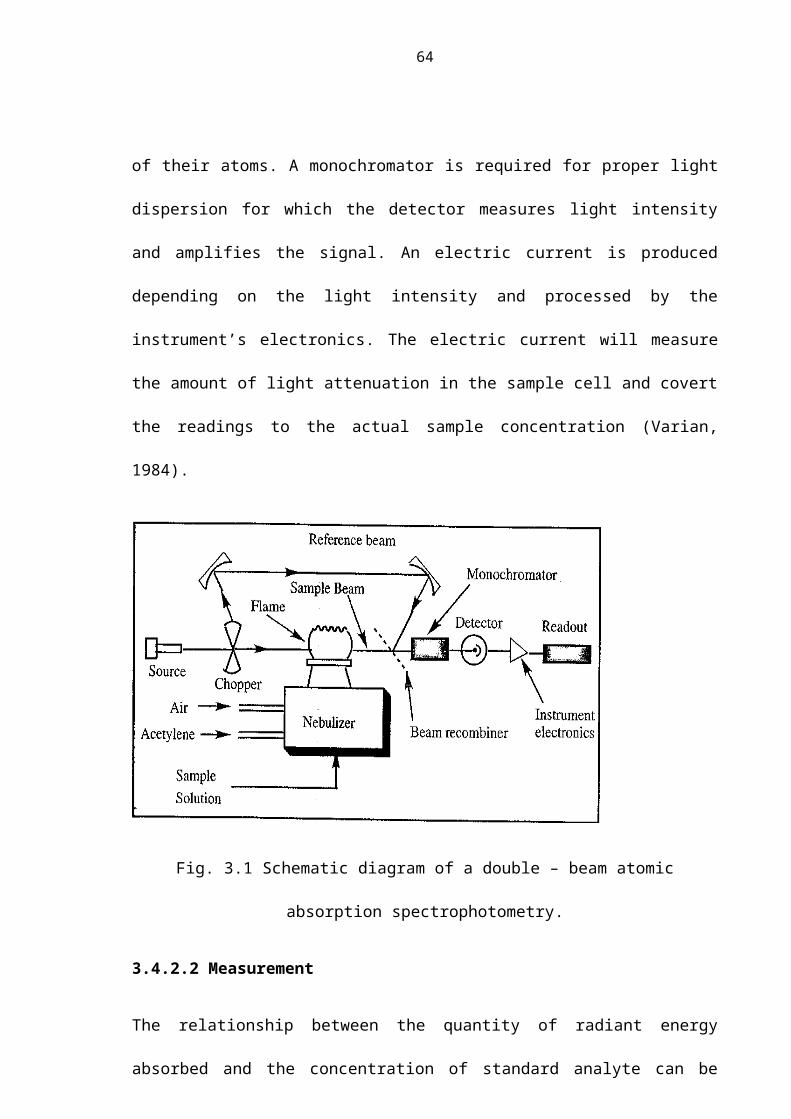
68
4.8 Water Quality Parameters Results
At Vikuge village, three wells are the only sources of water for all requirements including
drinking. The wells are located at a distance of nearly 100m from each other in triangular
form. Three samples were taken from each well
Table 4.6 Data for Water Quality Parameters
Sample W1 W2 W3
pH 5.51
5.51 5.50
5.43 5.43 5.45 6.26 6.26 6.27
Conductivity(us/cm)
62.40
62.40
62.40
52.6 52.60
52.50
73.90
73.80
73.80
Total dissolved soil (T.D.S) (mg/l)
31.90
31.90
31.91
26.70
26.70
26.70
72.40
72.40
72.50
Hardness (as CaCO3) (mg/l)
22.00
22.00
22.00
48.00
48.00
48.00
84.10
84.00
84.00
Chloride (Cl-) (mg/l)
45.20
45.20
45.21
38.60
38.70
38.80
56.20
56.20
56.10
Sulphate (So42-)
3.003.00
3.00 5.50
5.50 5.50
9.50
9.50 9.50
Nitrate (NO3-) (mg/l)
9.52
9.50 9.49
5.30
5.32 5.30
4.50 4.60 4.70
Table 4.7 Mean Value of Water Quality Parameters
Sample Mean experimental
data
Standard WHO/FAO data
(Source: internet)
pH 5.7 6.5 – 7.5
Conductivity(us/cm) 62.9 500
Total dissolved solid (T.D.S) (mg/l) 43.7 500
Hardness (as CaCO3) (mg/l) 51.3 120
Chloride (Cl-) (mg/l) 46.7 250
Sulphate (SO42-) (mg/l) 6.0 250
Nitrate (NO3-) (mg/l) 6.5 45

69
The column (i) contains the experimental data where as column (ii) contains the standard
data according to WHO/FAO.
4.8.1 pH Variation
There was a significant variation in pHvalues of the domestic water atVikuge from the only
sources (three wells located at intervals of 100 M from each other in a triangular structure).
The water was slightly acidic with pH range from 5.5 to 6.3. The range deviates from the
acceptable values for drinking water. According to WHO/TBS standards, drinking water is
recommended to have pH range from 6.5 to 7.5 ( Conradet al, 2002). It is difficult to get
these recommended values even from natural water due to many associated factors. The
main factor being; water is a universal solvent (can dissolve nearly every thing on earth) at
varying time interval. In VikugeVillage.The low pH water enhances corrosion of
galvanized steel pipes which will eventually release metal which inturn become dangerous
for human and animal health. Most open water bodies are exposed to various pollutants
from the environment, as it is the case for Vikuge water sources. The effect can be even
much higher when a body of water is passing through the industrial/squatter areas. This
may result in introducing various pollutants that can influence the increase or decrease of
the pH.(Kamagenge,1996). One of the most significant environmental impacts of pH is the
effect that it has on the solubility and thus the bioavailability of other substances. This
process is important in surface water run off from agricultural, domestic and industrial
areas which may contain iron, lead, chromium and other substances. The pH of water
affects the toxicity of these substances. As the pH falls (solution becomes more acidic)
many insoluble substances become more soluble and thus available for absorption(Zurera
et al, 1989).
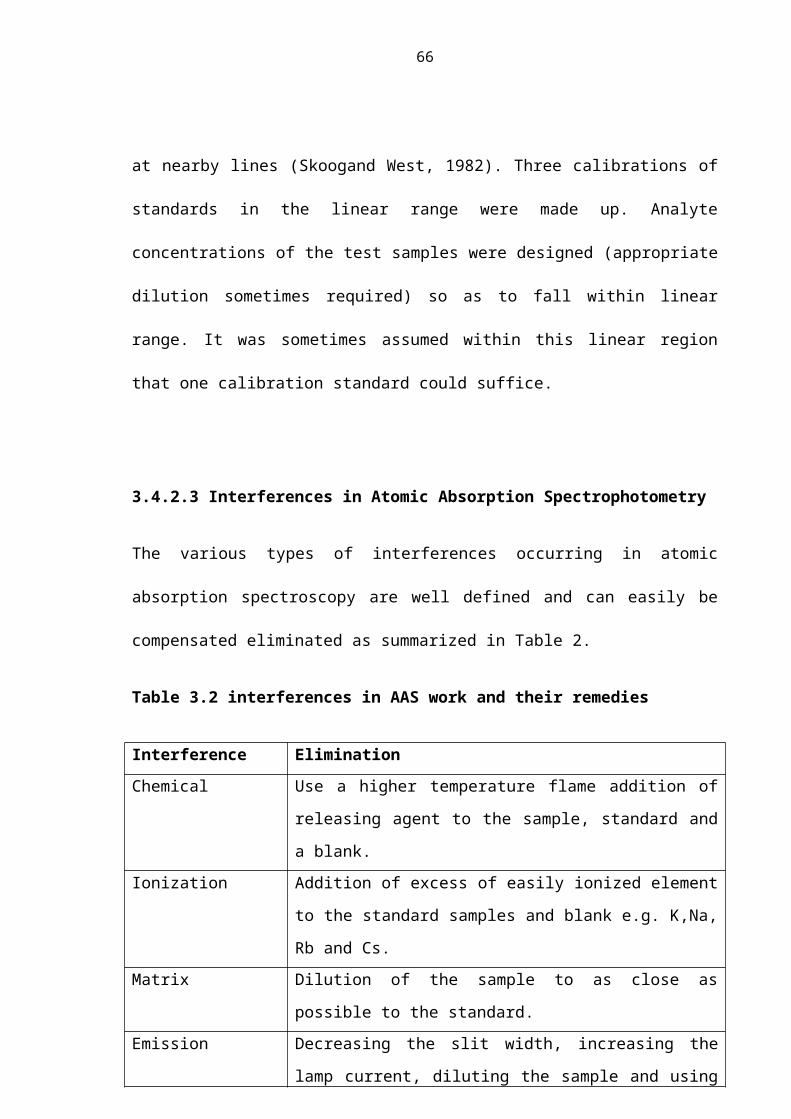
70
W1 W2 W30
1
2
3
4
5
6
7
Fig 4.3pH Values of water at Vikuge
The pH values are nearly the same from all wells from the results. The water in all the
wells appeared to be acidic due to the dissolved organic material. However the situation is
not alarming as it not so much beyond the recommended safe standardlimit by WHO/TBS
which range from 6.5 - 7.5, of pH (WHO, 2000).
4.8.2 Conductivity of Water
The results for conductivity of water from the Vikuge water sources ranged from 52.6
us/cm to 73.8 us/cm andindicated average value of 62.9 µs/cm from the three available
wells. Since wells are open water bodies ( as the case of Vikuge Village),the dissolved
material are inevitable. The human and other wastes become common sources of elevated
values of conductivity. Thegoodthing is the values are stillbelow the maximum permissible
value
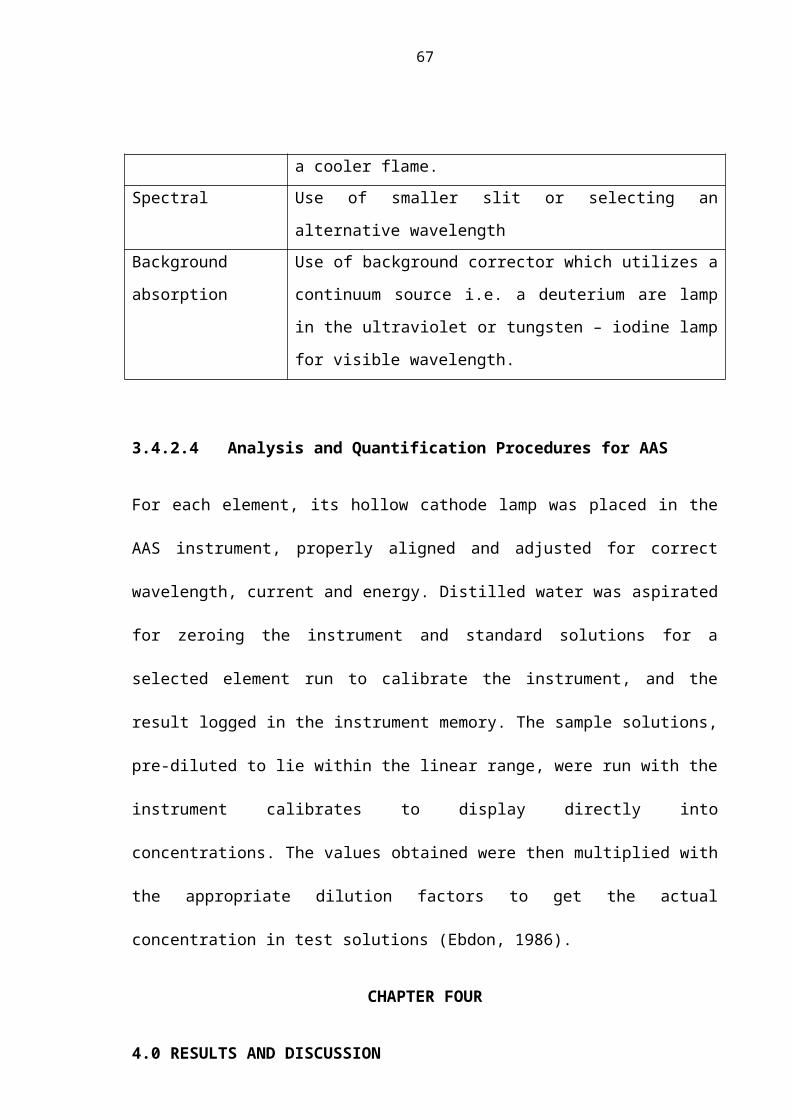
71
according to FAO/WHO which is 500 μs/cm ( WHO, 2000). This means the water does not
seem to pose health hazards to Vikuge people.
W1 W2 W3 Water samples0
10
20
30
40
50
60
70
80
Cond
uciti
vity
(µs/
cm
Fig 4.4 Variation of Conductivity of Vikuge water
The water is usually for multipurpose. Animals and human beings drink this water though
the colour itself does not impress one to drink. Since they are the only sources, this can not
be avoided. Figure 4.5 indicates that all the three wells( W1, W2 and W3) contain the
conducting materials. This can be explained in this way. The open wells and the built well
all contain the conducting origins. For open well the conducting materials originate from
surface material carried by running water but the built well, the conducting materials
originate from the materials produced from underground and from the soil. Electricity is
carried in the solution by the migration of ions. The measurement of conductivity gives
evaluable indications of the total ionic concentrations and therefore provides a useful
determinationof other analytical data, such as in organic minerals. Since conductivity of
water the amount of impurities available in it, this mean that, the higher the conductivity,
the greater the number of impuritities and therefore the lower the quality of water (Baily et
al,1996).
4.8.3 TDS Variation in Domestic Water Sources
The results for total dissolved solids (TDS) values have been stipulated in table 4.6. The
sevalues indicated that, there were particles dissolved in the said water. The expected
outcome for this kind of water being the sole source of water is the metabolic disturbances

72
when taken into body untreated, as is the case for Vikuge community members. However
the three wells of water (W1, W2and W3) are not cared enough, thus become a contributing
factor for foreign species to enter the wells. Flocculants (alum and poly electrolytes)
contributed to the increase of electrolyte species (WHO, 2000). The results shows that, the
mean value of TDS is 43.7 mg/l (table 4.7). This value is nearly 12 below the
recommended permissible value according to FAO/WHO standard. Which suggests that,
the Vikuge people are still safe when using the water for domestic purposes.TotalDissolved
solids in the material left over in a vessel after evaporation of a liquid.
This process tells how much solids was dissolve in the liquid under examination. This
parameter is aimed at looking the quality of water entitled for drinking according to
WHO/TBS standards should have TDS 10mg/1 in most cases it is difficult to find such
kind of water especially in developing countries, where water treatment is not very
common due to economical factors, butthis the standard, we should abide on it. In this
finding, the results for TDS as for fig.4.5 indicate that, there are particles dissolved in the
water under study. The samples of water from all the three wells indicated TSD varying
from 25.0 mg/1 to 75 mgl.The big range was caused as the fact that, out of the three wells,
only one was built to the extent that surface water can’t enter the while the rest are just dug
without any means of preventing surface running water to enter the wells.
As from the literature it was described that open wells cam easily be contaminated by the
run off water directed to the wells especially during rain seasons. Therefore, this is what
had happen to Vikuge water sources (the three wells) There are other possibility of
increase of TSD which is the internal deposit ie the naturally existing organic matter inside
and outside of wells. The amount of these deposits depends upon the area where the well as
dug.

73
W1 W2 W30
10
20
30
40
50
60
70
80
Fig. 4.5 Levels of TDS in Vikuge Water
The total dissolved solids from the groundwater were much greater than those from the
surface water. Since the surface water was prevented not to enter W3 thus the TDS at this
junction could be the materials which originated from the ground water and the soil.
4.8.4 Turbidity
Turbidity refers to the amount of suspended solids in water. As stated in literature, water
can be seen with suspended mobile particles, sometimes there particles are so minute to be
seen by nakes eyes microscope is used. All in all ,turbidity reflect low quality water.
Disinfectants can not work properly in the kind of water because the microorganisms are
protected by these
Suspended particles hence they are not killed by the disinfectants. In addition, turbidity
stimulated the growth of bacteria as a results water treatment process becomes very
difficult and expensive.
In Vikuge, water from the three wells where samples of water were taken was turbid at the
average of (59.9 NTU) .This value is above the recommended level by who (45 NTU).This
is one of the characteristics of open water bodies which are exposed to various chemical,

74
physical and biological; pollutants, particularly the open water bodies whose water is
stagnant .At vikuge village, the levels of turbidity as registered in (table 4.6) those W2 were
expected because those are open water bodies.
4.8.4 Hardness Variation in Domestic Water
The results for hardness values have been indicated in Figure 4.7.
These results indicate that there are alterations of the properties of water caused by the
presence of foreign bodies, principally calcium (Ca2+) and magnesium ions (Mg2+) as from
the literature. Hard water results when sufficient amount of calcium and magnesium ions
dissolve in it(Conrad et al 2002). The experiment therefore gives the value for hardness as
an average value 51.3 mg/L (Table 4.7). This value is below the recommended maximum
standard according to FAO/WO which is 120 mg/L. This shows that the Vikuge people are
still safe upon using the water.The results for hardness indicate that, vikuge water is hard to
an average of 51.30 mg/l in which calcium carbonate(CaCO3) was found to dissolve in it.
The property of water at one time may vary due to the amount of solute that had dissolved
in it, this is what we call hardness of water.Principally, calcium (Ca2+) and magnesium
(mg2+) frequently present at high concentration in hard water.
Thus we can simply state that, water is said to be hard when it contains soluble carbonates
of ca and mg. in hard water region, it is very common to see white deposits inside a
teakettle of other utensils used to heat water. In water pipes, the build up can cause serious
interference with water flow. In water heaters, the building interferes with heart transfer,
resulting in wastage energy and greater cost for water heating. Ground water supplies are
generally easier to install and operate. If the water is pure, it is as well easier to distribute to
consumers. In some cases it must be disinfected usually with chlorine to kill harmful
germs/bacteria. It may have to be softened, too, if the water is so “hard” that it clogs pipes

75
or will not easily produce leather with soap. The quality of drinking water in investigated
sources in the country reveals how water can be fit unfit depending on sources.
W1 W2 W30
10
20
30
40
50
60
70
80
90
mg/
l
Fig 4.6 Variation of Hardness of Water
As from the table 4.6 W3 water was at lowest quality compared to those of W1 and W2 for
the reasons mentioned before.
4.8.5 Nitrate Levels in Domestic Water
The nitrate levels in domestic water at Vikuge from well number one (W1) and well
number two (W2) which are open were 9.5 mg/l and 5.3 mg/l respectively, while the
third well which is covered the value is 4.6 mg/l.
The mean value for nitrate concentrations in water from the three wells was 6.5 mg/l. This
value is nearly 7 times less than the maximum permissible level according to WHO/ FAO
which is 45.0mg/l. This difference between the experimental value and the standard value
shows that the concentrations of nitrate in Vikuge water are not health threat so far. The
Vikuge people continue getting water from the locally drilled wells with little health
hazards. The variations of nitrate levels among the three wells are due to the fact the three
wells are exposed to different environments for example, W1, is an open well, where

76
pollutants from the soil enter the well easily. The nitrate sources include fertilizers and
manure animal feedlots, waste water and sludge, septic system, N- fixation from
atmosphere by legumes, bacteria and light ( Uriyo, et al 1979 ).rate in water when exceed
the recommended level is a poison although when it is in soil is a fertilizer and it is of
economic importance. It is very difficult to avoid the nitrate contaminations because nitrate
originate from nitrogen which is abundant in atmosphere (78%) by volume. Nitrogen
fixation bacteria which are responsible to convert nitrogen into are plenty everywhere. The
Vikuge water having that value of nitrates could not be avoided because of the nature of
the wells and their allocation ( low land) where plenty of trashes entering the wells from
the running water during rainy seasons. However the nitrate contaminations in vikuge
water did not exceed the recommended safe level as per WHO/TBS standards (
35mg/kg).Generally the nitrates pollution is from the surface decomposition of organic
matter and leaching from the soil including human wastes. Nitrogen is a constituent of
protein, chlorophyll and many other biological compounds. Upon the decomposition of
plan and animal matter, complex organic matter is broken down to simple form by bacterial
action. Protein for instance, are converted to amino acids and further reduced to ammonia
(NH4).If oxygen is present, the ammonia is oxidized to nitrite (NO2) and then to nitrate
(NO3).Therefore, nitrate is the final product of oxidation of ammonium and organic
nitrogen. This takes place in ground water. Ground water contamination by nitrate from
animal farms, septic tanks or pit latrines has been recorded in several cases.(Ntukula,
2002).
The high nitrate levels in many cities of the developing countries is due to human activities
and improper disposal of wastes and wastes as well.

77
W1 W2 W30
1
2
3
4
5
6
7
8
9
10Co
ne o
f Nitr
ate
Fig 4.7 Variation of nitrate levels at Vikuge water sources
From figure 4.8 the results suggests that, W1 contains a lot of nitrates, this is because W1
was open and dug at the plain surface where organic material were free to enter the well
especially during rainy season where organic material are carried by the running water into
the well. The results indicates the distribution of nitrates in Vikuge water as it was sampled
in the three wells w1,w2 and w3 bearing the average nitrate level of 6.5mg/1.
4.8.6 Chloride Levels in Domestic Water
The chloride levels in water at Vikuge are presented in Table 4.7. The results of chloride
levels in domestic water sources at Vikuge vary slightly from one well to another. This
variation is probably due to the surrounding environments of the well. Human excreta is the
potential source of chloride, since human excreta is rich in chloride because of
consumption of sodium chloride. Sea- water as another source of chloride but at Vikuge
water sources have no linkage with sea- water. The results show that the mean
concentration of chlorides in Vikuge water was 46.7 mg/l. This value is nearly 6 times

78
below the recommended maximum standard as per WHO/FAO standard which is 250 mg/l.
This means the Vikuge people are not in danger as it was assumed in theory.
W1 W2 W30
10
20
30
40
50
60
Fig 4.8 Variation of chloride levels at Vikugewatersources.
The explanations are just the same as those in figure 4.7 where organic and inorganic
material rich in chlorine are carried into the well (open well) by the running water during
rainy seasons. The level of chlorides in Vikuge water vary slightly from one well to another
as indicated in (table 4.7) which bears an average value of 46.70 mg/1.chloride is a very
common phenomenon in most mineral/natural water due to the existence of chloride in free
state in air and in combined from in soil and rocks.At Vikuge, the level of chlorides still
below the WHO/TBS permissible value.
We can still check the sources of the present one a part from the mentioned
above.Gererally the source of chlorides in Vikuge water is probably from human wastes,
since the location of wells may support the statement .During rain seasons the running
water carry many garbages down to the wells and since the wells are open. Human
settlements area also not very far from the wells, which is another problem because, wells
are usually fed by ground water which in turn may rely on replenishment from the pit

79
latrines, septic tanks and open sewers which are characterized by those settlements. Thus
problems associated with human wastes such as bacterial forms, chlorides, nitrates,
phosphates and other minerals such as sodium which become prominent in such wells.
Such sources are potential human health risks and require extra care by the responsible
authority.
4.8.8 Sulphates Levels in Domestic Water
The results of sulphate levels in domestic water sources at Vikuge vary from 3 mg/l to 9
mg/l within the three surrounding wells. Sulphate in domestic water is poison mainly in
drinking water especially when exceeds the permissible level. The primary source of
sulphates in domestic water is the ground, when there are traces of sulphur element in the
soil. The results show that the mean value of sulphates in Vikuge water was 6.0mg/l. This
value is much below the maximum permissible standard according to WHO/FAO which is
250mg/l. The difference between the experimental value and the standard value gives the
guarantee that the Vikuge people are still safe upon using this water, although further
treatment is needed to make the water free from chemicals. The analysis of Vikuge water
indicated the presence of sulphate (s) in all the three wells where samples of water were
drawn, have indicated the traces of sulphatess that vary between 3.0 mg/ l to 10 .0 mg/l.
however this level is still below the WHO/TBS toxic level which is 40mg/l. This means
Vikuge water is safe at this junction the traces of sulphates are very common in ground
water sources. This is because the polluted land contains a number of unclassified waste
materials such as nylon, rubber, woods etc whereby at the end of the day they end up being
burnt. The end product will eventually leach into the ground during rain season. In most
cases the end products of nylon and rubber will have traces of sulphur and finally
sulphates. Sulphur and sulphates are usually toxic when inhaled above 40mg/l in adults and

80
20mg/l in children. Thus for health reasons drinking water need to be treated and or
completely free sulpher.
W1 W2 W30
1
2
3
4
5
6
7
8
9
10
mg/
l
Fig 4.9 Variation of sulphate levels at Vikuge water sources.
In Figure 4.9, W3 contains a lot of sulphates although the well was built to avoid the
surface water to enter the well. This suggests that the sulphates originated from the ground.
It is a common phenomenon to find sulphur in deep soil or rocks which eventually through
various natural processes sulphates are produced and dissolve in water (Stove and Phillips,
1971).
4.9 Comparison of Levels of Heavy Metals among Sample Types
4.9.1 The Selected Heavy Metals
The average concentrations of the selected heavy metals in this study have been recorded
in Table 4.2 These include all those six heavy metals which are cadmium, lead, copper,
zinc, chromium, and iron. The table indicates the concentrations of these heavy metals in
soils, water, hay, guava, vegetables ;(sweet potato leaves and cassava leaves) and cassava.

81
Some metals seem to have either very low concentrations or not detected (below detection
limit). Almost all metals
selected in this study were significantly detected in nearly all samples. In water samples for
example, only copper were not detected (below detection limit). In soil, cadmium and
chromium were not detected, the two metals were also not detected in cassava. Iron was
found at highest concentrations in soil compared to water and any other item. This indicates
that at Vikuge, there is a significant source of iron in the soil. In water, iron concentrations
seemed to vary from 1.931 mg/Kg to 1.952 mg/Kg (Table 4.2). These values are still
above the WHO/TBS permitted levels for drinking water. For raw water (untreated) water,
these values are tolerable. Iron in water, especially raw (untreated) water, is introduced by
natural factors. One of them is the weathering of rocks. This metal is also contributed to the
water by the presence of particulate matter present in water.
The element deposits as the particulate and organic matter settle down through coagulation,
sedimentation and filtration stages of treatment. In this finding the concentrations of zinc
seem to follow that of iron especially in soil, vegetables (sweetpotato leaves) and cassava
leaves as well as in guava. Zinc in water and vegetables is the result of metallic mobility
from soil to surface water (running water) before being collected in wells. The dissolved
metals in soil are as well absorbed by plants through root hairs into roots and stem before
accumulation in leaves. The major pathway of zinc (and other metals) in water especially
running water (stream) is by sedimentation of particles and by sorption of dissolved metals
from surface water (Warren, 1981).
The three main kinds of particles transported by streams are bed load, suspended sediment
load and solutes (Daries, 1981). Considering the intensity of weathering and metal
solubility in aqueous medium zinc enters stream as solutes which are later precipitated in
the sediments.
82
4.9.1.1. Cadmium
The results, however, indicate that the Vikuge soil contains very little cadmium to the
extent that the instrument did not detect (BDL). The metal was not also observed in cassava
roots and leaves The minimum detected value was in water and guava which registered
0.01 mg/Kg. Although the value is small, it has already exceeded the WHO permissible
value which is 0.005 mg/Kg. This is because cadmium is very toxic where 0.01mg/Kgis
already a health hazards to human beings and animals.
Cadmium enters the environment through varieties of industrial operations. It is an
impurity found in zinc, also in by-products from smelting, electroplating, pigment and
plastic production.
Cadmium makes its way into the water supplies as a result of deterioration of galvanized
plumbing, industrial wastes or fertilizer contaminations. The insignificant levels of
cadmium in all the items under experimentation range from below detection limit (BDL) to
the highest value of 0.018 ppm recorded in sweet potato leaves(Table 4.1). This value
indicates that there were trace levels of cadmium at Vikuge which according to the above
description, is caused by the presence of zinc, where by cadmium is found in it as an
impurity.
4.9.1.2 Lead (Pb)
The results (Table 4.1) indicate that, lead levels were much significant with average value
of 1.150 mg/Kg, in water, 1.30 mg/Kg in hay, 1.14mg/Kg in guava and 1.10 mg/Kg in
cassava leaves 1.10mg/Kg. the rest of items the lead concentrations seemed to be
insignificant (less than 1.0 mg/Kg).The levels of lead were below the WHO standard limit.
This implies that in Vikuge village there is no threat due to lead contaminations The
pollution of water and soil by lead mainly originate from metallurgical wastes or from lead-
confining wastes which can percolate into soil through open wells. In case of lead pipes,

83
the contamination of water by lead is from corrosion of lead solder used to put together
water piping. Lead in the human body can cause serious damage to the brain, kidneys,
nervous system and red blood cells. (Bermaon,,1990). The lead contamination in Vikuge
can not originate from lead pipes since the samples were collected from water wells only.
The naturally occurring lead in the soil could be the main sources, being facilitated by the
movement of water during rainy season, carrying lead pollutants from one polluted area to
another. This is very likely the source because the wells involved in the research were all
open which can easily receive pollutants. Therefore in case of open wells as it is the case at
Vikuge, it is important to note that, the water quality status is influenced by the sum of the
following factors:
(i) the environmental stress and the waste loads in the sampling areas
(ii) inputs from the upstream where the stream picks up some waste loads. This is very
common during wet season. The latter component may diminish with distance
travelled. Generally waters from open wells are extremely polluted by heavy
metals (NEMC, 2002).
4.9.1.3 Copper
The results indicate that copper concentrations in soil and water at Vikuge village are
insignificant. For example in soil the average level is 0.115 mg/Kg, in water the level is
below the detection limit (BDL) while in the other samples the levels ranged from 0.033
mg/Kg to 2.010 mg/Kg.With these results, it implies that copper contamination in Vikuge
village is insignificant. This is so because the observed values are naturally occurring in
soil which can eventually cause pollution to water and in other items like vegetables, fruits,
roots etc in ordinary elemental mobility. However the values are not threat to living
organisms, they are within the torelable levels which are still below the WHO standards. In
ordinary situations copper is assumed to originate from mining industry, copper refining

84
and electroplating, metal processing and welding. To a greater extent though in trace
among copper in widely spread in soil(Gobas and Mackay, 1987).
4.9.1.4 Zinc
The results indicate that there is a lot of zinc at Vikuge averaging 8.368 mg/Kg in guava,
5.551 mg/Kg in sweetpotat leaves and 5.640 mg/Kg in cassava leaves. The metal seemed to
be not evenly distributed to all items, the reason to this is based on the kind of other
element already in the said item.
Zinc is very common element in most tropical soils and at high concentration it becomes
toxic to plants and animals. (Holton, 1988). Zinc being a non-transition element, does not
easily form many complexes in soils. Therefore it becomes more bio-available to plants
than lead. Zinc is found naturally in many mineral forming rocks. Because of its use in
vulcanization of rubber, it is generally found at higher levels near high ways. It also may be
present in industrial discharges. It is used to galvanize steel, and it is found in batteries,
plastic, wood preservatives, antiseptics and in rat and mouse poisons (zinc phosphide).
Corrosion of plumbing materials and industrial wastes result in contamination of treated
water sources (Hunt, 1989).
4.9.1.5 Chromium
The results (Table 4.2) indicate that the levels of chromium in Vikuge environment i.e. soil,
water, fruits, vegetables, roots and hay is insignificant as they range from (BDL) in soil
and cassava to average concentrations of 0.780 mg/Kg. in hay. These values show that,
there is no external spread of chromium element in Vikuge apart from the naturally
existing in the soil which is of trace amount below the WHO standard. Therefore no
detrimental effect is expected from chromium at Vikuge. Chromium is ubiquitous in the
environment, occurring naturally in air, water, rocks and soil. It is used in stainless steel,

85
electroplating of chrome, dyes leather tanning and wood preservatives. It occurs in several
forms, or oxidation states. Chromium is found in water supplies as a result of industrial
wastes contamination. The occurrence of excess chromium is relatively in frequant.
Chromium in water can be present in trivalent form (Cr3+) which is strongly soluble in
water and is considered essential in man for efficient lipid, glucose and protein metabolism.
Hexavalent chromium (Cr6+) can also be present in water and considered toxic. Chromium
is classified as a human carcinogen. (Berman, 1989).
Plants and animals do not bio –accumulate chromium; therefore the potential impact of
high chromium levels in the environment is acute toxicity to plants and animals. In animals
and humans this toxicity may be expressed as skin lesions or rashes and kidney and liver
damage (Mwijage, 2002).
4.9.1.6 Iron
The results indicate that there are plenty of iron in Vikuge soil (Table 4.1) nearly
16.00mg/Kg as an average, followed by sweet potato leaves 2.50 mg/Kg and in cassava
leaves 3.00 mg/Kg. while in water recorded an average of 2.00 mg/Kg.
Iron occurs naturally in ground water in three forms. Ferrous iron (clear water iron), ferric
iron, (red water iron) and heme iron (organic iron). Each can exist alone or in combination
with others. Ferrous ion is sometimes called ferrous bicarbonate. The water is clear when
drawn but it turns cloudy when it comes in contact with air. The air oxidizes the ferrous
iron and converts it to ferric iron. Ferric iron, or Ferric hydroxide is visible in water when
drawn, heme the name “red water iron” Heme iron is organically bond iron complexed with
decomposed vegetation. The organic materials complexed with the iron are called tennins
or lignin. These organics cause the water to have a weak tea or coffee colour. In the case of
Vikuge, iron levels in soil is associated with other natural impurities as a result oxidation
occuring making the soil brown. During rainy season, movement of water from the highly

86
contaminated area (point source) to less contaminated area, for this reason water is also
contaminated bearing in mind that the wells are open therefore of metals may enter the
wells.

87
CHAPTER FIVE
5.0 SUMMARY, CONCLUSIONS AND RECOMMENDATIONS
5.1 Summary
The samples of soil, water, leaves (vegetables), hay, fruits (guava) and roots(cassava) were
collected in triplicate. Polythene bags and plastic bottles were used to store those samples
in a dust-free area in the laboratory ready for digestion. The sampling were done at a
minimum of three sampling point and a maximum of five sampling points depending on
the spread of the intended samples. The sampling distances also depended on the scattering
of the intended samples. Water was collected at an interval of 100 m. from each well. Other
samples were collected at a distance of 100 m, 200 m and 300 m. Apart from water
samples, other samples such as vegetables, hay, fruits, roots and soil, the digestion was
done on them before analysis. Soil samples were collected at ten sampling points at an
interval of 100 m with a depth ranging from 10 cm to 15 cm. The analysis of all the
samples except water samples were done in an Atomic Absorption Spectrophotometer
(AAS). The results were then tabulated in table 4.1. The heavy metals intended in the
analysis were cadmium, lead, copper, zinc, chromium and iron. Mixed results showing
different levels of concentrations in the samples ranging from BDL to above the
recommended by WHO/FAO.
Water quality parameters were also analyzed to check the extent of pollution by toxic
material especially organic and inorganic in substances which includes the fast decaying
material. The parameters such as conductivity, hardness, turbidity, chlorides, sulphates,
nitrates and Total Dissolved Solids (TDS) were also checked to reveal the extent water
contaminations.
The average values of the results were tabulated in table 4.7. Pure drinking water must be
free from the mentioned parameters with pH value between 6.5 to 7.5. as per WHO/ FAO
standards. The results therefore indicate that Vikuge water have been polluted.

88
5.2 Conclusion
The study has revealed that;
The Vikuge environment ie water, soil and plants have been contaminated by toxic heavy
metals such as iron, zinc,lead, chromium, cadmium and copper. The analysis were done on
soil, water, hay, fruit(guava), vegetables(sweet potato leaves and cassava leaves) and in
roots(cassava). The results have shown significant levels of iron,zinc and to some extent
lead. The three toxic heavy metals were found in all the sample matrices under study.
Though most of them were found to be below the maximum permissible levels. The three
wells at Vikuge are all open allowing the material to enter thus polluting the water. During
rainy seasons running water carry garbages and dead organisms into wells thus by so doing
the level of nitrates, chlorides, and sulphates were detected. Unfortunately, the members of
Vikuge Village just fetch water from those wells and drink unbiled/untreated.
5.3 Recommendations
Pollution has become a worldwide problem to the extent that its consequences is observed
almost everywhere in the world. At present the world is experiencing a huge increase in
pollution compared to any other period in the world history. There is no single region
which is totally free from pollution, although in the developing world the situation is
worse.
Scientific investigations have revealed that pollution is connected to human activities such
as urbanization, industrialization, mining agriculture involving use of fertilizers and
chemicals as well as various technological expansions. The world is now experiencing
large increase of population (over 6billion). Human beings are always in search of
development and survival, to achieve this, various activities such as those named above

89
have to be performed. This means that population increase has resulted increasing human
activities leading to increasing rate of pollution.
Pollution disturbs the natural environment which results in disturbing the whole ecosystem
i.e. the living organisms including human being cannot proceed in theirordinary growth
cycle. For instance land pollution mainly affects soil microbial activities as a result there
will be adversehealth conditions. Water pollution affects acquatic ecosystems. Air pollution
is much more dangerous because it affects the atmosphere resulting in climatic
disturbances and global warming which is a bigger problem to human wellbeing. Human
health is dependent on a good environment, many of the factors that lead to a deteriorated
environment also lead to poor health. Pollution of the atmosphere, polluted or inadequate
water supplies and poor soil (leading to poor crops and inadequate nutrition) all present
dangers to human health and assist the spread of diseases. Global warming is the biggest
problem, the world is becoming warmer resulting in extremes of climatic changes such as
droughts, floods and rise of sea level which also brings increased risks to health from a
variety of causes. It is predicted that sea level will increase by 12cm by the year 2030.
Human health entirely depends on water, since nearly two thirds (2/3)of the human body is
water. Thus except for air the need of water is greater than any other need. If this is the
case, what will happen if water sources are polluted? We have seen that, there is an
indiscriminate disposal of domestic and industrial wastes into water bodies.
These wastes greatly contribute towards environmental pollution of surface and ground
water sources. In addition the destruction of catchmentareas, deforestation, poor
agricultural practices, misuse of pesticides and other agro-chemicals if left to continue will
cause water pollution or drying of water sources with consequences of drought and
desertification.
To maintain human health, there is a need to safeguard water and soil from being polluted
because they are the primary supporter of life, thus once these are polluted human health is

90
at risk. Heavy metals and other industrial chemicals if introduced into water and soil they
may remain undecomposed for a period of many years. Even when swallowed, they will
remain in the body unaffected and thus when a body dies and decay the chemicals are
released back to the environment and a new pollution cycle begins. This means, pollution
of any kind results in human health risk.
The recommendations are made to the researchers, the government and the general public.
To the researchers:
Some of the toxic material i.e. the heavy metals, their upper limits in foods and
beverages are not yet known at the WHO/TBS standards. It is recommended that
more researches are needed to increase the database for social utility.
The soil characteristics such as humas content; soil type, permeability etc. need to
be determined to check whether they have influence on the heavy metals uptake in
plants or not.
The mobility and toxicity of heavy metal pollutants depend upon the metal species.
More study is needed to identify and establish the relationships between the species
and their toxicity.
The recommendations to the government and general public:
Drinking water from all sources should be treated.
General public to be educated on the effects of pollutants in land, water and air so
that they can play their role where possible to minimize the effects..
Proper planning of residential areas, keep them away from industrial areas, keep
proper drainage systems and regular collection of garbages and carefully destroy
them or recycle them.
.

91
REFERENCES
Agramund M, Hernander J.M and Dorming J.L, Levels of dioxins and furans in plasma
of occupationally exposed subjects living near hazardous waste in cinerator.
Journal of exposure and analysis of Environmental Epidemology Vol.15, 29-34
(2005).
Aitio, A. AvoA. Jarvisalo. J. and Vainio V. Trace elements in health and disease Royal
Society of chemistry, Cvoambridge (1991).
Ak’habuhayaJ. and Martin L. International Journal of Environment (1988).
Alloway, B.J. Heavy metals in soils, Chapman and Hall, London, (1994).
American Heritage Dictionary (2006).
APHA; standard methods for the examination of water and waste water, 18th edition USA,
(1992).
Baetz, R.A. and Kenner, C.T. Agriculture and food Chemistry, (1975).
Bahemuka, R.E. MSc. Dissertation, University of Dar es Salaam (1995).
Baily, D. Bilderback, T. and Bir D., Water container production of plants; in Kessler T.R.
Horticulture information leaf let 557. North Carolina state University (1996).
Berman E.Toxic metals and their analysis (6th edition). Heyden and sons ltd; London
(1989).
Bogh, C., Clarke, S.E., Jawara M., Thomas, C. J. and lIndsay S. W. (2003) Localized
breeding of the Anopheles gambiaecomple (Diptera: Cilicidae) along the river

92
Gamia, East Africa. Bulletin of Entomological Research 93,
279 - 289.(2003)
Browing E. Toxicology of Industrial metals (2nd edition)Butter worth and Company Ltd
London (1969)
Calderon R.J. Toxicology and Industrial health (1993).
Cano, J., Descalzo, M. A. Moreno, M., Chen, Z., Nambo, S., Bobuakasi, I., Buatich, J. N.,
Melchor, O. Micha, F. and Benito, A. Spatial variability in the density, distribution
and vectorial capacity for anopheline species in a high transmission village
(Equatorial Guinea) Malaria(2006).
Chaney, R.L. Street S.S. and Miekle H.W Heavy metals in Urban soils Washing tone
Journal 5:21(1984).
Charlwood, J.D., Vij., R. and Billingsley, P. F. Dry season refugia of malaria transmitting
mosquitoes in a dry savannah zone of east Africa. American Journal of tropical
Medicine and Hygiene 62, 726 – 732.(2000).
Christensen, T.H. Cadmium absorption at low concentration. Evidence of competition by
other heavy metals (1987).
Dahi, E. and Jens T. levels and Mechanisms of contamination of drinking water in Dar es
Salaam:selected fields on hygiene drinking water quality in Tropics, center for
developing Countries of Denmark(1992).
93
Daries B.F Trace element pollution (1981).
Drewnowsk, Sustainable Environment (2010).
Ebdon, L. An introduction to Atomic spectros copy. 1st edition, heyden and son press,
Norwich (1986).
FAO/WHO Codex Alimentarius Commision, CODEX STAN-179,(1991).
Fillenger, U., Sonye G., Killeen, G., Knols, B.G., and Beeker, N. The practical
importance of permanent semi-permanent habitats for controlling aquatic stages if
Anopheles gambiaesensulato mosquitoes: operational observation from a rural
town in western Kenya. Tropical Medicine and international Helath 9,1274 – 1289
(2004).
Frederick, A. Rasmussen, Paul Holobinko and Victor M. Showatter. Man and his
environment (1984).
Geier, M. Sass, H. and Boeckh, A search for components in human body odour that
attract females of Aedesaegypti. Ciba Foundation Symposium 200.132-
144.(1996).
GelchellRippinVarnes (2000) Perspective on Health (2000).
Geldreich E,E,J. Environment Toxicology water quality (1991).
Gillies, M.T. and Coetzee, M. A supplement to the Anophelinae of Africa South of the
Sahara (Afro-tropical region).The South Africa Institute for Environment (1987).

94
Gobas, F.A.P.C. and Mackay D. Environmental toxicology chemicals (1987).
Greenberg, A.E, Trussel, R.R, and Clesseri, L.S, Standard methods for water and waste
water 16th edition, Butter Worth and Co. ltd (1985)
HACH DR/820, DR/850 and DR/890 Data Logging Calorimeter Hand Book (1997).
Hoadland D; The inorganic nutrients of plants in McGraw-Hill Encylopedia of Science and
Technology (1994).
Holden, W.S. water treatment and Examination J. and A Churchill, London (1970).
Holton M.S.C A silent epidemic of environment the environmental, mercury and arsenic
entering the environment from human activities (1988).
Hunt C.D. Trace element Residue, (1989).
Ifon, E.T. and Bassir, O. Food chemistry (1989).
Jacobs, A and Worwood, M. Blood and its disorder; Oxford, black well (1974).
Jones, M.M. Johnston, D.). Nettervile J.T. and wood J.L; Chemistry, Man and Society,
Sounders, (1983).
Kamagenge V/M MSc. Dissertation, University of Dar es Salaam (2000).
Khan, M.R and Gijzen, H.J. Environmental pollution and its management in Eastern
Africa, Faculty of Science, University of Dar es Salaam Tanzania (2000).
Khan, N.A. Ahmad A. and Ajmac M, Environment pollution (1981).
Kupchela, C.E and Halnd M.C Environmental Science, Allyn and Bacon inc. (1996).
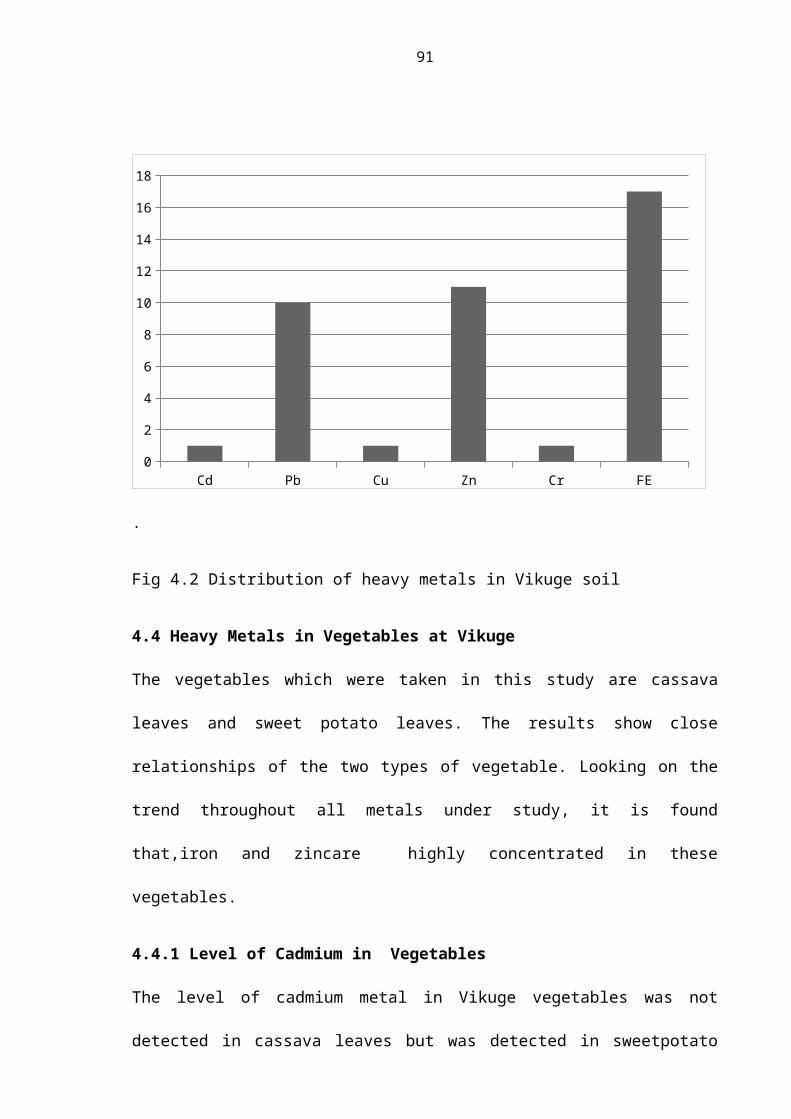
95
LechevallierM.w. Evans R.M. and seidler, R.J Application of Environmental Microbiology
(1981).
Maleki, A. Masoud, A.Z. Heavy metals in selected edible vegetables and Estimation of
their intake in Sanandaj, Iran, South East Asian, J. Trop med Public Health 39 (2)
335-340 (2008).
Manfred F.B. Kweyunga, C. and Manoko M. levels of heavy metals of Cyanide in soil,
Sedments and water from Vicinity of North Mara Gold Mine in Tanzania, a
report submitted to CCT (2009).
Masteron, slownsk and Stanitsk; polluted Environment (1981).
McFeters, G.A; Drinking water Microbiology, Springer Verlag, New York (1990).
Mihale, M.Chemodynamics of Obsolete pesticides at Vikuge Farm, Kibaha
District, Tanzania, M. Sc. Thesis, University of Dar es Salaam, (2002).
Mkuula ,S.S and Mpendazoe, F.M.T. Disposal of industrial wastes in Tanzania (2004).
Mosha, D. and Schroder ,K. Eastern and Southern Africa Environmental chemistry network
Workshop proceedings, Masern Lesotho (1980).
Mugasha A.L. MSc Thesis, University of Dar es Salaam (1995).
Muller.H.G. and Tobin, G. Nutrition and food processing.The Ari publishing company Inc.
London (1980).
Mwandosya, M.J. Nyeni B.S. and Luhanda M.L. (1998). The assessment of vulnerability
96
and adaptation to climate change impacts in Tanzania. Dar es Salaam Tanzania
center for Energy Environmental Science and Technology (CEEST), (1998).
Mwijage E.F. Mobilization of selected chemical Constituents into human food Chain Via
Horticultural produce frown in Dar es Salaam, M.sc Thesis, University of Dar es
Salaam (2002).
National Environmental Council (2002).
National Environmental policy (1997).
Neilesn, F.H; hunt, C.D Mullen L.M. and Gallagher S.K.J. Trace elements (1990).
NEMC, Chemical waste, NEMC database at National Environmental management council
Dar es Salaam. (1994).
Nicholas Foskett and Rosalina Foskett.People, Environment and Conservation (2002).
Nriagn J.O.A silent epidemic of environmental poisoning and pollution (1988).
Ntukula, T.W.M.Scdissertation University of Dar es Salaam (2002).
Othman O.O. lead, cadmium, chromium, zinc< nickel and copper in green vegetables and
soil from different areas in Dar es Salaam Tanzania Journal of Science paper
no. 250 (1999).
Parker L. Water quality and its impacts on popular leefy vegetables in tropics case study of
Dar es Salaam, MIRT- University of Dar es Salaam.(2002).

97
Perkin – Elmer, AAS analytical Instruments Guide to Techniques and Application of
Atomic Absorption Spectrophotometry. Norwalk conn (1984).
Prasad A.S and Charles C.T. Zinc Metabolism, Spring field (1996).
Robert Gardner, Water, the life sustaining resource (1982).
Ryall A.L. and Lipton W.J. Handling transportation and storage of fruits and
vegetables.The AVI Publishing Company inc London (1982).
Saxena M.M Environmental Analysis, Water, Soil and Air, Agro botanical Publisher. India
(1987).
Sharma, N., T. Damhang, E. Gilgan – Hunt, D. Grey, V. Okaru and D. Rothberg.African
Water Resources: Challenges and Opportunities for Sustainable Development,
World Bank Technical Paper No. 33, African Technical Department Series, The
World Bank, Washington DC, USA (1996).
Skoog D.A. and West, D.M Fundamental of Analytical Chemistry 4th Edition Hot –
Sounders Co.( 1982).
TBS (Tanzania Bureau of standards), specifications for natural mineral water (1997).
Tsubaki and Irukayama (1977).
Ukopong E.E and Olade M.A. Geochemical survey for Lead- Zinc mineralization,
Nigeria,John, Willey and Sons, Environmental Pollution (1987).

98
Varian B. Analytical methods for Atomic Absorption spectrophotometry, Varian Australia
pty ltd, Australia (1989).
Warren, L. Environmental pollution (1981).
WHO Guidelines for drinking water quality Geneva, (1985).
WHO: Global water supply and sanitation assessment (2000).
World Health Organization, Guidelines for Drinking water quality Vol. 2 Health criteria
and other supporting information Geneva (1984).
Zurera G. Moreno, R. and Pozo R.J. Science of food and Agriculture (1989).