view - drum - university of maryland
TRANSCRIPT

ABSTRACT Title of Thesis: EVALUATION OF SMOKE DETECTOR
RESPONSE ESTIMATION METHODS
Justin Aaron Geiman, Master of Science, 2003
Thesis directed by: Professor James A. Milke Department of Fire Protection Engineering
Approximation methods exist to provide estimates of smoke detector response based on
optical density, temperature rise, and gas velocity thresholds. The objective of this study
was to assess the uncertainty associated with these estimation methods. Experimental
data was used to evaluate recommended alarm thresholds and to quantify the associated
error. With few exceptions, less than 50 percent of the predicted alarm times occurred
within ± 60 seconds of the experimental alarms. At best, errors of 20 to 60 percent (in
under-prediction) occurred for smoldering fires using an optical density threshold. For
flaming fires, errors in predicted alarm times on the order of 100 to 1000 percent in over-
prediction of the experimental alarms were common. Overall, none of the approximation
methods distinguished themselves as vastly superior. Great care must be exercised when
applying these approximation methods to ensure that the uncertainty in the predicted
alarm times is appropriately considered.

EVALUATION OF SMOKE DETECTOR RESPONSE ESTIMATION METHODS
by
Justin Aaron Geiman
Thesis submitted to the Faculty of the Graduate School of the University of Maryland, College Park in partial fulfillment
of the requirements for the degree of Master of Science
2003 Advisory Committee:
Professor James A. Milke, Chair Professor Frederick W. Mowrer Dr. Daniel T. Gottuk

© Copyright by
Justin Aaron Geiman
2003

ii
ACKNOWLEDGEMENTS
First, I need to thank my wife Vicki for her patience, love, and understanding throughout
this project. I am equally indebted to my entire family for their support during my
education. In particular, I must thank my grandfather, John Means, Sr., for encouraging
me to pursue an education in fire protection engineering.
I would like to thank Professor Jim Milke for serving as my primary advisor on this
project. The guidance and insightful comments provided by Professor Milke improved
the quality of this work. Dr. Dan Gottuk has been a mentor to me for several years and
provided much of the day-to-day advice that kept this project moving forward. Dan also
initially sparked my interest in fire detection research and for that I am grateful.
Professor Fred Mowrer provided valuable commentary on this research. I sincerely
appreciated Professor Mowrer’s encouragement in the early stages of this research.
Special thanks are extended to Dr. Frederick Williams of the Naval Research Laboratory
and Dr. Joseph Su of the National Research Council of Canada for graciously providing
the experimental data used in this work.

iii
TABLE OF CONTENTS
LIST OF TABLES.............................................................................................................. v
LIST OF FIGURES .......................................................................................................... vii
CHAPTER 1: INTRODUCTION....................................................................................... 1
1.1 RESEARCH GOALS ..................................................................................................... 2 1.2 RESEARCH SCOPE ...................................................................................................... 2
1.2.1 Phase 1 – Threshold Evaluation ........................................................................ 3 1.2.2 Phase 2 – Threshold Uncertainty ...................................................................... 4
CHAPTER 2: LITERATURE REVIEW............................................................................ 6
2.1 DETECTOR OPERATING PRINCIPLES ........................................................................... 7 2.2 SMOKE MEASUREMENTS............................................................................................ 9 2.3 SMOKE DETECTOR MODELING APPROACHES........................................................... 14
2.3.1 First-Principles Methods ................................................................................. 15 2.3.2 Approximation Methods................................................................................... 21
2.3.2.1 Optical Density Method............................................................................ 21 2.3.2.2 Temperature Rise Method......................................................................... 26 2.3.2.3 Critical Velocity Method .......................................................................... 33
CHAPTER 3: OVERVIEW OF EXPERIMENTAL DATA............................................ 37
3.1 NAVY TESTS ............................................................................................................ 37 3.1.1 Test Spaces....................................................................................................... 37 3.1.2 Fire Sources ..................................................................................................... 38 3.1.3 Smoke Detectors............................................................................................... 39 3.1.4 Instrumentation................................................................................................ 41
3.2 KEMANO TESTS ....................................................................................................... 42 3.2.1 Test Spaces....................................................................................................... 43 3.2.2 Fire Sources ..................................................................................................... 43 3.2.3 Smoke detectors ............................................................................................... 44 3.2.4 Instrumentation................................................................................................ 46
CHAPTER 4: PHASE 1 RESULTS ................................................................................. 48
4.1 VARIABLES CONSIDERED......................................................................................... 48 4.2 DEVELOPMENT OF STATISTICAL DESCRIPTION ........................................................ 49 4.3 OPTICAL DENSITY AT ALARM.................................................................................. 54
4.3.1 Statistical Description...................................................................................... 54 4.3.2 Comparison to Common Thresholds ............................................................... 61
4.4 TEMPERATURE RISE AT ALARM............................................................................... 68 4.4.1 Statistical Description...................................................................................... 68 4.4.2 Comparison to Common Thresholds ............................................................... 71
4.5 VELOCITY AT ALARM .............................................................................................. 73 4.5.1 Statistical Description...................................................................................... 74 4.5.2 Comparison to Common Thresholds ............................................................... 79
4.6 RELATIONSHIP BETWEEN OPTICAL DENSITY AND TEMPERATURE RISE AT ALARM.. 80

iv
CHAPTER 5: PHASE 2 RESULTS ................................................................................. 85
5.1 DESCRIPTION OF THRESHOLD EVALUATOR AND ANALYSIS APPROACH................... 85 5.2 UNCERTAINTY IN ALARM PREDICTIONS USING OPTICAL DENSITY THRESHOLDS..... 92 5.3 UNCERTAINTY IN ALARM PREDICTIONS USING TEMPERATURE RISE THRESHOLDS 116 5.4 UNCERTAINTY IN ALARM PREDICTIONS USING VELOCITY THRESHOLDS ............... 122
CHAPTER 6: CONCLUSIONS ..................................................................................... 124
6.1 RECOMMENDATIONS.............................................................................................. 131 6.2 FUTURE WORK ...................................................................................................... 133
APPENDIX A: PHASE 1 DATA – VALUES AT ALARM ......................................... 135
APPENDIX B: PHASE 2 DATA – PREDICTED ALARM TIMES............................. 149
REFERENCES ............................................................................................................... 232

v
LIST OF TABLES
TABLE 1 - REPRESENTATIVE OPTICAL DENSITY VALUES AT ALARM FOR FLAMING FIRES FROM HESKESTAD AND DELICHATSIOS [1977]........................................................... 22
TABLE 2 - 20TH, 50TH, AND 80TH PERCENTILE VALUES OF OPTICAL DENSITY AT DETECTOR RESPONSE FROM GEIMAN AND GOTTUK [2003]. ........................................................ 25
TABLE 3 - RATIO OF OPTICAL DENSITY TO TEMPERATURE RISE FOR VARIOUS FUELS ......... 28
TABLE 4 - REPRESENTATIVE TEMPERATURE RISE TO DETECTION FOR FLAMING, SPREADING FIRES FROM HESKESTAD AND DELICHATSIOS [1977]. ................................................ 29
TABLE 5 - FIRE SOURCES USED IN THE SECOND SERIES OF NAVY TESTS............................. 39
TABLE 6 - SMOKE DETECTORS USED IN THE NAVY TESTS .................................................. 40
TABLE 7 - FIRE SOURCES USED IN THE KEMANO TESTS...................................................... 44
TABLE 8 - STATISTICAL DESCRIPTION OF NAVY OPTICAL DENSITY (M-1) AT ALARM DATA, GROUPED ACCORDING TO FIRE TYPE, DETECTOR TYPE AND DETECTOR NOMINAL SENSITIVITY. .............................................................................................................. 55
TABLE 9 - STATISTICAL DESCRIPTION OF NAVY OPTICAL DENSITY (M-1) AT ALARM DATA, GROUPED ACCORDING TO FIRE TYPE, DETECTOR TYPE, DETECTOR NOMINAL SENSITIVITY (WHERE APPLICABLE), AND VENTILATION.............................................. 57
TABLE 10 - FINAL STATISTICAL DESCRIPTION OF NAVY OPTICAL DENSITY (M-1) AT ALARM DATA.......................................................................................................................... 58
TABLE 11 - FINAL STATISTICAL DESCRIPTION OF KEMANO OPTICAL DENSITY (M-1) AT ALARM DATA.............................................................................................................. 60
TABLE 12 - 20, 50, AND 80 PERCENT OPTICAL DENSITY ALARM THRESHOLDS (M-1) USED IN THIS STUDY (BASED ON DATA FROM GEIMAN AND GOTTUK [2003]). ......................... 66
TABLE 13 - STATISTICAL DESCRIPTION OF NAVY TEMPERATURE RISE (°C) AT ALARM DATA FOR FLAMING FIRES, GROUPED ACCORDING TO DETECTOR TYPE AND DETECTOR NOMINAL SENSITIVITY. .............................................................................................. 69
TABLE 14 - STATISTICAL DESCRIPTION OF NAVY TEMPERATURE RISE (°C) AT ALARM DATA FOR FLAMING FIRES, GROUPED ACCORDING TO DETECTOR TYPE AND VENTILATION STATUS....................................................................................................................... 70
TABLE 15 - STATISTICAL DESCRIPTION OF TEMPERATURE RISE (°C) AT ALARM DATA FOR BOTH TEST SERIES, GROUPED ACCORDING TO FIRE TYPE AND DETECTOR TYPE........... 70
vi
TABLE 16 - STATISTICAL DESCRIPTION OF VELOCITY MAGNITUDE (M/S) AT THE TIME OF ALARM FOR FLAMING FIRES, GROUPED BY DETECTOR TYPE AND NOMINAL SENSITIVITY.................................................................................................................................... 77
TABLE 17 - STATISTICAL DESCRIPTION OF VELOCITY MAGNITUDE (M/S) AT THE TIME OF ALARM FOR FLAMING FIRES, GROUPED BY VENTILATION STATUS............................... 78
TABLE 18 - MEAN AND MEDIAN ERROR IN PREDICTED ALARM TIMES USING THE NOMINAL SENSITIVITY OF THE DETECTORS AS AN ALARM THRESHOLD. ..................................... 95
TABLE 19 - MEAN AND MEDIAN ERROR IN PREDICTED ALARM TIMES USING AN OPTICAL DENSITY OF 0.14 M-1 AS AN ALARM THRESHOLD. ..................................................... 100
TABLE 20 - MEAN AND MEDIAN ERROR IN PREDICTED ALARM TIMES FOR THE NAVY TESTS USING THE 20 PERCENT (TOP), 50 PERCENT (MIDDLE), AND 80 PERCENT (BOTTOM) OPTICAL DENSITY ALARM THRESHOLDS FROM TABLE 12. ........................................ 106
TABLE 21 - MEAN AND MEDIAN ERROR IN PREDICTED ALARM TIMES FOR THE KEMANO TESTS USING THE 20 PERCENT (TOP), 50 PERCENT (MIDDLE), AND 80 PERCENT (BOTTOM) OPTICAL DENSITY ALARM THRESHOLDS FROM TABLE 12. ....................... 112
TABLE 22 - MEAN AND MEDIAN ERROR IN PREDICTED ALARM TIMES USING A TEMPERATURE RISE OF 4 °C AS AN ALARM THRESHOLD................................................................... 118
TABLE 23 - MEAN AND MEDIAN ERROR IN PREDICTED ALARM TIMES USING A TEMPERATURE RISE OF 13 °C AS AN ALARM THRESHOLD................................................................. 120
TABLE 24 - OVERVIEW OF RESULTS FROM USING THE MATERIAL SPECIFIC TEMPERATURE RISE THRESHOLDS FROM HESKESTAD & DELICHATSIOS [1977] AS DETECTOR ALARM THRESHOLDS. ........................................................................................................... 122

vii
LIST OF FIGURES
FIGURE 1 - BOX PLOTS ILLUSTRATING THE NON-NORMAL DISTRIBUTIONS OF OPTICAL DENSITY AT ALARM DATA. ......................................................................................... 51
FIGURE 2 - CUMULATIVE DISTRIBUTION OF OPTICAL DENSITY AT ALARM TO ILLUSTRATE RATIONALE FOR USING 20TH AND 80TH PERCENTILES................................................... 53
FIGURE 3 - PERCENTAGE OF DETECTORS THAT ALARMED AT AN OPTICAL DENSITY LESS THAN OR EQUAL TO THE NOMINAL SENSITIVITY OF EACH DETECTOR.......................... 63
FIGURE 4 - PERCENTAGE OF DETECTORS THAT ALARMED AT AN OPTICAL DENSITY LESS THAN OR EQUAL TO THE NOMINAL SENSITIVITY OF EACH DETECTOR FROM THE DATA OF GEIMAN AND GOTTUK [2003].................................................................................... 64
FIGURE 5 - PERCENTAGE OF DETECTORS THAT ALARMED AT AN OPTICAL DENSITY LESS THAN OR EQUAL TO 0.14 M-1. ..................................................................................... 65
FIGURE 6 - PERCENTAGE OF DETECTORS THAT ALARMED AT AN OPTICAL DENSITY LESS THAN OR EQUAL TO THE 20, 50, AND 80 PERCENT OPTICAL DENSITY ALARM THRESHOLDS FROM TABLE 12. ................................................................................... 67
FIGURE 7 - PERCENTAGE OF DETECTORS THAT ALARMED AT A TEMPERATURE RISE LESS THAN OR EQUAL TO EACH TEMPERATURE ALARM THRESHOLD FOR NAVY TESTS WITH FLAMING FIRES........................................................................................................... 72
FIGURE 8 - VELOCITY MAGNITUDE AS A FUNCTION OF TIME FOR TEST NAVY-2-05, A SMOLDERING LACTOSE / POTASSIUM CHLORATE FIRE WITH NO VENTILATION. ........... 75
FIGURE 9 - NOISY VELOCITY DATA AT ELEVATED TEMPERATURES FOR TEST NAVY-2-10.77
FIGURE 10 - OPTICAL DENSITY TO TEMPERATURE RISE RATIOS FOR FLAMING WOOD CRIB FIRES. ......................................................................................................................... 81
FIGURE 11 - TEMPERATURE RISE AT ALARM PLOTTED AS A FUNCTION OF OPTICAL DENSITY TO TEMPERATURE RISE RATIO AT ALARM FOR THE NAVY FLAMING WOOD CRIB FIRES.................................................................................................................................... 83
FIGURE 12 - SCREEN SHOT OF USER INPUT WORKSHEET IN THE THRESHOLD EVALUATOR. 86
FIGURE 13 - PERCENTAGE OF UNDER-PREDICTED AND OVER-PREDICTED ALARMS USING THE NOMINAL SENSITIVITY OF THE DETECTORS AS AN ALARM THRESHOLD....................... 93
FIGURE 14 - PERCENTAGE OF PREDICTED ALARMS THAT OCCURRED WITHIN ±30 AND ±60 SECONDS OF THE EXPERIMENTAL ALARM WITH THE NOMINAL SENSITIVITY OF DETECTORS USED AS AN ALARM THRESHOLD. ............................................................ 97

viii
FIGURE 15 - PERCENTAGE OF UNDER-PREDICTED AND OVER-PREDICTED ALARMS USING AN OPTICAL DENSITY OF 0.14M-1 AS AN ALARM THRESHOLD. .......................................... 98
FIGURE 16 - PERCENTAGE OF PREDICTED ALARMS THAT OCCURRED WITHIN ±30 AND ±60 SECONDS OF THE EXPERIMENTAL ALARM WITH AN OPTICAL DENSITY OF 0.14 M-1 USED AS AN ALARM THRESHOLD. ...................................................................................... 101
FIGURE 17 - PERCENTAGE OF UNDER-PREDICTED AND OVER-PREDICTED ALARMS FOR THE NAVY TESTS USING THE 20 PERCENT (TOP), 50 PERCENT (MIDDLE), AND 80 PERCENT (BOTTOM) OPTICAL DENSITY ALARMS THRESHOLDS FROM TABLE 12. ..................... 104
FIGURE 18 - PERCENTAGE OF PREDICTED ALARMS THAT OCCURRED WITHIN ±30 AND ±60 SECONDS OF THE EXPERIMENTAL ALARM FOR THE NAVY TESTS USING THE 20 PERCENT (TOP), 50 PERCENT (MIDDLE), AND 80 PERCENT (BOTTOM) OPTICAL DENSITY ALARM THRESHOLDS FROM TABLE 12. ................................................................................. 108
FIGURE 19 - PERCENTAGE OF NAVY EXPERIMENTAL ALARMS BOUNDED BY THE 20 PERCENT AND 80 PERCENT OPTICAL DENSITY ALARM THRESHOLDS FROM TABLE 12.............. 109
FIGURE 20 - PERCENTAGE OF UNDER-PREDICTED AND OVER-PREDICTED ALARMS FOR THE KEMANO TESTS USING THE 20 PERCENT (TOP), 50 PERCENT (MIDDLE), AND 80 PERCENT (BOTTOM) OPTICAL DENSITY ALARM THRESHOLDS FROM TABLE 12. ........ 111
FIGURE 21 - PERCENTAGE OF PREDICTED ALARMS THAT OCCURRED WITHIN ±30 AND ±60 SECONDS OF THE EXPERIMENTAL ALARM FOR THE KEMANO TESTS USING THE 20 PERCENT (TOP), 50 PERCENT (MIDDLE), AND 80 PERCENT (BOTTOM) OPTICAL DENSITY ALARM THRESHOLDS FROM TABLE 12...................................................................... 114
FIGURE 22 - PERCENTAGE OF KEMANO EXPERIMENTAL ALARMS BOUNDED BY THE 20 PERCENT AND 80 PERCENT OPTICAL DENSITY ALARM THRESHOLDS FROM TABLE 12.................................................................................................................................. 115
FIGURE 23 - PERCENTAGE OF UNDER-PREDICTED AND OVER-PREDICTED ALARMS USING A TEMPERATURE RISE OF 4 °C AS AN ALARM THRESHOLD........................................... 117
FIGURE 24 - PERCENTAGE OF PREDICTED ALARMS THAT OCCURRED WITHIN ±30 AND ±60 SECONDS OF THE EXPERIMENTAL ALARM WITH A TEMPERATURE RISE OF 4 °C USED AS AN ALARM THRESHOLD. ........................................................................................... 119
1
CHAPTER 1: INTRODUCTION
Smoke detection has become a fundamental component of the active fire protection
strategy of most modern buildings, particularly residential occupancies. However, this
was not always the case. The smoke detection industry experienced explosive growth in
the use of smoke detectors in the 1970’s, driven by advances in technology and
manufacturing that greatly reduced prices [Bukowski & Mulholland, 1978]. This
explosive growth was accompanied, and likely furthered, by several significant research
projects that reinforced the life safety protection provided by smoke detectors [Heskestad,
1974; Bukowski, et al., 1975] and provided evidence that supported increased
requirements for smoke detectors in buildings. In addition, significant research efforts
were undertaken to understand the environments to which detectors are exposed and the
response of these detectors to such environments [Heskestad, 1974; Heskestad, 1975;
Bukowski, et al., 1975; Heskestad & Delichatsios, 1977]. Many of the means by which
to estimate the response of smoke detectors were formulated during this period of
important smoke detection research (1970’s) and have not advanced significantly since
then; they are still the only available means for engineers to even approximate the
response of smoke detectors. However, the practicality of these methods is severely
limited by the significant fact that the uncertainty in the methods is generally unknown.
The current research addresses this shortcoming and provides guidance on modeling the
response of smoke detectors. The goals and scope of this research are detailed in
subsequent sections of this chapter.

2
1.1 Research Goals
The overall goal of the present research is to assess and provide guidance on the currently
available methods of smoke detector response prediction. Specific goals of this study are
as follows.
Evaluation of the recommended thresholds of various measurements used in smoke
detector response estimation techniques based on experimental data is the initial objective
of this research. Subsequently, the predictive capabilities of these methods at estimating
smoke detector response are examined and the uncertainty quantified. Finally, guidance
is provided to engineers on the use of smoke detector response estimation techniques.
1.2 Research Scope
The focus of this research will be on methods of smoke detector response estimation
provided in the SFPE Handbook of Fire Protection Engineering [Schifiliti, et al., 2002]
and the National Fire Alarm Code, NFPA 72 [2002]. These sources are considered to be
the most likely sources of guidance for engineers in the United States on the design and
analysis of smoke detection systems.
The current research is divided into two phases. Phase 1 of the project focuses on the
validation of thresholds used in smoke detector response estimation. Phase 2 of the
project examines the predictive capability of smoke detector response estimation
techniques and quantifies the associated uncertainty. Each of these phases is developed
further in the subsections to follow.

3
1.2.1 Phase 1 – Threshold Evaluation
Thresholds commonly presented in the literature for estimating the response of smoke
detectors are examined in Phase 1 by comparing them to the experimental measurements
adjacent to smoke detectors at the time of alarm. Threshold values for optical density,
temperature, and velocity are examined. The database for this examination is comprised
of two independent series of tests, designated in this report as the Navy [Harrison, et al.,
2003; Gottuk, et al., 2003] and Kemano [Su, et al., 2003] data sets, respectively. These
data sets encompass a range of smoke sources, test conditions, smoke detector
manufacturers, and models. Both flaming and smoldering fire sources are considered in
each series of tests.
The Navy data, which was provided by the Naval Research Laboratory (NRL), includes a
total of 41 tests and approximately 360 smoke detector alarms. Multiple smoke detectors
were used in each test, which led to a large number of smoke detector alarms relative to
the number of tests conducted. Only those detectors that alarmed during the course of a
test were examined. Values of the local optical density, temperature rise, and velocity
adjacent to each detector were determined at the time each smoke detector alarmed
during the tests. Optical density and temperature rise values at the time of detector alarm
are available for the vast majority of tests and detectors. Unfortunately, the velocity at
detector alarm was only available for a small number of tests and detectors.
The Kemano data, which was provided by the National Research Council of Canada
(NRCC), includes a total of 13 tests. Again in this study multiple smoke alarms were
4
used in each test and only those smoke alarms that alarmed are considered. Note that in
the Navy test series smoke detectors were used, while in the Kemano test series smoke
alarms were used. For simplicity, both smoke alarms and smoke detectors are referred to
as smoke detectors in this report. Values of the local optical density and temperature rise
adjacent to each detector will be determined at the time each smoke detector alarmed
during the tests. Unfortunately, velocity measurements were not taken as a part of the
Kemano study.
Further information on test conditions and experimental setup used in each test series is
discussed in Chapter 3, Experimental Setup.
1.2.2 Phase 2 – Threshold Uncertainty
Based on a review of current guidance provided in the literature (See Chapter 2),
recommended thresholds for optical density, temperature rise and velocity at the time of
detection were used to calculate alarm times from the test data. For example, the optical
density data adjacent to a smoke detector that alarmed was analyzed to determine the
time at which a certain optical density threshold value associated with detection was
exceeded; this time was taken as the predicted alarm time using the given optical density
alarm threshold. This analysis was completed for all smoke detectors that alarmed during
each test series. Although the conditions outside detectors that did not alarm could also
be analyzed in the same manner (i.e. to determine if an alarm would be predicted where
no actual alarm occurred during the test), the process of quantifying the uncertainty in
5
such predictions was unclear and was therefore avoided. The thresholds used in Phase 2
are the same as those analyzed in Phase 1.
Phase 2 serves as a means to assess the uncertainty uniquely inherent to the estimation
technique (i.e. threshold) used without the complication of additional modeling errors
(i.e. whether the model is predicting the measurement correctly). Any error associated
with the experimental measurements used to make the predictions is assumed to be small
in comparison to the estimated errors in modeling smoke detector response using one of
the estimation techniques examined. The uncertainty related to each predicted smoke
detector alarm response will be determined based on the difference between the predicted
and experimental alarm times, normalized by the experimental alarm time.

6
CHAPTER 2: LITERATURE REVIEW
As stated in Chapter 1, the decade following 1970 was a period of tremendous growth in
the popularity of smoke detectors. A growth in research and the general knowledge base
regarding the operation of smoke detectors accompanied this. Most of the practical
means of estimating the response of smoke detectors were derived from this era and have
remained largely unchanged. By itself, this fact is not significant. However, there have
been significant advances in detector technology since that time, including more uniform
smoke entry characteristics among detector technologies, reduced sensitivity to nuisance
(i.e., non-fire) sources, algorithm-based detection and multi-sensor, multi-criteria
detection. Research into the current trend toward the development of fire detection
algorithms and multi-sensor, multi-criteria fire detectors is prevalent in the literature in
the last decade [e.g. Gottuk, et al., 1999; McAvoy, et al., 1996; Milke, 1995; Milke and
McAvoy, 1996; Milke and McAvoy, 1997; Rose-Pehrsson, et al., 2000; Wong, et al.,
2000]. However, advancement in the research behind predicting the response of common
spot-type ionization and photoelectric detectors has been minimal. More fundamental
approaches exist to model the detectors, though these methods have not been advanced
sufficiently to prove practically useful for modeling smoke detectors.
This chapter will address many of the issues mentioned in the previous paragraph in more
detail as well as some fundamental topics related to the prediction of smoke detector
response.
7
2.1 Detector Operating Principles
Before any attempt is made to understand the means by which smoke detector response is
predicted, an understanding of the fundamental operating principles of smoke detectors is
required. For this study, only spot-type ionization and photoelectric detectors are
considered and are therefore the only technologies addressed in this section. For the sake
of brevity, from this point forward the use of the phrase smoke detectors will refer only to
spot-type ionization and photoelectric smoke detectors. More information on detector
operating principles, both those included here and some that are not, is available from
[Bukowski & Mulholland, 1978; Schifiliti & Pucci, 1996].
Ionization smoke detectors operate as a result of the reduction of electrical current in their
ionization chamber below a given threshold in the presence of smoke. The ionization
chamber consists of a tiny amount of radioactive material (typically Americium-241)
located between two metal plates, one with a positive electrical charge and one with a
negative electrical charge. The voltage across the two plates is maintained via a 9-volt
battery or 120-volt alternating current (typical household current). The Americium
contained in the chamber emits alpha particles, positively-charged ions consisting of two
protons and two neutrons, which ionize molecules in air (e.g., nitrogen and oxygen
molecules). Ionization of the oxygen and nitrogen molecules simply means that electrons
from these molecules are “knocked off” by the positively charged alpha particles. As a
result of this collision, the neutral atoms that lose an electron become positively charged
and the free electrons (i.e. the ones that were knocked off) attach to neutral gas molecules

8
to form negative ions. The ions are then drawn to the metal plate containing the opposite
charge of the ion. A small current (on the order of 10-11 amperes) occurs as the result of
this normal transfer of charge between these ions and the metal plates of the ionization
chamber [Bukowski and Mulholland, 1978]. When smoke particles enter the chamber
they become attached to ions (just as occurred with the gas molecules of the clean air).
However, since these particles are significantly larger than the ions formed from the gas
molecules, the velocity at which they are drawn to the metal plates is orders of magnitude
slower, which allows the ionized smoke particles to be carried out of the sensing chamber
by convection before they reach the metal plates [Bukowski and Mulholland, 1978]. As a
result, a reduction in the current between the metal plates occurs and the smoke detector
triggers an alarm when this current falls below a preset level.
Photoelectric smoke detectors operate on a significantly different principle than
ionization smoke detectors – light scattering. Light scattering results from the
interference of smoke particles with a beam of light. Photoelectric smoke detectors
contain a light source, typically a light-emitting diode (LED), and a light receiver, such as
a photocell. Meacham reported that two photoelectric detector manufacturers use LEDs
with peak wavelengths in the range of 880 – 950 nm [Meacham, 1992]. The photocell is
arranged at such an angle that it does not normally receive any light from the LED. The
volume defined by the intersection of the viewing angles of the light beam from the LED
and the photocell is termed the scattering volume [Bukowski & Mulholland, 1978]. As
smoke enters the scattering volume, light from the LED is scattered onto the photocell.
Photocells generate a current when a luminous flux (the scattered light) is applied. The

9
luminous flux received by the photocell increases in proportion with the smoke
concentration in the scattering volume. When the amount of scattered light reaching the
photocell exceeds a preset threshold, an alarm is triggered. The signal produced by
photoelectric detectors is sensitive to a number of physical characteristics of both the
detector and smoke including the number concentration, size distribution, shape, and
refractive index of the smoke particles as well as the scattering volume and wavelength of
light used in the detector [Schifiliti, et al., 2002].
2.2 Smoke Measurements
There are numerous experimental measurements that are used to characterize smoke.
The most common measurement of smoke is in terms of light attenuation or extinction.
Light attenuation, the decrease in luminous intensity due to the absorbtion, reflection, and
refraction of light by particles (smoke), is commonly referred to as obscuration. This
measurement is relevant to evaluating visibility through smoke and is also used as a
means of grossly estimating the response of smoke detectors (despite the fact that neither
ionization nor photoelectric detectors operate based on light attenuation) [Schifiliti, et al.,
2002]. Light attenuation is measured by aligning a light beam and photocell at a given
distance apart (the pathlength of the light, l). Such a device is called by several names
including optical density meter (the terminology used in this report) and smoke meter.
The attenuation of light by smoke is measured by the intensity of light received by the
photocell, I, relative to the intensity of light received by the photocell in the absence of
smoke (I0). The light attenuation is typically normalized by the path length of the light
(d). In this way, light attenuation is typically measured as the average light attenuation

10
over a unit path length of light. Various forms of this are calculated as follows [Schifiliti,
et al., 2002]:
Percent obscuration per unit distance, Ou
−=
d
u IIO
1
0
1*100
Optical Density per unit distance, Du
=
II
dDu
010log1
Extinction Coefficient, K
=
II
dK 0ln1
The optical density of smoke per meter of path length (m-1) will be the measurement used
throughout this analysis. For brevity, the term optical density will used to refer to the
optical density per meter.
The extinction coefficient calculation comes directly from an integrated form of
Bouguer’s Law of light attenuation assuming a constant extinction coefficient over the
path length. As Mulholland points out, Bouguer’s law is strictly valid only for
monochromatic light sources (i.e., light sources emitting a single wavelength of light)
[Mulholland, 2002]. However, many researchers, and even the standards used to evaluate
smoke detectors, use polychromatic (white light) sources to measure light extinction.
Foster examined the uncertainty in applying Bouguer’s Law to a polychromatic light
source for wood smoke and predicted a 22 percent deviation over the mass concentrations
examined [Foster, 1959]. Mulholland [1982] presented the general design of a light

11
extinction instrument that satisfies Bouguer’s law by using a monochromatic light source
and eliminating forward scattered light at the receptor. More recently, Putorti [1998]
described in more detail the characteristics, performance guidelines, and expected
uncertainty of a similar device. Mulholland, et al. [2000] extended this research by
constructing and testing such an instrument.
It should also be noted that optical density is simply a base 10 expression of Bouguer’s
Law and therefore the same disclaimer regarding potential errors from polychromatic
light sources applies. The optical density, Du can be calculated from the extinction
coefficient, K, as follows
( ) ( )303.2
loglog1 11010
Ked
Kded
D Kdu ≈==
Other important smoke measurements include the particle size distribution, particle
number concentration, mass concentration, and refractive index. These measurements
are representative of fundamental physical properties of the smoke aerosol, but are rarely
measured despite their potential value. Measuring smoke in this way is a difficult
experimental problem due to the vast range of particles sizes (0.005 – 5 µm) and particle
concentrations (104 – 1010 particles/cm3) expected from smoke; the dynamic nature of
each due to particle coagulation and agglomeration (smoke aging) only adds to the
difficulty [Bukowski & Mulholland, 1978].
Lee and Mulholland [1977] provide a thorough review of the physical properties of
smoke and instrumentation to obtain such properties. The level of detail provided by Lee

12
and Mulholland is not repeated here, but the highlights of their work are summarized
below. The single most important property of smoke is its size distribution, which is
highly dependant on the mode of combustion (i.e., flaming or smoldering fire). Particle
size measurements are typically made using an Electrical Aerosol Analyzer (EEA) for
particle sizes of 0.006 – 1 µm and an optical particle counter is employed for particle
sizes of 0.5 – 5 µm. The size distribution is important due to the fact that the smoke
generated by a fire typically contains a range of particle sizes, with a peak concentration
of particles of a certain size (often referred to as the peak particle size of the smoke).
Flaming fire sources tend to produce particles with significantly smaller peak particle
sizes than smoldering (non-flaming) fire sources. In addition, the peak particle size tends
to decrease with increasing temperature and velocity, due to more complete combustion
and less time for particle growth due to coagulation, respectively. A condensation nuclei
monitor is typically used to monitor the particle number concentration of smoke. The
number concentration decreases rapidly over time due to particle coagulation. The mass
concentration of smoke is typically measured by a particle mass monitor and by filter
collection. Losses to the surrounding surfaces (wall losses) are the most significant loss
mechanism for mass concentration, however even these losses are generally orders of
magnitude lower than the reduction of number concentration due to coagulation. The
mass concentration, therefore, appears to relatively constant as a function of smoke age.
Seader and Einhorn present a value they term as the particle optical density, which is the
ratio of optical density per meter to mass concentration. They found the particle optical
density, Dp, is approximately constant for a variety of wood and plastic fuels at 1.9 m2/g

13
for smoldering fires and 3.3 m2/g for flaming fires [Seader and Einhorn, 1977].
However, as Mulholland [2002] notes, these values are based on the optical density
measured with a polychromatic white light source, to which Bouguer’s Law is not strictly
valid. Despite this limitation, these values can be used as a rough guide if no other data is
available. The specific extinction coefficient, σs (m2/g), is the equivalent of the particle
optical density in terms of base e (i.e. σs=2.303*Dp). The results from Seader and
Einhorn are more commonly presented in terms of specific extinction coefficient as σs=
7.6 m2/g for flaming combustion and σs= 4.4 m2/g for smoldering combustion. More
recently, Mulholland and Croarkin found a mean specific extinction coefficient of
8.7m2/g with an expanded uncertainty of + 1.1 m2/g (95 percent confidence level) using a
632.8 nm (He-Ne) laser for over-ventilated flaming fires [Mulholland & Croarkin, 2000].
Their analysis included a variety of fuel sources and fire sizes, with measurements
conducted by several laboratories. One significant conclusion from this work is that the
variation in specific extinction coefficient between laboratories was greater than the
variation found from a single laboratory to different fire sources. The importance of the
particle optical density and the specific extinction coefficient are that they can be used to
model the optical density or extinction coefficient of smoke by calculating the mass
concentration of smoke.
Another measurement of interest related to the particle optical density is the mass optical
density, Dm (m2/g). Seader and Chien [1975] defined the mass optical density as the
optical density of smoke produced per unit mass of fuel consumed. The particle optical
density is converted to the mass optical density by the following equation

14
spm yDD *=
where: ys = fraction of particulate matter (smoke) produced relative to the mass
loss of the fuel (also commonly referred to as the soot yield)
Dm is typically used to predict the optical density of smoke based on the equation
VmD
VmD
D fm
c
fmu &
&=
∆=
where:
Du = Optical density per meter (m-1)
Dm = Mass optical density (m2/g (fuel))
∆mf = Mass loss of fuel (g)
Vc = Volume into which smoke mass is dispersed (m3)
fm& = Mass loss rate of fuel (g/s)
V& = Volumetric flow rate (m3/s)
The mass optical density is typically determined using small-scale tests. Results for Dm
for a variety of materials are presented by Mulholland [2002]. Quintiere [1982] has
reported that the correlation between small-scale measurements of Dm and the optical
density values from full-scale fires breaks down with complex fires.
2.3 Smoke Detector Modeling Approaches
The approaches used to predict smoke detector response are categorized into first-
principles methods and approximation methods. First principles methods are the more
scientific methods of predicting detector response, however none of these are currently

15
practical for use by engineers. Approximation methods, which are the focus of this
study, may not correspond to the actual operational principle employed by the detector,
but are indications of conditions likely present when the detector alarms. The uncertainty
in these approximations is expected to be significant. Schifiliti and Pucci [1996] provide
a thorough review of the state-of-the-art in fire detection modeling.
2.3.1 First-Principles Methods
Scientific first-principles approaches to predicting smoke detector response do exist.
However, due to the lack of sufficient specific experimental data, including certain
properties of both the smoke and smoke detector, these models are effectively useless to
engineers. Nevertheless, these models do warrant discussion in that they hold the
potential to provide smoke detector response predictions with much greater accuracy.
Mulholland [2002] presented an empirical model for the electrical signal from a smoke
detector, S, for either ionization or photoelectric smoke detectors as the integrated
product of the size distribution and the response function, R(d), of the detector according
to the equation
( )∫= max
min
d
dd
dNdRS δ
δδ

16
where:
S = Electrical signal from smoke detector (µV)
R(d) = Response function for the smoke detector (µVcm3)
dN
δδ = Number size distribution function (cm-3µm-1)
d = Particle diameter (µm)
The difficulty in applying this knowledge is that the response function, R(d), is particular
to the detector design and only determined through specific testing. Mulholland and Liu
[1980] determined the response function for one ionization detector to be the product of a
constant multiplied by the particle diameter, R(d) = 7d. However this relationship holds
only for the detector under test in their research.
Models are available that address the specific operating principles of the detector
design – ionization or light scattering. A semi-empirical equation for the signal from an
ionization chamber in the presence of smoke was developed by Hosemann [1970] for
relatively low smoke densities. Although Hosemann’s work is not readily accessible, his
work is discussed by Scheidweiler [1976], Litton [1977], and Helsper, et al. [1983]. The
equation developed by Hosemann is
0
12
η
IIx
xxxy
dNy
∆=
−−
=
⋅=⋅
17
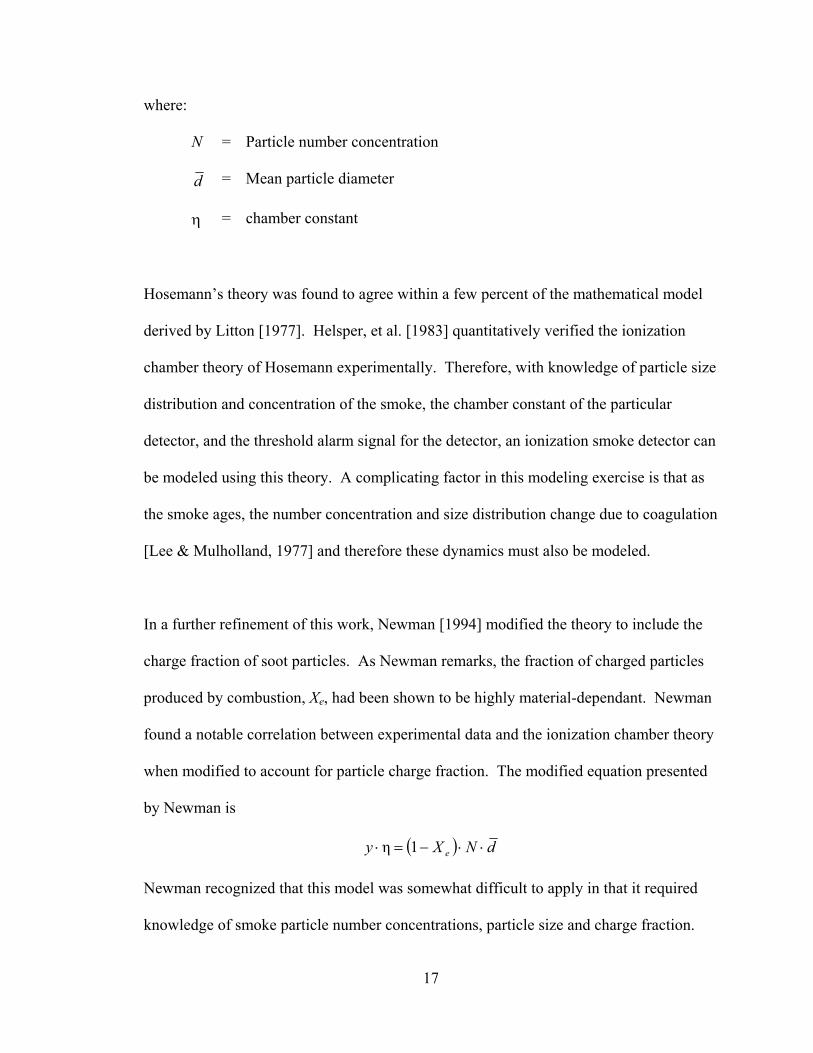
where:
N = Particle number concentration
d = Mean particle diameter
η = chamber constant
Hosemann’s theory was found to agree within a few percent of the mathematical model
derived by Litton [1977]. Helsper, et al. [1983] quantitatively verified the ionization
chamber theory of Hosemann experimentally. Therefore, with knowledge of particle size
distribution and concentration of the smoke, the chamber constant of the particular
detector, and the threshold alarm signal for the detector, an ionization smoke detector can
be modeled using this theory. A complicating factor in this modeling exercise is that as
the smoke ages, the number concentration and size distribution change due to coagulation
[Lee & Mulholland, 1977] and therefore these dynamics must also be modeled.
In a further refinement of this work, Newman [1994] modified the theory to include the
charge fraction of soot particles. As Newman remarks, the fraction of charged particles
produced by combustion, Xe, had been shown to be highly material-dependant. Newman
found a notable correlation between experimental data and the ionization chamber theory
when modified to account for particle charge fraction. The modified equation presented
by Newman is
( ) dNXy e ⋅⋅−=⋅ 1η
Newman recognized that this model was somewhat difficult to apply in that it required
knowledge of smoke particle number concentrations, particle size and charge fraction.

18
He reformulated the previous equation in terms of the soot volume fraction, fv, and a
detector/material sensitivity factor, α.
vfy ⋅= α
Newman found that the sensitivity factor was related to the soot yield (ys) by
( )[ ] 81074.0ln62.0 ×+−= syα
Although this result may seem fortuitous, Newman noted that the main source of ions in
flames was due to chemi-ionization and that the increase in soot formation and chemi-
ionization with increasing bond unsaturation and aromaticity as support for this
correlation. Furthermore, based on previous work, Newman showed that the soot volume
fraction can be related to the extinction coefficient at a particular wavelength by
0.7λλKfv =
Finally, combining the above equations, Newman’s model of ionization detector response
allows the prediction of ionization detector response based on the soot yield, the light
extinction coefficient, and the change of current required to cause an alarm according to
the following equation:
( )[ ]0.7
1074.0ln62.0λ 8λ ×+
−= syKy
The first principles approach to modeling photoelectric (light-scattering) smoke detectors
is significantly less advanced. To the author’s knowledge, the only such attempt at
fundamentally modeling photoelectric smoke detectors was conducted by Meacham
[1992]. Meacham proposed the use of Mie light-scattering theory to predict smoke
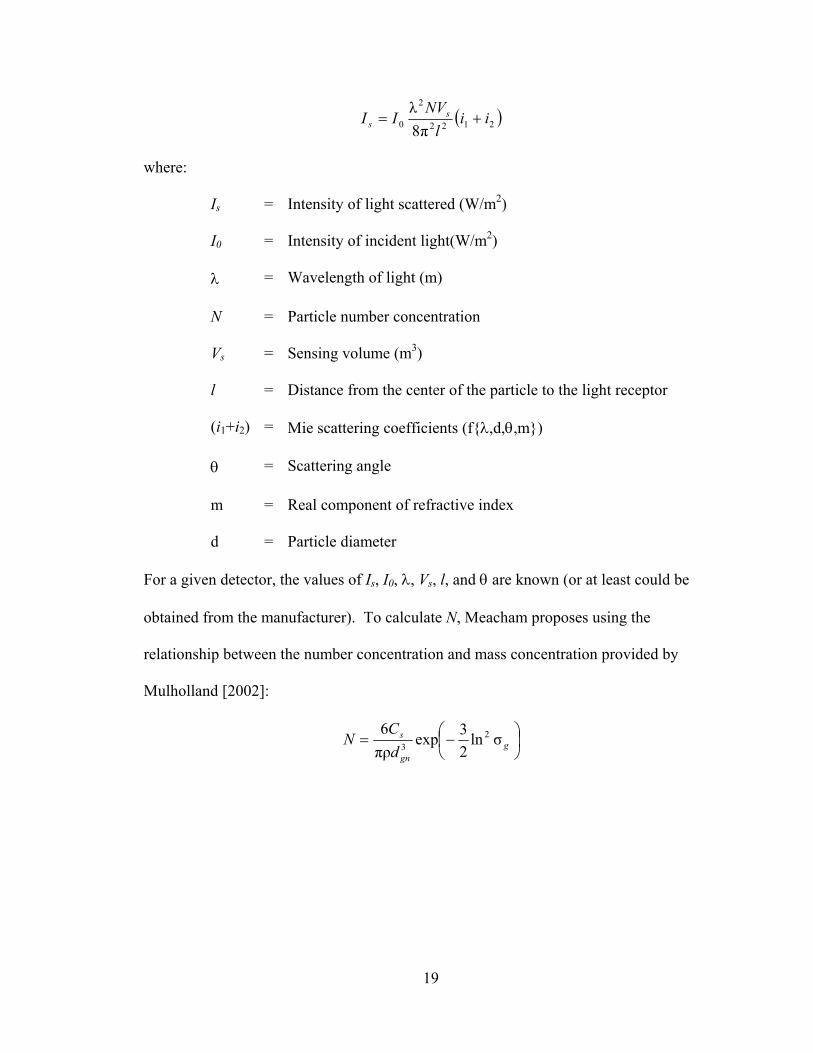
detector response in the following form:
19
( )2122
2
0 π8λ
iil
NVII s
s +=
where:
Is = Intensity of light scattered (W/m2)
I0 = Intensity of incident light(W/m2)
λ = Wavelength of light (m)
N = Particle number concentration
Vs = Sensing volume (m3)
l = Distance from the center of the particle to the light receptor
(i1+i2) = Mie scattering coefficients (f{λ,d,θ,m})
θ = Scattering angle
m = Real component of refractive index
d = Particle diameter
For a given detector, the values of Is, I0, λ, Vs, l, and θ are known (or at least could be
obtained from the manufacturer). To calculate N, Meacham proposes using the
relationship between the number concentration and mass concentration provided by
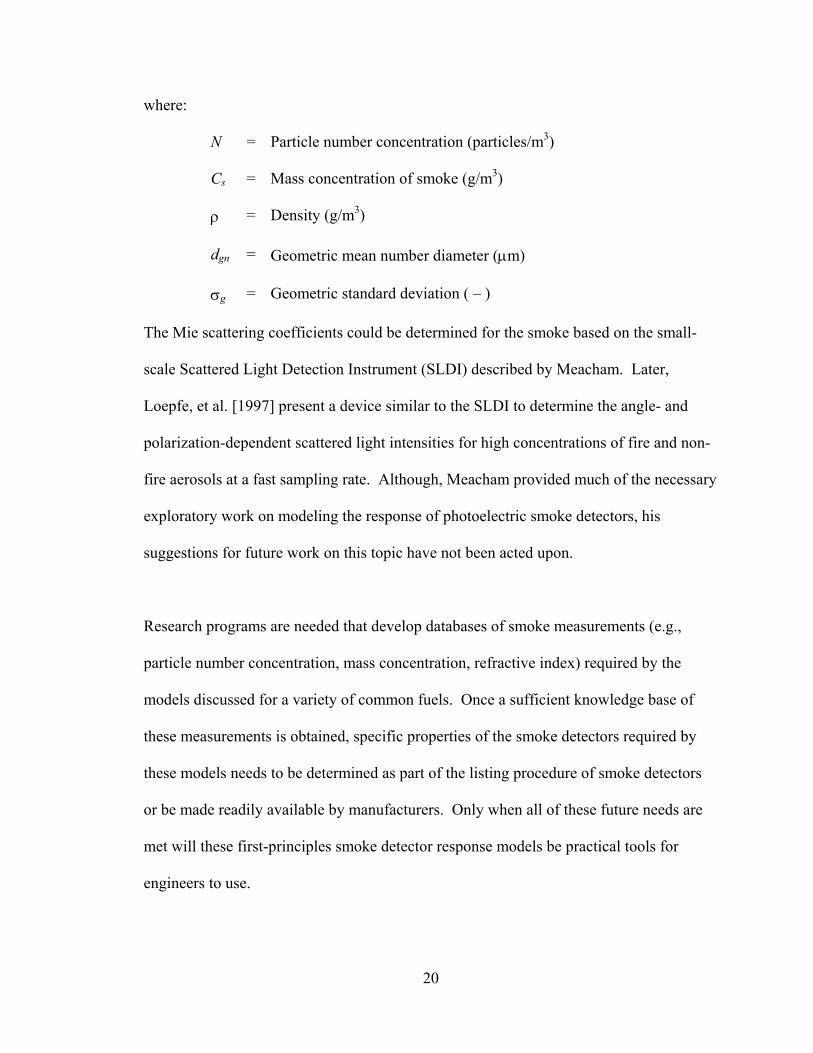
Mulholland [2002]:
−= g
gn
s
dC
N σln23exp
πρ6 2
3
20
where:
N = Particle number concentration (particles/m3)
Cs = Mass concentration of smoke (g/m3)
ρ = Density (g/m3)
dgn = Geometric mean number diameter (µm)
σg = Geometric standard deviation ( – )
The Mie scattering coefficients could be determined for the smoke based on the small-
scale Scattered Light Detection Instrument (SLDI) described by Meacham. Later,
Loepfe, et al. [1997] present a device similar to the SLDI to determine the angle- and
polarization-dependent scattered light intensities for high concentrations of fire and non-
fire aerosols at a fast sampling rate. Although, Meacham provided much of the necessary
exploratory work on modeling the response of photoelectric smoke detectors, his
suggestions for future work on this topic have not been acted upon.
Research programs are needed that develop databases of smoke measurements (e.g.,
particle number concentration, mass concentration, refractive index) required by the
models discussed for a variety of common fuels. Once a sufficient knowledge base of
these measurements is obtained, specific properties of the smoke detectors required by
these models needs to be determined as part of the listing procedure of smoke detectors
or be made readily available by manufacturers. Only when all of these future needs are
met will these first-principles smoke detector response models be practical tools for
engineers to use.
21
2.3.2 Approximation Methods
The approximation methods available for the prediction of smoke detector response are a
product of necessity. Out of a desire to have some practical means of estimating the
response of smoke detectors, early researchers in this area developed methods of
approximation based on measurements that could be modeled with reasonable accuracy
and obtained experimentally with minimal additional effort. This section will outline the
development of the current state-of-the-art in approximating smoke detector response and
provide the basis on which much of the remainder of this research is based.
2.3.2.1 Optical Density Method
The optical density method of estimating detector response compares a calculated optical
density outside a detector to a threshold value of optical density indicative of detector
response. Various measurements that are used to calculate optical density were discussed
in section 2.2. To review, one common method of calculation relies on the empirically
determined quantity mass optical density, Dm, which is assumed to be constant for a
given fuel. Using the mass loss of the fuel, the volume into which the smoke is
dissipated, as well as Dm an optical density can be determined. Likewise, the optical
density can be calculated based on the mass concentration of the smoke produced by a
fire. Based on knowledge of the mass loss of the fuel, the smoke yield, and volume into
which the smoke is dissipated, the mass concentration can be calculated. From this mass
concentration, the values of particle optical density by Seader & Einhorn [1977] (or the
specific extinction coefficient vales reported by Mulholland and Croarkin [2000]) can be
used to calculate the optical density. The previously discussed methods could be
22
calculated by hand or, more likely, be incorporated into zone model or field model
calculations.
Once the optical density is calculated, the threshold optical density for detection needs to
be known in order to estimate detector response. Approaches that have been considered
include using the nominal sensitivity of the smoke detector (the alarm level marked on
the detector as determined by the appropriate detector sensitivity test (i.e. UL 217 [2001]
or 268 [2003]); using the specified upper limit black smoke concentration of 0.14m-1
formerly used in the smoke detector approval standards UL 217 [2001] and UL 268
[2003]; and determining the threshold values based on experimental measurements in
which both optical density meters and smoke alarms were present. The two former
approaches will be discussed in more detail later.
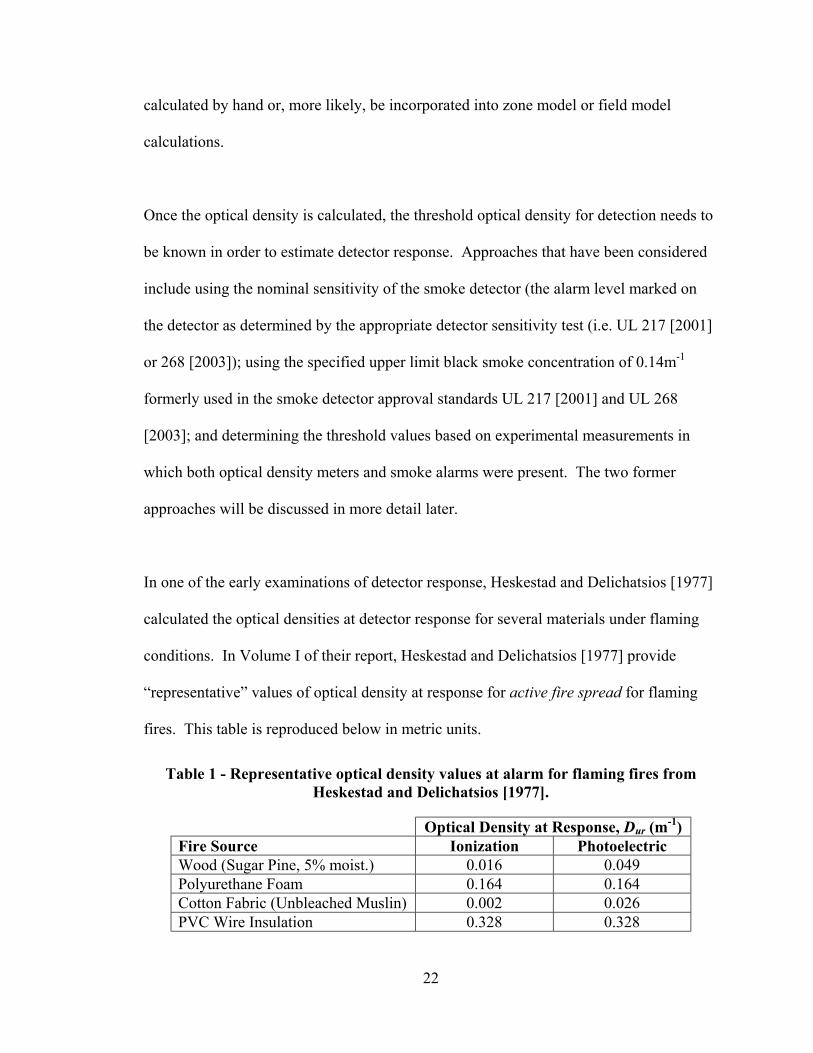
In one of the early examinations of detector response, Heskestad and Delichatsios [1977]
calculated the optical densities at detector response for several materials under flaming
conditions. In Volume I of their report, Heskestad and Delichatsios [1977] provide
“representative” values of optical density at response for active fire spread for flaming
fires. This table is reproduced below in metric units.
Table 1 - Representative optical density values at alarm for flaming fires from Heskestad and Delichatsios [1977].
Optical Density at Response, Dur (m-1) Fire Source Ionization Photoelectric Wood (Sugar Pine, 5% moist.) 0.016 0.049 Polyurethane Foam 0.164 0.164 Cotton Fabric (Unbleached Muslin) 0.002 0.026 PVC Wire Insulation 0.328 0.328
23
As Table 1 shows and as Heskestad and Delichatsios [1977] point out, there is significant
variation in the optical density at response values with respect to the fire source (material)
and the detector operating principle. What is not evident from Table 1, nor presented by
Heskestad and Delichatsios [1977], is exactly how these “representative” values were
determined and the degree of variation in these values. Heskestad and Delichatsios do
report that they gave little weight to the generally high optical density values at detector
response at the furthest distance from the fire for the polyurethane and cotton fires and
the near-zero values of optical density at detector response for the PVC fires obtained
before vigorous flame spread occurred. Additional details on the variation in the optical
density at response values for flaming wood crib fires is also reported. Heskestad and
Delichatsios [1977] report an average optical density at response of 0.014 m-1, with
minimum and maximum values of 0.003 m-1 and 0.032 m-1 respectively, for ionization
detectors. Likewise, for photoelectric detectors responding to flaming wood fires, the
average optical density at response was 0.053 m-1, with minimum and maximum values
of 0.018 m-1 and 0.101 m-1 respectively. Despite the “representative” values
corresponding fairly well with the mean values for the wood crib fires, it is not clear
whether this is the case for all the materials considered. Furthermore, even the overall
variation noted for the wood crib fires is significant and needs to be considered when
predicting smoke detector response.
In more recent work, Geiman and Gottuk [2003] examined the optical densities at
response for UL-listed smoke detectors under full-scale fire test conditions from three
different series of tests. The data sets used encompass a range of smoke sources, detector

24
sensitivity levels, test conditions, and detector manufacturers. In total, a database of 875
detector responses was compiled and examined. Major variables evaluated included
smoke detector type (ionization/photoelectric), fire type (flaming/smoldering) and
nominal detector sensitivity. The optical density alarm threshold defined by Geiman and
Gottuk [2003] is the smoke optical density level at which a certain percentage of
detectors would have alarmed based on the test data. Geiman and Gottuk [2003]
examined all the optical density at detector response data and presented optical density
alarm threshold values corresponding to when 20, 50 and 80 percent of the detectors
alarmed in the full-scale tests. These percentages of the population of detector responses
were selected based on providing a range of thresholds at a justifiable resolution; i.e.,
defining thresholds at 5 or 10 percent increments of the available population was not
sound given the small sample sizes. The vast majority of the data sets did not include
more than 50 detectors for a given fire, detector type, and nominal sensitivity, with some
only in the range of 10 to 20 detectors. Based on an informal sensitivity analysis, it was
concluded that using a percentage greater than 80 percent or less than 20 percent of the
population could result in one or two anomalous tests inappropriately skewing the
thresholds presented.
Table 2 presents the 20, 50, and 80 percent optical density alarm thresholds presented by
Geiman and Gottuk [2003]. In addition, the arithmetic mean optical density at the
detector response for each case is also presented with the standard deviation. These
values are provided to demonstrate the large variation in the data and to establish a
rationale for using percentiles of the population for this analysis. In fact, examining the

25
range within one standard deviation of the mean can result in non-physical, negative
values for the optical density at alarm. This is an artifact of the statistics due to the
presence of values much larger than the mean. The last column in the table is the number
of detectors examined. The three test series presented in Table 2 are designated as the
Indiana Dunes [Bukowski, et al., 1975], Navy [Gottuk, et al., 1999; Rose-Pehrsson, et al.,
2000; Wong, et al., 2000], and Fire Research Station (FRS) [Spearpoint and Smithies,
1997] data sets.
Table 2 - 20th, 50th, and 80th percentile values of optical density at detector response from Geiman and Gottuk [2003].
20% 50% 80% Mean Std DevIndiana Dunes Ion 0.0143 F 0.003 0.015 0.090 0.060 0.117 49Indiana Dunes Photo 0.0143 F 0.018 0.045 0.118 0.138 0.237 42Indiana Dunes Ion 0.0288 F 0.003 0.024 0.116 0.081 0.133 54Indiana Dunes Photo 0.0288 F 0.022 0.057 0.118 0.138 0.227 41Indiana Dunes Ion 0.0143 S 0.032 0.078 0.186 0.111 0.098 83Indiana Dunes Photo 0.0143 S 0.021 0.040 0.087 0.074 0.111 69Indiana Dunes Ion 0.0288 S 0.057 0.127 0.186 0.149 0.136 96Indiana Dunes Photo 0.0288 S 0.033 0.057 0.118 0.082 0.084 76
Navy Ion 0.0071 F 0.007 0.015 0.044 0.025 0.026 46Navy Photo 0.0071 F 0.012 0.028 0.056 0.031 0.026 43Navy Ion 0.0186 F 0.011 0.022 0.065 0.034 0.037 45Navy Photo 0.0361 F 0.028 0.049 0.057 0.055 0.046 14Navy Photo 0.0508 F 0.044 0.068 0.121 0.082 0.049 22Navy Ion 0.0071 S 0.028 0.081 0.116 0.079 0.049 18Navy Photo 0.0071 S 0.028 0.042 0.066 0.061 0.057 25Navy Ion 0.0186 S 0.025 0.090 0.138 0.082 0.057 14Navy Photo 0.0361 S 0.030 0.065 0.076 0.074 0.065 6Navy Photo 0.0508 S 0.063 0.079 0.125 0.093 0.046 20FRS Ion 0.0129 F 0.013 0.025 0.062 0.039 0.039 15FRS Ion 0.023 F 0.006 0.023 0.053 0.032 0.034 15FRS Photo 0.027 F 0.056 0.120 0.165 0.117 0.061 15FRS Photo 0.0295 F 0.034 0.072 0.104 0.069 0.038 15FRS Ion 0.0129 S 0.098 0.205 0.267 0.212 0.125 11FRS Ion 0.023 S 0.032 0.094 0.164 0.100 0.074 12FRS Photo 0.027 S 0.038 0.089 0.160 0.100 0.058 13FRS Photo 0.0295 S 0.014 0.044 0.136 0.103 0.146 13
a F = Flaming Fires; S = Smoldering Fires
Test Series # DetsDetector Type
Fire Sourcea
ODM Value at Alarm (OD/m)
ODM Alarm Thresholds (OD/m)
Nominal Sensitivity
(OD/m)

26
In addition to providing representative optical density values at detector response,
Geiman and Gottuk [2003] also compared the optical densities at detector response to
two of the alarm thresholds mentioned earlier – the nominal sensitivity of the detector
and the maximum black smoke optical density in UL 217 and UL 268 (0.14 m-1). The
nominal sensitivity of the detector was found to be a suitable alarm threshold only for
ionization detectors detecting flaming fires. In contrast, an optical density threshold of
0.14 m-1 was found to generally provide a conservative estimate of detector response for
all modes of combustion and detection principles examined.
2.3.2.2 Temperature Rise Method
Other than presenting the optical density at response, Heskestad and Delichatsios [1977]
did not promote the use of the optical density at response as a means of estimating
detector response. Instead they promoted the concept of a characteristic temperature rise
associated with smoke detector response, which they believed varied less between
materials than optical density.
The theory that Heskestad and Delichatsios [1977] developed to be able to relate detector
response to the temperature rise at the detector requires numerous assumptions.
Heskestad and Delichatsios [1977] assume that the ratio of mass concentration to
temperature rise is constant with respect to both time and space. This claim assumes that:
• the mass generation of smoke is equal to the mass loss of fuel,

27
• turbulent convection is solely responsible for the movement of combustion
products (including smoke) (i.e. diffusion and gravitational settling are
insignificant),
• combustion products do not react after they leave the source, and
• heat transfer from the smoke particles due to radiation and between the
ceiling jet flow and the ceiling material is insignificant.
Heskestad and Delichatsios [1977] also used the (now) generally accepted assumption
that the optical density per unit length is proportional to mass concentration (see section
2.2).
Given the previously mentioned assumptions, Heskestad and Delichatsios [1977] claim
that the ratio of optical density to temperature rise (Du/∆T) is constant with respect to
both time and space for a given material fuel and burning mode (i.e., flaming,
smoldering, vertical, or horizontal combustion). However, the data they present does not
bear this out. For the wood crib fires with the 29 ft ceiling height the presented Du/∆T
increases almost linearly with time, with little variation in space. The wood crib fires at
the 8 ft ceiling exhibited a similar trend with the exception of the data from the 40 ft
radial distance from the fire axis, which were significantly higher than at the 10 ft and 20
ft radii. Convective heat losses were blamed for the anomaly and it was suggested that
heat transfer to the ceiling could begin invalidating their theory at ratios of radial distance
to ceiling height greater than four (which Heskestad and Delichatsios point out is
supported by the theory for steady ceiling jets [Alpert, 1971]). For the other materials
studied, Du/∆T exhibited various behaviors including decreasing with time and increasing

28
to a maximum until steady burning is achieved then decreasing. In none of the data
presented was Du/∆T invariant enough to be considered constant in time or space.
Nevertheless, Heskestad and Delichatsios [1977] recommend using a constant Du/∆T as a
rough approximation and present “representative” values of Du/∆T. The term
representative is used in quotation marks because this is the wording that Heskestad and
Delichatsios use, but this claim is not necessarily supported nor explained by them.
Schifiliti and Pucci [1996] reexamined this data and provided the range of values of
Du/∆T for each fuel. Table 3 shows the “representative” values of Du/∆T provided by
Heskestad and Delichatsios [1977] and the range of Du/∆T values added by Schifiliti and
Pucci [1996], both of which been converted into metric units. Be aware that temperature
rise values less than 3 ºC (5 ºF) were not considered when calculating these ratios, due to
the fairly severe temperature stratification observed in test facility used by Heskestad and
Delichatsios [1977].
Table 3 - Ratio of optical density to temperature rise for various fuels
Du/∆T ((mºC)-1) Material “Representative” Value Range of Values Wood (Sugar Pine, 5% moist.) 1.2E-3 8.9E-4 – 3.2E-3 Cotton (Unbleached Muslin) 5.9E-4 / 1.2E-3 3.0E-4 – 1.8E-3 Paper (in Trashcan) 1.8E-3 Data not available Polyurethane Foam 2.4E-3 1.2E-2 – 3.2E-2 Polyester Fiber (Bed Pillow) 1.8E-2 Data not available PVC Wire Insulation 3.0E-2 / 5.9E-2 5.9E-3 – 5.9E-2 Foam Rubber / PU (Sofa Cushion) 7.7E-2 Data not available
In order to determine the temperature rise at detector response, ∆Tr, Heskestad and
Delichatsios [1977] did not rely directly on the recorded data. It was thought that ∆Tr
values based on the recorded data would include significant contributions of the ignitor

29
(or sustainer) fuel, which would unnecessarily increase ∆Tr. However, the actual ∆Tr
values from the data were never calculated (or at least not presented) by Heskestad and
Delichatsios for comparison. Instead, Heskestad and Delichatsios [1977] calculate ∆Tr as
TD
DT
u
urr
∆
=∆
In other words, the “representative” values of Dur from Table 1 were combined with the
“representative” values of Du/∆T from Table 3, by means of the equation above, to
determine the “representative” temperature rises at detection. The “representative”
values of ∆Tr provided by Heskestad and Delichatsios [1977], converted into metric units,
are summarized in Table 4.
Table 4 - Representative temperature rise to detection for flaming, spreading fires from Heskestad and Delichatsios [1977].
∆Tr (ºC) Fire Source Ionization Photoelectric Wood (Sugar Pine, 5% moist.) 14 42 Polyurethane Foam 7 7 Cotton Fabric (Unbleached Muslin) 2 28 PVC Wire Insulation 7 7
The values presented in Table 4 still appear in Annex B of NFPA 72 [2002], however,
they are no longer included in the SFPE Handbook of Fire Protection Engineering
[Schifiliti, et al., 2002]. It is also interesting to note that the representative temperature
rise of the ionization detector to the flaming cotton fabric fire which is reported as 3 ºF by
Heskestad and Delichatsios [1977] is below the 5 ºF minimum temperature rise they
established for much of their analysis.
30
An ad hoc committee of the Fire Detection Institute, which included Benjamin,
Heskestad, Bright, and Hayes [1979], was formed in order to formulate the research by
Heskestad and Delichatsios [1977] into a form that would be useful for smoke detector
standards. In this report, the authors promote the concept of the detector material
response number (DMR), the temperature rise from burning a given material required to
cause a selected smoke detector to alarm. The DMR values presented in this report are
identical to those found in Table 4. Benjamin, et al. [1979] note that the DMR numbers
are not sufficient when smoke entry resistance is present and that an equation utilizing the
characteristic length, L, of the detector (identical in form to Heskestad’s model of smoke
entry resistance presented in section 2.3.2.3, but with the temperature rise substituted for
optical density). However, because manufacturers and approval laboratories never
adopted a test to determine L numbers, the DMR (temperature rise at detection) values by
themselves became used as a means of predicting smoke detector responses.
In 1984 when Appendix C of NFPA 72E was published, a temperature rise of 13 °C (20
°F) was used to indicate detector response [NFPA 72, 2002]. This recommendation has
since been clarified in NFPA 72 to more accurately portray the original recommendations
of Heskestad and Delichatsios [1977]. In addition, the previous edition of the SFPE
Handbook of Fire Protection Engineering briefly mentioned that for higher energy
flaming fires, detectors often alarm at a temperature rise of 10 to 15 °C [Schifiliti, et al.,
1995]. However, even based on these references in the literature, the origin of the
assumption that 13 ºC corresponds to the temperature rise at detection for all detectors is
unclear. Benjamin, et al. [1979] make reference to the fact that if the burning material is

31
not known or readily predictable, then a conservative approach would be to assume a
wood crib is burning and use the DMR value for wood for the given detector. Later,
when Evans and Stroup [1985] developed the DETACT model, they discussed how the
calculated temperature rise (such as that determined by DETACT), could be used along
with the analysis of Heskestad and Delichatsios [1977] to calculate the response time of
smoke detectors (See section 4 of [Evans and Stroup, 1985]). In their discussion, they
note that a specific ionization smoke detector (tested by Heskestad and Delichatsios
[1977]) could be represented as a low temperature heat detector alarming at 13 ºC above
ambient for a wood fire. The difference between this temperature rise and the DMR
value for the ionization detector and wood fire listed in Table 4 is due to conversion to
metric units and rounding. Evans and Stroup [1985] converted the optical at response
value (from 0.005 ft-1 to 0.016 m-1) and ratio of optical density to temperature rise (from
2.0E-4 (ft ºF)-1 to 1.2E-3 (m ºC)-1) from Heskestad and Delichatsios [1977] and then
calculated the temperature rise at detection from these converted values. The
presentation of the 13 ºC temperature rise for detection by Evans and Stroup [1985],
when taken in addition to the comments by Benjamin, et al. [1979] regarding a DMR for
wood for an unknown fire source, led to the incorrect conclusion by many that any given
fire and detector could be approximated as a heat detector alarming at 13 ºC. It is the
author’s belief that Heskestad and Delichatsios, Bejamin, et al., and Evans and Stroup
never intended for 13 ºC to be used to predict response for all detectors to all fires,
however this is how their work was interpreted.
32
Numerous studies have questioned, or outright disputed, both the use of a constant
temperature rise for detection, as well as the temperature rise method in general. After an
article by Milke [1990] appeared in Fire Technology regarding the technical basis of the
(then) new smoke management standard for malls and atria (NFPA 92B [1990]), Beyler
and DiNenno [1991] responded with a Letter to the Editor citing numerous technical
questions on this article including the recommendation of using a temperature rise at
detection of approximately 10 ºC for all burning materials and detectors. Due to the
increasing use of the temperature rise method, which Beyler and DiNenno [1991] remark
was based on “very weak data”, they reexamined the data from Heskestad and
Delichatsios [1977]. Unlike the method used by Heskestad and Delichatsios [1977] to
determine ∆Tr, Beyler and DiNenno [1991] examined the actual gas temperature data
adjacent to the detectors at the time of response. They found that ∆Tr was not even close
to constant for a specific detector responding to a given material, much less for all
materials and detectors. Numerous studies have since reported similar conclusions (e.g.,
Schifiliti and Pucci, 1996; Luck and Seivert, 1999; Cholin and Marrion, 2001).
Additionally, Mowrer and Friedman [1998], Gottuk, et al. [1999], and Wakelin [1997]
have shown smoke detector alarms occurring at temperature rises as low as 1 to 3 °C.
Furthermore, Bukowski and Averill [1998] point out that Collier [1996] found that when
using CFAST a 4 ºC temperature rise best matched detector alarms from experiments,
while Davis and Notarianni [1996] recommended a temperature rise of 5 ºC for ionization
detectors with a nominal sensitivity of 0.025 m-1 in a high bay hangar space. Bukowski

33
and Averill [1998] go on to conclude that using a temperature rise at detection of 4-5 ºC
for modern detectors may be sufficient.
2.3.2.3 Critical Velocity Method
Numerous early researchers noted that often smoke detectors seemed to just “quietly
disappear in the smoke” in the absence of sufficient convective flow near detectors
[Bukowski, 1992]. The phenomenon to which they were referring is particularly
prevalent in slow smoldering fires. Such fires often produce significant quantities of
smoke without producing sufficient buoyancy; buoyancy is required to drive the flow.
Without a significant driving force, the velocity of the smoke reaching the smoke detector
can be quite low and as a result the optical density outside the smoke detector can be
significantly greater than that in the sensing chamber of the smoke detector due to a
smoke entry lag. Smoke entry lag can be significant and can cause the response of the
smoke detector to be appreciably delayed.
Heskestad attempted to account for this well-observed phenomenon of smoke entry lag in
his early work on modeling the response of smoke detectors. As an initial phase of some
of his work on the early-warning performance of residential fire detectors, Heskestad
developed an equation to correlate the response of smoke detectors to the optical density
of smoke at detector response [Heskestad, 1974]. This equation accounted for the entry
lag of smoke. The equation for the optical density at smoke detector response is based on
a characteristic optical density inside the smoke detector to a given smoke (Duo), the rate

34
of rise of the optical density
dtdDu , a characteristic length of the smoke detector that is
independent of the smoke properties (L), and the local gas velocity (u):
+=
dtdD
uLDD u
uour
Heskestad [1975] formalized and documented this theory in more detail. The equation
presented above is actually a simplified form of the actual response equation. Bjorkman,
et al. [1992] provide a concise derivation of the detector response equation as well as the
simplified form noted above.
Bjorkman, et al. [1992], Marrion [1989], and Oldweiler [1995] have all since studied
Heskestad’s detector response equation and determined L for various detectors. Schifiliti
and Pucci [1996] have compiled the characteristic lengths (L) of detectors determined by
these researchers. The characteristic lengths ranged from 1.8 to 14.2 m for ionization
detectors and 2.6 to 18.4 m for photoelectric smoke detectors across all researchers
studying a variety of detectors, smokes/aerosols, and flow velocities. In studying
Heskestad’s detector response equation Bjorkman, et al. [1992], Marrion [1989], and
Oldweiler [1995] all observed variation in L for low velocity flows [Schifiliti and Pucci,
1996]. This observation implies that a single L value is not sufficient to characterize the
smoke entry for both low and high velocity flows. In addition, a possible dependence of
L on smoke characteristics was implied by the data of Marrion and Oldweiler [Schifiliti
and Pucci, 1996]. Each of these last two points questions fundamental assumptions of the
characteristic length used in Heskestad’s theory – independence of L from the properties
of the smoke and ceiling jet.

35
Modern smoke detectors are expected to have more uniform entry resistance
characteristics due to the addition of variable velocity and smoldering fire sensitivity tests
into smoke detector approval standards [Bukowski, 1992]. Based on this fact and the
observed variation in L at lower flow velocities, more recent research into smoke entry
lag into smoke detectors has moved away from Heskestad’s model. Recently, Cleary, et
al. [2000] presented a two-parameter entry lag model that correlates each parameter to
velocity using power-law equations. The first parameter is termed the dwell time, the
delay associated with the decrease in flow caused by entrance screens and baffles, which
is modeled as a plug flow. The second parameter is a mixing time, the delay associated
with the sensing chamber volume, which occurs in series after the dwell time and is
modeled as a perfectly-stirred volume. Cleary, et al. examined two different ionization
and photoelectric smoke detectors over approximately 25 tests, with velocities ranging
from 0.02 to 0.55 m/s, to determine the correlations for the dwell and mixing times for
each detector. As might be expected from Heskestad’s model, Cleary, et al. found that
the exponent of the power-law velocity correlation between both the dwell time and
mixing was close to –1 (i.e. both parameters varied approximately inversely proportional
to the velocity – at low velocities smoke entry delays are significant). However, there
was significant scatter in the model parameters, possibly due in part to uncertainty in the
velocity measurements. Finally, for velocities greater than approximately 0.5 m/s, a
single parameter model or simply a small constant lag time may be appropriate, since the
dwell time drops below 10 seconds and the mixing time is essentially zero (at least for the
detector designs studied). Although the research by Cleary, et al. provides an
36
advancement in the state-of-the-art of understanding smoke entry lag, they only examined
one smoke source (a propene diffusion burner that provides black smoke), specific testing
of a detector is still required to determine the correlations for the two-parameter model,
and no further verification of this technique has been done by other researchers.
Brozovski [1991] approached the smoke entry problem differently, attempting to
determine a velocity below which delays due to smoke entry resistance would become
significant or prevent detector operation. In his research, a low velocity wind tunnel was
used to determine that a critical velocity, uc, of approximately 0.15 m/s exists below
which smoke detector response can become delayed. Coincidentally, this critical velocity
corresponds to the velocity used in the approval standard for smoke detectors (UL 217
[2001]). Schifiliti and Pucci [1996] caution that the critical velocity may vary with
smoke detector design or that it is simply an artifact of the detectors, test parameters or
test apparatus used. Nevertheless, Schifiliti, Meacham, and Custer in the SFPE
Handbook of Fire Protection Engineering [2002] and Annex B of NFPA 72 [2002]
propose using the critical velocity approach as a means of estimating the response of
smoke detectors. The critical velocity threshold is compared to a calculated ceiling jet
velocity (e.g., a velocity from a ceiling jet velocity correlation) and once this threshold is
exceeded, it is assumed that sufficient smoke concentration is present to cause the
detector to alarm.

37
CHAPTER 3: OVERVIEW OF EXPERIMENTAL DATA
The experimental data examined in this research was not conducted by the author, but
graciously provided by other researchers. Two series of tests were examined, designated
as the Navy [Harrison, et al., 2003; Gottuk, et al., 2003] and Kemano [Su, et al., 2003]
tests. Both test series are described in further detail later in this chapter. The rationale
for selecting these tests as part of this study was that both test series included full-scale
fire tests in which modern smoke detectors and several environmental variables (e.g.
optical density, temperature, and velocity) were examined in close proximity to one
another. Additionally, all of the data from these tests was provided electronically in order
to facilitate the analysis and modeling efforts of this project. Overall, these tests provided
a reasonable cross-section of smoke sources, test conditions, and smoke detectors likely
in modern buildings.
3.1 Navy Tests
The Navy tests were conducted aboard the ex-USS Shadwell, the Naval Research
Laboratory’s full-scale fire research facility in Mobile, Alabama [Carhart, et al., 1992].
The tests were conducted as two series, the first test series was conducted April 7-18,
2003 and the second test series was conducted April 21-25, 2003. The details of these
tests are described below.
3.1.1 Test Spaces
Fire tests were performed in small- and medium-size test compartments onboard the ex-
USS Shadwell. The overall dimensions of the small test compartment were 6.05 m from

38
forward to aft, 3.61m from port to starboard and 3.05 m in height. The medium test
compartment was 5.94 m forward to aft, 8.08 m port to starboard, and 3.05 m in height.
The medium size test space also contained a vestibule, which was not part of the test
space, in the front, starboard corner that measured 1.13 long, 2.22 m wide, and 2.59 m
high.
Both the small and medium test spaces aboard the ex-USS Shadwell have beams
spanning port to starboard at 1.22 m spacing and depths of 30.5 cm from the ceiling. In
addition, the medium test space was split into two zones separated by a 49.5 cm beam
that runs forward to aft through the compartment.
Two ventilation scenarios were used in this test series: no ventilation and 12 air changes
per hour of 100 percent outside air (maximum ventilation conditions in the
compartment). From a fire testing standpoint, these ventilation scenarios are
representative of conditions that remove the least and greatest amounts of heat and
smoke. The compartment doors were closed for each test series.
3.1.2 Fire Sources
Multiple fire exposures were used in the full-scale fire tests onboard the ex-USS
Shadwell. For the first test series, fires were performed both in the space where the
detectors were located as well as in an adjacent space to the test compartment. Since
there were no vents that allowed the passage of smoke between the adjacent spaces and
the spaces in which the detectors were located, the adjacent space fire tests were excluded
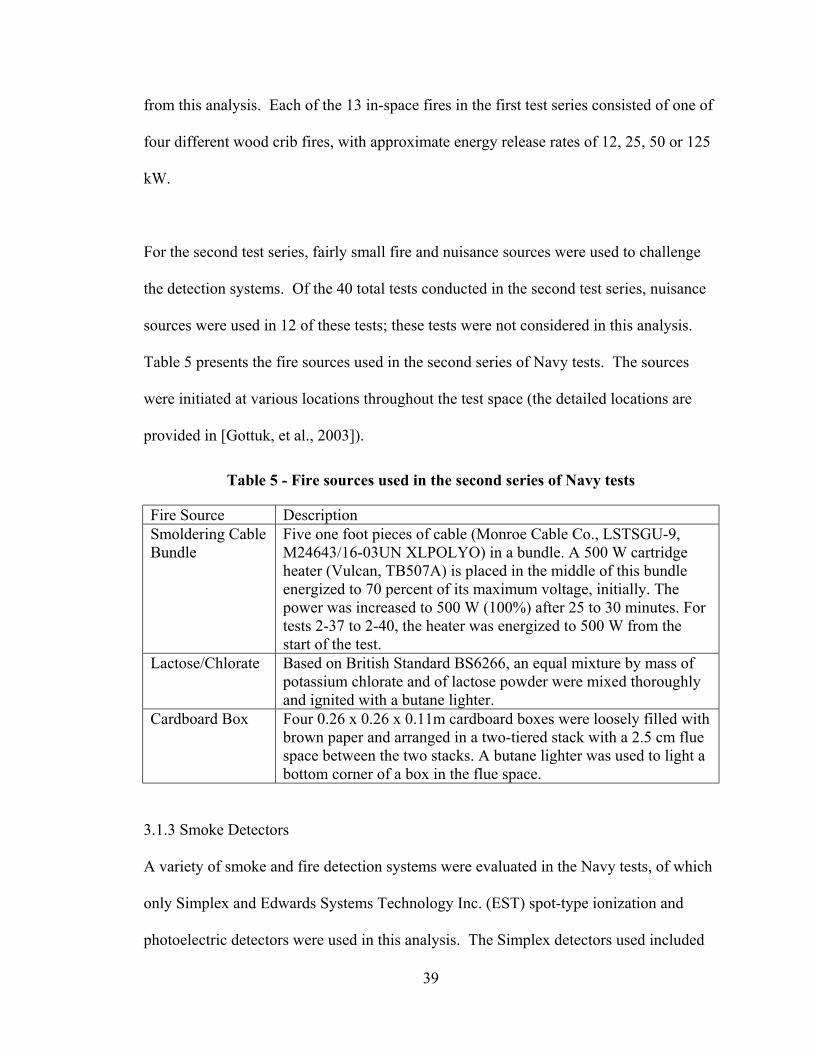
39
from this analysis. Each of the 13 in-space fires in the first test series consisted of one of
four different wood crib fires, with approximate energy release rates of 12, 25, 50 or 125
kW.
For the second test series, fairly small fire and nuisance sources were used to challenge
the detection systems. Of the 40 total tests conducted in the second test series, nuisance
sources were used in 12 of these tests; these tests were not considered in this analysis.
Table 5 presents the fire sources used in the second series of Navy tests. The sources
were initiated at various locations throughout the test space (the detailed locations are
provided in [Gottuk, et al., 2003]).
Table 5 - Fire sources used in the second series of Navy tests
Fire Source Description Smoldering Cable Bundle
Five one foot pieces of cable (Monroe Cable Co., LSTSGU-9, M24643/16-03UN XLPOLYO) in a bundle. A 500 W cartridge heater (Vulcan, TB507A) is placed in the middle of this bundle energized to 70 percent of its maximum voltage, initially. The power was increased to 500 W (100%) after 25 to 30 minutes. For tests 2-37 to 2-40, the heater was energized to 500 W from the start of the test.
Lactose/Chlorate Based on British Standard BS6266, an equal mixture by mass of potassium chlorate and of lactose powder were mixed thoroughly and ignited with a butane lighter.
Cardboard Box Four 0.26 x 0.26 x 0.11m cardboard boxes were loosely filled with brown paper and arranged in a two-tiered stack with a 2.5 cm flue space between the two stacks. A butane lighter was used to light a bottom corner of a box in the flue space.
3.1.3 Smoke Detectors
A variety of smoke and fire detection systems were evaluated in the Navy tests, of which
only Simplex and Edwards Systems Technology Inc. (EST) spot-type ionization and
photoelectric detectors were used in this analysis. The Simplex detectors used included

40
Model 4098-9717 ionization detectors and Model 4098-9714 photoelectric detectors.
The EST detector models used were SIGA-IS (ionization) and SIGA-PS (photoelectric).
To provide anonymity to the manufacturers, the detectors were arbitrarily assigned
identification numbers for this analysis. The nominal sensitivity (manufacturer default
sensitivity) values of the detectors used in this test series are shown in Table 6 along with
the corresponding identification number and detector type.
Table 6 - Smoke detectors used in the Navy tests
Nominal Sensitivity Test Compartment
ID Detector Type m-1 %Obs/ft
1 Ionization 0.023 1.6 2 Photoelectric 0.051 3.5 3 Ionization 0.019 1.3 4 Photoelectric 0.036 2.5 5 Ionization 0.023 1.6 6 Photoelectric 0.051 3.5 7 Ionization 0.019 1.3
Small
8 Photoelectric 0.036 2.5 9 Ionization 0.023 1.6 10 Photoelectric 0.051 3.5 11 Ionization 0.019 1.3 12 Photoelectric 0.036 2.5 13 Ionization 0.023 1.6 14 Photoelectric 0.051 3.5 15 Ionization 0.019 1.3 16 Photoelectric 0.036 2.5 17 Ionization 0.023 1.6 18 Photoelectric 0.051 3.5 19 Ionization 0.019 1.3 20 Photoelectric 0.036 2.5 21 Ionization 0.023 1.6 22 Photoelectric 0.051 3.5 23 Ionization 0.019 1.3
Medium
24 Photoelectric 0.036 2.5

41
Detectors were positioned in groups at several locations throughout the space, with a
general spacing of 0.3 m between detectors within each grouping. The detector locations
remained constant throughout the two Navy test series. The smoke detectors were
installed to industry standards (i.e. NFPA 72 [2002]). One smoke detector from each
manufacturer of each type was installed at every grouping. For the largest wood crib
fires, some of the detectors were removed to avoid damage from gas temperatures
exceeding 100 °C.
3.1.4 Instrumentation
Only instrumentation that pertains to the optical density, temperature and velocity
measurements adjacent to the smoke detectors is discussed in this section. For details on
additional instrumentation not discussed here, refer to Harrison, et al. [2003] and Gottuk,
et al. [2003].
The smoke optical density was measured with an optical density meter (ODM). Each
ODM utilized an 880 nm infrared light emitting diode (IRLED) and receptor arrangement
over a 1.0 m path length. Before each test all ODMs were adjusted such that the ambient
optical density measurement were near zero.
Temperature measurements in the Navy tests were made with Inconel-sheathed, type K
thermocouples located adjacent to each smoke detector group. All thermocouples were
positioned approximately 9 cm below the overhead.
42
A sonic anemometer (Model No. SPAS/2Y) from Applied Technologies, Inc. was used to
measure the gas velocity in two orthogonal directions. The vertical (floor to ceiling)
velocity component was not measured. The velocity along each direction is computed
based on the transit times for sonic pulses that are generated at the probe’s sonic
transducers and received 15 cm away by opposing transducers. The listed wind speed
measurement range for this probe was 0 – 50 m/s, with a resolution of ±0.01 m/s
according to the manufacturer’s specifications. One limitation of this velocity probe was
that the operating temperature range is –30 to +60ºC. Procedures were in place during
the test to remove the probe from the hot smoke when (if) the gas temperature
approached the maximum safe operating temperature of the probe. The sonic
anemometer was originally calibrated by the manufacturer. A formal calibration of the
instrument for this test series was not conducted, however informal examinations of its
operation were made.
3.2 Kemano Tests
The National Research Council of Canada (NRC) recently had the unique opportunity of
conducting full-scale fire detection experiments in residential dwellings in Kemano,
British Columbia [Su, et al., 2003]. A total of 13 fire detection tests were conducted as
part of that study from May 18 – 22, 2001. Details on the test spaces, fire sources, smoke
detectors, and instrumentation used in these tests will be outlined in the remaining
sections of this chapter.

43
3.2.1 Test Spaces
Tests were performed in two residential dwellings, identified as BB-513 and K1-106 by
Su, et al. [2003]. Both dwellings were of typical wood frame construction with common
residential interior furnishings. The houses were unheated. Dimensioned schematics of
each dwelling, which include detector, instrumentation, and fire source locations are
found in Figures 8a, 8b, 29, and 30 of [Su, et al., 2003]. Dwelling BB-513 is a one-story
bungalow, which also had a finished basement, with approximate internal dimensions of
7.7 m by 12.2 m. The ceiling height on the ground floor of BB-513, where the tests were
conducted, was 2.44 m. Tests 1 – 9 were conducted in BB-513. The remaining 4 tests
were conducted in K1-106, a two-story single-family home with approximate internal
dimensions of 6.9 m by 8.9 m. The ground floor of K1-106 had a ceiling height of 2.5 m,
the second floor ceiling height was 2.4 m, and the landing area of the staircase had a
ceiling height of 3.0 m.
3.2.2 Fire Sources
Small, slow-growing flaming and smoldering fire sources were used in the Kemano tests
to challenge the smoke detectors. Most fires began as smoldering combustion and later
transitioned to flaming. Representative household fire sources (e.g. wood, paper,
polyurethane foam, etc.) were used. The details of the fire sources used are summarized
in Table 7. An electronic heating element was used as the source of ignition energy in all
tests.
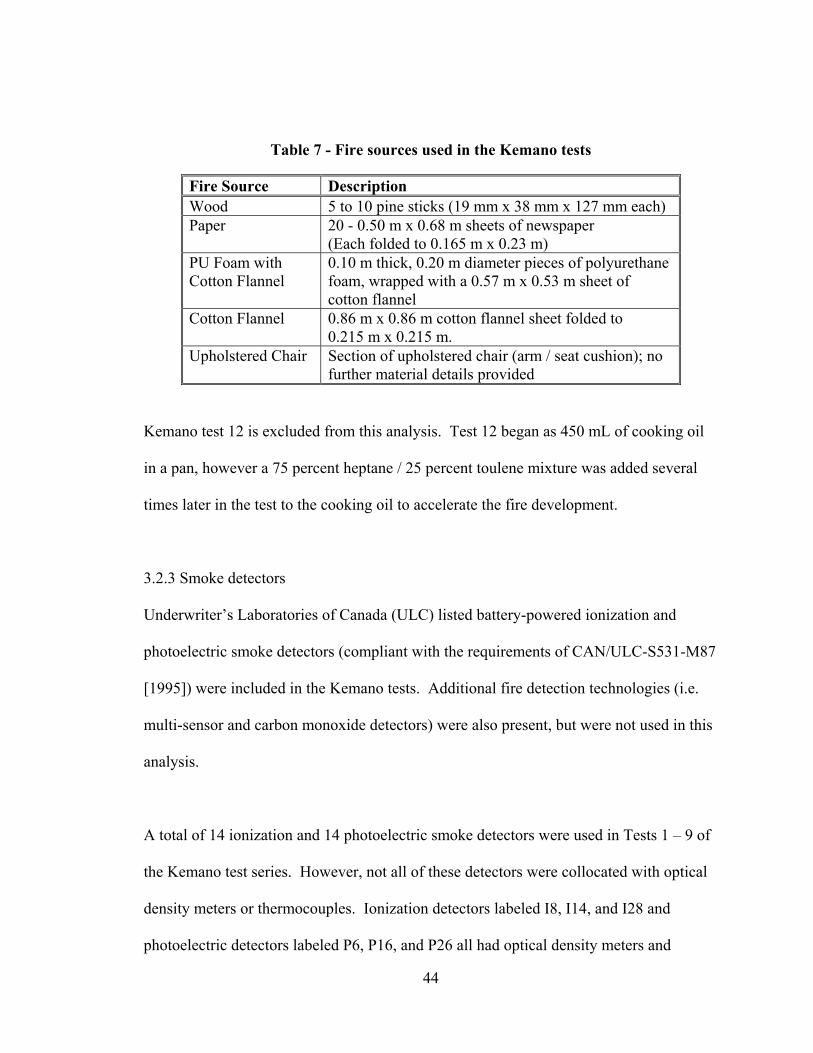
44
Table 7 - Fire sources used in the Kemano tests
Fire Source Description Wood 5 to 10 pine sticks (19 mm x 38 mm x 127 mm each) Paper 20 - 0.50 m x 0.68 m sheets of newspaper
(Each folded to 0.165 m x 0.23 m) PU Foam with Cotton Flannel
0.10 m thick, 0.20 m diameter pieces of polyurethane foam, wrapped with a 0.57 m x 0.53 m sheet of cotton flannel
Cotton Flannel 0.86 m x 0.86 m cotton flannel sheet folded to 0.215 m x 0.215 m.
Upholstered Chair Section of upholstered chair (arm / seat cushion); no further material details provided
Kemano test 12 is excluded from this analysis. Test 12 began as 450 mL of cooking oil
in a pan, however a 75 percent heptane / 25 percent toulene mixture was added several
times later in the test to the cooking oil to accelerate the fire development.
3.2.3 Smoke detectors
Underwriter’s Laboratories of Canada (ULC) listed battery-powered ionization and
photoelectric smoke detectors (compliant with the requirements of CAN/ULC-S531-M87
[1995]) were included in the Kemano tests. Additional fire detection technologies (i.e.
multi-sensor and carbon monoxide detectors) were also present, but were not used in this
analysis.
A total of 14 ionization and 14 photoelectric smoke detectors were used in Tests 1 – 9 of
the Kemano test series. However, not all of these detectors were collocated with optical
density meters or thermocouples. Ionization detectors labeled I8, I14, and I28 and
photoelectric detectors labeled P6, P16, and P26 all had optical density meters and

45
thermocouples located adjacent to their respective locations. Only thermocouples were
collocated with ionization detector I18 and photoelectric detector P20. The remaining
detectors were not located directly adjacent to any instrumentation and therefore were not
used in this analysis. Each group of smoke detectors contained a single ionization and
photoelectric detector and were located at the ceiling of Bedroom 1 (detectors P6 and I8),
corridor (detectors I14 and P20), foyer (detectors I18 and P20), and living room
(detectors P26 and I28). In general, all smoke detectors were spaced 0.3 m apart (center
to center) within each detector grouping.
Kemano tests 10 – 13 included a total of 5 photoelectric and 8 ionization smoke detectors
located on the ground and second floor of K1-106. Note that the fires were all conducted
on the ground floor. Each smoke detector group consisted of an ionization detector and a
photoelectric detector. Two smoke detector groups were located in the living room on
the ground floor (detectors I1 and P3 in one group and detectors I4 and P6 in the other).
Detectors I7 and P9 were located as a group in the staircase landing (between the ground
and second floors). Two additional smoke detector groups were installed in the second
floor corridor (detectors I10 and P12 in one group and detectors I13 and P15 in the
other). Each group was located adjacent to both gas temperature and optical density
instrumentation, with the exception of one of the living room detector groups (I1 and P3)
and one of the second floor corridor groups (I13 and P15) that were collocated only with
temperature measurement instrumentation.

46
3.2.4 Instrumentation
Optical density meters and thermocouples were used in the Kemano tests to measure the
smoke optical density and temperature in the vicinity of the smoke detectors. No
instrumentation was provided in the Kemano tests to measure the gas velocity near the
smoke detectors.
Optical density meters used in the Kemano tests were designed and constructed by NRC.
Each optical density meter used a 940 nm, pulsed, near-infrared LED light source with a
photodiode, separated by a distance of 0.60 m. Calibrations were performed on all
optical density meters using optical filters. For the nine tests conducted in BB-513,
smoke optical meters were located in Bedroom 1, the corridor and the living room at both
ceiling height and 1.68 m above the floor. Only the ceiling height (0.15 m below the
ceiling) optical density meters are used in this study. Optical density meters were located
in the living room, staircase landing, and corridor on the second floor for the remaining
four Kemano tests performed in K1-106. Again, these instruments were located at the
ceiling and 1.68 above the floor and only the ceiling height (0.15 m below the ceiling)
optical density meters were considered in this analysis.
Temperature measurements in the Kemano tests were measured with 0.038 mm diameter
(26 AWG), Type K, nickel-chromium and nickel-aluminum alloy thermocouples (TCs).
Multiple TCs were arranged into trees (vertical arrays), to measure the gas temperature at
various heights. Only the top-most TC in each tree, located 40 mm below the ceiling,
was examined in this analysis. TC trees were located in the living room, corridor, and

47
Bedroom 1 adjacent to the smoke detector groups for the tests conducted in BB-513.
Likewise, for the final four Kemano tests in K1-106, TC trees were located in the living
room, corridor, staircase landing, and second floor corridor adjacent to the smoke
detector groups.

48
CHAPTER 4: PHASE 1 RESULTS
Experimental measurements of optical density, temperature, and velocity adjacent to
smoke detectors at the time of alarm are the basis for Phase 1 of this analysis. A
statistical description of the experimental measurements examined at the time of alarm is
provided in this section. In addition, thresholds commonly presented in the literature for
estimating the response of smoke detectors are compared to these experimental
measurements.
4.1 Variables Considered
A critical element in an engineering analysis, especially one that is not based on first-
principles, is careful selection of variables of interest. For each of the experimental
measurements (optical density, temperature, and velocity) that are used as alarm
thresholds, four variables are considered:
• Mode of Combustion
• Smoke Detector Type
• Nominal Sensitivity
• Ventilation Status
Each of these four variables may affect the optical density, temperature, or velocity at the
time of detector alarm. The significance of each of these variables will be examined and
insignificant variables will be eliminated.
The mode of combustion, in this context, refers to either smoldering or flaming
combustion of the burning item. Throughout the rest of this section the mode of

49
combustion will be referred to as the “fire type.” Flaming and smoldering fires produce
smoke with significantly different characteristics and smoldering fires are less likely to
produce a strong buoyant plume than flaming fires, both of which could result in
variations of optical density, temperature and velocity at alarm. The type of smoke
detector refers to the operating principle of the smoke detector. For this research, only
ionization and photoelectric smoke detectors were considered. Detectors with different
operating principles respond with varying degrees of sensitivity to different
characteristics of the smoke. As a result, differences in the optical density at alarm are
likely between detector types. The nominal sensitivity of a smoke detector is the alarm
level marked on the detector as determined by the appropriate detector sensitivity test
(i.e. UL 217 [2001] or UL 268 [2003]). Although this singular value applies only to the
performance of the detector under the specified test conditions and will not likely
extrapolate to the performance of the detector under different conditions, it does serve as
a point of reference to be considered. Finally, the status of the ventilation system may
impact the values of optical density, temperature, and velocity at alarm. A functioning
ventilation system may remove, or relocate, both smoke and heat from a fire and would
likely affect the air velocity adjacent to the detector.
4.2 Development of Statistical Description
The statistical description of the optical density, temperature, and velocity at alarm values
is based on that presented by Geiman and Gottuk [2003] for the optical density at alarm.
See Table 2 for an example of the statistics they presented. Before proceeding further
into this discussion, it is necessary to discuss the nature of the data used in the statistical

50
description. In the early stages of this investigation, both instantaneous as well as
averaged (5 and 10 second average values around the time of alarm) were examined. No
significant difference was found between the instantaneous and averaged values for the
optical density and temperature rise at alarm; the instantaneous values were therefore
used for these measurements throughout this study. Conversely, the variation in the
velocity data required that a 10 second average value around the time of alarm be used
for all velocity at alarm values in this study.
Typically, mean and standard deviation values can adequately describe a population of
data for engineering calculations. However, for populations that are not normally
distributed the mean and standard deviation alone may not be adequate. To illustrate this
point and to provide evidence that the optical density values at alarm are not normally
distributed, Figure 1, presents box plots of the optical density values at alarm for all tests
examined. Note that the number of detector alarms incorporated in Figure 1 were 106,
93, 71, and 105 for the flaming-ion, flaming-photo, smoldering-ion, and smoldering-
photo categories, respectively. In addition, a fictitious box plot labeled “Normal
Distribution” has been added to the figure for comparison purposes only (i.e. the values
used and variation shown have no meaning). From a previous study of optical density at
alarm values [Geiman & Gottuk, 2003], the fire type and detector type are known to be
significant variables, so these are the only variables considered at this point in the
analysis.

51
A box plot provides a graphical representation of the data in the form of a five number
summary (in Figure 1 the 10th, 25th, 50th, 75th, and 90th percentiles) [Devore, 2000]. The
25th and 75th percentiles, form a box representing the middle 50 percent of values (the
interquartile range). The median is represented as the solid line that divides the
previously mentioned box. The lines extending from the box to the 10th and 90th
percentiles, respectively, are called the whiskers. Similar to the box, the middle 80
percent of the data is contained within the whiskers. To avoid plotting each outlier (i.e.,
value below the 10th percentile and above the 90th percentile) on the box plot, the 5th and
95th percentiles are shown. These points represent possible extreme values or “outliers.”
In addition to the normal five-point summary, the arithmetic mean of the data set is
presented on the box plots as a dashed red line.
Optical Density at Alarm (m-1)
0.00 0.10 0.20 0.30 0.40
Normal Distribution
Flaming - Ion
Flaming - Photo
Smoldering - Ion
Smoldering - Photo
KEYMean
5th Percentile95th Percentile
Percentiles on boxplot
10th 25th 50th 75th90th
Figure 1 - Box plots illustrating the non-normal distributions of optical density at
alarm data.

52
Box plots are a means to graphically represent the central tendencies and variation in the
data. The mean and median are both representations of the central tendencies of the data,
while the size of the box and whiskers reflect the variation in the data. Likewise, the
skewness or asymmetry of the data can also be determined from the box plot. In a
symmetric distribution, the mean and the median would be identical and the width of the
box and whiskers on each side of the mean would be symmetrical (see “Normal
Distribution” box plot in Figure 1). If the mean is higher than the median, the data is
positive or right-skewed; if the mean is lower than the median then the data is negative or
left-skewed. From Figure 1, the optical density is obviously a right-skewed distribution
and not a normal distribution, since the box and whiskers are larger on the positive (right)
side of the median than the other for each of the distributions of test data. This skewness
is the result of the mean being “pulled” higher by unusually large values in the data set.
Given this knowledge of the distributions of the optical density at alarm data, the use of
percentiles of the population, as used by Geiman and Gottuk [2003], over a simple mean
and standard deviation seems justified. However, to enable continued evaluation of this
assumption throughout this work, the average and standard deviations of the populations
will be provided. For simplicity, and comparison purposes, the temperature rise and
velocity data will be treated in the same manner as the optical density.
Another aspect of the statistical treatment used by Geiman and Gottuk [2003], and
adopted here, relates to the percentiles of the population presented. Through an informal
sensitivity analysis, Geiman and Gottuk decided that the 20th, 50th, and 80th percentiles
provided a reasonable description of the population at a justifiable resolution. They

53
found that using percentiles of the population examined lower than the 20th or greater
than the 80th may introduce complications given the small sample sizes where one or two
anomalous tests could inappropriately skew results. Figure 2 illustrates the deviation
from the majority of the population of optical density at alarm data below the 20th and
above the 80th percentile. The plots in Figure 2 use the same data set used in the box
plots in Figure 1.
Optical Density at Alarm (1/m)
0.0 0.2 0.4 0.6
Perc
enta
ge o
f Det
ecto
r Ala
rms
0
10
20
30
40
50
60
70
80
90
100
Flaming - IonFlaming - PhotoSmoldering - IonSmoldering - Photo
Optical Density at Alarm (1/m)
1e-4 1e-3 1e-2 1e-1
Linear Scale Logarithmic Scale (Base 10)
Figure 2 - Cumulative distribution of optical density at alarm to illustrate rationale for using 20th and 80th percentiles.
The two plots shown in Figure 2 are identical other than the scale used for the optical
density at alarm values. The plot on the left uses a linear scale and the deviation above

54
the 80th percentile is clearly visible. To better visualize the optical density at alarm below
the 20th percentile, the plot on the right uses a base-10 logarithmic scale.
4.3 Optical Density at Alarm
4.3.1 Statistical Description
Based on a previous study of optical density at alarm values [Geiman & Gottuk, 2003],
the fire type and detector type are known to be significant variables. However, the
significance of the nominal sensitivity of the detector and the ventilation status on the
optical density at alarm are unknown. A systematic evaluation of the significance of
these two remaining variables is performed before the final statistical description of the
optical density at alarm values is presented. The data from the Navy tests is the only data
suitable to perform this evaluation. The data from the Kemano tests will be presented
later in this section.
To determine the significance of the detector nominal sensitivity on the optical density at
alarm, a statistical description of the optical density at alarm data (described in section
4.2) was developed that considered the nominal sensitivity, in addition to the fire type
and detector type.
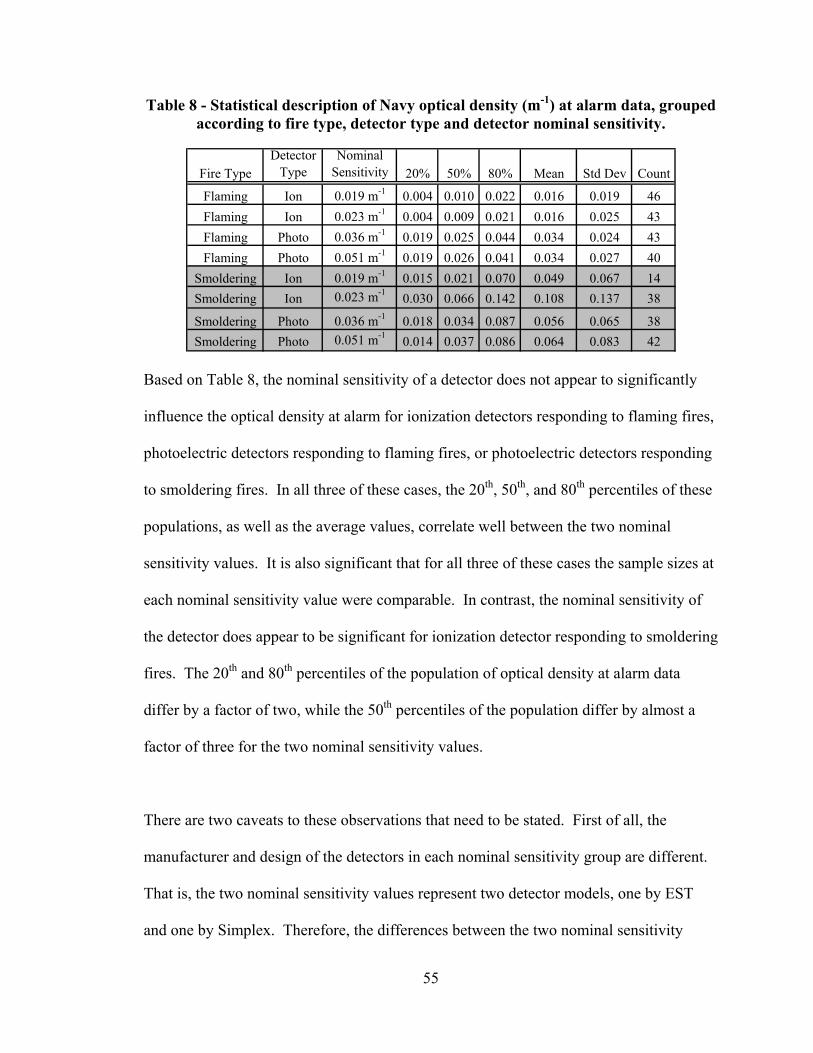
55
Table 8 - Statistical description of Navy optical density (m-1) at alarm data, grouped according to fire type, detector type and detector nominal sensitivity.
Fire TypeDetector
TypeNominal
Sensitivity 20% 50% 80% Mean Std Dev Count
Flaming Ion 0.019 m-1 0.004 0.010 0.022 0.016 0.019 46Flaming Ion 0.023 m-1 0.004 0.009 0.021 0.016 0.025 43Flaming Photo 0.036 m-1 0.019 0.025 0.044 0.034 0.024 43Flaming Photo 0.051 m-1 0.019 0.026 0.041 0.034 0.027 40
Smoldering Ion 0.019 m-1 0.015 0.021 0.070 0.049 0.067 14Smoldering Ion 0.023 m-1 0.030 0.066 0.142 0.108 0.137 38
Smoldering Photo 0.036 m-1 0.018 0.034 0.087 0.056 0.065 38Smoldering Photo 0.051 m-1 0.014 0.037 0.086 0.064 0.083 42
Based on Table 8, the nominal sensitivity of a detector does not appear to significantly
influence the optical density at alarm for ionization detectors responding to flaming fires,
photoelectric detectors responding to flaming fires, or photoelectric detectors responding
to smoldering fires. In all three of these cases, the 20th, 50th, and 80th percentiles of these
populations, as well as the average values, correlate well between the two nominal
sensitivity values. It is also significant that for all three of these cases the sample sizes at
each nominal sensitivity value were comparable. In contrast, the nominal sensitivity of
the detector does appear to be significant for ionization detector responding to smoldering
fires. The 20th and 80th percentiles of the population of optical density at alarm data
differ by a factor of two, while the 50th percentiles of the population differ by almost a
factor of three for the two nominal sensitivity values.
There are two caveats to these observations that need to be stated. First of all, the
manufacturer and design of the detectors in each nominal sensitivity group are different.
That is, the two nominal sensitivity values represent two detector models, one by EST
and one by Simplex. Therefore, the differences between the two nominal sensitivity

56
values for the ionization detectors responding to smoldering fires could also be attributed
to the difference in detector designs. Furthermore the sample size of the 0.019 m-1
nominal sensitivity ionization detector group responding to smoldering fires is only about
one third the size of the population of detector alarms considered for the 0.023 m-1
nominal sensitivity group of ionization detectors responding to smoldering fires. This
indicates a lack of sensitivity by the 0.019 m-1 nominal sensitivity ionization detectors in
many tests in which the 0.023 m-1 nominal sensitivity ionization detectors did alarm;
providing further evidence that the difference in optical density at alarm for the ionization
detectors and smoldering fires is related to the detector model and not the nominal
sensitivity of the detectors. The small sample size for the first group could possibly skew
the results, although the magnitude of the difference between the groups suggests that this
is unlikely.
Since the nominal sensitivity of the detectors only appeared significant for ionization
detectors responding to smoldering fires, this variable will only persist for this case in
subsequent analyses, but no longer be considered for the other cases (ionization detectors
responding to flaming fires and photoelectric detectors responding to either flaming or
smoldering fires). With the determination on the significance of the optical density
complete, the effect of ventilation on the optical density at alarm is now examined. Table
9 provides a statistical description of the optical density at alarm considering the status of
the ventilation system (on or off) as a variable in addition to the other variables already
determined to be significant. When operating, the ventilation system used in the Navy
tests produced a flow of approximately 12 air changes per hour in the test compartment.

57
Table 9 - Statistical description of Navy optical density (m-1) at alarm data, grouped according to fire type, detector type, detector nominal sensitivity (where applicable),
and ventilation.
Fire TypeDetector
TypeNominal
SensitivityVentilation
Status 20% 50% 80% Mean Std Dev CountFlaming Ion Off 0.004 0.010 0.021 0.016 0.023 56Flaming Ion On 0.003 0.010 0.024 0.017 0.021 33Flaming Photo Off 0.018 0.025 0.032 0.032 0.025 54Flaming Photo On 0.020 0.028 0.058 0.039 0.025 29
Smoldering Ion 0.019 m-1 Off 0.018 0.038 0.091 0.071 0.085 7Smoldering Ion 0.019 m-1 On 0.006 0.018 0.030 0.028 0.037 7Smoldering Ion 0.023 m-1 Off 0.029 0.104 0.189 0.148 0.168 20Smoldering Ion 0.023 m-1 On 0.032 0.041 0.072 0.063 0.072 18Smoldering Photo Off 0.021 0.054 0.133 0.086 0.093 42Smoldering Photo On 0.009 0.028 0.049 0.032 0.026 38
The status of the ventilation system appears to have an effect on the response of both
ionization and photoelectric detectors responding to smoldering fires. In contrast, there
appears to be little difference in the results between the two ventilation conditions for the
flaming fires, with the exception of the 80th percentile values of photoelectric detectors.
For the smoldering fires, the 20th, 50th, and 80th percentiles of the optical density at alarm
values, as well as the mean values, are a factor of two to three greater when the
ventilation system is off, then for those tests in which the ventilation system was
operating at 12 air changes per hour. Possible reasons for this outcome include an
increased air velocity in the space with the ventilation system operating or that the
operating ventilation system reduces the optical density in the space by dilution with
fresh air or extraction of smoke. A similar trend is not seen for the detectors responding
to flaming fires. For the flaming fires, the 20th, 50th, and 80th percentiles of the optical
density at alarm values, as well as the mean values, correlate well for the two ventilation
conditions. The 80th percentile optical density at alarm values for photoelectric detectors
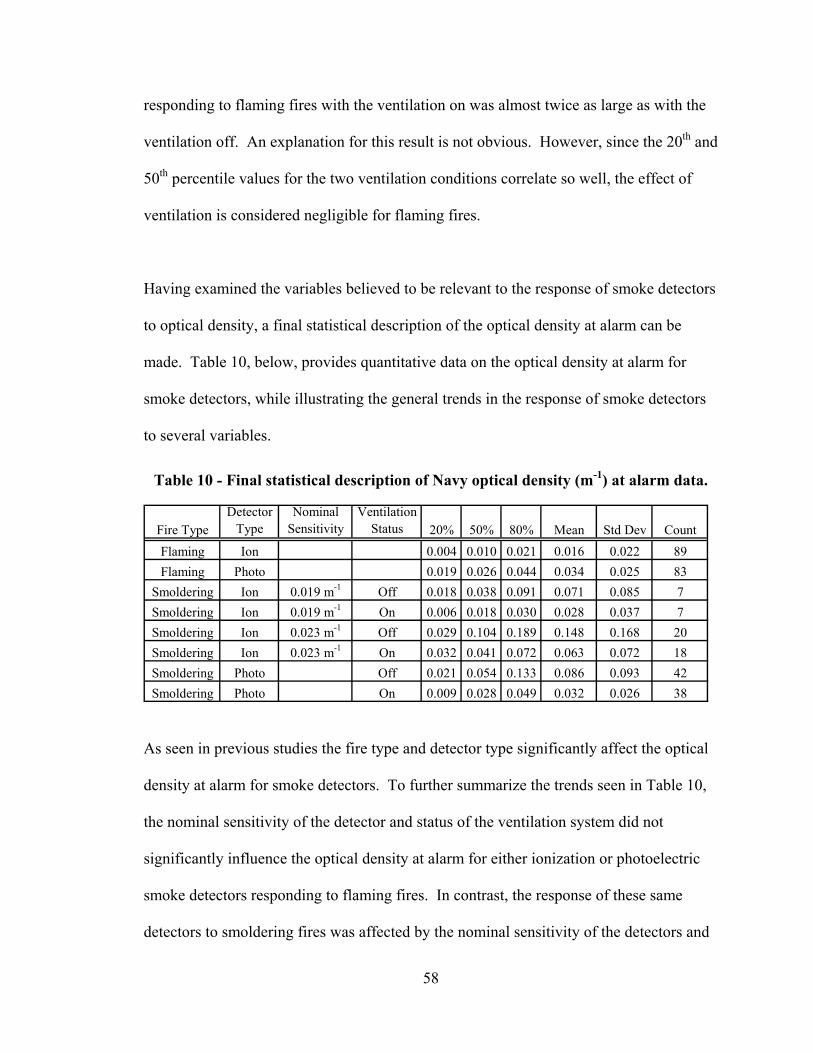
58
responding to flaming fires with the ventilation on was almost twice as large as with the
ventilation off. An explanation for this result is not obvious. However, since the 20th and
50th percentile values for the two ventilation conditions correlate so well, the effect of
ventilation is considered negligible for flaming fires.
Having examined the variables believed to be relevant to the response of smoke detectors
to optical density, a final statistical description of the optical density at alarm can be
made. Table 10, below, provides quantitative data on the optical density at alarm for
smoke detectors, while illustrating the general trends in the response of smoke detectors
to several variables.
Table 10 - Final statistical description of Navy optical density (m-1) at alarm data.
As seen in previous studies the fire type and detector type significantly affect the optical
density at alarm for smoke detectors. To further summarize the trends seen in Table 10,
the nominal sensitivity of the detector and status of the ventilation system did not
significantly influence the optical density at alarm for either ionization or photoelectric
smoke detectors responding to flaming fires. In contrast, the response of these same
detectors to smoldering fires was affected by the nominal sensitivity of the detectors and
Fire TypeDetector
TypeNominal
SensitivityVentilation
Status 20% 50% 80% Mean Std Dev CountFlaming Ion 0.004 0.010 0.021 0.016 0.022 89Flaming Photo 0.019 0.026 0.044 0.034 0.025 83
Smoldering Ion 0.019 m-1 Off 0.018 0.038 0.091 0.071 0.085 7Smoldering Ion 0.019 m-1 On 0.006 0.018 0.030 0.028 0.037 7Smoldering Ion 0.023 m-1 Off 0.029 0.104 0.189 0.148 0.168 20Smoldering Ion 0.023 m-1 On 0.032 0.041 0.072 0.063 0.072 18Smoldering Photo Off 0.021 0.054 0.133 0.086 0.093 42Smoldering Photo On 0.009 0.028 0.049 0.032 0.026 38

59
ventilation in the compartment. The response of the photoelectric detectors to
smoldering fires was only influenced by the ventilation status, while ionization detectors
appeared to be affected by both the ventilation of the compartment and the nominal
sensitivity of the detector. As might be expected, the optical density at alarm values for
smoldering fires with no ventilation were significantly (by a factor of two to three)
greater than when the ventilation system was operating. An operating ventilation system
provides additional momentum to the smoldering smoke, possibly reducing the smoke
entry resistance into the sensing chamber of the detector, while at the same time reducing
the concentration of the smoke in the compartment by dilution (i.e. the addition of clean
outside air into the compartment or removal of smoke particles from the compartment).
The difference in optical density at alarm values for ionization detectors responding to
smoldering fires for different nominal sensitivity values was likely a result of different
detector designs for these detectors. Geiman and Gottuk [2003], found no significant
difference, or at least no recognizable trend in the difference, between detectors of
varying nominal sensitivity values (including detectors of the same design with different
nominal sensitivities). In general, smoldering fires, which tend to produce larger smoke
particles, are more difficult for ionization detectors to detect. Therefore, it is reasonable
to assert that in this more challenging smoke detection scenario for ionization detectors
(i.e. detection of smoke from a smoldering fire) that the response of the detector could be
more sensitive to the detector design. From a modeling standpoint, this presents a
formidable challenge, in that the response of ionization detectors to smoldering fires may
not be suitable for generalization across different detector models.
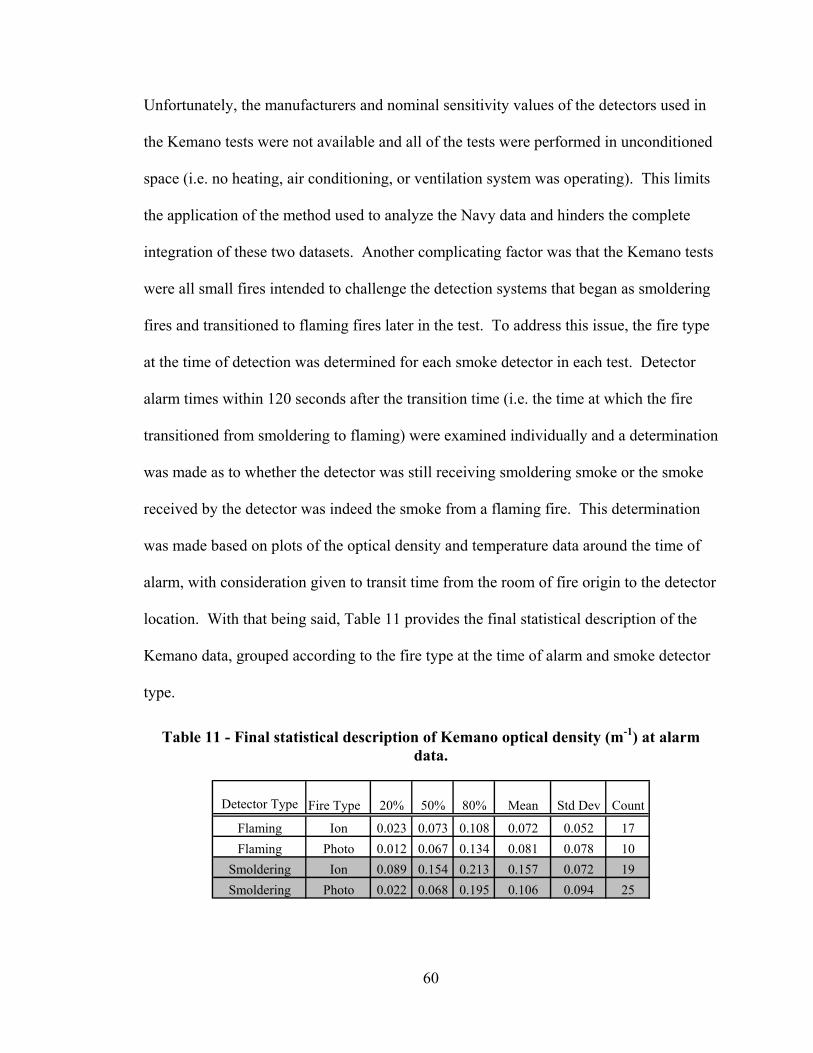
60
Unfortunately, the manufacturers and nominal sensitivity values of the detectors used in
the Kemano tests were not available and all of the tests were performed in unconditioned
space (i.e. no heating, air conditioning, or ventilation system was operating). This limits
the application of the method used to analyze the Navy data and hinders the complete
integration of these two datasets. Another complicating factor was that the Kemano tests
were all small fires intended to challenge the detection systems that began as smoldering
fires and transitioned to flaming fires later in the test. To address this issue, the fire type
at the time of detection was determined for each smoke detector in each test. Detector
alarm times within 120 seconds after the transition time (i.e. the time at which the fire
transitioned from smoldering to flaming) were examined individually and a determination
was made as to whether the detector was still receiving smoldering smoke or the smoke
received by the detector was indeed the smoke from a flaming fire. This determination
was made based on plots of the optical density and temperature data around the time of
alarm, with consideration given to transit time from the room of fire origin to the detector
location. With that being said, Table 11 provides the final statistical description of the
Kemano data, grouped according to the fire type at the time of alarm and smoke detector
type.
Table 11 - Final statistical description of Kemano optical density (m-1) at alarm data.
Detector Type Fire Type 20% 50% 80% Mean Std Dev Count
Flaming Ion 0.023 0.073 0.108 0.072 0.052 17Flaming Photo 0.012 0.067 0.134 0.081 0.078 10
Smoldering Ion 0.089 0.154 0.213 0.157 0.072 19Smoldering Photo 0.022 0.068 0.195 0.106 0.094 25
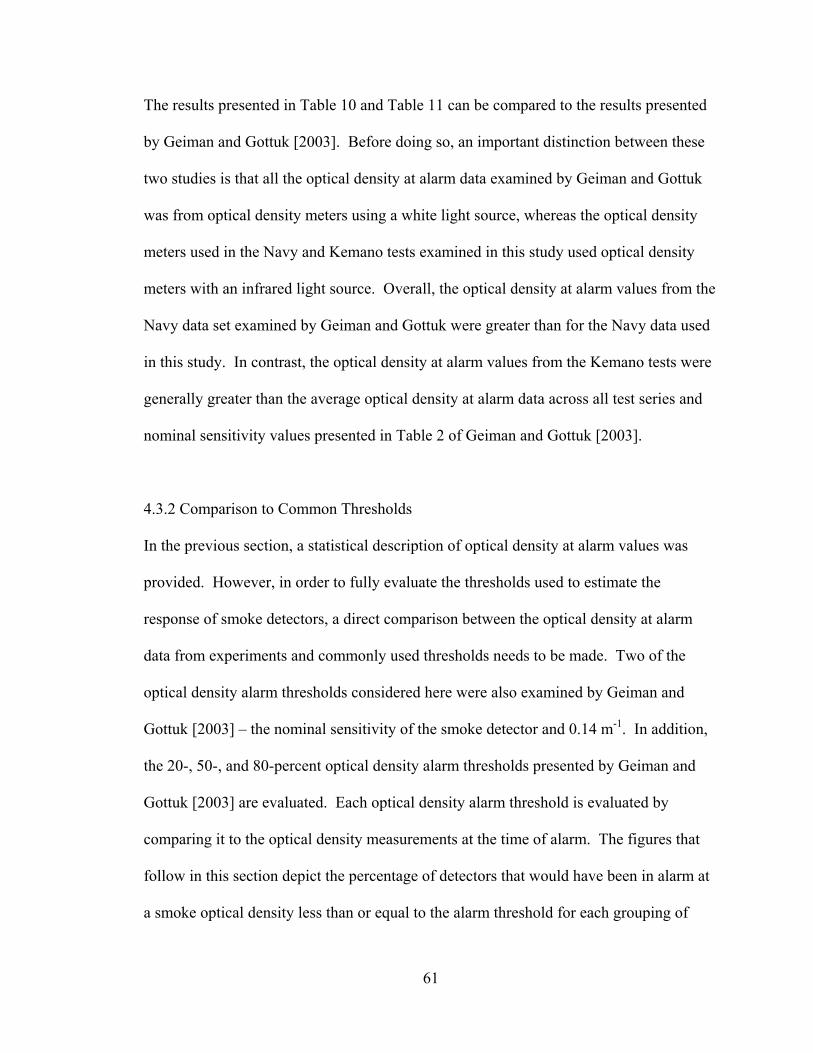
61
The results presented in Table 10 and Table 11 can be compared to the results presented
by Geiman and Gottuk [2003]. Before doing so, an important distinction between these
two studies is that all the optical density at alarm data examined by Geiman and Gottuk
was from optical density meters using a white light source, whereas the optical density
meters used in the Navy and Kemano tests examined in this study used optical density
meters with an infrared light source. Overall, the optical density at alarm values from the
Navy data set examined by Geiman and Gottuk were greater than for the Navy data used
in this study. In contrast, the optical density at alarm values from the Kemano tests were
generally greater than the average optical density at alarm data across all test series and
nominal sensitivity values presented in Table 2 of Geiman and Gottuk [2003].
4.3.2 Comparison to Common Thresholds
In the previous section, a statistical description of optical density at alarm values was
provided. However, in order to fully evaluate the thresholds used to estimate the
response of smoke detectors, a direct comparison between the optical density at alarm
data from experiments and commonly used thresholds needs to be made. Two of the
optical density alarm thresholds considered here were also examined by Geiman and
Gottuk [2003] – the nominal sensitivity of the smoke detector and 0.14 m-1. In addition,
the 20-, 50-, and 80-percent optical density alarm thresholds presented by Geiman and
Gottuk [2003] are evaluated. Each optical density alarm threshold is evaluated by
comparing it to the optical density measurements at the time of alarm. The figures that
follow in this section depict the percentage of detectors that would have been in alarm at
a smoke optical density less than or equal to the alarm threshold for each grouping of

62
significant variables presented in the final statistical descriptions of the data (Table 10
and Table 11).
The first alarm threshold evaluated for optical density measurements is the nominal
sensitivity of the detector. The optical density at alarm of each individual detector is
compared to the nominal sensitivity of that detector. Figure 3 presents the percentage of
detectors that alarmed at or below their nominal sensitivity values. Only the Navy tests
had detectors with known nominal sensitivity values and were therefore the only tests
considered in the evaluation of the nominal sensitivity as an alarm threshold.
If the typical response of a smoke detector is considered to occur when 50 percent of the
population of detectors alarm, then this provides a useful cutoff in evaluating the
effectiveness of an alarm threshold. Therefore, the nominal sensitivity appears to be a
reasonable threshold to evaluate the response of ionization and photoelectric detectors to
flaming fires, as well as photoelectric detectors responding to smoldering fires with an
operating ventilation system. The nominal sensitivity appears to barely capture the
typical response of detectors for smoldering fires being detected by photoelectric
detectors with no ventilation and for the 0.019 m-1 nominal sensitivity ionization
detectors responding to smoldering fires with the ventilation on. For all other cases in
Figure 3, the nominal sensitivity does not capture at least 50 percent of the smoke
detector alarms. Geiman and Gottuk [2003] found that the nominal sensitivity only
captured 50 percent of the smoke detector alarms for ionization detectors responding to
flaming fires. Figure 4 contains their data for comparison to this study. The increased

63
percentages of detector alarms that occurred at optical densities less than or equal to the
nominal sensitivity for the flaming fires and some of the smoldering fires in this study
was surprising compared to the results of Geiman and Gottuk.
76%
45%
11%
15%
57%
29%
77%76%
0%
10%
20%
30%
40%
50%
60%
70%
80%
90%
100%
NavyIon
Flaming
NavyPhoto
Flaming
NavyIon
Smoldering0.019 1/mVent Off
NavyIon
Smoldering0.019 1/mVent On
NavyIon
Smoldering0.023 1/mVent Off
NavyIon
Smoldering0.023 1/mVent On
NavyPhoto
SmolderingVent Off
NavyPhoto
SmolderingVent On
Perc
enta
ge o
f Det
ecto
rs A
larm
ed
Figure 3 - Percentage of detectors that alarmed at an optical density less than or equal to the nominal sensitivity of each detector.
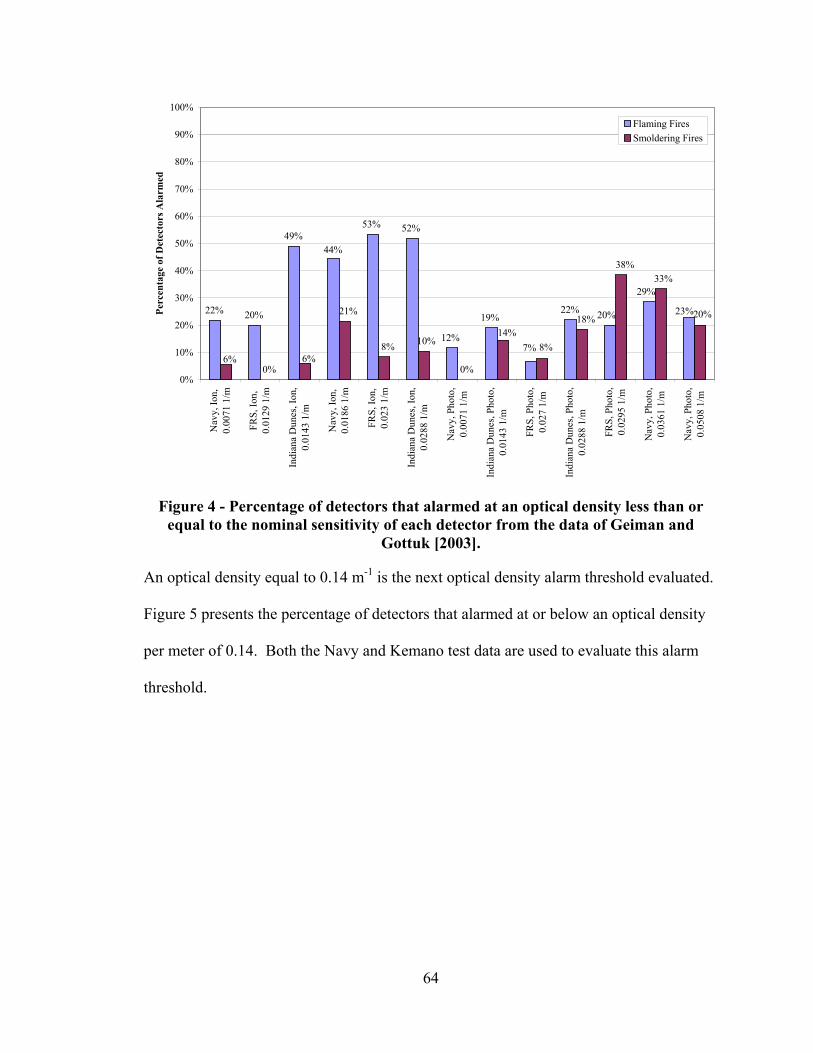
64
23%
29%
20%22%
7%
19%
12%
52%53%
44%49%
20%22% 20%
33%38%
18%
8%14%
0%
10%8%
21%
6%0%
6%
0%
10%
20%
30%
40%
50%
60%
70%
80%
90%
100%
Nav
y, Io
n,0.
0071
1/m
FRS,
Ion,
0.01
29 1
/m
Indi
ana
Dun
es, I
on,
0.01
43 1
/m
Nav
y, Io
n,0.
0186
1/m
FRS,
Ion,
0.02
3 1/
m
Indi
ana
Dun
es, I
on,
0.02
88 1
/m
Nav
y, P
hoto
,0.
0071
1/m
Indi
ana
Dun
es, P
hoto
,0.
0143
1/m
FRS,
Pho
to,
0.02
7 1/
m
Indi
ana
Dun
es, P
hoto
,0.
0288
1/m
FRS,
Pho
to,
0.02
95 1
/m
Nav
y, P
hoto
,0.
0361
1/m
Nav
y, P
hoto
,0.
0508
1/m
Perc
enta
ge o
f Det
ecto
rs A
larm
ed
Flaming FiresSmoldering Fires
Figure 4 - Percentage of detectors that alarmed at an optical density less than or
equal to the nominal sensitivity of each detector from the data of Geiman and Gottuk [2003].
An optical density equal to 0.14 m-1 is the next optical density alarm threshold evaluated.
Figure 5 presents the percentage of detectors that alarmed at or below an optical density
per meter of 0.14. Both the Navy and Kemano test data are used to evaluate this alarm
threshold.
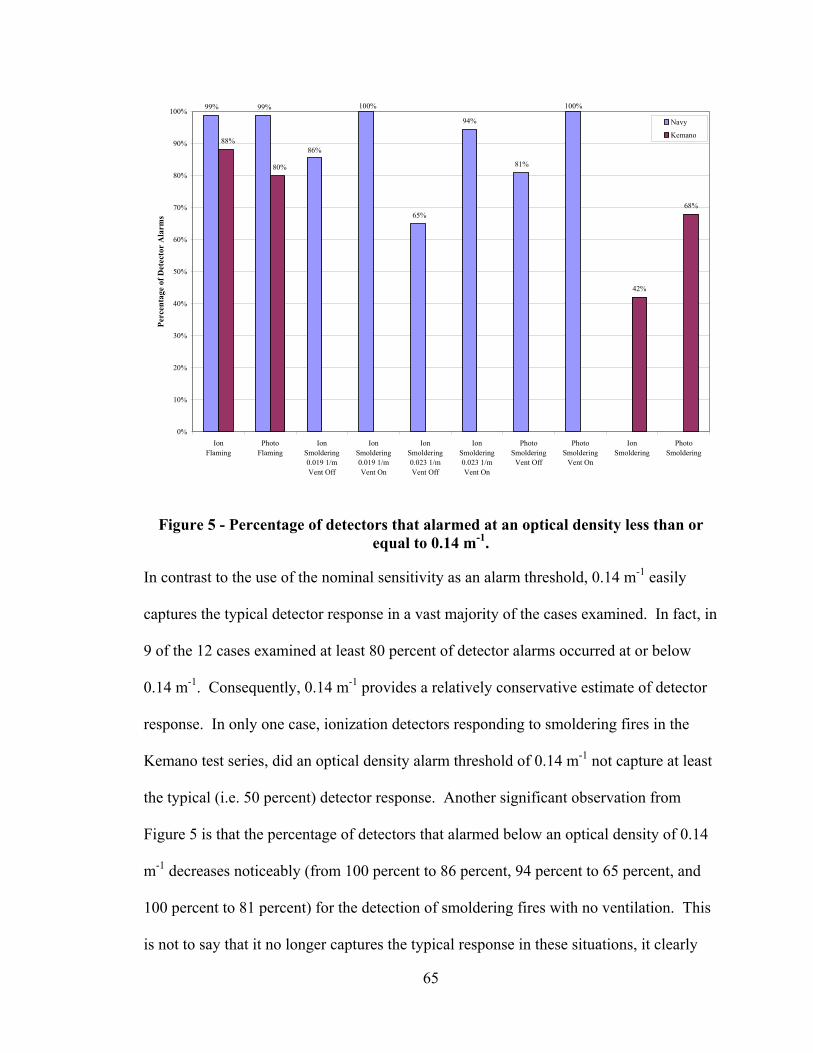
65
100%
81%
94%
65%
100%
86%
99%99%
68%
42%
80%
88%
0%
10%
20%
30%
40%
50%
60%
70%
80%
90%
100%
IonFlaming
PhotoFlaming
IonSmoldering0.019 1/mVent Off
IonSmoldering0.019 1/mVent On
IonSmoldering0.023 1/mVent Off
IonSmoldering0.023 1/mVent On
PhotoSmoldering
Vent Off
PhotoSmoldering
Vent On
IonSmoldering
PhotoSmoldering
Perc
enta
ge o
f Det
ecto
r A
larm
s
Navy
Kemano
Figure 5 - Percentage of detectors that alarmed at an optical density less than or equal to 0.14 m-1.
In contrast to the use of the nominal sensitivity as an alarm threshold, 0.14 m-1 easily
captures the typical detector response in a vast majority of the cases examined. In fact, in
9 of the 12 cases examined at least 80 percent of detector alarms occurred at or below
0.14 m-1. Consequently, 0.14 m-1 provides a relatively conservative estimate of detector
response. In only one case, ionization detectors responding to smoldering fires in the
Kemano test series, did an optical density alarm threshold of 0.14 m-1 not capture at least
the typical (i.e. 50 percent) detector response. Another significant observation from
Figure 5 is that the percentage of detectors that alarmed below an optical density of 0.14
m-1 decreases noticeably (from 100 percent to 86 percent, 94 percent to 65 percent, and
100 percent to 81 percent) for the detection of smoldering fires with no ventilation. This
is not to say that it no longer captures the typical response in these situations, it clearly
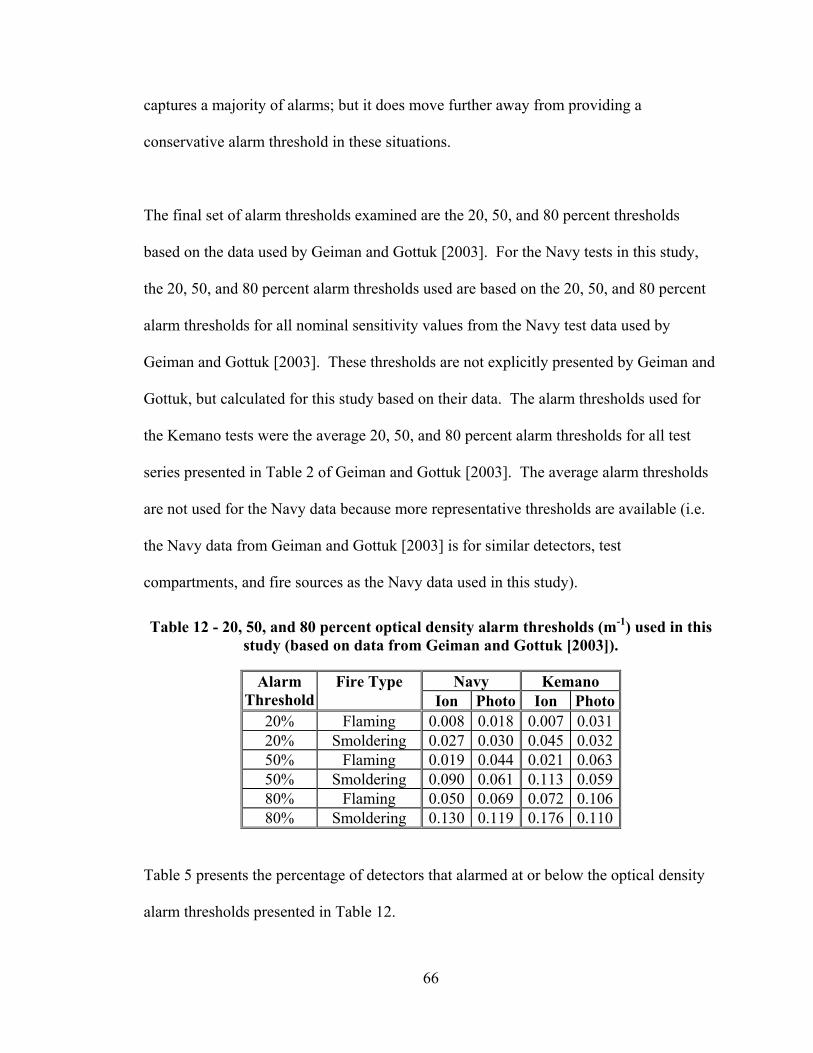
66
captures a majority of alarms; but it does move further away from providing a
conservative alarm threshold in these situations.
The final set of alarm thresholds examined are the 20, 50, and 80 percent thresholds
based on the data used by Geiman and Gottuk [2003]. For the Navy tests in this study,
the 20, 50, and 80 percent alarm thresholds used are based on the 20, 50, and 80 percent
alarm thresholds for all nominal sensitivity values from the Navy test data used by
Geiman and Gottuk [2003]. These thresholds are not explicitly presented by Geiman and
Gottuk, but calculated for this study based on their data. The alarm thresholds used for
the Kemano tests were the average 20, 50, and 80 percent alarm thresholds for all test
series presented in Table 2 of Geiman and Gottuk [2003]. The average alarm thresholds
are not used for the Navy data because more representative thresholds are available (i.e.
the Navy data from Geiman and Gottuk [2003] is for similar detectors, test
compartments, and fire sources as the Navy data used in this study).
Table 12 - 20, 50, and 80 percent optical density alarm thresholds (m-1) used in this study (based on data from Geiman and Gottuk [2003]).
Navy Kemano Alarm Threshold
Fire Type Ion Photo Ion Photo
20% Flaming 0.008 0.018 0.007 0.031 20% Smoldering 0.027 0.030 0.045 0.032 50% Flaming 0.019 0.044 0.021 0.063 50% Smoldering 0.090 0.061 0.113 0.059 80% Flaming 0.050 0.069 0.072 0.106 80% Smoldering 0.130 0.119 0.176 0.110
Table 5 presents the percentage of detectors that alarmed at or below the optical density
alarm thresholds presented in Table 12.

67
44%
19%
43%
71%
15%11%
31%
53%
18%
30%
0%
28%
72%
80%
71%
86%
40%
83%
57%
89%
24%
50%
42%44%
93%90%
86%
100%
65%
94%
71%
97%
47%
70% 68%
60%
0%
10%
20%
30%
40%
50%
60%
70%
80%
90%
100%
NavyIon
Flaming
NavyPhoto
Flaming
NavyIon
Smoldering0.019 1/mVent Off
NavyIon
Smoldering0.019 1/mVent On
NavyIon
Smoldering0.023 1/mVent Off
NavyIon
Smoldering0.023 1/mVent On
NavyPhoto
SmolderingVent Off
NavyPhoto
SmolderingVent On
KemanoIon
Flaming
KemanoPhoto
Flaming
KemanoIon
Smoldering
KemanoPhoto
Smoldering
Perc
enta
ge o
f Det
ecto
r A
larm
s
20% Alarm Threshold
50% Alarm Threshold
80% Alarm Threshold
Figure 6 - Percentage of detectors that alarmed at an optical density less than or
equal to the 20, 50, and 80 percent optical density alarm thresholds from Table 12.
One obvious conclusion from Figure 6 is that although the thresholds used represented
the 20th, 50th, and 80th percentile of that population of data, the percentages of detectors
that alarmed at or below these thresholds varied significantly in this study. For example,
the percentages of detector alarms that occurred at or below the 20 percent optical density
thresholds from Table 12 ranged from 0 to 71. However, the majority of the 20 percent
optical density alarm thresholds resulted in approximately 20 to 40 percent of detector
alarms occurring at or below these optical densities. The range of results for the 50
percent optical density alarm threshold was 24 – 86 percent. However, most of the
results for the 50 percent alarm threshold lied in the range of 40 – 70 percent. Similarly,
the 80 percent alarm thresholds resulted in 45 – 100 percent of alarms being captured,
with the majority of results in the range of approximately 70 – 90 percent. Although the
20, 50, and 80 percent optical density alarm thresholds from Table 12 do not provide
tremendous accuracy in the exact percentage of detector alarms captured, in general they
68
do capture lower, middle, and upper ranges of detector alarms in the general vicinity of
these percentages as is there intended use.
4.4 Temperature Rise at Alarm
4.4.1 Statistical Description
Since no previous statistical description of temperature rise values at alarm exists, the
process used for the optical density alarm presented in the previous section is adopted.
The fire type and detector type are assumed to be significant. The significance of the
nominal sensitivity of the detector and compartment ventilation status to the temperature
rise at alarm are explored. The data from the Navy tests is the only data suitable to
perform this evaluation. Later in this section, the data from the Kemano tests will be
presented, separately.
To determine the significance of the detector nominal sensitivity on the temperature rise
at alarm, Table 13 provides a statistical description of the temperature rise at alarm data
that considered the nominal sensitivity, in addition to the fire type and detector type, for
the flaming fires. Results for the smoldering fire tests were eliminated from this table
due to the fact that there was no appreciable temperature rise for the smoldering fires.
For the smoldering fire tests, the 80th percentile temperature rise at alarm was
approximately 1°C for each detector type and nominal sensitivity presented in Table 13,.
Furthermore, the maximum temperature rise at alarm values for each detector type and
nominal sensitivity were only 2 – 3°C. A temperature rise of 1°C is not only within the

69
normal range of ambient temperature variation, but also within the accuracy of the
thermocouple.
Table 13 - Statistical description of Navy temperature rise (°C) at alarm data for flaming fires, grouped according to detector type and detector nominal sensitivity.
Fire TypeDetector
TypeNominal
Sensitivity 20% 50% 80% Mean Std Dev Count
Flaming Ion 0.019 m-1 1 2 4 2 3 54Flaming Ion 0.023 m-1 0 1 2 1 2 49Flaming Photo 0.036 m-1 1 11 19 11 10 51Flaming Photo 0.051 m-1 1 7 15 9 10 47
Although there is some difference in the temperature rise at alarm between the nominal
sensitivity values, the nominal sensitivity of the detectors does not appear to significantly
influence the temperature rise at alarm. This determination is not based solely on the
results presented in Table 13, but rather an examination of the entire population of
temperature rise at alarm data in ten-percentile increments. The difference between the
two nominal sensitivity values is never more than 2°C for the ionization detectors and
never more than 4°C for the photoelectric detectors between the data for the two nominal
sensitivities at the same percentile of the population. Therefore, the nominal sensitivity
of the detectors is no longer considered as a variable affecting the temperature rise at
alarm.
The effect of ventilation on the temperature rise at alarm is now examined. Table 14
presents a statistical description of the temperature rise at alarm for the flaming fires
considering the detector type and ventilation status. The smoldering fires were excluded
due to negligible temperature rises at alarm.

70
Table 14 - Statistical description of Navy temperature rise (°C) at alarm data for flaming fires, grouped according to detector type and ventilation status.
Fire TypeDetector
TypeVentilation
Status 20% 50% 80% Mean Std Dev CountFlaming Ion Off 1 2 3 2 2 65Flaming Ion On 0 1 3 2 3 38Flaming Photo Off 2 8 16 10 8 63Flaming Photo On 0 7 20 11 12 35
As with the nominal sensitivity, the temperature rise at alarm does not appear to be
significantly influenced by the ventilation status. Due to the nominal sensitivity and
ventilation not significantly affecting the temperature rise at alarm, only the detector type
is considered in the final statistical description of the temperature rise at alarm for the
flaming fires. Table 15 provides the final description of the data, as well as the maximum
temperature rise at alarm for the smoldering Navy tests and the maximum temperature
rise at alarm for the smoldering and flaming Kemano tests.
Table 15 - Statistical description of temperature rise (°C) at alarm data for both test series, grouped according to fire type and detector type.
Test Series Fire TypeDetector
Type 20% 50% 80% Maximum Mean Std Dev CountNavy Flaming Ion 0 1 3 15 2 3 103Navy Flaming Photo 1 8 16 38 10 10 98Navy Smoldering Ion 3 58Navy Smoldering Photo 3 83
Kemano Flaming Ion 1 20Kemano Flaming Photo 3 10Kemano Smoldering Ion 1 21Kemano Smoldering Photo 1 31
For the flaming fires, ionization detectors alarm at lower temperature rises than
photoelectric fires. This observation is consistent with the optical density at alarm data
(see Table 10 and Table 11), where the optical density at alarm is generally higher for
photoelectric detectors than ionization detectors for flaming fires. It should also be noted
that for flaming fires detected by ionization detectors, the temperature rise at alarm was
71
barely noticeable, with approximately 80 percent of the alarms occurring at temperature
rises of 3°C or less.
The shaded rows in Table 15 represent data in which no significant temperature rise at
alarm is found. For these rows, even at the 80th percentile the temperature rise at alarm is
approximately 1°C or less. The maximum values are only provided to demonstrate the
lack of correlation between the temperature rise and detector alarm status for these cases.
Interestingly, even the detector alarms that occurred during the flaming period of burning
in the Kemano tests showed no substantial temperature rise at the time of alarm. It is
important to remember that the flaming fires in the Kemano tests began as slow
smoldering fires and later transitioned to flaming combustion. Regardless, based on these
results it does not appear prudent to use temperature rise alarm thresholds for smoldering
fires or those that begin as smoldering fires and later transition to flaming fires.
4.4.2 Comparison to Common Thresholds
This section provides a direct comparison between the experimental temperature rise at
alarm data and commonly used thresholds in order to fully evaluate the temperature rise
thresholds used to estimate the response of smoke detectors. Temperatures rises of 4°C
and 13°C are evaluated as temperature rise alarm thresholds. In addition, the material-
specific temperature rises presented by Heskestad and Delichatsios [1977] (see Table 4)
for flaming fires are evaluated. Based on the statistical description of the temperature
rise at alarm data in the previous section, only the flaming fires from the Navy tests are
presented in Figure 7. For the smoldering Navy tests and all the Kemano tests, there was
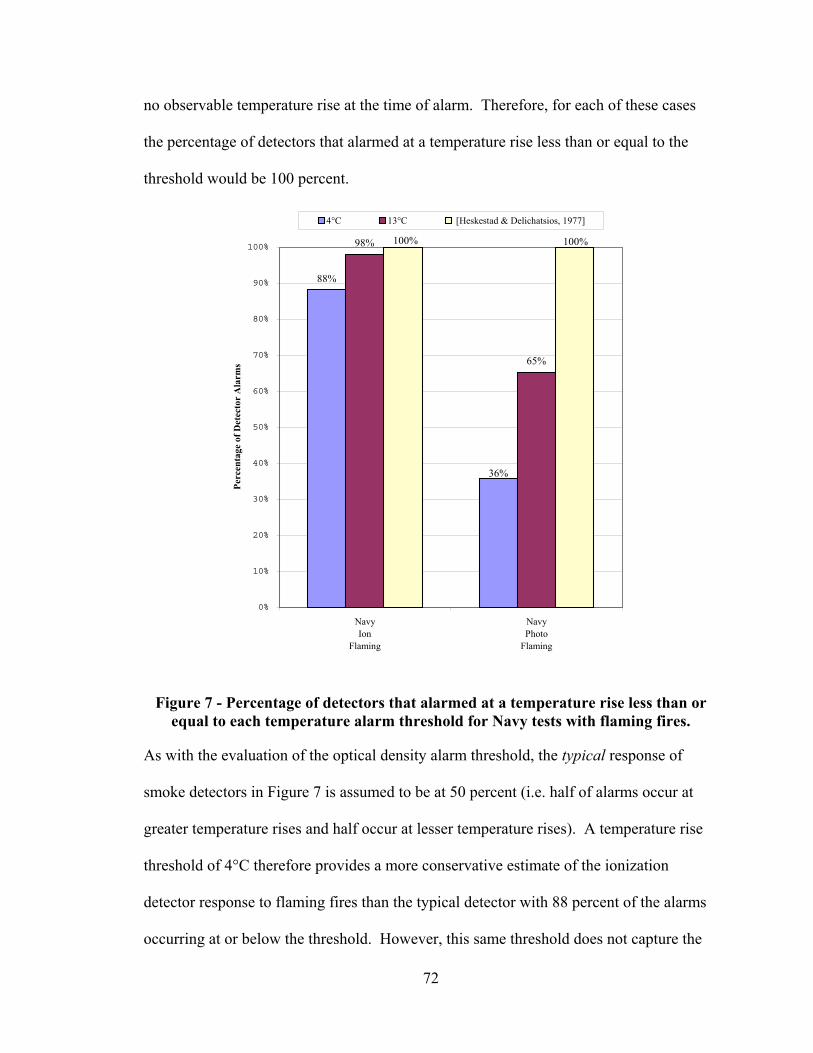
72
no observable temperature rise at the time of alarm. Therefore, for each of these cases
the percentage of detectors that alarmed at a temperature rise less than or equal to the
threshold would be 100 percent.
88%
36%
98%
65%
100% 100%
0%
10%
20%
30%
40%
50%
60%
70%
80%
90%
100%
NavyIon
Flaming
NavyPhoto
Flaming
Perc
enta
ge o
f Det
ecto
r A
larm
s
4°C 13°C [Heskestad & Delichatsios, 1977]
Figure 7 - Percentage of detectors that alarmed at a temperature rise less than or equal to each temperature alarm threshold for Navy tests with flaming fires.
As with the evaluation of the optical density alarm threshold, the typical response of
smoke detectors in Figure 7 is assumed to be at 50 percent (i.e. half of alarms occur at
greater temperature rises and half occur at lesser temperature rises). A temperature rise
threshold of 4°C therefore provides a more conservative estimate of the ionization
detector response to flaming fires than the typical detector with 88 percent of the alarms
occurring at or below the threshold. However, this same threshold does not capture the

73
typical detector response for flaming fires being detected by photoelectric detectors (only
36 percent of detectors alarmed below the threshold). At an alarm threshold of 13°C, the
results are slightly different. As expected based on the performance of the 4°C threshold,
an alarm threshold of 13°C provides a significantly conservative estimate of the detector
response (i.e. 98 percent of alarms occurred at or below this threshold) as compared to
the typical response. The 13°C threshold does capture the typical response of
photoelectric detectors to flaming fires, in contrast to the 4°C threshold. Finally, for both
ionization and photoelectric detectors responding to flaming fires, the material-specific
temperature rises capture 100 percent of all detector alarms, meaning that all alarms
occurred at temperature rises less than the threshold values. Although the percentage of
detectors that had alarmed once the temperature rise thresholds had been reached was
large in most cases, this does not necessarily translate into outstanding performance from
a modeling standpoint. Since a vast number of alarms occurred at much lower
temperature rises, the thresholds examined would possibly predict alarms much later than
they actually occur or may never indicate an alarm occurred when it actually did. Phase
2 will hopefully demonstrate this possible shortcoming of using conservative alarm
thresholds.
4.5 Velocity at Alarm
In comparison to the optical density and temperature data available at the time of detector
alarms, there is relatively little available velocity data at the time of alarm. There are
only a total of approximately 50 smoke detector alarms at which velocity data is
available, all of which come from the Navy test series. No velocity measurement
74
instrumentation was used in the Kemano tests. Consequently, the results presented in this
section are less certain than those presented in previous sections for the optical density
and temperature rise at alarm.
4.5.1 Statistical Description
During an initial examination of the available velocity at alarm data, inconsistencies were
noted for the smoldering fire tests. For that reason, the velocity data as a function of time
was plotted for all tests in which alarms occurred. This exercise revealed that for 6 of the
9 smoldering tests for which velocity data was available and detectors near the velocity
probe had alarmed there was no distinguishable difference between the velocity during
the test and the ambient velocity before the fire source was ignited. Five of these six tests
were tests in which there was no ventilation system in operation; a result that is expected.
Figure 8 presents the velocity magnitude as a function of time (from ignition) for test
NAVY-2-05, a smoldering lactose / potassium chlorate fire with no ventilation. The
adjacent detector alarms are shown as vertical lines in this plot, labeled with the detector
number that alarmed. Negative times shown in the plot reflect data taken before ignition
of the fire source, which was taken to provide baseline conditions for each test.
For the three smoldering tests in which there were noticeable increases in the velocity
magnitude, a peak velocity of approximately 0.15 m/s occurred as a brief spike(s) in the
measured velocity magnitude for a period(s) of no more than 10 to 15 seconds at a time.
These peaks typically occurred once or twice in close succession, with the remainder of
the velocity data before and after the peak being similar to that shown in Figure 8. The

75
detector alarms in these tests (9 total alarms for the 3 tests) generally corresponded to the
peaks in the velocity magnitude. However, the other 14 detector alarms that occurred
during the 6 smoldering tests discussed earlier showed no distinguishable increase in
velocity magnitude that could be attributed to the fire source. Therefore, it was
concluded that evaluating the velocity at the time of alarm for the smoldering fire tests
would not provide any information that would be useful for modeling the response of
smoke detectors.
Detector #8Alarm
Detector #6Alarm
Detector #5Alarm
0.0
0.1
0.2
0.3
0.4
0.5
0.6
0.7
0.8
0.9
1.0
-120 -60 0 60 120 180 240 300 360 420 480 540 600 660 720
Time from Ignition (s)
Vel
ocity
(m/s
)
Figure 8 - Velocity magnitude as a function of time for test NAVY-2-05, a smoldering lactose / potassium chlorate fire with no ventilation.
In contrast to the velocity data from the smoldering fires, the velocity data from the
flaming fires demonstrated an increase in velocity attributable to the fire source and
therefore the velocity at detector alarm will be evaluated for these tests. This
determination is again based on an examination of plots of the velocity magnitude as a
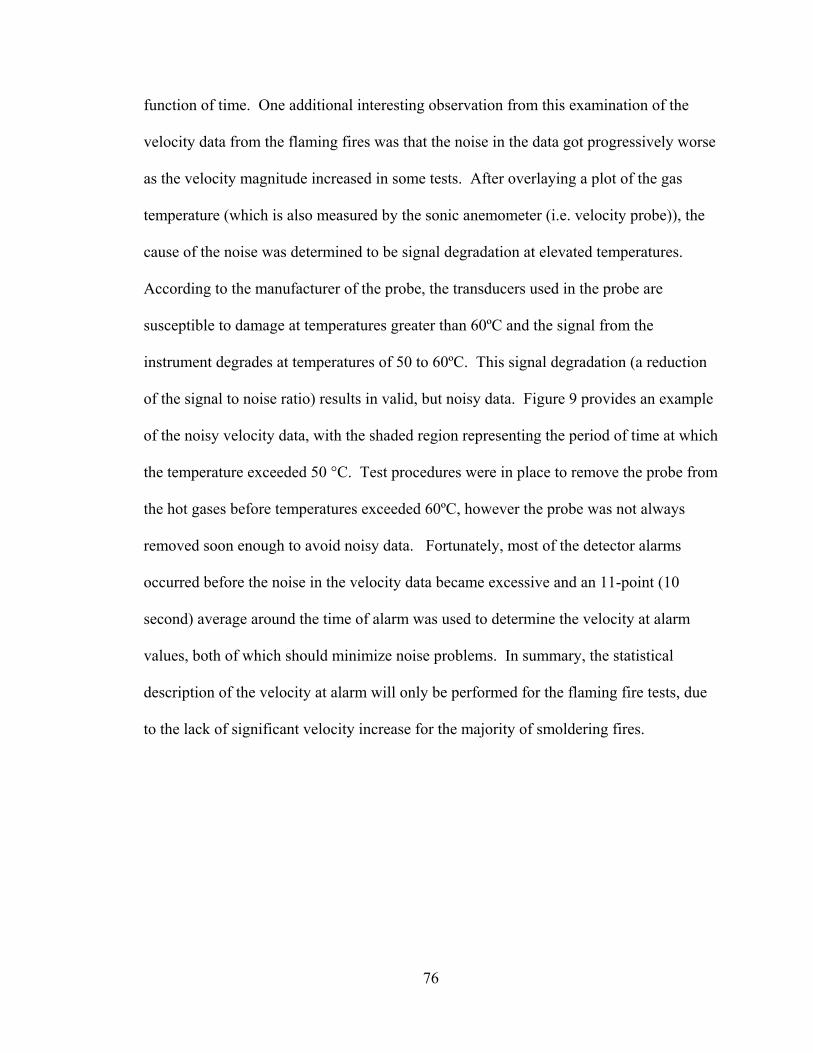
76
function of time. One additional interesting observation from this examination of the
velocity data from the flaming fires was that the noise in the data got progressively worse
as the velocity magnitude increased in some tests. After overlaying a plot of the gas
temperature (which is also measured by the sonic anemometer (i.e. velocity probe)), the
cause of the noise was determined to be signal degradation at elevated temperatures.
According to the manufacturer of the probe, the transducers used in the probe are
susceptible to damage at temperatures greater than 60ºC and the signal from the
instrument degrades at temperatures of 50 to 60ºC. This signal degradation (a reduction
of the signal to noise ratio) results in valid, but noisy data. Figure 9 provides an example
of the noisy velocity data, with the shaded region representing the period of time at which
the temperature exceeded 50 °C. Test procedures were in place to remove the probe from
the hot gases before temperatures exceeded 60ºC, however the probe was not always
removed soon enough to avoid noisy data. Fortunately, most of the detector alarms
occurred before the noise in the velocity data became excessive and an 11-point (10
second) average around the time of alarm was used to determine the velocity at alarm
values, both of which should minimize noise problems. In summary, the statistical
description of the velocity at alarm will only be performed for the flaming fire tests, due
to the lack of significant velocity increase for the majority of smoldering fires.
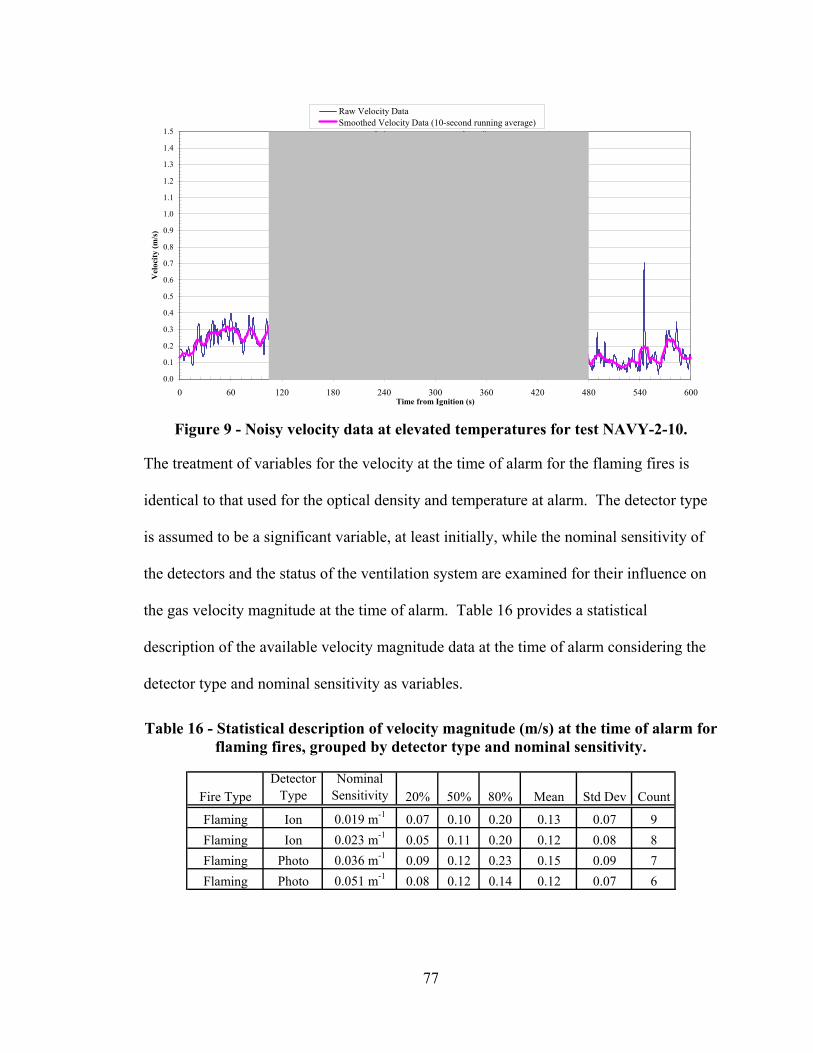
77
0.0
0.1
0.2
0.3
0.4
0.5
0.6
0.7
0.8
0.9
1.0
1.1
1.2
1.3
1.4
1.5
0 60 120 180 240 300 360 420 480 540 600Time from Ignition (s)
Vel
ocity
(m/s
)
Raw Velocity DataSmoothed Velocity Data (10-second running average)
Figure 9 - Noisy velocity data at elevated temperatures for test NAVY-2-10.
The treatment of variables for the velocity at the time of alarm for the flaming fires is
identical to that used for the optical density and temperature at alarm. The detector type
is assumed to be a significant variable, at least initially, while the nominal sensitivity of
the detectors and the status of the ventilation system are examined for their influence on
the gas velocity magnitude at the time of alarm. Table 16 provides a statistical
description of the available velocity magnitude data at the time of alarm considering the
detector type and nominal sensitivity as variables.
Table 16 - Statistical description of velocity magnitude (m/s) at the time of alarm for flaming fires, grouped by detector type and nominal sensitivity.
Fire TypeDetector
TypeNominal
Sensitivity 20% 50% 80% Mean Std Dev Count
Flaming Ion 0.019 m-1 0.07 0.10 0.20 0.13 0.07 9Flaming Ion 0.023 m-1 0.05 0.11 0.20 0.12 0.08 8Flaming Photo 0.036 m-1 0.09 0.12 0.23 0.15 0.09 7Flaming Photo 0.051 m-1 0.08 0.12 0.14 0.12 0.07 6

78
Based on the results in Table 16, the nominal sensitivity does not appear to significantly
affect the velocity magnitude at alarm. In addition, the type of detector does not seem to
affect the velocity magnitude at alarm, despite the initial assumption to the contrary.
Considering the small samples sizes, the degree of correlation between the different types
of detectors and nominal sensitivities within a fire type is somewhat remarkable.
Eliminating both the type and nominal sensitivity of the detectors as variables affecting
velocity at alarm, the effect of the ventilation status on the velocity at alarm is examined.
Table 17 provides a statistical description of the velocity magnitude at the time of
detector alarm for flaming fires with and without the ventilation system in the
compartment operating.
Table 17 - Statistical description of velocity magnitude (m/s) at the time of alarm for flaming fires, grouped by ventilation status.
Fire TypeVentilation
Status 20% 50% 80% Mean Std Dev CountFlaming Off 0.06 0.11 0.20 0.12 0.07 18Flaming On 0.07 0.12 0.21 0.14 0.08 12
The results presented in Table 17 are, for all practical purposes, identical for the two
ventilation conditions examined. Therefore, the only significant variable affecting the
velocity at alarm is the fire type. For smoldering fires, there is no significant increase in
velocity over ambient levels for the vast majority of tests. For flaming fires, the velocity
at alarm values (in units of m/s) are 0.07, 0.12, and 0.21 for the 20th, 50th, and 80th
percentiles of the population respectively, with the arithmetic mean value equal to 0.13
with a standard deviation of 0.07. Interestingly, unlike most of the optical density and
temperature rise data, the mean and median velocity at alarm values are quite similar. In

79
addition, notice that the range of values within one standard deviation of the mean (0.06 –
0.20 m/s) captures approximately the middle 60 percent of the data. In combination,
these observations suggest that the population of velocity magnitude at alarm data is
likely normally distributed.
The lack of dependence of the velocity magnitude at alarm on any variables other than
the fire type suggests that the two models of ionization detectors and the two models of
photoelectric detectors tested in the Navy test series all have similar smoke entry
characteristics. Although there is not sufficient evidence to unconditionally extrapolate
this statement to all detector models, these results provide evidence that the difference in
smoke entry characteristics between operating principles and models of modern spot-type
smoke detectors has been greatly reduced over previous generations of smoke detector
technology. Consequently, a single velocity threshold (or threshold velocity range) may
be sufficient to predict all detector alarms to flaming fires.
4.5.2 Comparison to Common Thresholds
There is currently only one threshold related to the velocity at the time of alarm. This
threshold is often referred to as a critical velocity and is typically given as a value of 0.15
m/s. To evaluate the critical velocity as an alarm threshold, the percentage of detectors
that alarmed at a velocity magnitude less than or equal to this threshold is examined. As
expected from the discussion in this previous section regarding the lack of an increase in
velocity from the smoldering fires, 100 percent of alarms from smoldering fire tests
occurred below 0.15 m/s. In contrast, only 67 percent of alarms during flaming fire tests

80
occurred at or below 0.15 m/s. This result highlights the fact that although it has been
termed a critical velocity, alarms, in this case a majority of them, occur at velocities less
than this value.
4.6 Relationship between Optical Density and Temperature Rise at Alarm
One of the fundamental assumptions of the temperature rise method of estimating smoke
detector response is the constancy of the ratio of optical density to temperature rise in
both time and space. The data to support this assumption by Heskestad and Delichatsios
in their development of the temperature rise method does not conclusively confirm the
constancy of the optical density to temperature rise ratio. However, they believed that
“representative” values of the ratio of optical density to temperature rise were sufficiently
accurate for rough estimation purposes. The representative values they presented were
only for flaming spreading fires. The optical density and temperature rise values at alarm
from the Navy experiments can be used to some extent to either confirm or refute the
constancy of the optical density to temperature rise ratios. Unfortunately, the only
flaming fire source used in both the work by Heskestad and Delichatsios [1977] and the
experiments examined in this report is a wood crib. Flaming wood crib fires were
conducted in the Navy test series. Figure 10 shows the entire population of optical
density to temperature rise ratios at alarm for the Navy flaming wood crib fires, as well as
the representative ratio for this fire source provided by Heskestad and Delichatsios
[1977].

81
0%
10%
20%
30%
40%
50%
60%
70%
80%
90%
100%
1.0E-04 1.0E-03 1.0E-02 1.0E-01 1.0E+00
Optical Density to Temp Rise Ratio at Alarm (1/m°C)
Perc
entil
e of
Det
ecto
r A
larm
s
Navy Flaming Wood Crib Fires
Mean of Navy Flaming Wood Crib Fires
Representative Ratio for Flaming Wood Crib Fires from [Heskestad & Delichatsios, 1977]
Figure 10 - Optical density to temperature rise ratios for flaming wood crib fires.
Despite the claim that the optical density to temperature rise ratio is constant in both time
and space, Figure 10 shows this ratio varying by over two orders of magnitude at the time
of alarm. The representative value determined by Heskestad and Delichatsios was for the
period of active fire growth and the data used to determine this ratio excluded
temperature rises less than 3 ºC (5 ºF). If this value was truly representative, one would
expect a narrow band around the representative value, not values differing by two orders
of magnitude. Although the data presented in Figure 10 is at the time of alarm and the
representative value is during active fire spread, this difference should be insignificant if
the value is constant in time and space. Furthermore, the value of the optical density to

82
temperature rise ratio at the time of alarm is the desired value for the intended purpose of
the ratio – to calculate a temperature rise at detection based on a characteristic optical
density at detection.
One explanation for the inconsistency between the data and the representative value in
Figure 10 is that the smoke detectors are operating during periods other than the active
fire growth period. The ratio of optical density to temperature rise before active fire
growth occurs or during the decay period may vary. The data presented by Heskestad
and Delichatsios showed variation as a function of time, but even this was not an orders
of magnitude variation. The other possible explanation for the discrepancy seen in Figure
10 is due to the exclusion of temperature rise values less than 3 ºC. The rationale behind
the exclusion of these small temperature rises was to prevent interference from ambient
temperature variations and contributions of the ignitor fuels. While these are both
judicious motives, for the Navy flaming fires 80 percent of ionization detectors and 40
percent of photoelectric detectors alarmed at temperature rises less than or equal to 3 ºC.
This observation provides a motivation not to exclude small temperature rises from the
determination of the optical density to temperature rise ratio in this study. As seen in
Figure 11, small temperature rise values tend to increase the optical density to
temperature rise ratio. This may explain why the representative optical density to
temperature rise ratio from Heskestad and Delichatsios appears near the minimum value
for all the ratios shown in Figure 10.

83
0
5
10
15
20
25
30
35
40
1.E-04 1.E-03 1.E-02 1.E-01 1.E+00
Optical Density to Temperature Rise Ratio (1/m°C)
Tem
pera
ture
Ris
e (°
C)
Navy Flaming Wood Crib Fires3 °C Temperature RiseRepresentative Ratio for Flaming Wood Crib Fires from [Heskestad & Delichatsios, 1977]
Figure 11 - Temperature rise at alarm plotted as a function of optical density to
temperature rise ratio at alarm for the Navy flaming wood crib fires.
Based on the results for the optical density to temperature rise ratio at alarm presented in
this section, the ratio is not constant and can vary over several orders of magnitude at the
time of alarm. Since the constancy of the optical density to temperature rise ratio is one
of the fundamental assumptions in using the temperature rise method, these results raise
serious questions as to the validity of that approach, especially considering the prevalence
of alarms occurring at nearly indistinguishable temperature rises for smoldering fires,

84
smoldering to flaming transitional fires, and to a lesser extent flaming fires being detected
by ionization detectors.

85
CHAPTER 5: PHASE 2 RESULTS
The second phase of this analysis uses the experimental measurements of optical density,
temperature, and velocity adjacent to smoke detectors to estimate the response of smoke
detectors based on typical alarm threshold values of these measurements. The goal of
this phase is to assess the uncertainty in estimating smoke detector response based on the
thresholds presented. A custom Microsoft Excel spreadsheet program was developed
with Visual Basic for Applications that calculates the estimated alarm times and their
associated errors with respect to the experimental alarm times for the threshold entered.
This Threshold Evaluator program and the general analysis approach used are discussed
in more detail in Section 5.1.
5.1 Description of Threshold Evaluator and Analysis Approach
Development of a tool to facilitate the prediction and analysis of detector alarms based on
threshold measurements was the motivation behind the Threshold Evaluator. Microsoft
Excel, with the aid of its Visual Basic for Applications (VBA) automation language,
serves as the engine for the Threshold Evaluator. The Excel workbook consists of three
worksheets: a user input screen; a template used to report the calculated alarm times; and
a database of test information from the Navy and Kemano test series.
The user input screen, shown in Figure 12, allows the user to specify the threshold
measurement type (i.e., optical density, temperature rise, or velocity) and value at the top
of the screen. A checkbox is provided for cases where the nominal sensitivity is the
desired optical density threshold. In this case, the alarm threshold used for each detector
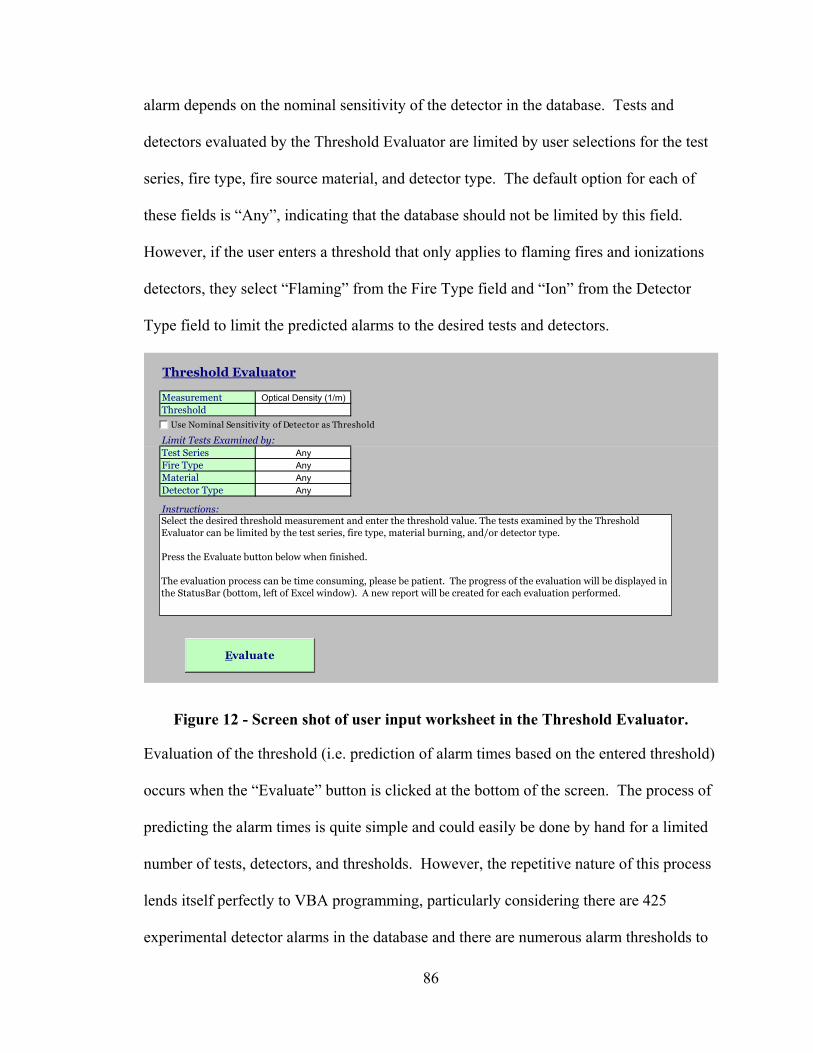
86
alarm depends on the nominal sensitivity of the detector in the database. Tests and
detectors evaluated by the Threshold Evaluator are limited by user selections for the test
series, fire type, fire source material, and detector type. The default option for each of
these fields is “Any”, indicating that the database should not be limited by this field.
However, if the user enters a threshold that only applies to flaming fires and ionizations
detectors, they select “Flaming” from the Fire Type field and “Ion” from the Detector
Type field to limit the predicted alarms to the desired tests and detectors.
Threshold Evaluator Optical DenAny Any Any AnyTemperatu NAVY Flaming Wood Ion
Measurement Optical Density (1/m) Velocity (m KEMANO SmolderingElectrical CPhotoThreshold Cotton Fabric
Upholstered Furniture
Limit Tests Examined by:Test Series AnyFire Type AnyMaterial AnyDetector Type Any
Instructions:Select the desired threshold measurement and enter the threshold value. The tests examined by the Threshold Evaluator can be limited by the test series, fire type, material burning, and/or detector type.
Press the Evaluate button below when finished.
The evaluation process can be time consuming, please be patient. The progress of the evaluation will be displayed in the StatusBar (bottom, left of Excel window). A new report will be created for each evaluation performed.
Evaluate
Use Nominal Sensitiv ity of Detector as Thresholdgfedc
Figure 12 - Screen shot of user input worksheet in the Threshold Evaluator.
Evaluation of the threshold (i.e. prediction of alarm times based on the entered threshold)
occurs when the “Evaluate” button is clicked at the bottom of the screen. The process of
predicting the alarm times is quite simple and could easily be done by hand for a limited
number of tests, detectors, and thresholds. However, the repetitive nature of this process
lends itself perfectly to VBA programming, particularly considering there are 425
experimental detector alarms in the database and there are numerous alarm thresholds to

87
evaluate. Instead of presenting the gory details of the VBA code used to predict alarm
times, a rough outline of the steps taken by the code (i.e. pseudo-code) is presented.
• Verify user inputs for completeness (e.g. Was a threshold value entered?)
• Filter the database such that only tests meeting the user specifications are
considered. Ensure that only detectors that were adjacent to instrumentation
for the desired threshold measurement are examined.
• Create a new report for this evaluation from the template
• Loop through each record (i.e. experimental detector alarm) from the filtered
database and predict an alarm time based on the user-specified threshold.
o Open the data file for the test
o Determine the first and last row of data to examine in the data file. For the
smoldering-to-flaming transitional fires in the Kemano test series, the
experimental alarms that occurred during the smoldering period use data
from ignition to the transition time to predict alarms, whereas the
experimental alarms that occur during flaming combustion use data from
the transition time to the end of test to predict alarms. All other alarm
predictions are based on data between the ignition time (time zero in the
data files) and end of the data file.
o Loop through each data point and compare that to the threshold entered.
Once the threshold has been exceeded, the time associated with this data
point is taken as the alarm time. To be consistent with Phase 1, only
single point measurements were used for optical density and temperature.
Due to the additional noise in the velocity data, an 11-point (10 second)

88
average around each data point was taken prior to evaluating whether the
threshold was exceeded.
o If the threshold was not exceeded, and no alarm was predicted, the
maximum value and time at which it occurred are determined.
o Copy the important test information and calculated alarm time to the
report.
o Calculate the percentage error in the predicted alarm time with respect to
the experimental alarm time. For almost all cases, the error in the
predicted alarm time is calculated as
%100*t
t- tError %
experiment
experimentpredicted
=
For the experimental detector alarms that occurred during flaming
combustion, this equation is modified to account for the offset from the
ignition time to the time of transition to flaming combustion (tflaming)
%100*t-t
t- tError %
flamingexperiment
experimentpredicted
=
o Repeat for each experimental detector alarm in the filtered database.
• Once predictions of all experimental alarms have been made, statistics for the
predicted alarms are calculated, (e.g. the number of alarms predicted, the
number of over- and under-predicted alarms, and the mean, standard deviation
and percentiles of the population of error in the predicted alarm times) are
added to the report.
• Finally, the user is alerted that the evaluation is complete along with the
number of experimental alarms considered in the evaluation and the time

89
required to complete the evaluation. The most time required to complete an
evaluation in this study was approximately 70 seconds.
The database of test information includes the following fields relevant to the prediction of
detector alarm times: test series, test id, fire type, classification of the fire source, detector
id, detector type, alarm time, the channel/column identifier for optical density,
temperature and velocity measurements in the data files, the initial temperature, the
detector nominal sensitivity, the status of the ventilation system, and the smolder-to-
flaming transition time. The database, and the Threshold Evaluator itself, is easily
extensible to include other data at a later time. To extend the use of the Threshold
Evaluator to other test series, information on the additional tests first needs to be added to
the database in the appropriate format (i.e. use the nomenclature already established in
the database, alarm times should be in seconds, etc.) Secondly, the data files for the
additional tests should be in Microsoft Excel format, containing only a single worksheet
of test data, and placed in a directory whose name corresponds to the name of the test
series entered in the database. The directory of test data for each test series is expected to
be located in the same directory as the Threshold Evaluator. For example if the
Threshold Evaluator is located at the path “C:\Phase 2\Threshold Evaluator.xls”, then the
data for the Navy test series is required to be located in the directory “C:\Phase 2\Navy\”.
In addition, Threshold Evaluator constructs the data filename and path based on the
information in the database. Therefore, the standard naming convention adopted for all
datafiles is TestSeries-TestID.xls. For example, the required filename of Navy test 2-12
is “NAVY-2-12.xls” and the required test name for Kemano test 9 is “KEMANO-09.xls”
90
according to the information in the database. The format of the data files is not nearly as
rigid. Because of this flexibility, changes are required to the VBA code of the Threshold
Evaluator before new test series are evaluated. In the subroutine “CalcAlarmTime”, the
format of the datafile must be declared. Modifications to the code need to be made in the
code that is preceded by the comment “Specify the format of the datafiles”. Two
examples of the required modifications to the code (which is only three lines), along with
a template version of the code are provided as comments in the code. The code specifies
addresses of the first cells in the worksheet that contain the test times (topmost time cell
on the spreadsheet) and instrument channel labels (leftmost channel label). The time data
(in units of seconds) must be contained in a single column, in ascending order with time
zero coinciding with the ignition time of the test. Data from each instrument must be
placed in consecutive columns with a cell preceding (above) the data containing an
identifying label for the instrument (the labels for all data columns must be in same the
row). The label provided for each data column should match the channel/column
identifiers used for optical density, temperature and velocity measurements in the
database.
Having discussed the workings of the Threshold Evaluator, it is necessary to discuss how
the results obtained from this program are used in the analysis. The goal of this phase of
the research is to assess the uncertainty in estimating detector response based on
threshold values of optical density, temperature rise, and velocity. To achieve this goal
there are four metrics of the certainty in the predicted alarm times that are examined: the
total percentage experimental alarms predicted; the percentages of experimental alarms
91
that are over- or under-predicted; the mean, median, and standard deviation of the mean
percentage error in the predicted alarm times with respect to the experimental alarm
times, and the percentage of alarm predictions that are within a given window of time
around the experimental alarm time. The first and second metrics are presented together,
as the first metric is simply a sum of the percentages of the under-predicted and over-
predicted alarms (the second metric). In addition to simply quantifying the error in the
associated prediction, the equations presented earlier in this section for the percentage
error are used to identify the direction of error in relation to the experimental alarm (i.e.
percentage errors less than zero indicate an under-prediction error, while those greater
than zero indicate an over-prediction error). To minimize the errors associated with the
predicted alarm time, the predicted alarm time would be less than the experimental alarm
time (under-predicted) in 50 percent of the cases and greater than the experimental alarm
time (over-predicted) in the remaining 50 percent. Although in some situations, only
over-predicted alarms may be desired and the inherent additional error is tolerated. The
purpose of the modeling exercise will dictate which approach is warranted. Quantifying
the uncertainty according to the calculated percentage error with respect to the
experimental alarm time is useful, but not uniquely so. In fact, the percentage error in the
predicted alarm time is insufficient, or rather misleading, when comparing errors in
predicted alarm times between smoldering and flaming fires. For example, assume that a
detector alarms 30 seconds after ignition and the predicted alarm time for this case is 60
seconds. The resultant error in the prediction would be +100 percent, despite the
predicted alarm time being within 30 seconds of the actual alarm. In contrast, assume
that fire and smoke growth rates were much smaller, as is typically the case with

92
smoldering fires and the experimental detector alarm did not occur until 1500 seconds,
with the predicted alarm time at 1650 seconds. The resultant error in this prediction is
only +10 percent, even though there is a difference of 150 seconds between the
experimental and predicted alarm times. A comparison of detection times to when
hazardous or untenable conditions occur is often the best approach in these situations,
however a tenability analysis is beyond the scope of this paper.
In an attempt to address this issue two arbitrary windows of time around the experimental
alarm are examined as the fourth metric of uncertainty in the predicted alarm times.
Percentages of predicted detector alarms that are within ± 30 seconds and ± 60 seconds of
the experimental alarm time are used. An estimated alarm time within a 60 second
window around the actual alarm time (i.e. ± 30 s) is assumed to be a great prediction
while estimated alarm times within a 120 second window around the actual alarm time
(i.e. ± 60 s) is still assumed to be a good prediction. These measures are arbitrary and in
some cases, depending on the expected growth rates of the fire and smoke or level of
accuracy required for the application, a prediction that differs with the actual alarm by
more than 60 seconds may be adequate.
5.2 Uncertainty in Alarm Predictions using Optical Density Thresholds
The same optical density alarm thresholds examined previously in this report are
evaluated in this section: the nominal sensitivity of the detector; 0.14 m-1; and the 20, 50,
and 80 percent thresholds presented by Geiman and Gottuk [2003]. Each of these
thresholds will be examined in turn.

93
Back in section 4.3.2, the percentage of detectors that alarmed at optical densities less
than or equal to their nominal sensitivity values varied widely depending on the fire type,
detector type, ventilation, etc. To further this analysis, alarm times were predicted for
each detector based on their nominal sensitivity and the experimental optical density
measurements. Figure 13 presents the percentages of experimental alarms under-
predicted and over predicted on a stacked bar chart. The total height of each stacked bar
represents the total percentage of experimental alarms that were predicted.
36%28%
100%
71%85% 89%
71%
50%
64%
51%
0%
29% 5%11%
19%
24%
0%
10%
20%
30%
40%
50%
60%
70%
80%
90%
100%
NA
VY
, Fla
min
g, Io
n
NA
VY
, Fla
min
g, P
hoto
NA
VY
, Sm
olde
ring,
Ion
0.01
9 1/
m, V
ent.
Off
NA
VY
, Sm
olde
ring,
Ion
0.01
9 1/
m, V
ent.
On
NA
VY
, Sm
olde
ring,
Ion
0.02
3 1/
m, V
ent.
Off
NA
VY
, Sm
olde
ring,
Ion
0.02
3 1/
m, V
ent.
On
NA
VY
, Sm
olde
ring
Phot
o, V
ent.
Off
NA
VY
, Sm
olde
ring
Phot
o, V
ent.
On
Prec
enta
ge o
f Exp
erim
enta
l Ala
rms P
redi
cted
Under-Predicted Over-Predicted
Figure 13 - Percentage of under-predicted and over-predicted alarms using the nominal sensitivity of the detectors as an alarm threshold.
94
For all but two of the cases shown in Figure 13, the nominal sensitivity predicted at least
90 percent of all alarms that occurred during the experimental testing. For the two
remaining cases, at least 75 percent of alarms were predicted. The downside to this high
of a successful percentage of predictions is that the vast majority of predicted alarms for
the smoldering fires occurred before the alarms in the experiments. On the other hand,
for the flaming fires there were more over-predicted alarms than under-predicted, with a
ratio of under-predicted to over-predicted alarms closer to one.
Table 18 presents the calculated error in the predicted alarms based on the experimental
alarm time. In addition to quantifying the error, the direction of error in relation to the
experimental alarm can be determined (i.e. percentage errors less than zero indicate an
under-prediction error, while those greater than zero indicate an over-prediction error).
The median, mean, and standard deviation values are given in percentage error.
Therefore, the range of error in the predicted alarm times within plus or minus one
standard deviation of the mean for smoldering fires with the ventilation off and
photoelectric detectors in Table 18 is –74 percent to +68 percent.

95
Table 18 - Mean and median error in predicted alarm times using the nominal sensitivity of the detectors as an alarm threshold.
Median Mean Std DevNAVY Flaming Ion 88 90% 327% 513%NAVY Flaming Photo 65 33% 103% 246%NAVY Smoldering Ion 0.019 m-1 Off 7 -59% -56% 26%NAVY Smoldering Ion 0.019 m-1 On 7 -68% -29% 79%NAVY Smoldering Ion 0.023 m-1 Off 19 -51% -41% 38%NAVY Smoldering Ion 0.023 m-1 On 18 -35% -28% 62%NAVY Smoldering Photo Off 38 -22% -23% 35%NAVY Smoldering Photo On 28 -14% -4% 70%
Detector Type
Nominal Sensitivity
Nominal Sensitivity Optical Density ThresholdError in Predicted Alarm TimeAlarms
Predicted
Ventilation Status
Fire TypeTest Series
In general, the mean and median error associated with using the nominal sensitivity to
estimate the response of smoke detector to smoldering fires is on the order of 20 – 60
percent under-predicted. When the standard deviations for the mean errors are
considered, the range of errors is substantially large. Despite a better balance between
over-predicted and under-predicted alarms for flaming fires (see Figure 13), the errors
associated with the predicted alarms are significantly greater than for the smoldering
cases just discussed. The mean and median errors in the estimated detector responses to
the flaming fires using the nominal sensitivity as an alarm threshold are on the order of
100 – 300 percent over-prediction. On one hand, the fact that the errors are most over-
prediction means that the predicted alarm times are fairly conservative. However, the
concern is that they are overly conservative and that a 100 – 300 percent over-prediction
error is too large.
The percentage errors presented in the previous table do not necessarily fully describe
how well the nominal sensitivity as an alarm threshold estimates detector responses. The
reasons for this were discussed in the previous section. To remedy this situation, a

96
further step in the analysis was taken to examine the percentage of predicted alarms that
occurred within ± 30 seconds and ± 60 seconds of the experimental alarm time. Figure
14 illustrates the percentages of predicted alarms (using the nominal sensitivity as an
alarm threshold) that occurred within ± 30 seconds and ± 60 seconds of the experimental
alarm time. Note that the percentages of predicted alarms within ± 60 seconds include
the predictions within ± 30 seconds (e.g. in Figure 14 for the Navy flaming fires and
ionization detectors, 20 percent of predicted alarms were within ± 30 seconds with an
additional 20 percent of predicted alarms between ± 30 to 60 seconds such that the total
percentage of predicted alarms within ± 60 seconds was 40 percent).

97
20% 22%
14% 14% 16%
22% 21%18%
40%
29% 29% 26% 28% 29% 29%
14%
0%
10%
20%
30%
40%
50%
60%
70%
80%
90%
100%
NA
VY
, Fla
min
g, Io
n
NA
VY
, Fla
min
g, P
hoto
NA
VY
, Sm
olde
ring,
Ion
0.01
9 1/
m, V
ent.
Off
NA
VY
, Sm
olde
ring,
Ion
0.01
9 1/
m, V
ent.
On
NA
VY
, Sm
olde
ring,
Ion
0.02
3 1/
m, V
ent.
Off
NA
VY
, Sm
olde
ring,
Ion
0.02
3 1/
m, V
ent.
On
NA
VY
, Sm
olde
ring
Phot
o, V
ent.
Off
NA
VY
, Sm
olde
ring
Phot
o, V
ent.
On
Perc
enta
ge o
f Pre
dict
ed A
larm
s
Predicted Alarm Within +/- 30 s of Experimental AlarmPredicted Alarm Within +/- 60 s of Experimental Alarm
Figure 14 - Percentage of predicted alarms that occurred within ±30 and ±60 seconds of the experimental alarm with the nominal sensitivity of detectors used as
an alarm threshold.
Interestingly, the percentage of alarms occurring within ± 30 and ± 60 seconds of the
experimental alarm time was fairly constant across the cases considered. The percentage
of predicted alarms within ± 30 seconds was generally in the range of 15 – 20 percent,
while the percentage of predicted alarms within ± 60 seconds was generally in the range
of 25 – 30 percent. In addition, despite a mean error of over 300 percent, 40 percent of

98
the predicted alarm times for ionization detectors responding to flaming fires were within
± 60 seconds of the experimental alarm time. Overall, the fact that only 20 – 30 percent
of predicted alarm times were good predictions (as defined in the previous section) is not
very encouraging for using the nominal sensitivity as an alarm threshold to estimate the
response of smoke detectors.
The same process undertaken for examining the uncertainty in the estimated detector
response using the nominal sensitivity as an alarm threshold is applied to the 0.14m-1
threshold. As before, the percentage of under-predicted and over-predicted alarms is
evaluated first.
43%
14%
40%
17%
31%
11%
28%
50%
65%
32%30% 30%
0%
0%
15%
22%
19%
21%
6%
10%
6%
32%
1%2%0%
10%
20%
30%
40%
50%
60%
70%
80%
90%
100%
NA
VY
, Fla
min
g, Io
n
NA
VY
, Fla
min
g, P
hoto
NA
VY
, Sm
olde
ring,
Ion
0.01
9 1/
m, V
ent.
Off
NA
VY
, Sm
olde
ring,
Ion
0.01
9 1/
m, V
ent.
On
NA
VY
, Sm
olde
ring,
Ion
0.02
3 1/
m, V
ent.
Off
NA
VY
, Sm
olde
ring,
Ion
0.02
3 1/
m, V
ent.
On
NA
VY
, Sm
olde
ring
Phot
o, V
ent.
Off
NA
VY
, Sm
olde
ring
Phot
o, V
ent.
On
KEM
AN
OFl
amin
g, Io
n
KEM
AN
OFl
amin
g, P
hoto
KEM
AN
OSm
olde
ring,
Ion
KEM
AN
OSm
olde
ring,
Pho
to
Prec
enta
ge o
f Exp
erim
enta
l Ala
rms P
redi
cted
Under-Predicted Over-Predicted
Figure 15 - Percentage of under-predicted and over-predicted alarms using an optical density of 0.14m-1 as an alarm threshold.

99
In contrast to Figure 13 for the nominal sensitivity alarm threshold where all of the cases
predicted more than 75 percent of the experimental alarms, Figure 15 shows that for a
majority of the cases shown less than 50 percent of the experimental alarms were
predicted using 0.14 m-1 as an alarm threshold. This low percentage of predicted alarms
was due to the optical density of the smoke during the test not exceeding 0.14 m-1 for
many of the tests. For ionization and photoelectric detectors responding to flaming fires,
the vast majority of alarms predicted using an optical density of 0.14 m-1 as an alarm
threshold were over-predictions. Despite the fact that for flaming fires an optical density
threshold of 0.14 m-1 over-predicts almost all alarms, it may provide a useful bounding
condition. The propensity for this threshold to over-predict detector response times
combined with the fact that 99 percent of ionization and photoelectric detector responses
to flaming fires in the Navy test series occurred at an optical density less than or equal to
0.14 m-1 (See Figure 5) leads to the conclusion that if this threshold is exceeded for a
flaming fire, then a detector response is highly likely to have occurred and the actual
alarm time of the detector took place prior to the predicted alarm time.
The percentage of predicted alarms for the smoldering cases from the Navy tests and the
transitional smoldering-to-flaming fires from the Kemano tests were varied. However,
the percentage of predicted alarms that were over-predicted increased as compared to
using the nominal sensitivity as an alarm threshold where almost all predicted alarms
were under-predicted. It is also interesting to note that the overall percentage of alarms
predicted was lower for the cases in which the ventilation system was operating as
compared to when there was no ventilation. The operating ventilation system in many of

100
these tests limits the optical density below the threshold of 0.14 m-1 so fewer alarms are
predicted.
The range of errors in the predicted alarm times varies significantly more for the 0.14 m-1
optical density threshold as compared to the detector nominal sensitivity threshold. The
mean and median errors in the predicted alarm times for the 0.14 m-1 as an alarm
threshold are shown in Table 19.
Table 19 - Mean and median error in predicted alarm times using an optical density of 0.14 m-1 as an alarm threshold.
Median Mean Std DevNAVY Flaming Ion 28 1844% 2089% 1203%NAVY Flaming Photo 26 152% 857% 1311%NAVY Smoldering Ion 0.019 m-1 Off 3 -11% -31% 36%NAVY Smoldering Ion 0.019 m-1 On 1 -51%NAVY Smoldering Ion 0.023 m-1 Off 11 -4% -18% 36%NAVY Smoldering Ion 0.023 m-1 On 7 7% -20% 42%NAVY Smoldering Photo Off 21 -8% -7% 44%NAVY Smoldering Photo On 12 45% 75% 102%
KEMANO Flaming Ion Off 8 -51% -51% 50%KEMANO Flaming Photo Off 6 -61% -52% 44%KEMANO Smoldering Ion Off 13 -26% -27% 23%KEMANO Smoldering Photo Off 16 -8% 40% 159%
Test Series Fire Type Detector Type
Nominal Sensitivity
Ventilation Status
0.14 m-1 Optical Density ThresholdAlarms
PredictedError in Predicted Alarm Time
For flaming fires, the error associated with the predicted responses of ionization detectors
was on average approximately 2000 percent, while that for photoelectric detectors was on
average approximately 900 percent (with the errors in both cases being over-predictions).
Again, the error in the predicted alarm times for the smoldering and smoldering-to-
flaming transitional cases varied but was significantly less than for the flaming fires. In
general, the mean error for these cases was in the range of 10 to 50 percent under-
prediction, with the error in the responses of photoelectric detectors in the Navy

101
smoldering fires with ventilation and Kemano smoldering tests being the outliers in this
group with mean errors of 40 and 75 percent over-prediction, respectively. It is
worthwhile to note that due to small sample sizes of predicted alarms for some of these
cases (e.g. the 0.019 m-1 ionization detector responses to the Navy smoldering fires with
ventilation on) the results in Table 19 should be interpreted with caution.
The percentage of predicted alarms that are within ± 30 and ± 60 seconds of the
experimental alarm, as shown in Figure 16, provides another measure of uncertainty in
the predicted alarms using a threshold optical density of 0.14m-1.
7% 8%
0% 0%
36%
0%
19%
8%
38%33%
15% 13%7% 8%
33%
0%
45%
14%
33%
8%
75%
50%
38%31%
0%
10%
20%
30%
40%
50%
60%
70%
80%
90%
100%
NA
VY
, Fla
min
g, Io
n
NA
VY
, Fla
min
g, P
hoto
NA
VY
, Sm
olde
ring,
Ion
0.01
9 1/
m, V
ent.
Off
NA
VY
, Sm
olde
ring,
Ion
0.01
9 1/
m, V
ent.
On
NA
VY
, Sm
olde
ring,
Ion
0.02
3 1/
m, V
ent.
Off
NA
VY
, Sm
olde
ring,
Ion
0.02
3 1/
m, V
ent.
On
NA
VY
, Sm
olde
ring
Phot
o, V
ent.
Off
NA
VY
, Sm
olde
ring
Phot
o, V
ent.
On
KEM
AN
OFl
amin
g, Io
n
KEM
AN
OFl
amin
g, P
hoto
KEM
AN
OSm
olde
ring,
Ion
KEM
AN
OSm
olde
ring,
Pho
to
Perc
enta
ge o
f Pre
dict
ed A
larm
s
Predicted Alarm Within +/- 30 s of Experimental AlarmPredicted Alarm Within +/- 60 s of Experimental Alarm
Figure 16 - Percentage of predicted alarms that occurred within ±30 and ±60 seconds of the experimental alarm with an optical density of 0.14 m-1 used as an
alarm threshold.
102
As expected with mean errors in the predicted alarm times on the order of 1000 – 2000
percent for ionization and photoelectric detectors responding to the Navy flaming fires,
less than 10 percent of the predicted alarms were within ± 30 and ± 60 seconds. The
percentage of predicted alarms between these two windows of time varied. The cases in
which none of the predicted alarms were within ± 30 and/or ± 60 seconds all had less
than 10 predicted alarms. In addition, the favorable percentages of predicted detector
responses within ± 30 and ± 60 seconds for flaming fires from the Kemano test series are
surprising given the results from the Navy tests. The difference in the Kemano test series
is that an appreciable concentration of smoke typically accumulated during the initial
smoldering phase of combustion (before the fire transitioned to flaming) that would not
normally have been present if the fires were flaming throughout their entire duration. As
a result, the experimental alarms during the flaming period of the tests generally occurred
soon after the transition to flaming. Since the predictions made for the experimental
alarms that occurred during the flaming period only looked at data after the transition
time and there was already a significant smoke concentration at this time, the majority of
both experimental and predicted alarms occurred on or immediately following the time to
transition. In this way, the methodology used to predict the alarms of detectors during
the flaming period of the smoldering-to-flaming transitional fires results in alarm times
artificially close to the experimental alarm time. This observation is not necessarily
reflected in Table 19 where the reported median errors were –50 to –60 percent, but upon
further exploration below the 20th to 30th percentile the percentage errors were –90 to –
100 percent (i.e. the predicted alarm occurred immediately on or soon after the transition
to flaming combustion).

103
The 20, 50, and 80 percent optical density thresholds from Table 12 were also used to
estimate detector responses from the Navy and Kemano tests. Optical density thresholds
used to predict smoke detector alarm times from these tests were shown previously in
Table 12. Figure 17 illustrates the percentages of experimental alarms that are over- and
under-predicted for the 20, 50, and 80 percent optical density alarm thresholds. The total
percentage of experimental alarms that are predicted ranged from 86 to 100 percent for
all cases examined for the 20 percent threshold, with between 70 and 90 percent of all
experimental alarms being under-predicted. Subsequently, the total percentage of
predicted alarms diminishes for the 50 percent and 80 percent thresholds, as expected. In
addition, for the flaming ionization and photoelectric predictions, the ratio of over-
predicted to under-predicted alarms increased 1:3 or 1:6 at the 20 percent threshold to
more than 4:1 at the 80 percent threshold. However, the trends in the smoldering cases
were not nearly as well behaved. In many of the smoldering fires, both ionization and
photoelectric detector responses were still predominantly under-predicted, even at the 50
percent and 80 percent alarm thresholds. It is important to remember though that the
thresholds used in these predictions do not address all of the variables embodied here for
smoldering fires; the status of ventilation in the compartment and the nominal sensitivity
of the detectors were not considered significant variables by Geiman and Gottuk [2003].

104
72%85% 86%
71%
90% 89%81% 76%
28%15%
0% 29%0%
11%
8%24%
0%
10%
20%
30%
40%
50%
60%
70%
80%
90%
100%
Prec
enta
ge o
f Exp
erim
enta
l Ala
rms
Pred
icte
d w
ith 2
0% T
hres
hold
Over-PredictedUnder-Predicted
39%27%
57%
14%
70%
22%
69%
45%
60%
55% 0%
0%
0%
28%
4%
33%
0%
10%
20%
30%
40%
50%
60%
70%
80%
90%
100%
Prec
enta
ge o
f Exp
erim
enta
l Ala
rms
Pred
icte
d w
ith 5
0% T
hres
hold
14% 11%
43%
14%
40%
17%
42%
21%
61%
49%0%
0%
15%
22%
0%29%
0%
10%
20%
30%
40%
50%
60%
70%
80%
90%
100%
NAVYFlaming
Ion
NAVYFlamingPhoto
NAVYSmoldering
Ion0.019 1/mVent. Off
NAVYSmoldering
Ion0.019 1/mVent. On
NAVYSmoldering
Ion0.023 1/mVent. Off
NAVYSmoldering
Ion0.023 1/mVent. On
NAVYSmoldering
PhotoVent. Off
NAVYSmoldering
PhotoVent. On
Prec
enta
ge o
f Exp
erim
enta
l Ala
rms
Pred
icte
d w
ith 8
0% T
hres
hold
Figure 17 - Percentage of under-predicted and over-predicted alarms for the Navy
tests using the 20 percent (top), 50 percent (middle), and 80 percent (bottom) optical density alarms thresholds from Table 12.
105
Mean and median error values are quantified in Error! Not a valid bookmark self-
reference. for the Navy test series. In general, the errors for all cases at the 20 percent
threshold were in the range of 20 to 60 percent under-predicted, with the exception to this
being for ionization detectors with flaming fires where the mean error was in over-
prediction due to a few large over-prediction errors. Moving to the 50 percent threshold
there is not a reduction or minima of the predicted error at this threshold, as previously
expected. For example, the magnitude of the error for the ionization and photoelectric
detectors for flaming fires was at a minimum at the 20 percent threshold and continually
increased to a maximum value at the 80 percent threshold. In addition, the mean and
median predicted errors in the response of ionization and photoelectric detectors to
flaming fires were all errors in over-prediction at the 50 percent and 80 percent
thresholds. Finally, it is interesting to note the standard deviations of the mean error. For
the flaming cases, the standard deviation increased from the 20 percent to the 80 percent
threshold, while for the smoldering cases it remained fairly constant. The standard
deviations in the error of the predicted alarm times for smoldering fires in which the
ventilation was off were in the range of 20 to 30 percent for all the thresholds, however
the standard deviations in the error of the predicted alarm times with the ventilation on
were consistently 2 to 3 times higher.
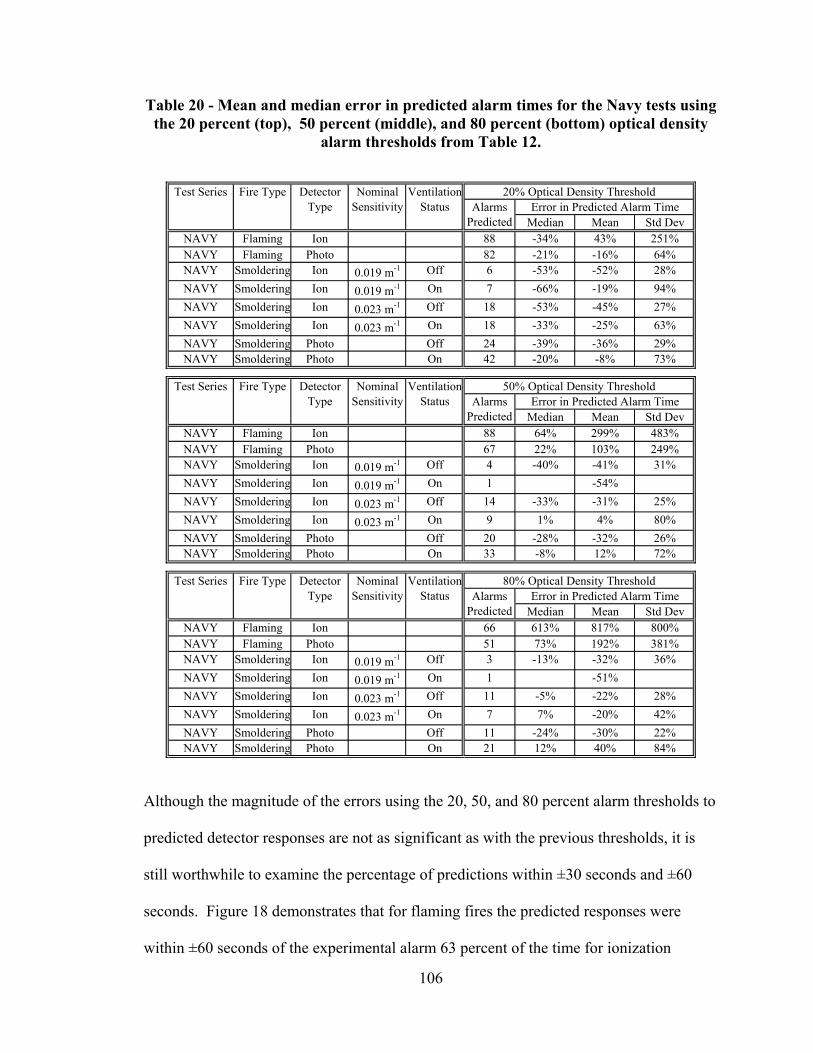
106
Table 20 - Mean and median error in predicted alarm times for the Navy tests using the 20 percent (top), 50 percent (middle), and 80 percent (bottom) optical density
alarm thresholds from Table 12.
Median Mean Std DevNAVY Flaming Ion 88 -34% 43% 251%NAVY Flaming Photo 82 -21% -16% 64%NAVY Smoldering Ion 0.019 m-1 Off 6 -53% -52% 28%NAVY Smoldering Ion 0.019 m-1 On 7 -66% -19% 94%NAVY Smoldering Ion 0.023 m-1 Off 18 -53% -45% 27%NAVY Smoldering Ion 0.023 m-1 On 18 -33% -25% 63%NAVY Smoldering Photo Off 24 -39% -36% 29%NAVY Smoldering Photo On 42 -20% -8% 73%
Median Mean Std DevNAVY Flaming Ion 88 64% 299% 483%NAVY Flaming Photo 67 22% 103% 249%NAVY Smoldering Ion 0.019 m-1 Off 4 -40% -41% 31%NAVY Smoldering Ion 0.019 m-1 On 1 -54%NAVY Smoldering Ion 0.023 m-1 Off 14 -33% -31% 25%NAVY Smoldering Ion 0.023 m-1 On 9 1% 4% 80%NAVY Smoldering Photo Off 20 -28% -32% 26%NAVY Smoldering Photo On 33 -8% 12% 72%
Median Mean Std DevNAVY Flaming Ion 66 613% 817% 800%NAVY Flaming Photo 51 73% 192% 381%NAVY Smoldering Ion 0.019 m-1 Off 3 -13% -32% 36%NAVY Smoldering Ion 0.019 m-1 On 1 -51%NAVY Smoldering Ion 0.023 m-1 Off 11 -5% -22% 28%NAVY Smoldering Ion 0.023 m-1 On 7 7% -20% 42%NAVY Smoldering Photo Off 11 -24% -30% 22%NAVY Smoldering Photo On 21 12% 40% 84%
Alarms Predicted
Ventilation Status
Fire TypeTest Series Detector Type
Nominal Sensitivity
20% Optical Density ThresholdError in Predicted Alarm Time
50% Optical Density ThresholdAlarms
PredictedError in Predicted Alarm Time
80% Optical Density Threshold
Ventilation Status
Test Series Fire Type Detector Type
Test Series Fire Type Detector Type
Nominal Sensitivity
Nominal Sensitivity
Ventilation Status Alarms
PredictedError in Predicted Alarm Time
Although the magnitude of the errors using the 20, 50, and 80 percent alarm thresholds to
predicted detector responses are not as significant as with the previous thresholds, it is
still worthwhile to examine the percentage of predictions within ±30 seconds and ±60
seconds. Figure 18 demonstrates that for flaming fires the predicted responses were
within ±60 seconds of the experimental alarm 63 percent of the time for ionization

107
detectors and 49 percent of the time for photoelectric detectors. Approximately 40
percent of predicted ionization and photoelectric responses to flaming fires were within
±30 seconds using the 20 percent alarm threshold. In general, between 15 and 20 percent
of predicted alarms to smoldering fires were within ±30 seconds of the experimental
alarm time, with similar or slightly greater percentages within ±60 seconds of the 20
percent threshold. The predicted responses of photoelectric detectors to smoldering fires
with the ventilation system off had a greater percentage of predicted alarms within the
±30 second and ±60 second windows, as compared to the other smoldering alarm
predictions. Generally speaking, the percentages of predicted alarms within each window
of time decrease at the 50 percent and 80 percent thresholds. The exception to this trend
are the predicted responses of the 0.023m-1 nominal sensitivity ionization detector to
smoldering fires with the ventilation system operating, which had the greatest percentage
of predicted alarms within each window of time (36 percent for ±30 seconds and 55
percent for ±60 seconds) at the 80 percent alarm threshold. Finally, caution should be
exercised when basing any conclusions on Figure 18, realizing that some of the
percentages presented therein incorporate fewer than 10 predicted alarms (e.g. the 0
percent values for smoldering fires with the 0.019 m-1 nominal sensitivity ionization
detector for the 50 percent and 80 percent thresholds).

108
40% 37%
17% 14% 17%22%
38%
21%
63%
49%
17% 14%
28% 28%
42%
29%
0%
10%
20%
30%
40%
50%
60%
70%
80%
90%
100%
Perc
enta
ge o
f Pre
dict
ed A
larm
sw
ith 2
0 %
Thr
esho
ld
Predicted Alarm Within +/- 30 s of Experimental AlarmPredicted Alarm Within +/- 60 s of Experimental Alarm
24% 21%
0% 0%
36%
11%
30%
15%
42%
27%
0% 0%
43%
22%30%
24%
0%
10%
20%
30%
40%
50%
60%
70%
80%
90%
100%
Perc
enta
ge o
f Pre
dict
ed A
larm
sw
ith 5
0% T
hres
hold
12%16%
0% 0%
36%
0%
18%
10%
18%25%
33%
0%
55%
14%
27%24%
0%
10%
20%
30%
40%
50%
60%
70%
80%
90%
100%
NAVYFlaming
Ion
NAVYFlamingPhoto
NAVYSmoldering
Ion0.019 1/mVent. Off
NAVYSmoldering
Ion0.019 1/mVent. On
NAVYSmoldering
Ion0.023 1/mVent. Off
NAVYSmoldering
Ion0.023 1/mVent. On
NAVYSmoldering
PhotoVent. Off
NAVYSmoldering
PhotoVent. On
Perc
enta
ge o
f Pre
dict
ed A
larm
sw
ith 8
0% T
hres
hold
Figure 18 - Percentage of predicted alarms that occurred within ±30 and ±60 seconds of the experimental alarm for the Navy tests using the 20 percent (top), 50
percent (middle), and 80 percent (bottom) optical density alarm thresholds from Table 12.
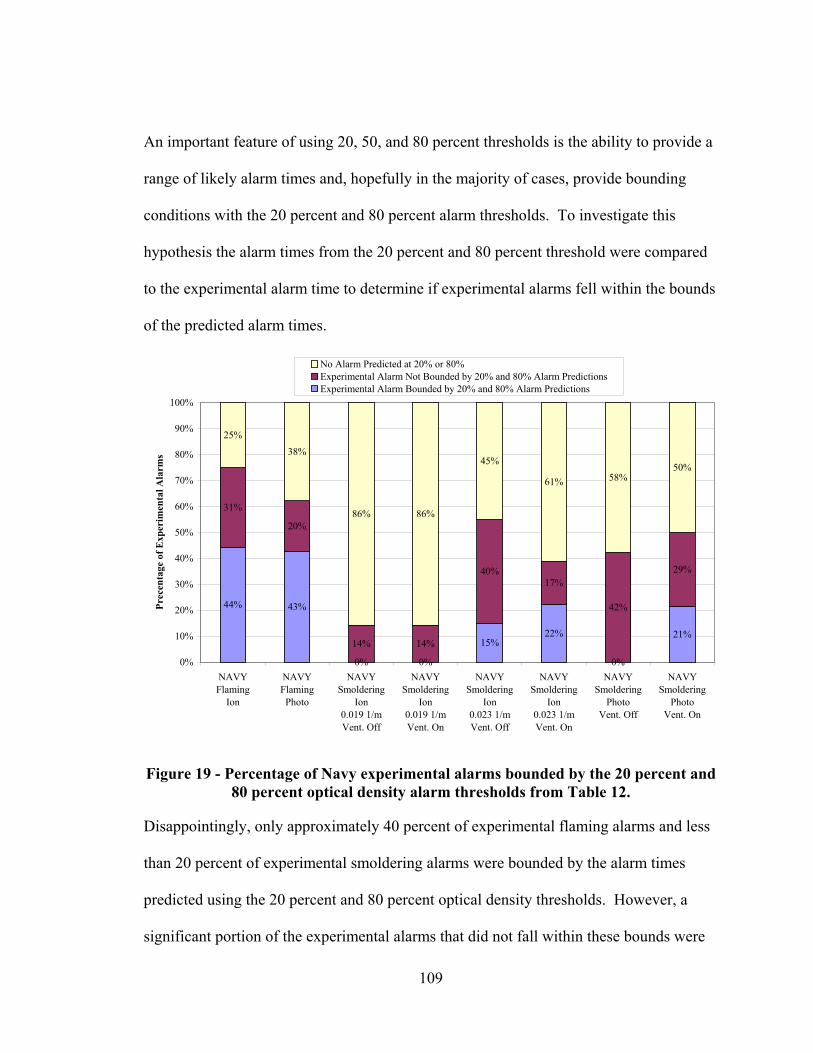
109
An important feature of using 20, 50, and 80 percent thresholds is the ability to provide a
range of likely alarm times and, hopefully in the majority of cases, provide bounding
conditions with the 20 percent and 80 percent alarm thresholds. To investigate this
hypothesis the alarm times from the 20 percent and 80 percent threshold were compared
to the experimental alarm time to determine if experimental alarms fell within the bounds
of the predicted alarm times.
44% 43%
0% 0%
15%22%
0%
21%
31%
20%
14% 14%
40%17%
42%
29%
25%38%
86% 86%
45%
61% 58%50%
0%
10%
20%
30%
40%
50%
60%
70%
80%
90%
100%
NAVYFlaming
Ion
NAVYFlamingPhoto
NAVYSmoldering
Ion0.019 1/mVent. Off
NAVYSmoldering
Ion0.019 1/mVent. On
NAVYSmoldering
Ion0.023 1/mVent. Off
NAVYSmoldering
Ion0.023 1/mVent. On
NAVYSmoldering
PhotoVent. Off
NAVYSmoldering
PhotoVent. On
Prec
enta
ge o
f Exp
erim
enta
l Ala
rms
No Alarm Predicted at 20% or 80%Experimental Alarm Not Bounded by 20% and 80% Alarm PredictionsExperimental Alarm Bounded by 20% and 80% Alarm Predictions
Figure 19 - Percentage of Navy experimental alarms bounded by the 20 percent and 80 percent optical density alarm thresholds from Table 12.
Disappointingly, only approximately 40 percent of experimental flaming alarms and less
than 20 percent of experimental smoldering alarms were bounded by the alarm times
predicted using the 20 percent and 80 percent optical density thresholds. However, a
significant portion of the experimental alarms that did not fall within these bounds were

110
due to the optical density not increasing sufficiently to cause alarm predictions at one or
both of the alarm thresholds.
Detector alarms from the Kemano test series were predicted in the same manner as the
Navy tests, however using different thresholds from Table 12. As Figure 20 shows, 100
percent of experimental alarms were predicted for all cases and three threshold levels,
except for the predicted responses of ionization detectors to smoldering fires of which 91
percent of alarms were predicted. Although Figure 20 demonstrates exceptional
performance by the 20, 50 and 80 percent alarm thresholds, the outlook for these
thresholds is diminished after reviewing the quantitative results in Table 21. For
example, the median error in the predicted response of ionization detectors to flaming
fires is roughly –100 percent for the 20, 50, and 80 percent thresholds. The predicted
response of photoelectric detectors to flaming fires was quite similar with median errors
between –74 to –95 percent. In both cases, these results indicate that a majority of the
predicted alarms are occurring at or immediately following the transition to flaming and
the experimental detector responses do not demonstrate corresponding behavior, or at
least not to the same degree. Another observation from Table 21 is that the median
prediction errors decrease from –44 to –26 percent for ionization detector and –19 to –7
percent for photoelectric detectors for smoldering fires from the 20 percent thresholds to
the 80 percent thresholds. In constrast, the mean error in the predicted response of
photoelectric detectors to smoldering fires increases from –12 to +58 percent from the 20
percent to 80 percent thresholds, with the standard deviation increasing likewise from 34
percent to 177 percent.

111
83% 80%
100%
68%
11%0%
0%
28%
0%
10%
20%
30%
40%
50%
60%
70%
80%
90%
100%
Prec
enta
ge o
f Exp
erim
enta
l Ala
rms
Pred
icte
d w
ith 2
0% T
hres
hold
Over-PredictedUnder-Predicted
83%70% 76%
64%
0%
0%6% 32%
0%
10%
20%
30%
40%
50%
60%
70%
80%
90%
100%
Prec
enta
ge o
f Exp
erim
enta
l Ala
rms
Pred
icte
d w
ith 5
0% T
hres
hold
72%60%
47% 44%
6%
0%12%
28%
0%
10%
20%
30%
40%
50%
60%
70%
80%
90%
100%
KEMANOFlaming
Ion
KEMANOFlamingPhoto
KEMANOSmoldering
Ion
KEMANOSmoldering
Photo
Prec
enta
ge o
f Exp
erim
enta
l Ala
rms
Pred
icte
d w
ith 8
0% T
hres
hold
Figure 20 - Percentage of under-predicted and over-predicted alarms for the Kemano tests using the 20 percent (top), 50 percent (middle), and 80 percent
(bottom) optical density alarm thresholds from Table 12.
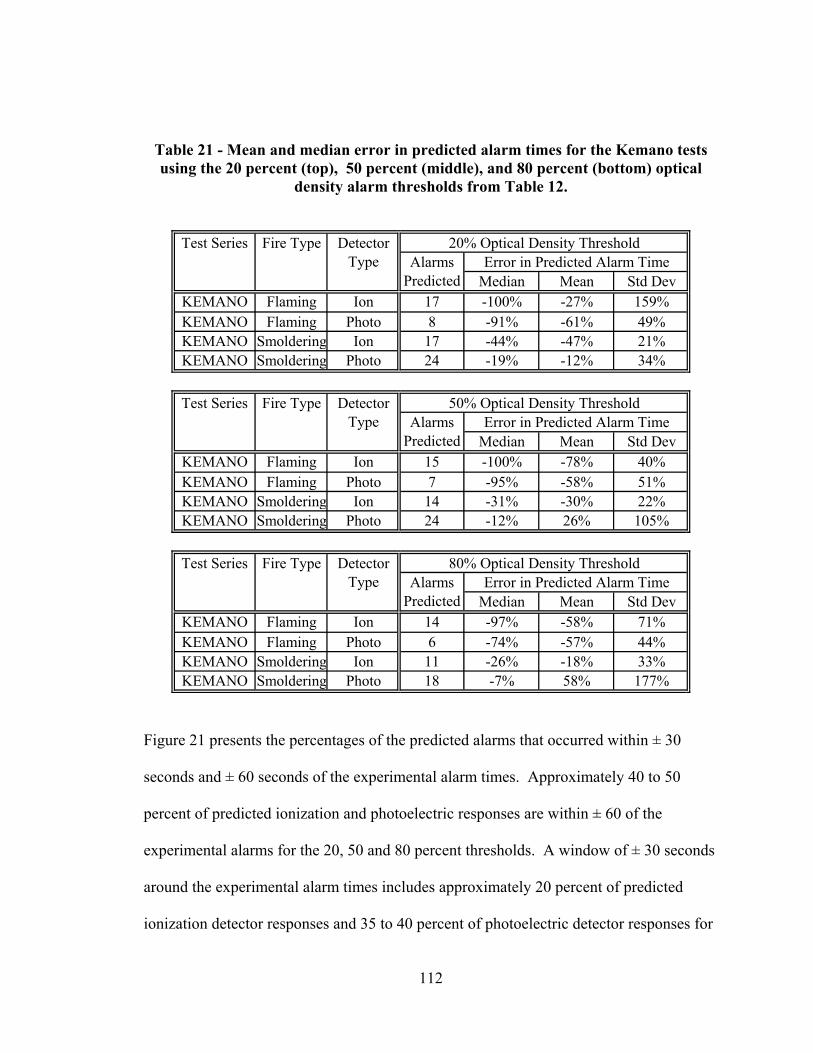
112
Table 21 - Mean and median error in predicted alarm times for the Kemano tests using the 20 percent (top), 50 percent (middle), and 80 percent (bottom) optical
density alarm thresholds from Table 12.
Median Mean Std DevKEMANO Flaming Ion 17 -100% -27% 159%KEMANO Flaming Photo 8 -91% -61% 49%KEMANO Smoldering Ion 17 -44% -47% 21%KEMANO Smoldering Photo 24 -19% -12% 34%
Median Mean Std DevKEMANO Flaming Ion 15 -100% -78% 40%KEMANO Flaming Photo 7 -95% -58% 51%KEMANO Smoldering Ion 14 -31% -30% 22%KEMANO Smoldering Photo 24 -12% 26% 105%
Median Mean Std DevKEMANO Flaming Ion 14 -97% -58% 71%KEMANO Flaming Photo 6 -74% -57% 44%KEMANO Smoldering Ion 11 -26% -18% 33%KEMANO Smoldering Photo 18 -7% 58% 177%
Test Series Fire Type Detector Type
Test Series Fire Type Detector Type
Alarms Predicted
Error in Predicted Alarm Time
80% Optical Density ThresholdAlarms
PredictedError in Predicted Alarm Time
50% Optical Density Threshold
Fire TypeTest Series Detector Type
20% Optical Density ThresholdError in Predicted Alarm TimeAlarms
Predicted
Figure 21 presents the percentages of the predicted alarms that occurred within ± 30
seconds and ± 60 seconds of the experimental alarm times. Approximately 40 to 50
percent of predicted ionization and photoelectric responses are within ± 60 of the
experimental alarms for the 20, 50 and 80 percent thresholds. A window of ± 30 seconds
around the experimental alarm times includes approximately 20 percent of predicted
ionization detector responses and 35 to 40 percent of photoelectric detector responses for
113
flaming fires. These figures are inflated due to the methodology used to predict the
detector response during the flaming portion of smoldering-to-flaming transitional fires.
Alarm predictions in these flaming scenarios are forced to occur after the time when
transition to flaming occurs. In combination with the observation that most of the
experimental alarms that occurred during the flaming period occurred soon after the
transition time, it comes as no surprise that so many of the predicted alarms occurred
within 60 seconds of the experimental alarm. The percentage of predicted ionization and
photoelectric alarms within the ± 30 second and ± 60 second windows increased to a
maximum of approximately 20 percent for ± 30 seconds and 30 percent for ± 60 seconds
at the 80 percent threshold.

114
18%
38%
0%
13%
41%50%
12%
25%
0%
10%
20%
30%
40%
50%
60%
70%
80%
90%
100%
Perc
enta
ge o
f Pre
dict
ed A
larm
sw
ith 2
0% T
hres
hold
Predicted Alarm Within +/- 30 s of Experimental AlarmPredicted Alarm Within +/- 60 s of Experimental Alarm
20%
43%
7%13%
47%
57%
21%29%
0%
10%
20%
30%
40%
50%
60%
70%
80%
90%
100%
Perc
enta
ge o
f Pre
dict
ed A
larm
sw
ith 5
0% T
hres
hold
21%
33%
18%22%
50% 50%
27%33%
0%
10%
20%
30%
40%
50%
60%
70%
80%
90%
100%
KEMANOFlaming
Ion
KEMANOFlamingPhoto
KEMANOSmoldering
Ion
KEMANOSmoldering
Photo
Perc
enta
ge o
f Pre
dict
ed A
larm
sw
ith 8
0% T
hres
hold
Figure 21 - Percentage of predicted alarms that occurred within ±30 and ±60 seconds of the experimental alarm for the Kemano tests using the 20 percent (top), 50 percent (middle), and 80 percent (bottom) optical density alarm thresholds from
Table 12.
As with the Navy tests, the ability of the 20, 50, and 80 percent optical density thresholds
to provide a range of likely alarm times and hopefully in the majority of cases provide
bounding conditions with the 20 percent and 80 percent alarm thresholds is examined.

115
The alarm times from the 20 percent and 80 percent thresholds are compared to the
experimental alarm times to determine if the experimental alarm fell within the bounds of
the predicted alarm times. The results of this analysis are shown in Figure 22.
6%0%
18% 20%
72%
60%
47%52%
22%
40%35%
28%
0%
10%
20%
30%
40%
50%
60%
70%
80%
90%
100%
KEMANOFlaming
Ion
KEMANOFlaming
Photo
KEMANOSmoldering
Ion
KEMANOSmoldering
Photo
Prec
enta
ge o
f Exp
erim
enta
l Ala
rms
No Alarm Predicted at 20% or 80%Experimental Alarm Not Bounded by 20% and 80% Alarm PredictionsExperimental Alarm Bounded by 20% and 80% Alarm Predictions
Figure 22 - Percentage of Kemano experimental alarms bounded by the 20 percent and 80 percent optical density alarm thresholds from Table 12.
As was seen in the Navy tests, less than 20 percent of experimental alarms from the
Kemano tests were bounded by the alarm times predicted using the 20 percent and 80
percent optical density thresholds. In contrast though, a significant portion (47 to 72
percent) of the experimental alarms did not fall within the bounds of the 20 percent and
80 percent thresholds.

116
5.3 Uncertainty in Alarm Predictions using Temperature Rise Thresholds
The same approach to examine the uncertainty in the predicted alarm times used for the
optical density thresholds is adopted for the temperature rise thresholds. The alarm
predictions for each threshold will be examined for the percentages of alarms over- and
under-predicted, the mean and median errors, and the percentage of predicted alarms that
are within ± 30 and ± 60 seconds of the experimental alarm time.
As shown in Figure 23, a temperature rise threshold of 4 ºC predicts 100 percent of
experimental detector alarms from flaming fires in the Navy test series with
approximately a 4:1 ratio of over-predicted to under-predicted alarms for the ionization
detectors and conversely a 1:3 ratio for photoelectric detectors. Less than 11 percent of
all experimental detector alarms for smoldering fires from the Navy tests were predicted
with this threshold. In addition, only 20 to 30 percent of the detector alarms that occurred
during the flaming combustion in the Kemano tests were predicted. None of the
experimental alarms that occurred during the smoldering period of the Kemano fires were
predicted.
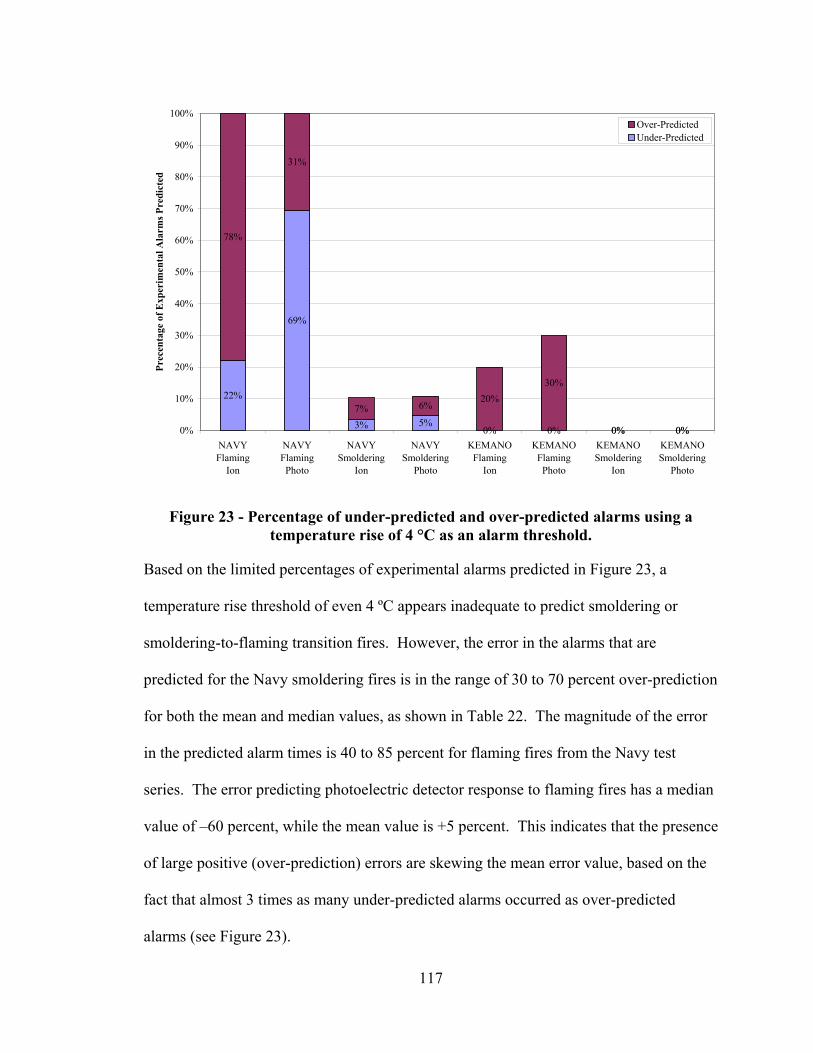
117
22%
69%
3% 5%0% 0% 0% 0%
78%
31%
7% 6%20%
30%
0% 0%0%
10%
20%
30%
40%
50%
60%
70%
80%
90%
100%
NAVYFlaming
Ion
NAVYFlamingPhoto
NAVYSmoldering
Ion
NAVYSmoldering
Photo
KEMANOFlaming
Ion
KEMANOFlamingPhoto
KEMANOSmoldering
Ion
KEMANOSmoldering
Photo
Prec
enta
ge o
f Exp
erim
enta
l Ala
rms P
redi
cted
Over-PredictedUnder-Predicted
Figure 23 - Percentage of under-predicted and over-predicted alarms using a temperature rise of 4 °C as an alarm threshold.
Based on the limited percentages of experimental alarms predicted in Figure 23, a
temperature rise threshold of even 4 ºC appears inadequate to predict smoldering or
smoldering-to-flaming transition fires. However, the error in the alarms that are
predicted for the Navy smoldering fires is in the range of 30 to 70 percent over-prediction
for both the mean and median values, as shown in Table 22. The magnitude of the error
in the predicted alarm times is 40 to 85 percent for flaming fires from the Navy test
series. The error predicting photoelectric detector response to flaming fires has a median
value of –60 percent, while the mean value is +5 percent. This indicates that the presence
of large positive (over-prediction) errors are skewing the mean error value, based on the
fact that almost 3 times as many under-predicted alarms occurred as over-predicted
alarms (see Figure 23).

118
Table 22 - Mean and median error in predicted alarm times using a temperature rise of 4 °C as an alarm threshold.
Despite drastically different overall percentages of alarms predicted, the percentage of
alarms that were predicted that occurred within ± 30 and ± 60 seconds was fairly
consistent across the flaming and smoldering Navy tests. As Figure 24 shows, over 50
percent of all predicted alarms were within ± 60 seconds of the experimental alarm for
ionization detectors responding to flaming fires in the Navy test series. The percentages
presented in Figure 24 for smoldering fires from the Navy tests and for flaming fires from
the Kemano tests are based on less than 10 predicted alarms for smoldering fires and are
therefore inconclusive. The success of these same cases at predicting alarms within ± 30
seconds ranged from 20 to 35 percent. Interestingly, even though all experimental
photoelectric detector responses to flaming fires were predicted with this threshold,
Figure 24 only shows 30 percent of these predictions occurring within ± 60 seconds.
Median Mean Std DevNAVY Flaming Ion 104 41% 85% 138%NAVY Flaming Photo 98 -60% 5% 161%NAVY Smoldering Ion 6 67% 70% 104%NAVY Smoldering Photo 9 33% 41% 87%
KEMANO Flaming Ion 4 677% 574% 410%KEMANO Flaming Photo 3 70% 476% 716%KEMANO Smoldering Ion 0KEMANO Smoldering Photo 0
Error in Predicted Alarm Detector
TypeFire TypeTest Series 4 °C Temperature Rise Threshold
Alarms Predicted

119
35%
20%17%
33%
25%
0% 0% 0%
57%
30%
50%56%
25%
0% 0% 0%0%
10%
20%
30%
40%
50%
60%
70%
80%
90%
100%
NAVYFlaming
Ion
NAVYFlamingPhoto
NAVYSmoldering
Ion
NAVYSmoldering
Photo
KEMANOFlaming
Ion
KEMANOFlamingPhoto
KEMANOSmoldering
Ion
KEMANOSmoldering
Photo
Perc
enta
ge o
f Pre
dict
ed A
larm
s
Predicted Alarm Within +/- 30 s of Experimental AlarmPredicted Alarm Within +/- 60 s of Experimental Alarm
Figure 24 - Percentage of predicted alarms that occurred within ±30 and ±60 seconds of the experimental alarm with a temperature rise of 4 °C used as an alarm
threshold.
As expected, the inadequacy of the 4 ºC temperature rise threshold at capturing the
response of detectors to smoldering and smoldering-to-flaming transitional fires is only
magnified when the 13 ºC temperature rise threshold is used. None of the smoke detector
responses in the smoldering and smoldering-to-flaming transitional fires were predicted
with the 13 ºC temperature rise threshold. Eighty-three percent of the experimental
detector alarms were over-predicted, while only 6 percent were under-predicted, for
ionization detectors responding to flaming fires in the Navy tests. In contrast, an almost
one-to-one ratio of over-predicted to under-predicted alarms occurred for photoelectric
detectors responding to flaming fires where 48 percent of experimental alarms were over-

120
predicted and 44 percent were under-predicted. Similar to the 4 ºC temperature rise
threshold, the 13 ºC temperature rise threshold predicted approximately 90 percent of
experimental ionization and photoelectric detector alarms that occurred in the flaming
fire experiments. However, in contrast, the mean and median errors in the alarm times
predicted with the 13 ºC temperature rise threshold for the flaming Navy fires are much
greater than with the 4 ºC temperature rise threshold. For example, the mean and median
errors associated with the 4 ºC temperature rise threshold alarm predictions are in the
range of 40 – 80 percent, whereas with the 13 ºC temperature rise threshold, the mean
and median error increases to approximately 200 – 400 percent over-prediction.
Table 23 - Mean and median error in predicted alarm times using a temperature rise of 13 °C as an alarm threshold.
In spite of the near equality in the number of over-predicted and under-predicted alarms
for photoelectric detectors in the flaming Navy fires, the mean error in the predicted
alarm times is positive, which means that the over-prediction errors are greater in
magnitude than the under-prediction errors.
Median Mean Std DevNAVY Flaming Ion 92 230% 390% 469%NAVY Flaming Photo 90 16% 154% 375%NAVY Smoldering Ion 0NAVY Smoldering Photo 0
KEMANO Flaming Ion 0KEMANO Flaming Photo 0KEMANO Smoldering Ion 0KEMANO Smoldering Photo 0
Test Series Fire Type Detector Type
13 °C Temperature Rise ThresholdError in Predicted Alarm Alarms
Predicted
121
Examining the percentage of predicted alarms that occurred within ± 30 and ± 60 seconds
with the 13 ºC temperature rise threshold does not shed a more positive light on this
threshold. Only 4 percent of the predicted ionization alarms and 11 percent of the
photoelectric alarms occurred within ± 60 seconds of the experimental alarms in the
flaming Navy tests. Likewise, only 1 percent of ionization and 3 percent of photoelectric
alarm predictions occurred within ± 30 seconds. Based on results presented in this
section, the use of a 13 ºC temperature rise threshold is not recommended in most
circumstances. For smoldering and smoldering-to-flaming transition fires there appears
to be no basis for using this threshold at all. For flaming fires, the errors in the predicted
alarm times were significant and almost none of the predicted alarms were within 60
seconds of the actual alarms.
Few of the fire sources examined in this study coincided with the fire sources for which
material specific temperature rise thresholds are available from Heskestad and
Delichatsios [1977]. The only truly similar fire source was the flaming wood crib fires
from the Navy test series. The simulated upholstered furniture (polyurethane foam
covered with cotton fabric) and cotton fabric fire sources used in the Kemano tests are
similar to fire sources used by Heskestad and Delichatsios, but much smaller in scale and
in this case these sources began as smoldering fires and only later transitioned to flaming.
Regardless of this lack of complete correlation between these sources, they are examined
for completeness. Other than the flaming wood fires, there are too few experimental and
predicted detector alarms to draw any firm conclusions. For the flaming wood fires 70
percent of ionization alarms and 22 percent of photoelectric detectors were predicted (all

122
over-predictions). This result suggests that the 42 ºC temperature rise threshold
recommended for the photoelectric detector tested by Heskestad and Delichatsios may
not apply to modern photoelectric detectors. For flaming wood fires, the mean and
median errors in the predicted alarm times for both ionization and photoelectric detectors
were significantly large (on the order of 500 – 1000 percent over-predicted). Although
not shown in Table 24, none of the predicted alarm times were within ±60 seconds of the
experimental alarms.
Table 24 - Overview of results from using the material specific temperature rise thresholds from Heskestad & Delichatsios [1977] as detector alarm thresholds.
Fire Type Source ClassificationDetector
TypeExperimental
AlarmsUnder-
PredictedOver-
Predicted Median Mean Std DevFlaming Wood Ion 67 0% 70% 460% 628% 544%Flaming Wood Photo 60 0% 22% 949% 1299% 1267%Flaming Upholstered Furniture Ion 8 0% 13% 48%Flaming Upholstered Furniture Photo 1 0% 0%Flaming Cotton Fabric Ion 3 0% 67% 172% 172% 71%Flaming Cotton Fabric Photo 2 0% 0%
5.4 Uncertainty in Alarm Predictions using Velocity Thresholds
The uncertainty in using a critical velocity of 0.15 m/s as an alarm threshold for the
estimation of smoke detector response is examined. To characterize the uncertainty in
the predicted alarms the percentages of alarms over- and under-predicted, the mean and
median errors, and the percentage of predicted alarms that are within ± 30 and ± 60
seconds of the experimental alarm time are all investigated. As expected, using 0.15 m/s
as an alarm threshold for smoldering fires predicted none of the 23 experimental detector
alarms that occurred. In absolute contrast, this same threshold predicted all 30
experimental detector alarms from flaming fires with 57 percent of predicted alarms
being under-predicted and 43 percent being over-predicted. The mean error in the

123
predicted alarm times with respect to the experimental alarm times was +40 percent with
a standard deviation of 187 percent for flaming fires. Quite the opposite trend was
observed for the median error in the predicted alarm times, which was –27 percent
(under-prediction). The errors associated with an alarm threshold of 0.15 m/s are
comparable to errors in using a 4 ºC temperature rise or the 20 percent optical density
alarm threshold for flaming fires, although the standard deviation in the error is larger
than in most these cases. Likewise, 43 percent of alarms predicted for flaming fires using
0.15 m/s as an alarm threshold were within ±60 seconds of the experimental alarm, with
17 percent of the predicted alarms being within ±30 seconds. These percentages are
approximately 50 percent less than the figures for the 4 ºC temperature rise or the 20
percent optical density alarm thresholds.
124
CHAPTER 6: CONCLUSIONS
The goals of this project were to evaluate alarm thresholds commonly used to estimate
the response of smoke detectors and then to quantify the uncertainty in alarm predictions
made using these thresholds. Chapters 4 and 5 presented the results that addressed both
of these goals. This chapter derives conclusions based on the results presented in the two
previous sections. In addition, recommendations are provided to serve as guidance to
those who would like to predict the response of smoke detectors with alarm thresholds.
Finally, future work that extends and complements this project is identified.
Phase 1 provided numerous insights into the alarm thresholds examined. First of all, the
values of optical density and temperature rise at the time of detector alarm do not appear
to be normally distributed. However, the values of velocity magnitude at the time of
detector alarm do appear to be normally distributed. Each measurement used as alarm
thresholds appeared to be influenced by different variables. Optical density at alarm
values were sensitive to the fire type, detector type, ventilation for smoldering fires, and
the nominal sensitivity/detector design for ionization detectors during smoldering fires.
In contrast, temperature rise at alarm values were only sensitive to fire type and detector
type and velocity at alarm values were only affected by the fire type.
The dependence of the optical density at alarm values for ionization detectors responding
to smoldering fires on the nominal sensitivity or detector design (it was unclear from this
study exactly which of these is the cause) means that it is difficult to generalize the
results for this case to other detector designs/nominal sensitivity values. Another

125
interesting observation derived from the Phase 1 results from the Navy tests was that the
optical density at alarm for smoldering fires with no ventilation was two to three times
greater than the optical density at alarm for smoldering fires with ventilation
(approximately 12 air changes per hour). Comparing the results from the Navy tests from
this study with the Navy test results presented by Geiman and Gottuk [2003] shows that
the optical density alarm values from this study are, in general, less then the previously
presented results. Reasons for this discrepancy are not initially obvious, but possible
explanations include random variations between test series or differences between the
white light optical density meters used by Geiman and Gottuk and the laser optical
density meters used in this study.
In general, the trends in the optical density at alarm data are that alarms for ionization
detectors responding to flaming fires occur at the lowest smoke optical densities and
those for ionization detectors responding to smoldering fires occur at the greatest optical
densities. The optical density at the time of photoelectric detector alarms for flaming and
smoldering fires falls in between these two extremes, with significantly less variation
among the two fire types.
Phase 1 results for the temperature rise at detector alarm are significantly lower than
traditionally reported. There was no noticeable temperature rise at alarm (i.e. maximum
values of 1 to 3 ºC) for the smoldering or smoldering-to-flaming transition fires. In the
smoldering-to-flaming transition fires, the detector alarms typically occurred either
during the smoldering period or soon after the transition to flaming before significant
126
temperature rises could occur. These results are not unexpected for smoldering fires,
however what was somewhat unexpected was that 80 percent of ionization detectors
alarmed at temperature rises less than or equal to 3 ºC for flaming fires (cardboard boxes
and wood cribs). Traditionally, much larger temperature rise values are associated with
detector response to flaming fires. The scale of the fire sources, or the growth rate of the
fire, may influence the temperature rise at alarm. This hypothesis is consistent with the
results of Brammer [2002] who found that an alarm threshold of 20 ºC was most
appropriate for the 600 kW and 1 MW fires examined in that study.
There were serious questions raised regarding the constancy of the optical density to
temperature rise ratio upon which the temperature rise method of smoke detector
response estimation is based. Values for this ratio ranged one to two orders of magnitude
above the recommended value by Heskestad and Delichatsios [1977] for flaming wood
crib fires. Loss of heat to the ceiling, smoke aging (reactions occurring in the smoke after
leaving the fire source), or detector alarms not occurring during what Heskestad and
Delichatsios refer to as the “active growth” period are all possible causes of the
anomalies.
For smoldering fires, the Phase 1 results showed no consistently obvious increase in the
velocity magnitude above ambient conditions attributable to the fire source at the time of
detector alarms. For flaming fires, the velocity magnitude at detector alarm appeared
normally distributed, with a mean value of 0.13 m/s and a standard deviation of 0.07 m/s.
127
These values are consistent with previously cited critical velocity values for flaming fires
by other authors [Brozovski, 1991; Cleary, et al., 2000].
Phase 2 involved a simple, yet novel approach to further evaluating the various alarm
thresholds considered in this study. Alarm responses of the detectors examined in this
study were estimated using the time-dependent experimental data and the alarm
thresholds identified in the literature. The uncertainty in the predicted alarm times is
quantified with respect to the experimental alarm time.
A majority of predicted alarms are under-predicted for smoldering fires when the nominal
sensitivity of the detector is used as an alarm threshold. For flaming fires, the nominal
sensitivity of the detector results in approximately a 3:2 ratio of over-predicted to under-
predicted alarms. Overall, the nominal sensitivity predicts a high percentage of detector
alarms. Despite fairly large percentage errors for flaming fires, 30 to 40 percent of the
predicted alarms were within ±60 seconds of the experimental alarms.
An optical density of 0.14 m-1 predicted less than 50 percent of experimental alarms.
Along with a low percentage of predicted alarms, the error in the predicted alarms was
overwhelmingly in over-prediction (+1000 to +2000 percent error) for flaming fires. The
results were more varied for smoldering fires, with the majority of alarms still being
under-predicted for smoldering fires with the ventilation off. As anticipated from these
conclusions, an alarm threshold of 0.14 m-1 rarely predicts alarms within ±60 seconds of
the experimental alarms.

128
A slightly different approach to using an optical density threshold is to consider a range
of threshold values, in this study the 20-, 50-, and 80-percent optical density alarm
thresholds based on the data of Geiman and Gottuk [2003]. The values used for the
alarm threshold depended on the type of fire and type of detector whose response was
being predicted, as well as which of the three threshold levels was desired. Detector
responses from both the Navy and Kemano test series were evaluated with this approach.
For the Navy test series, the overall percentage of alarms predicted decreased and the
number of over-predicted alarms increased from the 20 percent threshold to the 80
percent threshold, as expected. Error was not minimized at the 50 percent threshold as
was previously assumed, due to the generally lower optical density at alarm values (with
respect to the values presented by Geiman and Gottuk [2003]) found in this study. At the
20 percent threshold, 49 and 63 percent of predicted alarms were within ±60 seconds of
the experimental alarms for flaming fires being detected by photoelectric and ionization
detectors respectively. These results make the 20 percent optical density alarm
thresholds the most effective threshold at predicting ionization and photoelectric detector
alarms reasonably close to the experimental alarms. The percentage of predicted detector
responses within ±30 and ±60 seconds of the experimental alarms decreased from the 20
percent to the 80 percent optical density thresholds. Finally, approximately 40 percent of
experimental alarm times were bounded between the alarm times predicted by the 20
percent and 80 percent alarm thresholds for flaming fires, with significantly less success
for smoldering fires.

129
Attempts to predict the alarm responses from the Kemano test series proved difficult,
particularly for those that occurred after the transition to flaming. Prediction of detector
alarms that occurred during the smoldering period was straightforward and the results for
this test series using the 20, 50 and 80 percent thresholds from Table 12 yielded
comparable results to the Navy smoldering tests. However, the difficulties lied in the
method used to predict detector alarms that occurred after the transition to a flaming fire.
The approach taken in this study was to force the predicted alarms to occur during the
same mode of combustion as was experienced by the detector in the experiments.
Knowledge of the transition time from the experiments was required to successfully use
this approach and the resulting alarm times were highly sensitive to this time. Most
predicted alarms (regardless of threshold level) occurred almost instantaneously after the
transition to flaming, due to the significant build-up of optically dense smoke in the
smoldering portion of many of the tests.
Traditionally, temperature rise thresholds have been used to estimate the response of
smoke detectors primarily due to the ability to model temperature measurements with
reasonable accuracy. Temperature rise thresholds were still examined in Phase 2 despite
evidence that questioned the validity of this approach in Phase 1. A temperature rise of 4
ºC predicted all detector responses from the Navy flaming fires and practically none of
the detector responses from the Navy smoldering or Kemano smoldering-to-flaming
transition fires. The uncertainty in the predicted alarms to flaming fires in terms of mean
and median errors and percentages of predicted responses within ±30 and ±60 seconds

130
was slightly better than using the nominal sensitivity as a threshold, but not quite as good
as the 20 percent optical density alarm thresholds.
A temperature rise of 13 ºC has unfortunately become the de facto standard method for
engineers to predict smoke detector responses, despite a limited amount of research
supporting this approach. Based on the results of Phase 2 of this study, a 13 ºC
temperature rise alarm threshold is completely unacceptable to predict smoldering or
smoldering-to-flaming transitional fires; none of the experimental alarms for these cases
were predicted. For flaming fires, this threshold predicted approximately 90 percent of
the experimental alarms (mostly over-predictions for ionization detectors) but the mean
and median errors were large. In addition, less than 11 percent of predicted photoelectric
alarms and 4 percent of ionization alarms were within ±60 seconds of the experimental
alarms.
The use of material- and detector-specific temperature rises as alarm thresholds was the
original intent of Heskestad and Delichatsios [2002]. Only the flaming wood crib fires
provided a comparable fire source between this study and the original that produced a
sufficient quantity of results for examination in Phase 2. The temperature rise threshold
recommended for photoelectric detectors for this fire source seemed exceedingly high
compared to the data in this study.
Finally, the use of a velocity magnitude of 0.15 m/s as an alarm threshold produced
results with comparable uncertainty to the temperature rise threshold of 4 ºC. For

131
example, all of the experimental detector alarms that occurred during flaming fires were
predicted with a threshold of 0.15 m/s, but none of the experimental alarms that occurred
during the smoldering fires. The magnitude of the errors associated with the predicted
alarm times for flaming fires was comparable to errors in using a 4 ºC temperature rise or
the 20 percent optical density alarm threshold for flaming fires, however the percentage
of predicted alarms within ±60 seconds was significantly less than either of these
thresholds.
6.1 Recommendations
A characterization of the crude nature of the estimates of detector response from the
various thresholds examined has been established. Overall, with few exceptions, the
percentage of predicted alarm times within ±60 seconds of the experimental alarm time
was less than 50 percent. This fact when taken in combination with the large variation in
the errors of the predicted alarm times limits the usefulness of these approaches to
predicting the response of smoke detectors in many applications. At best, errors of 20 to
60 percent (often in under-prediction) can be expected for smoldering fires using an
optical density threshold. For flaming fires, errors on the order of 100 to 1000 percent in
over-prediction are common.
The 20 percent optical density alarm threshold provided the best overall performance of
the thresholds examined in this study in terms of the percentage of alarms predicted, the
error associated with the predictions, and the percentage of predicted alarms reasonably
close to the experimental alarms. In addition, the 20, 50 and 80 percent thresholds can be

132
used to provide a range of predicted alarm times, with the understanding that the 20
percent and 80 percent thresholds only provide bounding conditions in approximately 40
percent of the detectors responding to flaming fires and less than 20 percent of the
detectors responding to smoldering fires. In addition, often an alarm may not be
predicted by at least one of the threshold levels, which precludes the estimation of a range
of alarm times.
However, the 20, 50 and 80 percent optical density alarm thresholds are not necessarily
the optimum approach in all situations. For example, if primarily over-predicted detector
responses are desired for flaming fires, an optical density of 0.14 m-1 and a temperature
rise of 13 ºC generally provided a predicted alarm time that occurred after the
experimental alarm, often extremely so. For ionization detectors responding to flaming
fires, a temperature rise threshold of 4 ºC may prove most effective, since it predicted all
experimental alarms, had a mean error less than +100 percent, and greater than 50 percent
of the predicted alarms were within ±60 seconds. Despite the success of the temperature
rise thresholds in certain situations, caution needs to be exercised to ensure all the
assumptions inherent in this method are met. Likewise, temperature rise and velocity rise
thresholds should never be used for smoldering fires or fires that smolder initially for a
period of time.
For prediction of detector responses to smoldering fires, only the nominal sensitivity and
20, 50 and 80 percent optical density thresholds are appropriate. In either case, a
significant portion of the predicted alarms may be under-predicted with respect to the

133
experimental alarm time. This results from the difficulty in quantifying a practical, yet
conservative upper bound for optical density in smoldering fires without significantly
reducing the percentage of experimental alarms predicted. Ventilation in smoldering
fires needs to be known in order to model the response of detectors properly. Prediction
of detector responses in the flaming period following an initially smoldering fire is not
recommended. Alarm predictions in this case are highly dependent on the time of the
transition from smoldering to flaming, which is generally unknown a priori.
6.2 Future Work
During the course of this research project, as with most, numerous opportunities for
future research present themselves. This section contains many of these possible topics
along with brief explanations for the benefit future researchers to advance the state-of-
the-art in the prediction of smoke detector response.
• Analyze false positive alarm responses predicted with these alarm thresholds –
Prediction of an alarm response, when none occurred experimentally is highly
undesirable. Alarms in this study were predicted only for those smoke detectors
that alarmed during experiments. It would be instructive to perform a similar
analysis for detectors that did not alarm and quantify the propensity of the
thresholds to yield false positive responses; this may provide further guidance on
the most appropriate modeling approach in a given scenario.
• Examine differences between optical density thresholds based on laser and white
light optical density meters.
134
• Characterize smoke entry characteristics for various detectors. Refining the
currently available models provides a means to reduce the error in the estimated
alarm times from optical density thresholds.
• Investigate smoke detector alarms to larger fire sources. Lower values of optical
density and temperature rise at alarm were reported in this study than have been
previously reported. The small, challenging fire sources used in this study are a
possible cause of this result.
• Address the impracticalities in the first-principles methods of detector response
prediction that prevent their widespread use. Using threshold measurements does
not provide satisfactory prediction of alarm responses in many cases and the first-
principles methods offer the opportunity to address this problem, but additional
research is required to make these methods useful.
o Quantify uncertainty in predicted alarm responses using Newton’s
ionization chamber model.
o Verify Meacham’s model of photoelectric detector response
experimentally and through modeling.
o Conducted additional research on the optical properties of smoke (as
required by Meacham’s photoelectric smoke detector model).
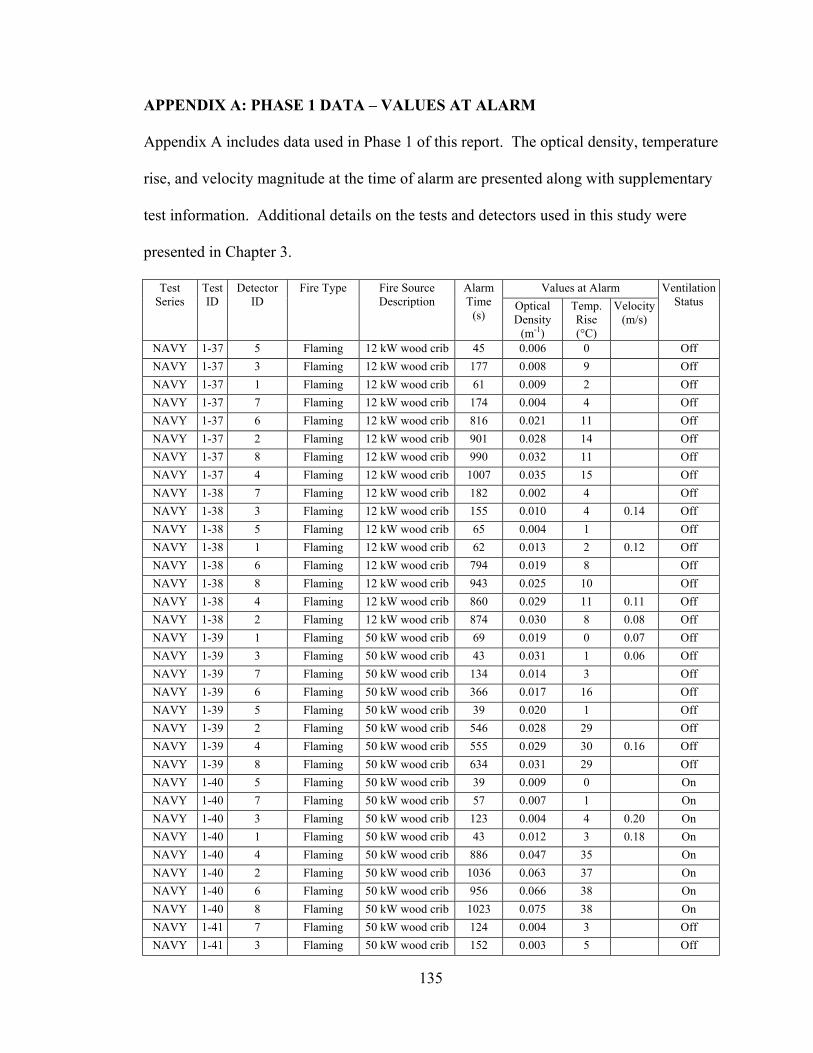
135
APPENDIX A: PHASE 1 DATA – VALUES AT ALARM
Appendix A includes data used in Phase 1 of this report. The optical density, temperature
rise, and velocity magnitude at the time of alarm are presented along with supplementary
test information. Additional details on the tests and detectors used in this study were
presented in Chapter 3.
Values at Alarm Test Series
Test ID
Detector ID
Fire Type Fire Source Description
Alarm Time
(s) Optical Density
(m-1)
Temp. Rise (°C)
Velocity (m/s)
Ventilation Status
NAVY 1-37 5 Flaming 12 kW wood crib 45 0.006 0 Off NAVY 1-37 3 Flaming 12 kW wood crib 177 0.008 9 Off NAVY 1-37 1 Flaming 12 kW wood crib 61 0.009 2 Off NAVY 1-37 7 Flaming 12 kW wood crib 174 0.004 4 Off NAVY 1-37 6 Flaming 12 kW wood crib 816 0.021 11 Off NAVY 1-37 2 Flaming 12 kW wood crib 901 0.028 14 Off NAVY 1-37 8 Flaming 12 kW wood crib 990 0.032 11 Off NAVY 1-37 4 Flaming 12 kW wood crib 1007 0.035 15 Off NAVY 1-38 7 Flaming 12 kW wood crib 182 0.002 4 Off NAVY 1-38 3 Flaming 12 kW wood crib 155 0.010 4 0.14 Off NAVY 1-38 5 Flaming 12 kW wood crib 65 0.004 1 Off NAVY 1-38 1 Flaming 12 kW wood crib 62 0.013 2 0.12 Off NAVY 1-38 6 Flaming 12 kW wood crib 794 0.019 8 Off NAVY 1-38 8 Flaming 12 kW wood crib 943 0.025 10 Off NAVY 1-38 4 Flaming 12 kW wood crib 860 0.029 11 0.11 Off NAVY 1-38 2 Flaming 12 kW wood crib 874 0.030 8 0.08 Off NAVY 1-39 1 Flaming 50 kW wood crib 69 0.019 0 0.07 Off NAVY 1-39 3 Flaming 50 kW wood crib 43 0.031 1 0.06 Off NAVY 1-39 7 Flaming 50 kW wood crib 134 0.014 3 Off NAVY 1-39 6 Flaming 50 kW wood crib 366 0.017 16 Off NAVY 1-39 5 Flaming 50 kW wood crib 39 0.020 1 Off NAVY 1-39 2 Flaming 50 kW wood crib 546 0.028 29 Off NAVY 1-39 4 Flaming 50 kW wood crib 555 0.029 30 0.16 Off NAVY 1-39 8 Flaming 50 kW wood crib 634 0.031 29 Off NAVY 1-40 5 Flaming 50 kW wood crib 39 0.009 0 On NAVY 1-40 7 Flaming 50 kW wood crib 57 0.007 1 On NAVY 1-40 3 Flaming 50 kW wood crib 123 0.004 4 0.20 On NAVY 1-40 1 Flaming 50 kW wood crib 43 0.012 3 0.18 On NAVY 1-40 4 Flaming 50 kW wood crib 886 0.047 35 On NAVY 1-40 2 Flaming 50 kW wood crib 1036 0.063 37 On NAVY 1-40 6 Flaming 50 kW wood crib 956 0.066 38 On NAVY 1-40 8 Flaming 50 kW wood crib 1023 0.075 38 On NAVY 1-41 7 Flaming 50 kW wood crib 124 0.004 3 Off NAVY 1-41 3 Flaming 50 kW wood crib 152 0.003 5 Off

136
Values at Alarm Test Series
Test ID
Detector ID
Fire Type Fire Source Description
Alarm Time
(s) Optical Density
(m-1)
Temp. Rise (°C)
Velocity (m/s)
Ventilation Status
NAVY 1-41 1 Flaming 50 kW wood crib 69 0.004 1 Off NAVY 1-41 5 Flaming 50 kW wood crib 46 0.011 1 Off NAVY 1-41 6 Flaming 50 kW wood crib 484 0.014 16 Off NAVY 1-41 4 Flaming 50 kW wood crib 494 0.015 24 Off NAVY 1-41 2 Flaming 50 kW wood crib 529 0.017 24 Off NAVY 1-41 8 Flaming 50 kW wood crib 553 0.020 17 Off NAVY 1-50 19 Flaming 12 kW wood crib 128 0.001 3 Off NAVY 1-50 21 Flaming 12 kW wood crib 112 0.003 2 Off NAVY 1-50 23 Flaming 12 kW wood crib 161 0.003 2 Off NAVY 1-50 17 Flaming 12 kW wood crib 75 0.004 2 Off NAVY 1-50 13 Flaming 12 kW wood crib 48 0.006 2 Off NAVY 1-50 15 Flaming 12 kW wood crib 65 0.006 3 Off NAVY 1-50 9 Flaming 12 kW wood crib 24 3 Off NAVY 1-50 11 Flaming 12 kW wood crib 25 3 Off NAVY 1-50 12 Flaming 12 kW wood crib 1113 12 Off NAVY 1-50 20 Flaming 12 kW wood crib 1194 0.047 3 Off NAVY 1-50 24 Flaming 12 kW wood crib 1149 0.073 5 Off NAVY 1-50 16 Flaming 12 kW wood crib 1149 0.083 3 Off NAVY 1-51 9 Flaming 50 kW wood crib 22 1 Off NAVY 1-51 10 Flaming 50 kW wood crib 28 1 Off NAVY 1-51 11 Flaming 50 kW wood crib 22 1 Off NAVY 1-51 12 Flaming 50 kW wood crib 17 0 Off NAVY 1-51 23 Flaming 50 kW wood crib 89 0.010 1 Off NAVY 1-51 16 Flaming 50 kW wood crib 53 0.033 0 Off NAVY 1-51 21 Flaming 50 kW wood crib 99 0.011 1 Off NAVY 1-51 15 Flaming 50 kW wood crib 90 0.013 1 Off NAVY 1-51 19 Flaming 50 kW wood crib 182 0.013 5 Off NAVY 1-51 20 Flaming 50 kW wood crib 82 0.020 3 Off NAVY 1-51 17 Flaming 50 kW wood crib 79 0.021 1 Off NAVY 1-51 22 Flaming 50 kW wood crib 518 0.021 13 Off NAVY 1-51 13 Flaming 50 kW wood crib 44 0.027 3 Off NAVY 1-51 14 Flaming 50 kW wood crib 54 0.031 2 Off NAVY 1-51 18 Flaming 50 kW wood crib 612 0.032 23 Off NAVY 1-52 9 Flaming 50 kW wood crib 21 2 On NAVY 1-52 10 Flaming 50 kW wood crib 16 1 On NAVY 1-52 11 Flaming 50 kW wood crib 25 1 On NAVY 1-52 12 Flaming 50 kW wood crib 17 1 On NAVY 1-52 13 Flaming 50 kW wood crib 38 0.025 0 On NAVY 1-52 14 Flaming 50 kW wood crib 38 0.025 0 On NAVY 1-52 16 Flaming 50 kW wood crib 35 0.040 0 On NAVY 1-52 20 Flaming 50 kW wood crib 40 0.053 -1 On NAVY 1-52 21 Flaming 50 kW wood crib 84 0.010 0 On NAVY 1-52 23 Flaming 50 kW wood crib 177 0.004 -1 On NAVY 1-52 19 Flaming 50 kW wood crib 73 0.020 3 On
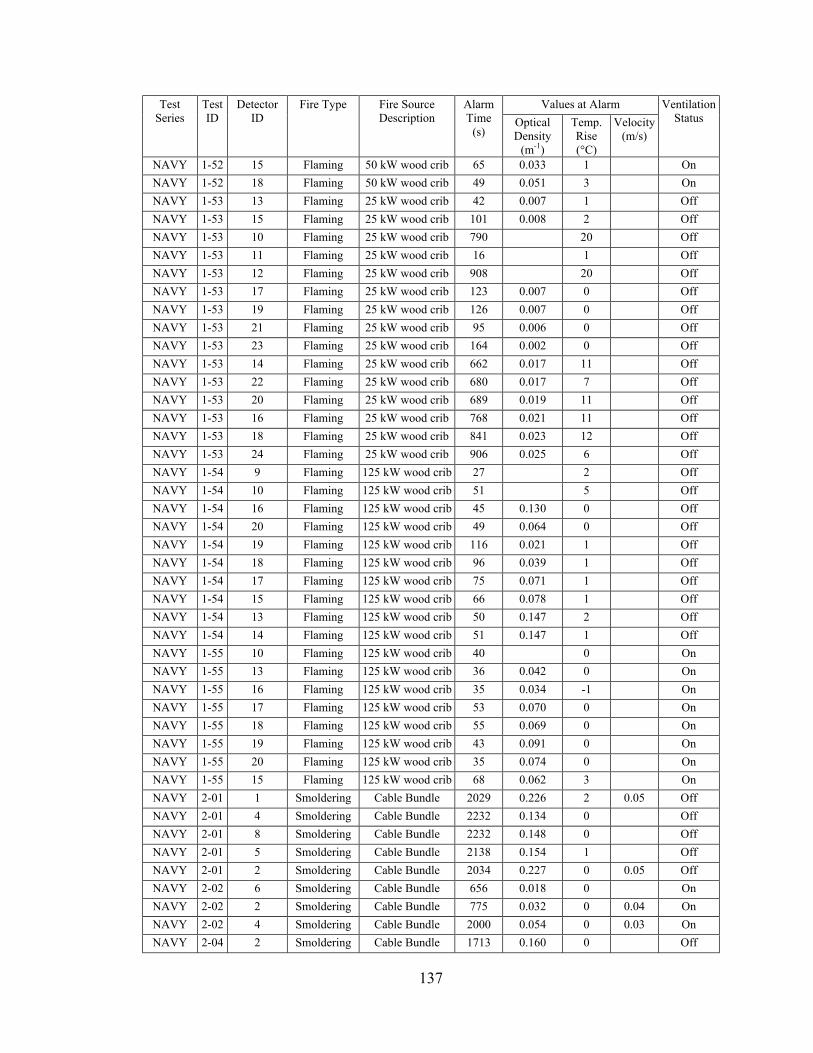
137
Values at Alarm Test Series
Test ID
Detector ID
Fire Type Fire Source Description
Alarm Time
(s) Optical Density
(m-1)
Temp. Rise (°C)
Velocity (m/s)
Ventilation Status
NAVY 1-52 15 Flaming 50 kW wood crib 65 0.033 1 On NAVY 1-52 18 Flaming 50 kW wood crib 49 0.051 3 On NAVY 1-53 13 Flaming 25 kW wood crib 42 0.007 1 Off NAVY 1-53 15 Flaming 25 kW wood crib 101 0.008 2 Off NAVY 1-53 10 Flaming 25 kW wood crib 790 20 Off NAVY 1-53 11 Flaming 25 kW wood crib 16 1 Off NAVY 1-53 12 Flaming 25 kW wood crib 908 20 Off NAVY 1-53 17 Flaming 25 kW wood crib 123 0.007 0 Off NAVY 1-53 19 Flaming 25 kW wood crib 126 0.007 0 Off NAVY 1-53 21 Flaming 25 kW wood crib 95 0.006 0 Off NAVY 1-53 23 Flaming 25 kW wood crib 164 0.002 0 Off NAVY 1-53 14 Flaming 25 kW wood crib 662 0.017 11 Off NAVY 1-53 22 Flaming 25 kW wood crib 680 0.017 7 Off NAVY 1-53 20 Flaming 25 kW wood crib 689 0.019 11 Off NAVY 1-53 16 Flaming 25 kW wood crib 768 0.021 11 Off NAVY 1-53 18 Flaming 25 kW wood crib 841 0.023 12 Off NAVY 1-53 24 Flaming 25 kW wood crib 906 0.025 6 Off NAVY 1-54 9 Flaming 125 kW wood crib 27 2 Off NAVY 1-54 10 Flaming 125 kW wood crib 51 5 Off NAVY 1-54 16 Flaming 125 kW wood crib 45 0.130 0 Off NAVY 1-54 20 Flaming 125 kW wood crib 49 0.064 0 Off NAVY 1-54 19 Flaming 125 kW wood crib 116 0.021 1 Off NAVY 1-54 18 Flaming 125 kW wood crib 96 0.039 1 Off NAVY 1-54 17 Flaming 125 kW wood crib 75 0.071 1 Off NAVY 1-54 15 Flaming 125 kW wood crib 66 0.078 1 Off NAVY 1-54 13 Flaming 125 kW wood crib 50 0.147 2 Off NAVY 1-54 14 Flaming 125 kW wood crib 51 0.147 1 Off NAVY 1-55 10 Flaming 125 kW wood crib 40 0 On NAVY 1-55 13 Flaming 125 kW wood crib 36 0.042 0 On NAVY 1-55 16 Flaming 125 kW wood crib 35 0.034 -1 On NAVY 1-55 17 Flaming 125 kW wood crib 53 0.070 0 On NAVY 1-55 18 Flaming 125 kW wood crib 55 0.069 0 On NAVY 1-55 19 Flaming 125 kW wood crib 43 0.091 0 On NAVY 1-55 20 Flaming 125 kW wood crib 35 0.074 0 On NAVY 1-55 15 Flaming 125 kW wood crib 68 0.062 3 On NAVY 2-01 1 Smoldering Cable Bundle 2029 0.226 2 0.05 Off NAVY 2-01 4 Smoldering Cable Bundle 2232 0.134 0 Off NAVY 2-01 8 Smoldering Cable Bundle 2232 0.148 0 Off NAVY 2-01 5 Smoldering Cable Bundle 2138 0.154 1 Off NAVY 2-01 2 Smoldering Cable Bundle 2034 0.227 0 0.05 Off NAVY 2-02 6 Smoldering Cable Bundle 656 0.018 0 On NAVY 2-02 2 Smoldering Cable Bundle 775 0.032 0 0.04 On NAVY 2-02 4 Smoldering Cable Bundle 2000 0.054 0 0.03 On NAVY 2-04 2 Smoldering Cable Bundle 1713 0.160 0 Off

138
Values at Alarm Test Series
Test ID
Detector ID
Fire Type Fire Source Description
Alarm Time
(s) Optical Density
(m-1)
Temp. Rise (°C)
Velocity (m/s)
Ventilation Status
NAVY 2-04 5 Smoldering Cable Bundle 1057 0.504 -1 0.05 Off NAVY 2-04 6 Smoldering Cable Bundle 796 0.417 0 0.04 Off NAVY 2-05 1 Smoldering Cable Bundle 1695 0.047 -1 On NAVY 2-05 2 Smoldering Cable Bundle 559 0.021 0 On NAVY 2-05 8 Smoldering Cable Bundle 297 0.053 0 0.02 On NAVY 2-05 4 Smoldering Cable Bundle 639 0.033 0 On NAVY 2-05 6 Smoldering Cable Bundle 424 0.091 0 0.02 On NAVY 2-05 5 Smoldering Cable Bundle 643 0.330 1 0.02 On NAVY 2-07 1 Smoldering Cable Bundle 831 0.116 0 Off NAVY 2-07 4 Smoldering Cable Bundle 936 0.096 0 Off NAVY 2-07 6 Smoldering Cable Bundle 908 0.147 0 0.04 Off NAVY 2-07 5 Smoldering Cable Bundle 1365 0.240 0 0.02 Off NAVY 2-08 1 Smoldering Cable Bundle 1372 0.039 0 On NAVY 2-08 2 Smoldering Cable Bundle 728 0.017 0 On NAVY 2-08 4 Smoldering Cable Bundle 845 0.018 0 On NAVY 2-08 6 Smoldering Cable Bundle 539 0.050 0 0.03 On NAVY 2-08 8 Smoldering Cable Bundle 775 0.054 1 0.02 On NAVY 2-08 5 Smoldering Cable Bundle 1391 0.106 0 0.04 On NAVY 2-09 5 Flaming Cardboard Box
Stack 86 0.004 2 0.22 Off
NAVY 2-09 7 Flaming Cardboard Box Stack
100 0.007 3 0.24 Off
NAVY 2-09 4 Flaming Cardboard Box Stack
169 0.014 3 Off
NAVY 2-09 1 Flaming Cardboard Box Stack
162 0.013 2 Off
NAVY 2-09 3 Flaming Cardboard Box Stack
165 0.013 2 Off
NAVY 2-09 8 Flaming Cardboard Box Stack
124 0.020 6 0.25 Off
NAVY 2-09 6 Flaming Cardboard Box Stack
129 0.021 6 0.25 Off
NAVY 2-09 2 Flaming Cardboard Box Stack
480 0.028 16 Off
NAVY 2-10 7 Flaming Cardboard Box Stack
228 0.010 12 0.21 On
NAVY 2-10 8 Flaming Cardboard Box Stack
260 0.014 20 0.30 On
NAVY 2-10 4 Flaming Cardboard Box Stack
281 0.015 9 On
NAVY 2-10 1 Flaming Cardboard Box Stack
229 0.007 1 On
NAVY 2-10 5 Flaming Cardboard Box Stack
166 0.003 0 0.22 On
NAVY 2-10 3 Flaming Cardboard Box Stack
239 0.010 1 On
NAVY 2-10 2 Flaming Cardboard Box Stack
643 0.054 11 On
NAVY 2-10 6 Flaming Cardboard Box Stack
592 0.122 25 0.14 On
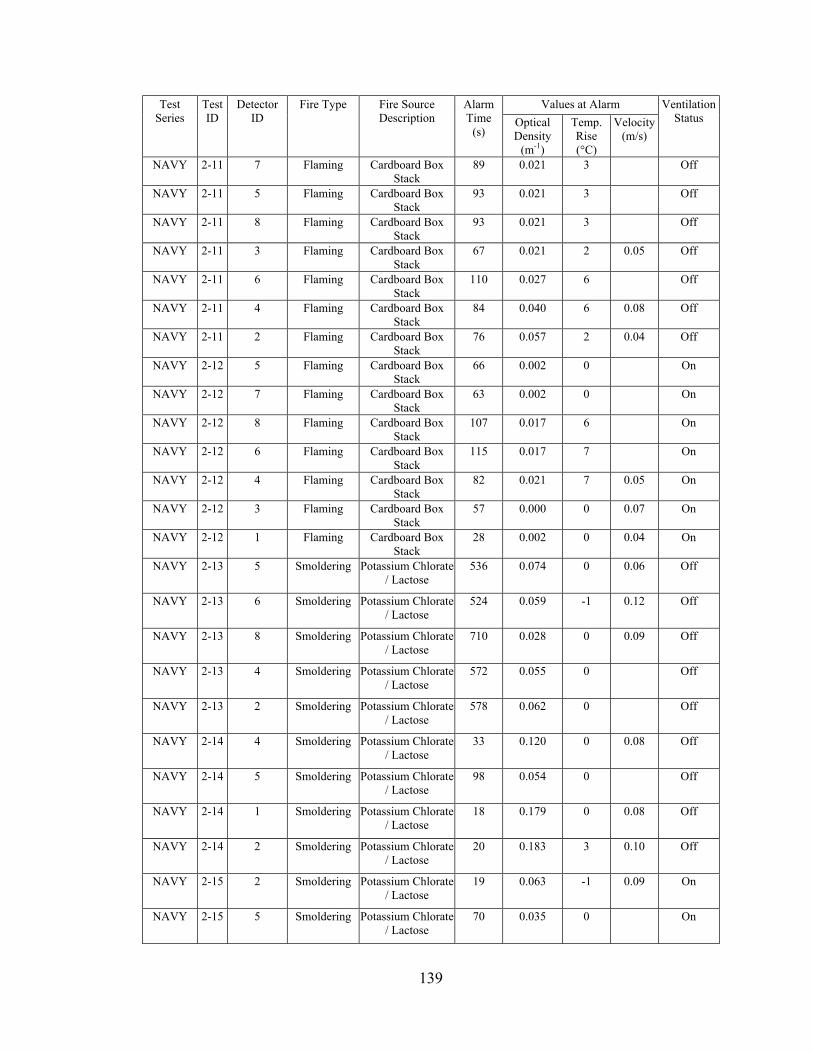
139
Values at Alarm Test Series
Test ID
Detector ID
Fire Type Fire Source Description
Alarm Time
(s) Optical Density
(m-1)
Temp. Rise (°C)
Velocity (m/s)
Ventilation Status
NAVY 2-11 7 Flaming Cardboard Box Stack
89 0.021 3 Off
NAVY 2-11 5 Flaming Cardboard Box Stack
93 0.021 3 Off
NAVY 2-11 8 Flaming Cardboard Box Stack
93 0.021 3 Off
NAVY 2-11 3 Flaming Cardboard Box Stack
67 0.021 2 0.05 Off
NAVY 2-11 6 Flaming Cardboard Box Stack
110 0.027 6 Off
NAVY 2-11 4 Flaming Cardboard Box Stack
84 0.040 6 0.08 Off
NAVY 2-11 2 Flaming Cardboard Box Stack
76 0.057 2 0.04 Off
NAVY 2-12 5 Flaming Cardboard Box Stack
66 0.002 0 On
NAVY 2-12 7 Flaming Cardboard Box Stack
63 0.002 0 On
NAVY 2-12 8 Flaming Cardboard Box Stack
107 0.017 6 On
NAVY 2-12 6 Flaming Cardboard Box Stack
115 0.017 7 On
NAVY 2-12 4 Flaming Cardboard Box Stack
82 0.021 7 0.05 On
NAVY 2-12 3 Flaming Cardboard Box Stack
57 0.000 0 0.07 On
NAVY 2-12 1 Flaming Cardboard Box Stack
28 0.002 0 0.04 On
NAVY 2-13 5 Smoldering Potassium Chlorate / Lactose
536 0.074 0 0.06 Off
NAVY 2-13 6 Smoldering Potassium Chlorate / Lactose
524 0.059 -1 0.12 Off
NAVY 2-13 8 Smoldering Potassium Chlorate / Lactose
710 0.028 0 0.09 Off
NAVY 2-13 4 Smoldering Potassium Chlorate / Lactose
572 0.055 0 Off
NAVY 2-13 2 Smoldering Potassium Chlorate / Lactose
578 0.062 0 Off
NAVY 2-14 4 Smoldering Potassium Chlorate / Lactose
33 0.120 0 0.08 Off
NAVY 2-14 5 Smoldering Potassium Chlorate / Lactose
98 0.054 0 Off
NAVY 2-14 1 Smoldering Potassium Chlorate / Lactose
18 0.179 0 0.08 Off
NAVY 2-14 2 Smoldering Potassium Chlorate / Lactose
20 0.183 3 0.10 Off
NAVY 2-15 2 Smoldering Potassium Chlorate / Lactose
19 0.063 -1 0.09 On
NAVY 2-15 5 Smoldering Potassium Chlorate / Lactose
70 0.035 0 On
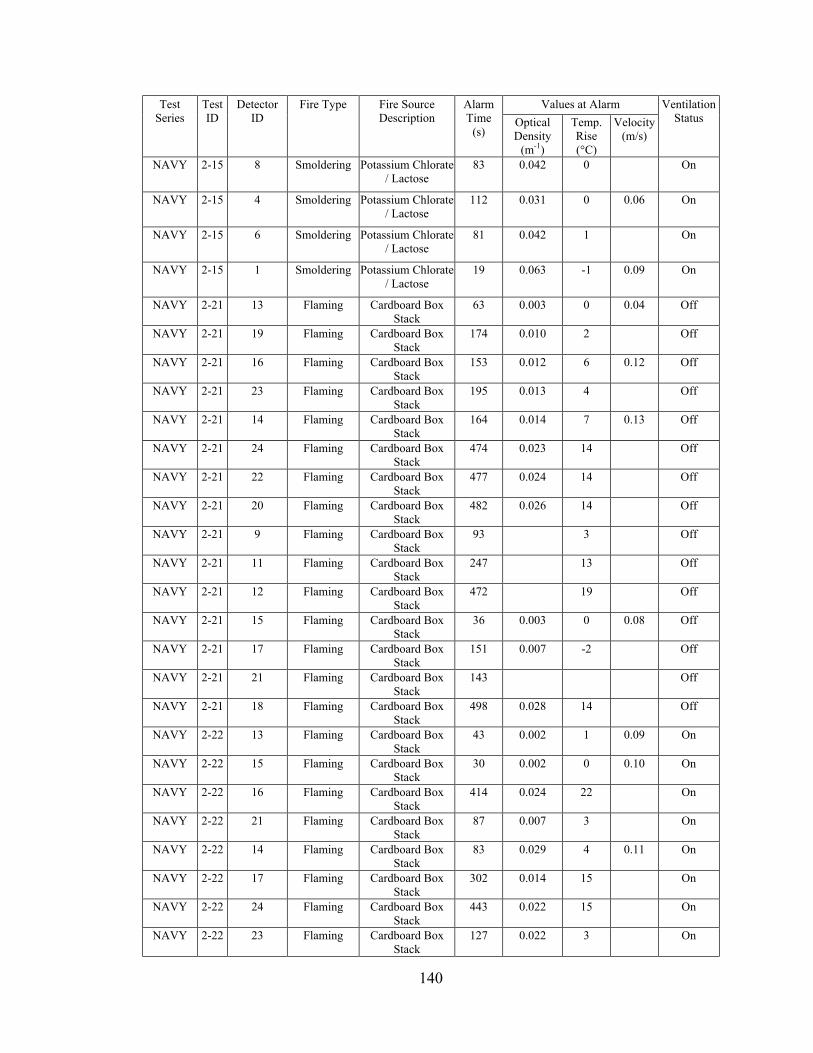
140
Values at Alarm Test Series
Test ID
Detector ID
Fire Type Fire Source Description
Alarm Time
(s) Optical Density
(m-1)
Temp. Rise (°C)
Velocity (m/s)
Ventilation Status
NAVY 2-15 8 Smoldering Potassium Chlorate / Lactose
83 0.042 0 On
NAVY 2-15 4 Smoldering Potassium Chlorate / Lactose
112 0.031 0 0.06 On
NAVY 2-15 6 Smoldering Potassium Chlorate / Lactose
81 0.042 1 On
NAVY 2-15 1 Smoldering Potassium Chlorate / Lactose
19 0.063 -1 0.09 On
NAVY 2-21 13 Flaming Cardboard Box Stack
63 0.003 0 0.04 Off
NAVY 2-21 19 Flaming Cardboard Box Stack
174 0.010 2 Off
NAVY 2-21 16 Flaming Cardboard Box Stack
153 0.012 6 0.12 Off
NAVY 2-21 23 Flaming Cardboard Box Stack
195 0.013 4 Off
NAVY 2-21 14 Flaming Cardboard Box Stack
164 0.014 7 0.13 Off
NAVY 2-21 24 Flaming Cardboard Box Stack
474 0.023 14 Off
NAVY 2-21 22 Flaming Cardboard Box Stack
477 0.024 14 Off
NAVY 2-21 20 Flaming Cardboard Box Stack
482 0.026 14 Off
NAVY 2-21 9 Flaming Cardboard Box Stack
93 3 Off
NAVY 2-21 11 Flaming Cardboard Box Stack
247 13 Off
NAVY 2-21 12 Flaming Cardboard Box Stack
472 19 Off
NAVY 2-21 15 Flaming Cardboard Box Stack
36 0.003 0 0.08 Off
NAVY 2-21 17 Flaming Cardboard Box Stack
151 0.007 -2 Off
NAVY 2-21 21 Flaming Cardboard Box Stack
143 Off
NAVY 2-21 18 Flaming Cardboard Box Stack
498 0.028 14 Off
NAVY 2-22 13 Flaming Cardboard Box Stack
43 0.002 1 0.09 On
NAVY 2-22 15 Flaming Cardboard Box Stack
30 0.002 0 0.10 On
NAVY 2-22 16 Flaming Cardboard Box Stack
414 0.024 22 On
NAVY 2-22 21 Flaming Cardboard Box Stack
87 0.007 3 On
NAVY 2-22 14 Flaming Cardboard Box Stack
83 0.029 4 0.11 On
NAVY 2-22 17 Flaming Cardboard Box Stack
302 0.014 15 On
NAVY 2-22 24 Flaming Cardboard Box Stack
443 0.022 15 On
NAVY 2-22 23 Flaming Cardboard Box Stack
127 0.022 3 On

141
Values at Alarm Test Series
Test ID
Detector ID
Fire Type Fire Source Description
Alarm Time
(s) Optical Density
(m-1)
Temp. Rise (°C)
Velocity (m/s)
Ventilation Status
NAVY 2-22 20 Flaming Cardboard Box Stack
455 0.023 11 On
NAVY 2-22 18 Flaming Cardboard Box Stack
479 0.024 11 On
NAVY 2-22 19 Flaming Cardboard Box Stack
126 0.026 2 On
NAVY 2-22 22 Flaming Cardboard Box Stack
118 0.028 3 On
NAVY 2-22 9 Flaming Cardboard Box Stack
74 0 On
NAVY 2-22 11 Flaming Cardboard Box Stack
129 4 On
NAVY 2-22 12 Flaming Cardboard Box Stack
432 16 On
NAVY 2-23 17 Flaming Cardboard Box Stack
54 0.004 1 Off
NAVY 2-23 13 Flaming Cardboard Box Stack
119 0.005 0 Off
NAVY 2-23 16 Flaming Cardboard Box Stack
139 0.014 1 Off
NAVY 2-23 20 Flaming Cardboard Box Stack
310 0.015 31 Off
NAVY 2-23 18 Flaming Cardboard Box Stack
97 0.026 1 Off
NAVY 2-23 22 Flaming Cardboard Box Stack
173 0.027 2 Off
NAVY 2-23 21 Flaming Cardboard Box Stack
125 0.028 1 Off
NAVY 2-23 23 Flaming Cardboard Box Stack
144 0.031 1 Off
NAVY 2-23 24 Flaming Cardboard Box Stack
139 0.031 1 Off
NAVY 2-23 10 Flaming Cardboard Box Stack
89 1 Off
NAVY 2-23 11 Flaming Cardboard Box Stack
120 0 Off
NAVY 2-23 12 Flaming Cardboard Box Stack
349 16 Off
NAVY 2-23 14 Flaming Cardboard Box Stack
151 0.020 0 Off
NAVY 2-23 15 Flaming Cardboard Box Stack
143 0.014 0 Off
NAVY 2-23 19 Flaming Cardboard Box Stack
122 0.032 1 Off
NAVY 2-24 21 Flaming Cardboard Box Stack
58 0.003 0 On
NAVY 2-24 23 Flaming Cardboard Box Stack
67 0.004 1 On
NAVY 2-24 17 Flaming Cardboard Box Stack
62 0.009 1 On
NAVY 2-24 13 Flaming Cardboard Box Stack
117 0.010 1 On
NAVY 2-24 15 Flaming Cardboard Box Stack
142 0.016 1 On
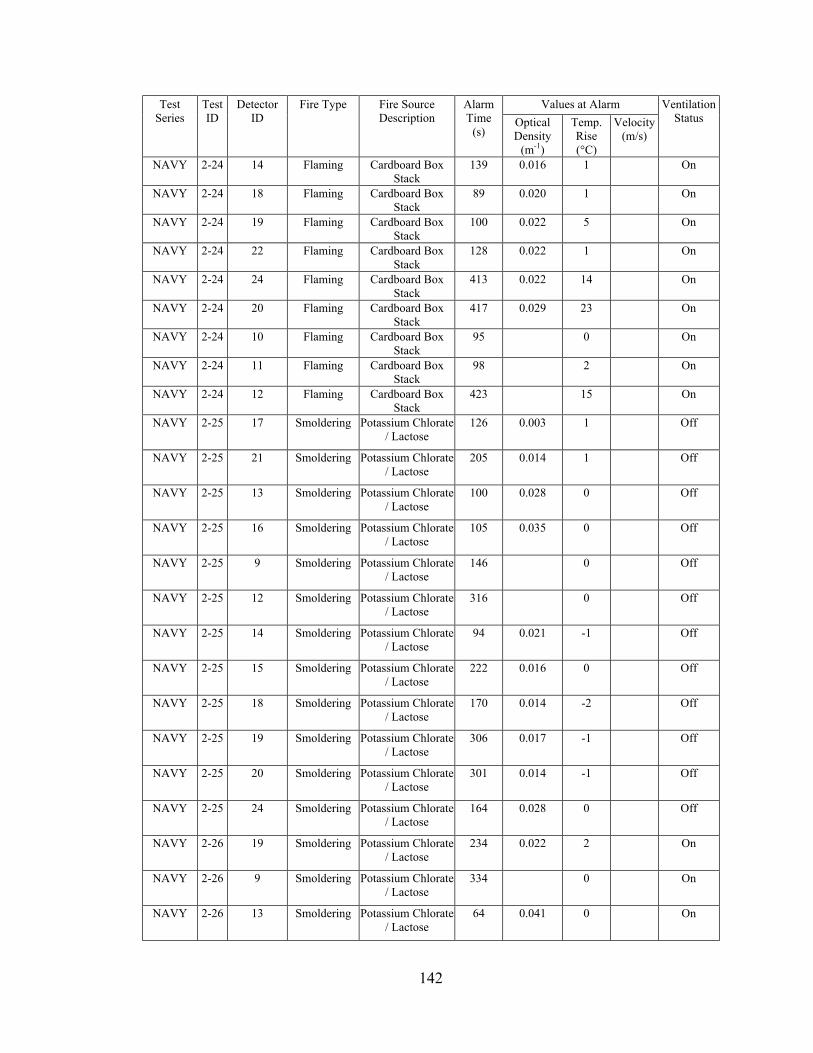
142
Values at Alarm Test Series
Test ID
Detector ID
Fire Type Fire Source Description
Alarm Time
(s) Optical Density
(m-1)
Temp. Rise (°C)
Velocity (m/s)
Ventilation Status
NAVY 2-24 14 Flaming Cardboard Box Stack
139 0.016 1 On
NAVY 2-24 18 Flaming Cardboard Box Stack
89 0.020 1 On
NAVY 2-24 19 Flaming Cardboard Box Stack
100 0.022 5 On
NAVY 2-24 22 Flaming Cardboard Box Stack
128 0.022 1 On
NAVY 2-24 24 Flaming Cardboard Box Stack
413 0.022 14 On
NAVY 2-24 20 Flaming Cardboard Box Stack
417 0.029 23 On
NAVY 2-24 10 Flaming Cardboard Box Stack
95 0 On
NAVY 2-24 11 Flaming Cardboard Box Stack
98 2 On
NAVY 2-24 12 Flaming Cardboard Box Stack
423 15 On
NAVY 2-25 17 Smoldering Potassium Chlorate / Lactose
126 0.003 1 Off
NAVY 2-25 21 Smoldering Potassium Chlorate / Lactose
205 0.014 1 Off
NAVY 2-25 13 Smoldering Potassium Chlorate / Lactose
100 0.028 0 Off
NAVY 2-25 16 Smoldering Potassium Chlorate / Lactose
105 0.035 0 Off
NAVY 2-25 9 Smoldering Potassium Chlorate / Lactose
146 0 Off
NAVY 2-25 12 Smoldering Potassium Chlorate / Lactose
316 0 Off
NAVY 2-25 14 Smoldering Potassium Chlorate / Lactose
94 0.021 -1 Off
NAVY 2-25 15 Smoldering Potassium Chlorate / Lactose
222 0.016 0 Off
NAVY 2-25 18 Smoldering Potassium Chlorate / Lactose
170 0.014 -2 Off
NAVY 2-25 19 Smoldering Potassium Chlorate / Lactose
306 0.017 -1 Off
NAVY 2-25 20 Smoldering Potassium Chlorate / Lactose
301 0.014 -1 Off
NAVY 2-25 24 Smoldering Potassium Chlorate / Lactose
164 0.028 0 Off
NAVY 2-26 19 Smoldering Potassium Chlorate / Lactose
234 0.022 2 On
NAVY 2-26 9 Smoldering Potassium Chlorate / Lactose
334 0 On
NAVY 2-26 13 Smoldering Potassium Chlorate / Lactose
64 0.041 0 On
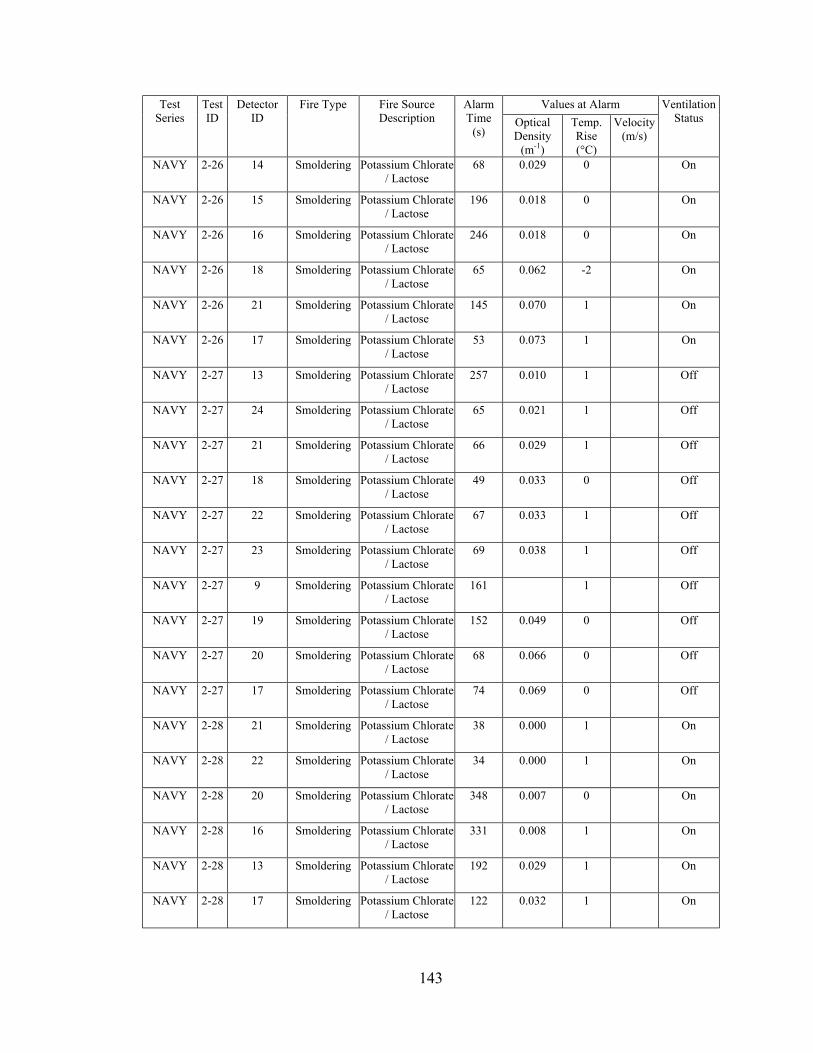
143
Values at Alarm Test Series
Test ID
Detector ID
Fire Type Fire Source Description
Alarm Time
(s) Optical Density
(m-1)
Temp. Rise (°C)
Velocity (m/s)
Ventilation Status
NAVY 2-26 14 Smoldering Potassium Chlorate / Lactose
68 0.029 0 On
NAVY 2-26 15 Smoldering Potassium Chlorate / Lactose
196 0.018 0 On
NAVY 2-26 16 Smoldering Potassium Chlorate / Lactose
246 0.018 0 On
NAVY 2-26 18 Smoldering Potassium Chlorate / Lactose
65 0.062 -2 On
NAVY 2-26 21 Smoldering Potassium Chlorate / Lactose
145 0.070 1 On
NAVY 2-26 17 Smoldering Potassium Chlorate / Lactose
53 0.073 1 On
NAVY 2-27 13 Smoldering Potassium Chlorate / Lactose
257 0.010 1 Off
NAVY 2-27 24 Smoldering Potassium Chlorate / Lactose
65 0.021 1 Off
NAVY 2-27 21 Smoldering Potassium Chlorate / Lactose
66 0.029 1 Off
NAVY 2-27 18 Smoldering Potassium Chlorate / Lactose
49 0.033 0 Off
NAVY 2-27 22 Smoldering Potassium Chlorate / Lactose
67 0.033 1 Off
NAVY 2-27 23 Smoldering Potassium Chlorate / Lactose
69 0.038 1 Off
NAVY 2-27 9 Smoldering Potassium Chlorate / Lactose
161 1 Off
NAVY 2-27 19 Smoldering Potassium Chlorate / Lactose
152 0.049 0 Off
NAVY 2-27 20 Smoldering Potassium Chlorate / Lactose
68 0.066 0 Off
NAVY 2-27 17 Smoldering Potassium Chlorate / Lactose
74 0.069 0 Off
NAVY 2-28 21 Smoldering Potassium Chlorate / Lactose
38 0.000 1 On
NAVY 2-28 22 Smoldering Potassium Chlorate / Lactose
34 0.000 1 On
NAVY 2-28 20 Smoldering Potassium Chlorate / Lactose
348 0.007 0 On
NAVY 2-28 16 Smoldering Potassium Chlorate / Lactose
331 0.008 1 On
NAVY 2-28 13 Smoldering Potassium Chlorate / Lactose
192 0.029 1 On
NAVY 2-28 17 Smoldering Potassium Chlorate / Lactose
122 0.032 1 On
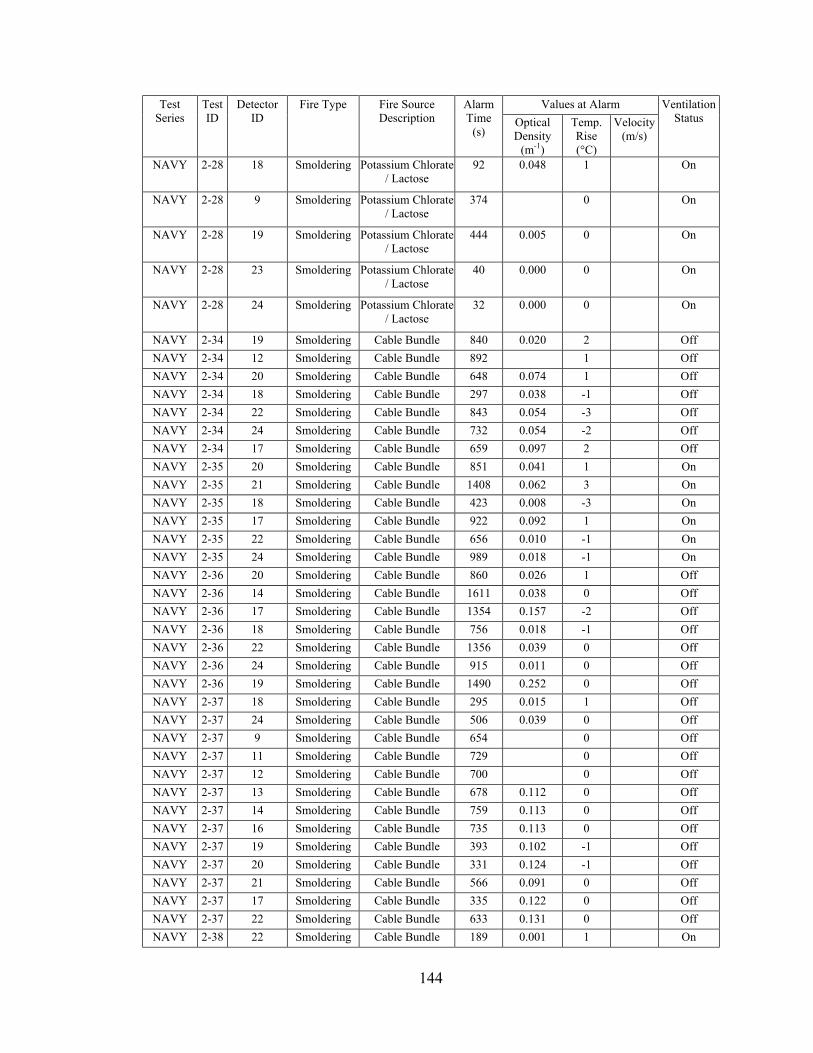
144
Values at Alarm Test Series
Test ID
Detector ID
Fire Type Fire Source Description
Alarm Time
(s) Optical Density
(m-1)
Temp. Rise (°C)
Velocity (m/s)
Ventilation Status
NAVY 2-28 18 Smoldering Potassium Chlorate / Lactose
92 0.048 1 On
NAVY 2-28 9 Smoldering Potassium Chlorate / Lactose
374 0 On
NAVY 2-28 19 Smoldering Potassium Chlorate / Lactose
444 0.005 0 On
NAVY 2-28 23 Smoldering Potassium Chlorate / Lactose
40 0.000 0 On
NAVY 2-28 24 Smoldering Potassium Chlorate / Lactose
32 0.000 0 On
NAVY 2-34 19 Smoldering Cable Bundle 840 0.020 2 Off NAVY 2-34 12 Smoldering Cable Bundle 892 1 Off NAVY 2-34 20 Smoldering Cable Bundle 648 0.074 1 Off NAVY 2-34 18 Smoldering Cable Bundle 297 0.038 -1 Off NAVY 2-34 22 Smoldering Cable Bundle 843 0.054 -3 Off NAVY 2-34 24 Smoldering Cable Bundle 732 0.054 -2 Off NAVY 2-34 17 Smoldering Cable Bundle 659 0.097 2 Off NAVY 2-35 20 Smoldering Cable Bundle 851 0.041 1 On NAVY 2-35 21 Smoldering Cable Bundle 1408 0.062 3 On NAVY 2-35 18 Smoldering Cable Bundle 423 0.008 -3 On NAVY 2-35 17 Smoldering Cable Bundle 922 0.092 1 On NAVY 2-35 22 Smoldering Cable Bundle 656 0.010 -1 On NAVY 2-35 24 Smoldering Cable Bundle 989 0.018 -1 On NAVY 2-36 20 Smoldering Cable Bundle 860 0.026 1 Off NAVY 2-36 14 Smoldering Cable Bundle 1611 0.038 0 Off NAVY 2-36 17 Smoldering Cable Bundle 1354 0.157 -2 Off NAVY 2-36 18 Smoldering Cable Bundle 756 0.018 -1 Off NAVY 2-36 22 Smoldering Cable Bundle 1356 0.039 0 Off NAVY 2-36 24 Smoldering Cable Bundle 915 0.011 0 Off NAVY 2-36 19 Smoldering Cable Bundle 1490 0.252 0 Off NAVY 2-37 18 Smoldering Cable Bundle 295 0.015 1 Off NAVY 2-37 24 Smoldering Cable Bundle 506 0.039 0 Off NAVY 2-37 9 Smoldering Cable Bundle 654 0 Off NAVY 2-37 11 Smoldering Cable Bundle 729 0 Off NAVY 2-37 12 Smoldering Cable Bundle 700 0 Off NAVY 2-37 13 Smoldering Cable Bundle 678 0.112 0 Off NAVY 2-37 14 Smoldering Cable Bundle 759 0.113 0 Off NAVY 2-37 16 Smoldering Cable Bundle 735 0.113 0 Off NAVY 2-37 19 Smoldering Cable Bundle 393 0.102 -1 Off NAVY 2-37 20 Smoldering Cable Bundle 331 0.124 -1 Off NAVY 2-37 21 Smoldering Cable Bundle 566 0.091 0 Off NAVY 2-37 17 Smoldering Cable Bundle 335 0.122 0 Off NAVY 2-37 22 Smoldering Cable Bundle 633 0.131 0 Off NAVY 2-38 22 Smoldering Cable Bundle 189 0.001 1 On
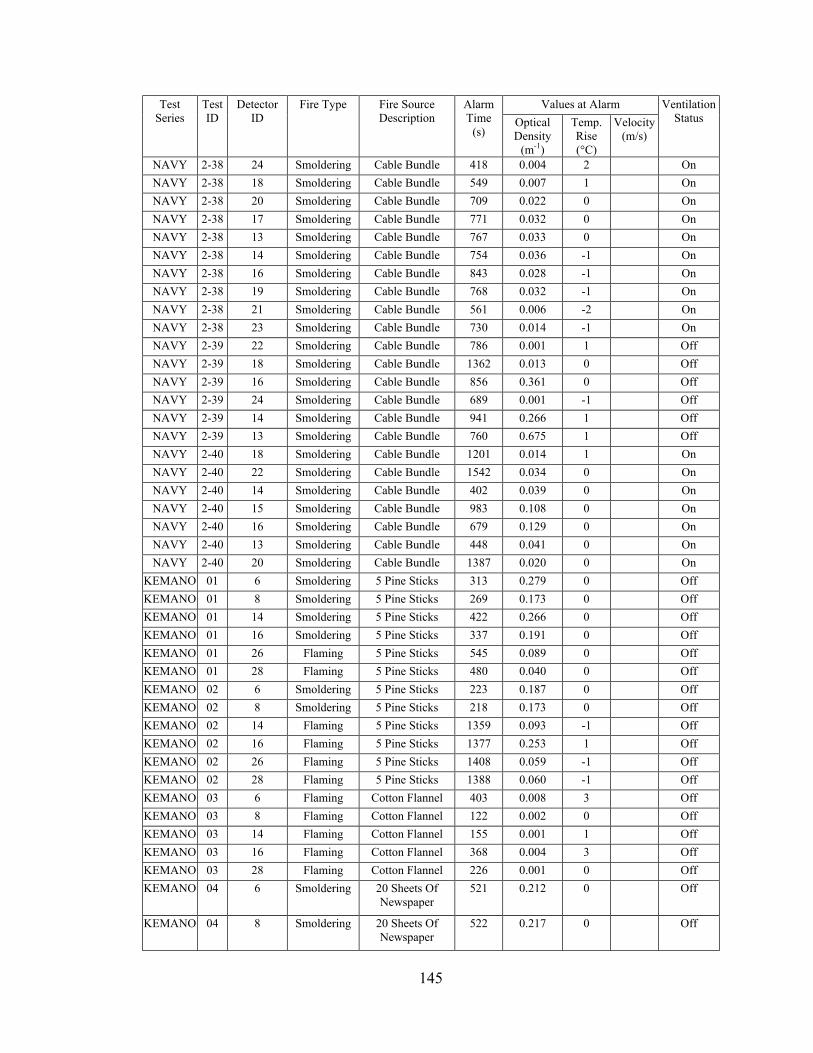
145
Values at Alarm Test Series
Test ID
Detector ID
Fire Type Fire Source Description
Alarm Time
(s) Optical Density
(m-1)
Temp. Rise (°C)
Velocity (m/s)
Ventilation Status
NAVY 2-38 24 Smoldering Cable Bundle 418 0.004 2 On NAVY 2-38 18 Smoldering Cable Bundle 549 0.007 1 On NAVY 2-38 20 Smoldering Cable Bundle 709 0.022 0 On NAVY 2-38 17 Smoldering Cable Bundle 771 0.032 0 On NAVY 2-38 13 Smoldering Cable Bundle 767 0.033 0 On NAVY 2-38 14 Smoldering Cable Bundle 754 0.036 -1 On NAVY 2-38 16 Smoldering Cable Bundle 843 0.028 -1 On NAVY 2-38 19 Smoldering Cable Bundle 768 0.032 -1 On NAVY 2-38 21 Smoldering Cable Bundle 561 0.006 -2 On NAVY 2-38 23 Smoldering Cable Bundle 730 0.014 -1 On NAVY 2-39 22 Smoldering Cable Bundle 786 0.001 1 Off NAVY 2-39 18 Smoldering Cable Bundle 1362 0.013 0 Off NAVY 2-39 16 Smoldering Cable Bundle 856 0.361 0 Off NAVY 2-39 24 Smoldering Cable Bundle 689 0.001 -1 Off NAVY 2-39 14 Smoldering Cable Bundle 941 0.266 1 Off NAVY 2-39 13 Smoldering Cable Bundle 760 0.675 1 Off NAVY 2-40 18 Smoldering Cable Bundle 1201 0.014 1 On NAVY 2-40 22 Smoldering Cable Bundle 1542 0.034 0 On NAVY 2-40 14 Smoldering Cable Bundle 402 0.039 0 On NAVY 2-40 15 Smoldering Cable Bundle 983 0.108 0 On NAVY 2-40 16 Smoldering Cable Bundle 679 0.129 0 On NAVY 2-40 13 Smoldering Cable Bundle 448 0.041 0 On NAVY 2-40 20 Smoldering Cable Bundle 1387 0.020 0 On
KEMANO 01 6 Smoldering 5 Pine Sticks 313 0.279 0 Off KEMANO 01 8 Smoldering 5 Pine Sticks 269 0.173 0 Off KEMANO 01 14 Smoldering 5 Pine Sticks 422 0.266 0 Off KEMANO 01 16 Smoldering 5 Pine Sticks 337 0.191 0 Off KEMANO 01 26 Flaming 5 Pine Sticks 545 0.089 0 Off KEMANO 01 28 Flaming 5 Pine Sticks 480 0.040 0 Off KEMANO 02 6 Smoldering 5 Pine Sticks 223 0.187 0 Off KEMANO 02 8 Smoldering 5 Pine Sticks 218 0.173 0 Off KEMANO 02 14 Flaming 5 Pine Sticks 1359 0.093 -1 Off KEMANO 02 16 Flaming 5 Pine Sticks 1377 0.253 1 Off KEMANO 02 26 Flaming 5 Pine Sticks 1408 0.059 -1 Off KEMANO 02 28 Flaming 5 Pine Sticks 1388 0.060 -1 Off KEMANO 03 6 Flaming Cotton Flannel 403 0.008 3 Off KEMANO 03 8 Flaming Cotton Flannel 122 0.002 0 Off KEMANO 03 14 Flaming Cotton Flannel 155 0.001 1 Off KEMANO 03 16 Flaming Cotton Flannel 368 0.004 3 Off KEMANO 03 28 Flaming Cotton Flannel 226 0.001 0 Off KEMANO 04 6 Smoldering 20 Sheets Of
Newspaper 521 0.212 0 Off
KEMANO 04 8 Smoldering 20 Sheets Of Newspaper
522 0.217 0 Off

146
Values at Alarm Test Series
Test ID
Detector ID
Fire Type Fire Source Description
Alarm Time
(s) Optical Density
(m-1)
Temp. Rise (°C)
Velocity (m/s)
Ventilation Status
KEMANO 04 14 Smoldering 20 Sheets Of Newspaper
377 0.112 1 Off
KEMANO 04 16 Smoldering 20 Sheets Of Newspaper
373 0.099 0 Off
KEMANO 04 26 Flaming 20 Sheets Of Newspaper
787 0.074 0 Off
KEMANO 04 28 Smoldering 20 Sheets Of Newspaper
686 0.055 0 Off
KEMANO 05 6 Smoldering Polyurethane Foam + Cotton Flannel
461 0.296 1 Off
KEMANO 05 8 Smoldering Polyurethane Foam + Cotton Flannel
325 0.258 0 Off
KEMANO 05 14 Smoldering Polyurethane Foam + Cotton Flannel
315 0.166 -1 Off
KEMANO 05 16 Smoldering Polyurethane Foam + Cotton Flannel
356 0.270 0 Off
KEMANO 05 26 Flaming Polyurethane Foam + Cotton Flannel
922 0.142 0 Off
KEMANO 05 28 Flaming Polyurethane Foam + Cotton Flannel
875 0.176 0 Off
KEMANO 06 6 Flaming 5 Pine Sticks 1112 0.013 1 Off KEMANO 06 8 Flaming 5 Pine Sticks 1111 0.019 0 Off KEMANO 06 14 Flaming 5 Pine Sticks 389 0.056 0 Off KEMANO 06 16 Smoldering 5 Pine Sticks 297 0.043 -1 Off KEMANO 06 26 Flaming 5 Pine Sticks 265 0.132 0 Off KEMANO 06 28 Flaming 5 Pine Sticks 277 0.086 0 Off KEMANO 07 6 Flaming 5 Pine Sticks 1115 0.033 1 Off KEMANO 07 8 Flaming 5 Pine Sticks 1107 0.075 0 Off KEMANO 07 14 Smoldering 5 Pine Sticks 606 0.153 0 Off KEMANO 07 16 Smoldering 5 Pine Sticks 342 0.041 -1 Off KEMANO 07 26 Smoldering 5 Pine Sticks 374 0.226 -1 Off KEMANO 07 28 Smoldering 5 Pine Sticks 383 0.210 -1 Off KEMANO 08 6 Smoldering Polyurethane Foam
+ Cotton Flannel 376 0.012 0 Off
KEMANO 08 8 Flaming Polyurethane Foam + Cotton Flannel
760 0.073 0 Off
KEMANO 08 14 Flaming Polyurethane Foam + Cotton Flannel
860 0.151 0 Off
KEMANO 08 16 Smoldering Polyurethane Foam + Cotton Flannel
334 0.036 -1 Off
KEMANO 08 26 Smoldering Polyurethane Foam + Cotton Flannel
254 0.146 0 Off
KEMANO 08 28 Smoldering Polyurethane Foam + Cotton Flannel
715 0.303 1 Off

147
Values at Alarm Test Series
Test ID
Detector ID
Fire Type Fire Source Description
Alarm Time
(s) Optical Density
(m-1)
Temp. Rise (°C)
Velocity (m/s)
Ventilation Status
KEMANO 09 6 Smoldering Chair Section Upholstered
755 0.061 0 Off
KEMANO 09 8 Smoldering Chair Section Upholstered
924 0.079 1 Off
KEMANO 09 14 Flaming Chair Section Upholstered
906 0.135 1 Off
KEMANO 09 16 Smoldering Chair Section Upholstered
376 0.037 0 Off
KEMANO 09 26 Smoldering Chair Section Upholstered
288 0.068 0 Off
KEMANO 09 28 Smoldering Chair Section Upholstered
795 0.209 1 Off
KEMANO 10 1 Smoldering 10 Pine Sticks 681 -1 Off KEMANO 10 3 Smoldering 10 Pine Sticks 418 -1 Off KEMANO 10 4 Smoldering 10 Pine Sticks 1044 0.154 -1 Off KEMANO 10 6 Smoldering 10 Pine Sticks 504 0.117 -1 Off KEMANO 10 7 Smoldering 10 Pine Sticks 2017 0.097 0 Off KEMANO 10 9 Smoldering 10 Pine Sticks 605 0.020 0 Off KEMANO 10 10 Smoldering 10 Pine Sticks 2055 0.084 -1 Off KEMANO 10 12 Smoldering 10 Pine Sticks 755 0.027 0 Off KEMANO 10 13 Flaming 10 Pine Sticks 2851 0 Off KEMANO 10 15 Smoldering 10 Pine Sticks 687 0 Off KEMANO 11 1 Flaming Polyurethane Foam
+ Cotton Flannel 1690 0 Off
KEMANO 11 3 Smoldering Polyurethane Foam + Cotton Flannel
344 -1 Off
KEMANO 11 4 Flaming Polyurethane Foam + Cotton Flannel
1723 0.111 0 Off
KEMANO 11 6 Smoldering Polyurethane Foam + Cotton Flannel
371 0.131 -1 Off
KEMANO 11 7 Flaming Polyurethane Foam + Cotton Flannel
1763 0.078 0 Off
KEMANO 11 9 Smoldering Polyurethane Foam + Cotton Flannel
439 0.022 0 Off
KEMANO 11 10 Flaming Polyurethane Foam + Cotton Flannel
1756 0.063 0 Off
KEMANO 11 12 Smoldering Polyurethane Foam + Cotton Flannel
485 0.013 0 Off
KEMANO 11 15 Smoldering Polyurethane Foam + Cotton Flannel
580 0 Off
KEMANO 13 1 Smoldering 20 Sheets Of Newspaper
3121 0 Off
KEMANO 13 3 Smoldering 20 Sheets Of Newspaper
420 0 Off
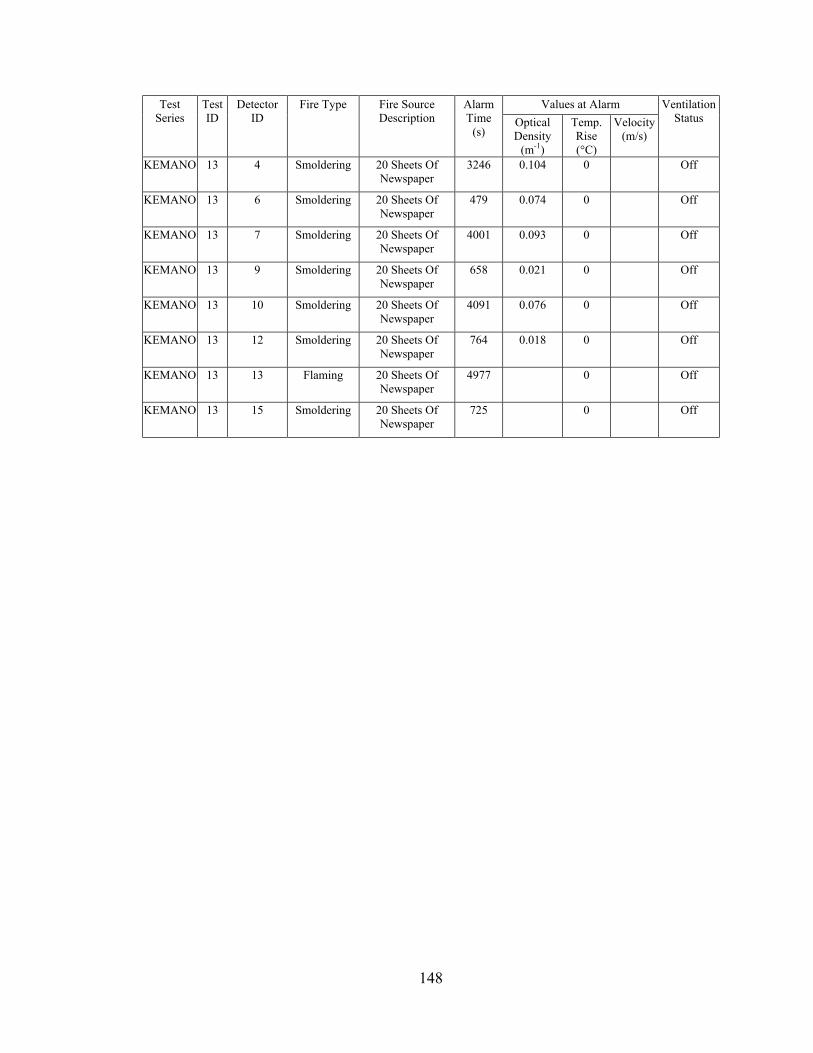
148
Values at Alarm Test Series
Test ID
Detector ID
Fire Type Fire Source Description
Alarm Time
(s) Optical Density
(m-1)
Temp. Rise (°C)
Velocity (m/s)
Ventilation Status
KEMANO 13 4 Smoldering 20 Sheets Of Newspaper
3246 0.104 0 Off
KEMANO 13 6 Smoldering 20 Sheets Of Newspaper
479 0.074 0 Off
KEMANO 13 7 Smoldering 20 Sheets Of Newspaper
4001 0.093 0 Off
KEMANO 13 9 Smoldering 20 Sheets Of Newspaper
658 0.021 0 Off
KEMANO 13 10 Smoldering 20 Sheets Of Newspaper
4091 0.076 0 Off
KEMANO 13 12 Smoldering 20 Sheets Of Newspaper
764 0.018 0 Off
KEMANO 13 13 Flaming 20 Sheets Of Newspaper
4977 0 Off
KEMANO 13 15 Smoldering 20 Sheets Of Newspaper
725 0 Off
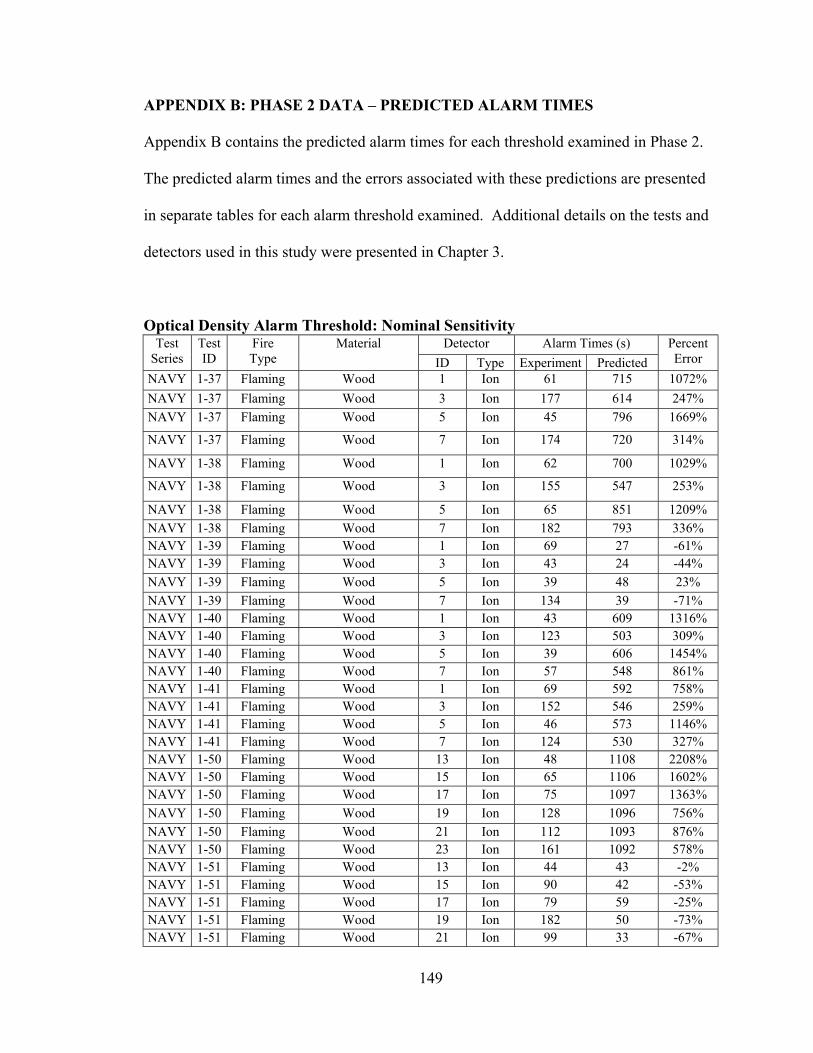
149
APPENDIX B: PHASE 2 DATA – PREDICTED ALARM TIMES
Appendix B contains the predicted alarm times for each threshold examined in Phase 2.
The predicted alarm times and the errors associated with these predictions are presented
in separate tables for each alarm threshold examined. Additional details on the tests and
detectors used in this study were presented in Chapter 3.
Optical Density Alarm Threshold: Nominal Sensitivity Detector Alarm Times (s) Test
Series Test ID
Fire Type
Material ID Type Experiment Predicted
Percent Error
NAVY 1-37 Flaming Wood 1 Ion 61 715 1072% NAVY 1-37 Flaming Wood 3 Ion 177 614 247% NAVY 1-37 Flaming Wood 5 Ion 45 796 1669%
NAVY 1-37 Flaming Wood 7 Ion 174 720 314%
NAVY 1-38 Flaming Wood 1 Ion 62 700 1029%
NAVY 1-38 Flaming Wood 3 Ion 155 547 253%
NAVY 1-38 Flaming Wood 5 Ion 65 851 1209% NAVY 1-38 Flaming Wood 7 Ion 182 793 336% NAVY 1-39 Flaming Wood 1 Ion 69 27 -61% NAVY 1-39 Flaming Wood 3 Ion 43 24 -44% NAVY 1-39 Flaming Wood 5 Ion 39 48 23% NAVY 1-39 Flaming Wood 7 Ion 134 39 -71% NAVY 1-40 Flaming Wood 1 Ion 43 609 1316% NAVY 1-40 Flaming Wood 3 Ion 123 503 309% NAVY 1-40 Flaming Wood 5 Ion 39 606 1454% NAVY 1-40 Flaming Wood 7 Ion 57 548 861% NAVY 1-41 Flaming Wood 1 Ion 69 592 758% NAVY 1-41 Flaming Wood 3 Ion 152 546 259% NAVY 1-41 Flaming Wood 5 Ion 46 573 1146% NAVY 1-41 Flaming Wood 7 Ion 124 530 327% NAVY 1-50 Flaming Wood 13 Ion 48 1108 2208% NAVY 1-50 Flaming Wood 15 Ion 65 1106 1602% NAVY 1-50 Flaming Wood 17 Ion 75 1097 1363% NAVY 1-50 Flaming Wood 19 Ion 128 1096 756% NAVY 1-50 Flaming Wood 21 Ion 112 1093 876% NAVY 1-50 Flaming Wood 23 Ion 161 1092 578% NAVY 1-51 Flaming Wood 13 Ion 44 43 -2% NAVY 1-51 Flaming Wood 15 Ion 90 42 -53% NAVY 1-51 Flaming Wood 17 Ion 79 59 -25% NAVY 1-51 Flaming Wood 19 Ion 182 50 -73% NAVY 1-51 Flaming Wood 21 Ion 99 33 -67%

150
Optical Density Alarm Threshold: Nominal Sensitivity Detector Alarm Times (s) Test
Series Test ID
Fire Type
Material ID Type Experiment Predicted
Percent Error
NAVY 1-51 Flaming Wood 23 Ion 89 29 -67% NAVY 1-52 Flaming Wood 13 Ion 38 30 -21% NAVY 1-52 Flaming Wood 15 Ion 65 30 -54% NAVY 1-52 Flaming Wood 19 Ion 73 28 -62% NAVY 1-52 Flaming Wood 21 Ion 84 21 -75% NAVY 1-52 Flaming Wood 23 Ion 177 20 -89% NAVY 1-53 Flaming Wood 13 Ion 42 826 1867% NAVY 1-53 Flaming Wood 15 Ion 101 738 631% NAVY 1-53 Flaming Wood 17 Ion 123 821 567% NAVY 1-53 Flaming Wood 19 Ion 126 733 482% NAVY 1-53 Flaming Wood 21 Ion 95 772 713% NAVY 1-53 Flaming Wood 23 Ion 164 672 310% NAVY 1-54 Flaming Wood 13 Ion 50 36 -28% NAVY 1-54 Flaming Wood 15 Ion 66 36 -45% NAVY 1-54 Flaming Wood 17 Ion 75 44 -41% NAVY 1-54 Flaming Wood 19 Ion 116 43 -63% NAVY 1-55 Flaming Wood 13 Ion 36 34 -6% NAVY 1-55 Flaming Wood 15 Ion 68 32 -53% NAVY 1-55 Flaming Wood 17 Ion 53 20 -62% NAVY 1-55 Flaming Wood 19 Ion 43 20 -53% NAVY 2-09 Flaming Cardboard 1 Ion 162 434 168% NAVY 2-09 Flaming Cardboard 3 Ion 165 416 152% NAVY 2-09 Flaming Cardboard 5 Ion 86 383 345% NAVY 2-09 Flaming Cardboard 7 Ion 100 124 24% NAVY 2-10 Flaming Cardboard 1 Ion 229 404 76% NAVY 2-10 Flaming Cardboard 3 Ion 239 390 63% NAVY 2-10 Flaming Cardboard 5 Ion 166 381 130% NAVY 2-10 Flaming Cardboard 7 Ion 228 165 -28% NAVY 2-11 Flaming Cardboard 3 Ion 67 66 -1% NAVY 2-11 Flaming Cardboard 5 Ion 93 102 10% NAVY 2-11 Flaming Cardboard 7 Ion 89 88 -1% NAVY 2-12 Flaming Cardboard 5 Ion 66 487 638% NAVY 2-12 Flaming Cardboard 7 Ion 63 371 489% NAVY 2-21 Flaming Cardboard 13 Ion 63 459 629% NAVY 2-21 Flaming Cardboard 15 Ion 36 428 1089% NAVY 2-21 Flaming Cardboard 17 Ion 151 467 209% NAVY 2-21 Flaming Cardboard 19 Ion 174 414 138% NAVY 2-21 Flaming Cardboard 21 Ion 143 468 227% NAVY 2-21 Flaming Cardboard 23 Ion 195 453 132% NAVY 2-22 Flaming Cardboard 13 Ion 43 77 79% NAVY 2-22 Flaming Cardboard 15 Ion 30 71 137% NAVY 2-22 Flaming Cardboard 17 Ion 302 122 -60% NAVY 2-22 Flaming Cardboard 19 Ion 126 116 -8% NAVY 2-22 Flaming Cardboard 21 Ion 87 107 23% NAVY 2-22 Flaming Cardboard 23 Ion 127 104 -18%

151
Optical Density Alarm Threshold: Nominal Sensitivity Detector Alarm Times (s) Test
Series Test ID
Fire Type
Material ID Type Experiment Predicted
Percent Error
NAVY 2-23 Flaming Cardboard 13 Ion 119 168 41% NAVY 2-23 Flaming Cardboard 15 Ion 143 151 6% NAVY 2-23 Flaming Cardboard 17 Ion 54 88 63% NAVY 2-23 Flaming Cardboard 19 Ion 122 87 -29% NAVY 2-23 Flaming Cardboard 21 Ion 125 114 -9% NAVY 2-23 Flaming Cardboard 23 Ion 144 110 -24% NAVY 2-24 Flaming Cardboard 13 Ion 117 457 291% NAVY 2-24 Flaming Cardboard 15 Ion 142 434 206% NAVY 2-24 Flaming Cardboard 17 Ion 62 102 65% NAVY 2-24 Flaming Cardboard 19 Ion 100 78 -22% NAVY 2-24 Flaming Cardboard 21 Ion 58 116 100% NAVY 2-24 Flaming Cardboard 23 Ion 67 102 52% NAVY 1-37 Flaming Wood 2 Photo 901 1200 33% NAVY 1-37 Flaming Wood 4 Photo 1007 995 -1% NAVY 1-37 Flaming Wood 6 Photo 816 1240 52% NAVY 1-37 Flaming Wood 8 Photo 990 1038 5% NAVY 1-38 Flaming Wood 2 Photo 874 1433 64% NAVY 1-38 Flaming Wood 4 Photo 860 1072 25% NAVY 1-38 Flaming Wood 6 Photo 794 1575 98% NAVY 1-38 Flaming Wood 8 Photo 943 1303 38% NAVY 1-39 Flaming Wood 2 Photo 546 769 41% NAVY 1-39 Flaming Wood 4 Photo 555 602 8% NAVY 1-39 Flaming Wood 6 Photo 366 825 125% NAVY 1-39 Flaming Wood 8 Photo 634 682 8% NAVY 1-40 Flaming Wood 2 Photo 1036 918 -11% NAVY 1-40 Flaming Wood 4 Photo 886 756 -15% NAVY 1-40 Flaming Wood 6 Photo 956 828 -13% NAVY 1-40 Flaming Wood 8 Photo 1023 699 -32% NAVY 1-41 Flaming Wood 2 Photo 529 879 66% NAVY 1-41 Flaming Wood 4 Photo 494 745 51% NAVY 1-41 Flaming Wood 6 Photo 484 871 80% NAVY 1-41 Flaming Wood 8 Photo 553 738 33% NAVY 1-50 Flaming Wood 16 Photo 1149 1139 -1% NAVY 1-50 Flaming Wood 20 Photo 1194 1128 -6% NAVY 1-50 Flaming Wood 24 Photo 1149 1094 -5% NAVY 1-51 Flaming Wood 14 Photo 54 804 1389% NAVY 1-51 Flaming Wood 16 Photo 53 662 1149% NAVY 1-51 Flaming Wood 18 Photo 612 778 27% NAVY 1-51 Flaming Wood 20 Photo 82 661 706% NAVY 1-51 Flaming Wood 22 Photo 518 782 51% NAVY 1-52 Flaming Wood 14 Photo 38 32 -16% NAVY 1-52 Flaming Wood 16 Photo 35 31 -11% NAVY 1-52 Flaming Wood 18 Photo 49 39 -20% NAVY 1-52 Flaming Wood 20 Photo 40 32 -20% NAVY 1-53 Flaming Wood 14 Photo 662 1534 132%
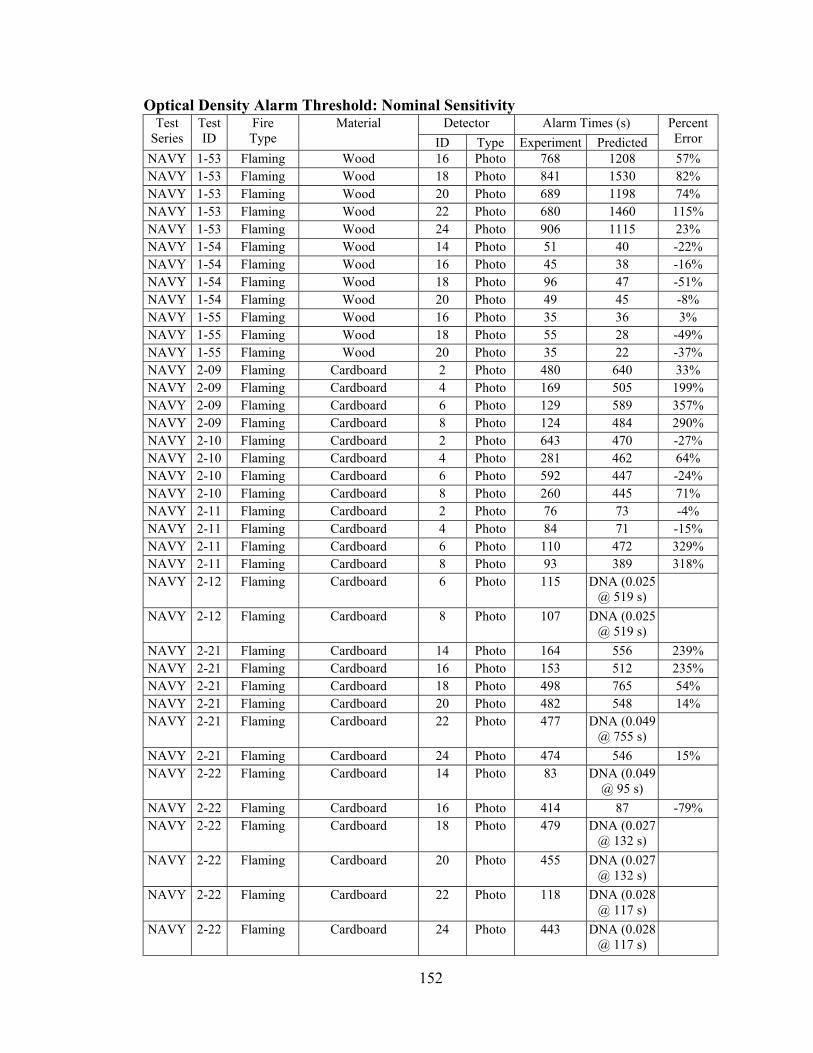
152
Optical Density Alarm Threshold: Nominal Sensitivity Detector Alarm Times (s) Test
Series Test ID
Fire Type
Material ID Type Experiment Predicted
Percent Error
NAVY 1-53 Flaming Wood 16 Photo 768 1208 57% NAVY 1-53 Flaming Wood 18 Photo 841 1530 82% NAVY 1-53 Flaming Wood 20 Photo 689 1198 74% NAVY 1-53 Flaming Wood 22 Photo 680 1460 115% NAVY 1-53 Flaming Wood 24 Photo 906 1115 23% NAVY 1-54 Flaming Wood 14 Photo 51 40 -22% NAVY 1-54 Flaming Wood 16 Photo 45 38 -16% NAVY 1-54 Flaming Wood 18 Photo 96 47 -51% NAVY 1-54 Flaming Wood 20 Photo 49 45 -8% NAVY 1-55 Flaming Wood 16 Photo 35 36 3% NAVY 1-55 Flaming Wood 18 Photo 55 28 -49% NAVY 1-55 Flaming Wood 20 Photo 35 22 -37% NAVY 2-09 Flaming Cardboard 2 Photo 480 640 33% NAVY 2-09 Flaming Cardboard 4 Photo 169 505 199% NAVY 2-09 Flaming Cardboard 6 Photo 129 589 357% NAVY 2-09 Flaming Cardboard 8 Photo 124 484 290% NAVY 2-10 Flaming Cardboard 2 Photo 643 470 -27% NAVY 2-10 Flaming Cardboard 4 Photo 281 462 64% NAVY 2-10 Flaming Cardboard 6 Photo 592 447 -24% NAVY 2-10 Flaming Cardboard 8 Photo 260 445 71% NAVY 2-11 Flaming Cardboard 2 Photo 76 73 -4% NAVY 2-11 Flaming Cardboard 4 Photo 84 71 -15% NAVY 2-11 Flaming Cardboard 6 Photo 110 472 329% NAVY 2-11 Flaming Cardboard 8 Photo 93 389 318% NAVY 2-12 Flaming Cardboard 6 Photo 115 DNA (0.025
@ 519 s)
NAVY 2-12 Flaming Cardboard 8 Photo 107 DNA (0.025 @ 519 s)
NAVY 2-21 Flaming Cardboard 14 Photo 164 556 239% NAVY 2-21 Flaming Cardboard 16 Photo 153 512 235% NAVY 2-21 Flaming Cardboard 18 Photo 498 765 54% NAVY 2-21 Flaming Cardboard 20 Photo 482 548 14% NAVY 2-21 Flaming Cardboard 22 Photo 477 DNA (0.049
@ 755 s)
NAVY 2-21 Flaming Cardboard 24 Photo 474 546 15% NAVY 2-22 Flaming Cardboard 14 Photo 83 DNA (0.049
@ 95 s)
NAVY 2-22 Flaming Cardboard 16 Photo 414 87 -79% NAVY 2-22 Flaming Cardboard 18 Photo 479 DNA (0.027
@ 132 s)
NAVY 2-22 Flaming Cardboard 20 Photo 455 DNA (0.027 @ 132 s)
NAVY 2-22 Flaming Cardboard 22 Photo 118 DNA (0.028 @ 117 s)
NAVY 2-22 Flaming Cardboard 24 Photo 443 DNA (0.028 @ 117 s)
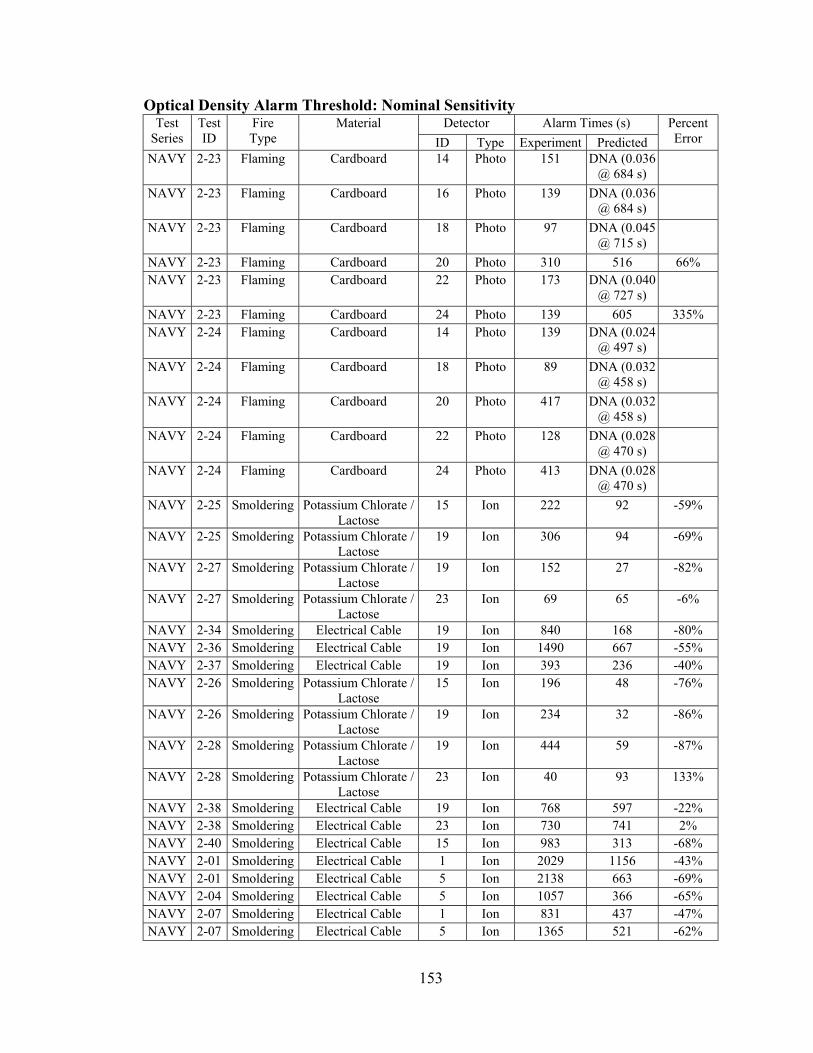
153
Optical Density Alarm Threshold: Nominal Sensitivity Detector Alarm Times (s) Test
Series Test ID
Fire Type
Material ID Type Experiment Predicted
Percent Error
NAVY 2-23 Flaming Cardboard 14 Photo 151 DNA (0.036 @ 684 s)
NAVY 2-23 Flaming Cardboard 16 Photo 139 DNA (0.036 @ 684 s)
NAVY 2-23 Flaming Cardboard 18 Photo 97 DNA (0.045 @ 715 s)
NAVY 2-23 Flaming Cardboard 20 Photo 310 516 66% NAVY 2-23 Flaming Cardboard 22 Photo 173 DNA (0.040
@ 727 s)
NAVY 2-23 Flaming Cardboard 24 Photo 139 605 335% NAVY 2-24 Flaming Cardboard 14 Photo 139 DNA (0.024
@ 497 s)
NAVY 2-24 Flaming Cardboard 18 Photo 89 DNA (0.032 @ 458 s)
NAVY 2-24 Flaming Cardboard 20 Photo 417 DNA (0.032 @ 458 s)
NAVY 2-24 Flaming Cardboard 22 Photo 128 DNA (0.028 @ 470 s)
NAVY 2-24 Flaming Cardboard 24 Photo 413 DNA (0.028 @ 470 s)
NAVY 2-25 Smoldering Potassium Chlorate / Lactose
15 Ion 222 92 -59%
NAVY 2-25 Smoldering Potassium Chlorate / Lactose
19 Ion 306 94 -69%
NAVY 2-27 Smoldering Potassium Chlorate / Lactose
19 Ion 152 27 -82%
NAVY 2-27 Smoldering Potassium Chlorate / Lactose
23 Ion 69 65 -6%
NAVY 2-34 Smoldering Electrical Cable 19 Ion 840 168 -80% NAVY 2-36 Smoldering Electrical Cable 19 Ion 1490 667 -55% NAVY 2-37 Smoldering Electrical Cable 19 Ion 393 236 -40% NAVY 2-26 Smoldering Potassium Chlorate /
Lactose 15 Ion 196 48 -76%
NAVY 2-26 Smoldering Potassium Chlorate / Lactose
19 Ion 234 32 -86%
NAVY 2-28 Smoldering Potassium Chlorate / Lactose
19 Ion 444 59 -87%
NAVY 2-28 Smoldering Potassium Chlorate / Lactose
23 Ion 40 93 133%
NAVY 2-38 Smoldering Electrical Cable 19 Ion 768 597 -22% NAVY 2-38 Smoldering Electrical Cable 23 Ion 730 741 2% NAVY 2-40 Smoldering Electrical Cable 15 Ion 983 313 -68% NAVY 2-01 Smoldering Electrical Cable 1 Ion 2029 1156 -43% NAVY 2-01 Smoldering Electrical Cable 5 Ion 2138 663 -69% NAVY 2-04 Smoldering Electrical Cable 5 Ion 1057 366 -65% NAVY 2-07 Smoldering Electrical Cable 1 Ion 831 437 -47% NAVY 2-07 Smoldering Electrical Cable 5 Ion 1365 521 -62%

154
Optical Density Alarm Threshold: Nominal Sensitivity Detector Alarm Times (s) Test
Series Test ID
Fire Type
Material ID Type Experiment Predicted
Percent Error
NAVY 2-13 Smoldering Potassium Chlorate / Lactose
5 Ion 536 502 -6%
NAVY 2-14 Smoldering Potassium Chlorate / Lactose
1 Ion 18 6 -67%
NAVY 2-14 Smoldering Potassium Chlorate / Lactose
5 Ion 98 30 -69%
NAVY 2-25 Smoldering Potassium Chlorate / Lactose
13 Ion 100 95 -5%
NAVY 2-25 Smoldering Potassium Chlorate / Lactose
17 Ion 126 217 72%
NAVY 2-25 Smoldering Potassium Chlorate / Lactose
21 Ion 205 21 -90%
NAVY 2-27 Smoldering Potassium Chlorate / Lactose
13 Ion 257 DNA (0.011 @ 99 s)
NAVY 2-27 Smoldering Potassium Chlorate / Lactose
17 Ion 74 28 -62%
NAVY 2-27 Smoldering Potassium Chlorate / Lactose
21 Ion 66 66 0%
NAVY 2-34 Smoldering Electrical Cable 17 Ion 659 168 -75% NAVY 2-36 Smoldering Electrical Cable 17 Ion 1354 668 -51% NAVY 2-37 Smoldering Electrical Cable 13 Ion 678 585 -14% NAVY 2-37 Smoldering Electrical Cable 17 Ion 335 236 -30% NAVY 2-37 Smoldering Electrical Cable 21 Ion 566 377 -33% NAVY 2-39 Smoldering Electrical Cable 13 Ion 760 278 -63% NAVY 2-05 Smoldering Electrical Cable 1 Ion 1695 579 -66% NAVY 2-05 Smoldering Electrical Cable 5 Ion 643 209 -67% NAVY 2-08 Smoldering Electrical Cable 1 Ion 1372 1027 -25% NAVY 2-08 Smoldering Electrical Cable 5 Ion 1391 417 -70% NAVY 2-15 Smoldering Potassium Chlorate /
Lactose 1 Ion 19 5 -74%
NAVY 2-15 Smoldering Potassium Chlorate / Lactose
5 Ion 70 50 -29%
NAVY 2-26 Smoldering Potassium Chlorate / Lactose
13 Ion 64 49 -23%
NAVY 2-26 Smoldering Potassium Chlorate / Lactose
17 Ion 53 32 -40%
NAVY 2-26 Smoldering Potassium Chlorate / Lactose
21 Ion 145 15 -90%
NAVY 2-28 Smoldering Potassium Chlorate / Lactose
13 Ion 192 94 -51%
NAVY 2-28 Smoldering Potassium Chlorate / Lactose
17 Ion 122 73 -40%
NAVY 2-28 Smoldering Potassium Chlorate / Lactose
21 Ion 38 109 187%
NAVY 2-35 Smoldering Electrical Cable 17 Ion 922 199 -78% NAVY 2-35 Smoldering Electrical Cable 21 Ion 1408 1228 -13% NAVY 2-38 Smoldering Electrical Cable 13 Ion 767 603 -21% NAVY 2-38 Smoldering Electrical Cable 17 Ion 771 704 -9% NAVY 2-38 Smoldering Electrical Cable 21 Ion 561 746 33%
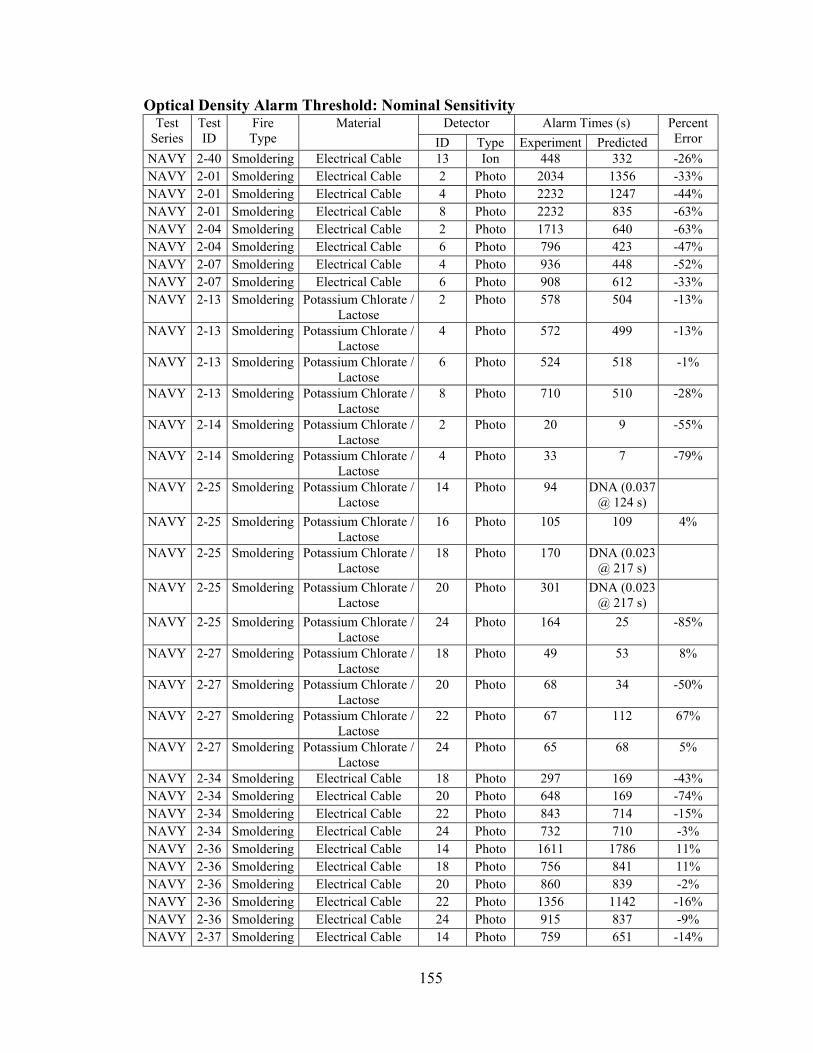
155
Optical Density Alarm Threshold: Nominal Sensitivity Detector Alarm Times (s) Test
Series Test ID
Fire Type
Material ID Type Experiment Predicted
Percent Error
NAVY 2-40 Smoldering Electrical Cable 13 Ion 448 332 -26% NAVY 2-01 Smoldering Electrical Cable 2 Photo 2034 1356 -33% NAVY 2-01 Smoldering Electrical Cable 4 Photo 2232 1247 -44% NAVY 2-01 Smoldering Electrical Cable 8 Photo 2232 835 -63% NAVY 2-04 Smoldering Electrical Cable 2 Photo 1713 640 -63% NAVY 2-04 Smoldering Electrical Cable 6 Photo 796 423 -47% NAVY 2-07 Smoldering Electrical Cable 4 Photo 936 448 -52% NAVY 2-07 Smoldering Electrical Cable 6 Photo 908 612 -33% NAVY 2-13 Smoldering Potassium Chlorate /
Lactose 2 Photo 578 504 -13%
NAVY 2-13 Smoldering Potassium Chlorate / Lactose
4 Photo 572 499 -13%
NAVY 2-13 Smoldering Potassium Chlorate / Lactose
6 Photo 524 518 -1%
NAVY 2-13 Smoldering Potassium Chlorate / Lactose
8 Photo 710 510 -28%
NAVY 2-14 Smoldering Potassium Chlorate / Lactose
2 Photo 20 9 -55%
NAVY 2-14 Smoldering Potassium Chlorate / Lactose
4 Photo 33 7 -79%
NAVY 2-25 Smoldering Potassium Chlorate / Lactose
14 Photo 94 DNA (0.037 @ 124 s)
NAVY 2-25 Smoldering Potassium Chlorate / Lactose
16 Photo 105 109 4%
NAVY 2-25 Smoldering Potassium Chlorate / Lactose
18 Photo 170 DNA (0.023 @ 217 s)
NAVY 2-25 Smoldering Potassium Chlorate / Lactose
20 Photo 301 DNA (0.023 @ 217 s)
NAVY 2-25 Smoldering Potassium Chlorate / Lactose
24 Photo 164 25 -85%
NAVY 2-27 Smoldering Potassium Chlorate / Lactose
18 Photo 49 53 8%
NAVY 2-27 Smoldering Potassium Chlorate / Lactose
20 Photo 68 34 -50%
NAVY 2-27 Smoldering Potassium Chlorate / Lactose
22 Photo 67 112 67%
NAVY 2-27 Smoldering Potassium Chlorate / Lactose
24 Photo 65 68 5%
NAVY 2-34 Smoldering Electrical Cable 18 Photo 297 169 -43% NAVY 2-34 Smoldering Electrical Cable 20 Photo 648 169 -74% NAVY 2-34 Smoldering Electrical Cable 22 Photo 843 714 -15% NAVY 2-34 Smoldering Electrical Cable 24 Photo 732 710 -3% NAVY 2-36 Smoldering Electrical Cable 14 Photo 1611 1786 11% NAVY 2-36 Smoldering Electrical Cable 18 Photo 756 841 11% NAVY 2-36 Smoldering Electrical Cable 20 Photo 860 839 -2% NAVY 2-36 Smoldering Electrical Cable 22 Photo 1356 1142 -16% NAVY 2-36 Smoldering Electrical Cable 24 Photo 915 837 -9% NAVY 2-37 Smoldering Electrical Cable 14 Photo 759 651 -14%

156
Optical Density Alarm Threshold: Nominal Sensitivity Detector Alarm Times (s) Test
Series Test ID
Fire Type
Material ID Type Experiment Predicted
Percent Error
NAVY 2-37 Smoldering Electrical Cable 16 Photo 735 635 -14% NAVY 2-37 Smoldering Electrical Cable 18 Photo 295 240 -19% NAVY 2-37 Smoldering Electrical Cable 20 Photo 331 236 -29% NAVY 2-37 Smoldering Electrical Cable 22 Photo 633 468 -26% NAVY 2-37 Smoldering Electrical Cable 24 Photo 506 387 -24% NAVY 2-39 Smoldering Electrical Cable 14 Photo 941 278 -70% NAVY 2-39 Smoldering Electrical Cable 16 Photo 856 278 -68% NAVY 2-39 Smoldering Electrical Cable 18 Photo 1362 DNA (0.046
@ 1518 s)
NAVY 2-39 Smoldering Electrical Cable 22 Photo 786 1072 36% NAVY 2-39 Smoldering Electrical Cable 24 Photo 689 1041 51% NAVY 2-02 Smoldering Electrical Cable 2 Photo 775 1921 148% NAVY 2-02 Smoldering Electrical Cable 4 Photo 2000 781 -61% NAVY 2-02 Smoldering Electrical Cable 6 Photo 656 DNA (0.039
@ 618 s)
NAVY 2-05 Smoldering Electrical Cable 2 Photo 559 1701 204% NAVY 2-05 Smoldering Electrical Cable 4 Photo 639 692 8% NAVY 2-05 Smoldering Electrical Cable 6 Photo 424 273 -36% NAVY 2-05 Smoldering Electrical Cable 8 Photo 297 217 -27% NAVY 2-08 Smoldering Electrical Cable 2 Photo 728 1419 95% NAVY 2-08 Smoldering Electrical Cable 4 Photo 845 1316 56% NAVY 2-08 Smoldering Electrical Cable 6 Photo 539 481 -11% NAVY 2-08 Smoldering Electrical Cable 8 Photo 775 445 -43% NAVY 2-15 Smoldering Potassium Chlorate /
Lactose 2 Photo 19 10 -47%
NAVY 2-15 Smoldering Potassium Chlorate / Lactose
4 Photo 112 8 -93%
NAVY 2-15 Smoldering Potassium Chlorate / Lactose
6 Photo 81 DNA (0.047 @ 99 s)
NAVY 2-15 Smoldering Potassium Chlorate / Lactose
8 Photo 83 74 -11%
NAVY 2-26 Smoldering Potassium Chlorate / Lactose
14 Photo 68 DNA (0.044 @ 82 s)
NAVY 2-26 Smoldering Potassium Chlorate / Lactose
16 Photo 246 53 -78%
NAVY 2-26 Smoldering Potassium Chlorate / Lactose
18 Photo 65 38 -42%
NAVY 2-28 Smoldering Potassium Chlorate / Lactose
16 Photo 331 116 -65%
NAVY 2-28 Smoldering Potassium Chlorate / Lactose
18 Photo 92 77 -16%
NAVY 2-28 Smoldering Potassium Chlorate / Lactose
20 Photo 348 75 -78%
NAVY 2-28 Smoldering Potassium Chlorate / Lactose
22 Photo 34 DNA (0.033 @ 160 s)
NAVY 2-28 Smoldering Potassium Chlorate / Lactose
24 Photo 32 DNA (0.033 @ 160 s)
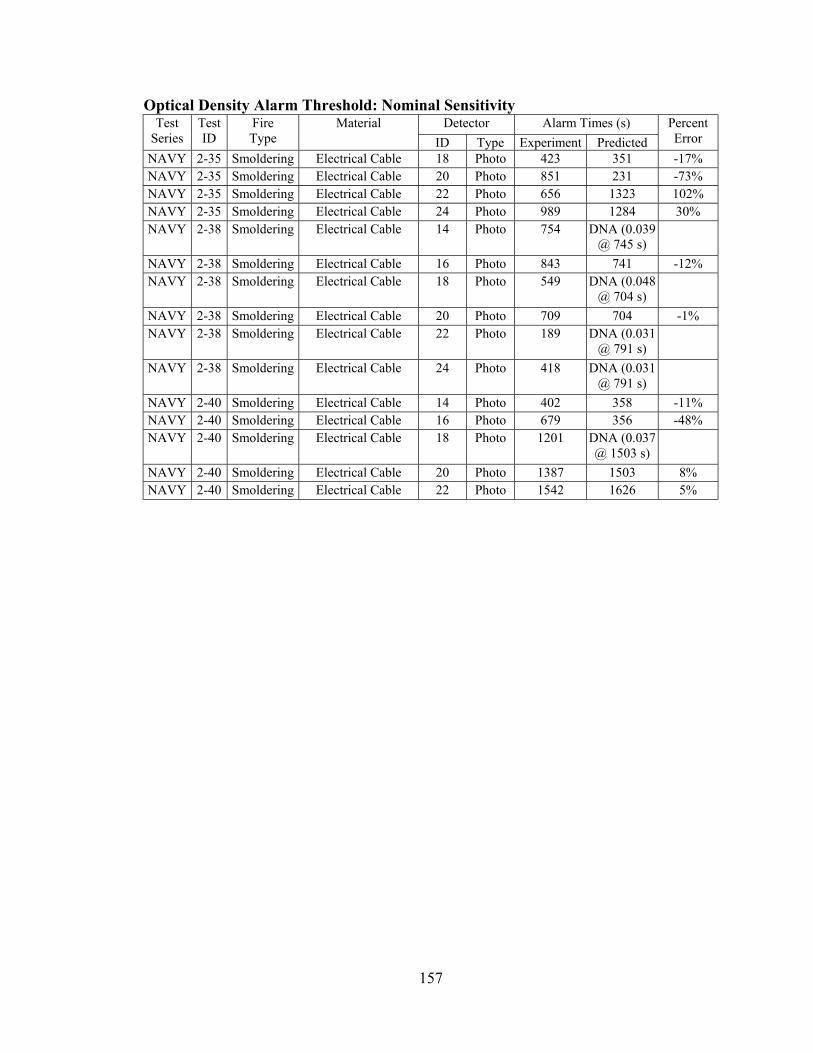
157
Optical Density Alarm Threshold: Nominal Sensitivity Detector Alarm Times (s) Test
Series Test ID
Fire Type
Material ID Type Experiment Predicted
Percent Error
NAVY 2-35 Smoldering Electrical Cable 18 Photo 423 351 -17% NAVY 2-35 Smoldering Electrical Cable 20 Photo 851 231 -73% NAVY 2-35 Smoldering Electrical Cable 22 Photo 656 1323 102% NAVY 2-35 Smoldering Electrical Cable 24 Photo 989 1284 30% NAVY 2-38 Smoldering Electrical Cable 14 Photo 754 DNA (0.039
@ 745 s)
NAVY 2-38 Smoldering Electrical Cable 16 Photo 843 741 -12% NAVY 2-38 Smoldering Electrical Cable 18 Photo 549 DNA (0.048
@ 704 s)
NAVY 2-38 Smoldering Electrical Cable 20 Photo 709 704 -1% NAVY 2-38 Smoldering Electrical Cable 22 Photo 189 DNA (0.031
@ 791 s)
NAVY 2-38 Smoldering Electrical Cable 24 Photo 418 DNA (0.031 @ 791 s)
NAVY 2-40 Smoldering Electrical Cable 14 Photo 402 358 -11% NAVY 2-40 Smoldering Electrical Cable 16 Photo 679 356 -48% NAVY 2-40 Smoldering Electrical Cable 18 Photo 1201 DNA (0.037
@ 1503 s)
NAVY 2-40 Smoldering Electrical Cable 20 Photo 1387 1503 8% NAVY 2-40 Smoldering Electrical Cable 22 Photo 1542 1626 5%

158
Optical Density Alarm Threshold: 0.14 m-1 Detector Alarm Times (s) Test
Series Test ID
Fire Type
Material ID Type Experiment Predicted
Percent Error
NAVY 1-37 Flaming Wood 1 Ion 61 1555 2449% NAVY 1-37 Flaming Wood 3 Ion 177 1555 779% NAVY 1-37 Flaming Wood 5 Ion 45 1558 3362% NAVY 1-37 Flaming Wood 7 Ion 174 1558 795% NAVY 1-38 Flaming Wood 1 Ion 62 DNA (0.133
@ 1584 s)
NAVY 1-38 Flaming Wood 3 Ion 155 DNA (0.133 @ 1584 s)
NAVY 1-38 Flaming Wood 5 Ion 65 DNA (0.078 @ 1611 s)
NAVY 1-38 Flaming Wood 7 Ion 182 DNA (0.078 @ 1611 s)
NAVY 1-39 Flaming Wood 1 Ion 69 1468 2028% NAVY 1-39 Flaming Wood 3 Ion 43 1468 3314% NAVY 1-39 Flaming Wood 5 Ion 39 1509 3769% NAVY 1-39 Flaming Wood 7 Ion 134 1509 1026% NAVY 1-40 Flaming Wood 1 Ion 43 1665 3772% NAVY 1-40 Flaming Wood 3 Ion 123 1665 1254% NAVY 1-40 Flaming Wood 5 Ion 39 1675 4195% NAVY 1-40 Flaming Wood 7 Ion 57 1675 2839% NAVY 1-41 Flaming Wood 1 Ion 69 1285 1762% NAVY 1-41 Flaming Wood 3 Ion 152 1285 745% NAVY 1-41 Flaming Wood 5 Ion 46 1277 2676% NAVY 1-41 Flaming Wood 7 Ion 124 1277 930% NAVY 1-50 Flaming Wood 13 Ion 48 DNA (0.120
@ 1155 s)
NAVY 1-50 Flaming Wood 15 Ion 65 DNA (0.120 @ 1155 s)
NAVY 1-50 Flaming Wood 17 Ion 75 DNA (0.070 @ 1143 s)
NAVY 1-50 Flaming Wood 19 Ion 128 DNA (0.070 @ 1143 s)
NAVY 1-50 Flaming Wood 21 Ion 112 DNA (0.086 @ 1158 s)
NAVY 1-50 Flaming Wood 23 Ion 161 DNA (0.086 @ 1158 s)
NAVY 1-51 Flaming Wood 13 Ion 44 1717 3802% NAVY 1-51 Flaming Wood 15 Ion 90 1717 1808% NAVY 1-51 Flaming Wood 17 Ion 79 DNA (0.137
@ 1771 s)
NAVY 1-51 Flaming Wood 19 Ion 182 DNA (0.137 @ 1771 s)
NAVY 1-51 Flaming Wood 21 Ion 99 1720 1637% NAVY 1-51 Flaming Wood 23 Ion 89 1720 1833% NAVY 1-52 Flaming Wood 13 Ion 38 DNA (0.054
@ 32 s)
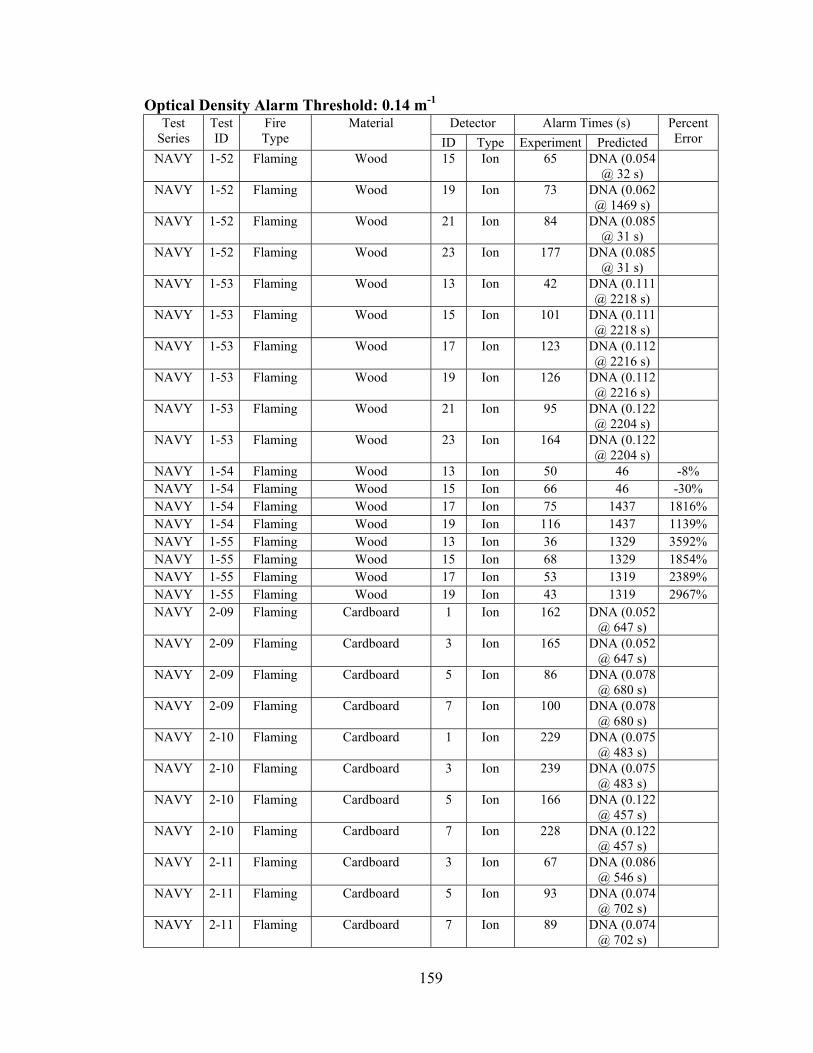
159
Optical Density Alarm Threshold: 0.14 m-1 Detector Alarm Times (s) Test
Series Test ID
Fire Type
Material ID Type Experiment Predicted
Percent Error
NAVY 1-52 Flaming Wood 15 Ion 65 DNA (0.054 @ 32 s)
NAVY 1-52 Flaming Wood 19 Ion 73 DNA (0.062 @ 1469 s)
NAVY 1-52 Flaming Wood 21 Ion 84 DNA (0.085 @ 31 s)
NAVY 1-52 Flaming Wood 23 Ion 177 DNA (0.085 @ 31 s)
NAVY 1-53 Flaming Wood 13 Ion 42 DNA (0.111 @ 2218 s)
NAVY 1-53 Flaming Wood 15 Ion 101 DNA (0.111 @ 2218 s)
NAVY 1-53 Flaming Wood 17 Ion 123 DNA (0.112 @ 2216 s)
NAVY 1-53 Flaming Wood 19 Ion 126 DNA (0.112 @ 2216 s)
NAVY 1-53 Flaming Wood 21 Ion 95 DNA (0.122 @ 2204 s)
NAVY 1-53 Flaming Wood 23 Ion 164 DNA (0.122 @ 2204 s)
NAVY 1-54 Flaming Wood 13 Ion 50 46 -8% NAVY 1-54 Flaming Wood 15 Ion 66 46 -30% NAVY 1-54 Flaming Wood 17 Ion 75 1437 1816% NAVY 1-54 Flaming Wood 19 Ion 116 1437 1139% NAVY 1-55 Flaming Wood 13 Ion 36 1329 3592% NAVY 1-55 Flaming Wood 15 Ion 68 1329 1854% NAVY 1-55 Flaming Wood 17 Ion 53 1319 2389% NAVY 1-55 Flaming Wood 19 Ion 43 1319 2967% NAVY 2-09 Flaming Cardboard 1 Ion 162 DNA (0.052
@ 647 s)
NAVY 2-09 Flaming Cardboard 3 Ion 165 DNA (0.052 @ 647 s)
NAVY 2-09 Flaming Cardboard 5 Ion 86 DNA (0.078 @ 680 s)
NAVY 2-09 Flaming Cardboard 7 Ion 100 DNA (0.078 @ 680 s)
NAVY 2-10 Flaming Cardboard 1 Ion 229 DNA (0.075 @ 483 s)
NAVY 2-10 Flaming Cardboard 3 Ion 239 DNA (0.075 @ 483 s)
NAVY 2-10 Flaming Cardboard 5 Ion 166 DNA (0.122 @ 457 s)
NAVY 2-10 Flaming Cardboard 7 Ion 228 DNA (0.122 @ 457 s)
NAVY 2-11 Flaming Cardboard 3 Ion 67 DNA (0.086 @ 546 s)
NAVY 2-11 Flaming Cardboard 5 Ion 93 DNA (0.074 @ 702 s)
NAVY 2-11 Flaming Cardboard 7 Ion 89 DNA (0.074 @ 702 s)
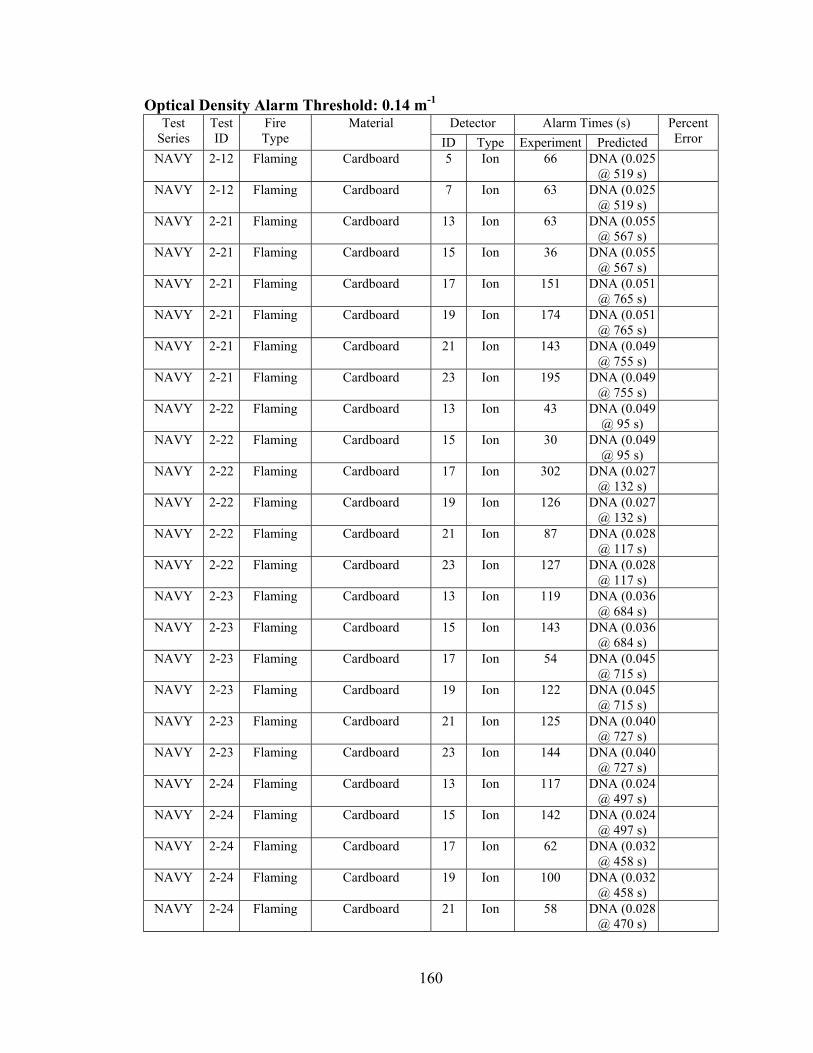
160
Optical Density Alarm Threshold: 0.14 m-1 Detector Alarm Times (s) Test
Series Test ID
Fire Type
Material ID Type Experiment Predicted
Percent Error
NAVY 2-12 Flaming Cardboard 5 Ion 66 DNA (0.025 @ 519 s)
NAVY 2-12 Flaming Cardboard 7 Ion 63 DNA (0.025 @ 519 s)
NAVY 2-21 Flaming Cardboard 13 Ion 63 DNA (0.055 @ 567 s)
NAVY 2-21 Flaming Cardboard 15 Ion 36 DNA (0.055 @ 567 s)
NAVY 2-21 Flaming Cardboard 17 Ion 151 DNA (0.051 @ 765 s)
NAVY 2-21 Flaming Cardboard 19 Ion 174 DNA (0.051 @ 765 s)
NAVY 2-21 Flaming Cardboard 21 Ion 143 DNA (0.049 @ 755 s)
NAVY 2-21 Flaming Cardboard 23 Ion 195 DNA (0.049 @ 755 s)
NAVY 2-22 Flaming Cardboard 13 Ion 43 DNA (0.049 @ 95 s)
NAVY 2-22 Flaming Cardboard 15 Ion 30 DNA (0.049 @ 95 s)
NAVY 2-22 Flaming Cardboard 17 Ion 302 DNA (0.027 @ 132 s)
NAVY 2-22 Flaming Cardboard 19 Ion 126 DNA (0.027 @ 132 s)
NAVY 2-22 Flaming Cardboard 21 Ion 87 DNA (0.028 @ 117 s)
NAVY 2-22 Flaming Cardboard 23 Ion 127 DNA (0.028 @ 117 s)
NAVY 2-23 Flaming Cardboard 13 Ion 119 DNA (0.036 @ 684 s)
NAVY 2-23 Flaming Cardboard 15 Ion 143 DNA (0.036 @ 684 s)
NAVY 2-23 Flaming Cardboard 17 Ion 54 DNA (0.045 @ 715 s)
NAVY 2-23 Flaming Cardboard 19 Ion 122 DNA (0.045 @ 715 s)
NAVY 2-23 Flaming Cardboard 21 Ion 125 DNA (0.040 @ 727 s)
NAVY 2-23 Flaming Cardboard 23 Ion 144 DNA (0.040 @ 727 s)
NAVY 2-24 Flaming Cardboard 13 Ion 117 DNA (0.024 @ 497 s)
NAVY 2-24 Flaming Cardboard 15 Ion 142 DNA (0.024 @ 497 s)
NAVY 2-24 Flaming Cardboard 17 Ion 62 DNA (0.032 @ 458 s)
NAVY 2-24 Flaming Cardboard 19 Ion 100 DNA (0.032 @ 458 s)
NAVY 2-24 Flaming Cardboard 21 Ion 58 DNA (0.028 @ 470 s)

161
Optical Density Alarm Threshold: 0.14 m-1 Detector Alarm Times (s) Test
Series Test ID
Fire Type
Material ID Type Experiment Predicted
Percent Error
NAVY 2-24 Flaming Cardboard 23 Ion 67 DNA (0.028 @ 470 s)
NAVY 1-37 Flaming Wood 2 Photo 901 1555 73% NAVY 1-37 Flaming Wood 4 Photo 1007 1555 54% NAVY 1-37 Flaming Wood 6 Photo 816 1558 91% NAVY 1-37 Flaming Wood 8 Photo 990 1558 57% NAVY 1-38 Flaming Wood 2 Photo 874 DNA (0.133
@ 1584 s)
NAVY 1-38 Flaming Wood 4 Photo 860 DNA (0.133 @ 1584 s)
NAVY 1-38 Flaming Wood 6 Photo 794 DNA (0.078 @ 1611 s)
NAVY 1-38 Flaming Wood 8 Photo 943 DNA (0.078 @ 1611 s)
NAVY 1-39 Flaming Wood 2 Photo 546 1468 169% NAVY 1-39 Flaming Wood 4 Photo 555 1468 165% NAVY 1-39 Flaming Wood 6 Photo 366 1509 312% NAVY 1-39 Flaming Wood 8 Photo 634 1509 138% NAVY 1-40 Flaming Wood 2 Photo 1036 1665 61% NAVY 1-40 Flaming Wood 4 Photo 886 1665 88% NAVY 1-40 Flaming Wood 6 Photo 956 1675 75% NAVY 1-40 Flaming Wood 8 Photo 1023 1675 64% NAVY 1-41 Flaming Wood 2 Photo 529 1285 143% NAVY 1-41 Flaming Wood 4 Photo 494 1285 160% NAVY 1-41 Flaming Wood 6 Photo 484 1277 164% NAVY 1-41 Flaming Wood 8 Photo 553 1277 131% NAVY 1-50 Flaming Wood 16 Photo 1149 DNA (0.120
@ 1155 s)
NAVY 1-50 Flaming Wood 20 Photo 1194 DNA (0.070 @ 1143 s)
NAVY 1-50 Flaming Wood 24 Photo 1149 DNA (0.086 @ 1158 s)
NAVY 1-51 Flaming Wood 14 Photo 54 1717 3080% NAVY 1-51 Flaming Wood 16 Photo 53 1717 3140% NAVY 1-51 Flaming Wood 18 Photo 612 DNA (0.137
@ 1771 s)
NAVY 1-51 Flaming Wood 20 Photo 82 DNA (0.137 @ 1771 s)
NAVY 1-51 Flaming Wood 22 Photo 518 1720 232% NAVY 1-52 Flaming Wood 14 Photo 38 DNA (0.054
@ 32 s)
NAVY 1-52 Flaming Wood 16 Photo 35 DNA (0.054 @ 32 s)
NAVY 1-52 Flaming Wood 18 Photo 49 DNA (0.062 @ 1469 s)
NAVY 1-52 Flaming Wood 20 Photo 40 DNA (0.062 @ 1469 s)
NAVY 1-53 Flaming Wood 14 Photo 662 DNA (0.111 @ 2218 s)

162
Optical Density Alarm Threshold: 0.14 m-1 Detector Alarm Times (s) Test
Series Test ID
Fire Type
Material ID Type Experiment Predicted
Percent Error
NAVY 1-53 Flaming Wood 16 Photo 768 DNA (0.111 @ 2218 s)
NAVY 1-53 Flaming Wood 18 Photo 841 DNA (0.112 @ 2216 s)
NAVY 1-53 Flaming Wood 20 Photo 689 DNA (0.112 @ 2216 s)
NAVY 1-53 Flaming Wood 22 Photo 680 DNA (0.122 @ 2204 s)
NAVY 1-53 Flaming Wood 24 Photo 906 DNA (0.122 @ 2204 s)
NAVY 1-54 Flaming Wood 14 Photo 51 46 -10% NAVY 1-54 Flaming Wood 16 Photo 45 46 2% NAVY 1-54 Flaming Wood 18 Photo 96 1437 1397% NAVY 1-54 Flaming Wood 20 Photo 49 1437 2833% NAVY 1-55 Flaming Wood 16 Photo 35 1329 3697% NAVY 1-55 Flaming Wood 18 Photo 55 1319 2298% NAVY 1-55 Flaming Wood 20 Photo 35 1319 3669% NAVY 2-09 Flaming Cardboard 2 Photo 480 DNA (0.052
@ 647 s)
NAVY 2-09 Flaming Cardboard 4 Photo 169 DNA (0.052 @ 647 s)
NAVY 2-09 Flaming Cardboard 6 Photo 129 DNA (0.078 @ 680 s)
NAVY 2-09 Flaming Cardboard 8 Photo 124 DNA (0.078 @ 680 s)
NAVY 2-10 Flaming Cardboard 2 Photo 643 DNA (0.075 @ 483 s)
NAVY 2-10 Flaming Cardboard 4 Photo 281 DNA (0.075 @ 483 s)
NAVY 2-10 Flaming Cardboard 6 Photo 592 DNA (0.122 @ 457 s)
NAVY 2-10 Flaming Cardboard 8 Photo 260 DNA (0.122 @ 457 s)
NAVY 2-11 Flaming Cardboard 2 Photo 76 DNA (0.086 @ 546 s)
NAVY 2-11 Flaming Cardboard 4 Photo 84 DNA (0.086 @ 546 s)
NAVY 2-11 Flaming Cardboard 6 Photo 110 DNA (0.074 @ 702 s)
NAVY 2-11 Flaming Cardboard 8 Photo 93 DNA (0.074 @ 702 s)
NAVY 2-12 Flaming Cardboard 6 Photo 115 DNA (0.025 @ 519 s)
NAVY 2-12 Flaming Cardboard 8 Photo 107 DNA (0.025 @ 519 s)
NAVY 2-21 Flaming Cardboard 14 Photo 164 DNA (0.055 @ 567 s)
NAVY 2-21 Flaming Cardboard 16 Photo 153 DNA (0.055 @ 567 s)

163
Optical Density Alarm Threshold: 0.14 m-1 Detector Alarm Times (s) Test
Series Test ID
Fire Type
Material ID Type Experiment Predicted
Percent Error
NAVY 2-21 Flaming Cardboard 18 Photo 498 DNA (0.051 @ 765 s)
NAVY 2-21 Flaming Cardboard 20 Photo 482 DNA (0.051 @ 765 s)
NAVY 2-21 Flaming Cardboard 22 Photo 477 DNA (0.049 @ 755 s)
NAVY 2-21 Flaming Cardboard 24 Photo 474 DNA (0.049 @ 755 s)
NAVY 2-22 Flaming Cardboard 14 Photo 83 DNA (0.049 @ 95 s)
NAVY 2-22 Flaming Cardboard 16 Photo 414 DNA (0.049 @ 95 s)
NAVY 2-22 Flaming Cardboard 18 Photo 479 DNA (0.027 @ 132 s)
NAVY 2-22 Flaming Cardboard 20 Photo 455 DNA (0.027 @ 132 s)
NAVY 2-22 Flaming Cardboard 22 Photo 118 DNA (0.028 @ 117 s)
NAVY 2-22 Flaming Cardboard 24 Photo 443 DNA (0.028 @ 117 s)
NAVY 2-23 Flaming Cardboard 14 Photo 151 DNA (0.036 @ 684 s)
NAVY 2-23 Flaming Cardboard 16 Photo 139 DNA (0.036 @ 684 s)
NAVY 2-23 Flaming Cardboard 18 Photo 97 DNA (0.045 @ 715 s)
NAVY 2-23 Flaming Cardboard 20 Photo 310 DNA (0.045 @ 715 s)
NAVY 2-23 Flaming Cardboard 22 Photo 173 DNA (0.040 @ 727 s)
NAVY 2-23 Flaming Cardboard 24 Photo 139 DNA (0.040 @ 727 s)
NAVY 2-24 Flaming Cardboard 14 Photo 139 DNA (0.024 @ 497 s)
NAVY 2-24 Flaming Cardboard 18 Photo 89 DNA (0.032 @ 458 s)
NAVY 2-24 Flaming Cardboard 20 Photo 417 DNA (0.032 @ 458 s)
NAVY 2-24 Flaming Cardboard 22 Photo 128 DNA (0.028 @ 470 s)
NAVY 2-24 Flaming Cardboard 24 Photo 413 DNA (0.028 @ 470 s)
NAVY 2-25 Smoldering Potassium Chlorate / Lactose
15 Ion 222 DNA (0.037 @ 124 s)
NAVY 2-25 Smoldering Potassium Chlorate / Lactose
19 Ion 306 DNA (0.023 @ 217 s)
NAVY 2-27 Smoldering Potassium Chlorate / Lactose
19 Ion 152 DNA (0.112 @ 62 s)
NAVY 2-27 Smoldering Potassium Chlorate / Lactose
23 Ion 69 DNA (0.055 @ 125 s)
NAVY 2-34 Smoldering Electrical Cable 19 Ion 840 227 -73%

164
Optical Density Alarm Threshold: 0.14 m-1 Detector Alarm Times (s) Test
Series Test ID
Fire Type
Material ID Type Experiment Predicted
Percent Error
NAVY 2-36 Smoldering Electrical Cable 19 Ion 1490 1342 -10% NAVY 2-37 Smoldering Electrical Cable 19 Ion 393 348 -11% NAVY 2-26 Smoldering Potassium Chlorate /
Lactose 15 Ion 196 DNA (0.044
@ 82 s)
NAVY 2-26 Smoldering Potassium Chlorate / Lactose
19 Ion 234 DNA (0.086 @ 51 s)
NAVY 2-28 Smoldering Potassium Chlorate / Lactose
19 Ion 444 DNA (0.089 @ 80 s)
NAVY 2-28 Smoldering Potassium Chlorate / Lactose
23 Ion 40 DNA (0.033 @ 160 s)
NAVY 2-38 Smoldering Electrical Cable 19 Ion 768 DNA (0.048 @ 704 s)
NAVY 2-38 Smoldering Electrical Cable 23 Ion 730 DNA (0.031 @ 791 s)
NAVY 2-40 Smoldering Electrical Cable 15 Ion 983 481 -51% NAVY 2-01 Smoldering Electrical Cable 1 Ion 2029 1987 -2% NAVY 2-01 Smoldering Electrical Cable 5 Ion 2138 2050 -4% NAVY 2-04 Smoldering Electrical Cable 5 Ion 1057 486 -54% NAVY 2-07 Smoldering Electrical Cable 1 Ion 831 1275 53% NAVY 2-07 Smoldering Electrical Cable 5 Ion 1365 897 -34% NAVY 2-13 Smoldering Potassium Chlorate /
Lactose 5 Ion 536 DNA (0.077
@ 527 s)
NAVY 2-14 Smoldering Potassium Chlorate / Lactose
1 Ion 18 13 -28%
NAVY 2-14 Smoldering Potassium Chlorate / Lactose
5 Ion 98 DNA (0.059 @ 53 s)
NAVY 2-25 Smoldering Potassium Chlorate / Lactose
13 Ion 100 DNA (0.037 @ 124 s)
NAVY 2-25 Smoldering Potassium Chlorate / Lactose
17 Ion 126 DNA (0.023 @ 217 s)
NAVY 2-25 Smoldering Potassium Chlorate / Lactose
21 Ion 205 DNA (0.091 @ 78 s)
NAVY 2-27 Smoldering Potassium Chlorate / Lactose
13 Ion 257 DNA (0.011 @ 99 s)
NAVY 2-27 Smoldering Potassium Chlorate / Lactose
17 Ion 74 DNA (0.112 @ 62 s)
NAVY 2-27 Smoldering Potassium Chlorate / Lactose
21 Ion 66 DNA (0.055 @ 125 s)
NAVY 2-34 Smoldering Electrical Cable 17 Ion 659 227 -66% NAVY 2-36 Smoldering Electrical Cable 17 Ion 1354 1342 -1% NAVY 2-37 Smoldering Electrical Cable 13 Ion 678 DNA (0.121
@ 708 s)
NAVY 2-37 Smoldering Electrical Cable 17 Ion 335 348 4% NAVY 2-37 Smoldering Electrical Cable 21 Ion 566 575 2% NAVY 2-39 Smoldering Electrical Cable 13 Ion 760 279 -63% NAVY 2-05 Smoldering Electrical Cable 1 Ion 1695 1947 15% NAVY 2-05 Smoldering Electrical Cable 5 Ion 643 397 -38% NAVY 2-08 Smoldering Electrical Cable 1 Ion 1372 DNA (0.117
@ 1616 s)

165
Optical Density Alarm Threshold: 0.14 m-1 Detector Alarm Times (s) Test
Series Test ID
Fire Type
Material ID Type Experiment Predicted
Percent Error
NAVY 2-08 Smoldering Electrical Cable 5 Ion 1391 1603 15% NAVY 2-15 Smoldering Potassium Chlorate /
Lactose 1 Ion 19 DNA (0.109
@ 57 s)
NAVY 2-15 Smoldering Potassium Chlorate / Lactose
5 Ion 70 DNA (0.047 @ 99 s)
NAVY 2-26 Smoldering Potassium Chlorate / Lactose
13 Ion 64 DNA (0.044 @ 82 s)
NAVY 2-26 Smoldering Potassium Chlorate / Lactose
17 Ion 53 DNA (0.086 @ 51 s)
NAVY 2-26 Smoldering Potassium Chlorate / Lactose
21 Ion 145 19 -87%
NAVY 2-28 Smoldering Potassium Chlorate / Lactose
13 Ion 192 DNA (0.039 @ 134 s)
NAVY 2-28 Smoldering Potassium Chlorate / Lactose
17 Ion 122 DNA (0.089 @ 80 s)
NAVY 2-28 Smoldering Potassium Chlorate / Lactose
21 Ion 38 DNA (0.033 @ 160 s)
NAVY 2-35 Smoldering Electrical Cable 17 Ion 922 363 -61% NAVY 2-35 Smoldering Electrical Cable 21 Ion 1408 1532 9% NAVY 2-38 Smoldering Electrical Cable 13 Ion 767 DNA (0.039
@ 745 s)
NAVY 2-38 Smoldering Electrical Cable 17 Ion 771 DNA (0.048 @ 704 s)
NAVY 2-38 Smoldering Electrical Cable 21 Ion 561 DNA (0.031 @ 791 s)
NAVY 2-40 Smoldering Electrical Cable 13 Ion 448 481 7% NAVY 2-01 Smoldering Electrical Cable 2 Photo 2034 1987 -2% NAVY 2-01 Smoldering Electrical Cable 4 Photo 2232 1987 -11% NAVY 2-01 Smoldering Electrical Cable 8 Photo 2232 2050 -8% NAVY 2-04 Smoldering Electrical Cable 2 Photo 1713 1017 -41% NAVY 2-04 Smoldering Electrical Cable 6 Photo 796 486 -39% NAVY 2-07 Smoldering Electrical Cable 4 Photo 936 1275 36% NAVY 2-07 Smoldering Electrical Cable 6 Photo 908 897 -1% NAVY 2-13 Smoldering Potassium Chlorate /
Lactose 2 Photo 578 DNA (0.078
@ 527 s)
NAVY 2-13 Smoldering Potassium Chlorate / Lactose
4 Photo 572 DNA (0.078 @ 527 s)
NAVY 2-13 Smoldering Potassium Chlorate / Lactose
6 Photo 524 DNA (0.077 @ 527 s)
NAVY 2-13 Smoldering Potassium Chlorate / Lactose
8 Photo 710 DNA (0.077 @ 527 s)
NAVY 2-14 Smoldering Potassium Chlorate / Lactose
2 Photo 20 13 -35%
NAVY 2-14 Smoldering Potassium Chlorate / Lactose
4 Photo 33 13 -61%
NAVY 2-25 Smoldering Potassium Chlorate / Lactose
14 Photo 94 DNA (0.037 @ 124 s)
NAVY 2-25 Smoldering Potassium Chlorate / Lactose
16 Photo 105 DNA (0.037 @ 124 s)
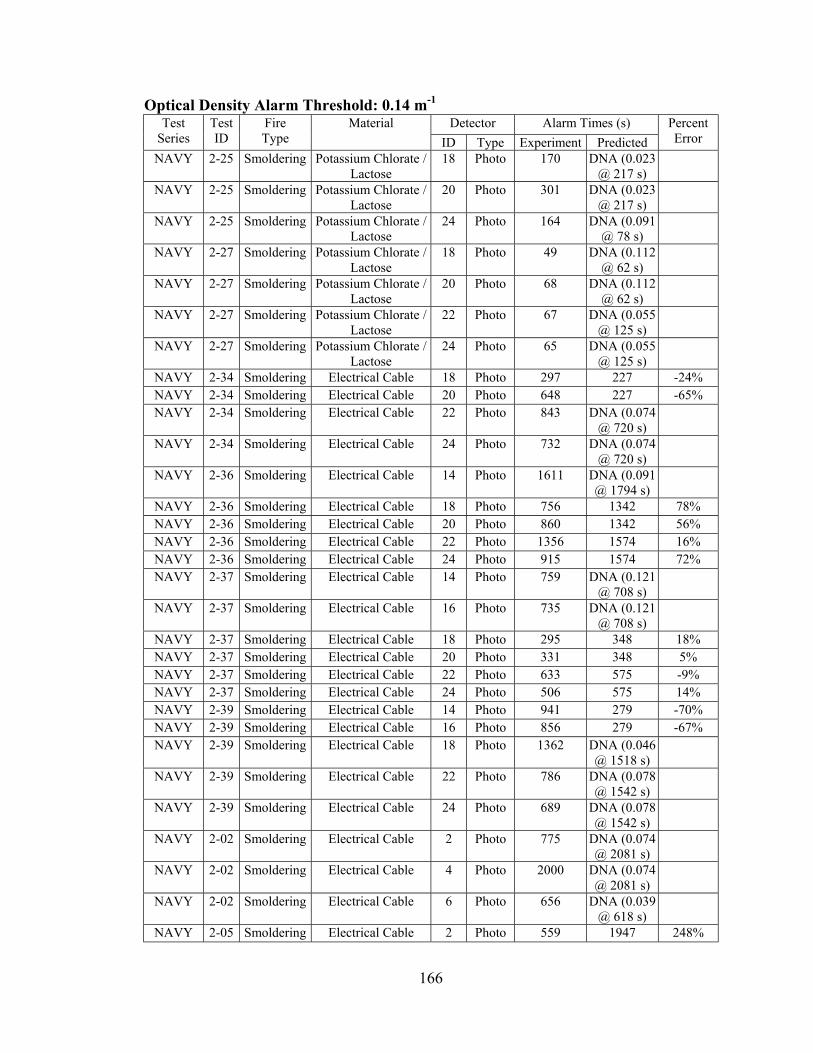
166
Optical Density Alarm Threshold: 0.14 m-1 Detector Alarm Times (s) Test
Series Test ID
Fire Type
Material ID Type Experiment Predicted
Percent Error
NAVY 2-25 Smoldering Potassium Chlorate / Lactose
18 Photo 170 DNA (0.023 @ 217 s)
NAVY 2-25 Smoldering Potassium Chlorate / Lactose
20 Photo 301 DNA (0.023 @ 217 s)
NAVY 2-25 Smoldering Potassium Chlorate / Lactose
24 Photo 164 DNA (0.091 @ 78 s)
NAVY 2-27 Smoldering Potassium Chlorate / Lactose
18 Photo 49 DNA (0.112 @ 62 s)
NAVY 2-27 Smoldering Potassium Chlorate / Lactose
20 Photo 68 DNA (0.112 @ 62 s)
NAVY 2-27 Smoldering Potassium Chlorate / Lactose
22 Photo 67 DNA (0.055 @ 125 s)
NAVY 2-27 Smoldering Potassium Chlorate / Lactose
24 Photo 65 DNA (0.055 @ 125 s)
NAVY 2-34 Smoldering Electrical Cable 18 Photo 297 227 -24% NAVY 2-34 Smoldering Electrical Cable 20 Photo 648 227 -65% NAVY 2-34 Smoldering Electrical Cable 22 Photo 843 DNA (0.074
@ 720 s)
NAVY 2-34 Smoldering Electrical Cable 24 Photo 732 DNA (0.074 @ 720 s)
NAVY 2-36 Smoldering Electrical Cable 14 Photo 1611 DNA (0.091 @ 1794 s)
NAVY 2-36 Smoldering Electrical Cable 18 Photo 756 1342 78% NAVY 2-36 Smoldering Electrical Cable 20 Photo 860 1342 56% NAVY 2-36 Smoldering Electrical Cable 22 Photo 1356 1574 16% NAVY 2-36 Smoldering Electrical Cable 24 Photo 915 1574 72% NAVY 2-37 Smoldering Electrical Cable 14 Photo 759 DNA (0.121
@ 708 s)
NAVY 2-37 Smoldering Electrical Cable 16 Photo 735 DNA (0.121 @ 708 s)
NAVY 2-37 Smoldering Electrical Cable 18 Photo 295 348 18% NAVY 2-37 Smoldering Electrical Cable 20 Photo 331 348 5% NAVY 2-37 Smoldering Electrical Cable 22 Photo 633 575 -9% NAVY 2-37 Smoldering Electrical Cable 24 Photo 506 575 14% NAVY 2-39 Smoldering Electrical Cable 14 Photo 941 279 -70% NAVY 2-39 Smoldering Electrical Cable 16 Photo 856 279 -67% NAVY 2-39 Smoldering Electrical Cable 18 Photo 1362 DNA (0.046
@ 1518 s)
NAVY 2-39 Smoldering Electrical Cable 22 Photo 786 DNA (0.078 @ 1542 s)
NAVY 2-39 Smoldering Electrical Cable 24 Photo 689 DNA (0.078 @ 1542 s)
NAVY 2-02 Smoldering Electrical Cable 2 Photo 775 DNA (0.074 @ 2081 s)
NAVY 2-02 Smoldering Electrical Cable 4 Photo 2000 DNA (0.074 @ 2081 s)
NAVY 2-02 Smoldering Electrical Cable 6 Photo 656 DNA (0.039 @ 618 s)
NAVY 2-05 Smoldering Electrical Cable 2 Photo 559 1947 248%
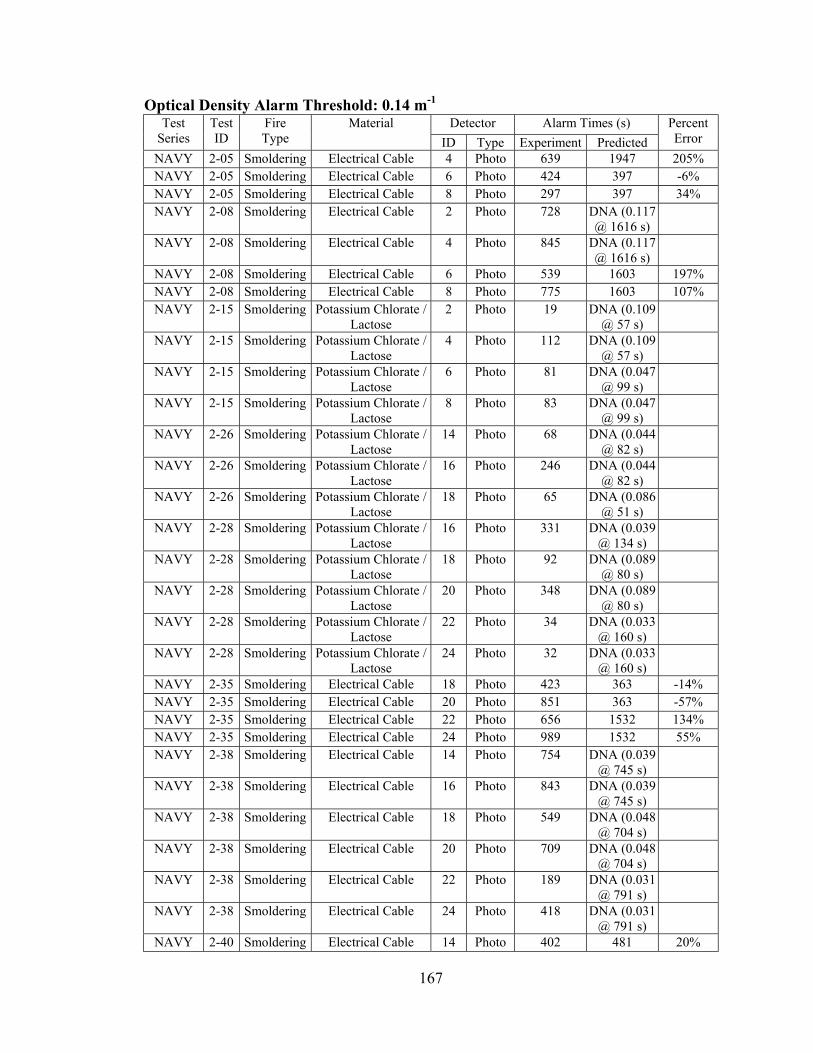
167
Optical Density Alarm Threshold: 0.14 m-1 Detector Alarm Times (s) Test
Series Test ID
Fire Type
Material ID Type Experiment Predicted
Percent Error
NAVY 2-05 Smoldering Electrical Cable 4 Photo 639 1947 205% NAVY 2-05 Smoldering Electrical Cable 6 Photo 424 397 -6% NAVY 2-05 Smoldering Electrical Cable 8 Photo 297 397 34% NAVY 2-08 Smoldering Electrical Cable 2 Photo 728 DNA (0.117
@ 1616 s)
NAVY 2-08 Smoldering Electrical Cable 4 Photo 845 DNA (0.117 @ 1616 s)
NAVY 2-08 Smoldering Electrical Cable 6 Photo 539 1603 197% NAVY 2-08 Smoldering Electrical Cable 8 Photo 775 1603 107% NAVY 2-15 Smoldering Potassium Chlorate /
Lactose 2 Photo 19 DNA (0.109
@ 57 s)
NAVY 2-15 Smoldering Potassium Chlorate / Lactose
4 Photo 112 DNA (0.109 @ 57 s)
NAVY 2-15 Smoldering Potassium Chlorate / Lactose
6 Photo 81 DNA (0.047 @ 99 s)
NAVY 2-15 Smoldering Potassium Chlorate / Lactose
8 Photo 83 DNA (0.047 @ 99 s)
NAVY 2-26 Smoldering Potassium Chlorate / Lactose
14 Photo 68 DNA (0.044 @ 82 s)
NAVY 2-26 Smoldering Potassium Chlorate / Lactose
16 Photo 246 DNA (0.044 @ 82 s)
NAVY 2-26 Smoldering Potassium Chlorate / Lactose
18 Photo 65 DNA (0.086 @ 51 s)
NAVY 2-28 Smoldering Potassium Chlorate / Lactose
16 Photo 331 DNA (0.039 @ 134 s)
NAVY 2-28 Smoldering Potassium Chlorate / Lactose
18 Photo 92 DNA (0.089 @ 80 s)
NAVY 2-28 Smoldering Potassium Chlorate / Lactose
20 Photo 348 DNA (0.089 @ 80 s)
NAVY 2-28 Smoldering Potassium Chlorate / Lactose
22 Photo 34 DNA (0.033 @ 160 s)
NAVY 2-28 Smoldering Potassium Chlorate / Lactose
24 Photo 32 DNA (0.033 @ 160 s)
NAVY 2-35 Smoldering Electrical Cable 18 Photo 423 363 -14% NAVY 2-35 Smoldering Electrical Cable 20 Photo 851 363 -57% NAVY 2-35 Smoldering Electrical Cable 22 Photo 656 1532 134% NAVY 2-35 Smoldering Electrical Cable 24 Photo 989 1532 55% NAVY 2-38 Smoldering Electrical Cable 14 Photo 754 DNA (0.039
@ 745 s)
NAVY 2-38 Smoldering Electrical Cable 16 Photo 843 DNA (0.039 @ 745 s)
NAVY 2-38 Smoldering Electrical Cable 18 Photo 549 DNA (0.048 @ 704 s)
NAVY 2-38 Smoldering Electrical Cable 20 Photo 709 DNA (0.048 @ 704 s)
NAVY 2-38 Smoldering Electrical Cable 22 Photo 189 DNA (0.031 @ 791 s)
NAVY 2-38 Smoldering Electrical Cable 24 Photo 418 DNA (0.031 @ 791 s)
NAVY 2-40 Smoldering Electrical Cable 14 Photo 402 481 20%
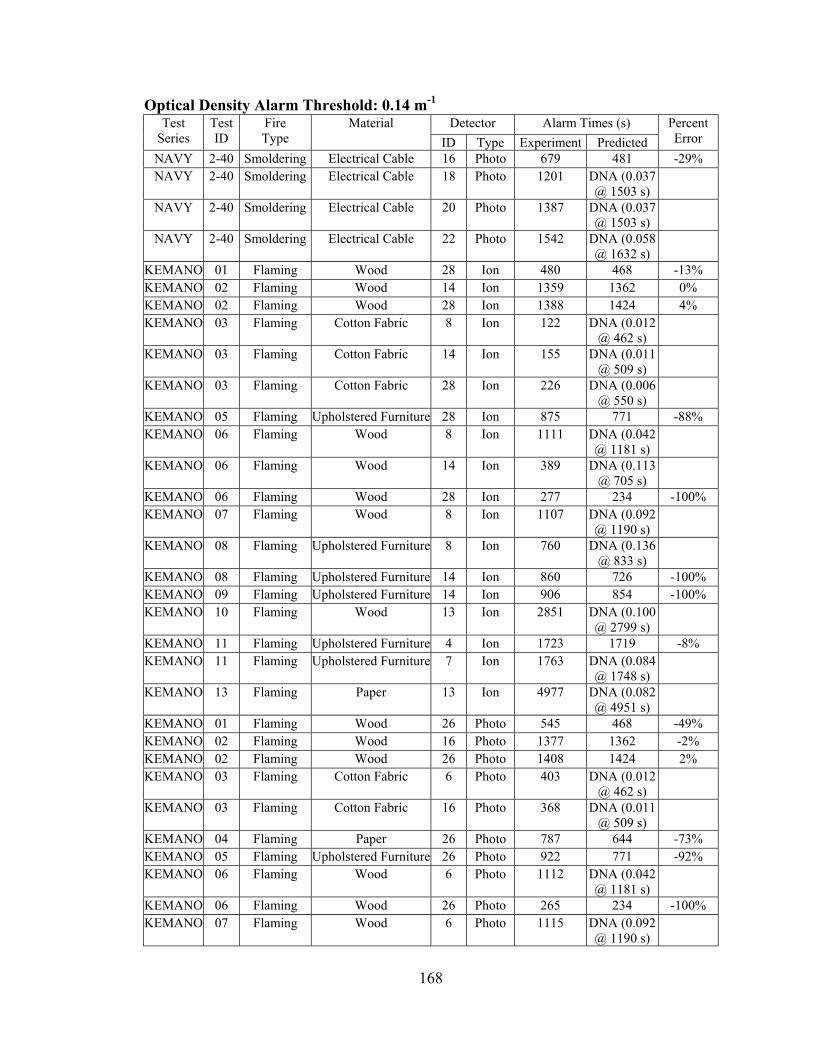
168
Optical Density Alarm Threshold: 0.14 m-1 Detector Alarm Times (s) Test
Series Test ID
Fire Type
Material ID Type Experiment Predicted
Percent Error
NAVY 2-40 Smoldering Electrical Cable 16 Photo 679 481 -29% NAVY 2-40 Smoldering Electrical Cable 18 Photo 1201 DNA (0.037
@ 1503 s)
NAVY 2-40 Smoldering Electrical Cable 20 Photo 1387 DNA (0.037 @ 1503 s)
NAVY 2-40 Smoldering Electrical Cable 22 Photo 1542 DNA (0.058 @ 1632 s)
KEMANO 01 Flaming Wood 28 Ion 480 468 -13% KEMANO 02 Flaming Wood 14 Ion 1359 1362 0% KEMANO 02 Flaming Wood 28 Ion 1388 1424 4% KEMANO 03 Flaming Cotton Fabric 8 Ion 122 DNA (0.012
@ 462 s)
KEMANO 03 Flaming Cotton Fabric 14 Ion 155 DNA (0.011 @ 509 s)
KEMANO 03 Flaming Cotton Fabric 28 Ion 226 DNA (0.006 @ 550 s)
KEMANO 05 Flaming Upholstered Furniture 28 Ion 875 771 -88% KEMANO 06 Flaming Wood 8 Ion 1111 DNA (0.042
@ 1181 s)
KEMANO 06 Flaming Wood 14 Ion 389 DNA (0.113 @ 705 s)
KEMANO 06 Flaming Wood 28 Ion 277 234 -100% KEMANO 07 Flaming Wood 8 Ion 1107 DNA (0.092
@ 1190 s)
KEMANO 08 Flaming Upholstered Furniture 8 Ion 760 DNA (0.136 @ 833 s)
KEMANO 08 Flaming Upholstered Furniture 14 Ion 860 726 -100% KEMANO 09 Flaming Upholstered Furniture 14 Ion 906 854 -100% KEMANO 10 Flaming Wood 13 Ion 2851 DNA (0.100
@ 2799 s)
KEMANO 11 Flaming Upholstered Furniture 4 Ion 1723 1719 -8% KEMANO 11 Flaming Upholstered Furniture 7 Ion 1763 DNA (0.084
@ 1748 s)
KEMANO 13 Flaming Paper 13 Ion 4977 DNA (0.082 @ 4951 s)
KEMANO 01 Flaming Wood 26 Photo 545 468 -49% KEMANO 02 Flaming Wood 16 Photo 1377 1362 -2% KEMANO 02 Flaming Wood 26 Photo 1408 1424 2% KEMANO 03 Flaming Cotton Fabric 6 Photo 403 DNA (0.012
@ 462 s)
KEMANO 03 Flaming Cotton Fabric 16 Photo 368 DNA (0.011 @ 509 s)
KEMANO 04 Flaming Paper 26 Photo 787 644 -73% KEMANO 05 Flaming Upholstered Furniture 26 Photo 922 771 -92% KEMANO 06 Flaming Wood 6 Photo 1112 DNA (0.042
@ 1181 s)
KEMANO 06 Flaming Wood 26 Photo 265 234 -100% KEMANO 07 Flaming Wood 6 Photo 1115 DNA (0.092
@ 1190 s)
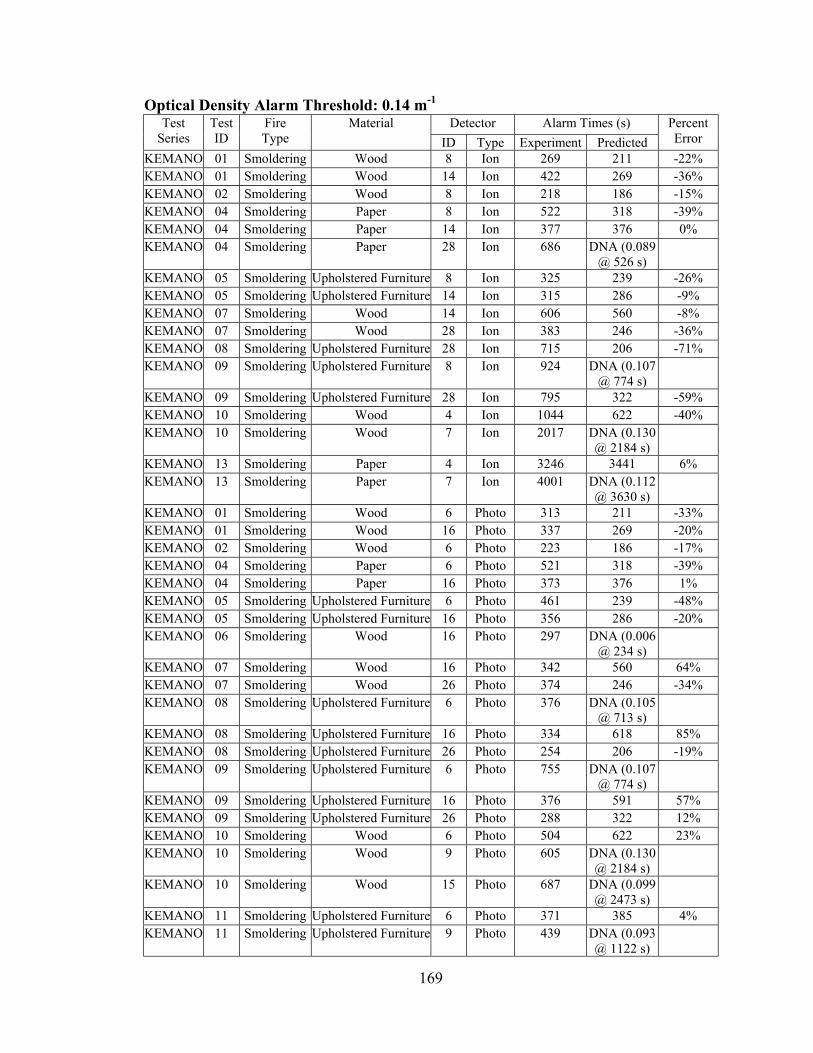
169
Optical Density Alarm Threshold: 0.14 m-1 Detector Alarm Times (s) Test
Series Test ID
Fire Type
Material ID Type Experiment Predicted
Percent Error
KEMANO 01 Smoldering Wood 8 Ion 269 211 -22% KEMANO 01 Smoldering Wood 14 Ion 422 269 -36% KEMANO 02 Smoldering Wood 8 Ion 218 186 -15% KEMANO 04 Smoldering Paper 8 Ion 522 318 -39% KEMANO 04 Smoldering Paper 14 Ion 377 376 0% KEMANO 04 Smoldering Paper 28 Ion 686 DNA (0.089
@ 526 s)
KEMANO 05 Smoldering Upholstered Furniture 8 Ion 325 239 -26% KEMANO 05 Smoldering Upholstered Furniture 14 Ion 315 286 -9% KEMANO 07 Smoldering Wood 14 Ion 606 560 -8% KEMANO 07 Smoldering Wood 28 Ion 383 246 -36% KEMANO 08 Smoldering Upholstered Furniture 28 Ion 715 206 -71% KEMANO 09 Smoldering Upholstered Furniture 8 Ion 924 DNA (0.107
@ 774 s)
KEMANO 09 Smoldering Upholstered Furniture 28 Ion 795 322 -59% KEMANO 10 Smoldering Wood 4 Ion 1044 622 -40% KEMANO 10 Smoldering Wood 7 Ion 2017 DNA (0.130
@ 2184 s)
KEMANO 13 Smoldering Paper 4 Ion 3246 3441 6% KEMANO 13 Smoldering Paper 7 Ion 4001 DNA (0.112
@ 3630 s)
KEMANO 01 Smoldering Wood 6 Photo 313 211 -33% KEMANO 01 Smoldering Wood 16 Photo 337 269 -20% KEMANO 02 Smoldering Wood 6 Photo 223 186 -17% KEMANO 04 Smoldering Paper 6 Photo 521 318 -39% KEMANO 04 Smoldering Paper 16 Photo 373 376 1% KEMANO 05 Smoldering Upholstered Furniture 6 Photo 461 239 -48% KEMANO 05 Smoldering Upholstered Furniture 16 Photo 356 286 -20% KEMANO 06 Smoldering Wood 16 Photo 297 DNA (0.006
@ 234 s)
KEMANO 07 Smoldering Wood 16 Photo 342 560 64% KEMANO 07 Smoldering Wood 26 Photo 374 246 -34% KEMANO 08 Smoldering Upholstered Furniture 6 Photo 376 DNA (0.105
@ 713 s)
KEMANO 08 Smoldering Upholstered Furniture 16 Photo 334 618 85% KEMANO 08 Smoldering Upholstered Furniture 26 Photo 254 206 -19% KEMANO 09 Smoldering Upholstered Furniture 6 Photo 755 DNA (0.107
@ 774 s)
KEMANO 09 Smoldering Upholstered Furniture 16 Photo 376 591 57% KEMANO 09 Smoldering Upholstered Furniture 26 Photo 288 322 12% KEMANO 10 Smoldering Wood 6 Photo 504 622 23% KEMANO 10 Smoldering Wood 9 Photo 605 DNA (0.130
@ 2184 s)
KEMANO 10 Smoldering Wood 15 Photo 687 DNA (0.099 @ 2473 s)
KEMANO 11 Smoldering Upholstered Furniture 6 Photo 371 385 4% KEMANO 11 Smoldering Upholstered Furniture 9 Photo 439 DNA (0.093
@ 1122 s)

170
Optical Density Alarm Threshold: 0.14 m-1 Detector Alarm Times (s) Test
Series Test ID
Fire Type
Material ID Type Experiment Predicted
Percent Error
KEMANO 11 Smoldering Upholstered Furniture 15 Photo 580 DNA (0.068 @ 1152 s)
KEMANO 13 Smoldering Paper 6 Photo 479 3441 618% KEMANO 13 Smoldering Paper 9 Photo 658 DNA (0.112
@ 3630 s)
KEMANO 13 Smoldering Paper 15 Photo 725 DNA (0.087 @ 4497 s)

171
Optical Density Alarm Threshold: 20% Threshold; Navy tests (see Table 12) Detector Alarm Times (s) Test
ID Fire Type
Material ID Type Experiment Predicted
Percent Error
1-37 Flaming Wood 1 Ion 61 25 -59% 1-37 Flaming Wood 3 Ion 177 25 -86% 1-37 Flaming Wood 5 Ion 45 417 827% 1-37 Flaming Wood 7 Ion 174 417 140% 1-38 Flaming Wood 1 Ion 62 25 -60% 1-38 Flaming Wood 3 Ion 155 25 -84% 1-38 Flaming Wood 5 Ion 65 481 640% 1-38 Flaming Wood 7 Ion 182 481 164% 1-39 Flaming Wood 1 Ion 69 12 -83% 1-39 Flaming Wood 3 Ion 43 12 -72% 1-39 Flaming Wood 5 Ion 39 21 -46% 1-39 Flaming Wood 7 Ion 134 21 -84% 1-40 Flaming Wood 1 Ion 43 28 -35% 1-40 Flaming Wood 3 Ion 123 28 -77% 1-40 Flaming Wood 5 Ion 39 19 -51% 1-40 Flaming Wood 7 Ion 57 19 -67% 1-41 Flaming Wood 1 Ion 69 33 -52% 1-41 Flaming Wood 3 Ion 152 33 -78% 1-41 Flaming Wood 5 Ion 46 30 -35% 1-41 Flaming Wood 7 Ion 124 30 -76% 1-50 Flaming Wood 13 Ion 48 708 1375% 1-50 Flaming Wood 15 Ion 65 708 989% 1-50 Flaming Wood 17 Ion 75 774 932% 1-50 Flaming Wood 19 Ion 128 774 505% 1-50 Flaming Wood 21 Ion 112 571 410% 1-50 Flaming Wood 23 Ion 161 571 255% 1-51 Flaming Wood 13 Ion 44 31 -30% 1-51 Flaming Wood 15 Ion 90 31 -66% 1-51 Flaming Wood 17 Ion 79 37 -53% 1-51 Flaming Wood 19 Ion 182 37 -80% 1-51 Flaming Wood 21 Ion 99 25 -75% 1-51 Flaming Wood 23 Ion 89 25 -72% 1-52 Flaming Wood 13 Ion 38 28 -26% 1-52 Flaming Wood 15 Ion 65 28 -57% 1-52 Flaming Wood 19 Ion 73 25 -66% 1-52 Flaming Wood 21 Ion 84 17 -80% 1-52 Flaming Wood 23 Ion 177 17 -90% 1-53 Flaming Wood 13 Ion 42 32 -24% 1-53 Flaming Wood 15 Ion 101 32 -68% 1-53 Flaming Wood 17 Ion 123 48 -61% 1-53 Flaming Wood 19 Ion 126 48 -62%

172
Optical Density Alarm Threshold: 20% Threshold; Navy tests (see Table 12) Detector Alarm Times (s) Test
ID Fire Type
Material ID Type Experiment Predicted
Percent Error
1-53 Flaming Wood 21 Ion 95 23 -76% 1-53 Flaming Wood 23 Ion 164 23 -86% 1-54 Flaming Wood 13 Ion 50 34 -32% 1-54 Flaming Wood 15 Ion 66 34 -48% 1-54 Flaming Wood 17 Ion 75 40 -47% 1-54 Flaming Wood 19 Ion 116 40 -66% 1-55 Flaming Wood 13 Ion 36 28 -22% 1-55 Flaming Wood 15 Ion 68 28 -59% 1-55 Flaming Wood 17 Ion 53 17 -68% 1-55 Flaming Wood 19 Ion 43 17 -60% 2-09 Flaming Cardboard 1 Ion 162 152 -6% 2-09 Flaming Cardboard 3 Ion 165 152 -8% 2-09 Flaming Cardboard 5 Ion 86 104 21% 2-09 Flaming Cardboard 7 Ion 100 104 4% 2-10 Flaming Cardboard 1 Ion 229 96 -58% 2-10 Flaming Cardboard 3 Ion 239 96 -60% 2-10 Flaming Cardboard 5 Ion 166 68 -59% 2-10 Flaming Cardboard 7 Ion 228 68 -70% 2-11 Flaming Cardboard 3 Ion 67 52 -22% 2-11 Flaming Cardboard 5 Ion 93 81 -13% 2-11 Flaming Cardboard 7 Ion 89 81 -9% 2-12 Flaming Cardboard 5 Ion 66 87 32% 2-12 Flaming Cardboard 7 Ion 63 87 38% 2-21 Flaming Cardboard 13 Ion 63 118 87% 2-21 Flaming Cardboard 15 Ion 36 118 228% 2-21 Flaming Cardboard 17 Ion 151 160 6% 2-21 Flaming Cardboard 19 Ion 174 160 -8% 2-21 Flaming Cardboard 21 Ion 143 172 20% 2-21 Flaming Cardboard 23 Ion 195 172 -12% 2-22 Flaming Cardboard 13 Ion 43 59 37% 2-22 Flaming Cardboard 15 Ion 30 59 97% 2-22 Flaming Cardboard 17 Ion 302 101 -67% 2-22 Flaming Cardboard 19 Ion 126 101 -20% 2-22 Flaming Cardboard 21 Ion 87 89 2% 2-22 Flaming Cardboard 23 Ion 127 89 -30% 2-23 Flaming Cardboard 13 Ion 119 126 6% 2-23 Flaming Cardboard 15 Ion 143 126 -12% 2-23 Flaming Cardboard 17 Ion 54 71 31% 2-23 Flaming Cardboard 19 Ion 122 71 -42% 2-23 Flaming Cardboard 21 Ion 125 93 -26% 2-23 Flaming Cardboard 23 Ion 144 93 -35% 2-24 Flaming Cardboard 13 Ion 117 115 -2% 2-24 Flaming Cardboard 15 Ion 142 115 -19%
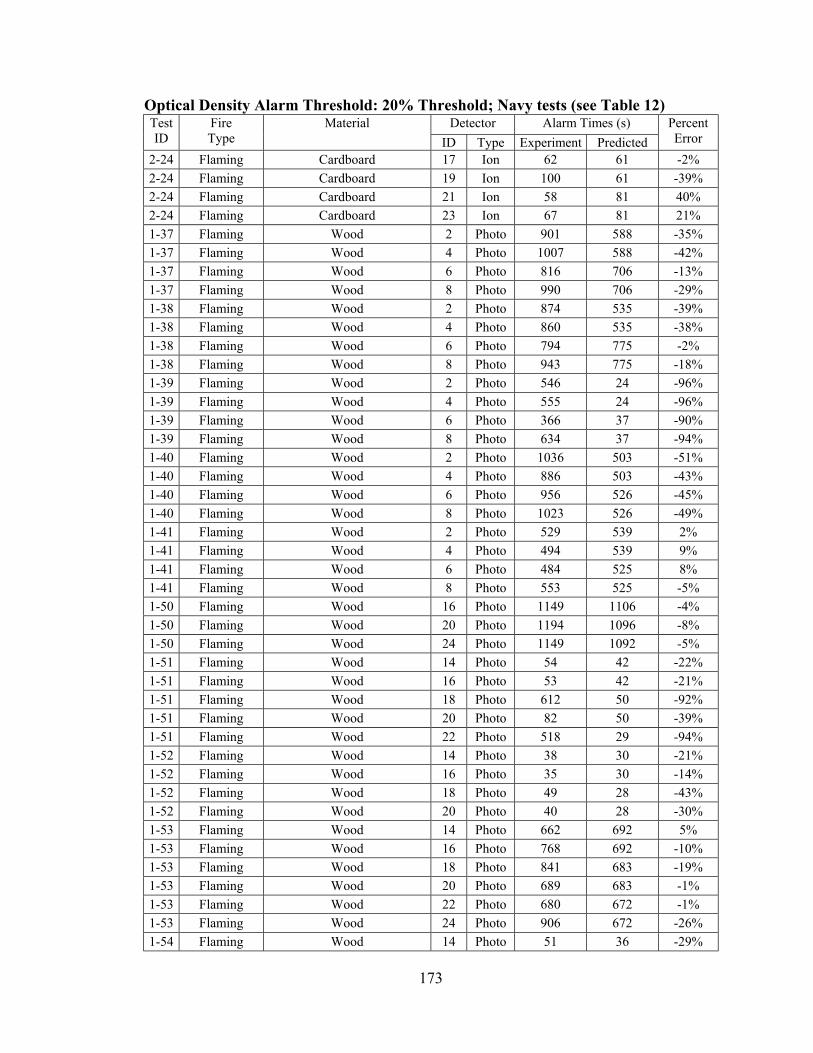
173
Optical Density Alarm Threshold: 20% Threshold; Navy tests (see Table 12) Detector Alarm Times (s) Test
ID Fire Type
Material ID Type Experiment Predicted
Percent Error
2-24 Flaming Cardboard 17 Ion 62 61 -2% 2-24 Flaming Cardboard 19 Ion 100 61 -39% 2-24 Flaming Cardboard 21 Ion 58 81 40% 2-24 Flaming Cardboard 23 Ion 67 81 21% 1-37 Flaming Wood 2 Photo 901 588 -35% 1-37 Flaming Wood 4 Photo 1007 588 -42% 1-37 Flaming Wood 6 Photo 816 706 -13% 1-37 Flaming Wood 8 Photo 990 706 -29% 1-38 Flaming Wood 2 Photo 874 535 -39% 1-38 Flaming Wood 4 Photo 860 535 -38% 1-38 Flaming Wood 6 Photo 794 775 -2% 1-38 Flaming Wood 8 Photo 943 775 -18% 1-39 Flaming Wood 2 Photo 546 24 -96% 1-39 Flaming Wood 4 Photo 555 24 -96% 1-39 Flaming Wood 6 Photo 366 37 -90% 1-39 Flaming Wood 8 Photo 634 37 -94% 1-40 Flaming Wood 2 Photo 1036 503 -51% 1-40 Flaming Wood 4 Photo 886 503 -43% 1-40 Flaming Wood 6 Photo 956 526 -45% 1-40 Flaming Wood 8 Photo 1023 526 -49% 1-41 Flaming Wood 2 Photo 529 539 2% 1-41 Flaming Wood 4 Photo 494 539 9% 1-41 Flaming Wood 6 Photo 484 525 8% 1-41 Flaming Wood 8 Photo 553 525 -5% 1-50 Flaming Wood 16 Photo 1149 1106 -4% 1-50 Flaming Wood 20 Photo 1194 1096 -8% 1-50 Flaming Wood 24 Photo 1149 1092 -5% 1-51 Flaming Wood 14 Photo 54 42 -22% 1-51 Flaming Wood 16 Photo 53 42 -21% 1-51 Flaming Wood 18 Photo 612 50 -92% 1-51 Flaming Wood 20 Photo 82 50 -39% 1-51 Flaming Wood 22 Photo 518 29 -94% 1-52 Flaming Wood 14 Photo 38 30 -21% 1-52 Flaming Wood 16 Photo 35 30 -14% 1-52 Flaming Wood 18 Photo 49 28 -43% 1-52 Flaming Wood 20 Photo 40 28 -30% 1-53 Flaming Wood 14 Photo 662 692 5% 1-53 Flaming Wood 16 Photo 768 692 -10% 1-53 Flaming Wood 18 Photo 841 683 -19% 1-53 Flaming Wood 20 Photo 689 683 -1% 1-53 Flaming Wood 22 Photo 680 672 -1% 1-53 Flaming Wood 24 Photo 906 672 -26% 1-54 Flaming Wood 14 Photo 51 36 -29%
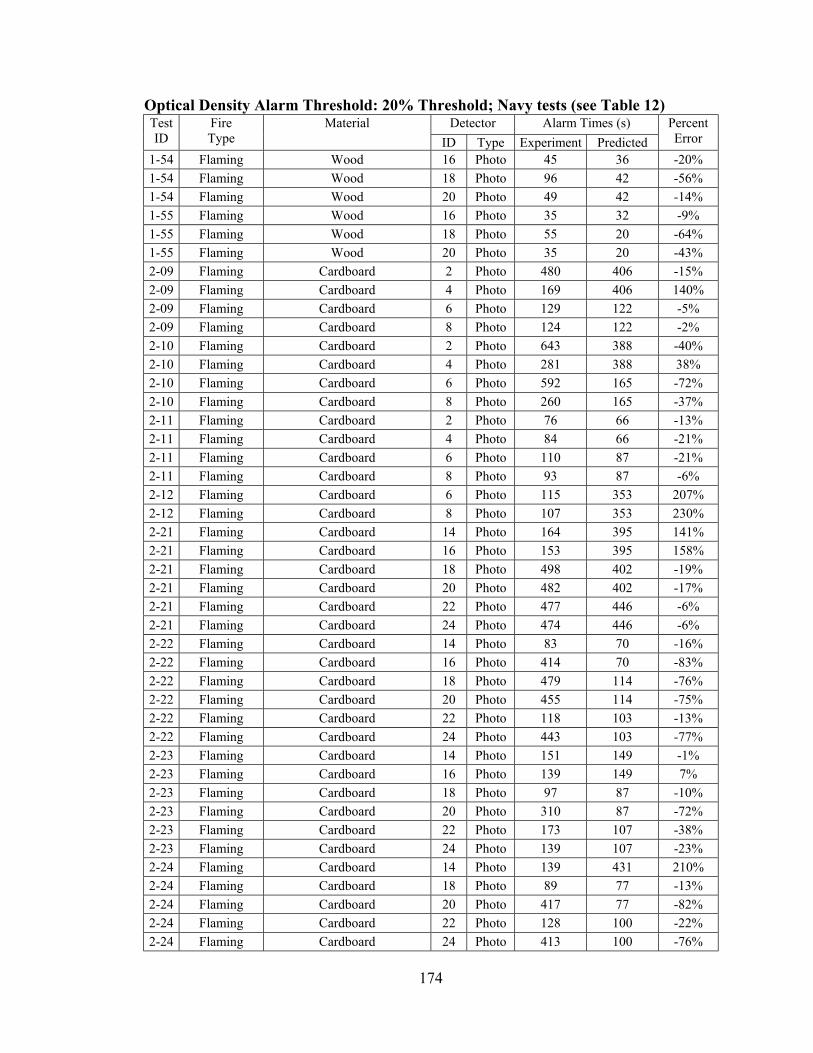
174
Optical Density Alarm Threshold: 20% Threshold; Navy tests (see Table 12) Detector Alarm Times (s) Test
ID Fire Type
Material ID Type Experiment Predicted
Percent Error
1-54 Flaming Wood 16 Photo 45 36 -20% 1-54 Flaming Wood 18 Photo 96 42 -56% 1-54 Flaming Wood 20 Photo 49 42 -14% 1-55 Flaming Wood 16 Photo 35 32 -9% 1-55 Flaming Wood 18 Photo 55 20 -64% 1-55 Flaming Wood 20 Photo 35 20 -43% 2-09 Flaming Cardboard 2 Photo 480 406 -15% 2-09 Flaming Cardboard 4 Photo 169 406 140% 2-09 Flaming Cardboard 6 Photo 129 122 -5% 2-09 Flaming Cardboard 8 Photo 124 122 -2% 2-10 Flaming Cardboard 2 Photo 643 388 -40% 2-10 Flaming Cardboard 4 Photo 281 388 38% 2-10 Flaming Cardboard 6 Photo 592 165 -72% 2-10 Flaming Cardboard 8 Photo 260 165 -37% 2-11 Flaming Cardboard 2 Photo 76 66 -13% 2-11 Flaming Cardboard 4 Photo 84 66 -21% 2-11 Flaming Cardboard 6 Photo 110 87 -21% 2-11 Flaming Cardboard 8 Photo 93 87 -6% 2-12 Flaming Cardboard 6 Photo 115 353 207% 2-12 Flaming Cardboard 8 Photo 107 353 230% 2-21 Flaming Cardboard 14 Photo 164 395 141% 2-21 Flaming Cardboard 16 Photo 153 395 158% 2-21 Flaming Cardboard 18 Photo 498 402 -19% 2-21 Flaming Cardboard 20 Photo 482 402 -17% 2-21 Flaming Cardboard 22 Photo 477 446 -6% 2-21 Flaming Cardboard 24 Photo 474 446 -6% 2-22 Flaming Cardboard 14 Photo 83 70 -16% 2-22 Flaming Cardboard 16 Photo 414 70 -83% 2-22 Flaming Cardboard 18 Photo 479 114 -76% 2-22 Flaming Cardboard 20 Photo 455 114 -75% 2-22 Flaming Cardboard 22 Photo 118 103 -13% 2-22 Flaming Cardboard 24 Photo 443 103 -77% 2-23 Flaming Cardboard 14 Photo 151 149 -1% 2-23 Flaming Cardboard 16 Photo 139 149 7% 2-23 Flaming Cardboard 18 Photo 97 87 -10% 2-23 Flaming Cardboard 20 Photo 310 87 -72% 2-23 Flaming Cardboard 22 Photo 173 107 -38% 2-23 Flaming Cardboard 24 Photo 139 107 -23% 2-24 Flaming Cardboard 14 Photo 139 431 210% 2-24 Flaming Cardboard 18 Photo 89 77 -13% 2-24 Flaming Cardboard 20 Photo 417 77 -82% 2-24 Flaming Cardboard 22 Photo 128 100 -22% 2-24 Flaming Cardboard 24 Photo 413 100 -76%
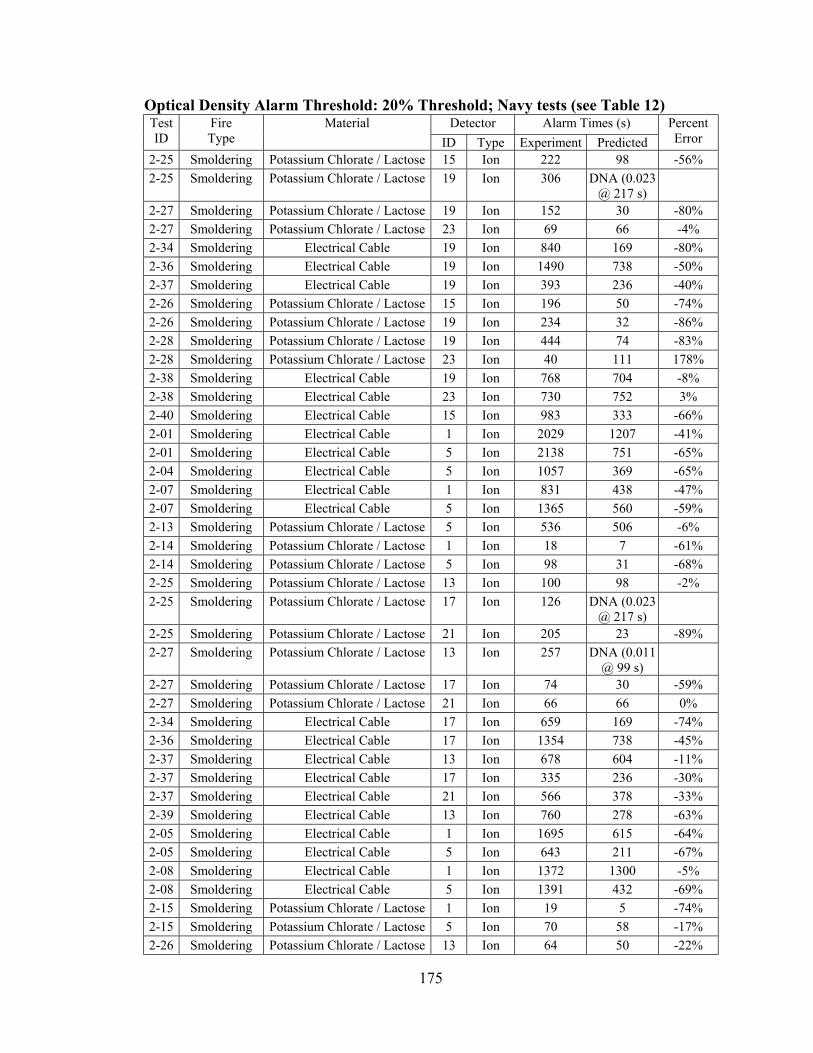
175
Optical Density Alarm Threshold: 20% Threshold; Navy tests (see Table 12) Detector Alarm Times (s) Test
ID Fire Type
Material ID Type Experiment Predicted
Percent Error
2-25 Smoldering Potassium Chlorate / Lactose 15 Ion 222 98 -56% 2-25 Smoldering Potassium Chlorate / Lactose 19 Ion 306 DNA (0.023
@ 217 s)
2-27 Smoldering Potassium Chlorate / Lactose 19 Ion 152 30 -80% 2-27 Smoldering Potassium Chlorate / Lactose 23 Ion 69 66 -4% 2-34 Smoldering Electrical Cable 19 Ion 840 169 -80% 2-36 Smoldering Electrical Cable 19 Ion 1490 738 -50% 2-37 Smoldering Electrical Cable 19 Ion 393 236 -40% 2-26 Smoldering Potassium Chlorate / Lactose 15 Ion 196 50 -74% 2-26 Smoldering Potassium Chlorate / Lactose 19 Ion 234 32 -86% 2-28 Smoldering Potassium Chlorate / Lactose 19 Ion 444 74 -83% 2-28 Smoldering Potassium Chlorate / Lactose 23 Ion 40 111 178% 2-38 Smoldering Electrical Cable 19 Ion 768 704 -8% 2-38 Smoldering Electrical Cable 23 Ion 730 752 3% 2-40 Smoldering Electrical Cable 15 Ion 983 333 -66% 2-01 Smoldering Electrical Cable 1 Ion 2029 1207 -41% 2-01 Smoldering Electrical Cable 5 Ion 2138 751 -65% 2-04 Smoldering Electrical Cable 5 Ion 1057 369 -65% 2-07 Smoldering Electrical Cable 1 Ion 831 438 -47% 2-07 Smoldering Electrical Cable 5 Ion 1365 560 -59% 2-13 Smoldering Potassium Chlorate / Lactose 5 Ion 536 506 -6% 2-14 Smoldering Potassium Chlorate / Lactose 1 Ion 18 7 -61% 2-14 Smoldering Potassium Chlorate / Lactose 5 Ion 98 31 -68% 2-25 Smoldering Potassium Chlorate / Lactose 13 Ion 100 98 -2% 2-25 Smoldering Potassium Chlorate / Lactose 17 Ion 126 DNA (0.023
@ 217 s)
2-25 Smoldering Potassium Chlorate / Lactose 21 Ion 205 23 -89% 2-27 Smoldering Potassium Chlorate / Lactose 13 Ion 257 DNA (0.011
@ 99 s)
2-27 Smoldering Potassium Chlorate / Lactose 17 Ion 74 30 -59% 2-27 Smoldering Potassium Chlorate / Lactose 21 Ion 66 66 0% 2-34 Smoldering Electrical Cable 17 Ion 659 169 -74% 2-36 Smoldering Electrical Cable 17 Ion 1354 738 -45% 2-37 Smoldering Electrical Cable 13 Ion 678 604 -11% 2-37 Smoldering Electrical Cable 17 Ion 335 236 -30% 2-37 Smoldering Electrical Cable 21 Ion 566 378 -33% 2-39 Smoldering Electrical Cable 13 Ion 760 278 -63% 2-05 Smoldering Electrical Cable 1 Ion 1695 615 -64% 2-05 Smoldering Electrical Cable 5 Ion 643 211 -67% 2-08 Smoldering Electrical Cable 1 Ion 1372 1300 -5% 2-08 Smoldering Electrical Cable 5 Ion 1391 432 -69% 2-15 Smoldering Potassium Chlorate / Lactose 1 Ion 19 5 -74% 2-15 Smoldering Potassium Chlorate / Lactose 5 Ion 70 58 -17% 2-26 Smoldering Potassium Chlorate / Lactose 13 Ion 64 50 -22%
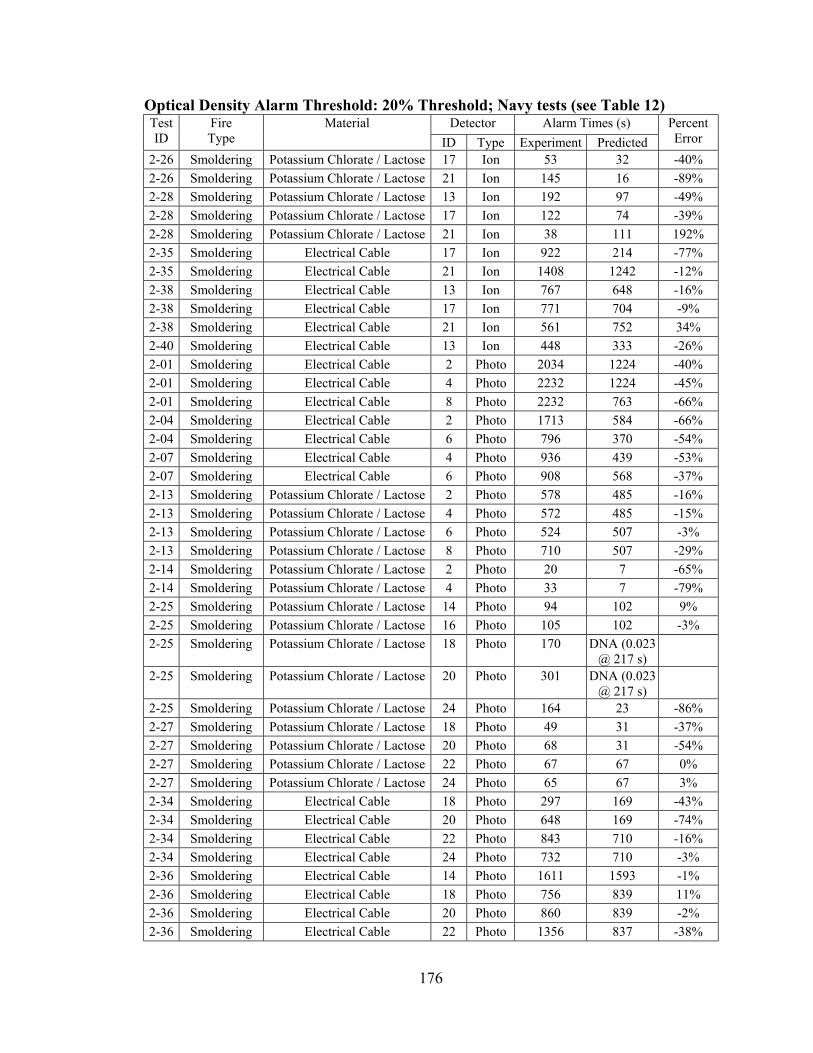
176
Optical Density Alarm Threshold: 20% Threshold; Navy tests (see Table 12) Detector Alarm Times (s) Test
ID Fire Type
Material ID Type Experiment Predicted
Percent Error
2-26 Smoldering Potassium Chlorate / Lactose 17 Ion 53 32 -40% 2-26 Smoldering Potassium Chlorate / Lactose 21 Ion 145 16 -89% 2-28 Smoldering Potassium Chlorate / Lactose 13 Ion 192 97 -49% 2-28 Smoldering Potassium Chlorate / Lactose 17 Ion 122 74 -39% 2-28 Smoldering Potassium Chlorate / Lactose 21 Ion 38 111 192% 2-35 Smoldering Electrical Cable 17 Ion 922 214 -77% 2-35 Smoldering Electrical Cable 21 Ion 1408 1242 -12% 2-38 Smoldering Electrical Cable 13 Ion 767 648 -16% 2-38 Smoldering Electrical Cable 17 Ion 771 704 -9% 2-38 Smoldering Electrical Cable 21 Ion 561 752 34% 2-40 Smoldering Electrical Cable 13 Ion 448 333 -26% 2-01 Smoldering Electrical Cable 2 Photo 2034 1224 -40% 2-01 Smoldering Electrical Cable 4 Photo 2232 1224 -45% 2-01 Smoldering Electrical Cable 8 Photo 2232 763 -66% 2-04 Smoldering Electrical Cable 2 Photo 1713 584 -66% 2-04 Smoldering Electrical Cable 6 Photo 796 370 -54% 2-07 Smoldering Electrical Cable 4 Photo 936 439 -53% 2-07 Smoldering Electrical Cable 6 Photo 908 568 -37% 2-13 Smoldering Potassium Chlorate / Lactose 2 Photo 578 485 -16% 2-13 Smoldering Potassium Chlorate / Lactose 4 Photo 572 485 -15% 2-13 Smoldering Potassium Chlorate / Lactose 6 Photo 524 507 -3% 2-13 Smoldering Potassium Chlorate / Lactose 8 Photo 710 507 -29% 2-14 Smoldering Potassium Chlorate / Lactose 2 Photo 20 7 -65% 2-14 Smoldering Potassium Chlorate / Lactose 4 Photo 33 7 -79% 2-25 Smoldering Potassium Chlorate / Lactose 14 Photo 94 102 9% 2-25 Smoldering Potassium Chlorate / Lactose 16 Photo 105 102 -3% 2-25 Smoldering Potassium Chlorate / Lactose 18 Photo 170 DNA (0.023
@ 217 s)
2-25 Smoldering Potassium Chlorate / Lactose 20 Photo 301 DNA (0.023 @ 217 s)
2-25 Smoldering Potassium Chlorate / Lactose 24 Photo 164 23 -86% 2-27 Smoldering Potassium Chlorate / Lactose 18 Photo 49 31 -37% 2-27 Smoldering Potassium Chlorate / Lactose 20 Photo 68 31 -54% 2-27 Smoldering Potassium Chlorate / Lactose 22 Photo 67 67 0% 2-27 Smoldering Potassium Chlorate / Lactose 24 Photo 65 67 3% 2-34 Smoldering Electrical Cable 18 Photo 297 169 -43% 2-34 Smoldering Electrical Cable 20 Photo 648 169 -74% 2-34 Smoldering Electrical Cable 22 Photo 843 710 -16% 2-34 Smoldering Electrical Cable 24 Photo 732 710 -3% 2-36 Smoldering Electrical Cable 14 Photo 1611 1593 -1% 2-36 Smoldering Electrical Cable 18 Photo 756 839 11% 2-36 Smoldering Electrical Cable 20 Photo 860 839 -2% 2-36 Smoldering Electrical Cable 22 Photo 1356 837 -38%
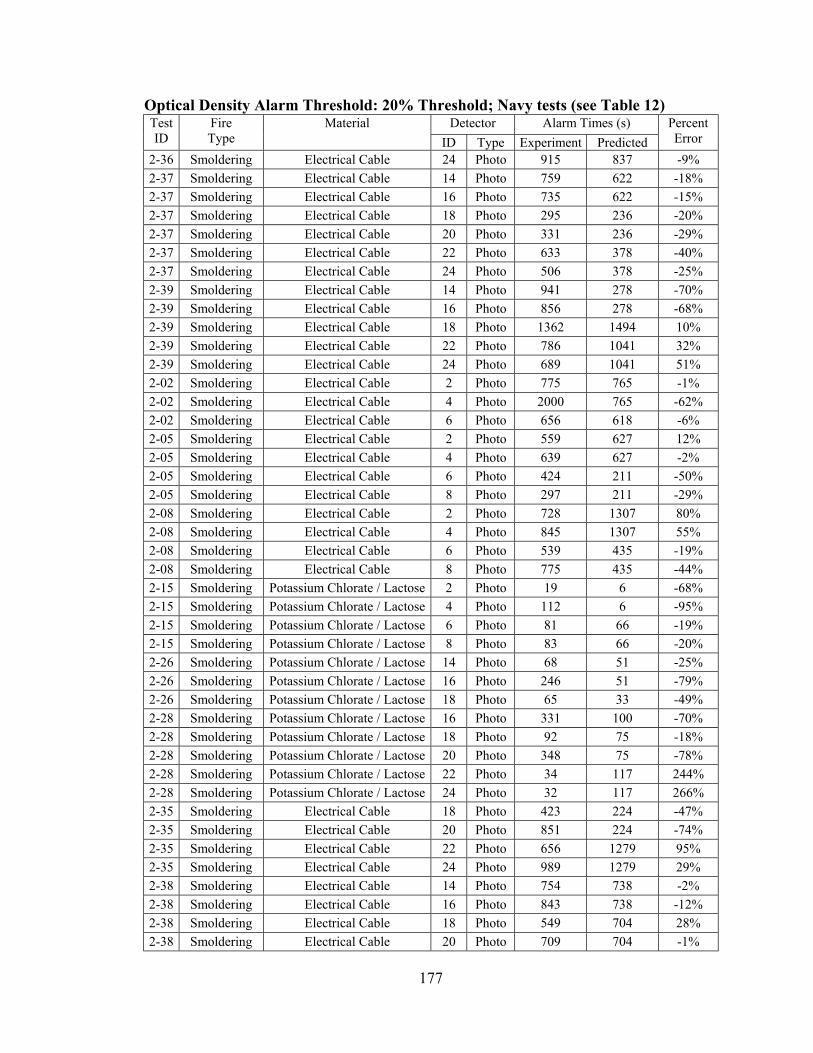
177
Optical Density Alarm Threshold: 20% Threshold; Navy tests (see Table 12) Detector Alarm Times (s) Test
ID Fire Type
Material ID Type Experiment Predicted
Percent Error
2-36 Smoldering Electrical Cable 24 Photo 915 837 -9% 2-37 Smoldering Electrical Cable 14 Photo 759 622 -18% 2-37 Smoldering Electrical Cable 16 Photo 735 622 -15% 2-37 Smoldering Electrical Cable 18 Photo 295 236 -20% 2-37 Smoldering Electrical Cable 20 Photo 331 236 -29% 2-37 Smoldering Electrical Cable 22 Photo 633 378 -40% 2-37 Smoldering Electrical Cable 24 Photo 506 378 -25% 2-39 Smoldering Electrical Cable 14 Photo 941 278 -70% 2-39 Smoldering Electrical Cable 16 Photo 856 278 -68% 2-39 Smoldering Electrical Cable 18 Photo 1362 1494 10% 2-39 Smoldering Electrical Cable 22 Photo 786 1041 32% 2-39 Smoldering Electrical Cable 24 Photo 689 1041 51% 2-02 Smoldering Electrical Cable 2 Photo 775 765 -1% 2-02 Smoldering Electrical Cable 4 Photo 2000 765 -62% 2-02 Smoldering Electrical Cable 6 Photo 656 618 -6% 2-05 Smoldering Electrical Cable 2 Photo 559 627 12% 2-05 Smoldering Electrical Cable 4 Photo 639 627 -2% 2-05 Smoldering Electrical Cable 6 Photo 424 211 -50% 2-05 Smoldering Electrical Cable 8 Photo 297 211 -29% 2-08 Smoldering Electrical Cable 2 Photo 728 1307 80% 2-08 Smoldering Electrical Cable 4 Photo 845 1307 55% 2-08 Smoldering Electrical Cable 6 Photo 539 435 -19% 2-08 Smoldering Electrical Cable 8 Photo 775 435 -44% 2-15 Smoldering Potassium Chlorate / Lactose 2 Photo 19 6 -68% 2-15 Smoldering Potassium Chlorate / Lactose 4 Photo 112 6 -95% 2-15 Smoldering Potassium Chlorate / Lactose 6 Photo 81 66 -19% 2-15 Smoldering Potassium Chlorate / Lactose 8 Photo 83 66 -20% 2-26 Smoldering Potassium Chlorate / Lactose 14 Photo 68 51 -25% 2-26 Smoldering Potassium Chlorate / Lactose 16 Photo 246 51 -79% 2-26 Smoldering Potassium Chlorate / Lactose 18 Photo 65 33 -49% 2-28 Smoldering Potassium Chlorate / Lactose 16 Photo 331 100 -70% 2-28 Smoldering Potassium Chlorate / Lactose 18 Photo 92 75 -18% 2-28 Smoldering Potassium Chlorate / Lactose 20 Photo 348 75 -78% 2-28 Smoldering Potassium Chlorate / Lactose 22 Photo 34 117 244% 2-28 Smoldering Potassium Chlorate / Lactose 24 Photo 32 117 266% 2-35 Smoldering Electrical Cable 18 Photo 423 224 -47% 2-35 Smoldering Electrical Cable 20 Photo 851 224 -74% 2-35 Smoldering Electrical Cable 22 Photo 656 1279 95% 2-35 Smoldering Electrical Cable 24 Photo 989 1279 29% 2-38 Smoldering Electrical Cable 14 Photo 754 738 -2% 2-38 Smoldering Electrical Cable 16 Photo 843 738 -12% 2-38 Smoldering Electrical Cable 18 Photo 549 704 28% 2-38 Smoldering Electrical Cable 20 Photo 709 704 -1%

178
Optical Density Alarm Threshold: 20% Threshold; Navy tests (see Table 12) Detector Alarm Times (s) Test
ID Fire Type
Material ID Type Experiment Predicted
Percent Error
2-38 Smoldering Electrical Cable 22 Photo 189 765 305% 2-38 Smoldering Electrical Cable 24 Photo 418 765 83% 2-40 Smoldering Electrical Cable 14 Photo 402 334 -17% 2-40 Smoldering Electrical Cable 16 Photo 679 334 -51% 2-40 Smoldering Electrical Cable 18 Photo 1201 1488 24% 2-40 Smoldering Electrical Cable 20 Photo 1387 1488 7% 2-40 Smoldering Electrical Cable 22 Photo 1542 1182 -23%

179
Optical Density Alarm Threshold: 50% Threshold; Navy tests (see Table 12) Detector Alarm Times (s) Test
ID Fire Type
Material ID Type Experiment Predicted
Percent Error
1-37 Flaming Wood 1 Ion 61 614 907% 1-37 Flaming Wood 3 Ion 177 614 247% 1-37 Flaming Wood 5 Ion 45 720 1500% 1-37 Flaming Wood 7 Ion 174 720 314% 1-38 Flaming Wood 1 Ion 62 547 782% 1-38 Flaming Wood 3 Ion 155 547 253% 1-38 Flaming Wood 5 Ion 65 793 1120% 1-38 Flaming Wood 7 Ion 182 793 336% 1-39 Flaming Wood 1 Ion 69 24 -65% 1-39 Flaming Wood 3 Ion 43 24 -44% 1-39 Flaming Wood 5 Ion 39 39 0% 1-39 Flaming Wood 7 Ion 134 39 -71% 1-40 Flaming Wood 1 Ion 43 503 1070% 1-40 Flaming Wood 3 Ion 123 503 309% 1-40 Flaming Wood 5 Ion 39 548 1305% 1-40 Flaming Wood 7 Ion 57 548 861% 1-41 Flaming Wood 1 Ion 69 546 691% 1-41 Flaming Wood 3 Ion 152 546 259% 1-41 Flaming Wood 5 Ion 46 530 1052% 1-41 Flaming Wood 7 Ion 124 530 327% 1-50 Flaming Wood 13 Ion 48 1106 2204% 1-50 Flaming Wood 15 Ion 65 1106 1602% 1-50 Flaming Wood 17 Ion 75 1096 1361% 1-50 Flaming Wood 19 Ion 128 1096 756% 1-50 Flaming Wood 21 Ion 112 1092 875% 1-50 Flaming Wood 23 Ion 161 1092 578% 1-51 Flaming Wood 13 Ion 44 42 -5% 1-51 Flaming Wood 15 Ion 90 42 -53% 1-51 Flaming Wood 17 Ion 79 50 -37% 1-51 Flaming Wood 19 Ion 182 50 -73% 1-51 Flaming Wood 21 Ion 99 29 -71% 1-51 Flaming Wood 23 Ion 89 29 -67% 1-52 Flaming Wood 13 Ion 38 30 -21% 1-52 Flaming Wood 15 Ion 65 30 -54% 1-52 Flaming Wood 19 Ion 73 28 -62% 1-52 Flaming Wood 21 Ion 84 20 -76% 1-52 Flaming Wood 23 Ion 177 20 -89% 1-53 Flaming Wood 13 Ion 42 738 1657% 1-53 Flaming Wood 15 Ion 101 738 631% 1-53 Flaming Wood 17 Ion 123 733 496% 1-53 Flaming Wood 19 Ion 126 733 482% 1-53 Flaming Wood 21 Ion 95 672 607%

180
Optical Density Alarm Threshold: 50% Threshold; Navy tests (see Table 12) Detector Alarm Times (s) Test
ID Fire Type
Material ID Type Experiment Predicted
Percent Error
1-53 Flaming Wood 23 Ion 164 672 310% 1-54 Flaming Wood 13 Ion 50 36 -28% 1-54 Flaming Wood 15 Ion 66 36 -45% 1-54 Flaming Wood 17 Ion 75 43 -43% 1-54 Flaming Wood 19 Ion 116 43 -63% 1-55 Flaming Wood 13 Ion 36 32 -11% 1-55 Flaming Wood 15 Ion 68 32 -53% 1-55 Flaming Wood 17 Ion 53 20 -62% 1-55 Flaming Wood 19 Ion 43 20 -53% 2-09 Flaming Cardboard 1 Ion 162 416 157% 2-09 Flaming Cardboard 3 Ion 165 416 152% 2-09 Flaming Cardboard 5 Ion 86 124 44% 2-09 Flaming Cardboard 7 Ion 100 124 24% 2-10 Flaming Cardboard 1 Ion 229 390 70% 2-10 Flaming Cardboard 3 Ion 239 390 63% 2-10 Flaming Cardboard 5 Ion 166 165 -1% 2-10 Flaming Cardboard 7 Ion 228 165 -28% 2-11 Flaming Cardboard 3 Ion 67 66 -1% 2-11 Flaming Cardboard 5 Ion 93 88 -5% 2-11 Flaming Cardboard 7 Ion 89 88 -1% 2-12 Flaming Cardboard 5 Ion 66 371 462% 2-12 Flaming Cardboard 7 Ion 63 371 489% 2-21 Flaming Cardboard 13 Ion 63 428 579% 2-21 Flaming Cardboard 15 Ion 36 428 1089% 2-21 Flaming Cardboard 17 Ion 151 414 174% 2-21 Flaming Cardboard 19 Ion 174 414 138% 2-21 Flaming Cardboard 21 Ion 143 453 217% 2-21 Flaming Cardboard 23 Ion 195 453 132% 2-22 Flaming Cardboard 13 Ion 43 71 65% 2-22 Flaming Cardboard 15 Ion 30 71 137% 2-22 Flaming Cardboard 17 Ion 302 116 -62% 2-22 Flaming Cardboard 19 Ion 126 116 -8% 2-22 Flaming Cardboard 21 Ion 87 104 20% 2-22 Flaming Cardboard 23 Ion 127 104 -18% 2-23 Flaming Cardboard 13 Ion 119 151 27% 2-23 Flaming Cardboard 15 Ion 143 151 6% 2-23 Flaming Cardboard 17 Ion 54 87 61% 2-23 Flaming Cardboard 19 Ion 122 87 -29% 2-23 Flaming Cardboard 21 Ion 125 110 -12% 2-23 Flaming Cardboard 23 Ion 144 110 -24% 2-24 Flaming Cardboard 13 Ion 117 434 271% 2-24 Flaming Cardboard 15 Ion 142 434 206% 2-24 Flaming Cardboard 17 Ion 62 78 26% 2-24 Flaming Cardboard 19 Ion 100 78 -22%
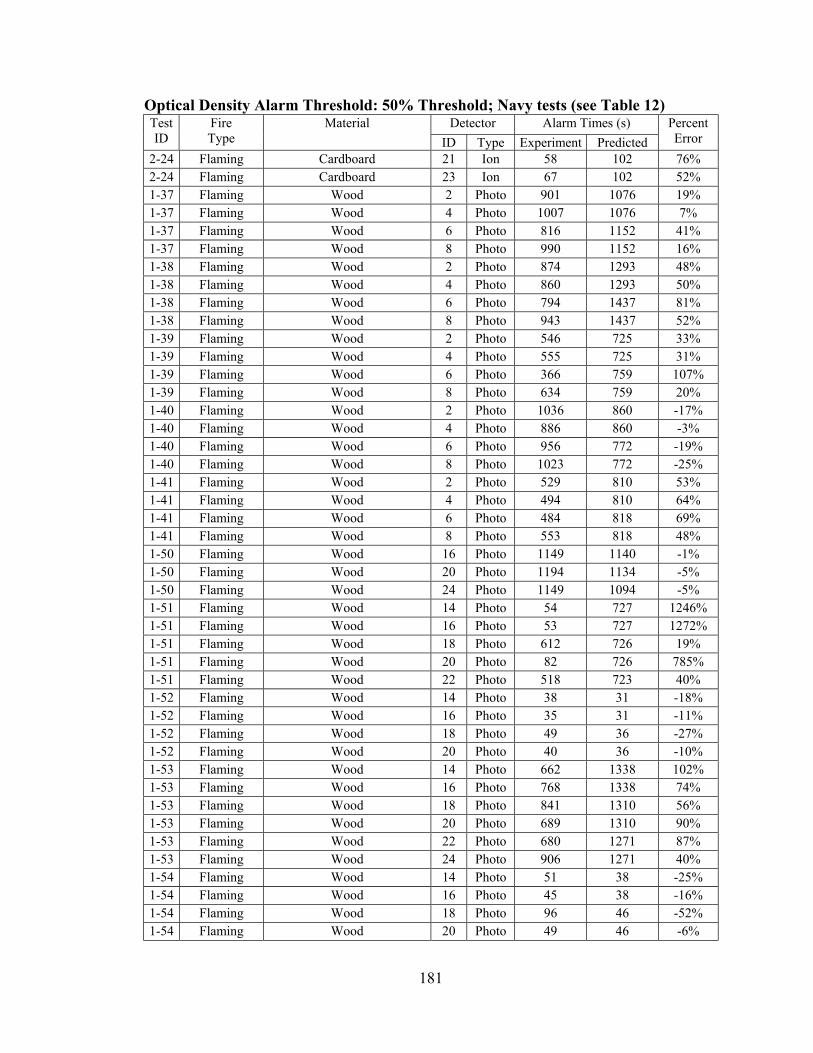
181
Optical Density Alarm Threshold: 50% Threshold; Navy tests (see Table 12) Detector Alarm Times (s) Test
ID Fire Type
Material ID Type Experiment Predicted
Percent Error
2-24 Flaming Cardboard 21 Ion 58 102 76% 2-24 Flaming Cardboard 23 Ion 67 102 52% 1-37 Flaming Wood 2 Photo 901 1076 19% 1-37 Flaming Wood 4 Photo 1007 1076 7% 1-37 Flaming Wood 6 Photo 816 1152 41% 1-37 Flaming Wood 8 Photo 990 1152 16% 1-38 Flaming Wood 2 Photo 874 1293 48% 1-38 Flaming Wood 4 Photo 860 1293 50% 1-38 Flaming Wood 6 Photo 794 1437 81% 1-38 Flaming Wood 8 Photo 943 1437 52% 1-39 Flaming Wood 2 Photo 546 725 33% 1-39 Flaming Wood 4 Photo 555 725 31% 1-39 Flaming Wood 6 Photo 366 759 107% 1-39 Flaming Wood 8 Photo 634 759 20% 1-40 Flaming Wood 2 Photo 1036 860 -17% 1-40 Flaming Wood 4 Photo 886 860 -3% 1-40 Flaming Wood 6 Photo 956 772 -19% 1-40 Flaming Wood 8 Photo 1023 772 -25% 1-41 Flaming Wood 2 Photo 529 810 53% 1-41 Flaming Wood 4 Photo 494 810 64% 1-41 Flaming Wood 6 Photo 484 818 69% 1-41 Flaming Wood 8 Photo 553 818 48% 1-50 Flaming Wood 16 Photo 1149 1140 -1% 1-50 Flaming Wood 20 Photo 1194 1134 -5% 1-50 Flaming Wood 24 Photo 1149 1094 -5% 1-51 Flaming Wood 14 Photo 54 727 1246% 1-51 Flaming Wood 16 Photo 53 727 1272% 1-51 Flaming Wood 18 Photo 612 726 19% 1-51 Flaming Wood 20 Photo 82 726 785% 1-51 Flaming Wood 22 Photo 518 723 40% 1-52 Flaming Wood 14 Photo 38 31 -18% 1-52 Flaming Wood 16 Photo 35 31 -11% 1-52 Flaming Wood 18 Photo 49 36 -27% 1-52 Flaming Wood 20 Photo 40 36 -10% 1-53 Flaming Wood 14 Photo 662 1338 102% 1-53 Flaming Wood 16 Photo 768 1338 74% 1-53 Flaming Wood 18 Photo 841 1310 56% 1-53 Flaming Wood 20 Photo 689 1310 90% 1-53 Flaming Wood 22 Photo 680 1271 87% 1-53 Flaming Wood 24 Photo 906 1271 40% 1-54 Flaming Wood 14 Photo 51 38 -25% 1-54 Flaming Wood 16 Photo 45 38 -16% 1-54 Flaming Wood 18 Photo 96 46 -52% 1-54 Flaming Wood 20 Photo 49 46 -6%

182
Optical Density Alarm Threshold: 50% Threshold; Navy tests (see Table 12) Detector Alarm Times (s) Test
ID Fire Type
Material ID Type Experiment Predicted
Percent Error
1-55 Flaming Wood 16 Photo 35 37 6% 1-55 Flaming Wood 18 Photo 55 22 -60% 1-55 Flaming Wood 20 Photo 35 22 -37% 2-09 Flaming Cardboard 2 Photo 480 520 8% 2-09 Flaming Cardboard 4 Photo 169 520 208% 2-09 Flaming Cardboard 6 Photo 129 487 278% 2-09 Flaming Cardboard 8 Photo 124 487 293% 2-10 Flaming Cardboard 2 Photo 643 468 -27% 2-10 Flaming Cardboard 4 Photo 281 468 67% 2-10 Flaming Cardboard 6 Photo 592 447 -24% 2-10 Flaming Cardboard 8 Photo 260 447 72% 2-11 Flaming Cardboard 2 Photo 76 73 -4% 2-11 Flaming Cardboard 4 Photo 84 73 -13% 2-11 Flaming Cardboard 6 Photo 110 416 278% 2-11 Flaming Cardboard 8 Photo 93 416 347% 2-12 Flaming Cardboard 6 Photo 115 DNA (0.025
@ 519 s)
2-12 Flaming Cardboard 8 Photo 107 DNA (0.025 @ 519 s)
2-21 Flaming Cardboard 14 Photo 164 516 215% 2-21 Flaming Cardboard 16 Photo 153 516 237% 2-21 Flaming Cardboard 18 Photo 498 585 17% 2-21 Flaming Cardboard 20 Photo 482 585 21% 2-21 Flaming Cardboard 22 Photo 477 579 21% 2-21 Flaming Cardboard 24 Photo 474 579 22% 2-22 Flaming Cardboard 14 Photo 83 94 13% 2-22 Flaming Cardboard 16 Photo 414 94 -77% 2-22 Flaming Cardboard 18 Photo 479 DNA (0.027
@ 132 s)
2-22 Flaming Cardboard 20 Photo 455 DNA (0.027 @ 132 s)
2-22 Flaming Cardboard 22 Photo 118 DNA (0.028 @ 117 s)
2-22 Flaming Cardboard 24 Photo 443 DNA (0.028 @ 117 s)
2-23 Flaming Cardboard 14 Photo 151 DNA (0.036 @ 684 s)
2-23 Flaming Cardboard 16 Photo 139 DNA (0.036 @ 684 s)
2-23 Flaming Cardboard 18 Photo 97 711 633% 2-23 Flaming Cardboard 20 Photo 310 711 129% 2-23 Flaming Cardboard 22 Photo 173 DNA (0.040
@ 727 s)
2-23 Flaming Cardboard 24 Photo 139 DNA (0.040 @ 727 s)
2-24 Flaming Cardboard 14 Photo 139 DNA (0.024 @ 497 s)

183
Optical Density Alarm Threshold: 50% Threshold; Navy tests (see Table 12) Detector Alarm Times (s) Test
ID Fire Type
Material ID Type Experiment Predicted
Percent Error
2-24 Flaming Cardboard 18 Photo 89 DNA (0.032 @ 458 s)
2-24 Flaming Cardboard 20 Photo 417 DNA (0.032 @ 458 s)
2-24 Flaming Cardboard 22 Photo 128 DNA (0.028 @ 470 s)
2-24 Flaming Cardboard 24 Photo 413 DNA (0.028 @ 470 s)
2-25 Smoldering Potassium Chlorate / Lactose 15 Ion 222 DNA (0.037 @ 124 s)
2-25 Smoldering Potassium Chlorate / Lactose 19 Ion 306 DNA (0.023 @ 217 s)
2-27 Smoldering Potassium Chlorate / Lactose 19 Ion 152 59 -61% 2-27 Smoldering Potassium Chlorate / Lactose 23 Ion 69 DNA (0.055
@ 125 s)
2-34 Smoldering Electrical Cable 19 Ion 840 225 -73% 2-36 Smoldering Electrical Cable 19 Ion 1490 1321 -11% 2-37 Smoldering Electrical Cable 19 Ion 393 319 -19% 2-26 Smoldering Potassium Chlorate / Lactose 15 Ion 196 DNA (0.044
@ 82 s)
2-26 Smoldering Potassium Chlorate / Lactose 19 Ion 234 DNA (0.086 @ 51 s)
2-28 Smoldering Potassium Chlorate / Lactose 19 Ion 444 DNA (0.089 @ 80 s)
2-28 Smoldering Potassium Chlorate / Lactose 23 Ion 40 DNA (0.033 @ 160 s)
2-38 Smoldering Electrical Cable 19 Ion 768 DNA (0.048 @ 704 s)
2-38 Smoldering Electrical Cable 23 Ion 730 DNA (0.031 @ 791 s)
2-40 Smoldering Electrical Cable 15 Ion 983 454 -54% 2-01 Smoldering Electrical Cable 1 Ion 2029 1946 -4% 2-01 Smoldering Electrical Cable 5 Ion 2138 1528 -29% 2-04 Smoldering Electrical Cable 5 Ion 1057 473 -55% 2-07 Smoldering Electrical Cable 1 Ion 831 531 -36% 2-07 Smoldering Electrical Cable 5 Ion 1365 702 -49% 2-13 Smoldering Potassium Chlorate / Lactose 5 Ion 536 DNA (0.077
@ 527 s)
2-14 Smoldering Potassium Chlorate / Lactose 1 Ion 18 11 -39% 2-14 Smoldering Potassium Chlorate / Lactose 5 Ion 98 DNA (0.059
@ 53 s)
2-25 Smoldering Potassium Chlorate / Lactose 13 Ion 100 DNA (0.037 @ 124 s)
2-25 Smoldering Potassium Chlorate / Lactose 17 Ion 126 DNA (0.023 @ 217 s)
2-25 Smoldering Potassium Chlorate / Lactose 21 Ion 205 78 -62% 2-27 Smoldering Potassium Chlorate / Lactose 13 Ion 257 DNA (0.011
@ 99 s)
2-27 Smoldering Potassium Chlorate / Lactose 17 Ion 74 59 -20%

184
Optical Density Alarm Threshold: 50% Threshold; Navy tests (see Table 12) Detector Alarm Times (s) Test
ID Fire Type
Material ID Type Experiment Predicted
Percent Error
2-27 Smoldering Potassium Chlorate / Lactose 21 Ion 66 DNA (0.055 @ 125 s)
2-34 Smoldering Electrical Cable 17 Ion 659 225 -66% 2-36 Smoldering Electrical Cable 17 Ion 1354 1321 -2% 2-37 Smoldering Electrical Cable 13 Ion 678 665 -2% 2-37 Smoldering Electrical Cable 17 Ion 335 319 -5% 2-37 Smoldering Electrical Cable 21 Ion 566 566 0% 2-39 Smoldering Electrical Cable 13 Ion 760 278 -63% 2-05 Smoldering Electrical Cable 1 Ion 1695 1865 10% 2-05 Smoldering Electrical Cable 5 Ion 643 385 -40% 2-08 Smoldering Electrical Cable 1 Ion 1372 1602 17% 2-08 Smoldering Electrical Cable 5 Ion 1391 1325 -5% 2-15 Smoldering Potassium Chlorate / Lactose 1 Ion 19 56 195% 2-15 Smoldering Potassium Chlorate / Lactose 5 Ion 70 DNA (0.047
@ 99 s)
2-26 Smoldering Potassium Chlorate / Lactose 13 Ion 64 DNA (0.044 @ 82 s)
2-26 Smoldering Potassium Chlorate / Lactose 17 Ion 53 DNA (0.086 @ 51 s)
2-26 Smoldering Potassium Chlorate / Lactose 21 Ion 145 18 -88% 2-28 Smoldering Potassium Chlorate / Lactose 13 Ion 192 DNA (0.039
@ 134 s)
2-28 Smoldering Potassium Chlorate / Lactose 17 Ion 122 DNA (0.089 @ 80 s)
2-28 Smoldering Potassium Chlorate / Lactose 21 Ion 38 DNA (0.033 @ 160 s)
2-35 Smoldering Electrical Cable 17 Ion 922 358 -61% 2-35 Smoldering Electrical Cable 21 Ion 1408 1496 6% 2-38 Smoldering Electrical Cable 13 Ion 767 DNA (0.039
@ 745 s)
2-38 Smoldering Electrical Cable 17 Ion 771 DNA (0.048 @ 704 s)
2-38 Smoldering Electrical Cable 21 Ion 561 DNA (0.031 @ 791 s)
2-40 Smoldering Electrical Cable 13 Ion 448 454 1% 2-01 Smoldering Electrical Cable 2 Photo 2034 1711 -16% 2-01 Smoldering Electrical Cable 4 Photo 2232 1711 -23% 2-01 Smoldering Electrical Cable 8 Photo 2232 1119 -50% 2-04 Smoldering Electrical Cable 2 Photo 1713 680 -60% 2-04 Smoldering Electrical Cable 6 Photo 796 429 -46% 2-07 Smoldering Electrical Cable 4 Photo 936 523 -44% 2-07 Smoldering Electrical Cable 6 Photo 908 639 -30% 2-13 Smoldering Potassium Chlorate / Lactose 2 Photo 578 508 -12% 2-13 Smoldering Potassium Chlorate / Lactose 4 Photo 572 508 -11% 2-13 Smoldering Potassium Chlorate / Lactose 6 Photo 524 525 0% 2-13 Smoldering Potassium Chlorate / Lactose 8 Photo 710 525 -26% 2-14 Smoldering Potassium Chlorate / Lactose 2 Photo 20 9 -55%
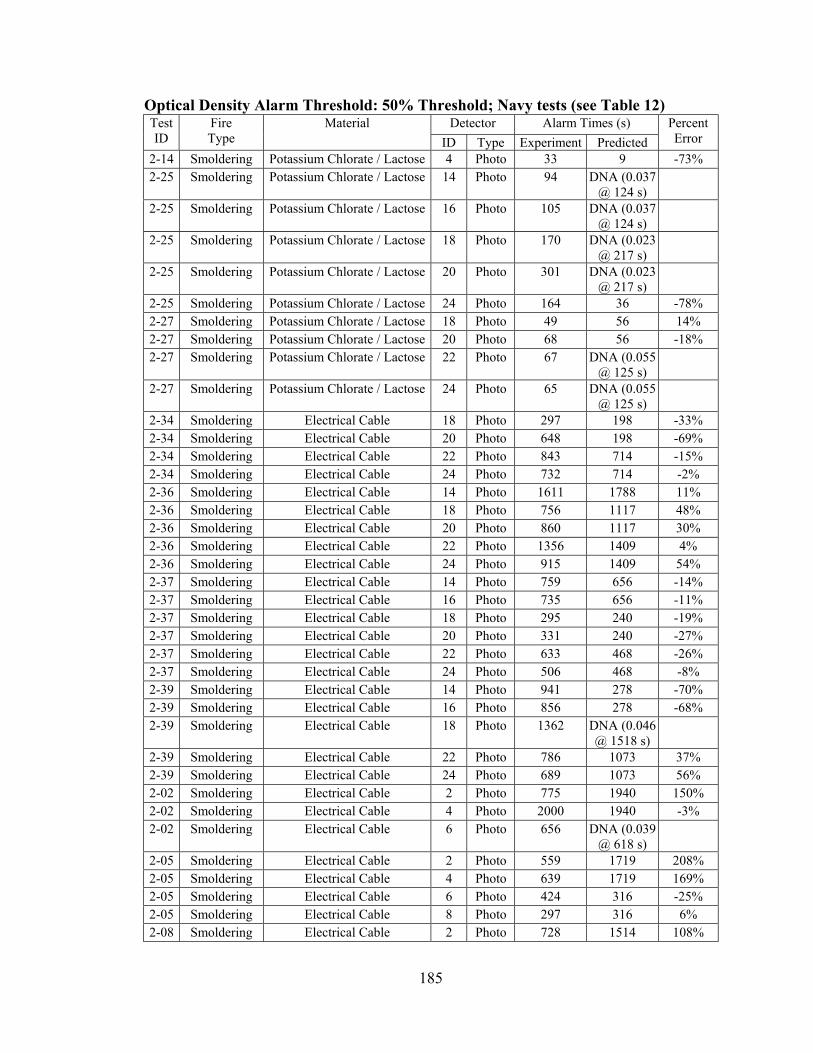
185
Optical Density Alarm Threshold: 50% Threshold; Navy tests (see Table 12) Detector Alarm Times (s) Test
ID Fire Type
Material ID Type Experiment Predicted
Percent Error
2-14 Smoldering Potassium Chlorate / Lactose 4 Photo 33 9 -73% 2-25 Smoldering Potassium Chlorate / Lactose 14 Photo 94 DNA (0.037
@ 124 s)
2-25 Smoldering Potassium Chlorate / Lactose 16 Photo 105 DNA (0.037 @ 124 s)
2-25 Smoldering Potassium Chlorate / Lactose 18 Photo 170 DNA (0.023 @ 217 s)
2-25 Smoldering Potassium Chlorate / Lactose 20 Photo 301 DNA (0.023 @ 217 s)
2-25 Smoldering Potassium Chlorate / Lactose 24 Photo 164 36 -78% 2-27 Smoldering Potassium Chlorate / Lactose 18 Photo 49 56 14% 2-27 Smoldering Potassium Chlorate / Lactose 20 Photo 68 56 -18% 2-27 Smoldering Potassium Chlorate / Lactose 22 Photo 67 DNA (0.055
@ 125 s)
2-27 Smoldering Potassium Chlorate / Lactose 24 Photo 65 DNA (0.055 @ 125 s)
2-34 Smoldering Electrical Cable 18 Photo 297 198 -33% 2-34 Smoldering Electrical Cable 20 Photo 648 198 -69% 2-34 Smoldering Electrical Cable 22 Photo 843 714 -15% 2-34 Smoldering Electrical Cable 24 Photo 732 714 -2% 2-36 Smoldering Electrical Cable 14 Photo 1611 1788 11% 2-36 Smoldering Electrical Cable 18 Photo 756 1117 48% 2-36 Smoldering Electrical Cable 20 Photo 860 1117 30% 2-36 Smoldering Electrical Cable 22 Photo 1356 1409 4% 2-36 Smoldering Electrical Cable 24 Photo 915 1409 54% 2-37 Smoldering Electrical Cable 14 Photo 759 656 -14% 2-37 Smoldering Electrical Cable 16 Photo 735 656 -11% 2-37 Smoldering Electrical Cable 18 Photo 295 240 -19% 2-37 Smoldering Electrical Cable 20 Photo 331 240 -27% 2-37 Smoldering Electrical Cable 22 Photo 633 468 -26% 2-37 Smoldering Electrical Cable 24 Photo 506 468 -8% 2-39 Smoldering Electrical Cable 14 Photo 941 278 -70% 2-39 Smoldering Electrical Cable 16 Photo 856 278 -68% 2-39 Smoldering Electrical Cable 18 Photo 1362 DNA (0.046
@ 1518 s)
2-39 Smoldering Electrical Cable 22 Photo 786 1073 37% 2-39 Smoldering Electrical Cable 24 Photo 689 1073 56% 2-02 Smoldering Electrical Cable 2 Photo 775 1940 150% 2-02 Smoldering Electrical Cable 4 Photo 2000 1940 -3% 2-02 Smoldering Electrical Cable 6 Photo 656 DNA (0.039
@ 618 s)
2-05 Smoldering Electrical Cable 2 Photo 559 1719 208% 2-05 Smoldering Electrical Cable 4 Photo 639 1719 169% 2-05 Smoldering Electrical Cable 6 Photo 424 316 -25% 2-05 Smoldering Electrical Cable 8 Photo 297 316 6% 2-08 Smoldering Electrical Cable 2 Photo 728 1514 108%

186
Optical Density Alarm Threshold: 50% Threshold; Navy tests (see Table 12) Detector Alarm Times (s) Test
ID Fire Type
Material ID Type Experiment Predicted
Percent Error
2-08 Smoldering Electrical Cable 4 Photo 845 1514 79% 2-08 Smoldering Electrical Cable 6 Photo 539 516 -4% 2-08 Smoldering Electrical Cable 8 Photo 775 516 -33% 2-15 Smoldering Potassium Chlorate / Lactose 2 Photo 19 10 -47% 2-15 Smoldering Potassium Chlorate / Lactose 4 Photo 112 10 -91% 2-15 Smoldering Potassium Chlorate / Lactose 6 Photo 81 DNA (0.047
@ 99 s)
2-15 Smoldering Potassium Chlorate / Lactose 8 Photo 83 DNA (0.047 @ 99 s)
2-26 Smoldering Potassium Chlorate / Lactose 14 Photo 68 DNA (0.044 @ 82 s)
2-26 Smoldering Potassium Chlorate / Lactose 16 Photo 246 DNA (0.044 @ 82 s)
2-26 Smoldering Potassium Chlorate / Lactose 18 Photo 65 41 -37% 2-28 Smoldering Potassium Chlorate / Lactose 16 Photo 331 DNA (0.039
@ 134 s)
2-28 Smoldering Potassium Chlorate / Lactose 18 Photo 92 77 -16% 2-28 Smoldering Potassium Chlorate / Lactose 20 Photo 348 77 -78% 2-28 Smoldering Potassium Chlorate / Lactose 22 Photo 34 DNA (0.033
@ 160 s)
2-28 Smoldering Potassium Chlorate / Lactose 24 Photo 32 DNA (0.033 @ 160 s)
2-35 Smoldering Electrical Cable 18 Photo 423 352 -17% 2-35 Smoldering Electrical Cable 20 Photo 851 352 -59% 2-35 Smoldering Electrical Cable 22 Photo 656 1331 103% 2-35 Smoldering Electrical Cable 24 Photo 989 1331 35% 2-38 Smoldering Electrical Cable 14 Photo 754 DNA (0.039
@ 745 s)
2-38 Smoldering Electrical Cable 16 Photo 843 DNA (0.039 @ 745 s)
2-38 Smoldering Electrical Cable 18 Photo 549 DNA (0.048 @ 704 s)
2-38 Smoldering Electrical Cable 20 Photo 709 DNA (0.048 @ 704 s)
2-38 Smoldering Electrical Cable 22 Photo 189 DNA (0.031 @ 791 s)
2-38 Smoldering Electrical Cable 24 Photo 418 DNA (0.031 @ 791 s)
2-40 Smoldering Electrical Cable 14 Photo 402 366 -9% 2-40 Smoldering Electrical Cable 16 Photo 679 366 -46% 2-40 Smoldering Electrical Cable 18 Photo 1201 DNA (0.037
@ 1503 s)
2-40 Smoldering Electrical Cable 20 Photo 1387 DNA (0.037 @ 1503 s)
2-40 Smoldering Electrical Cable 22 Photo 1542 DNA (0.058 @ 1632 s)

187
Optical Density Alarm Threshold: 80% Threshold; Navy tests (see Table 12) Detector Alarm Times (s) Test
ID Fire Type
Material ID Type Experiment Predicted
Percent Error
1-37 Flaming Wood 1 Ion 61 1182 1838% 1-37 Flaming Wood 3 Ion 177 1182 568% 1-37 Flaming Wood 5 Ion 45 1224 2620% 1-37 Flaming Wood 7 Ion 174 1224 603% 1-38 Flaming Wood 1 Ion 62 1412 2177% 1-38 Flaming Wood 3 Ion 155 1412 811% 1-38 Flaming Wood 5 Ion 65 1561 2302% 1-38 Flaming Wood 7 Ion 182 1561 758% 1-39 Flaming Wood 1 Ion 69 769 1014% 1-39 Flaming Wood 3 Ion 43 769 1688% 1-39 Flaming Wood 5 Ion 39 821 2005% 1-39 Flaming Wood 7 Ion 134 821 513% 1-40 Flaming Wood 1 Ion 43 889 1967% 1-40 Flaming Wood 3 Ion 123 889 623% 1-40 Flaming Wood 5 Ion 39 810 1977% 1-40 Flaming Wood 7 Ion 57 810 1321% 1-41 Flaming Wood 1 Ion 69 857 1142% 1-41 Flaming Wood 3 Ion 152 857 464% 1-41 Flaming Wood 5 Ion 46 862 1774% 1-41 Flaming Wood 7 Ion 124 862 595% 1-50 Flaming Wood 13 Ion 48 1141 2277% 1-50 Flaming Wood 15 Ion 65 1141 1655% 1-50 Flaming Wood 17 Ion 75 1134 1412% 1-50 Flaming Wood 19 Ion 128 1134 786% 1-50 Flaming Wood 21 Ion 112 1094 877% 1-50 Flaming Wood 23 Ion 161 1094 580% 1-51 Flaming Wood 13 Ion 44 784 1682% 1-51 Flaming Wood 15 Ion 90 784 771% 1-51 Flaming Wood 17 Ion 79 761 863% 1-51 Flaming Wood 19 Ion 182 761 318% 1-51 Flaming Wood 21 Ion 99 765 673% 1-51 Flaming Wood 23 Ion 89 765 760% 1-52 Flaming Wood 13 Ion 38 31 -18% 1-52 Flaming Wood 15 Ion 65 31 -52% 1-52 Flaming Wood 19 Ion 73 39 -47% 1-52 Flaming Wood 21 Ion 84 25 -70% 1-52 Flaming Wood 23 Ion 177 25 -86% 1-53 Flaming Wood 13 Ion 42 1518 3514% 1-53 Flaming Wood 15 Ion 101 1518 1403% 1-53 Flaming Wood 17 Ion 123 1510 1128% 1-53 Flaming Wood 19 Ion 126 1510 1098% 1-53 Flaming Wood 21 Ion 95 1460 1437%
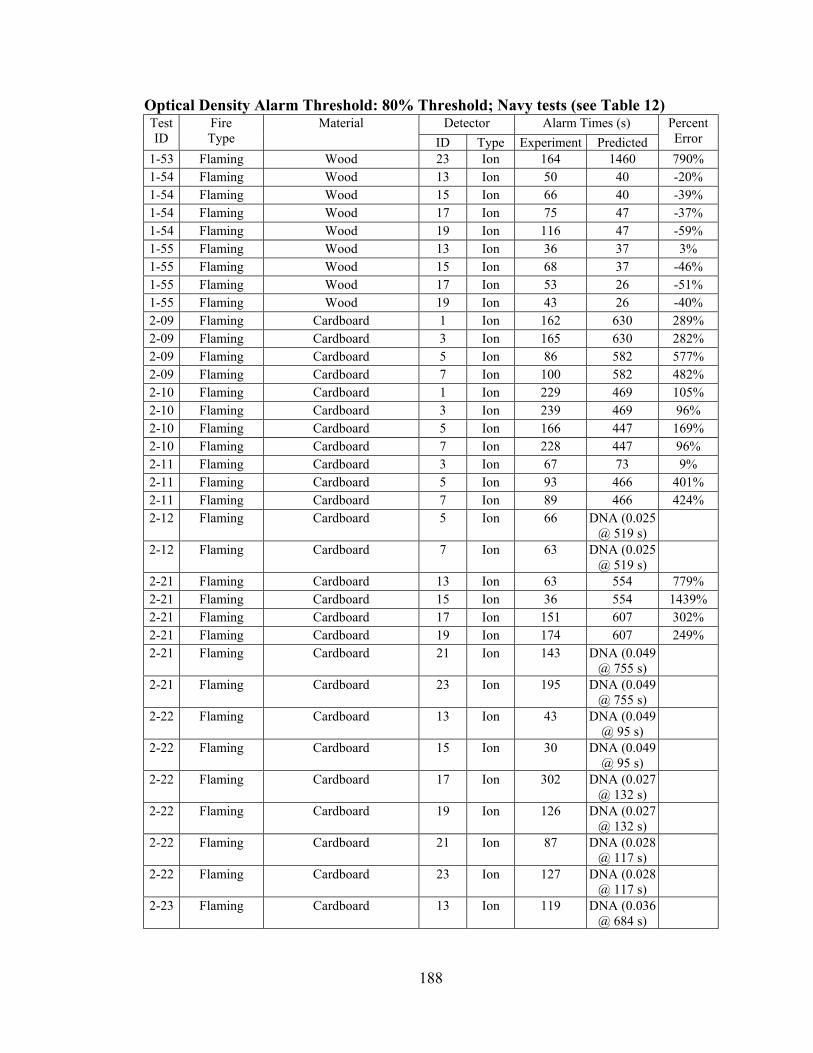
188
Optical Density Alarm Threshold: 80% Threshold; Navy tests (see Table 12) Detector Alarm Times (s) Test
ID Fire Type
Material ID Type Experiment Predicted
Percent Error
1-53 Flaming Wood 23 Ion 164 1460 790% 1-54 Flaming Wood 13 Ion 50 40 -20% 1-54 Flaming Wood 15 Ion 66 40 -39% 1-54 Flaming Wood 17 Ion 75 47 -37% 1-54 Flaming Wood 19 Ion 116 47 -59% 1-55 Flaming Wood 13 Ion 36 37 3% 1-55 Flaming Wood 15 Ion 68 37 -46% 1-55 Flaming Wood 17 Ion 53 26 -51% 1-55 Flaming Wood 19 Ion 43 26 -40% 2-09 Flaming Cardboard 1 Ion 162 630 289% 2-09 Flaming Cardboard 3 Ion 165 630 282% 2-09 Flaming Cardboard 5 Ion 86 582 577% 2-09 Flaming Cardboard 7 Ion 100 582 482% 2-10 Flaming Cardboard 1 Ion 229 469 105% 2-10 Flaming Cardboard 3 Ion 239 469 96% 2-10 Flaming Cardboard 5 Ion 166 447 169% 2-10 Flaming Cardboard 7 Ion 228 447 96% 2-11 Flaming Cardboard 3 Ion 67 73 9% 2-11 Flaming Cardboard 5 Ion 93 466 401% 2-11 Flaming Cardboard 7 Ion 89 466 424% 2-12 Flaming Cardboard 5 Ion 66 DNA (0.025
@ 519 s)
2-12 Flaming Cardboard 7 Ion 63 DNA (0.025 @ 519 s)
2-21 Flaming Cardboard 13 Ion 63 554 779% 2-21 Flaming Cardboard 15 Ion 36 554 1439% 2-21 Flaming Cardboard 17 Ion 151 607 302% 2-21 Flaming Cardboard 19 Ion 174 607 249% 2-21 Flaming Cardboard 21 Ion 143 DNA (0.049
@ 755 s)
2-21 Flaming Cardboard 23 Ion 195 DNA (0.049 @ 755 s)
2-22 Flaming Cardboard 13 Ion 43 DNA (0.049 @ 95 s)
2-22 Flaming Cardboard 15 Ion 30 DNA (0.049 @ 95 s)
2-22 Flaming Cardboard 17 Ion 302 DNA (0.027 @ 132 s)
2-22 Flaming Cardboard 19 Ion 126 DNA (0.027 @ 132 s)
2-22 Flaming Cardboard 21 Ion 87 DNA (0.028 @ 117 s)
2-22 Flaming Cardboard 23 Ion 127 DNA (0.028 @ 117 s)
2-23 Flaming Cardboard 13 Ion 119 DNA (0.036 @ 684 s)
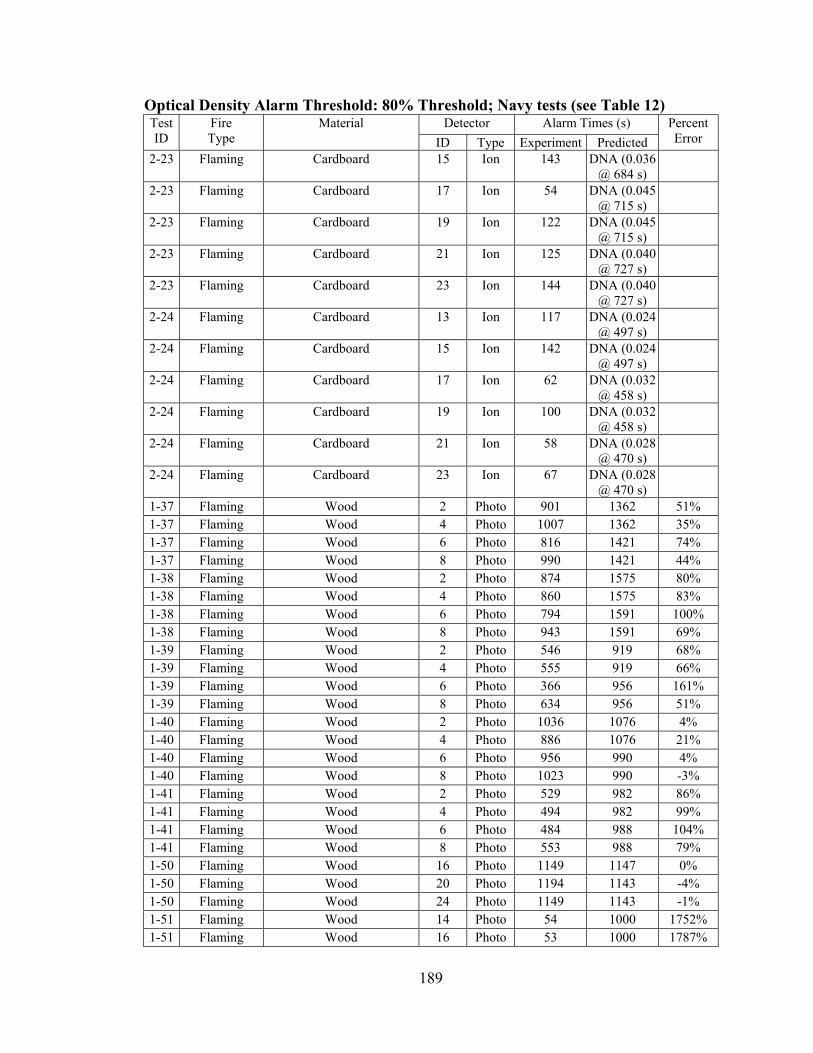
189
Optical Density Alarm Threshold: 80% Threshold; Navy tests (see Table 12) Detector Alarm Times (s) Test
ID Fire Type
Material ID Type Experiment Predicted
Percent Error
2-23 Flaming Cardboard 15 Ion 143 DNA (0.036 @ 684 s)
2-23 Flaming Cardboard 17 Ion 54 DNA (0.045 @ 715 s)
2-23 Flaming Cardboard 19 Ion 122 DNA (0.045 @ 715 s)
2-23 Flaming Cardboard 21 Ion 125 DNA (0.040 @ 727 s)
2-23 Flaming Cardboard 23 Ion 144 DNA (0.040 @ 727 s)
2-24 Flaming Cardboard 13 Ion 117 DNA (0.024 @ 497 s)
2-24 Flaming Cardboard 15 Ion 142 DNA (0.024 @ 497 s)
2-24 Flaming Cardboard 17 Ion 62 DNA (0.032 @ 458 s)
2-24 Flaming Cardboard 19 Ion 100 DNA (0.032 @ 458 s)
2-24 Flaming Cardboard 21 Ion 58 DNA (0.028 @ 470 s)
2-24 Flaming Cardboard 23 Ion 67 DNA (0.028 @ 470 s)
1-37 Flaming Wood 2 Photo 901 1362 51% 1-37 Flaming Wood 4 Photo 1007 1362 35% 1-37 Flaming Wood 6 Photo 816 1421 74% 1-37 Flaming Wood 8 Photo 990 1421 44% 1-38 Flaming Wood 2 Photo 874 1575 80% 1-38 Flaming Wood 4 Photo 860 1575 83% 1-38 Flaming Wood 6 Photo 794 1591 100% 1-38 Flaming Wood 8 Photo 943 1591 69% 1-39 Flaming Wood 2 Photo 546 919 68% 1-39 Flaming Wood 4 Photo 555 919 66% 1-39 Flaming Wood 6 Photo 366 956 161% 1-39 Flaming Wood 8 Photo 634 956 51% 1-40 Flaming Wood 2 Photo 1036 1076 4% 1-40 Flaming Wood 4 Photo 886 1076 21% 1-40 Flaming Wood 6 Photo 956 990 4% 1-40 Flaming Wood 8 Photo 1023 990 -3% 1-41 Flaming Wood 2 Photo 529 982 86% 1-41 Flaming Wood 4 Photo 494 982 99% 1-41 Flaming Wood 6 Photo 484 988 104% 1-41 Flaming Wood 8 Photo 553 988 79% 1-50 Flaming Wood 16 Photo 1149 1147 0% 1-50 Flaming Wood 20 Photo 1194 1143 -4% 1-50 Flaming Wood 24 Photo 1149 1143 -1% 1-51 Flaming Wood 14 Photo 54 1000 1752% 1-51 Flaming Wood 16 Photo 53 1000 1787%

190
Optical Density Alarm Threshold: 80% Threshold; Navy tests (see Table 12) Detector Alarm Times (s) Test
ID Fire Type
Material ID Type Experiment Predicted
Percent Error
1-51 Flaming Wood 18 Photo 612 985 61% 1-51 Flaming Wood 20 Photo 82 985 1101% 1-51 Flaming Wood 22 Photo 518 985 90% 1-52 Flaming Wood 14 Photo 38 DNA (0.054
@ 32 s)
1-52 Flaming Wood 16 Photo 35 DNA (0.054 @ 32 s)
1-52 Flaming Wood 18 Photo 49 DNA (0.062 @ 1469 s)
1-52 Flaming Wood 20 Photo 40 DNA (0.062 @ 1469 s)
1-53 Flaming Wood 14 Photo 662 1859 181% 1-53 Flaming Wood 16 Photo 768 1859 142% 1-53 Flaming Wood 18 Photo 841 1831 118% 1-53 Flaming Wood 20 Photo 689 1831 166% 1-53 Flaming Wood 22 Photo 680 1807 166% 1-53 Flaming Wood 24 Photo 906 1807 99% 1-54 Flaming Wood 14 Photo 51 41 -20% 1-54 Flaming Wood 16 Photo 45 41 -9% 1-54 Flaming Wood 18 Photo 96 50 -48% 1-54 Flaming Wood 20 Photo 49 50 2% 1-55 Flaming Wood 16 Photo 35 40 14% 1-55 Flaming Wood 18 Photo 55 35 -36% 1-55 Flaming Wood 20 Photo 35 35 0% 2-09 Flaming Cardboard 2 Photo 480 DNA (0.052
@ 647 s)
2-09 Flaming Cardboard 4 Photo 169 DNA (0.052 @ 647 s)
2-09 Flaming Cardboard 6 Photo 129 672 421% 2-09 Flaming Cardboard 8 Photo 124 672 442% 2-10 Flaming Cardboard 2 Photo 643 478 -26% 2-10 Flaming Cardboard 4 Photo 281 478 70% 2-10 Flaming Cardboard 6 Photo 592 449 -24% 2-10 Flaming Cardboard 8 Photo 260 449 73% 2-11 Flaming Cardboard 2 Photo 76 526 592% 2-11 Flaming Cardboard 4 Photo 84 526 526% 2-11 Flaming Cardboard 6 Photo 110 555 405% 2-11 Flaming Cardboard 8 Photo 93 555 497% 2-12 Flaming Cardboard 6 Photo 115 DNA (0.025
@ 519 s)
2-12 Flaming Cardboard 8 Photo 107 DNA (0.025 @ 519 s)
2-21 Flaming Cardboard 14 Photo 164 DNA (0.055 @ 567 s)
2-21 Flaming Cardboard 16 Photo 153 DNA (0.055 @ 567 s)

191
Optical Density Alarm Threshold: 80% Threshold; Navy tests (see Table 12) Detector Alarm Times (s) Test
ID Fire Type
Material ID Type Experiment Predicted
Percent Error
2-21 Flaming Cardboard 18 Photo 498 DNA (0.051 @ 765 s)
2-21 Flaming Cardboard 20 Photo 482 DNA (0.051 @ 765 s)
2-21 Flaming Cardboard 22 Photo 477 DNA (0.049 @ 755 s)
2-21 Flaming Cardboard 24 Photo 474 DNA (0.049 @ 755 s)
2-22 Flaming Cardboard 14 Photo 83 DNA (0.049 @ 95 s)
2-22 Flaming Cardboard 16 Photo 414 DNA (0.049 @ 95 s)
2-22 Flaming Cardboard 18 Photo 479 DNA (0.027 @ 132 s)
2-22 Flaming Cardboard 20 Photo 455 DNA (0.027 @ 132 s)
2-22 Flaming Cardboard 22 Photo 118 DNA (0.028 @ 117 s)
2-22 Flaming Cardboard 24 Photo 443 DNA (0.028 @ 117 s)
2-23 Flaming Cardboard 14 Photo 151 DNA (0.036 @ 684 s)
2-23 Flaming Cardboard 16 Photo 139 DNA (0.036 @ 684 s)
2-23 Flaming Cardboard 18 Photo 97 DNA (0.045 @ 715 s)
2-23 Flaming Cardboard 20 Photo 310 DNA (0.045 @ 715 s)
2-23 Flaming Cardboard 22 Photo 173 DNA (0.040 @ 727 s)
2-23 Flaming Cardboard 24 Photo 139 DNA (0.040 @ 727 s)
2-24 Flaming Cardboard 14 Photo 139 DNA (0.024 @ 497 s)
2-24 Flaming Cardboard 18 Photo 89 DNA (0.032 @ 458 s)
2-24 Flaming Cardboard 20 Photo 417 DNA (0.032 @ 458 s)
2-24 Flaming Cardboard 22 Photo 128 DNA (0.028 @ 470 s)
2-24 Flaming Cardboard 24 Photo 413 DNA (0.028 @ 470 s)
2-25 Smoldering Potassium Chlorate / Lactose
15 Ion 222 DNA (0.037 @ 124 s)
2-25 Smoldering Potassium Chlorate / Lactose
19 Ion 306 DNA (0.023 @ 217 s)
2-27 Smoldering Potassium Chlorate / Lactose
19 Ion 152 DNA (0.112 @ 62 s)
2-27 Smoldering Potassium Chlorate / Lactose
23 Ion 69 DNA (0.055 @ 125 s)

192
Optical Density Alarm Threshold: 80% Threshold; Navy tests (see Table 12) Detector Alarm Times (s) Test
ID Fire Type
Material ID Type Experiment Predicted
Percent Error
2-34 Smoldering Electrical Cable 19 Ion 840 227 -73% 2-36 Smoldering Electrical Cable 19 Ion 1490 1342 -10% 2-37 Smoldering Electrical Cable 19 Ion 393 341 -13% 2-26 Smoldering Potassium Chlorate /
Lactose 15 Ion 196 DNA (0.044
@ 82 s)
2-26 Smoldering Potassium Chlorate / Lactose
19 Ion 234 DNA (0.086 @ 51 s)
2-28 Smoldering Potassium Chlorate / Lactose
19 Ion 444 DNA (0.089 @ 80 s)
2-28 Smoldering Potassium Chlorate / Lactose
23 Ion 40 DNA (0.033 @ 160 s)
2-38 Smoldering Electrical Cable 19 Ion 768 DNA (0.048 @ 704 s)
2-38 Smoldering Electrical Cable 23 Ion 730 DNA (0.031 @ 791 s)
2-40 Smoldering Electrical Cable 15 Ion 983 480 -51% 2-01 Smoldering Electrical Cable 1 Ion 2029 1985 -2% 2-01 Smoldering Electrical Cable 5 Ion 2138 2038 -5% 2-04 Smoldering Electrical Cable 5 Ion 1057 486 -54% 2-07 Smoldering Electrical Cable 1 Ion 831 887 7% 2-07 Smoldering Electrical Cable 5 Ion 1365 856 -37% 2-13 Smoldering Potassium Chlorate /
Lactose 5 Ion 536 DNA (0.077
@ 527 s)
2-14 Smoldering Potassium Chlorate / Lactose
1 Ion 18 13 -28%
2-14 Smoldering Potassium Chlorate / Lactose
5 Ion 98 DNA (0.059 @ 53 s)
2-25 Smoldering Potassium Chlorate / Lactose
13 Ion 100 DNA (0.037 @ 124 s)
2-25 Smoldering Potassium Chlorate / Lactose
17 Ion 126 DNA (0.023 @ 217 s)
2-25 Smoldering Potassium Chlorate / Lactose
21 Ion 205 DNA (0.091 @ 78 s)
2-27 Smoldering Potassium Chlorate / Lactose
13 Ion 257 DNA (0.011 @ 99 s)
2-27 Smoldering Potassium Chlorate / Lactose
17 Ion 74 DNA (0.112 @ 62 s)
2-27 Smoldering Potassium Chlorate / Lactose
21 Ion 66 DNA (0.055 @ 125 s)
2-34 Smoldering Electrical Cable 17 Ion 659 227 -66% 2-36 Smoldering Electrical Cable 17 Ion 1354 1342 -1% 2-37 Smoldering Electrical Cable 13 Ion 678 DNA (0.121
@ 708 s)
2-37 Smoldering Electrical Cable 17 Ion 335 341 2% 2-37 Smoldering Electrical Cable 21 Ion 566 575 2% 2-39 Smoldering Electrical Cable 13 Ion 760 279 -63% 2-05 Smoldering Electrical Cable 1 Ion 1695 1944 15% 2-05 Smoldering Electrical Cable 5 Ion 643 397 -38%

193
Optical Density Alarm Threshold: 80% Threshold; Navy tests (see Table 12) Detector Alarm Times (s) Test
ID Fire Type
Material ID Type Experiment Predicted
Percent Error
2-08 Smoldering Electrical Cable 1 Ion 1372 DNA (0.117 @ 1616 s)
2-08 Smoldering Electrical Cable 5 Ion 1391 1592 14% 2-15 Smoldering Potassium Chlorate /
Lactose 1 Ion 19 DNA (0.109
@ 57 s)
2-15 Smoldering Potassium Chlorate / Lactose
5 Ion 70 DNA (0.047 @ 99 s)
2-26 Smoldering Potassium Chlorate / Lactose
13 Ion 64 DNA (0.044 @ 82 s)
2-26 Smoldering Potassium Chlorate / Lactose
17 Ion 53 DNA (0.086 @ 51 s)
2-26 Smoldering Potassium Chlorate / Lactose
21 Ion 145 19 -87%
2-28 Smoldering Potassium Chlorate / Lactose
13 Ion 192 DNA (0.039 @ 134 s)
2-28 Smoldering Potassium Chlorate / Lactose
17 Ion 122 DNA (0.089 @ 80 s)
2-28 Smoldering Potassium Chlorate / Lactose
21 Ion 38 DNA (0.033 @ 160 s)
2-35 Smoldering Electrical Cable 17 Ion 922 363 -61% 2-35 Smoldering Electrical Cable 21 Ion 1408 1532 9% 2-38 Smoldering Electrical Cable 13 Ion 767 DNA (0.039
@ 745 s)
2-38 Smoldering Electrical Cable 17 Ion 771 DNA (0.048 @ 704 s)
2-38 Smoldering Electrical Cable 21 Ion 561 DNA (0.031 @ 791 s)
2-40 Smoldering Electrical Cable 13 Ion 448 480 7% 2-01 Smoldering Electrical Cable 2 Photo 2034 1978 -3% 2-01 Smoldering Electrical Cable 4 Photo 2232 1978 -11% 2-01 Smoldering Electrical Cable 8 Photo 2232 2016 -10% 2-04 Smoldering Electrical Cable 2 Photo 1713 974 -43% 2-04 Smoldering Electrical Cable 6 Photo 796 484 -39% 2-07 Smoldering Electrical Cable 4 Photo 936 827 -12% 2-07 Smoldering Electrical Cable 6 Photo 908 781 -14% 2-13 Smoldering Potassium Chlorate /
Lactose 2 Photo 578 DNA (0.078
@ 527 s)
2-13 Smoldering Potassium Chlorate / Lactose
4 Photo 572 DNA (0.078 @ 527 s)
2-13 Smoldering Potassium Chlorate / Lactose
6 Photo 524 DNA (0.077 @ 527 s)
2-13 Smoldering Potassium Chlorate / Lactose
8 Photo 710 DNA (0.077 @ 527 s)
2-14 Smoldering Potassium Chlorate / Lactose
2 Photo 20 12 -40%
2-14 Smoldering Potassium Chlorate / Lactose
4 Photo 33 12 -64%
2-25 Smoldering Potassium Chlorate / Lactose
14 Photo 94 DNA (0.037 @ 124 s)

194
Optical Density Alarm Threshold: 80% Threshold; Navy tests (see Table 12) Detector Alarm Times (s) Test
ID Fire Type
Material ID Type Experiment Predicted
Percent Error
2-25 Smoldering Potassium Chlorate / Lactose
16 Photo 105 DNA (0.037 @ 124 s)
2-25 Smoldering Potassium Chlorate / Lactose
18 Photo 170 DNA (0.023 @ 217 s)
2-25 Smoldering Potassium Chlorate / Lactose
20 Photo 301 DNA (0.023 @ 217 s)
2-25 Smoldering Potassium Chlorate / Lactose
24 Photo 164 DNA (0.091 @ 78 s)
2-27 Smoldering Potassium Chlorate / Lactose
18 Photo 49 DNA (0.112 @ 62 s)
2-27 Smoldering Potassium Chlorate / Lactose
20 Photo 68 DNA (0.112 @ 62 s)
2-27 Smoldering Potassium Chlorate / Lactose
22 Photo 67 DNA (0.055 @ 125 s)
2-27 Smoldering Potassium Chlorate / Lactose
24 Photo 65 DNA (0.055 @ 125 s)
2-34 Smoldering Electrical Cable 18 Photo 297 227 -24% 2-34 Smoldering Electrical Cable 20 Photo 648 227 -65% 2-34 Smoldering Electrical Cable 22 Photo 843 DNA (0.074
@ 720 s)
2-34 Smoldering Electrical Cable 24 Photo 732 DNA (0.074 @ 720 s)
2-36 Smoldering Electrical Cable 14 Photo 1611 DNA (0.091 @ 1794 s)
2-36 Smoldering Electrical Cable 18 Photo 756 1334 76% 2-36 Smoldering Electrical Cable 20 Photo 860 1334 55% 2-36 Smoldering Electrical Cable 22 Photo 1356 1480 9% 2-36 Smoldering Electrical Cable 24 Photo 915 1480 62% 2-37 Smoldering Electrical Cable 14 Photo 759 695 -8% 2-37 Smoldering Electrical Cable 16 Photo 735 695 -5% 2-37 Smoldering Electrical Cable 18 Photo 295 329 12% 2-37 Smoldering Electrical Cable 20 Photo 331 329 -1% 2-37 Smoldering Electrical Cable 22 Photo 633 575 -9% 2-37 Smoldering Electrical Cable 24 Photo 506 575 14% 2-39 Smoldering Electrical Cable 14 Photo 941 279 -70% 2-39 Smoldering Electrical Cable 16 Photo 856 279 -67% 2-39 Smoldering Electrical Cable 18 Photo 1362 DNA (0.046
@ 1518 s)
2-39 Smoldering Electrical Cable 22 Photo 786 DNA (0.078 @ 1542 s)
2-39 Smoldering Electrical Cable 24 Photo 689 DNA (0.078 @ 1542 s)
2-02 Smoldering Electrical Cable 2 Photo 775 DNA (0.074 @ 2081 s)
2-02 Smoldering Electrical Cable 4 Photo 2000 DNA (0.074 @ 2081 s)
2-02 Smoldering Electrical Cable 6 Photo 656 DNA (0.039 @ 618 s)
2-05 Smoldering Electrical Cable 2 Photo 559 1931 245%

195
Optical Density Alarm Threshold: 80% Threshold; Navy tests (see Table 12) Detector Alarm Times (s) Test
ID Fire Type
Material ID Type Experiment Predicted
Percent Error
2-05 Smoldering Electrical Cable 4 Photo 639 1931 202% 2-05 Smoldering Electrical Cable 6 Photo 424 397 -6% 2-05 Smoldering Electrical Cable 8 Photo 297 397 34% 2-08 Smoldering Electrical Cable 2 Photo 728 DNA (0.117
@ 1616 s)
2-08 Smoldering Electrical Cable 4 Photo 845 DNA (0.117 @ 1616 s)
2-08 Smoldering Electrical Cable 6 Photo 539 1377 155% 2-08 Smoldering Electrical Cable 8 Photo 775 1377 78% 2-15 Smoldering Potassium Chlorate /
Lactose 2 Photo 19 DNA (0.109
@ 57 s)
2-15 Smoldering Potassium Chlorate / Lactose
4 Photo 112 DNA (0.109 @ 57 s)
2-15 Smoldering Potassium Chlorate / Lactose
6 Photo 81 DNA (0.047 @ 99 s)
2-15 Smoldering Potassium Chlorate / Lactose
8 Photo 83 DNA (0.047 @ 99 s)
2-26 Smoldering Potassium Chlorate / Lactose
14 Photo 68 DNA (0.044 @ 82 s)
2-26 Smoldering Potassium Chlorate / Lactose
16 Photo 246 DNA (0.044 @ 82 s)
2-26 Smoldering Potassium Chlorate / Lactose
18 Photo 65 DNA (0.086 @ 51 s)
2-28 Smoldering Potassium Chlorate / Lactose
16 Photo 331 DNA (0.039 @ 134 s)
2-28 Smoldering Potassium Chlorate / Lactose
18 Photo 92 DNA (0.089 @ 80 s)
2-28 Smoldering Potassium Chlorate / Lactose
20 Photo 348 DNA (0.089 @ 80 s)
2-28 Smoldering Potassium Chlorate / Lactose
22 Photo 34 DNA (0.033 @ 160 s)
2-28 Smoldering Potassium Chlorate / Lactose
24 Photo 32 DNA (0.033 @ 160 s)
2-35 Smoldering Electrical Cable 18 Photo 423 362 -14% 2-35 Smoldering Electrical Cable 20 Photo 851 362 -57% 2-35 Smoldering Electrical Cable 22 Photo 656 1532 134% 2-35 Smoldering Electrical Cable 24 Photo 989 1532 55% 2-38 Smoldering Electrical Cable 14 Photo 754 DNA (0.039
@ 745 s)
2-38 Smoldering Electrical Cable 16 Photo 843 DNA (0.039 @ 745 s)
2-38 Smoldering Electrical Cable 18 Photo 549 DNA (0.048 @ 704 s)
2-38 Smoldering Electrical Cable 20 Photo 709 DNA (0.048 @ 704 s)
2-38 Smoldering Electrical Cable 22 Photo 189 DNA (0.031 @ 791 s)
2-38 Smoldering Electrical Cable 24 Photo 418 DNA (0.031 @ 791 s)
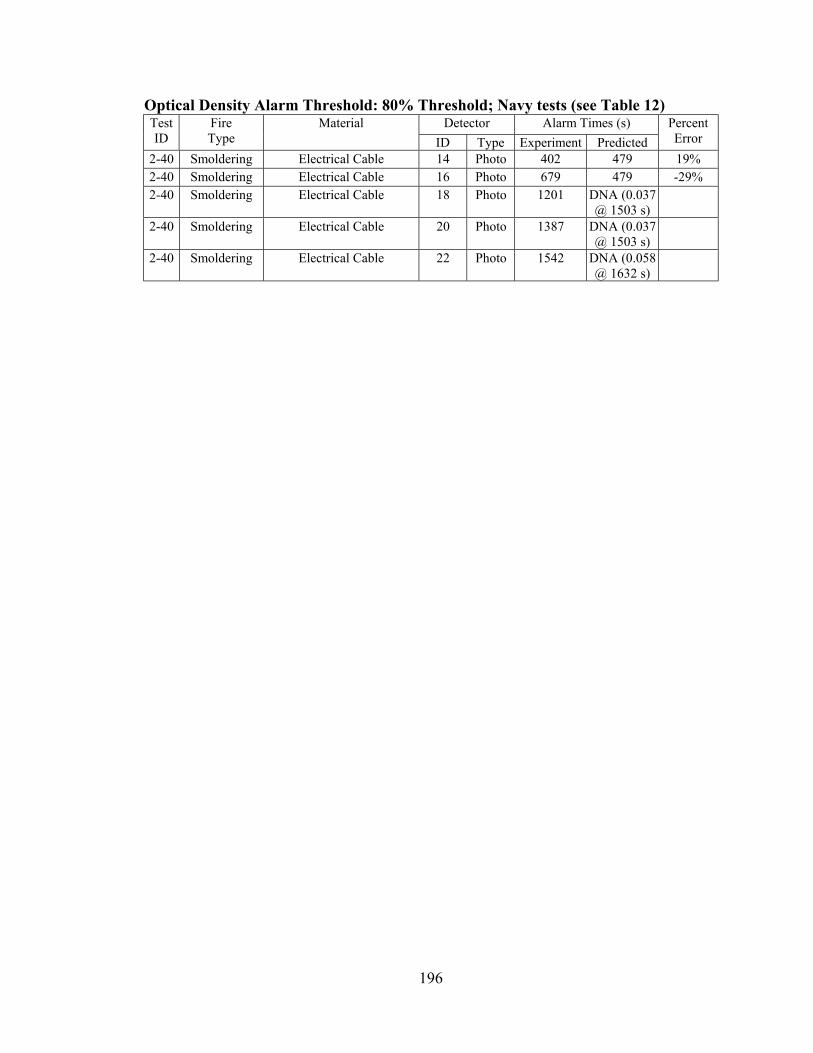
196
Optical Density Alarm Threshold: 80% Threshold; Navy tests (see Table 12) Detector Alarm Times (s) Test
ID Fire Type
Material ID Type Experiment Predicted
Percent Error
2-40 Smoldering Electrical Cable 14 Photo 402 479 19% 2-40 Smoldering Electrical Cable 16 Photo 679 479 -29% 2-40 Smoldering Electrical Cable 18 Photo 1201 DNA (0.037
@ 1503 s)
2-40 Smoldering Electrical Cable 20 Photo 1387 DNA (0.037 @ 1503 s)
2-40 Smoldering Electrical Cable 22 Photo 1542 DNA (0.058 @ 1632 s)

197
Optical Density Alarm Threshold: 20% Threshold; Kemano tests (see Table 12) Detector Alarm Times (s) Test
ID Fire Type
Material ID Type Experiment Predicted
Percent Error
01 Flaming Wood 28 Ion 480 388 -100% 02 Flaming Wood 14 Ion 1359 390 -100% 02 Flaming Wood 28 Ion 1388 1379 -1% 03 Flaming Cotton Fabric 8 Ion 122 377 472% 03 Flaming Cotton Fabric 14 Ion 155 390 270% 03 Flaming Cotton Fabric 28 Ion 226 DNA (0.006
@ 550 s)
05 Flaming Upholstered Furniture 28 Ion 875 757 -100% 06 Flaming Wood 8 Ion 1111 1095 -2% 06 Flaming Wood 14 Ion 389 245 -93% 06 Flaming Wood 28 Ion 277 234 -100% 07 Flaming Wood 8 Ion 1107 1093 -3% 08 Flaming Upholstered Furniture 8 Ion 760 726 -100% 08 Flaming Upholstered Furniture 14 Ion 860 726 -100% 09 Flaming Upholstered Furniture 14 Ion 906 854 -100% 10 Flaming Wood 13 Ion 2851 2744 -100% 11 Flaming Upholstered Furniture 4 Ion 1723 1674 -100% 11 Flaming Upholstered Furniture 7 Ion 1763 1674 -100% 13 Flaming Paper 13 Ion 4977 4794 -100% 01 Flaming Wood 26 Photo 545 388 -100% 02 Flaming Wood 16 Photo 1377 575 -81% 02 Flaming Wood 26 Photo 1408 1379 -3% 03 Flaming Cotton Fabric 6 Photo 403 DNA (0.012
@ 462 s)
03 Flaming Cotton Fabric 16 Photo 368 DNA (0.011 @ 509 s)
04 Flaming Paper 26 Photo 787 591 -100% 05 Flaming Upholstered Furniture 26 Photo 922 757 -100% 06 Flaming Wood 6 Photo 1112 1100 -1% 06 Flaming Wood 26 Photo 265 234 -100% 07 Flaming Wood 6 Photo 1115 1094 -4% 01 Smoldering Wood 8 Ion 269 171 -36% 01 Smoldering Wood 14 Ion 422 213 -50% 02 Smoldering Wood 8 Ion 218 142 -35% 04 Smoldering Paper 8 Ion 522 293 -44% 04 Smoldering Paper 14 Ion 377 325 -14% 04 Smoldering Paper 28 Ion 686 474 -31% 05 Smoldering Upholstered Furniture 8 Ion 325 231 -29% 05 Smoldering Upholstered Furniture 14 Ion 315 262 -17% 07 Smoldering Wood 14 Ion 606 334 -45% 07 Smoldering Wood 28 Ion 383 236 -38% 08 Smoldering Upholstered Furniture 28 Ion 715 193 -73% 09 Smoldering Upholstered Furniture 8 Ion 924 534 -42%

198
Optical Density Alarm Threshold: 20% Threshold; Kemano tests (see Table 12) Detector Alarm Times (s) Test
ID Fire Type
Material ID Type Experiment Predicted
Percent Error
09 Smoldering Upholstered Furniture 28 Ion 795 138 -83% 10 Smoldering Wood 4 Ion 1044 446 -57% 10 Smoldering Wood 7 Ion 2017 735 -64% 13 Smoldering Paper 4 Ion 3246 432 -87% 13 Smoldering Paper 7 Ion 4001 2152 -46% 01 Smoldering Wood 6 Photo 313 170 -46% 01 Smoldering Wood 16 Photo 337 209 -38% 02 Smoldering Wood 6 Photo 223 142 -36% 04 Smoldering Paper 6 Photo 521 292 -44% 04 Smoldering Paper 16 Photo 373 298 -20% 05 Smoldering Upholstered Furniture 6 Photo 461 230 -50% 05 Smoldering Upholstered Furniture 16 Photo 356 257 -28% 06 Smoldering Wood 16 Photo 297 DNA (0.006
@ 234 s)
07 Smoldering Wood 16 Photo 342 331 -3% 07 Smoldering Wood 26 Photo 374 233 -38% 08 Smoldering Upholstered Furniture 6 Photo 376 438 16% 08 Smoldering Upholstered Furniture 16 Photo 334 301 -10% 08 Smoldering Upholstered Furniture 26 Photo 254 193 -24% 09 Smoldering Upholstered Furniture 6 Photo 755 460 -39% 09 Smoldering Upholstered Furniture 16 Photo 376 318 -15% 09 Smoldering Upholstered Furniture 26 Photo 288 128 -56% 10 Smoldering Wood 6 Photo 504 385 -24% 10 Smoldering Wood 9 Photo 605 688 14% 10 Smoldering Wood 15 Photo 687 828 21% 11 Smoldering Upholstered Furniture 6 Photo 371 309 -17% 11 Smoldering Upholstered Furniture 9 Photo 439 465 6% 11 Smoldering Upholstered Furniture 15 Photo 580 605 4% 13 Smoldering Paper 6 Photo 479 431 -10% 13 Smoldering Paper 9 Photo 658 948 44% 13 Smoldering Paper 15 Photo 725 1404 94%

199
Optical Density Alarm Threshold: 50% Threshold; Kemano tests (see Table 12) Detector Alarm Times (s) Test
ID Fire Type
Material ID Type Experiment Predicted
Percent Error
01 Flaming Wood 28 Ion 480 388 -100% 02 Flaming Wood 14 Ion 1359 496 -89% 02 Flaming Wood 28 Ion 1388 1379 -1% 03 Flaming Cotton Fabric 8 Ion 122 DNA (0.012
@ 462 s)
03 Flaming Cotton Fabric 14 Ion 155 DNA (0.011 @ 509 s)
03 Flaming Cotton Fabric 28 Ion 226 DNA (0.006 @ 550 s)
05 Flaming Upholstered Furniture 28 Ion 875 757 -100% 06 Flaming Wood 8 Ion 1111 1096 -2% 06 Flaming Wood 14 Ion 389 278 -72% 06 Flaming Wood 28 Ion 277 234 -100% 07 Flaming Wood 8 Ion 1107 1094 -3% 08 Flaming Upholstered Furniture 8 Ion 760 726 -100% 08 Flaming Upholstered Furniture 14 Ion 860 726 -100% 09 Flaming Upholstered Furniture 14 Ion 906 854 -100% 10 Flaming Wood 13 Ion 2851 2744 -100% 11 Flaming Upholstered Furniture 4 Ion 1723 1674 -100% 11 Flaming Upholstered Furniture 7 Ion 1763 1674 -100% 13 Flaming Paper 13 Ion 4977 4794 -100% 01 Flaming Wood 26 Photo 545 396 -95% 02 Flaming Wood 16 Photo 1377 1357 -2% 02 Flaming Wood 26 Photo 1408 1380 -3% 03 Flaming Cotton Fabric 6 Photo 403 DNA (0.012
@ 462 s)
03 Flaming Cotton Fabric 16 Photo 368 DNA (0.011 @ 509 s)
04 Flaming Paper 26 Photo 787 591 -100% 05 Flaming Upholstered Furniture 26 Photo 922 757 -100% 06 Flaming Wood 6 Photo 1112 DNA (0.042
@ 1181 s)
06 Flaming Wood 26 Photo 265 234 -100% 07 Flaming Wood 6 Photo 1115 1099 -3% 01 Smoldering Wood 8 Ion 269 182 -32% 01 Smoldering Wood 14 Ion 422 261 -38% 02 Smoldering Wood 8 Ion 218 152 -30% 04 Smoldering Paper 8 Ion 522 317 -39% 04 Smoldering Paper 14 Ion 377 345 -8% 04 Smoldering Paper 28 Ion 686 DNA (0.089
@ 526 s)
05 Smoldering Upholstered Furniture 8 Ion 325 239 -26% 05 Smoldering Upholstered Furniture 14 Ion 315 286 -9% 07 Smoldering Wood 14 Ion 606 500 -17%
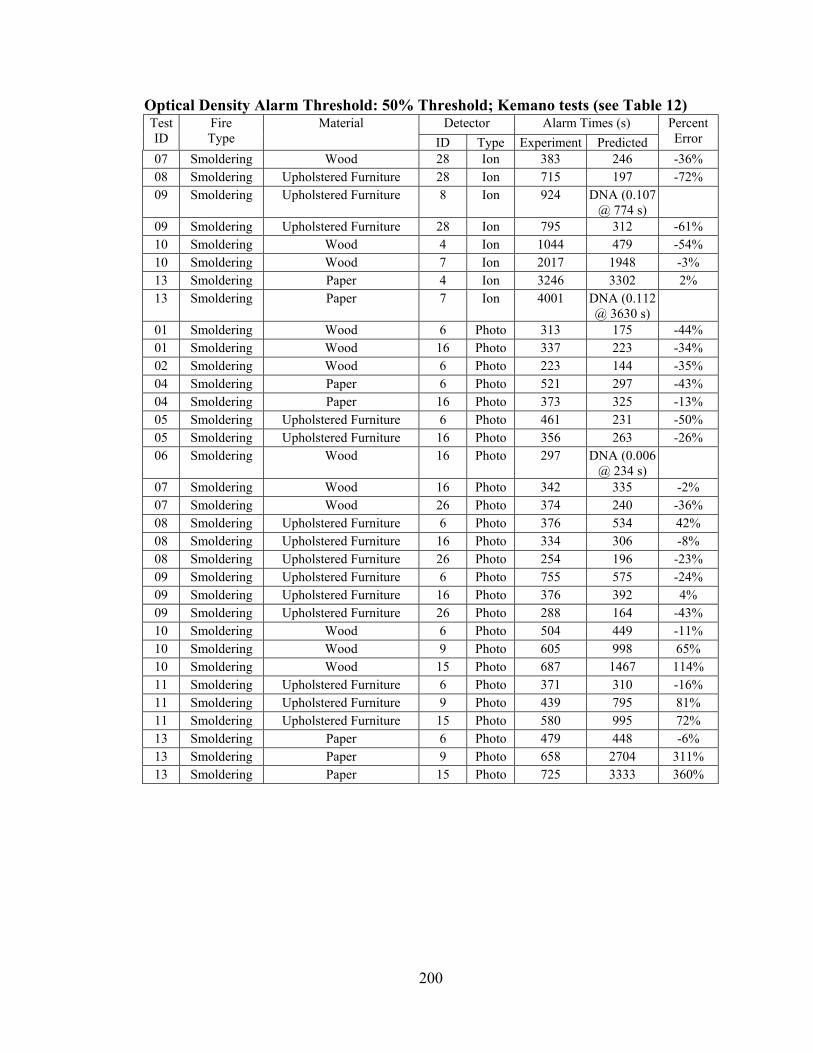
200
Optical Density Alarm Threshold: 50% Threshold; Kemano tests (see Table 12) Detector Alarm Times (s) Test
ID Fire Type
Material ID Type Experiment Predicted
Percent Error
07 Smoldering Wood 28 Ion 383 246 -36% 08 Smoldering Upholstered Furniture 28 Ion 715 197 -72% 09 Smoldering Upholstered Furniture 8 Ion 924 DNA (0.107
@ 774 s)
09 Smoldering Upholstered Furniture 28 Ion 795 312 -61% 10 Smoldering Wood 4 Ion 1044 479 -54% 10 Smoldering Wood 7 Ion 2017 1948 -3% 13 Smoldering Paper 4 Ion 3246 3302 2% 13 Smoldering Paper 7 Ion 4001 DNA (0.112
@ 3630 s)
01 Smoldering Wood 6 Photo 313 175 -44% 01 Smoldering Wood 16 Photo 337 223 -34% 02 Smoldering Wood 6 Photo 223 144 -35% 04 Smoldering Paper 6 Photo 521 297 -43% 04 Smoldering Paper 16 Photo 373 325 -13% 05 Smoldering Upholstered Furniture 6 Photo 461 231 -50% 05 Smoldering Upholstered Furniture 16 Photo 356 263 -26% 06 Smoldering Wood 16 Photo 297 DNA (0.006
@ 234 s)
07 Smoldering Wood 16 Photo 342 335 -2% 07 Smoldering Wood 26 Photo 374 240 -36% 08 Smoldering Upholstered Furniture 6 Photo 376 534 42% 08 Smoldering Upholstered Furniture 16 Photo 334 306 -8% 08 Smoldering Upholstered Furniture 26 Photo 254 196 -23% 09 Smoldering Upholstered Furniture 6 Photo 755 575 -24% 09 Smoldering Upholstered Furniture 16 Photo 376 392 4% 09 Smoldering Upholstered Furniture 26 Photo 288 164 -43% 10 Smoldering Wood 6 Photo 504 449 -11% 10 Smoldering Wood 9 Photo 605 998 65% 10 Smoldering Wood 15 Photo 687 1467 114% 11 Smoldering Upholstered Furniture 6 Photo 371 310 -16% 11 Smoldering Upholstered Furniture 9 Photo 439 795 81% 11 Smoldering Upholstered Furniture 15 Photo 580 995 72% 13 Smoldering Paper 6 Photo 479 448 -6% 13 Smoldering Paper 9 Photo 658 2704 311% 13 Smoldering Paper 15 Photo 725 3333 360%

201
Optical Density Alarm Threshold: 80% Threshold; Kemano tests (see Table 12) Detector Alarm Times (s) Test
ID Fire Type
Material ID Type Experiment Predicted
Percent Error
01 Flaming Wood 28 Ion 480 396 -91% 02 Flaming Wood 14 Ion 1359 1358 0% 02 Flaming Wood 28 Ion 1388 1381 -1% 03 Flaming Cotton Fabric 8 Ion 122 DNA (0.012
@ 462 s)
03 Flaming Cotton Fabric 14 Ion 155 DNA (0.011 @ 509 s)
03 Flaming Cotton Fabric 28 Ion 226 DNA (0.006 @ 550 s)
05 Flaming Upholstered Furniture 28 Ion 875 757 -100% 06 Flaming Wood 8 Ion 1111 DNA (0.042
@ 1181 s)
06 Flaming Wood 14 Ion 389 610 143% 06 Flaming Wood 28 Ion 277 234 -100% 07 Flaming Wood 8 Ion 1107 1099 -2% 08 Flaming Upholstered Furniture 8 Ion 760 728 -94% 08 Flaming Upholstered Furniture 14 Ion 860 726 -100% 09 Flaming Upholstered Furniture 14 Ion 906 854 -100% 10 Flaming Wood 13 Ion 2851 2744 -100% 11 Flaming Upholstered Furniture 4 Ion 1723 1674 -100% 11 Flaming Upholstered Furniture 7 Ion 1763 1698 -73% 13 Flaming Paper 13 Ion 4977 4794 -100% 01 Flaming Wood 26 Photo 545 428 -75% 02 Flaming Wood 16 Photo 1377 1361 -2% 02 Flaming Wood 26 Photo 1408 1387 -2% 03 Flaming Cotton Fabric 6 Photo 403 DNA (0.012
@ 462 s)
03 Flaming Cotton Fabric 16 Photo 368 DNA (0.011 @ 509 s)
04 Flaming Paper 26 Photo 787 642 -74% 05 Flaming Upholstered Furniture 26 Photo 922 769 -93% 06 Flaming Wood 6 Photo 1112 DNA (0.042
@ 1181 s)
06 Flaming Wood 26 Photo 265 234 -100% 07 Flaming Wood 6 Photo 1115 DNA (0.092
@ 1190 s)
01 Smoldering Wood 8 Ion 269 229 -15% 01 Smoldering Wood 14 Ion 422 305 -28% 02 Smoldering Wood 8 Ion 218 219 0% 04 Smoldering Paper 8 Ion 522 350 -33% 04 Smoldering Paper 14 Ion 377 448 19% 04 Smoldering Paper 28 Ion 686 DNA (0.089
@ 526 s)
05 Smoldering Upholstered Furniture 8 Ion 325 240 -26% 05 Smoldering Upholstered Furniture 14 Ion 315 292 -7%

202
Optical Density Alarm Threshold: 80% Threshold; Kemano tests (see Table 12) Detector Alarm Times (s) Test
ID Fire Type
Material ID Type Experiment Predicted
Percent Error
07 Smoldering Wood 14 Ion 606 DNA (0.158 @ 583 s)
07 Smoldering Wood 28 Ion 383 247 -36% 08 Smoldering Upholstered Furniture 28 Ion 715 236 -67% 09 Smoldering Upholstered Furniture 8 Ion 924 DNA (0.107
@ 774 s)
09 Smoldering Upholstered Furniture 28 Ion 795 330 -58% 10 Smoldering Wood 4 Ion 1044 1541 48% 10 Smoldering Wood 7 Ion 2017 DNA (0.130
@ 2184 s)
13 Smoldering Paper 4 Ion 3246 DNA (0.152 @ 3626 s)
13 Smoldering Paper 7 Ion 4001 DNA (0.112 @ 3630 s)
01 Smoldering Wood 6 Photo 313 182 -42% 01 Smoldering Wood 16 Photo 337 247 -27% 02 Smoldering Wood 6 Photo 223 149 -33% 04 Smoldering Paper 6 Photo 521 317 -39% 04 Smoldering Paper 16 Photo 373 345 -8% 05 Smoldering Upholstered Furniture 6 Photo 461 239 -48% 05 Smoldering Upholstered Furniture 16 Photo 356 284 -20% 06 Smoldering Wood 16 Photo 297 DNA (0.006
@ 234 s)
07 Smoldering Wood 16 Photo 342 500 46% 07 Smoldering Wood 26 Photo 374 246 -34% 08 Smoldering Upholstered Furniture 6 Photo 376 DNA (0.105
@ 713 s)
08 Smoldering Upholstered Furniture 16 Photo 334 381 14% 08 Smoldering Upholstered Furniture 26 Photo 254 197 -22% 09 Smoldering Upholstered Furniture 6 Photo 755 DNA (0.107
@ 774 s)
09 Smoldering Upholstered Furniture 16 Photo 376 528 40% 09 Smoldering Upholstered Furniture 26 Photo 288 311 8% 10 Smoldering Wood 6 Photo 504 479 -5% 10 Smoldering Wood 9 Photo 605 1696 180% 10 Smoldering Wood 15 Photo 687 DNA (0.099
@ 2473 s)
11 Smoldering Upholstered Furniture 6 Photo 371 354 -5% 11 Smoldering Upholstered Furniture 9 Photo 439 DNA (0.093
@ 1122 s)
11 Smoldering Upholstered Furniture 15 Photo 580 DNA (0.068 @ 1152 s)
13 Smoldering Paper 6 Photo 479 3272 583% 13 Smoldering Paper 9 Photo 658 3630 452% 13 Smoldering Paper 15 Photo 725 DNA (0.087
@ 4497 s)

203
Temperature Rise Alarm Threshold: 4 °C Detector Alarm Times (s) Test
Series Test ID
Fire Type
Material ID Type Experiment Predicted
Percent Error
NAVY 1-37 Flaming Wood 1 Ion 61 104 70% NAVY 1-37 Flaming Wood 3 Ion 177 104 -41% NAVY 1-37 Flaming Wood 5 Ion 45 151 236% NAVY 1-37 Flaming Wood 7 Ion 174 151 -13% NAVY 1-38 Flaming Wood 1 Ion 62 95 53% NAVY 1-38 Flaming Wood 3 Ion 155 95 -39% NAVY 1-38 Flaming Wood 5 Ion 65 190 192% NAVY 1-38 Flaming Wood 7 Ion 182 190 4% NAVY 1-39 Flaming Wood 1 Ion 69 99 43% NAVY 1-39 Flaming Wood 3 Ion 43 99 130% NAVY 1-39 Flaming Wood 5 Ion 39 173 344% NAVY 1-39 Flaming Wood 7 Ion 134 173 29% NAVY 1-40 Flaming Wood 1 Ion 43 139 223% NAVY 1-40 Flaming Wood 3 Ion 123 139 13% NAVY 1-40 Flaming Wood 5 Ion 39 119 205% NAVY 1-40 Flaming Wood 7 Ion 57 119 109% NAVY 1-41 Flaming Wood 1 Ion 69 36 -48% NAVY 1-41 Flaming Wood 3 Ion 152 36 -76% NAVY 1-41 Flaming Wood 5 Ion 46 106 130% NAVY 1-41 Flaming Wood 7 Ion 124 106 -15% NAVY 1-50 Flaming Wood 9 Ion 24 34 42% NAVY 1-50 Flaming Wood 11 Ion 25 34 36% NAVY 1-50 Flaming Wood 13 Ion 48 148 208% NAVY 1-50 Flaming Wood 15 Ion 65 148 128% NAVY 1-50 Flaming Wood 17 Ion 75 126 68% NAVY 1-50 Flaming Wood 19 Ion 128 126 -2% NAVY 1-50 Flaming Wood 21 Ion 112 149 33% NAVY 1-50 Flaming Wood 23 Ion 161 149 -7% NAVY 1-51 Flaming Wood 9 Ion 22 100 355% NAVY 1-51 Flaming Wood 11 Ion 22 100 355% NAVY 1-51 Flaming Wood 13 Ion 44 206 368% NAVY 1-51 Flaming Wood 15 Ion 90 206 129% NAVY 1-51 Flaming Wood 17 Ion 79 166 110% NAVY 1-51 Flaming Wood 19 Ion 182 166 -9% NAVY 1-51 Flaming Wood 21 Ion 99 224 126% NAVY 1-51 Flaming Wood 23 Ion 89 224 152% NAVY 1-52 Flaming Wood 9 Ion 21 151 619% NAVY 1-52 Flaming Wood 11 Ion 25 151 504% NAVY 1-52 Flaming Wood 13 Ion 38 152 300% NAVY 1-52 Flaming Wood 15 Ion 65 152 134% NAVY 1-52 Flaming Wood 19 Ion 73 88 21% NAVY 1-52 Flaming Wood 21 Ion 84 430 412% NAVY 1-52 Flaming Wood 23 Ion 177 430 143% NAVY 1-53 Flaming Wood 11 Ion 16 127 694%

204
Temperature Rise Alarm Threshold: 4 °C Detector Alarm Times (s) Test
Series Test ID
Fire Type
Material ID Type Experiment Predicted
Percent Error
NAVY 1-53 Flaming Wood 13 Ion 42 208 395% NAVY 1-53 Flaming Wood 15 Ion 101 208 106% NAVY 1-53 Flaming Wood 17 Ion 123 212 72% NAVY 1-53 Flaming Wood 19 Ion 126 212 68% NAVY 1-53 Flaming Wood 21 Ion 95 277 192% NAVY 1-53 Flaming Wood 23 Ion 164 277 69% NAVY 1-54 Flaming Wood 9 Ion 27 46 70% NAVY 1-54 Flaming Wood 13 Ion 50 55 10% NAVY 1-54 Flaming Wood 15 Ion 66 55 -17% NAVY 1-54 Flaming Wood 17 Ion 75 151 101% NAVY 1-54 Flaming Wood 19 Ion 116 151 30% NAVY 1-55 Flaming Wood 13 Ion 36 69 92% NAVY 1-55 Flaming Wood 15 Ion 68 69 1% NAVY 1-55 Flaming Wood 17 Ion 53 62 17% NAVY 1-55 Flaming Wood 19 Ion 43 62 44% NAVY 2-09 Flaming Cardboard 1 Ion 162 184 14% NAVY 2-09 Flaming Cardboard 3 Ion 165 184 12% NAVY 2-09 Flaming Cardboard 5 Ion 86 104 21% NAVY 2-09 Flaming Cardboard 7 Ion 100 104 4% NAVY 2-10 Flaming Cardboard 1 Ion 229 122 -47% NAVY 2-10 Flaming Cardboard 3 Ion 239 122 -49% NAVY 2-10 Flaming Cardboard 5 Ion 166 47 -72% NAVY 2-10 Flaming Cardboard 7 Ion 228 47 -79% NAVY 2-11 Flaming Cardboard 3 Ion 67 83 24% NAVY 2-11 Flaming Cardboard 5 Ion 93 100 8% NAVY 2-11 Flaming Cardboard 7 Ion 89 100 12% NAVY 2-12 Flaming Cardboard 1 Ion 28 79 182% NAVY 2-12 Flaming Cardboard 3 Ion 57 79 39% NAVY 2-12 Flaming Cardboard 5 Ion 66 77 17% NAVY 2-12 Flaming Cardboard 7 Ion 63 77 22% NAVY 2-21 Flaming Cardboard 9 Ion 93 161 73% NAVY 2-21 Flaming Cardboard 11 Ion 247 161 -35% NAVY 2-21 Flaming Cardboard 13 Ion 63 61 -3% NAVY 2-21 Flaming Cardboard 15 Ion 36 61 69% NAVY 2-21 Flaming Cardboard 17 Ion 151 206 36% NAVY 2-21 Flaming Cardboard 19 Ion 174 206 18% NAVY 2-21 Flaming Cardboard 21 Ion 143 162 13% NAVY 2-21 Flaming Cardboard 23 Ion 195 162 -17% NAVY 2-22 Flaming Cardboard 9 Ion 74 117 58% NAVY 2-22 Flaming Cardboard 11 Ion 129 117 -9% NAVY 2-22 Flaming Cardboard 13 Ion 43 74 72% NAVY 2-22 Flaming Cardboard 15 Ion 30 74 147% NAVY 2-22 Flaming Cardboard 17 Ion 302 114 -62% NAVY 2-22 Flaming Cardboard 19 Ion 126 114 -10%

205
Temperature Rise Alarm Threshold: 4 °C Detector Alarm Times (s) Test
Series Test ID
Fire Type
Material ID Type Experiment Predicted
Percent Error
NAVY 2-22 Flaming Cardboard 21 Ion 87 95 9% NAVY 2-22 Flaming Cardboard 23 Ion 127 95 -25% NAVY 2-23 Flaming Cardboard 11 Ion 120 177 48% NAVY 2-23 Flaming Cardboard 13 Ion 119 205 72% NAVY 2-23 Flaming Cardboard 15 Ion 143 205 43% NAVY 2-23 Flaming Cardboard 17 Ion 54 112 107% NAVY 2-23 Flaming Cardboard 19 Ion 122 112 -8% NAVY 2-23 Flaming Cardboard 21 Ion 125 194 55% NAVY 2-23 Flaming Cardboard 23 Ion 144 194 35% NAVY 2-24 Flaming Cardboard 11 Ion 98 129 32% NAVY 2-24 Flaming Cardboard 13 Ion 117 161 38% NAVY 2-24 Flaming Cardboard 15 Ion 142 161 13% NAVY 2-24 Flaming Cardboard 17 Ion 62 79 27% NAVY 2-24 Flaming Cardboard 19 Ion 100 79 -21% NAVY 2-24 Flaming Cardboard 21 Ion 58 127 119% NAVY 2-24 Flaming Cardboard 23 Ion 67 127 90% NAVY 1-37 Flaming Wood 2 Photo 901 104 -88% NAVY 1-37 Flaming Wood 4 Photo 1007 104 -90% NAVY 1-37 Flaming Wood 6 Photo 816 151 -81% NAVY 1-37 Flaming Wood 8 Photo 990 151 -85% NAVY 1-38 Flaming Wood 2 Photo 874 95 -89% NAVY 1-38 Flaming Wood 4 Photo 860 95 -89% NAVY 1-38 Flaming Wood 6 Photo 794 190 -76% NAVY 1-38 Flaming Wood 8 Photo 943 190 -80% NAVY 1-39 Flaming Wood 2 Photo 546 99 -82% NAVY 1-39 Flaming Wood 4 Photo 555 99 -82% NAVY 1-39 Flaming Wood 6 Photo 366 173 -53% NAVY 1-39 Flaming Wood 8 Photo 634 173 -73% NAVY 1-40 Flaming Wood 2 Photo 1036 139 -87% NAVY 1-40 Flaming Wood 4 Photo 886 139 -84% NAVY 1-40 Flaming Wood 6 Photo 956 119 -88% NAVY 1-40 Flaming Wood 8 Photo 1023 119 -88% NAVY 1-41 Flaming Wood 2 Photo 529 36 -93% NAVY 1-41 Flaming Wood 4 Photo 494 36 -93% NAVY 1-41 Flaming Wood 6 Photo 484 106 -78% NAVY 1-41 Flaming Wood 8 Photo 553 106 -81% NAVY 1-50 Flaming Wood 12 Photo 1113 34 -97% NAVY 1-50 Flaming Wood 16 Photo 1149 148 -87% NAVY 1-50 Flaming Wood 20 Photo 1194 126 -89% NAVY 1-50 Flaming Wood 24 Photo 1149 149 -87% NAVY 1-51 Flaming Wood 10 Photo 28 100 257% NAVY 1-51 Flaming Wood 12 Photo 17 100 488% NAVY 1-51 Flaming Wood 14 Photo 54 206 281% NAVY 1-51 Flaming Wood 16 Photo 53 206 289%

206
Temperature Rise Alarm Threshold: 4 °C Detector Alarm Times (s) Test
Series Test ID
Fire Type
Material ID Type Experiment Predicted
Percent Error
NAVY 1-51 Flaming Wood 18 Photo 612 166 -73% NAVY 1-51 Flaming Wood 20 Photo 82 166 102% NAVY 1-51 Flaming Wood 22 Photo 518 224 -57% NAVY 1-52 Flaming Wood 10 Photo 16 151 844% NAVY 1-52 Flaming Wood 12 Photo 17 151 788% NAVY 1-52 Flaming Wood 14 Photo 38 152 300% NAVY 1-52 Flaming Wood 16 Photo 35 152 334% NAVY 1-52 Flaming Wood 18 Photo 49 88 80% NAVY 1-52 Flaming Wood 20 Photo 40 88 120% NAVY 1-53 Flaming Wood 10 Photo 790 127 -84% NAVY 1-53 Flaming Wood 12 Photo 908 127 -86% NAVY 1-53 Flaming Wood 14 Photo 662 208 -69% NAVY 1-53 Flaming Wood 16 Photo 768 208 -73% NAVY 1-53 Flaming Wood 18 Photo 841 212 -75% NAVY 1-53 Flaming Wood 20 Photo 689 212 -69% NAVY 1-53 Flaming Wood 22 Photo 680 277 -59% NAVY 1-53 Flaming Wood 24 Photo 906 277 -69% NAVY 1-54 Flaming Wood 10 Photo 51 46 -10% NAVY 1-54 Flaming Wood 14 Photo 51 55 8% NAVY 1-54 Flaming Wood 16 Photo 45 55 22% NAVY 1-54 Flaming Wood 18 Photo 96 151 57% NAVY 1-54 Flaming Wood 20 Photo 49 151 208% NAVY 1-55 Flaming Wood 10 Photo 40 145 263% NAVY 1-55 Flaming Wood 16 Photo 35 69 97% NAVY 1-55 Flaming Wood 18 Photo 55 62 13% NAVY 1-55 Flaming Wood 20 Photo 35 62 77% NAVY 2-09 Flaming Cardboard 2 Photo 480 184 -62% NAVY 2-09 Flaming Cardboard 4 Photo 169 184 9% NAVY 2-09 Flaming Cardboard 6 Photo 129 104 -19% NAVY 2-09 Flaming Cardboard 8 Photo 124 104 -16% NAVY 2-10 Flaming Cardboard 2 Photo 643 122 -81% NAVY 2-10 Flaming Cardboard 4 Photo 281 122 -57% NAVY 2-10 Flaming Cardboard 6 Photo 592 47 -92% NAVY 2-10 Flaming Cardboard 8 Photo 260 47 -82% NAVY 2-11 Flaming Cardboard 2 Photo 76 83 9% NAVY 2-11 Flaming Cardboard 4 Photo 84 83 -1% NAVY 2-11 Flaming Cardboard 6 Photo 110 100 -9% NAVY 2-11 Flaming Cardboard 8 Photo 93 100 8% NAVY 2-12 Flaming Cardboard 4 Photo 82 79 -4% NAVY 2-12 Flaming Cardboard 6 Photo 115 77 -33% NAVY 2-12 Flaming Cardboard 8 Photo 107 77 -28% NAVY 2-21 Flaming Cardboard 12 Photo 472 161 -66% NAVY 2-21 Flaming Cardboard 14 Photo 164 61 -63% NAVY 2-21 Flaming Cardboard 16 Photo 153 61 -60%
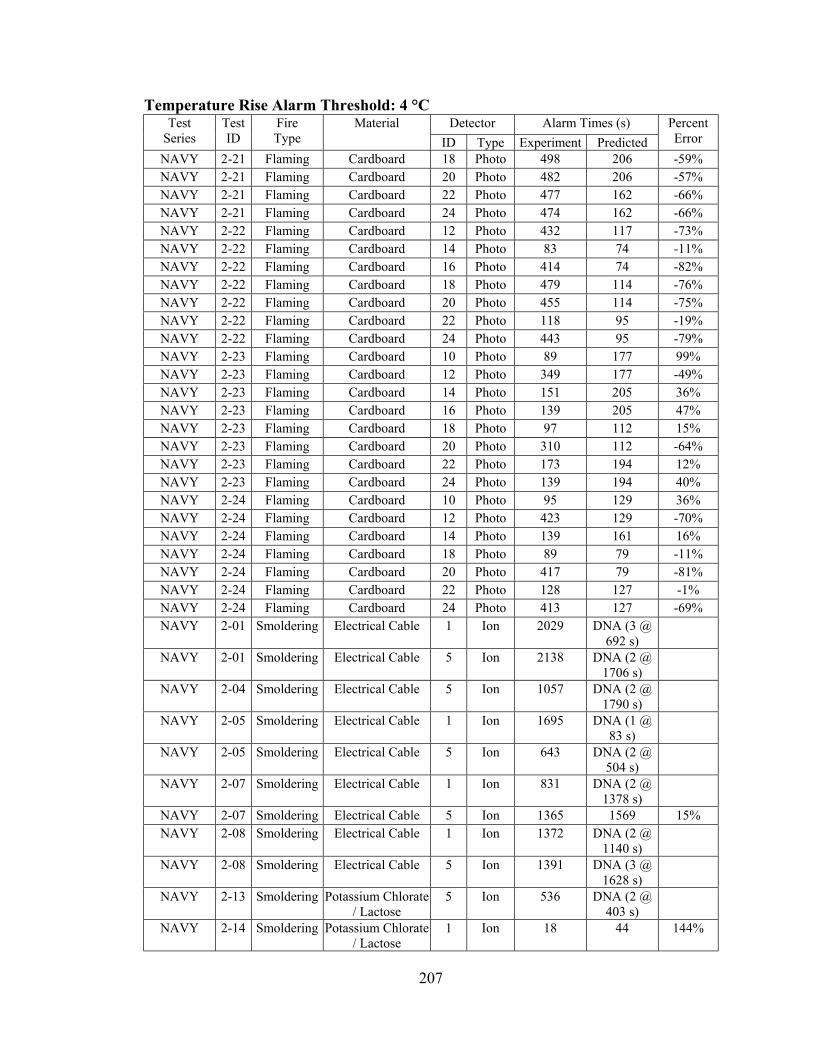
207
Temperature Rise Alarm Threshold: 4 °C Detector Alarm Times (s) Test
Series Test ID
Fire Type
Material ID Type Experiment Predicted
Percent Error
NAVY 2-21 Flaming Cardboard 18 Photo 498 206 -59% NAVY 2-21 Flaming Cardboard 20 Photo 482 206 -57% NAVY 2-21 Flaming Cardboard 22 Photo 477 162 -66% NAVY 2-21 Flaming Cardboard 24 Photo 474 162 -66% NAVY 2-22 Flaming Cardboard 12 Photo 432 117 -73% NAVY 2-22 Flaming Cardboard 14 Photo 83 74 -11% NAVY 2-22 Flaming Cardboard 16 Photo 414 74 -82% NAVY 2-22 Flaming Cardboard 18 Photo 479 114 -76% NAVY 2-22 Flaming Cardboard 20 Photo 455 114 -75% NAVY 2-22 Flaming Cardboard 22 Photo 118 95 -19% NAVY 2-22 Flaming Cardboard 24 Photo 443 95 -79% NAVY 2-23 Flaming Cardboard 10 Photo 89 177 99% NAVY 2-23 Flaming Cardboard 12 Photo 349 177 -49% NAVY 2-23 Flaming Cardboard 14 Photo 151 205 36% NAVY 2-23 Flaming Cardboard 16 Photo 139 205 47% NAVY 2-23 Flaming Cardboard 18 Photo 97 112 15% NAVY 2-23 Flaming Cardboard 20 Photo 310 112 -64% NAVY 2-23 Flaming Cardboard 22 Photo 173 194 12% NAVY 2-23 Flaming Cardboard 24 Photo 139 194 40% NAVY 2-24 Flaming Cardboard 10 Photo 95 129 36% NAVY 2-24 Flaming Cardboard 12 Photo 423 129 -70% NAVY 2-24 Flaming Cardboard 14 Photo 139 161 16% NAVY 2-24 Flaming Cardboard 18 Photo 89 79 -11% NAVY 2-24 Flaming Cardboard 20 Photo 417 79 -81% NAVY 2-24 Flaming Cardboard 22 Photo 128 127 -1% NAVY 2-24 Flaming Cardboard 24 Photo 413 127 -69% NAVY 2-01 Smoldering Electrical Cable 1 Ion 2029 DNA (3 @
692 s)
NAVY 2-01 Smoldering Electrical Cable 5 Ion 2138 DNA (2 @ 1706 s)
NAVY 2-04 Smoldering Electrical Cable 5 Ion 1057 DNA (2 @ 1790 s)
NAVY 2-05 Smoldering Electrical Cable 1 Ion 1695 DNA (1 @ 83 s)
NAVY 2-05 Smoldering Electrical Cable 5 Ion 643 DNA (2 @ 504 s)
NAVY 2-07 Smoldering Electrical Cable 1 Ion 831 DNA (2 @ 1378 s)
NAVY 2-07 Smoldering Electrical Cable 5 Ion 1365 1569 15% NAVY 2-08 Smoldering Electrical Cable 1 Ion 1372 DNA (2 @
1140 s)
NAVY 2-08 Smoldering Electrical Cable 5 Ion 1391 DNA (3 @ 1628 s)
NAVY 2-13 Smoldering Potassium Chlorate / Lactose
5 Ion 536 DNA (2 @ 403 s)
NAVY 2-14 Smoldering Potassium Chlorate / Lactose
1 Ion 18 44 144%
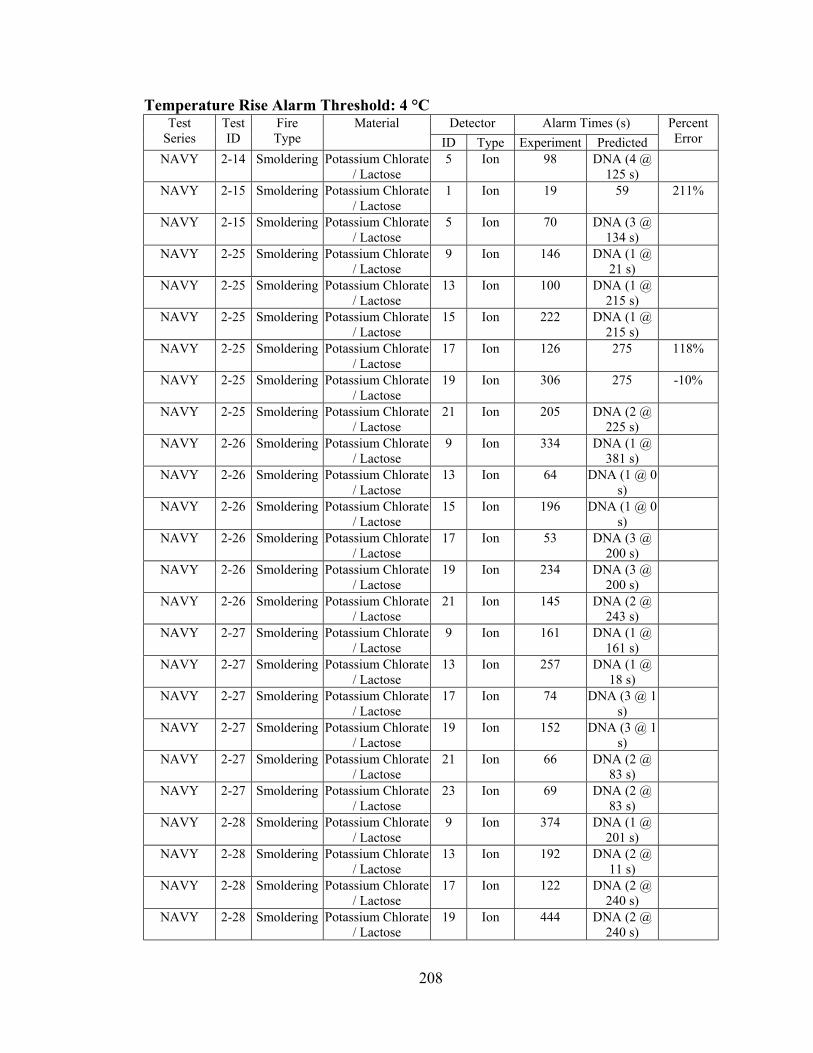
208
Temperature Rise Alarm Threshold: 4 °C Detector Alarm Times (s) Test
Series Test ID
Fire Type
Material ID Type Experiment Predicted
Percent Error
NAVY 2-14 Smoldering Potassium Chlorate / Lactose
5 Ion 98 DNA (4 @ 125 s)
NAVY 2-15 Smoldering Potassium Chlorate / Lactose
1 Ion 19 59 211%
NAVY 2-15 Smoldering Potassium Chlorate / Lactose
5 Ion 70 DNA (3 @ 134 s)
NAVY 2-25 Smoldering Potassium Chlorate / Lactose
9 Ion 146 DNA (1 @ 21 s)
NAVY 2-25 Smoldering Potassium Chlorate / Lactose
13 Ion 100 DNA (1 @ 215 s)
NAVY 2-25 Smoldering Potassium Chlorate / Lactose
15 Ion 222 DNA (1 @ 215 s)
NAVY 2-25 Smoldering Potassium Chlorate / Lactose
17 Ion 126 275 118%
NAVY 2-25 Smoldering Potassium Chlorate / Lactose
19 Ion 306 275 -10%
NAVY 2-25 Smoldering Potassium Chlorate / Lactose
21 Ion 205 DNA (2 @ 225 s)
NAVY 2-26 Smoldering Potassium Chlorate / Lactose
9 Ion 334 DNA (1 @ 381 s)
NAVY 2-26 Smoldering Potassium Chlorate / Lactose
13 Ion 64 DNA (1 @ 0 s)
NAVY 2-26 Smoldering Potassium Chlorate / Lactose
15 Ion 196 DNA (1 @ 0 s)
NAVY 2-26 Smoldering Potassium Chlorate / Lactose
17 Ion 53 DNA (3 @ 200 s)
NAVY 2-26 Smoldering Potassium Chlorate / Lactose
19 Ion 234 DNA (3 @ 200 s)
NAVY 2-26 Smoldering Potassium Chlorate / Lactose
21 Ion 145 DNA (2 @ 243 s)
NAVY 2-27 Smoldering Potassium Chlorate / Lactose
9 Ion 161 DNA (1 @ 161 s)
NAVY 2-27 Smoldering Potassium Chlorate / Lactose
13 Ion 257 DNA (1 @ 18 s)
NAVY 2-27 Smoldering Potassium Chlorate / Lactose
17 Ion 74 DNA (3 @ 1 s)
NAVY 2-27 Smoldering Potassium Chlorate / Lactose
19 Ion 152 DNA (3 @ 1 s)
NAVY 2-27 Smoldering Potassium Chlorate / Lactose
21 Ion 66 DNA (2 @ 83 s)
NAVY 2-27 Smoldering Potassium Chlorate / Lactose
23 Ion 69 DNA (2 @ 83 s)
NAVY 2-28 Smoldering Potassium Chlorate / Lactose
9 Ion 374 DNA (1 @ 201 s)
NAVY 2-28 Smoldering Potassium Chlorate / Lactose
13 Ion 192 DNA (2 @ 11 s)
NAVY 2-28 Smoldering Potassium Chlorate / Lactose
17 Ion 122 DNA (2 @ 240 s)
NAVY 2-28 Smoldering Potassium Chlorate / Lactose
19 Ion 444 DNA (2 @ 240 s)

209
Temperature Rise Alarm Threshold: 4 °C Detector Alarm Times (s) Test
Series Test ID
Fire Type
Material ID Type Experiment Predicted
Percent Error
NAVY 2-28 Smoldering Potassium Chlorate / Lactose
21 Ion 38 DNA (3 @ 75 s)
NAVY 2-28 Smoldering Potassium Chlorate / Lactose
23 Ion 40 DNA (3 @ 75 s)
NAVY 2-34 Smoldering Electrical Cable 17 Ion 659 DNA (3 @ 828 s)
NAVY 2-34 Smoldering Electrical Cable 19 Ion 840 DNA (3 @ 828 s)
NAVY 2-35 Smoldering Electrical Cable 17 Ion 922 355 -61% NAVY 2-35 Smoldering Electrical Cable 21 Ion 1408 DNA (4 @
1022 s)
NAVY 2-36 Smoldering Electrical Cable 17 Ion 1354 DNA (3 @ 1787 s)
NAVY 2-36 Smoldering Electrical Cable 19 Ion 1490 DNA (3 @ 1787 s)
NAVY 2-37 Smoldering Electrical Cable 9 Ion 654 DNA (1 @ 744 s)
NAVY 2-37 Smoldering Electrical Cable 11 Ion 729 DNA (1 @ 744 s)
NAVY 2-37 Smoldering Electrical Cable 13 Ion 678 DNA (2 @ 474 s)
NAVY 2-37 Smoldering Electrical Cable 17 Ion 335 DNA (4 @ 732 s)
NAVY 2-37 Smoldering Electrical Cable 19 Ion 393 DNA (4 @ 732 s)
NAVY 2-37 Smoldering Electrical Cable 21 Ion 566 DNA (2 @ 758 s)
NAVY 2-38 Smoldering Electrical Cable 13 Ion 767 DNA (1 @ 893 s)
NAVY 2-38 Smoldering Electrical Cable 17 Ion 771 DNA (3 @ 348 s)
NAVY 2-38 Smoldering Electrical Cable 19 Ion 768 DNA (3 @ 348 s)
NAVY 2-38 Smoldering Electrical Cable 21 Ion 561 DNA (2 @ 914 s)
NAVY 2-38 Smoldering Electrical Cable 23 Ion 730 DNA (2 @ 914 s)
NAVY 2-39 Smoldering Electrical Cable 13 Ion 760 DNA (2 @ 623 s)
NAVY 2-40 Smoldering Electrical Cable 13 Ion 448 DNA (1 @ 930 s)
NAVY 2-40 Smoldering Electrical Cable 15 Ion 983 DNA (1 @ 930 s)
NAVY 2-01 Smoldering Electrical Cable 2 Photo 2034 DNA (3 @ 692 s)
NAVY 2-01 Smoldering Electrical Cable 4 Photo 2232 DNA (3 @ 692 s)
NAVY 2-01 Smoldering Electrical Cable 8 Photo 2232 DNA (2 @ 1706 s)
NAVY 2-02 Smoldering Electrical Cable 2 Photo 775 DNA (2 @
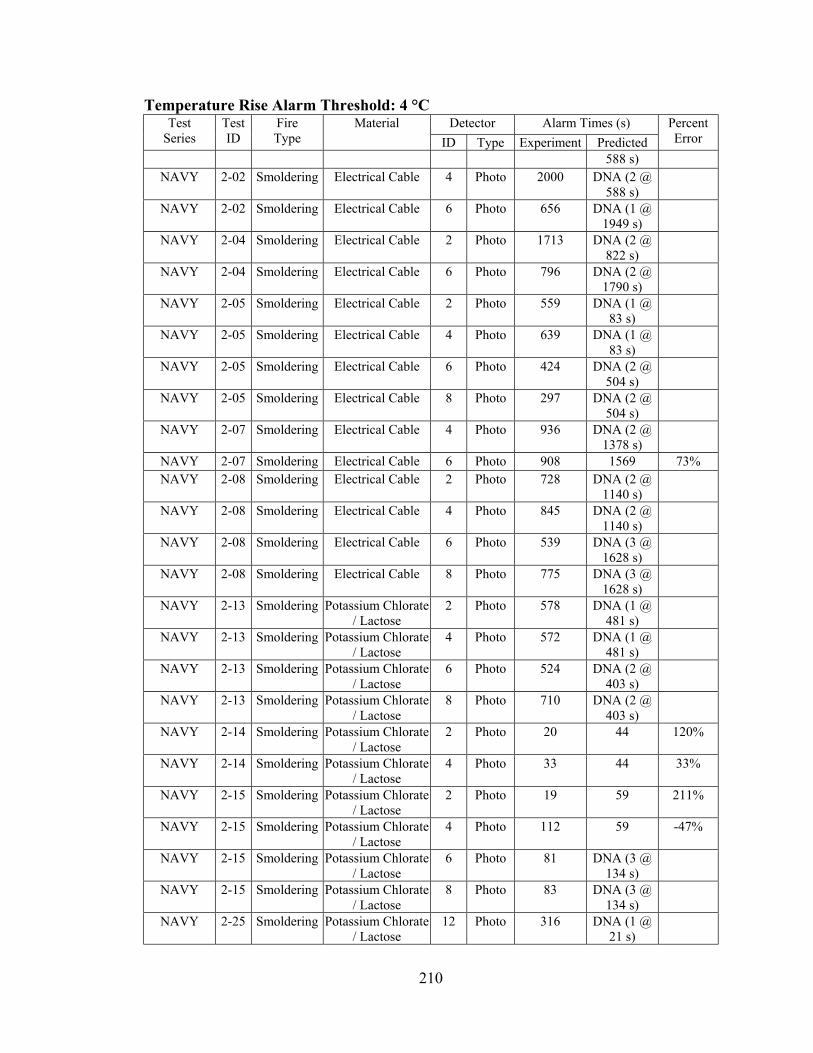
210
Temperature Rise Alarm Threshold: 4 °C Detector Alarm Times (s) Test
Series Test ID
Fire Type
Material ID Type Experiment Predicted
Percent Error
588 s) NAVY 2-02 Smoldering Electrical Cable 4 Photo 2000 DNA (2 @
588 s)
NAVY 2-02 Smoldering Electrical Cable 6 Photo 656 DNA (1 @ 1949 s)
NAVY 2-04 Smoldering Electrical Cable 2 Photo 1713 DNA (2 @ 822 s)
NAVY 2-04 Smoldering Electrical Cable 6 Photo 796 DNA (2 @ 1790 s)
NAVY 2-05 Smoldering Electrical Cable 2 Photo 559 DNA (1 @ 83 s)
NAVY 2-05 Smoldering Electrical Cable 4 Photo 639 DNA (1 @ 83 s)
NAVY 2-05 Smoldering Electrical Cable 6 Photo 424 DNA (2 @ 504 s)
NAVY 2-05 Smoldering Electrical Cable 8 Photo 297 DNA (2 @ 504 s)
NAVY 2-07 Smoldering Electrical Cable 4 Photo 936 DNA (2 @ 1378 s)
NAVY 2-07 Smoldering Electrical Cable 6 Photo 908 1569 73% NAVY 2-08 Smoldering Electrical Cable 2 Photo 728 DNA (2 @
1140 s)
NAVY 2-08 Smoldering Electrical Cable 4 Photo 845 DNA (2 @ 1140 s)
NAVY 2-08 Smoldering Electrical Cable 6 Photo 539 DNA (3 @ 1628 s)
NAVY 2-08 Smoldering Electrical Cable 8 Photo 775 DNA (3 @ 1628 s)
NAVY 2-13 Smoldering Potassium Chlorate / Lactose
2 Photo 578 DNA (1 @ 481 s)
NAVY 2-13 Smoldering Potassium Chlorate / Lactose
4 Photo 572 DNA (1 @ 481 s)
NAVY 2-13 Smoldering Potassium Chlorate / Lactose
6 Photo 524 DNA (2 @ 403 s)
NAVY 2-13 Smoldering Potassium Chlorate / Lactose
8 Photo 710 DNA (2 @ 403 s)
NAVY 2-14 Smoldering Potassium Chlorate / Lactose
2 Photo 20 44 120%
NAVY 2-14 Smoldering Potassium Chlorate / Lactose
4 Photo 33 44 33%
NAVY 2-15 Smoldering Potassium Chlorate / Lactose
2 Photo 19 59 211%
NAVY 2-15 Smoldering Potassium Chlorate / Lactose
4 Photo 112 59 -47%
NAVY 2-15 Smoldering Potassium Chlorate / Lactose
6 Photo 81 DNA (3 @ 134 s)
NAVY 2-15 Smoldering Potassium Chlorate / Lactose
8 Photo 83 DNA (3 @ 134 s)
NAVY 2-25 Smoldering Potassium Chlorate / Lactose
12 Photo 316 DNA (1 @ 21 s)

211
Temperature Rise Alarm Threshold: 4 °C Detector Alarm Times (s) Test
Series Test ID
Fire Type
Material ID Type Experiment Predicted
Percent Error
NAVY 2-25 Smoldering Potassium Chlorate / Lactose
14 Photo 94 DNA (1 @ 215 s)
NAVY 2-25 Smoldering Potassium Chlorate / Lactose
16 Photo 105 DNA (1 @ 215 s)
NAVY 2-25 Smoldering Potassium Chlorate / Lactose
18 Photo 170 275 62%
NAVY 2-25 Smoldering Potassium Chlorate / Lactose
20 Photo 301 275 -9%
NAVY 2-25 Smoldering Potassium Chlorate / Lactose
24 Photo 164 DNA (2 @ 225 s)
NAVY 2-26 Smoldering Potassium Chlorate / Lactose
14 Photo 68 DNA (1 @ 0 s)
NAVY 2-26 Smoldering Potassium Chlorate / Lactose
16 Photo 246 DNA (1 @ 0 s)
NAVY 2-26 Smoldering Potassium Chlorate / Lactose
18 Photo 65 DNA (3 @ 200 s)
NAVY 2-27 Smoldering Potassium Chlorate / Lactose
18 Photo 49 DNA (3 @ 1 s)
NAVY 2-27 Smoldering Potassium Chlorate / Lactose
20 Photo 68 DNA (3 @ 1 s)
NAVY 2-27 Smoldering Potassium Chlorate / Lactose
22 Photo 67 DNA (2 @ 83 s)
NAVY 2-27 Smoldering Potassium Chlorate / Lactose
24 Photo 65 DNA (2 @ 83 s)
NAVY 2-28 Smoldering Potassium Chlorate / Lactose
16 Photo 331 DNA (2 @ 11 s)
NAVY 2-28 Smoldering Potassium Chlorate / Lactose
18 Photo 92 DNA (2 @ 240 s)
NAVY 2-28 Smoldering Potassium Chlorate / Lactose
20 Photo 348 DNA (2 @ 240 s)
NAVY 2-28 Smoldering Potassium Chlorate / Lactose
22 Photo 34 DNA (3 @ 75 s)
NAVY 2-28 Smoldering Potassium Chlorate / Lactose
24 Photo 32 DNA (3 @ 75 s)
NAVY 2-34 Smoldering Electrical Cable 12 Photo 892 DNA (2 @ 7 s)
NAVY 2-34 Smoldering Electrical Cable 18 Photo 297 DNA (3 @ 828 s)
NAVY 2-34 Smoldering Electrical Cable 20 Photo 648 DNA (3 @ 828 s)
NAVY 2-34 Smoldering Electrical Cable 22 Photo 843 DNA (3 @ 31 s)
NAVY 2-34 Smoldering Electrical Cable 24 Photo 732 DNA (3 @ 31 s)
NAVY 2-35 Smoldering Electrical Cable 18 Photo 423 355 -16% NAVY 2-35 Smoldering Electrical Cable 20 Photo 851 355 -58% NAVY 2-35 Smoldering Electrical Cable 22 Photo 656 DNA (4 @
1022 s)
NAVY 2-35 Smoldering Electrical Cable 24 Photo 989 DNA (4 @ 1022 s)

212
Temperature Rise Alarm Threshold: 4 °C Detector Alarm Times (s) Test
Series Test ID
Fire Type
Material ID Type Experiment Predicted
Percent Error
NAVY 2-36 Smoldering Electrical Cable 14 Photo 1611 DNA (3 @ 963 s)
NAVY 2-36 Smoldering Electrical Cable 18 Photo 756 DNA (3 @ 1787 s)
NAVY 2-36 Smoldering Electrical Cable 20 Photo 860 DNA (3 @ 1787 s)
NAVY 2-36 Smoldering Electrical Cable 22 Photo 1356 DNA (2 @ 2 s)
NAVY 2-36 Smoldering Electrical Cable 24 Photo 915 DNA (2 @ 2 s)
NAVY 2-37 Smoldering Electrical Cable 12 Photo 700 DNA (1 @ 744 s)
NAVY 2-37 Smoldering Electrical Cable 14 Photo 759 DNA (2 @ 474 s)
NAVY 2-37 Smoldering Electrical Cable 16 Photo 735 DNA (2 @ 474 s)
NAVY 2-37 Smoldering Electrical Cable 18 Photo 295 DNA (4 @ 732 s)
NAVY 2-37 Smoldering Electrical Cable 20 Photo 331 DNA (4 @ 732 s)
NAVY 2-37 Smoldering Electrical Cable 22 Photo 633 DNA (2 @ 758 s)
NAVY 2-37 Smoldering Electrical Cable 24 Photo 506 DNA (2 @ 758 s)
NAVY 2-38 Smoldering Electrical Cable 14 Photo 754 DNA (1 @ 893 s)
NAVY 2-38 Smoldering Electrical Cable 16 Photo 843 DNA (1 @ 893 s)
NAVY 2-38 Smoldering Electrical Cable 18 Photo 549 DNA (3 @ 348 s)
NAVY 2-38 Smoldering Electrical Cable 20 Photo 709 DNA (3 @ 348 s)
NAVY 2-38 Smoldering Electrical Cable 22 Photo 189 DNA (2 @ 914 s)
NAVY 2-38 Smoldering Electrical Cable 24 Photo 418 DNA (2 @ 914 s)
NAVY 2-39 Smoldering Electrical Cable 14 Photo 941 DNA (2 @ 623 s)
NAVY 2-39 Smoldering Electrical Cable 16 Photo 856 DNA (2 @ 623 s)
NAVY 2-39 Smoldering Electrical Cable 18 Photo 1362 DNA (2 @ 312 s)
NAVY 2-39 Smoldering Electrical Cable 22 Photo 786 DNA (2 @ 270 s)
NAVY 2-39 Smoldering Electrical Cable 24 Photo 689 DNA (2 @ 270 s)
NAVY 2-40 Smoldering Electrical Cable 14 Photo 402 DNA (1 @ 930 s)
NAVY 2-40 Smoldering Electrical Cable 16 Photo 679 DNA (1 @ 930 s)

213
Temperature Rise Alarm Threshold: 4 °C Detector Alarm Times (s) Test
Series Test ID
Fire Type
Material ID Type Experiment Predicted
Percent Error
NAVY 2-40 Smoldering Electrical Cable 18 Photo 1201 DNA (2 @ 1069 s)
NAVY 2-40 Smoldering Electrical Cable 20 Photo 1387 DNA (2 @ 1069 s)
NAVY 2-40 Smoldering Electrical Cable 22 Photo 1542 DNA (3 @ 1534 s)
KEMANO 01 Flaming Wood 28 Ion 480 DNA (1 @ 795 s)
KEMANO 02 Flaming Wood 14 Ion 1359 DNA (3 @ 1464 s)
KEMANO 02 Flaming Wood 28 Ion 1388 DNA (0 @ 1507 s)
KEMANO 03 Flaming Cotton Fabric 8 Ion 122 590 867% KEMANO 03 Flaming Cotton Fabric 14 Ion 155 579 487% KEMANO 03 Flaming Cotton Fabric 28 Ion 226 DNA (1 @
836 s)
KEMANO 05 Flaming Upholstered Furniture
28 Ion 875 DNA (1 @ 1062 s)
KEMANO 06 Flaming Wood 8 Ion 1111 DNA (1 @ 1184 s)
KEMANO 06 Flaming Wood 14 Ion 389 DNA (2 @ 771 s)
KEMANO 06 Flaming Wood 28 Ion 277 669 912% KEMANO 07 Flaming Wood 8 Ion 1107 DNA (1 @
1203 s)
KEMANO 08 Flaming Upholstered Furniture
8 Ion 760 DNA (0 @ 931 s)
KEMANO 08 Flaming Upholstered Furniture
14 Ion 860 DNA (2 @ 968 s)
KEMANO 09 Flaming Upholstered Furniture
14 Ion 906 921 29%
KEMANO 10 Flaming Wood 13 Ion 2851 DNA (2 @ 2867 s)
KEMANO 11 Flaming Upholstered Furniture
1 Ion 1690 DNA (3 @ 1724 s)
KEMANO 11 Flaming Upholstered Furniture
4 Ion 1723 DNA (2 @ 1760 s)
KEMANO 11 Flaming Upholstered Furniture
7 Ion 1763 DNA (1 @ 1765 s)
KEMANO 11 Flaming Upholstered Furniture
10 Ion 1756 DNA (0 @ 1787 s)
KEMANO 13 Flaming Paper 13 Ion 4977 DNA (0 @ 5045 s)
KEMANO 01 Flaming Wood 26 Photo 545 DNA (1 @ 795 s)
KEMANO 02 Flaming Wood 16 Photo 1377 DNA (3 @ 1464 s)
KEMANO 02 Flaming Wood 26 Photo 1408 DNA (0 @ 1507 s)
KEMANO 03 Flaming Cotton Fabric 6 Photo 403 590 56%

214
Temperature Rise Alarm Threshold: 4 °C Detector Alarm Times (s) Test
Series Test ID
Fire Type
Material ID Type Experiment Predicted
Percent Error
KEMANO 03 Flaming Cotton Fabric 16 Photo 368 579 70% KEMANO 04 Flaming Paper 26 Photo 787 DNA (0 @
867 s)
KEMANO 05 Flaming Upholstered Furniture
26 Photo 922 DNA (1 @ 1062 s)
KEMANO 06 Flaming Wood 6 Photo 1112 DNA (1 @ 1184 s)
KEMANO 06 Flaming Wood 26 Photo 265 669 1303% KEMANO 07 Flaming Wood 6 Photo 1115 DNA (1 @
1203 s)
KEMANO 01 Smoldering Wood 8 Ion 269 DNA (1 @ 383 s)
KEMANO 01 Smoldering Wood 14 Ion 422 DNA (0 @ 12 s)
KEMANO 02 Smoldering Wood 8 Ion 218 DNA (1 @ 385 s)
KEMANO 04 Smoldering Paper 8 Ion 522 DNA (0 @ 584 s)
KEMANO 04 Smoldering Paper 14 Ion 377 DNA (1 @ 580 s)
KEMANO 04 Smoldering Paper 28 Ion 686 DNA (0 @ 0 s)
KEMANO 05 Smoldering Upholstered Furniture
8 Ion 325 DNA (2 @ 746 s)
KEMANO 05 Smoldering Upholstered Furniture
14 Ion 315 DNA (2 @ 718 s)
KEMANO 07 Smoldering Wood 14 Ion 606 DNA (1 @ 23 s)
KEMANO 07 Smoldering Wood 28 Ion 383 DNA (0 @ 2 s)
KEMANO 08 Smoldering Upholstered Furniture
28 Ion 715 DNA (1 @ 720 s)
KEMANO 09 Smoldering Upholstered Furniture
8 Ion 924 DNA (0 @ 672 s)
KEMANO 09 Smoldering Upholstered Furniture
28 Ion 795 DNA (1 @ 851 s)
KEMANO 10 Smoldering Wood 1 Ion 681 DNA (0 @ 1 s)
KEMANO 10 Smoldering Wood 4 Ion 1044 DNA (0 @ 30 s)
KEMANO 10 Smoldering Wood 7 Ion 2017 DNA (0 @ 18 s)
KEMANO 10 Smoldering Wood 10 Ion 2055 DNA (0 @ 18 s)
KEMANO 13 Smoldering Paper 1 Ion 3121 DNA (1 @ 3781 s)
KEMANO 13 Smoldering Paper 4 Ion 3246 DNA (1 @ 3934 s)
KEMANO 13 Smoldering Paper 7 Ion 4001 DNA (0 @ 15 s)

215
Temperature Rise Alarm Threshold: 4 °C Detector Alarm Times (s) Test
Series Test ID
Fire Type
Material ID Type Experiment Predicted
Percent Error
KEMANO 13 Smoldering Paper 10 Ion 4091 DNA (0 @ 17 s)
KEMANO 01 Smoldering Wood 6 Photo 313 DNA (1 @ 383 s)
KEMANO 01 Smoldering Wood 16 Photo 337 DNA (0 @ 12 s)
KEMANO 02 Smoldering Wood 6 Photo 223 DNA (1 @ 385 s)
KEMANO 04 Smoldering Paper 6 Photo 521 DNA (0 @ 584 s)
KEMANO 04 Smoldering Paper 16 Photo 373 DNA (1 @ 580 s)
KEMANO 05 Smoldering Upholstered Furniture
6 Photo 461 DNA (2 @ 746 s)
KEMANO 05 Smoldering Upholstered Furniture
16 Photo 356 DNA (2 @ 718 s)
KEMANO 06 Smoldering Wood 16 Photo 297 DNA (1 @ 63 s)
KEMANO 07 Smoldering Wood 16 Photo 342 DNA (1 @ 23 s)
KEMANO 07 Smoldering Wood 26 Photo 374 DNA (0 @ 2 s)
KEMANO 08 Smoldering Upholstered Furniture
6 Photo 376 DNA (0 @ 0 s)
KEMANO 08 Smoldering Upholstered Furniture
16 Photo 334 DNA (1 @ 706 s)
KEMANO 08 Smoldering Upholstered Furniture
26 Photo 254 DNA (1 @ 720 s)
KEMANO 09 Smoldering Upholstered Furniture
6 Photo 755 DNA (0 @ 672 s)
KEMANO 09 Smoldering Upholstered Furniture
16 Photo 376 DNA (1 @ 701 s)
KEMANO 09 Smoldering Upholstered Furniture
26 Photo 288 DNA (1 @ 851 s)
KEMANO 10 Smoldering Wood 3 Photo 418 DNA (0 @ 1 s)
KEMANO 10 Smoldering Wood 6 Photo 504 DNA (0 @ 30 s)
KEMANO 10 Smoldering Wood 9 Photo 605 DNA (0 @ 18 s)
KEMANO 10 Smoldering Wood 12 Photo 755 DNA (0 @ 18 s)
KEMANO 10 Smoldering Wood 15 Photo 687 DNA (0 @ 18 s)
KEMANO 11 Smoldering Upholstered Furniture
3 Photo 344 DNA (0 @ 22 s)
KEMANO 11 Smoldering Upholstered Furniture
6 Photo 371 DNA (0 @ 117 s)
KEMANO 11 Smoldering Upholstered Furniture
9 Photo 439 DNA (0 @ 20 s)
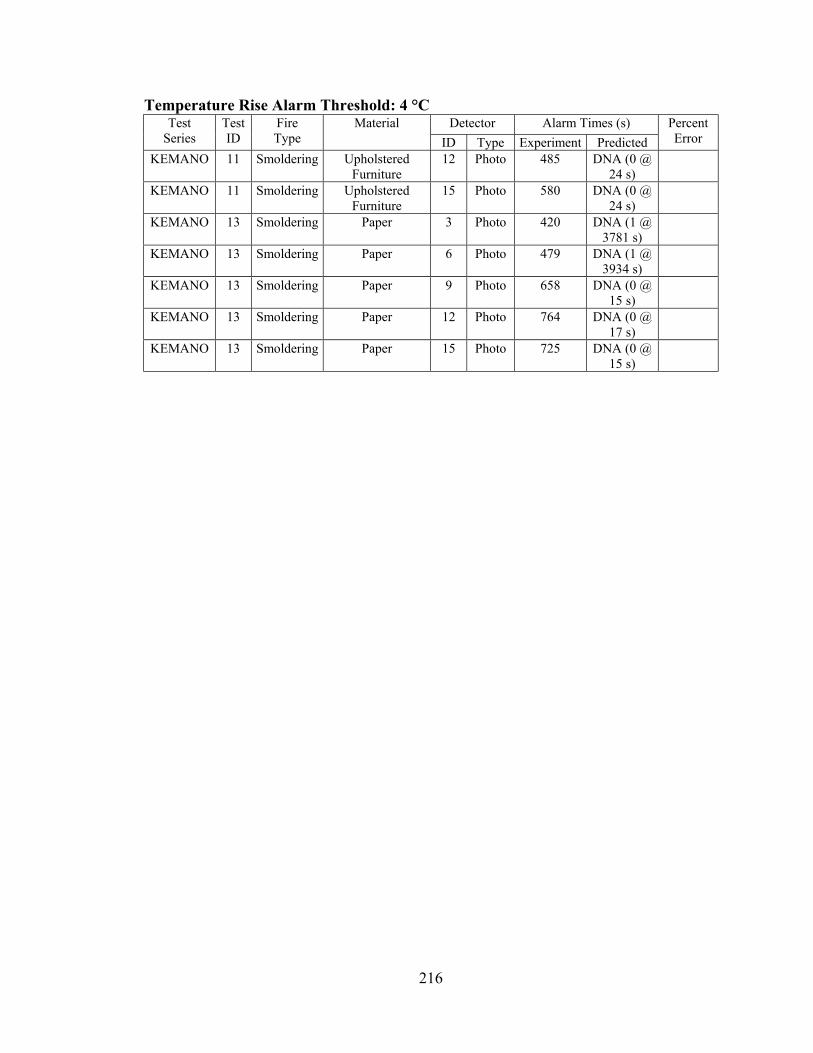
216
Temperature Rise Alarm Threshold: 4 °C Detector Alarm Times (s) Test
Series Test ID
Fire Type
Material ID Type Experiment Predicted
Percent Error
KEMANO 11 Smoldering Upholstered Furniture
12 Photo 485 DNA (0 @ 24 s)
KEMANO 11 Smoldering Upholstered Furniture
15 Photo 580 DNA (0 @ 24 s)
KEMANO 13 Smoldering Paper 3 Photo 420 DNA (1 @ 3781 s)
KEMANO 13 Smoldering Paper 6 Photo 479 DNA (1 @ 3934 s)
KEMANO 13 Smoldering Paper 9 Photo 658 DNA (0 @ 15 s)
KEMANO 13 Smoldering Paper 12 Photo 764 DNA (0 @ 17 s)
KEMANO 13 Smoldering Paper 15 Photo 725 DNA (0 @ 15 s)
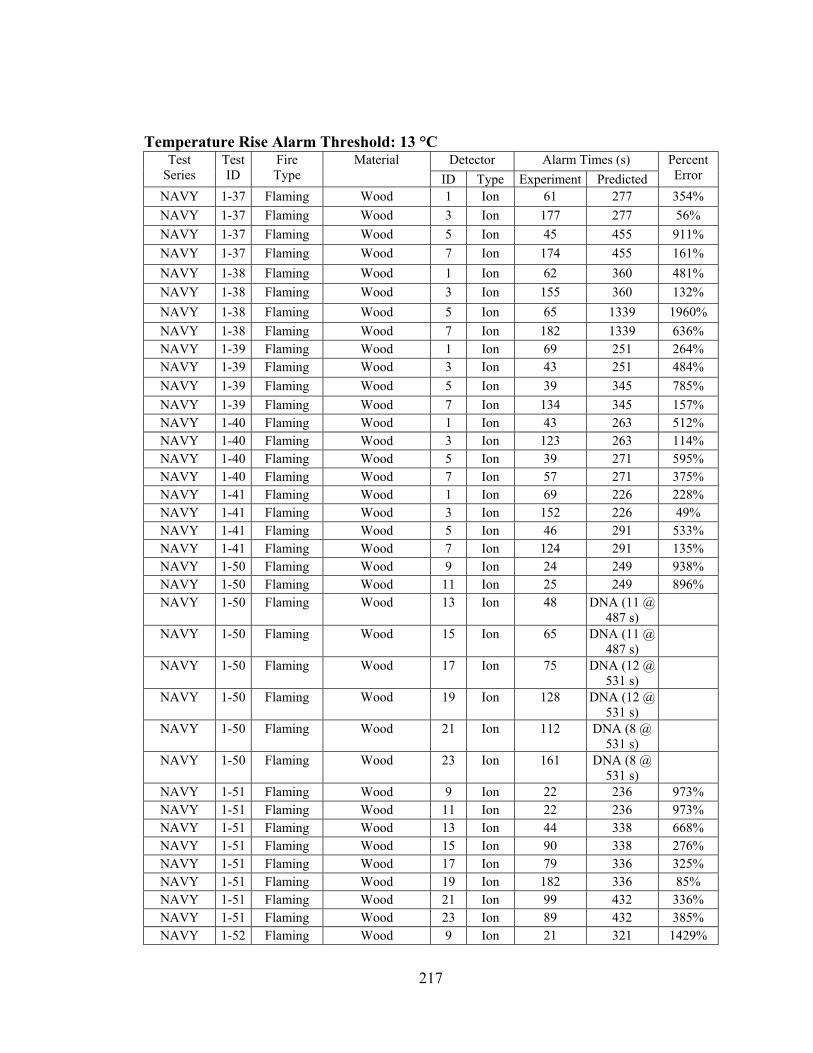
217
Temperature Rise Alarm Threshold: 13 °C Detector Alarm Times (s) Test
Series Test ID
Fire Type
Material ID Type Experiment Predicted
Percent Error
NAVY 1-37 Flaming Wood 1 Ion 61 277 354% NAVY 1-37 Flaming Wood 3 Ion 177 277 56% NAVY 1-37 Flaming Wood 5 Ion 45 455 911% NAVY 1-37 Flaming Wood 7 Ion 174 455 161% NAVY 1-38 Flaming Wood 1 Ion 62 360 481% NAVY 1-38 Flaming Wood 3 Ion 155 360 132% NAVY 1-38 Flaming Wood 5 Ion 65 1339 1960% NAVY 1-38 Flaming Wood 7 Ion 182 1339 636% NAVY 1-39 Flaming Wood 1 Ion 69 251 264% NAVY 1-39 Flaming Wood 3 Ion 43 251 484% NAVY 1-39 Flaming Wood 5 Ion 39 345 785% NAVY 1-39 Flaming Wood 7 Ion 134 345 157% NAVY 1-40 Flaming Wood 1 Ion 43 263 512% NAVY 1-40 Flaming Wood 3 Ion 123 263 114% NAVY 1-40 Flaming Wood 5 Ion 39 271 595% NAVY 1-40 Flaming Wood 7 Ion 57 271 375% NAVY 1-41 Flaming Wood 1 Ion 69 226 228% NAVY 1-41 Flaming Wood 3 Ion 152 226 49% NAVY 1-41 Flaming Wood 5 Ion 46 291 533% NAVY 1-41 Flaming Wood 7 Ion 124 291 135% NAVY 1-50 Flaming Wood 9 Ion 24 249 938% NAVY 1-50 Flaming Wood 11 Ion 25 249 896% NAVY 1-50 Flaming Wood 13 Ion 48 DNA (11 @
487 s)
NAVY 1-50 Flaming Wood 15 Ion 65 DNA (11 @ 487 s)
NAVY 1-50 Flaming Wood 17 Ion 75 DNA (12 @ 531 s)
NAVY 1-50 Flaming Wood 19 Ion 128 DNA (12 @ 531 s)
NAVY 1-50 Flaming Wood 21 Ion 112 DNA (8 @ 531 s)
NAVY 1-50 Flaming Wood 23 Ion 161 DNA (8 @ 531 s)
NAVY 1-51 Flaming Wood 9 Ion 22 236 973% NAVY 1-51 Flaming Wood 11 Ion 22 236 973% NAVY 1-51 Flaming Wood 13 Ion 44 338 668% NAVY 1-51 Flaming Wood 15 Ion 90 338 276% NAVY 1-51 Flaming Wood 17 Ion 79 336 325% NAVY 1-51 Flaming Wood 19 Ion 182 336 85% NAVY 1-51 Flaming Wood 21 Ion 99 432 336% NAVY 1-51 Flaming Wood 23 Ion 89 432 385% NAVY 1-52 Flaming Wood 9 Ion 21 321 1429%
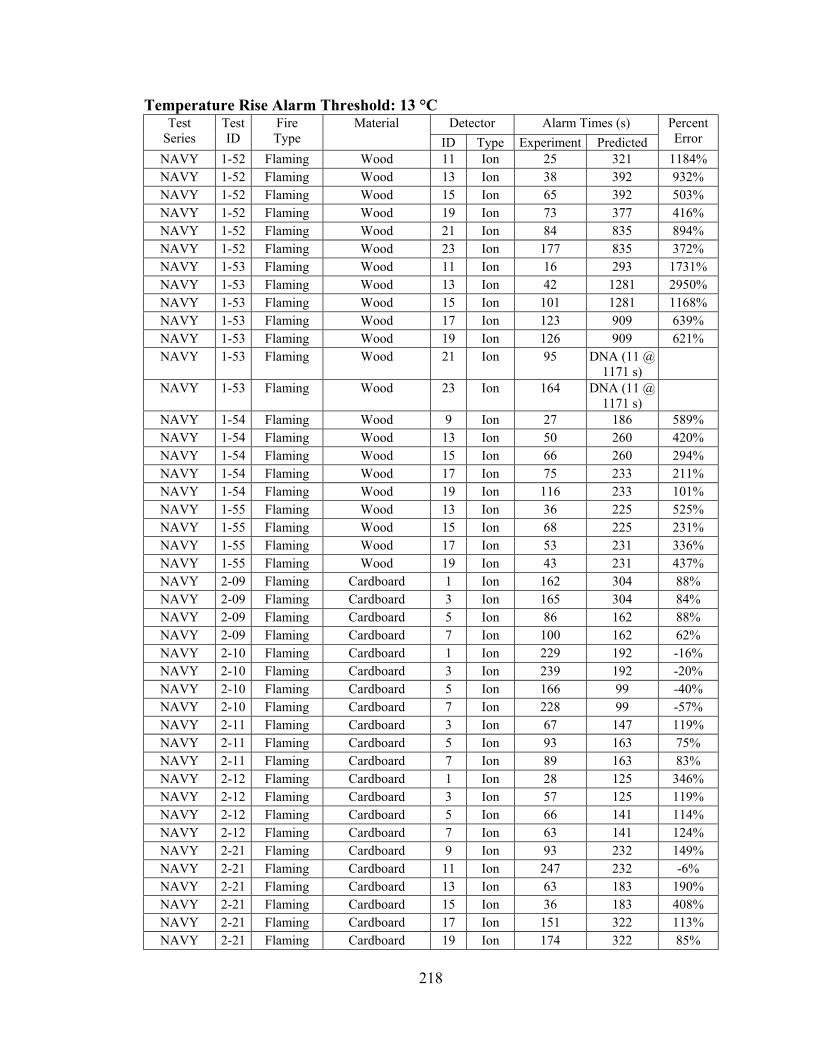
218
Temperature Rise Alarm Threshold: 13 °C Detector Alarm Times (s) Test
Series Test ID
Fire Type
Material ID Type Experiment Predicted
Percent Error
NAVY 1-52 Flaming Wood 11 Ion 25 321 1184% NAVY 1-52 Flaming Wood 13 Ion 38 392 932% NAVY 1-52 Flaming Wood 15 Ion 65 392 503% NAVY 1-52 Flaming Wood 19 Ion 73 377 416% NAVY 1-52 Flaming Wood 21 Ion 84 835 894% NAVY 1-52 Flaming Wood 23 Ion 177 835 372% NAVY 1-53 Flaming Wood 11 Ion 16 293 1731% NAVY 1-53 Flaming Wood 13 Ion 42 1281 2950% NAVY 1-53 Flaming Wood 15 Ion 101 1281 1168% NAVY 1-53 Flaming Wood 17 Ion 123 909 639% NAVY 1-53 Flaming Wood 19 Ion 126 909 621% NAVY 1-53 Flaming Wood 21 Ion 95 DNA (11 @
1171 s)
NAVY 1-53 Flaming Wood 23 Ion 164 DNA (11 @ 1171 s)
NAVY 1-54 Flaming Wood 9 Ion 27 186 589% NAVY 1-54 Flaming Wood 13 Ion 50 260 420% NAVY 1-54 Flaming Wood 15 Ion 66 260 294% NAVY 1-54 Flaming Wood 17 Ion 75 233 211% NAVY 1-54 Flaming Wood 19 Ion 116 233 101% NAVY 1-55 Flaming Wood 13 Ion 36 225 525% NAVY 1-55 Flaming Wood 15 Ion 68 225 231% NAVY 1-55 Flaming Wood 17 Ion 53 231 336% NAVY 1-55 Flaming Wood 19 Ion 43 231 437% NAVY 2-09 Flaming Cardboard 1 Ion 162 304 88% NAVY 2-09 Flaming Cardboard 3 Ion 165 304 84% NAVY 2-09 Flaming Cardboard 5 Ion 86 162 88% NAVY 2-09 Flaming Cardboard 7 Ion 100 162 62% NAVY 2-10 Flaming Cardboard 1 Ion 229 192 -16% NAVY 2-10 Flaming Cardboard 3 Ion 239 192 -20% NAVY 2-10 Flaming Cardboard 5 Ion 166 99 -40% NAVY 2-10 Flaming Cardboard 7 Ion 228 99 -57% NAVY 2-11 Flaming Cardboard 3 Ion 67 147 119% NAVY 2-11 Flaming Cardboard 5 Ion 93 163 75% NAVY 2-11 Flaming Cardboard 7 Ion 89 163 83% NAVY 2-12 Flaming Cardboard 1 Ion 28 125 346% NAVY 2-12 Flaming Cardboard 3 Ion 57 125 119% NAVY 2-12 Flaming Cardboard 5 Ion 66 141 114% NAVY 2-12 Flaming Cardboard 7 Ion 63 141 124% NAVY 2-21 Flaming Cardboard 9 Ion 93 232 149% NAVY 2-21 Flaming Cardboard 11 Ion 247 232 -6% NAVY 2-21 Flaming Cardboard 13 Ion 63 183 190% NAVY 2-21 Flaming Cardboard 15 Ion 36 183 408% NAVY 2-21 Flaming Cardboard 17 Ion 151 322 113% NAVY 2-21 Flaming Cardboard 19 Ion 174 322 85%

219
Temperature Rise Alarm Threshold: 13 °C Detector Alarm Times (s) Test
Series Test ID
Fire Type
Material ID Type Experiment Predicted
Percent Error
NAVY 2-21 Flaming Cardboard 21 Ion 143 312 118% NAVY 2-21 Flaming Cardboard 23 Ion 195 312 60% NAVY 2-22 Flaming Cardboard 9 Ion 74 195 164% NAVY 2-22 Flaming Cardboard 11 Ion 129 195 51% NAVY 2-22 Flaming Cardboard 13 Ion 43 121 181% NAVY 2-22 Flaming Cardboard 15 Ion 30 121 303% NAVY 2-22 Flaming Cardboard 17 Ion 302 242 -20% NAVY 2-22 Flaming Cardboard 19 Ion 126 242 92% NAVY 2-22 Flaming Cardboard 21 Ion 87 206 137% NAVY 2-22 Flaming Cardboard 23 Ion 127 206 62% NAVY 2-23 Flaming Cardboard 11 Ion 120 281 134% NAVY 2-23 Flaming Cardboard 13 Ion 119 DNA (12 @
376 s)
NAVY 2-23 Flaming Cardboard 15 Ion 143 DNA (12 @ 376 s)
NAVY 2-23 Flaming Cardboard 17 Ion 54 193 257% NAVY 2-23 Flaming Cardboard 19 Ion 122 193 58% NAVY 2-23 Flaming Cardboard 21 Ion 125 320 156% NAVY 2-23 Flaming Cardboard 23 Ion 144 320 122% NAVY 2-24 Flaming Cardboard 11 Ion 98 307 213% NAVY 2-24 Flaming Cardboard 13 Ion 117 DNA (11 @
414 s)
NAVY 2-24 Flaming Cardboard 15 Ion 142 DNA (11 @ 414 s)
NAVY 2-24 Flaming Cardboard 17 Ion 62 150 142% NAVY 2-24 Flaming Cardboard 19 Ion 100 150 50% NAVY 2-24 Flaming Cardboard 21 Ion 58 283 388% NAVY 2-24 Flaming Cardboard 23 Ion 67 283 322% NAVY 1-37 Flaming Wood 2 Photo 901 277 -69% NAVY 1-37 Flaming Wood 4 Photo 1007 277 -72% NAVY 1-37 Flaming Wood 6 Photo 816 455 -44% NAVY 1-37 Flaming Wood 8 Photo 990 455 -54% NAVY 1-38 Flaming Wood 2 Photo 874 360 -59% NAVY 1-38 Flaming Wood 4 Photo 860 360 -58% NAVY 1-38 Flaming Wood 6 Photo 794 1339 69% NAVY 1-38 Flaming Wood 8 Photo 943 1339 42% NAVY 1-39 Flaming Wood 2 Photo 546 251 -54% NAVY 1-39 Flaming Wood 4 Photo 555 251 -55% NAVY 1-39 Flaming Wood 6 Photo 366 345 -6% NAVY 1-39 Flaming Wood 8 Photo 634 345 -46% NAVY 1-40 Flaming Wood 2 Photo 1036 263 -75% NAVY 1-40 Flaming Wood 4 Photo 886 263 -70% NAVY 1-40 Flaming Wood 6 Photo 956 271 -72% NAVY 1-40 Flaming Wood 8 Photo 1023 271 -74% NAVY 1-41 Flaming Wood 2 Photo 529 226 -57%

220
Temperature Rise Alarm Threshold: 13 °C Detector Alarm Times (s) Test
Series Test ID
Fire Type
Material ID Type Experiment Predicted
Percent Error
NAVY 1-41 Flaming Wood 4 Photo 494 226 -54% NAVY 1-41 Flaming Wood 6 Photo 484 291 -40% NAVY 1-41 Flaming Wood 8 Photo 553 291 -47% NAVY 1-50 Flaming Wood 12 Photo 1113 249 -78% NAVY 1-50 Flaming Wood 16 Photo 1149 DNA (11 @
487 s)
NAVY 1-50 Flaming Wood 20 Photo 1194 DNA (12 @ 531 s)
NAVY 1-50 Flaming Wood 24 Photo 1149 DNA (8 @ 531 s)
NAVY 1-51 Flaming Wood 10 Photo 28 236 743% NAVY 1-51 Flaming Wood 12 Photo 17 236 1288% NAVY 1-51 Flaming Wood 14 Photo 54 338 526% NAVY 1-51 Flaming Wood 16 Photo 53 338 538% NAVY 1-51 Flaming Wood 18 Photo 612 336 -45% NAVY 1-51 Flaming Wood 20 Photo 82 336 310% NAVY 1-51 Flaming Wood 22 Photo 518 432 -17% NAVY 1-52 Flaming Wood 10 Photo 16 321 1906% NAVY 1-52 Flaming Wood 12 Photo 17 321 1788% NAVY 1-52 Flaming Wood 14 Photo 38 392 932% NAVY 1-52 Flaming Wood 16 Photo 35 392 1020% NAVY 1-52 Flaming Wood 18 Photo 49 377 669% NAVY 1-52 Flaming Wood 20 Photo 40 377 843% NAVY 1-53 Flaming Wood 10 Photo 790 293 -63% NAVY 1-53 Flaming Wood 12 Photo 908 293 -68% NAVY 1-53 Flaming Wood 14 Photo 662 1281 94% NAVY 1-53 Flaming Wood 16 Photo 768 1281 67% NAVY 1-53 Flaming Wood 18 Photo 841 909 8% NAVY 1-53 Flaming Wood 20 Photo 689 909 32% NAVY 1-53 Flaming Wood 22 Photo 680 DNA (11 @
1171 s)
NAVY 1-53 Flaming Wood 24 Photo 906 DNA (11 @ 1171 s)
NAVY 1-54 Flaming Wood 10 Photo 51 186 265% NAVY 1-54 Flaming Wood 14 Photo 51 260 410% NAVY 1-54 Flaming Wood 16 Photo 45 260 478% NAVY 1-54 Flaming Wood 18 Photo 96 233 143% NAVY 1-54 Flaming Wood 20 Photo 49 233 376% NAVY 1-55 Flaming Wood 10 Photo 40 209 423% NAVY 1-55 Flaming Wood 16 Photo 35 225 543% NAVY 1-55 Flaming Wood 18 Photo 55 231 320% NAVY 1-55 Flaming Wood 20 Photo 35 231 560% NAVY 2-09 Flaming Cardboard 2 Photo 480 304 -37% NAVY 2-09 Flaming Cardboard 4 Photo 169 304 80% NAVY 2-09 Flaming Cardboard 6 Photo 129 162 26% NAVY 2-09 Flaming Cardboard 8 Photo 124 162 31%
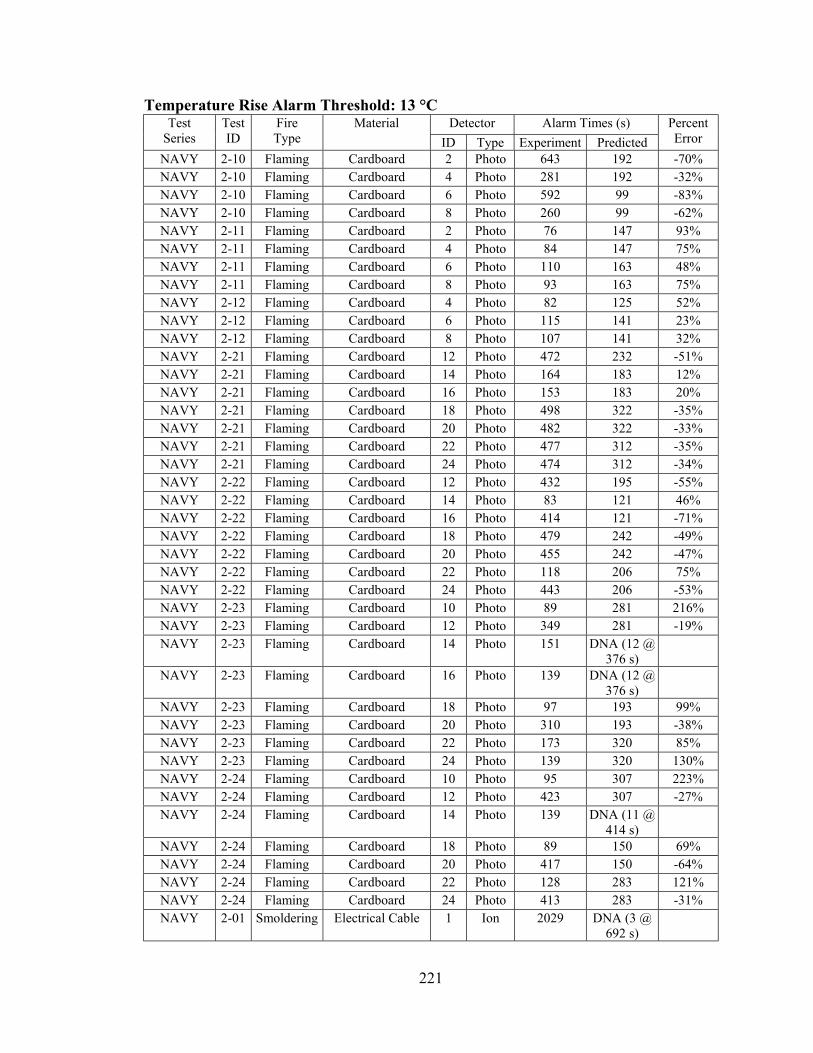
221
Temperature Rise Alarm Threshold: 13 °C Detector Alarm Times (s) Test
Series Test ID
Fire Type
Material ID Type Experiment Predicted
Percent Error
NAVY 2-10 Flaming Cardboard 2 Photo 643 192 -70% NAVY 2-10 Flaming Cardboard 4 Photo 281 192 -32% NAVY 2-10 Flaming Cardboard 6 Photo 592 99 -83% NAVY 2-10 Flaming Cardboard 8 Photo 260 99 -62% NAVY 2-11 Flaming Cardboard 2 Photo 76 147 93% NAVY 2-11 Flaming Cardboard 4 Photo 84 147 75% NAVY 2-11 Flaming Cardboard 6 Photo 110 163 48% NAVY 2-11 Flaming Cardboard 8 Photo 93 163 75% NAVY 2-12 Flaming Cardboard 4 Photo 82 125 52% NAVY 2-12 Flaming Cardboard 6 Photo 115 141 23% NAVY 2-12 Flaming Cardboard 8 Photo 107 141 32% NAVY 2-21 Flaming Cardboard 12 Photo 472 232 -51% NAVY 2-21 Flaming Cardboard 14 Photo 164 183 12% NAVY 2-21 Flaming Cardboard 16 Photo 153 183 20% NAVY 2-21 Flaming Cardboard 18 Photo 498 322 -35% NAVY 2-21 Flaming Cardboard 20 Photo 482 322 -33% NAVY 2-21 Flaming Cardboard 22 Photo 477 312 -35% NAVY 2-21 Flaming Cardboard 24 Photo 474 312 -34% NAVY 2-22 Flaming Cardboard 12 Photo 432 195 -55% NAVY 2-22 Flaming Cardboard 14 Photo 83 121 46% NAVY 2-22 Flaming Cardboard 16 Photo 414 121 -71% NAVY 2-22 Flaming Cardboard 18 Photo 479 242 -49% NAVY 2-22 Flaming Cardboard 20 Photo 455 242 -47% NAVY 2-22 Flaming Cardboard 22 Photo 118 206 75% NAVY 2-22 Flaming Cardboard 24 Photo 443 206 -53% NAVY 2-23 Flaming Cardboard 10 Photo 89 281 216% NAVY 2-23 Flaming Cardboard 12 Photo 349 281 -19% NAVY 2-23 Flaming Cardboard 14 Photo 151 DNA (12 @
376 s)
NAVY 2-23 Flaming Cardboard 16 Photo 139 DNA (12 @ 376 s)
NAVY 2-23 Flaming Cardboard 18 Photo 97 193 99% NAVY 2-23 Flaming Cardboard 20 Photo 310 193 -38% NAVY 2-23 Flaming Cardboard 22 Photo 173 320 85% NAVY 2-23 Flaming Cardboard 24 Photo 139 320 130% NAVY 2-24 Flaming Cardboard 10 Photo 95 307 223% NAVY 2-24 Flaming Cardboard 12 Photo 423 307 -27% NAVY 2-24 Flaming Cardboard 14 Photo 139 DNA (11 @
414 s)
NAVY 2-24 Flaming Cardboard 18 Photo 89 150 69% NAVY 2-24 Flaming Cardboard 20 Photo 417 150 -64% NAVY 2-24 Flaming Cardboard 22 Photo 128 283 121% NAVY 2-24 Flaming Cardboard 24 Photo 413 283 -31% NAVY 2-01 Smoldering Electrical Cable 1 Ion 2029 DNA (3 @
692 s)

222
Temperature Rise Alarm Threshold: 13 °C Detector Alarm Times (s) Test
Series Test ID
Fire Type
Material ID Type Experiment Predicted
Percent Error
NAVY 2-01 Smoldering Electrical Cable 5 Ion 2138 DNA (2 @ 1706 s)
NAVY 2-04 Smoldering Electrical Cable 5 Ion 1057 DNA (2 @ 1790 s)
NAVY 2-05 Smoldering Electrical Cable 1 Ion 1695 DNA (1 @ 83 s)
NAVY 2-05 Smoldering Electrical Cable 5 Ion 643 DNA (2 @ 504 s)
NAVY 2-07 Smoldering Electrical Cable 1 Ion 831 DNA (2 @ 1378 s)
NAVY 2-07 Smoldering Electrical Cable 5 Ion 1365 DNA (4 @ 1569 s)
NAVY 2-08 Smoldering Electrical Cable 1 Ion 1372 DNA (2 @ 1140 s)
NAVY 2-08 Smoldering Electrical Cable 5 Ion 1391 DNA (3 @ 1628 s)
NAVY 2-13 Smoldering Potassium Chlorate / Lactose
5 Ion 536 DNA (2 @ 403 s)
NAVY 2-14 Smoldering Potassium Chlorate / Lactose
1 Ion 18 DNA (4 @ 46 s)
NAVY 2-14 Smoldering Potassium Chlorate / Lactose
5 Ion 98 DNA (4 @ 125 s)
NAVY 2-15 Smoldering Potassium Chlorate / Lactose
1 Ion 19 DNA (4 @ 107 s)
NAVY 2-15 Smoldering Potassium Chlorate / Lactose
5 Ion 70 DNA (3 @ 134 s)
NAVY 2-25 Smoldering Potassium Chlorate / Lactose
9 Ion 146 DNA (1 @ 21 s)
NAVY 2-25 Smoldering Potassium Chlorate / Lactose
13 Ion 100 DNA (1 @ 215 s)
NAVY 2-25 Smoldering Potassium Chlorate / Lactose
15 Ion 222 DNA (1 @ 215 s)
NAVY 2-25 Smoldering Potassium Chlorate / Lactose
17 Ion 126 DNA (4 @ 284 s)
NAVY 2-25 Smoldering Potassium Chlorate / Lactose
19 Ion 306 DNA (4 @ 284 s)
NAVY 2-25 Smoldering Potassium Chlorate / Lactose
21 Ion 205 DNA (2 @ 225 s)
NAVY 2-26 Smoldering Potassium Chlorate / Lactose
9 Ion 334 DNA (1 @ 381 s)
NAVY 2-26 Smoldering Potassium Chlorate / Lactose
13 Ion 64 DNA (1 @ 0 s)
NAVY 2-26 Smoldering Potassium Chlorate / Lactose
15 Ion 196 DNA (1 @ 0 s)
NAVY 2-26 Smoldering Potassium Chlorate / Lactose
17 Ion 53 DNA (3 @ 200 s)
NAVY 2-26 Smoldering Potassium Chlorate / Lactose
19 Ion 234 DNA (3 @ 200 s)
NAVY 2-26 Smoldering Potassium Chlorate / Lactose
21 Ion 145 DNA (2 @ 243 s)

223
Temperature Rise Alarm Threshold: 13 °C Detector Alarm Times (s) Test
Series Test ID
Fire Type
Material ID Type Experiment Predicted
Percent Error
NAVY 2-27 Smoldering Potassium Chlorate / Lactose
9 Ion 161 DNA (1 @ 161 s)
NAVY 2-27 Smoldering Potassium Chlorate / Lactose
13 Ion 257 DNA (1 @ 18 s)
NAVY 2-27 Smoldering Potassium Chlorate / Lactose
17 Ion 74 DNA (3 @ 1 s)
NAVY 2-27 Smoldering Potassium Chlorate / Lactose
19 Ion 152 DNA (3 @ 1 s)
NAVY 2-27 Smoldering Potassium Chlorate / Lactose
21 Ion 66 DNA (2 @ 83 s)
NAVY 2-27 Smoldering Potassium Chlorate / Lactose
23 Ion 69 DNA (2 @ 83 s)
NAVY 2-28 Smoldering Potassium Chlorate / Lactose
9 Ion 374 DNA (1 @ 201 s)
NAVY 2-28 Smoldering Potassium Chlorate / Lactose
13 Ion 192 DNA (2 @ 11 s)
NAVY 2-28 Smoldering Potassium Chlorate / Lactose
17 Ion 122 DNA (2 @ 240 s)
NAVY 2-28 Smoldering Potassium Chlorate / Lactose
19 Ion 444 DNA (2 @ 240 s)
NAVY 2-28 Smoldering Potassium Chlorate / Lactose
21 Ion 38 DNA (3 @ 75 s)
NAVY 2-28 Smoldering Potassium Chlorate / Lactose
23 Ion 40 DNA (3 @ 75 s)
NAVY 2-34 Smoldering Electrical Cable 17 Ion 659 DNA (3 @ 828 s)
NAVY 2-34 Smoldering Electrical Cable 19 Ion 840 DNA (3 @ 828 s)
NAVY 2-35 Smoldering Electrical Cable 17 Ion 922 DNA (4 @ 1529 s)
NAVY 2-35 Smoldering Electrical Cable 21 Ion 1408 DNA (4 @ 1022 s)
NAVY 2-36 Smoldering Electrical Cable 17 Ion 1354 DNA (3 @ 1787 s)
NAVY 2-36 Smoldering Electrical Cable 19 Ion 1490 DNA (3 @ 1787 s)
NAVY 2-37 Smoldering Electrical Cable 9 Ion 654 DNA (1 @ 744 s)
NAVY 2-37 Smoldering Electrical Cable 11 Ion 729 DNA (1 @ 744 s)
NAVY 2-37 Smoldering Electrical Cable 13 Ion 678 DNA (2 @ 474 s)
NAVY 2-37 Smoldering Electrical Cable 17 Ion 335 DNA (4 @ 732 s)
NAVY 2-37 Smoldering Electrical Cable 19 Ion 393 DNA (4 @ 732 s)
NAVY 2-37 Smoldering Electrical Cable 21 Ion 566 DNA (2 @ 758 s)
NAVY 2-38 Smoldering Electrical Cable 13 Ion 767 DNA (1 @ 893 s)

224
Temperature Rise Alarm Threshold: 13 °C Detector Alarm Times (s) Test
Series Test ID
Fire Type
Material ID Type Experiment Predicted
Percent Error
NAVY 2-38 Smoldering Electrical Cable 17 Ion 771 DNA (3 @ 348 s)
NAVY 2-38 Smoldering Electrical Cable 19 Ion 768 DNA (3 @ 348 s)
NAVY 2-38 Smoldering Electrical Cable 21 Ion 561 DNA (2 @ 914 s)
NAVY 2-38 Smoldering Electrical Cable 23 Ion 730 DNA (2 @ 914 s)
NAVY 2-39 Smoldering Electrical Cable 13 Ion 760 DNA (2 @ 623 s)
NAVY 2-40 Smoldering Electrical Cable 13 Ion 448 DNA (1 @ 930 s)
NAVY 2-40 Smoldering Electrical Cable 15 Ion 983 DNA (1 @ 930 s)
NAVY 2-01 Smoldering Electrical Cable 2 Photo 2034 DNA (3 @ 692 s)
NAVY 2-01 Smoldering Electrical Cable 4 Photo 2232 DNA (3 @ 692 s)
NAVY 2-01 Smoldering Electrical Cable 8 Photo 2232 DNA (2 @ 1706 s)
NAVY 2-02 Smoldering Electrical Cable 2 Photo 775 DNA (2 @ 588 s)
NAVY 2-02 Smoldering Electrical Cable 4 Photo 2000 DNA (2 @ 588 s)
NAVY 2-02 Smoldering Electrical Cable 6 Photo 656 DNA (1 @ 1949 s)
NAVY 2-04 Smoldering Electrical Cable 2 Photo 1713 DNA (2 @ 822 s)
NAVY 2-04 Smoldering Electrical Cable 6 Photo 796 DNA (2 @ 1790 s)
NAVY 2-05 Smoldering Electrical Cable 2 Photo 559 DNA (1 @ 83 s)
NAVY 2-05 Smoldering Electrical Cable 4 Photo 639 DNA (1 @ 83 s)
NAVY 2-05 Smoldering Electrical Cable 6 Photo 424 DNA (2 @ 504 s)
NAVY 2-05 Smoldering Electrical Cable 8 Photo 297 DNA (2 @ 504 s)
NAVY 2-07 Smoldering Electrical Cable 4 Photo 936 DNA (2 @ 1378 s)
NAVY 2-07 Smoldering Electrical Cable 6 Photo 908 DNA (4 @ 1569 s)
NAVY 2-08 Smoldering Electrical Cable 2 Photo 728 DNA (2 @ 1140 s)
NAVY 2-08 Smoldering Electrical Cable 4 Photo 845 DNA (2 @ 1140 s)
NAVY 2-08 Smoldering Electrical Cable 6 Photo 539 DNA (3 @ 1628 s)
NAVY 2-08 Smoldering Electrical Cable 8 Photo 775 DNA (3 @ 1628 s)

225
Temperature Rise Alarm Threshold: 13 °C Detector Alarm Times (s) Test
Series Test ID
Fire Type
Material ID Type Experiment Predicted
Percent Error
NAVY 2-13 Smoldering Potassium Chlorate / Lactose
2 Photo 578 DNA (1 @ 481 s)
NAVY 2-13 Smoldering Potassium Chlorate / Lactose
4 Photo 572 DNA (1 @ 481 s)
NAVY 2-13 Smoldering Potassium Chlorate / Lactose
6 Photo 524 DNA (2 @ 403 s)
NAVY 2-13 Smoldering Potassium Chlorate / Lactose
8 Photo 710 DNA (2 @ 403 s)
NAVY 2-14 Smoldering Potassium Chlorate / Lactose
2 Photo 20 DNA (4 @ 46 s)
NAVY 2-14 Smoldering Potassium Chlorate / Lactose
4 Photo 33 DNA (4 @ 46 s)
NAVY 2-15 Smoldering Potassium Chlorate / Lactose
2 Photo 19 DNA (4 @ 107 s)
NAVY 2-15 Smoldering Potassium Chlorate / Lactose
4 Photo 112 DNA (4 @ 107 s)
NAVY 2-15 Smoldering Potassium Chlorate / Lactose
6 Photo 81 DNA (3 @ 134 s)
NAVY 2-15 Smoldering Potassium Chlorate / Lactose
8 Photo 83 DNA (3 @ 134 s)
NAVY 2-25 Smoldering Potassium Chlorate / Lactose
12 Photo 316 DNA (1 @ 21 s)
NAVY 2-25 Smoldering Potassium Chlorate / Lactose
14 Photo 94 DNA (1 @ 215 s)
NAVY 2-25 Smoldering Potassium Chlorate / Lactose
16 Photo 105 DNA (1 @ 215 s)
NAVY 2-25 Smoldering Potassium Chlorate / Lactose
18 Photo 170 DNA (4 @ 284 s)
NAVY 2-25 Smoldering Potassium Chlorate / Lactose
20 Photo 301 DNA (4 @ 284 s)
NAVY 2-25 Smoldering Potassium Chlorate / Lactose
24 Photo 164 DNA (2 @ 225 s)
NAVY 2-26 Smoldering Potassium Chlorate / Lactose
14 Photo 68 DNA (1 @ 0 s)
NAVY 2-26 Smoldering Potassium Chlorate / Lactose
16 Photo 246 DNA (1 @ 0 s)
NAVY 2-26 Smoldering Potassium Chlorate / Lactose
18 Photo 65 DNA (3 @ 200 s)
NAVY 2-27 Smoldering Potassium Chlorate / Lactose
18 Photo 49 DNA (3 @ 1 s)
NAVY 2-27 Smoldering Potassium Chlorate / Lactose
20 Photo 68 DNA (3 @ 1 s)
NAVY 2-27 Smoldering Potassium Chlorate / Lactose
22 Photo 67 DNA (2 @ 83 s)
NAVY 2-27 Smoldering Potassium Chlorate / Lactose
24 Photo 65 DNA (2 @ 83 s)
NAVY 2-28 Smoldering Potassium Chlorate / Lactose
16 Photo 331 DNA (2 @ 11 s)
NAVY 2-28 Smoldering Potassium Chlorate / Lactose
18 Photo 92 DNA (2 @ 240 s)

226
Temperature Rise Alarm Threshold: 13 °C Detector Alarm Times (s) Test
Series Test ID
Fire Type
Material ID Type Experiment Predicted
Percent Error
NAVY 2-28 Smoldering Potassium Chlorate / Lactose
20 Photo 348 DNA (2 @ 240 s)
NAVY 2-28 Smoldering Potassium Chlorate / Lactose
22 Photo 34 DNA (3 @ 75 s)
NAVY 2-28 Smoldering Potassium Chlorate / Lactose
24 Photo 32 DNA (3 @ 75 s)
NAVY 2-34 Smoldering Electrical Cable 12 Photo 892 DNA (2 @ 7 s)
NAVY 2-34 Smoldering Electrical Cable 18 Photo 297 DNA (3 @ 828 s)
NAVY 2-34 Smoldering Electrical Cable 20 Photo 648 DNA (3 @ 828 s)
NAVY 2-34 Smoldering Electrical Cable 22 Photo 843 DNA (3 @ 31 s)
NAVY 2-34 Smoldering Electrical Cable 24 Photo 732 DNA (3 @ 31 s)
NAVY 2-35 Smoldering Electrical Cable 18 Photo 423 DNA (4 @ 1529 s)
NAVY 2-35 Smoldering Electrical Cable 20 Photo 851 DNA (4 @ 1529 s)
NAVY 2-35 Smoldering Electrical Cable 22 Photo 656 DNA (4 @ 1022 s)
NAVY 2-35 Smoldering Electrical Cable 24 Photo 989 DNA (4 @ 1022 s)
NAVY 2-36 Smoldering Electrical Cable 14 Photo 1611 DNA (3 @ 963 s)
NAVY 2-36 Smoldering Electrical Cable 18 Photo 756 DNA (3 @ 1787 s)
NAVY 2-36 Smoldering Electrical Cable 20 Photo 860 DNA (3 @ 1787 s)
NAVY 2-36 Smoldering Electrical Cable 22 Photo 1356 DNA (2 @ 2 s)
NAVY 2-36 Smoldering Electrical Cable 24 Photo 915 DNA (2 @ 2 s)
NAVY 2-37 Smoldering Electrical Cable 12 Photo 700 DNA (1 @ 744 s)
NAVY 2-37 Smoldering Electrical Cable 14 Photo 759 DNA (2 @ 474 s)
NAVY 2-37 Smoldering Electrical Cable 16 Photo 735 DNA (2 @ 474 s)
NAVY 2-37 Smoldering Electrical Cable 18 Photo 295 DNA (4 @ 732 s)
NAVY 2-37 Smoldering Electrical Cable 20 Photo 331 DNA (4 @ 732 s)
NAVY 2-37 Smoldering Electrical Cable 22 Photo 633 DNA (2 @ 758 s)
NAVY 2-37 Smoldering Electrical Cable 24 Photo 506 DNA (2 @ 758 s)
NAVY 2-38 Smoldering Electrical Cable 14 Photo 754 DNA (1 @ 893 s)

227
Temperature Rise Alarm Threshold: 13 °C Detector Alarm Times (s) Test
Series Test ID
Fire Type
Material ID Type Experiment Predicted
Percent Error
NAVY 2-38 Smoldering Electrical Cable 16 Photo 843 DNA (1 @ 893 s)
NAVY 2-38 Smoldering Electrical Cable 18 Photo 549 DNA (3 @ 348 s)
NAVY 2-38 Smoldering Electrical Cable 20 Photo 709 DNA (3 @ 348 s)
NAVY 2-38 Smoldering Electrical Cable 22 Photo 189 DNA (2 @ 914 s)
NAVY 2-38 Smoldering Electrical Cable 24 Photo 418 DNA (2 @ 914 s)
NAVY 2-39 Smoldering Electrical Cable 14 Photo 941 DNA (2 @ 623 s)
NAVY 2-39 Smoldering Electrical Cable 16 Photo 856 DNA (2 @ 623 s)
NAVY 2-39 Smoldering Electrical Cable 18 Photo 1362 DNA (2 @ 312 s)
NAVY 2-39 Smoldering Electrical Cable 22 Photo 786 DNA (2 @ 270 s)
NAVY 2-39 Smoldering Electrical Cable 24 Photo 689 DNA (2 @ 270 s)
NAVY 2-40 Smoldering Electrical Cable 14 Photo 402 DNA (1 @ 930 s)
NAVY 2-40 Smoldering Electrical Cable 16 Photo 679 DNA (1 @ 930 s)
NAVY 2-40 Smoldering Electrical Cable 18 Photo 1201 DNA (2 @ 1069 s)
NAVY 2-40 Smoldering Electrical Cable 20 Photo 1387 DNA (2 @ 1069 s)
NAVY 2-40 Smoldering Electrical Cable 22 Photo 1542 DNA (3 @ 1534 s)
KEMANO 01 Flaming Wood 28 Ion 480 DNA (1 @ 795 s)
KEMANO 02 Flaming Wood 14 Ion 1359 DNA (3 @ 1464 s)
KEMANO 02 Flaming Wood 28 Ion 1388 DNA (0 @ 1507 s)
KEMANO 03 Flaming Cotton Fabric 8 Ion 122 DNA (4 @ 590 s)
KEMANO 03 Flaming Cotton Fabric 14 Ion 155 DNA (4 @ 579 s)
KEMANO 03 Flaming Cotton Fabric 28 Ion 226 DNA (1 @ 836 s)
KEMANO 05 Flaming Upholstered Furniture
28 Ion 875 DNA (1 @ 1062 s)
KEMANO 06 Flaming Wood 8 Ion 1111 DNA (1 @ 1184 s)
KEMANO 06 Flaming Wood 14 Ion 389 DNA (2 @ 771 s)
KEMANO 06 Flaming Wood 28 Ion 277 DNA (4 @ 723 s)
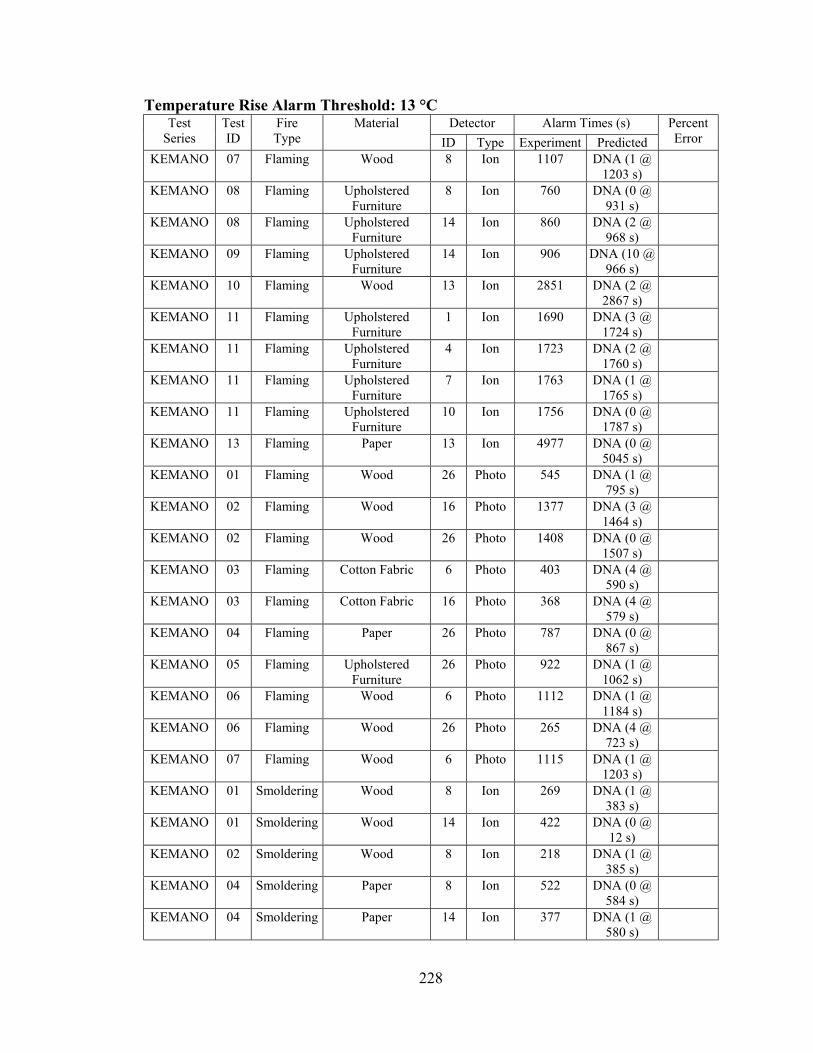
228
Temperature Rise Alarm Threshold: 13 °C Detector Alarm Times (s) Test
Series Test ID
Fire Type
Material ID Type Experiment Predicted
Percent Error
KEMANO 07 Flaming Wood 8 Ion 1107 DNA (1 @ 1203 s)
KEMANO 08 Flaming Upholstered Furniture
8 Ion 760 DNA (0 @ 931 s)
KEMANO 08 Flaming Upholstered Furniture
14 Ion 860 DNA (2 @ 968 s)
KEMANO 09 Flaming Upholstered Furniture
14 Ion 906 DNA (10 @ 966 s)
KEMANO 10 Flaming Wood 13 Ion 2851 DNA (2 @ 2867 s)
KEMANO 11 Flaming Upholstered Furniture
1 Ion 1690 DNA (3 @ 1724 s)
KEMANO 11 Flaming Upholstered Furniture
4 Ion 1723 DNA (2 @ 1760 s)
KEMANO 11 Flaming Upholstered Furniture
7 Ion 1763 DNA (1 @ 1765 s)
KEMANO 11 Flaming Upholstered Furniture
10 Ion 1756 DNA (0 @ 1787 s)
KEMANO 13 Flaming Paper 13 Ion 4977 DNA (0 @ 5045 s)
KEMANO 01 Flaming Wood 26 Photo 545 DNA (1 @ 795 s)
KEMANO 02 Flaming Wood 16 Photo 1377 DNA (3 @ 1464 s)
KEMANO 02 Flaming Wood 26 Photo 1408 DNA (0 @ 1507 s)
KEMANO 03 Flaming Cotton Fabric 6 Photo 403 DNA (4 @ 590 s)
KEMANO 03 Flaming Cotton Fabric 16 Photo 368 DNA (4 @ 579 s)
KEMANO 04 Flaming Paper 26 Photo 787 DNA (0 @ 867 s)
KEMANO 05 Flaming Upholstered Furniture
26 Photo 922 DNA (1 @ 1062 s)
KEMANO 06 Flaming Wood 6 Photo 1112 DNA (1 @ 1184 s)
KEMANO 06 Flaming Wood 26 Photo 265 DNA (4 @ 723 s)
KEMANO 07 Flaming Wood 6 Photo 1115 DNA (1 @ 1203 s)
KEMANO 01 Smoldering Wood 8 Ion 269 DNA (1 @ 383 s)
KEMANO 01 Smoldering Wood 14 Ion 422 DNA (0 @ 12 s)
KEMANO 02 Smoldering Wood 8 Ion 218 DNA (1 @ 385 s)
KEMANO 04 Smoldering Paper 8 Ion 522 DNA (0 @ 584 s)
KEMANO 04 Smoldering Paper 14 Ion 377 DNA (1 @ 580 s)
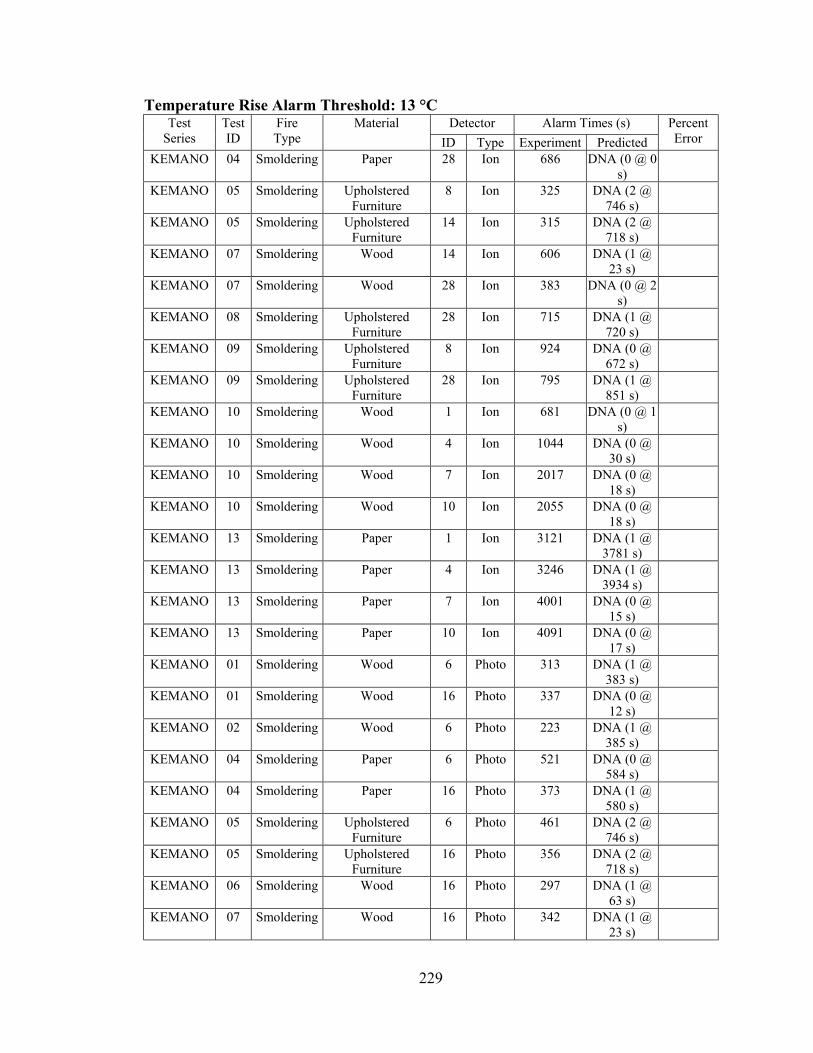
229
Temperature Rise Alarm Threshold: 13 °C Detector Alarm Times (s) Test
Series Test ID
Fire Type
Material ID Type Experiment Predicted
Percent Error
KEMANO 04 Smoldering Paper 28 Ion 686 DNA (0 @ 0 s)
KEMANO 05 Smoldering Upholstered Furniture
8 Ion 325 DNA (2 @ 746 s)
KEMANO 05 Smoldering Upholstered Furniture
14 Ion 315 DNA (2 @ 718 s)
KEMANO 07 Smoldering Wood 14 Ion 606 DNA (1 @ 23 s)
KEMANO 07 Smoldering Wood 28 Ion 383 DNA (0 @ 2 s)
KEMANO 08 Smoldering Upholstered Furniture
28 Ion 715 DNA (1 @ 720 s)
KEMANO 09 Smoldering Upholstered Furniture
8 Ion 924 DNA (0 @ 672 s)
KEMANO 09 Smoldering Upholstered Furniture
28 Ion 795 DNA (1 @ 851 s)
KEMANO 10 Smoldering Wood 1 Ion 681 DNA (0 @ 1 s)
KEMANO 10 Smoldering Wood 4 Ion 1044 DNA (0 @ 30 s)
KEMANO 10 Smoldering Wood 7 Ion 2017 DNA (0 @ 18 s)
KEMANO 10 Smoldering Wood 10 Ion 2055 DNA (0 @ 18 s)
KEMANO 13 Smoldering Paper 1 Ion 3121 DNA (1 @ 3781 s)
KEMANO 13 Smoldering Paper 4 Ion 3246 DNA (1 @ 3934 s)
KEMANO 13 Smoldering Paper 7 Ion 4001 DNA (0 @ 15 s)
KEMANO 13 Smoldering Paper 10 Ion 4091 DNA (0 @ 17 s)
KEMANO 01 Smoldering Wood 6 Photo 313 DNA (1 @ 383 s)
KEMANO 01 Smoldering Wood 16 Photo 337 DNA (0 @ 12 s)
KEMANO 02 Smoldering Wood 6 Photo 223 DNA (1 @ 385 s)
KEMANO 04 Smoldering Paper 6 Photo 521 DNA (0 @ 584 s)
KEMANO 04 Smoldering Paper 16 Photo 373 DNA (1 @ 580 s)
KEMANO 05 Smoldering Upholstered Furniture
6 Photo 461 DNA (2 @ 746 s)
KEMANO 05 Smoldering Upholstered Furniture
16 Photo 356 DNA (2 @ 718 s)
KEMANO 06 Smoldering Wood 16 Photo 297 DNA (1 @ 63 s)
KEMANO 07 Smoldering Wood 16 Photo 342 DNA (1 @ 23 s)

230
Temperature Rise Alarm Threshold: 13 °C Detector Alarm Times (s) Test
Series Test ID
Fire Type
Material ID Type Experiment Predicted
Percent Error
KEMANO 07 Smoldering Wood 26 Photo 374 DNA (0 @ 2 s)
KEMANO 08 Smoldering Upholstered Furniture
6 Photo 376 DNA (0 @ 0 s)
KEMANO 08 Smoldering Upholstered Furniture
16 Photo 334 DNA (1 @ 706 s)
KEMANO 08 Smoldering Upholstered Furniture
26 Photo 254 DNA (1 @ 720 s)
KEMANO 09 Smoldering Upholstered Furniture
6 Photo 755 DNA (0 @ 672 s)
KEMANO 09 Smoldering Upholstered Furniture
16 Photo 376 DNA (1 @ 701 s)
KEMANO 09 Smoldering Upholstered Furniture
26 Photo 288 DNA (1 @ 851 s)
KEMANO 10 Smoldering Wood 3 Photo 418 DNA (0 @ 1 s)
KEMANO 10 Smoldering Wood 6 Photo 504 DNA (0 @ 30 s)
KEMANO 10 Smoldering Wood 9 Photo 605 DNA (0 @ 18 s)
KEMANO 10 Smoldering Wood 12 Photo 755 DNA (0 @ 18 s)
KEMANO 10 Smoldering Wood 15 Photo 687 DNA (0 @ 18 s)
KEMANO 11 Smoldering Upholstered Furniture
3 Photo 344 DNA (0 @ 22 s)
KEMANO 11 Smoldering Upholstered Furniture
6 Photo 371 DNA (0 @ 117 s)
KEMANO 11 Smoldering Upholstered Furniture
9 Photo 439 DNA (0 @ 20 s)
KEMANO 11 Smoldering Upholstered Furniture
12 Photo 485 DNA (0 @ 24 s)
KEMANO 11 Smoldering Upholstered Furniture
15 Photo 580 DNA (0 @ 24 s)
KEMANO 13 Smoldering Paper 3 Photo 420 DNA (1 @ 3781 s)
KEMANO 13 Smoldering Paper 6 Photo 479 DNA (1 @ 3934 s)
KEMANO 13 Smoldering Paper 9 Photo 658 DNA (0 @ 15 s)
KEMANO 13 Smoldering Paper 12 Photo 764 DNA (0 @ 17 s)
KEMANO 13 Smoldering Paper 15 Photo 725 DNA (0 @ 15 s)

231
Velocity Alarm Threshold: 0.15 m/s Detector Alarm Times (s) Test
Series Test ID
Fire Type
Material ID Type Experiment Predicted
Percent Error
NAVY 1-38 Flaming Wood 1 Ion 62 40 -35% NAVY 1-38 Flaming Wood 2 Photo 874 40 -95% NAVY 1-38 Flaming Wood 3 Ion 155 40 -74% NAVY 1-38 Flaming Wood 4 Photo 860 40 -95% NAVY 1-39 Flaming Wood 1 Ion 69 9 -87% NAVY 1-39 Flaming Wood 3 Ion 43 9 -79% NAVY 1-39 Flaming Wood 4 Photo 555 9 -98% NAVY 1-40 Flaming Wood 1 Ion 43 6 -86% NAVY 1-40 Flaming Wood 3 Ion 123 6 -95% NAVY 2-09 Flaming Cardboard 5 Ion 86 81 -6% NAVY 2-09 Flaming Cardboard 6 Photo 129 81 -37% NAVY 2-09 Flaming Cardboard 7 Ion 100 81 -19% NAVY 2-09 Flaming Cardboard 8 Photo 124 81 -35% NAVY 2-10 Flaming Cardboard 5 Ion 166 4 -98% NAVY 2-10 Flaming Cardboard 6 Photo 592 4 -99% NAVY 2-10 Flaming Cardboard 7 Ion 228 4 -98% NAVY 2-10 Flaming Cardboard 8 Photo 260 4 -98% NAVY 2-11 Flaming Cardboard 2 Photo 76 106 39% NAVY 2-11 Flaming Cardboard 3 Ion 67 106 58% NAVY 2-11 Flaming Cardboard 4 Photo 84 106 26% NAVY 2-12 Flaming Cardboard 1 Ion 28 219 682% NAVY 2-12 Flaming Cardboard 3 Ion 57 219 284% NAVY 2-12 Flaming Cardboard 4 Photo 82 219 167% NAVY 2-21 Flaming Cardboard 13 Ion 63 213 238% NAVY 2-21 Flaming Cardboard 14 Photo 164 213 30% NAVY 2-21 Flaming Cardboard 15 Ion 36 213 492% NAVY 2-21 Flaming Cardboard 16 Photo 153 213 39% NAVY 2-22 Flaming Cardboard 13 Ion 43 99 130% NAVY 2-22 Flaming Cardboard 14 Photo 83 99 19% NAVY 2-22 Flaming Cardboard 15 Ion 30 99 230%

232
REFERENCES
Alpert, R.L., “Fire Induced Turbulent Ceiling Jet,” Technical Report, FMRC 19722-2, Factory Mutual Research Corporation, Norwood, MA, May 1971.
Benjamin, I., Heskestad, G., Bright, R., and Hayes, T., “An Analysis of the Report on Environments of Fire Detectors,” Fire Detection Institute, 1979.
Beyler, C., and DiNenno, P., “Letters to the Editor”, Fire Technology, Vol. 27, No. 2, pp. 160-169, May 1991.
Bjorkman, J., Kokkala, M.A., and Ahola, H., “Measurements of the Characteristic Lengths of Smoke Detectors,” Fire Technology, Vol. 28, No. 2, 1992, pp. 99-106.
Brammer, D.R., “A comparison between predicted and actual behavior of domestic smoke detectors in a realistic house fire,” Master of Engineering Thesis, University of Canterbury, Christchurch, New Zealand, 2002.
Brozovski, E., “A Preliminary Approach to Siting Smoke Detectors Based on Design Fire Size and Detector Aerosol Entry Lag Time, Master of Science Thesis, Worcester Polytechnic Institute, Worcester, MA, 1991.
Bukowski, R.W., “Comments on Measurements of the Characteristic Lengths of Smoke Detectors,” Fire Technology, Vol. 28, No. 2,1992, pp. 107-108.
Bukowski, R.W., and Averill, J.D., “Methods for Predicting Detector Activation,” Proceedings of 14th Joint Panel Meeting of the UJNR Panel on Fire Research and Safety, May 28 – June 3, 1998, Tsukuba, Japan, U.S./Japan Government Cooperative Program on Natural Resources (UJNR), Fire Research and Safety, 1998, pp. 213-221.
Bukowski, R.W. and Mulholland, G.W., “Smoke Detector Design and Smoke Properties. Final Report,” NBS Technical Note 973, National Bureau of Standards, Gaithersburg, MD, November 1978.
Bukowski, R.W., Waterman, T.E., and Christian, W.J., "Detector Sensitivity and Siting Requirements for Dwellings", Final Technical Report, IITRI Project J6340, Contract No. 4-36092, NBS-GCR-75-51, National Bureau of Standards, Gaithersburg, MD, 1975.
CAN/ULC-S531-M87, “Standard for Smoke Alarms,” Underwriter’s Laboratories of Canadam Toronto, ON, Canada, 1995 Ed., pp. 1-86.

233
Carhart, H.W., Toomey, T.A., and Williams, F.W., “The ex-USS SHADWELL Full-scale Fire Research and Test Ship,” Naval Research Laboratory, NRL Memorandum Report 6074, Revised January 20, 1988, Reissued 1992.
Cholin, J.M., and Marrion, C., “Performance Metrics for Fire Detection,” Fire Protection Engineering, pp. 21-30, No. 11, Summer 2001.
Collier, P.C.R., “Fire In a Residential Building: Comparisons Between Experimental Data and a Fire Zone Model,” Fire Technology, Vol. 32, No. 3, August 1996, pp. 195 – 219.
Cleary, T., Chernovsky, A., Grosshandler, W., and M. Anderson, “Particulate Entry Lag in Spot-Type Smoke Detectors,” Fire Safety Science – Proceedings of the 6th International Symposium, July 5-9, 1999, Poitiers, France, International Association for Fire Safety Science, Boston, MA, Curtat, M., Editor, 2000, pp. 779 – 790.
Davis, W.D., and Notarianni, K.A., “NASA Fire Detector Study,” NISTIR 5798, National Institute of Standards and Technology, 1996.
Devore, J.L., Probability and Statistics for Engineering and the Sciences, 5th Edition, Duxbury, Pacific Grove, CA, 2000, pp. 40 – 44.
Evans, D., and Stroup, D., “Methods to Calculate the Response Time of Heat and Smoke Detectors Installed Below Large Unobstructed Ceilings,” NBSIR 85-3167, National Bureau of Standards, Gaithersburg, MD, February 1985.
Foster, W.W., “Attenuation of Light by Wood Smoke,” British Journal of Applied Physics, Vol. 10, Sept. 1959, pp. 416-420.
Geiman, J.A., and Gottuk, D.T., “Alarm Thresholds for Smoke Detector Modeling,” Fire Safety Science – Proceedings of the 7th International Symposium, June 16-21, 2002, Worcester, MA, International Association for Fire Safety Science, Boston, MA, Evans, D.D., Editor, 2003, pp. 197 – 208.
Gottuk, D.T., Harrison, M.A., Rose-Pehrsson, S.L., Owrutsky, J.C., Williams, F.W., and Farley, J.P., “Shipboard Evaluation of Fire Detection Technologies for Volume Sensor Development,” Naval Research Laboratory, Memorandum Report, 6180-0282, 2003.
Gottuk, D.T., Hill, S.A., Schemel, C.F., Strehlen, B.D., Rose-Phersson, S.L., Shaffer, R.E., Tatem, P.A., and Williams, F.W., “Identification of Fire Signatures for Shipboard Multi-criteria Fire Detection Systems,” Naval Research Laboratory, Memorandum Report, 6180-99-8386, Washington, D.C., June 18, 1999.
234
Harrison, M.A., Gottuk, D.T., Rose-Pehrsson, S.L., Owrutsky, J.C., Williams, F.W., and Farley, J.P., “Video Image Detection (VID) Systems and Fire Detection Technologies: Preliminary Results from the Magazine Detection System Response Tests,” Naval Research Laboratory, Memorandum Report, 6180-0262, 2003.
Helsper, C., Fissan, H.J., Muggli, J., and Scheidweiler, A., “Verification of Ionization Chamber Theory,” Fire Technology, Vol. 19, No. 1, February 1983, pp. 14-21.
Heskestad, G., “Escape Potentials From Apartments Protected by Fire Detectors in High-Rise Buildings,” Final Technical Report, Contract No. H-2034R, Department of Housing and Urban Development, FMRC Serial No. 21017, Factory Mutual Research Corp., Norwood, MA, June 1974.
Heskestad, G., “Generalized Characterization of Smoke Entry and Response for Products-of-Combustion Detectors,” Proceedings, Fire Detection for Life Safety, March 31-April 1, 1975, National Research Council, pp. 93-127, 1975.
Heskestad, G., and Delichatsios, M.A., “Environments of Fire Detectors – Phase I: Effect of Fire Size, Ceiling Height, and Material,” Volume I: “Measurements” (NBS-GCR-77-86), (1977), Volume II: “Analysis” (NBS-GCR-77-95), National Bureau of Standards, Gaithersburg, MD, 1977.
Hosemann, J.P., “Methods to Determine Particle Size Distribution of Highly Concentrated Polydispersions of Mie-Particles,” Dissertation, Rheinisch-Westfalisch Technical University, Aachen, Germany, 1970.
Lee, T.G.K., and Mulholland, G. “Physical Properties of Smokes Pertinent to Smoke Detector Technology,” NBSIR 77-1312, National Bureau of Standards, Gaithersburg, MD, Nov. 1977.
Litton, C.D., “Mathematical Model for Ionization-Type Smoke Detectors and the Reduced Source Approximation,” Fire Technology, Vol. 13, No. 4, November 1977, pp. 266-281.
Loepfe, M., Ryser, P., Tompkin, C., and Wieser, D.,“Optical Properties of Fire and Non-fire Aerosols,” Fire Safety Journal, Vol. 29, No. 2-3, September 1997, pp. 185-194.
Luck, H. and Sievert, U., “Does an Over-All Modeling Make Any Sense in Automatic Fire Detection?,” AUBE ‘99 Proceedings of the 11th International Conference on Automatic Fire Detection, Gerhard Mercator Universität Duisburg, pp. 1-21, 1999.

235
Marrion, C., “Lag Time Modeling and the Effects of Ceiling Jet Velocity on the Placement of Optical Smoke Detectors,” Master’s Thesis, Worcester Polytechnic Institute, Worcester, MA, 1989.
McAvoy, T.J., Milke, J., and Kunt, T.A., “Using Multivariate Statistical Methods to Detect Fires,” Fire Technology, Vol. 32, No. 1, Jan./Feb. 1996, pp. 6-24.
Meacham, B.J., “Characterization of Smoke from Burning Materials for the Evaluation of Light Scattering Type Smoke Detector Response,” Master of Science Thesis, Worcester Polytechnic Institute, Worcester, MA, 1992.
Milke, J.A., “Application of Neural Networks for Discriminating Fire Detectors,” International Conference on Automatic Fire Detection, AUBE ’95, April 1995, pp. 213-222.
Milke, J., “Smoke Management for Covered Malls and Atria,” Fire Technology, Vol. 26, No. 3, 1990, pp. 223 – 243.
Milke, J.A., and McAvoy, T.J., “Analysis of Fire and Non-fire Signatures for Discriminating Fire Detection,” Fire Safety Science – Proceedings of the 5th International Symposium, March 3-7 1997, Melbourne, Australia, International Association for Fire Safety Science, Boston, MA, Hasemi, Y., ed., 1997, pp. 819-828.
Milke, J.A., and McAvoy, T.J., “Neural Networks for Smart Fire Detection,” NIST-GCR-96-699, National Institute of Standards and Technology, Gaithersburg, MD, Dec. 1996.
Mowrer , F.W., and Friedman, J., “Experimental Investigation of Heat and Smoke Detector Response,” Proceedings of Fire Suppression and Detection Research Application Symposium, Orlando, FL, February 24-26, 1998, pp. 256-264.
Mulholland, G.W., “How well are we measuring smoke?” Fire and Materials, Vol. 6, No. 2, June 1982, pp. 65-67.
Mulholland, G.W., “Smoke Production and Properties,” SFPE Handbook of Fire Protection Engineering, Chapter 2-13, 3rd Edition, DiNenno, P.J., Ed., National Fire Protection Association, Quincy, MA, 2002.
Mulholland, G.W., and Croarkin, C., “Specific Extinction Coefficient of Flame Generated Smoke,” Fire and Materials, Vol. 24, 2000, pp. 227-230.
Mulholland, G.W., Johnsson, E.L., Fernandez, M.G., and Shear, D.A., “Design and Testing of a New Smoke Concentration Meter,” Fire and Materials, Vol. 24, No. 5, September/October 2000, pp. 231-243.
236
Mulholland, G.W., and Liu, B.Y.H., “Response of Smoke Detectors to Monodisperse Aerosols,” Journal of Research of the National Bureau of Standards, Vol. 85, No. 3, May – June 1980, pp. 223 – 237.
Newman, J.S., “Modified Theory for the Characterization of Ionization Smoke Detectors,” Fire Safety Science – Proceedings of the 4th International Symposium, July 13-17, 1994, Ottawa, Ontario, Canada, International Association for Fire Safety Science, Boston, MA, Kashiwagi, T., Editor, 1994, pp. 785-792.
NFPA 72, National Fire Alarm Code, National Fire Protection Association, Quincy, MA, 2002.
NFPA 92B, Guide for Smoke Management Systems in Malls, Atria, and Large Areas, National Fire Protection Association, Quincy, MA, 1990.
Oldweiler, A., “Investigation of the Smoke Detector L Number in the UL Smoke Box,” Master of Science Thesis, Worcester Polytechnic Institute, Worcester, MA, 1995.
Putorti, A.D., “Design Parameters for Stack-Mounted Light Extinction Measurement Devices,” NISTIR 6215, National Institute of Standards and Technology, Gaithersburg, MD, July 1998.
Quintiere, J.G., “Smoke Measurements: An Assessment of Correlations between Laboratory and Full-scale Experiments,” Fire and Materials, Vol. 6, Nos. 3 and 4, 1982, pp. 145-148.
Rose-Pehrsson, S.L., Shaffer, R.E., Hart, S.J., Williams, F.W., Gottuk, D.T., Strehlen, B.D., and Hill, S.A., “Multi-Criteria Fire Detection Systems Using a Probalistic Neural Network,” Sensors and Acuators B 69, 2000 pp. 325-335.
Scheidweiler, A., “Ionization Chamber as Smoke Dependent Resistance,” Fire Technology, Vol. 12, No. 2, May 1976, pp. 113-123.
Schifiliti, R.P., Meacham, B.J., and Custer, R.L.P., “Design of Detection Systems,” SFPE Handbook of Fire Protection Engineering, Chapter 4-1, 2nd Edition, DiNenno, P.J., Ed., National Fire Protection Association, Quincy, MA, 1995.
Schifiliti, R.P., Meacham, B.J., and Custer, R.L.P., “Design of Detection Systems,” SFPE Handbook of Fire Protection Engineering, Chapter 4-1, 3rd Edition, DiNenno, P.J., Ed., National Fire Protection Association, Quincy, MA, 2002.
Schifiliti, R.P., and Pucci, W.E., “Fire Detection Modeling: State of the Art”, Fire Detection Institute, Bloomfield, CT, 1996.
Seader, J.D. and Chien, W.P., “Physical Aspects of Smoke Development in an NBS Smoke-Density Chamber,” Journal of Fire and Flammability, Vol. 6, 1975.
237
Seader, J.D., and Einhorn, I.N., “Some Physical, Chemical, Toxicological, and Physiological Aspects of Fire Smokes,” Proceedings, 16th Symposium (International) on Combustion, The Combustion Institute, 1977, pp. 1423 – 1445.
Spearpoint, M.J., and Smithies, J.N., “Practical Comparison of Domestic Smoke Alarm Sensitivity Standards,” Fire Research Station, Home Office Fire Research and Development Group, FRDG Publication No. 4/97, 1997.
Su, J.Z., Crampton, G.P., Carpenter, D.W., McCartney, C., and Leroux, P., “KEMANO FIRE STUDIES – Part 1: Response of Residential Smoke Alarms,” Research Report 108, National Research Council of Canada, Ottawa, Canada, April 2003.
UL 217, “Standard for Single and Multiple Station Smoke Alarms,” Fifth Edition dated February 21, 1997 with revisions through October 12, 2001, Underwriters Laboratories Inc., Northbrook, IL, 2001.
UL 268, “Standard for Smoke Detectors for Fire Protective Signaling Systems,” Fourth Edition dated December 30, 1996 with revisions through October 22, 2003, Underwriters Laboratories Inc., Northbrook, IL, 2003.
Wakelin, A.J., “An Investigation of Correlations for Multi-Signal Fire Detectors,” Master of Science Thesis, Worcester Polytechnic Institute, Worcester, MA, February 1997.
Wong, J.T., Gottuk, D.T., Rose-Pehrsson, S.L., Shaffer, R.E., Hart, S., Tatem, P.A., Williams, F.W., “Results of Multi-Criteria Fire Detection System Tests,” Naval Research Laboratory, May 2000.