vietnam beverage industry report 2018 · thuếtrong đócó bia và rượu; ... malt export...
TRANSCRIPT

Content is intentionally removed for demo purposeContent is intentionally removed for demo purpose
VIETNAM BEVERAGE INDUSTRY REPORT 2018
1

Content is intentionally removed for demo purpose
Content
Executive summary 3
1 Business environment 6
1.1 Macroeconomic context 6
1.2 Legal barriers 13
1.3 Free trade agreements 18
2 Industry overview 24
2.1 Global market 24
2.1.1. Beer 25
2.1.2. Wine 36
2.1.3 Soft Drink 45
2.2 Local market 48
2.2.1. Beer 51
2.2.2. Wine 61
2.2.3 Soft Drink 75
2.3 Risk 90
3.2.1 4.1 SWOT analysis 91
2.3.2. Competitiveness analysis 92
2.3.3. Business risk 95
2.4 Planning and development 99
2.5 Prospect and prediction 101
2.5.1. 2.1 Motivational factors 102
2.5.2 Prediction 104
3 Enterprise analysis 112
3.1 Profitability 114
3.2 Operating capability 118
3.3 Financial strength 121
3.4 Return on investment 124
4 Appendix 126
2

Content is intentionally removed for demo purpose
Executive summary
Vietnam beverage industry came into being
years ago but just blossomed for the past
decade.
The local industry is capable of meeting
domestic consumption needs, with less
imports and more exports.
As of soft drinks, the industry has expanded on a
large scale and rapid growth given adequate
domestic supply.
The global beverage market has so far been on a
positive trend but with lots of unexplored
potentials.
2018 witnessed a sharp downturn in the industry
compared to the last year due to production
setbacks.
3

Content is intentionally removed for demo purpose
Executive summary
The wine market is on a small scale with falling
production.
There exists a few large-scale and strong -
branded enterprises in the industry such as
Sabeco, Habeco and Tan Hiep that are capable
of competing with FDI enterprises.
The industry has low debt rate, high liquidity
and high asset performance.
As estimated, the beer, wine and soft drink
segment will revenue 180 billion, 33 billion and
120 billion respectively by 2018.
4

Content is intentionally removed for demo purpose
Abbreviation
MOF Ministry of Finance
CAGR Compounded Annual Growth Rate
FI Foreign Investment
EVFTA EU-Vietnam Bilateral Trade Agreement
FAO Food and Agriculture Organization of the United Nations
FDI Foreign Direct Investment
FTA Free Trade Agreements
VA Value Added
IWSR International Wine & Spirit Research
MFN Most Favoured Nation
OIV International Organisation of Vine and Wine
GDVC General Department of Vietnam Customs
GSO General Statistics Office of Vietnam
SC Special Consumption
TPP Trans-Pacific Agreement TPP
UNFPA United Nations Population Fund
UNWTO World Tourism Organization
USDA U.S. Department of Agriculture
VAT Value Added Tax
VBA Association Beer - Alcohol - Beverage Vietnam
VIRAC VIRAC Joint Stock Company
WTO World Trade Organization
5
Content is intentionally removed for demo purpose
Content
1 Business environment
1.1 Macroeconomic context
1.2 Legal barriers
1.3 Free trade agreements
Content is intentionally removed for demo purpose
6

Source: VIRAC, GSO
1. Business environment
1.1 Macroeconomic context
Source: VIRAC, GSO
Monthly CPI fluctuations, 2014-2018
GDP growth, 2011 - 2018
Content is intentionally removed for demo purpose
7

Source: VIRAC, GSO
Source: VIRAC, GSO
1. Business environment
1.1 Macroeconomic context
CPI by item group, 2018
• The beverage and tobacco industry are among segments having
positive CPI growth in 2018.
• Vietnamese consumer confidence index fell by 1 point percent to 116
points in the third quarter of the year 2018.
Vietnam’s Consumer Confidence Index, Q1/2014 - Q1/2018
Content is intentionally removed for demo purpose
8

Content is intentionally removed for demo purpose
1. Business environment
1.1 Macroeconomic context
9
Source: Synthesized by VIRAC, BCG
• In 2018, the USD/VND exchange rate fluctuated around 22.400.
• 2018’s FDI rose sharply to 35.88 billion dollars, up 47.05% compared to
the same period in 2017.
Thousand
VND
VND/USD exchange rate, 2013-2018 Source: VIRAC, PVN
FDI capital, 2015-2018Billion
USD

Content is intentionally removed for demo purpose
1. Business environment
1.1 Macroeconomic context
10
Source: VIRAC, GDVC
Beverage industry’s shares in GDP, the period 2010-2015
Source: VIRAC, GSO
Billion USD
Commodity import – export, 2006 - 2018
Billion USDThe total im-export value reached 425.12 billion, up 21% corresponding
to 73.74 billion compared to 2017.

Content is intentionally removed for demo purpose
1. Business environment
1.1 Macroeconomic context
11
Beverage consumption is one of the important driving
factors behind consumer goods.
The young population creates a potential market for the
beverage industry.
Source: VIRAC, GSO
Million
people
Total population and working - age population structure, 2010-2018
Beverage and tobacco sectors’ CPI compared to the previous month
T4/2017-2018
Source: VIRAC, GSO

Content is intentionally removed for demo purpose
1. Business environment
1.1 Macroeconomic context
12
Source: VIRAC, Economist Intelligence Unit
Total disposable income, 2010-2020The increasing disposable income has stimulated expenditures on beverage
stuff.
Source: VIRAC, GSO
Billion USD
Vietnam’s retail sales 2011-2018

Content is intentionally removed for demo purpose
Content
I Business environment
1.1 Macroeconomic context
1.2 Legal barriers
1.3 Free trade agreements
13

Content is intentionally removed for demo purpose
14
1. Business environment
1.2. Legal framework
• Quy chuẩn kỹ thuật quốc gia đối với các sản phẩm Đồ uống có cồn (QCVN 6-3:2010/BYT) quy định các chỉ tiêu an toàn thực phẩm và các yêu cầu quản
lý đối với cồn thực phẩm được sử dụng để sản xuất các sản phẩm đồ uống có cồn như Cồn thực phẩm, Bia hơi, Bia hộp, Bia chai, Rượu Vang, Rượu Mạnh,…;
• Quy chuẩn kỹ thuật quốc gia đối với các sản phẩm Đồ uống không cồn (QCVN 6-2:2010/BYT) quy định các chỉ tiêu an toàn thực phẩm và các yêu cầu
quản lý đối với Đồ uống không cồn, bao gồm nước rau quả, nectar rau quả và Đồ uống pha chế sẵn không cồn;
• Quy chuẩn kỹ thuật quốc gia đối với nước khoáng thiên nhiên và nước uống đóng chai (QCVN 6-1: 2010/BYT). Quy chuẩn này quy định các chỉ tiêu
an toàn thực phẩm và các yêu cầu quản lý đối với nước khoáng thiên nhiên đóng chai và nước uống đóng chai được sử dụng với mục đích giải khát. Quy
chuẩn này không áp dụng đối với thực phẩm chức năng. Luật An toàn thực phẩm số 55/2010/QH12, ngày 17/6/2010;
• Luật Chất lượng sản phẩm hàng hóa số 05/2007/QH12 ngày 21/11/2007;
• Nghị định số 38/2012/NĐ-CP của Chính phủ ngày 25/4/2012 quy định chi tiết thi hành một số điều của Luật An toàn thực phẩm;
• Thông tư số 29/2012/TT-BCT của Bộ Công thương quy định cấp, thu hồi Giấy chứng nhận cơ sở đủ điều kiện an toàn thực phẩm thuộc trách nhiệm quản
lý của Bộ Công thương.
• Luật số 55/2014/QH13 – Luật Bảo vệ môi trường quy định về hoạt động bảo vệ môi trường; chính sách, biện pháp và nguồn lực để bảo vệ môi trường;
quyền, nghĩa vụ và trách nhiệm của cơ quan, tổ chức, hộ gia đình và cá nhân trong bảo vệ môi trường;
• Thông tư số 128/2013/TT-BTC ngày 10/9/2013 của Bộ Tài chính quy định về thủ tục hải quan; kiểm tra, giám sát hải quan; thuế xuất khẩu, thuế nhập
khẩu và quản lý thuế đối với hàng hóa xuất khẩu, nhập khẩu;
• Thông tư 164/2013/TT-BTC ngày 15/11/2013 của Bộ Tài chính ban hành Biểu thuế xuất khẩu, biểu thuế nhập khẩu ưu đãi theo danh mục mặt hàng chịu
thuế trong đó có Bia và Rượu;
• Nghị định số 08/2015/NĐ-CP ngày 21/1/2015 của Chính phủ quy định chi tiết và biện pháp thi hành Luật Hải quan về thủ tục hải quan, kiểm tra, giám
sát, kiểm soát hải quan Biểu thuế nhập khẩu Bia, Rượu, Nước Giải Khát;
• Luật số: 27/2008/QH12 – Luật thuế tiêu thụ đặc biệt quy định về đối tượng chịu thuế, đối tượng không chịu thuế, người nộp thuế, căn cứ tính thuế, hoàn
thuế, khấu trừ thuế và giảm thuế tiêu thụ đặc biệt;
• Quyết định số 2219/QĐ-BCT phê duyệt kinh doanh mạng lưới kinh doanh phân phối, bán buôn sản phẩm Rượu trên phạm vi toàn quốc đến năm 2025,
tầm nhìn 2035;
Laws, decrees and regulations of the industry
Content is intentionally removed for demo purpose

Content is intentionally removed for demo purpose
Legal framework’s impact on the industry
For state agencies
For businesses in the industry
Beverage export output 2010-2015
Source: VIRAC, GSO
15
1. Business environment
1.2. Legal framework
Thousand tons

Content is intentionally removed for demo purpose
Beer manufacturing enterprises 2010-2017 Profit margin before tax, 2010-2017 Beverage manufacturing growth 2011-2018
Source: VIRAC, GSOSource: VIRAC, GSOSource: VIRAC, GSO
Unit: %
16
1. Business environment
1.2. Legal framework

Content is intentionally removed for demo purpose
17
1. Business environment
1.2. Legal framework
Circulars and decrees of the special consumption tax on alcoholic beverages
SCT on alcoholic beverages are subject to the incremental roadmap as indicated
in Law No. 70/QH13/2014 and will increase gradually to 65% in 3 years’ time,
starting from January 1st, 2017.Commodity Date
Tax rate
(%)
SCT roadmap applicable to liquor and beer since 2017
Source: Synthesized by VIRAC

Content is intentionally removed for demo purpose
18
1. Business environment
1.2. Legal framework
New regulations on liquor imports.

Content is intentionally removed for demo purpose
Content
1 Business environment
1.1 Macroeconomic context
1.2 Legal barriers
1.3 Free trade agreements
19

Content is intentionally removed for demo purpose
• Tariffs:
3.1 WTO — Vietnam joined as the 150th member on November 7th, 2006
• Distribution markets:
• Investment environment:
WTO’s impact on Vietnam’s beverage industry:
Item
Most
Favoured
Nation(%)
Commitments with WTO
Tariff before
membership (%)
Final tariff
(%)
Implementa
tion span
Source: VIRAC, WTO
20
1. Business environment
1.3 Free trade agreements
Content is intentionally removed for demo purpose
• Tariffs:
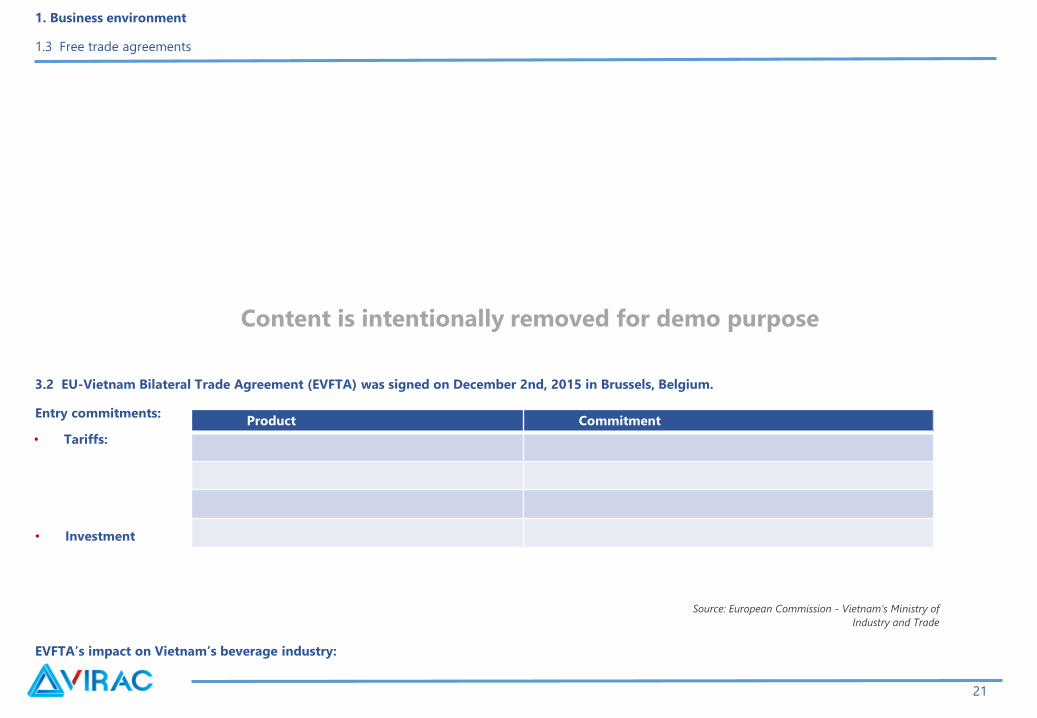
3.2 EU-Vietnam Bilateral Trade Agreement (EVFTA) was signed on December 2nd, 2015 in Brussels, Belgium.
Entry commitments:Product Commitment
Source: European Commission - Vietnam’s Ministry of
Industry and Trade
21
1. Business environment
1.3 Free trade agreements
• Investment
EVFTA’s impact on Vietnam’s beverage industry:

Content is intentionally removed for demo purpose
3.3 CPTPP - Comprehensive Partnership and Transition Partnership Agreement
Commitments
• Tariff (commercial goods):
• Other commitments
22
1. Business environment
1.3 Free trade agreements

Content is intentionally removed for demo purpose
CPTPP’s impact on Vietnam’s beverage industry:
No. Item Tax - cutting
roadmap
1
2
3
4
5
Vietnam's commitments with CPTPP on import tariffs:
Source: VIRAC, Ministry of Finance
22
1. Business environment
1.3 Free trade agreements
Content is intentionally removed for demo purpose

Content is intentionally removed for demo purpose
3.4 Other trade agreements:
FTA’s impact on Vietnam’s beverage industry:
24
1. Business environment
1.3 Free trade agreements

Content is intentionally removed for demo purpose
Content
2. Industry overview
2.1 Global market
2.2 Local market
2.3 Risk
2.4 Planning and development
2.5 Prospect and prediction
25

Content is intentionally removed for demo purpose
2. Industry overview
2.1 Global market – 2.1.1. Beer
2.1.1 Beer
Input material: Malt, Hops
Regarding malt
26
The UK’s barley price developments 1/2012-2018
Source: VIRAC, Indexmundi
Unit: GBP/tonne
Global barley production and consumption, 10/11-17/18e
Million
tons
Source: VIRAC, USDA

Content is intentionally removed for demo purpose
2. Industry overview
2.1 Global market – 2.1.1. Beer
27
Market shares of 5 largest barley producers 2017/2018
Source: VIRAC, USDA
Barley consumption for malt processing, 10/11-16/17
Million tons
Source: VIRAC, International Grains Council

Content is intentionally removed for demo purpose
2. Industry overview
2.1 Global market – 2.1.1. Beer
28
The UK’s malt price movements, 7/7/2011-2015
Source: VIRAC, Bloomberg
Unit: GBP/tonne
Malt export production in the world and Europe, 2010-
2015
Million tons
Million tons
There is a worldwide decline in malt exports, except for the European region, which
is forecast to be on the upward trend given favorable weather conditions in some
countries in the region: The UK and Spain.
Source: VIRAC, Euromalt, United Nations Trade Statistics
Malt production situations in the world and Europe, 2010-2014
Content is intentionally removed for demo purpose
2. Industry overview
2.1 Global market – 2.1.1. Beer
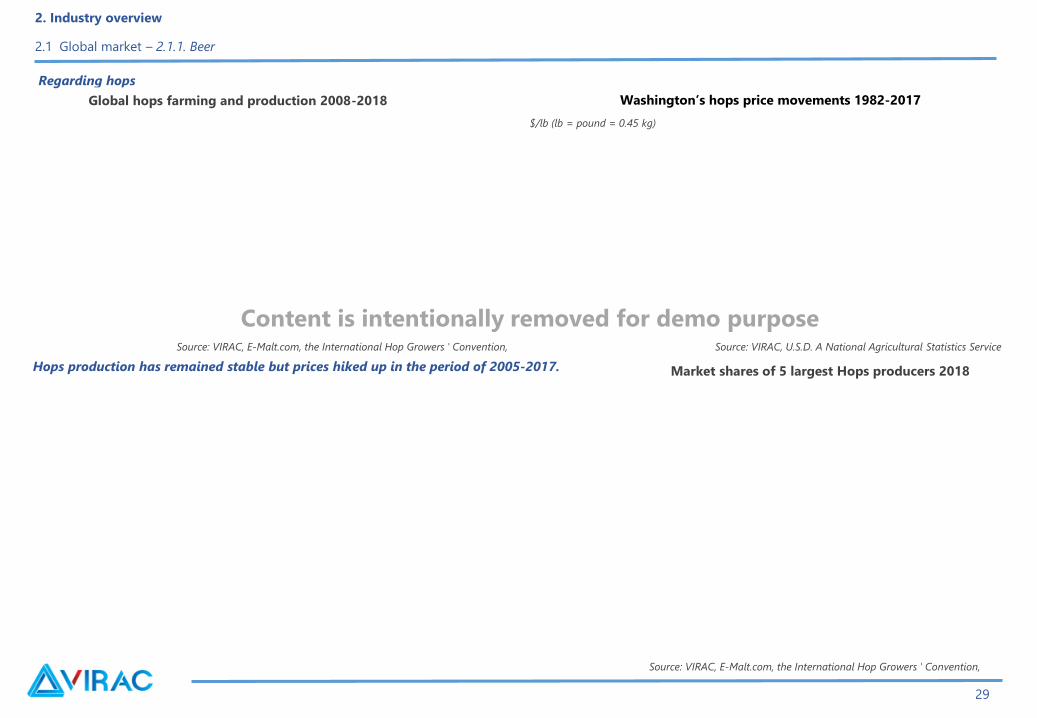
Regarding hops
29
Global hops farming and production 2008-2018
Source: VIRAC, E-Malt.com, the International Hop Growers ' Convention,
Washington’s hops price movements 1982-2017
Source: VIRAC, U.S.D. A National Agricultural Statistics Service
$/lb (lb = pound = 0.45 kg)
Hops production has remained stable but prices hiked up in the period of 2005-2017. Market shares of 5 largest Hops producers 2018
Source: VIRAC, E-Malt.com, the International Hop Growers ' Convention,

Content is intentionally removed for demo purpose
2. Industry overview
2.1 Global market – 2.1.1. Beer
30
Source: VIRAC, Euromalt, United Nations Trade Statistics
Million
tons
Million
USD
Hops export situation, 2011-2017
Market shares of 5 world's largest Hops exporters 2017

Content is intentionally removed for demo purpose
2. Industry overview
2.1 Global market – 2.1.1. Beer
Global beer supply and demand
Global production is of large scale with two major hubs, including Asia and Europe. Irregularities due to prolonged droughts blew a huge hit to malt
production — the main input material. Against this setback, the industry still met the world’s consumption needs.
Global beer consumption and production 2010-2018Beer output and growth rate of 7 regions 2018
Source: Synthesized by VIRAC
31
Billion liter
Source: Synthesized by VIRAC
Content is intentionally removed for demo purpose

Content is intentionally removed for demo purpose
32
Top 10 countries having the highest beer im-export value 2017 Countries with highest beer im-export growth rates 2010-2015
Source: VIRAC, worldsrichestcountries.comSource: VIRAC, Euromalt, United Nations Trade Statistics
2. Industry overview
2.1 Global market – 2.1.1. Beer
Global beer output and exports, 2010-2017
Million
tons
Billion
USD

Content is intentionally removed for demo purpose
The beer market has distinctly divided into two groups: Multinational companies with capital, branding and distribution channel advantages and
indigenous manufacturers with a depth understanding of the local demand.
33
Production market shares of 5 world’s leading enterprises, 2017
Source: VIRAC, VBA
Consumption market shares of 5 world’s leading enterprises,
2017
Source: VIRAC, VBA
2. Industry overview
2.1 Global market – 2.1.1. Beer
Content is intentionally removed for demo purpose

Content is intentionally removed for demo purpose
34
RankLogo Brand Entity Nation
Brand value (million USD) Brand ranking
2018 2017 2018 2017 2018 2017
Source: brandirectory.com
10 highest-value beer brands, 2017-2018
1. Bud Light
2. Industry overview
2.1 Global market – 2.1.1. Beer
Content is intentionally removed for demo purpose

Content is intentionally removed for demo purpose
35
2. Budweiser
3. Heineken
4. Brahma
5. Skol
6. Asahi
2. Industry overview
2.1 Global market – 2.1.1. Beer
Content is intentionally removed for demo purpose
36
7. Corona Extra
8. Guinness
9. Cyrillic
10. Miller Lite
2. Industry overview
2.1 Global market – 2.1.1. Beer

Content is intentionally removed for demo purpose
Wine
37
2. Industry overview
2.1 Global market – 2.1.2. Wine
Top five European countries with the largest wine vineyard area
Source: VIRAC, THE OIV
Top five non- European countries with the largest wine vineyard area
Source: VIRAC, THE OIV
Wine-producing vineyard area, 2005-2017
Source: VIRAC, THE OIV

Content is intentionally removed for demo purpose
38
2. Industry overview
2.1 Global market – 2.1.2. Wine
Unit: million Output
Source: VIRAC, THE
OIV
Grape production in General, 2010-2017eMillion
tons
Source: VIRAC, THE OIV
Total vine production by country in 2017
Content is intentionally removed for demo purpose

Content is intentionally removed for demo purpose
39
2. Industry overview
2.1 Global market – 2.1.2. Wine
Wine production presents lots of discernable fluctuations while the
demand for consumption remained relatively stable during 2005-
2017.
Top five largest wine producers in the world, 2014-2017
Source: VIRAC, THE OIV
Global wine production and consumption, 2005-2017e100 million
litres
Market shares of five largest wine producers, 2017-2017
Source: VIRAC, THE OIV
Source: VIRAC, THE OIV
Content is intentionally removed for demo purpose
40
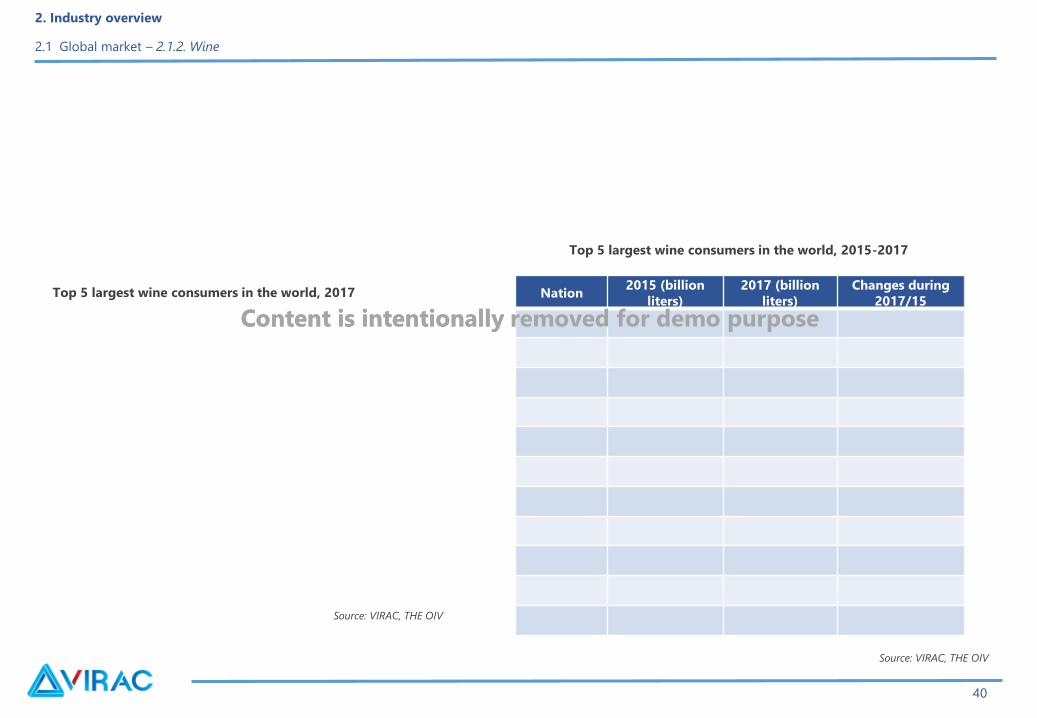
2. Industry overview
2.1 Global market – 2.1.2. Wine
Nation2015 (billion
liters)
2017 (billion
liters)
Changes during
2017/15
Top 5 largest wine consumers in the world, 2015-2017
Source: VIRAC, THE OIV
Source: VIRAC, THE OIV
Top 5 largest wine consumers in the world, 2017
Content is intentionally removed for demo purpose

Content is intentionally removed for demo purpose
Wine exports tend to climb up in value and output with major importers within the EU.
41
2. Industry overview
2.1 Global market – 2.1.2. Wine
Source: VIRAC OIV, GTA
Source: VIRAC, THE OIV
Nation
Wine export output,
2012-2017
(billion liters)
Export value
(billion EUR)
2015 2017 2015 2017
Wine export value and output 2000-2017e Largest wine exporters
Content is intentionally removed for demo purpose

Content is intentionally removed for demo purposeContent is intentionally removed for demo purpose
42
2. Industry overview
2.1 Global market – 2.1.2. Wine
Largest wine importers
Nation
Import output, 2012-
2017
(billion liters)
Import value
(billion EUR)
2015 2017 2015 2017
Source: VIRAC OIV, GTA
Content is intentionally removed for demo purpose

Content is intentionally removed for demo purpose
43
2. Industry overview
2.1 Global market – 2.1.2. Wine
Rượu Mạnh
Rượu Rạnh là chất cồn được chưng cất và có thể được làm từ bất kì chất hữu cơ nào có thể lên men để tạo ra cồn. Hầu hết các Đồ uống có cồn được làm ra từ
quá trình lên men trái cây hay ngũ cốc. Chất cồn được chiết ra từ chất lỏng được lên men bằng cách đun sôi và cô đọng phần chất cồn bốc hơi. Sau đó người ta
đưa chất lỏng vào thùng gỗ sồi để ủ (đối với Whisky hoặc Cognac) hay đóng chai luôn (đối với Vodka, Gin,…). Do đó khi đề cập đến Rượu Mạnh nói chung không
có một nguyên liệu đầu vào đặc trưng như đối với Rượu Vang (sản xuất bởi Nho).
product
• Brandy: Chỉ chung các loại Rượu Mạnh chưng cất từ Rượu Vang (Nho) hay từ trái cây đã lên men. Thường thì Brandy phải qua hai lần chưng cất để đạt tỷ lệ
cồn 70–80% rồi mới ủ cho rượu dịu bớt trong các thùng gỗ sồi nhờ quá trình oxy hóa, sau đó pha thêm nước cất để đạt được độ cồn khoảng 40%. Cũng có khi
Brandy được pha thêm caramen (đường ngào) để có màu đẹp. Brandy có hai dòng chính là Cognac và Armagnac. Các nhãn hiệu nổi tiếng của dòng Rượu
Brandy: Hennessy, Remy Martin, Martel, Otard, Courvoisier, Camus, Hines.
• Whiskey: Whisky là sản phẩm chưng cất từ những hạt lúa đại mạch, lúa mạch đen bắp và các loại ngũ cốc có hạt nhỏ khác. Trước năm 1820, tất cả các loại
whisky đều được làm ra từ mạch nha của lúa đại mạch (nên còn có tên là Whisky đại mạch). Việc chưng cất loại whisky từ lúa đại mạch pha trộn với bắp xuất
hiện vào năm 1830, sau khi bằng sáng chế được cung cấp. Từ đó người ta mới phát hiện ra rằng Whisky pha trộn có mùi êm dịu hơn. Nhưng whisky tuyệt đối
không sử dụng nguyên liệu khoai tây, trái cây hay bất cứ loại thực phẩm nào khác, ngoài những thứ đã kể trên. Có 4 nhà sản xuất trên thế giới nổi tiếng nhất
hiện nay):
- Scotch Whisky, Malt whisky: đi từ hạt lúa mạch được sơ chế thành hạt mạch nha; Blend whisky: được pha từ nhiều loại ngũ cốc (đa dạng sản phẩm); Những sản
phẩm trên chủ yếu được chưng cất bằng nồi 2 lần.
- Canadian Whisky: Thời gian ủ ít nhất là 3 năm và được chưng cất bằng cột với các thành phần chính: Rye (Lúa mạch đen), Lúa mạch (barley), Lúa mì (wheat),
Ngô.
- American Whisky: Sản phẩm cũng khá đa dạng trong cách kết hợp các nguyên liệu chính từ ngũ cốc với những nồng độ khác nhau và đặc biệt chưng cất bằng
cột. Ví dụ: American Bourbon whisky với 51% ngô + 49% ngũ cốc khác; Rye whisky với 51% rye + 49% ngũ cốc khác.
- Irish Whisky: Thời gian ủ ít nhất 5 năm, và cũng từ những nguyên liệu chủ yếu từ ngũ cốc và lúa mạch nhưng đặc biệt là không có mùi khói, chưng cất 3 lần
bằng nồi.
• Vodka là loại Rượu Mạnh không màu làm từ bất cứ chất liệu nào. Lúc mới chưng cất Vodka đạt đến 95 độ cồn, sau giảm dần còn 40–50 độ. Vodka không nhất
thiết phải qua khâu ủ, nhưng cần xử lý nhằm loại bỏ hương vị và màu sắc để trở thành trong suốt, không mùi (chủ yếu sử dụng than hoạt tính để khử chất
độc). Đây là loại rượu dễ bay hơi có thể pha chế với nhiều loại trái cây và các hỗn hợp Đồ uống khác. Có hai loại Vodka: Clear Vodka (sản xuất theo kiểu thông
thường không màu); Flavour Vodka (sử dụng hương vị, nguyên liệu làm thơm Vodka).
• Gin là loại Rượu được chưng cất từ các loại hạt (bắp, lúa mạch, lúa mì, lúa mạch đen) trộn với hương liệu thảo mộc như hạnh nhân, quế, hạt côca, gừng, vỏ
chanh, cam,… Về mặt kỹ thuật, Gin có thể được coi là các loại Rượu mùi nếu được cho thêm đường. Độ cồn trong Rượu Gin thường là 34–47%.
Content is intentionally removed for demo purpose

Content is intentionally removed for demo purpose
44
2. Industry overview
2.1 Global market – 2.1.2. Wine
The consumption demand for malt wine is on the rise alongside a slight increase in export values.
Largest malt wine importers 2017
Source: VIRAC, UN COMTRADE statistics
Malt wine consumption 2009-2017
Billion USD

Content is intentionally removed for demo purpose
45
2. Industry overview
2.1 Global market – 2.1.2. Wine
RankChan
geType of wine
Total
point
Total brand
point
Brand
quantity of
top 10
Most prevalent liquor types in the world 2017
Source: VIRAC, drinkspowerbrands.com
Rank Type of wineTotal brand
pointChange
World-class alcohol brands 2017
Source: VIRAC, drinkspowerbrands.com
Content is intentionally removed for demo purpose

Content is intentionally removed for demo purpose
46
2. Industry overview
2.1 Global market – 2.1.2. Wine
Rank Change Type of wine Total point ChangeTotal brand
pointChange
Brand quantity
of top 10Change
World’s largest wine traders and producers 2015
Source: VIRAC, drinkspowerbrands.com
Rank Change Type of wine Total point ChangeTotal brand
pointChange
Brand quantity
of top 10Change
-
World - famous wine exporters 2015
Source: VIRAC, drinkspowerbrands.com
Content is intentionally removed for demo purpose
Content is intentionally removed for demo purpose
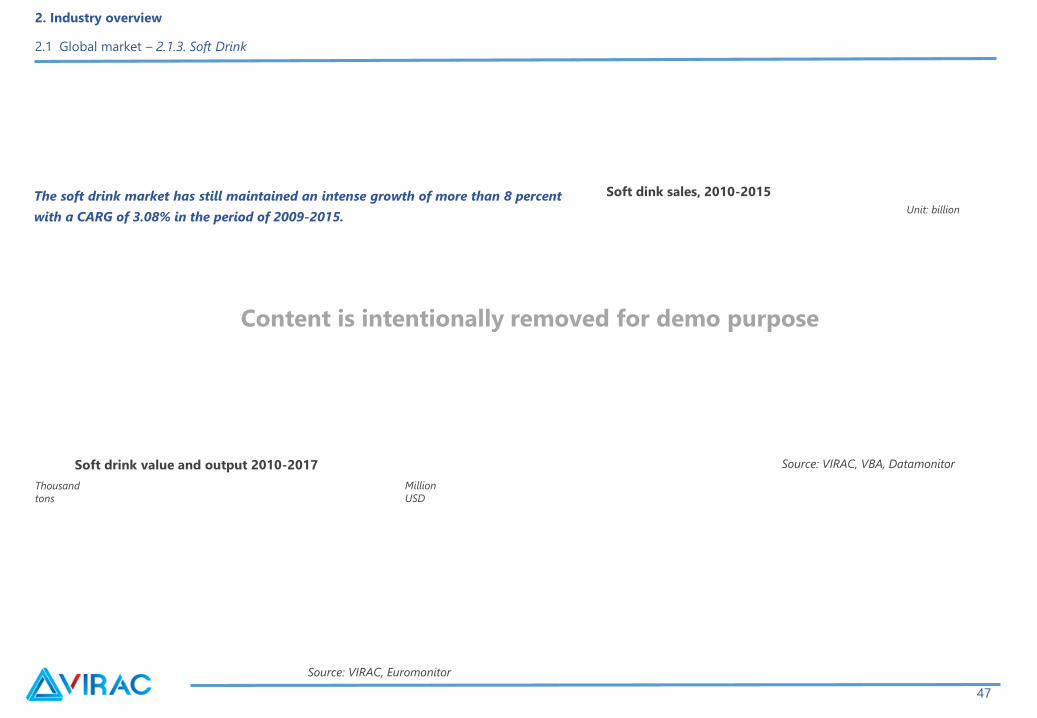
The soft drink market has still maintained an intense growth of more than 8 percent
with a CARG of 3.08% in the period of 2009-2015.
47
2. Industry overview
2.1 Global market – 2.1.3. Soft Drink
Soft dink sales, 2010-2015
Source: VIRAC, VBA, Datamonitor
Unit: billion
Soft drink value and output 2010-2017
Thousand
tons
Million
USD
Source: VIRAC, Euromonitor

Content is intentionally removed for demo purpose
Fizzy drinks are still the most preferred but the demand for
consumption is shifting to bottled water and fruit juice.
48
2. Industry overview
2.1 Global market – 2.1.3. Soft Drink
Sales of soft drink lines 2015
Source: VIRAC, VBA
RankLogo Brand Entity
Brand value (million USD)Change
Brand
ranking2017 2018 2017 2018
10 highest-value soft drink brands, 2017-2018
Source: brandfinance
Content is intentionally removed for demo purpose

Content is intentionally removed for demo purpose
49
2. Industry overview
2.1 Global market – 2.1.3. Soft Drink
Coca-Cola and Pepsico has taken the lead in the industry, contributing 8 out of 10 largest - value brands. Coca-Cola is dubbed as the most expensive
global brand, reaching 31.89 billion, up 6% compared to 2017.
Fizzy soft drink supplemental and sports drink Fruit juice Bottled water
Source: VIRAC, Bloomberg Intelligent, VBA

Content is intentionally removed for demo purpose
Content
2. Industry overview
2.1 Global market
2.2 Local market
2.3 Risk
2.4 Planning and development
2.5 Prospect and prediction
50
Content is intentionally removed for demo purpose

Content is intentionally removed for demo purpose
The drinks industry has a large scale and high growth potential. Production is gradually meeting the demand, with increasing exports and falling
imports.
51
2. Industry overview
2.2 Local market
Local soft drink im-export import, 2010-2017e
Thousand
tons
Source: VIRAC, UN COMTRADE
statistics
Local soft drink production and consumption, 2010-2018
Billion
liter
Source: VIRAC, GDVC
Billion
VND

Content is intentionally removed for demo purpose
Segment structure and shifting during 2010-2018 recorded no significant change. Beer and soft drinks were still dominant while the wine segment only
made up the small share.
52
2. Industry overview
2.2 Local market
Production structure by segment 2010-2018
Source: VIRAC, GDVC

Content is intentionally removed for demo purpose
Source: Synthesized by VIRAC
The beer value chain
Agriculture Malt
Brewing
Agency Consumer
Packaging
53
2. Industry overview
2.2 Local market – 2.2.1. Beer
2.2.1. Beer

Content is intentionally removed for demo purpose
Vietnam’s major malt export areas, 2017e
Malt and hops import 2010-2017
Source: VIRAC, Euromalt, United Nations Trade Statistics
The beer industry depend its input material on imports, mainly for malt.
Source: VIRAC, Euromalt, United Nations Trade
Statistics
54
2. Industry overview
2.2 Local market – 2.2.1. Beer
Input material
Thousand kg
Malt import situations, 2010-2017
Source: VIRAC, Euromalt, United Nations Trade Statistics
Million
tons
Europe

Content is intentionally removed for demo purpose
55
2. Industry overview
2.2 Local market – 2.2.1. Beer
Vietnam’s hops supply structure 2017
Source: VIRAC, Euromalt, United Nations Trade
Statistics
Thousand kg
Source: VIRAC, Euromalt, United Nations Trade
Statistics
Hops import to Vietnam, 2010-2017e

Content is intentionally removed for demo purpose
56
2. Industry overview
2.2 Local market – 2.2.1. Beer
Production-consumption
The domestic beer industry is in surplus due to production beyond
consumption demand. However, there is much space for growth, particularly
the high-end beer segment.
Local beer production and consumption, 2010 – 2018
Source: VIRAC, GSO
Billion
liter
Thousand
billion VND
Source: VIRAC, GSO

Content is intentionally removed for demo purpose
57
2. Industry overview
2.2 Local market – 2.2.1. Beer
Inventories
Million USD
Beer inventories, 2011-2018
Source: VIRAC, GSO
Beer inventory structure, 2011-2018
Source: VIRAC, GSO

Content is intentionally removed for demo purpose
The beer market has a discernable concentration with more than 90% of the value belong to such giant corporations as: Sabeco, Habeco, Heineken,
Carlsberg, Tiger.
58
2. Industry overview
2.2 Local market – 2.2.1. Beer
Internal competition
Domestic consumption market shares, 2017
Source: VIRAC Source: VIRAC
Top 10 Vietnam’s beer brands, 2017

Content is intentionally removed for demo purpose
59
2. Industry overview
2.2 Local market – 2.2.1. Beer
In 2017, Sabeco vẫn duy trì vị trí dẫn đầu dù thị phần giảm nhẹ từ 41.6% năm 2015 xuống 40.9%.
Sabeco là hãng bia nổi tiếng nhất và là doanh nghiệp đang được tất cả các hãng bia khác quan tâm, trong năm qua, thương vụ thoái vốn nhà nước tại Sabeco trị
giá gần 5 tỉ USD. Công ty TNHH Vietnam Beverage – nhà đầu tư Thái lan, đã trả mức giá 320,000 đồng/cổ phiếu – chưa từng có trong lịch sử để chiếm 53.59% cổ
phần tại Sabeco. Hiện tại, Sabeco đang sở hữu 24 nhà máy bia đang hoạt động. Năm 2018, Sabeco tiêu thụ 1.727 tỷ lít bia và kỳ vọng lên mức 1.85 tỷ lít trong
năm 2018. Sabeco trở thành "gã khổng lồ" trên thị trường nhờ việc thành lập và hợp nhất nhiều nhà máy bia, đặc biệt là ở phía Nam. Mạng lưới nhà máy rộng lớn
là lợi thế cạnh tranh giúp Sabeco phân phối hiệu quả hơn các đối thủ. Sabeco có 2 thương hiệu bia mang tính biểu tượng và có truyền thống tại Việt Nam là "Bia
Sài Gòn" và "333". Ngoài ra, Sabeco đang đẩy mạnh các thương hiệu Saigon Special (hay còn được gọi là Sài Gòn lùn do mẫu thiết kế chai thấp).
Không những thế, Sabeco đang giành giật thị phần của Habeco ở miền bắc. Tính riêng tại khu vực miền bắc, thị phần Sabeco tăng từ 10% năm 20014 lên 15.5%
trong năm 2017. Trong top 10 thương hiệu Bia có đến 3 nhãn hiệu thuộc sở hữu của Sabeco và đều chiếm thị phần cao: Saigon Export (16.5%), 333’
Export (13.2%) và Saigon lager (10.4%). 2 thương hiệu mang tính biểu tượng và có truyền thống tại Việt Nam là Bia Sài Gòn và 333.
Kể từ năm 2015, VBL đã vượt Habeco, vươn lên vị trí thứ 2 về thị phần tiêu thụ và đạt 23% trong năm 2017.
VBL với sản phẩm chính là Heineken hiện đang thống lĩnh phân khúc cao cấp, ngoài ra còn có các thương hiệu Tiger, Larue, Desperados, Affligem và Strongbow…
Trong phân khúc này, riêng VBL đã chiếm khoảng 67% thị phần, trong đó 40% thuộc về thương hiệu Tiger và 27% thuộc về thương hiệu Heineken. Saigon Special
của Sabeco có thị phần 28% ở phân khúc này. VBL hiện sở hữu 5 nhà máy tại Việt Nam, trong đó 3 nhà máy tại miền Nam và 2 nhà máy tại miền Trung, đây là 2
thị trường trọng điểm của công ty.
VBL đầu tư mạnh cho tiếp thị, quảng cáo với sự tham gia của nhiều người nổi tiếng, có những vị trí đắc địa hưởng lợi từ việc tâm lý tiêu dùng của người dân trong
nước chuyển hướng ưa chuộng các dòng sản phẩm thương hiệu nước ngoài. Trong khi đó, Sabeco và Habeco có dấu hiệu giảm thị phần do gặp khó khăn trong
việc phát triển địa điểm bán hàng. Với bối cảnh cạnh tranh ngày càng gay gắt, mọi địa điểm bán hàng tại các thành phố lớn như Hà Nội, Hồ Chí Minh cũng như
tỉnh lẻ như Hải Dương, Thái Nguyên đều bị giành giật quyết liệt. Do vậy, hai doanh nghiệp này gần như độc quyền chỉ ở phân khúc bình dân – sản phẩm tạo ra
giá trị thấp, các sản phẩm cao cấp gần như không cạnh tranh được với VBL.
Habeco chiếm 16.2% thị trường
Habeco nắm hơn 50% thị phần ở miền Bắc và chiếm 16.2% thị trường, xếp thứ 3 trong năm 2017 . Tương tự như Bia Sài Gòn của Sabeco, thì Bia Hà Nội của
Habeco cũng có tính biểu tượng ở miền bắc.Ngoài bia chai và bia lon, Habeco cũng sản xuất dòng bia hơi riêng, nổi bật nhất là "Bia hơi Hà Nội". Bia hơi chiếm
15-16% tổng sản lượng của Habeco. Dòng bia bình dân và sản phẩm Bia Hà Nội chiếm phần lớn sản lượng của Habeco, trong khi thương hiệu cao cấp là Trúc
Bạch không đạt được nhiều thành công. Habeco có 15 nhà máy bia chủ yếu ở miền bắc.
Content is intentionally removed for demo purpose

Content is intentionally removed for demo purpose
Other beer labels
Masan Brewery
Sapporo
AB InBev
60
2. Industry overview
2.2 Local market – 2.2.1. Beer

Content is intentionally removed for demo purpose
61
2. Industry overview
2.2 Local market – 2.2.1. Beer
Vietnamese beer is gradually penetrating the world market, with increasing
exports and falling imports, which contributes to boosting the production.
Source: VIRAC, GDVC
Largest beer suppliers for Vietnam 2018
Thousand
tons
Million
USD
Source: VIRAC, Euromalt, United Nations Trade Statistics
Beer import – export, 2010 –2018
Beer consumption market largest Vietnam
2018
Source: VIRAC, GDVC

Content is intentionally removed for demo purpose
62
2. Industry overview
2.2 Local market – 2.2.1. Beer
Export markets outside the territory of Vietnam Beer is Southeast Asia (Singapore, Laos and the Philippines)
Kim ngạch xuất khẩu Bia sang Lào ngày một tăng (chiếm 3.3%), thị trường Lào cũng là một thị trường đầy tiềm năng mà các doanh nghiệp sản xuất Bia Việt Nam
còn chưa khai thác hết. Những ưu điểm lớn của thị trường Lào: vị trí địa lý, khí hậu tương đương Việt Nam, số lượng dân số nam chiếm đa số, kinh tế Lào đang
từng bước phát triển và đây là cùng được coi là một đất nước lễ hội (một năm có 4 lần đón Tết).
Australia là nước nhập khẩu Bia từ Việt Nam lớn thứ 4. Trong những năm gần đây kim ngạch xuất khẩu Bia từ thị trường Việt Nam sang Australia tăng trưởng
khá tốt do giá Bia nhập khẩu từ Việt Nam rẻ so với các nước khác, trong khi chất lượng khá tốt lại quy tụ nhiều hãng bia nổi tiếng tham gia sản xuất. Một nguyên
ngân khác là do chính sách khuyến khích xuất khẩu của Nhà nước.
Trong top 10 doanh nghiệp xuất khẩu bia nhiều nhất, có đến 7 doanh nghiệp có vốn đầu tư của nước ngoài như: Công ty TNHH Sabmiller Việt Nam, Công ty
TNHH Nhà Máy Bia Heineken Hà Nội, Công ty TNHH Bia San Miguel Việt Nam,... Tỷ trọng xuất khẩu của 7 doanh nghiệp này chiếm 32% lượng bia xuất khẩu của
Việt Nam. Mặc dù các doanh nghiệp sản xuất bia trong nước chỉ có 3 đại diện là: Tổng Công ty CP Bia Rượu Nước Giải Khát Sài Gòn, Công ty CP Tập Đoàn
Hương Sen và Công ty CP Đầu Tư Phát Triển Công Nghệ Bia Rượu Nước Giải Khát Hà Nội nhưng tỷ trọng xuất khẩu bia của các công ty này cao hơn các doanh
nghiệp FDI và chiếm 32% thị phần bia xuất khẩu cả nước.
In 2018, 3 main supplyment of Vietnam's Beer is...Mexico (17%), Hà Lan (16%) và Thái Lan (13%). Mexico và Hà Lan là 2 thị trường thống trị bia thế giới
với những công ty bia được ưa chuộng hàng đầu thế giới nói chung và Việt Nam nói riêng là: AB Inbev, Corona Extra thuộc Hà Lan và Mexico.
Thái Lan đứng thứ 3 trong top các quốc gia xuất khẩu Bia sang Việt Nam, Bia Thái Lan được người tiêu dùng Việt ưa chuộng bởi giá chỉ cao hơn sản phẩm Việt
từ 10 - 20% nhưng lại rẻ hơn nhiều so với hàng hóa có xuất xứ từ châu Âu mà chất lượng lại không thua kém nhiều. Dòng Bia Thái được ưa chuộng nhất là Bia
Con Voi của ThaiBev. ThaiBev là doanh nghiệp có cùng chủ sở hữu với tập đoàn TCC Holdings – tập đoàn đã mua lại chuỗi siêu thị Metro. Do vậy, các thương
hiệu Bia Thái thông qua các chuỗi bán lẻ dễ dàng tiếp cận người tiêu dùng trong nước.

Content is intentionally removed for demo purpose
63
2. Industry overview
2.2 Local market – 2.2.1. Beer
Payment methods of beer export enterprises 2018
Beer export delivery conditions 2018
Source: VIRAC, GDVC
Purchasing method:

Content is intentionally removed for demo purpose
64
2. Industry overview
2.2 Local market – 2.2.1. Beer
10 Vietnam’s biggest beer exporters 2018 10 Vietnam’s biggest beer importers 2018
Source: VIRAC, GDVC
Main Vietnam beer import partners, 2018 Main beer export partners to Vietnam, 2018
Source: VIRAC, GDVCSource: VIRAC, GDVC
Source: VIRAC, GDVC

Content is intentionally removed for demo purpose
65
2. Industry overview
2.2 Local market – 2.2.1. Beer
Distribution system
Beer consumption by distribution channels, 2011-2017
Source: VIRAC, Euromonitor
End-user beer price structure
Source: VIRAC, Euromonitor

Content is intentionally removed for demo purpose
Agriculture Vine
FermentationPressing, filtering
and smoothingPackagingWine brewing
Squeezed grape
juiceMixing
Consumer
Agency
Source: Synthesized by VIRAC
66
The wine value chain
Regarding wine
2. Industry overview
2.2 Local market – 2.2.2. Wine
Content is intentionally removed for demo purpose

Content is intentionally removed for demo purpose
Source: Synthesized by VIRAC
Regarding malt wine
AgricultureGrapes, cereals,
sugar cane
Fermentation Distillation PackagingWine brewing Mixing
Consumer
Agency
67
2. Industry overview
2.2 Local market – 2.2.2. Wine
Content is intentionally removed for demo purpose
Content is intentionally removed for demo purpose
Input material
68
2. Industry overview
2.2 Local market – 2.2.2. Wine
Rice and other cereals
Vine

Content is intentionally removed for demo purpose
69
2. Industry overview
2.2 Local market – 2.2.2. Wine

Content is intentionally removed for demo purpose
Production-consumption
The wine market is on a small scale with falling consumption.
70
2. Industry overview
2.2 Local market – 2.2.2. Wine
Million
litres
Domestic liquor production and consumption 2010-2018
Source: VIRAC, GDVC

Content is intentionally removed for demo purpose
Consumer trends shifted from ordinary wines to vine and high-end ones. The local vine market has a great potential for growth while the malt wine
segment is gloomy, with a shortage of high-quality products.
71
2. Industry overview
2.2 Local market – 2.2.2. Wine
Billion
VND
Million
litres
Wine inventories, 2010-2018
Source: VIRAC, GSO
Sales of vine and malt wines 2010 - 2018
Source: VIRAC, GSO

Content is intentionally removed for demo purpose
72
2. Industry overview
2.2 Local market – 2.2.2. Wine
Internal competition
As of the malt wine segment, Halico occupies the largest consumption share with 2 prevalent brands, including Hanoi Vodka and Hanoi New Rice.
Malt wine consumption of production enterprises, 2017
Source: VIRAC
Malt wine consumption market share, 2017
Source: VIRAC
Avinaa

Content is intentionally removed for demo purpose
73
2. Industry overview
2.2 Local market – 2.2.2. Wine
The local vine wine market is distinctly and Thang Long wine contributes a large share to the market. In addition, local enterprises produce only low-
cost wine lines.
Source: VIRAC
Vine wine consumption of production enterprises, 2017 Vine wine consumption market share by output, 2017
Source: VIRAC

Content is intentionally removed for demo purpose
Import – export
Domestic wine is exported in small and low-value quantities, while high-end
imports are worth 30 times higher.
74
2. Industry overview
2.2 Local market – 2.2.2. Wine
Million
USD
Thousand
tons
Source: VIRAC, United Nations Trade Statistics, GDVC
Thousand
tons
Million
USD
Source: VIRAC, United Nations Trade Statistics, GDVC
Vine wine import and export 2010-2018
Alcohol import and export 2010-2018

Content is intentionally removed for demo purpose
75
2. Industry overview
2.2 Local market – 2.2.2. Wine
Million
USD
Thousand
tons
Source: VIRAC, United Nations Trade Statistics, GDVC
Major wine suppliers to Vietnam, 2018
Source: VIRAC, United Nations Trade Statistics, GDVC
Malt wine import and export 2010-2018

Content is intentionally removed for demo purpose
76
2. Industry overview
2.2 Local market – 2.2.2. Wine
In 2018, wine imports from Laos also rose sharply to due the fact that
glutinous rice wine and white wine with an alcoholic concentration of
under 39% are much favored.
Vietnam’s major wine exports 2018
Source: VIRAC, United Nations Trade Statistics, GDVC

Content is intentionally removed for demo purpose
77
2. Industry overview
2.2 Local market – 2.2.2. Wine
Asia has maintained a key malt wine supplier and consumer of Vietnam
Vietnam’s larges malt wine suppliers 2018
Source: VIRAC, GDVC
Vietnam’s larges malt wine consumers 2018
Source: VIRAC, GDVC
Content is intentionally removed for demo purpose

Content is intentionally removed for demo purpose
78
2. Industry overview
2.2 Local market – 2.2.2. Wine
Source: VIRAC, GDVC
10 Vietnam’s biggest malt wine importers 20107e 10 Vietnam’s biggest malt wine exporters 20107e
Top 10 Vietnam’s malt wine importers 2018Top 10 malt wine exporters to Vietnam 2018
Source: VIRAC, GDVC
Source: VIRAC, GDVCSource: VIRAC, GDVC

Content is intentionally removed for demo purpose
79
2. Industry overview
2.2 Local market – 2.2.2. Wine
Source: VIRAC, GDVC
Top 10 Vietnam’s largest malt wine exporting enterprises 2018 Top 10 Vietnam’s largest malt wine importing enterprises 2018
Top 10 largest malt wine exporters to Vietnam 2018 Top 10 Vietnam’s largest malt wine importers 2018
Source: VIRAC, GDVC
Source: VIRAC, GDVCSource: VIRAC, GDVC

Content is intentionally removed for demo purpose
The soft drink industry
Source: Synthesized by VIRAC
Pure water/mineral water
Mineral water
sourcesFiltration Cooling Bacterial filtration Bottling
AgencyConsumer
Synthesized
by VIRAC
Industrial
water
Soft
drink
LiddingHeat
treatmentBottling Agency
Consume
r
Cooling
CO2
loading
Fizzy soft drink
Source: Synthesized by VIRAC
80
2. Industry overview
2.2 Local market – 2.2.3. Soft Drink

Content is intentionally removed for demo purpose
Fruit juice
Source: Synthesized by VIRAC
Agriculture Fruit
PressingManual
filtrationFruit gel Purifying
Crystal
filtrationProcessing
Agency
Filling
Consumer
.
81
2. Industry overview
2.2 Local market – 2.2.3. Soft Drink

Content is intentionally removed for demo purpose
Input material
Sugar
Mineral water
Green tea leaves
82
2. Industry overview
2.2 Local market – 2.2.3. Soft Drink

Content is intentionally removed for demo purpose
Fruit
Flavorings
83
2. Industry overview
2.2 Local market – 2.2.3. Soft Drink

Content is intentionally removed for demo purpose
84
2. Industry overview
2.2 Local market – 2.2.3. Soft Drink

Content is intentionally removed for demo purpose
Production - consumption
The soft drink market runs on a large scale and high growth rate that gradually
meets the local consumption.
85
2. Industry overview
2.2 Local market – 2.2.3. Soft Drink
Domestic soft drink production and consumption
2010-2018
Billion
liter
Thousand billion
VND
Source: VIRAC, GSO
Soft drink consumption structure (by volume) 2018
Source: VIRAC, GSO

Content is intentionally removed for demo purpose
The soft drink market has a high level of inventories compared to beer and wine, increasing sharply in the period of 2015-2018
86
2. Industry overview
2.2 Local market – 2.2.3. Soft Drink
Inventories
Unit: million liters
2010 2018
Source: VIRAC, GSO
Inventory structure by product lines 2010-2018
Soft drink inventories 2010 – 2018
Source: VIRAC, GSO

Content is intentionally removed for demo purpose
The soft drink market has a high concentration level and great growth potentials which are very much attractive to investors. The domestic enterprises
remain weak with inadequate production capacity compared to foreign businesses.
Total soft drink enterprises 2010-2018
Source: VIRAC, TCKT
87
2. Industry overview
2.2 Local market – 2.2.3. Soft Drink
Internal competition

Content is intentionally removed for demo purposeContent is intentionally removed for demo purpose
88
2. Industry overview
2.2 Local market – 2.2.3. Soft Drink
Vietnam’s soft drink market shares, 2018
Source: VIRAC
Soft drink line market shares, 2018
Source: VIRAC

Content is intentionally removed for demo purpose
89
2. Industry overview
2.2 Local market – 2.2.3. Soft Drink
Exports have exceeded imports but with lower values.
Import – export
Source: VIRAC, United Nations Trade Statistics, GDVC
Thousand tons Thousand kg
Soft drink export and import, 2010-2018
Content is intentionally removed for demo purpose
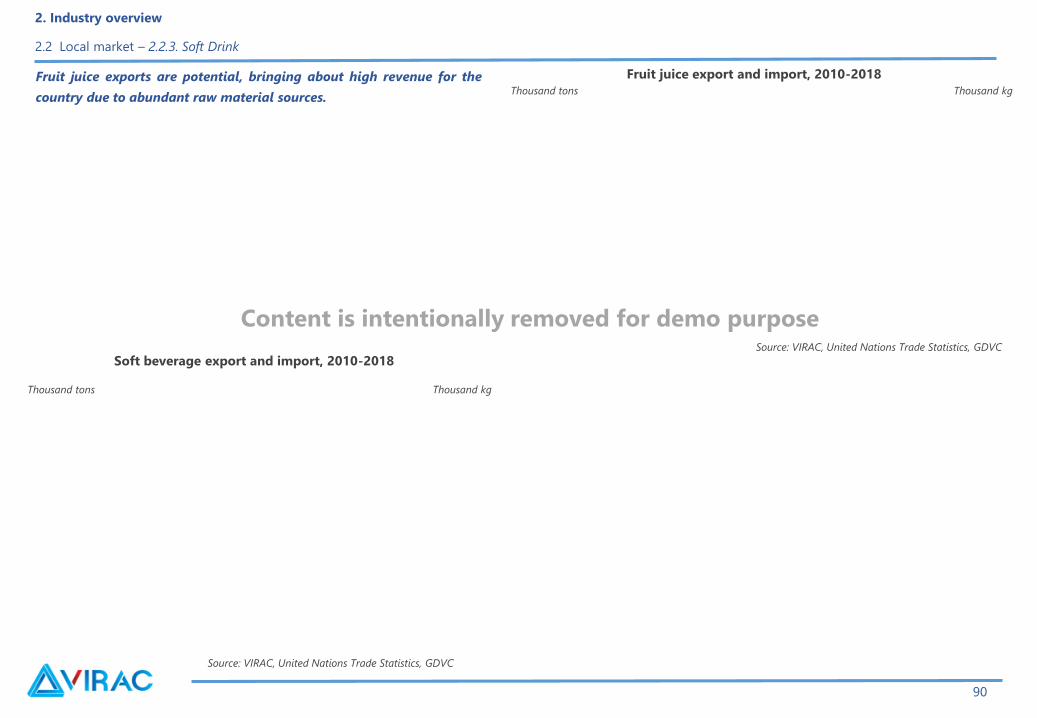
Fruit juice exports are potential, bringing about high revenue for the
country due to abundant raw material sources.
Source: VIRAC, United Nations Trade Statistics, GDVC
Thousand tons Thousand kg
90
2. Industry overview
2.2 Local market – 2.2.3. Soft Drink
Source: VIRAC, United Nations Trade Statistics, GDVC
Thousand tons Thousand kg
Fruit juice export and import, 2010-2018
Soft beverage export and import, 2010-2018
Content is intentionally removed for demo purpose
Source: VIRAC, United Nations Trade Statistics, GDVC
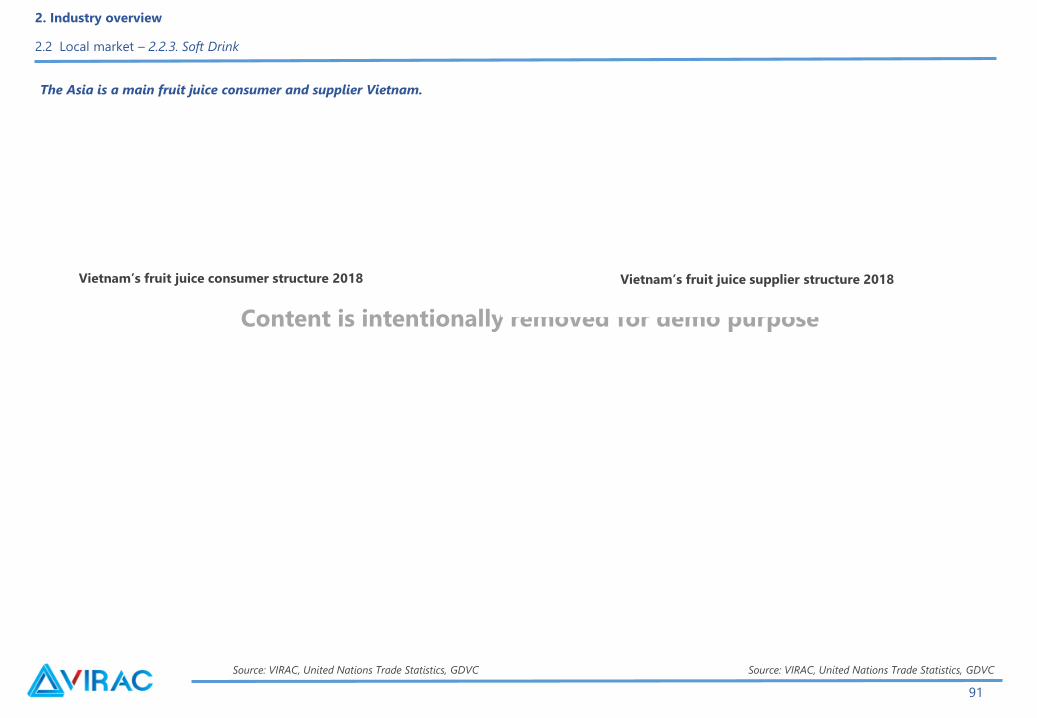
The Asia is a main fruit juice consumer and supplier Vietnam.
Vietnam’s fruit juice consumer structure 2018 Vietnam’s fruit juice supplier structure 2018
Source: VIRAC, United Nations Trade Statistics, GDVC
91
2. Industry overview
2.2 Local market – 2.2.3. Soft Drink

Content is intentionally removed for demo purpose
Similar to the fruit juice segment, Vietnam’s soft drink also deals with the Asia as a major im-exporter.
Vietnam’s soft drink consumer structure 2018 Vietnam’s soft drink supplier structure 2018
Source: VIRAC, Euromalt, United Nations Trade Statistics
92
2. Industry overview
2.2 Local market – 2.2.3. Soft Drink
Source: VIRAC, United Nations Trade Statistics

Content is intentionally removed for demo purpose
93
2. Industry overview
2.2 Local market – 2.2.3. Soft Drink
Source: VIRAC, GDVC
10 Vietnam’s biggest soft drink importing enterprises 2018 10 Vietnam’s biggest soft drink exporting enterprises 2018
Top largest fresh drink exporters Vietnam 2018 Top Vietnam’s largest fresh drink importers 2018
Source: VIRAC, GDVC
Source: VIRAC, GDVCSource: VIRAC, GDVC

Content is intentionally removed for demo purpose
94
2. Industry overview
2.2 Local market – 2.2.3. Soft Drink
Source: VIRAC, GDVC
10 Vietnam’s biggest fruit juice exporting enterprises 2018
Top 10 fruit juice exporters to Vietnam 2018
10 Vietnam’s biggest fruit juice importing enterprises 2018
Source: VIRAC, GDVC
Source: VIRAC, GDVC
Source: VIRAC, GDVC
Top 10 fruit juice importers to Vietnam 2018

Content is intentionally removed for demo purpose
Content
2. Industry overview
2.1 Global market
2.2 Local market
2.3 Risk
2.4 Planning and development
2.5 Prospect and prediction
95

Content is intentionally removed for demo purpose
2. Industry overview
2.3 Risks - 2.3.1 SWOT analysis
Strength: Weakness:
Opportunities: Challenges:
96
Content is intentionally removed for demo purpose

Content is intentionally removed for demo purpose
0
1
2
3
4
5
Source: Synthesized by
VIRAC
-1
1
3
5 Customer power
Source: Synthesized by
VIRAC
97
2. Industry overview
2.3 Risks -2.3.2 Competitiveness analysis (5-forces)
Content is intentionally removed for demo purpose

Content is intentionally removed for demo purpose
Supplier power
0
1
2
3
4
5
Source: Synthesized by
VIRAC
0
1
2
3
4
5
Nguồn: VIRAC tổng hợp
Potential competitors
98
2. Industry overview
2.3 Risks -2.3.2 Competitiveness analysis (5-forces)
Content is intentionally removed for demo purpose

Content is intentionally removed for demo purpose
Subsitute product risks
0
1
2
3
4
5
Source: Synthesized by
VIRAC
012345
Internal competition
Source: Synthesized by
VIRAC
99
2. Industry overview
2.3 Risks -2.3.2 Competitiveness analysis (5-forces)
Content is intentionally removed for demo purpose

Content is intentionally removed for demo purpose
3.1 Production risks
• Input material risks:
• Food safety risks:
100
2. Industry overview
2.3 Risks - 2.3.3 Operating risks

Content is intentionally removed for demo purpose
• Production policy risks:
• Supply chain risks:
• Consumption policy risks:
101
2. Industry overview
2.3 Risks - 2.3.3 Operating risks

Content is intentionally removed for demo purpose
• Competitiveness risks:
• Consumer taste risks:
102
2. Industry overview
2.3 Risks - 2.3.3 Operating risks
Content is intentionally removed for demo purpose
• Media communication risks:
• M&A risks:
103
2. Industry overview
2.3 Risks - 2.3.3 Operating risks

Content is intentionally removed for demo purpose
Content
2. Industry overview
2.1 Global market
2.2 Local market
2.3 Risk
2.4 Planning and development
2.5 Prospect and prediction
104

Content is intentionally removed for demo purpose
Target Beer Wine Soft Drink
Product planning:
Region
Production capacity by
region (million litres)
Capital
investment
2011-2015
(billion VND)2015 2025
Production area planning and
capital investment
Source: VIRAC
Source: VIRAC
105
2. Industry overview
2.4 Planning and development

Content is intentionally removed for demo purpose
Content
2. Industry overview
2.1 Global market
2.2 Local market
2.3 Risk
2.4 Planning and development
2.5 Prospect and prediction
106

Content is intentionally removed for demo purpose
Population:
Income:
Lifestyle and consumer habits:
107
2. Industry overview
2.5 Prospect and prediction -2.5.1 Motivations

Content is intentionally removed for demo purpose
FTAs’ positive impacts
Other factors
108
2. Industry overview
2.5 Prospect and prediction -2.5.1 Motivations

Content is intentionally removed for demo purpose
Source: VIRAC, VBA
109
2. Industry overview
2.5 Prospect and prediction - 2.5.2 Prediction
Sub-sector
Annual forecast (billion VND)Average growth rate (%)
2018f 2019f 2020f
Sub-sectoral consumption price forecast (including both domestic and imported products), 2018-2020
Content is intentionally removed for demo purpose

Content is intentionally removed for demo purpose
Product development trend
Beer:
No. Entity Project
Total
invest
ment
Impleme
ntation
span
Capacity (
million
tons/year)
Phas
e I
Phase
II
1
2
3
4
5
6
7
Built and inaugurated beer factories, 2015-2019
Source: Synthesized by VIRAC
110
2. Industry overview
2.5 Prospect and prediction - 2.5.2 Prediction
Content is intentionally removed for demo purpose

Content is intentionally removed for demo purpose
Liquor:
Soft Drink:
111
2. Industry overview
2.5 Prospect and prediction - 2.5.2 Prediction

Content is intentionally removed for demo purposeNo. Entity Project
Total
investmentImplementation span
Capacity ( million
tons/year)
Phase IPhase
II
Built and inaugurated soft drink plants, 2015-2018
Source: Synthesized by VIRAC
112
2. Industry overview
2.5 Prospect and prediction - 2.5.2 Prediction
Content is intentionally removed for demo purpose

Content is intentionally removed for demo purpose
Relevant sector development trends
Tourism:
113
2. Industry overview
2.5 Prospect and prediction - 2.5.2 Prediction

Content is intentionally removed for demo purpose
114
2. Industry overview
2.5 Prospect and prediction - 2.5.2 Prediction
• Đối tượng sử dụng dịch vụ du lịch sẽ ngày càng đa dạng.
Về khả năng chi tiêu: du lịch đang ngày càng phổ biến, không chỉ những người giàu có từ các nước phát triển mới đi du lịch mà tất cả các tầng lớp khác, từ nhiều
quốc gia khác nhau cũng tham gia ngày càng đông đảo;
Về độ tuổi: người già, người mới nghỉ hưu đi du lịch ngày càng nhiều nên cần có những chương trình đặc biệt phục vụ nhu cầu về nghỉ dưỡng cho đối tượng khách
này;
Về nhân thân: số người độc thân đi du lịch ngày càng tăng;
Về giới tính: Những thay đổi về vai trò và trách nhiệm trong gia đình khiến khách là phụ nữ ngày càng tăng, yêu cầu các cơ sở có những cải tiến, bổ sung các trang
thiết bị, vật dụng và các dịch vụ, lịch trình phù hợp với nhu cầu của nữ thương nhân.
Về loại hình: ngày càng nhiều những nhóm gia đình đăng ký đi du lịch với sự tham gia của đầy đủ các thành viên của cả ba thế hệ trong gia đình, đặc biệt các dịp lễ,
cuối tuần và kỳ nghỉ hè của trẻ em.
• Xu hướng ngày càng tăng nhu cầu cho khách lựa chọn chương trình du lịch có sự kết hợp giữa các loại hình du lịch.
Sự kết hợp hình thức du lịch có thể bao gồm nghỉ biển kết hợp với hội nghị, du lịch khen thưởng kết hợp thăm dò thị trường, du lịch nghỉ dưỡng ngắn ngày kết hợp
với casino,...đòi hỏi các cơ sở đa dạng hoá các sản phẩm như tạo chương trình nghỉ ngơi tham quan di tích lịch sử kết hợp thăm trang trại trồng rau, chè và cây ăn
quả, tổ chức các hoạt động giải trí trên biển.
• Khách hàng có xu hướng muốn chọn tour du lịch tự thiết kế, đặt chỗ qua mạng; tự lựa chọn dịch vụ, không đi theo hình thức trọn gói.
Du lịch mang tính cá nhân nhiều nhất là dịch vụ ăn uống. Vì vậy các doanh nghiệp lữ hành, vận chuyển, khách sạn thường kết hợp tổ chức các chương trình chỉ
cung ứng một phần dịch vụ du lịch như hãng Hàng không quốc gia Việt Nam (Vietnam Airlines) đã tổ chức khá thành công gói sản phẩm Free and Easy chỉ gồm vé
máy bay, dịch vụ đón tiễn sân bay và 3 đêm khách sạn. Nếu có nhu cầu, khách có thể tiếp tục mua tour lẻ và các dịch vụ khác tại điểm đến. Như vậy, để hỗ trợ thúc
đẩy xu hướng này, cần hỗ trợ nâng cao năng lực tiếp cận thị trường của các doanh nghiệp, cơ quan xúc tiến du lịch bằng các công cụ cập nhật theo đời sống hiện
đại như các mạng di động, mạng xã hội như Facebook, Twitter…

Content is intentionally removed for demo purpose
Retailing sector:
11/1/2011 11/1/2012. 11/1/2014 11/1/2015
100%-FDI enterprises’ market penetration roadmap
Source: Synthesized by VIRAC
115
2. Industry overview
2.5 Prospect and prediction - 2.5.2 Prediction

Content is intentionally removed for demo purpose
No. FDI enterprise Total investment Plan/activitty
1
2
3
4
Source: Synthesized by VIRAC
FDI enterprises’ retailing projects and plans have been launched in Vietnam
116
2. Industry overview
2.5 Prospect and prediction - 2.5.2 Prediction
Content is intentionally removed for demo purpose

Content is intentionally removed for demo purpose
Content
117
3 Enterprise analysis
3.1 Profitability
3.2 Operating capability
3.3 Financial strength
3.4 Return on investment
Content is intentionally removed for demo purpose
3. Enterprise analysis
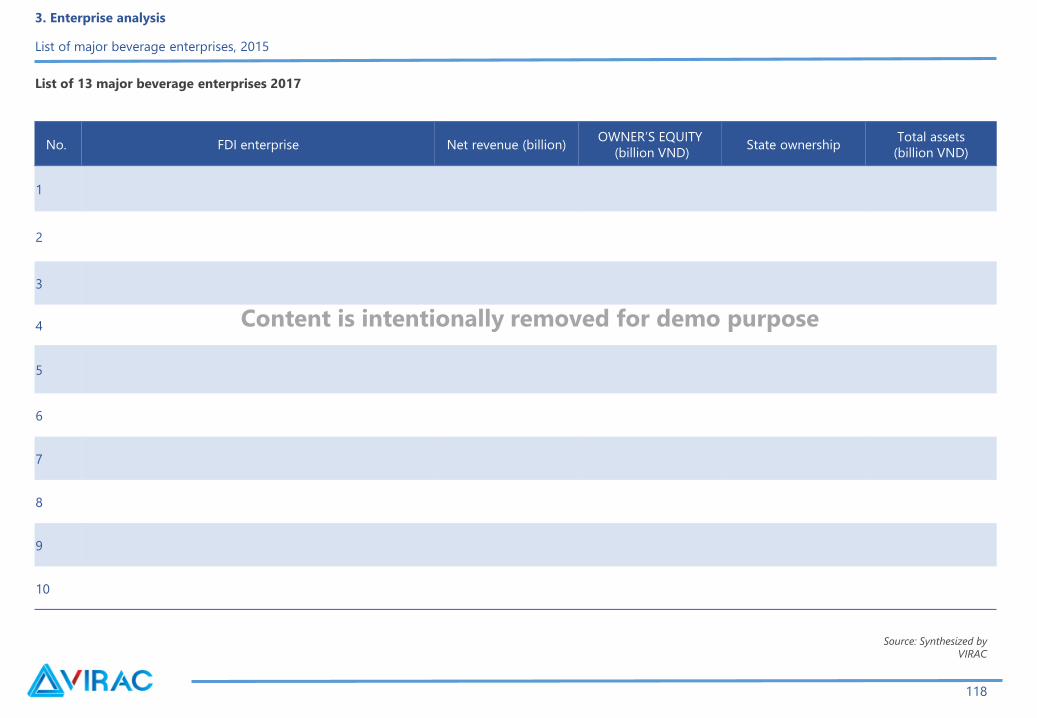
List of major beverage enterprises, 2015
No. FDI enterprise Net revenue (billion)OWNER’S EQUITY
(billion VND)State ownership
Total assets
(billion VND)
1
2
3
4
5
6
7
8
9
10
List of 13 major beverage enterprises 2017
Source: Synthesized by
VIRAC
118

Content is intentionally removed for demo purpose
Content
119
3 Enterprise analysis
3.1 Profitability
3.2 Operating capability
3.3 Financial strength
3.4 Return on investment

Content is intentionally removed for demo purpose
120
3. Enterprise analysis
3.1 Profitability
Billion
VND
Source: Synthesized by
VIRAC
Rate of turnover, 2015-2016

Content is intentionally removed for demo purpose
121
3. Enterprise analysis
3.1 Profitability

Content is intentionally removed for demo purpose
122
3. Enterprise analysis
3.1 Profitability
Billion
VND
Gross profit and gross profit margin, 2016
Source: Synthesized by
VIRAC

Content is intentionally removed for demo purpose
Content
123
3 Enterprise analysis
3.1 Profitability
3.2 Operating capability
3.3 Financial strength
3.4 Return on investment

Content is intentionally removed for demo purpose
124
3. Enterprise analysis
3.2 Operating capability
Turnover of receivables 2016
Unit: times
Source: Synthesized by VIRAC
Source: Synthesized by VIRAC
Corporate inventory turnover 2016

Content is intentionally removed for demo purpose
125
3. Enterprise analysis
3.2 Operating capability
Asset performance, 2016
Unit: times
Source: Synthesized by VIRAC

Content is intentionally removed for demo purpose
Content
126
3 Enterprise analysis
3.1 Profitability
3.2 Operating capability
3.3 Financial strength
3.4 Return on investment

Content is intentionally removed for demo purpose
127
3. Enterprise analysis
3.3 Financial strength
Tan Hiep Phat and Vang Thang Long have debt/equity as well as debt/total assets many times higher than the industry average.
Solvency capacity, 2016
Source: Synthesized by
VIRAC

Content is intentionally removed for demo purpose
128
3. Enterprise analysis
3.3 Financial strength
Payment capacity, 2016
Source: Synthesized by VIRAC

Content is intentionally removed for demo purpose
Content
129
3 Enterprise analysis
3.1 Profitability
3.2 Operating capability
3.3 Financial strength
3.4 Gross profit margin 2015

Content is intentionally removed for demo purpose
130
3. Enterprise analysis
3.4 Gross profit margin
Source: Synthesized by VIRAC
ROA and ROE 2015-2016
Content is intentionally removed for demo purpose
Content
131
4 Appendix
Financial Statements

Content is intentionally removed for demo purpose
BALANCE SHEET
Unit: billion 2016 2015
A. SHORT-TERM ASSETS
I. Cash and cash equivalents
II. Short-term financial investments
III. Short-term receivables
1. Short-term receivables from customers
IV. Inventories
B. LONG-TERM ASSETS
I. Long-term receivables
II. Fixed assets
1. Tangible fixed assets
2. Intangible fixed assets
TOTAL ASSETS
A. LIABILITIES
I. Short-term liabilities
1. Short-term liabilities and loans
2. Taxes and amounts payable to the state
II. Long-term liabilities
1. Long-term liabilities and loans
2. Long-term provisions
B. OWNER’S EQUITY
TOTAL LIABILITIES AND OWNER’S EQUITY
REPORT ON BUSINESS RESULTS
Unit: billion 2016 2015
Net revenue from sales and services
Costs of goods sold
Gross revenues from sales and services
Financial income
Financial cost
Interest expenses
Cost of sales
Enterprise administration expenses
Net profits from operating activities
Total net profit before tax
Current corporate income tax expense
Deferred corporate income tax expense
Profit after tax
CASH FLOW STATEMENT
Unit: billion 2016 2015
I. Cash flows from operating activities
Fixed assets
Unrealized foreign exchange gain/loss
Net cash flows from operating activities
II. Cash flows from investing activities
Other long-term assets
Net cash flows from investing activities
III. Cash flows from financial activities
Net cash flows from financial activities
Effect of exchange rate fluctuations
Net cash flows during the fiscal year
4. Appendix
Financial statements- Saigon Beer-Alcohol-Beverage Joint Stock Corporation (Sabeco)
Content is intentionally removed for demo purpose
132
Content is intentionally removed for demo purpose
CASH FLOW STATEMENT
Unit: billion 2016 2015
I. Cash flows from operating activities
Fixed assets
Unrealized foreign exchange gain/loss
Net cash flows from operating activities
II. Cash flows from investing activities
Other long-term assets
Net cash flows from investing activities
III. Cash flows from financial activities
Net cash flows from financial activities
Effect of exchange rate fluctuations
Net cash flows during the fiscal year
BALANCE SHEET
Unit: billion 2016 2015
A. SHORT-TERM ASSETS
I. Cash and cash equivalents
II. Short-term financial investments
III. Short-term receivables
1. Short-term receivables from customers
IV. Inventories
B. LONG-TERM ASSETS
I. Long-term receivables
II. Fixed assets
1. Tangible fixed assets
2. Intangible fixed assets
TOTAL ASSETS
A. LIABILITIES
I. Short-term liabilities
1. Short-term liabilities and loans
2. Taxes and amounts payable to the state
II. Long-term liabilities
1. Long-term liabilities and loans
2. Long-term provisions
B. OWNER’S EQUITY
TOTAL LIABILITIES AND OWNER’S EQUITY
REPORT ON BUSINESS RESULTS
Unit: billion 2016 2015
Net revenue from sales and services
Costs of goods sold
Gross revenues from sales and services
Financial income
Financial cost
Interest expenses
Cost of sales
Enterprise administration expenses
Net profits from operating activities
Total net profit before tax
Current corporate income tax expense
Deferred corporate income tax expense
Profit after tax
4. Appendix
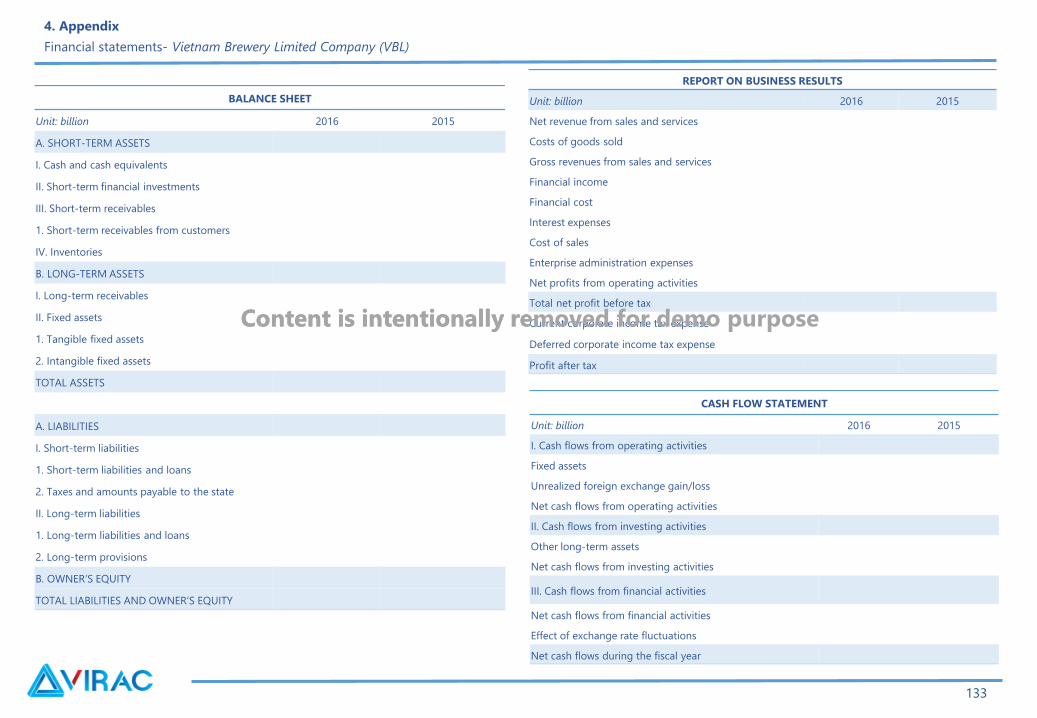
Financial statements- Vietnam Brewery Limited Company (VBL)
Content is intentionally removed for demo purpose
133
Content is intentionally removed for demo purpose
BALANCE SHEET
Unit: billion 2016 2015
A. SHORT-TERM ASSETS
I. Cash and cash equivalents
II. Short-term financial investments
III. Short-term receivables
1. Short-term receivables from customers
IV. Inventories
B. LONG-TERM ASSETS
I. Long-term receivables
II. Fixed assets
1. Tangible fixed assets
2. Intangible fixed assets
TOTAL ASSETS
A. LIABILITIES
I. Short-term liabilities
1. Short-term liabilities and loans
2. Taxes and amounts payable to the state
II. Long-term liabilities
1. Long-term liabilities and loans
2. Long-term provisions
B. OWNER’S EQUITY
TOTAL LIABILITIES AND OWNER’S EQUITY
REPORT ON BUSINESS RESULTS
Unit: billion 2016 2015
Net revenue from sales and services
Costs of goods sold
Gross revenues from sales and services
Financial income
Financial cost
Interest expenses
Cost of sales
Enterprise administration expenses
Net profits from operating activities
Total net profit before tax
Current corporate income tax expense
Deferred corporate income tax expense
Profit after tax
CASH FLOW STATEMENT
Unit: billion 2016 2015
I. Cash flows from operating activities
Fixed assets
Unrealized foreign exchange gain/loss
Net cash flows from operating activities
II. Cash flows from investing activities
Other long-term assets
Net cash flows from investing activities
III. Cash flows from financial activities
Net cash flows from financial activities
Effect of exchange rate fluctuations
Net cash flows during the fiscal year
4. Appendix
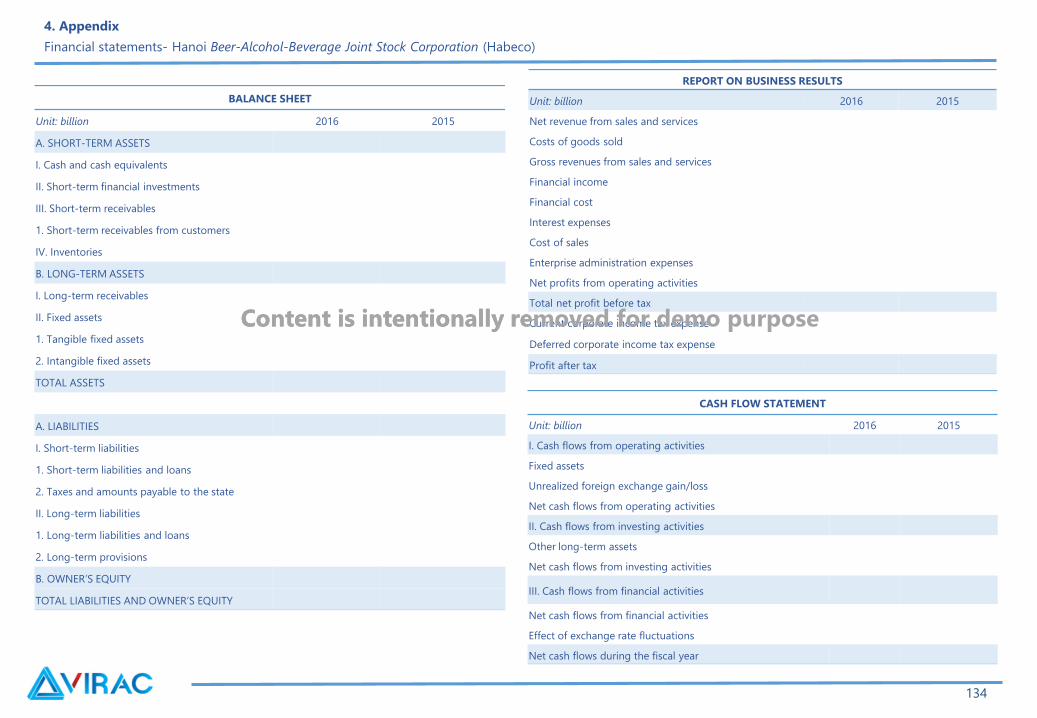
Financial statements- Hanoi Beer-Alcohol-Beverage Joint Stock Corporation (Habeco)
Content is intentionally removed for demo purpose
134
Content is intentionally removed for demo purpose
BALANCE SHEET
Unit: billion 2016 2015
A. SHORT-TERM ASSETS
I. Cash and cash equivalents
II. Short-term financial investments
III. Short-term receivables
1. Short-term receivables from customers
IV. Inventories
B. LONG-TERM ASSETS
I. Long-term receivables
II. Fixed assets
1. Tangible fixed assets
2. Intangible fixed assets
TOTAL ASSETS
A. LIABILITIES
I. Short-term liabilities
1. Short-term liabilities and loans
2. Taxes and amounts payable to the state
II. Long-term liabilities
1. Long-term liabilities and loans
2. Long-term provisions
B. OWNER’S EQUITY
TOTAL LIABILITIES AND OWNER’S EQUITY
REPORT ON BUSINESS RESULTS
Unit: million 2016 2015
Net revenue from sales and services
Costs of goods sold
Gross revenues from sales and services
Financial income
Financial cost
Interest expenses
Cost of sales
Enterprise administration expenses
Net profits from operating activities
Total net profit before tax
Current corporate income tax expense
Deferred corporate income tax expense
Profit after tax
CASH FLOW STATEMENT
Unit: billion 2016 2015
I. Cash flows from operating activities
Fixed assets
Unrealized foreign exchange gain/loss
Net cash flows from operating activities
II. Cash flows from investing activities
Other long-term assets
Net cash flows from investing activities
III. Cash flows from financial activities
Net cash flows from financial activities
Effect of exchange rate fluctuations
Net cash flows during the fiscal year
4. Appendix
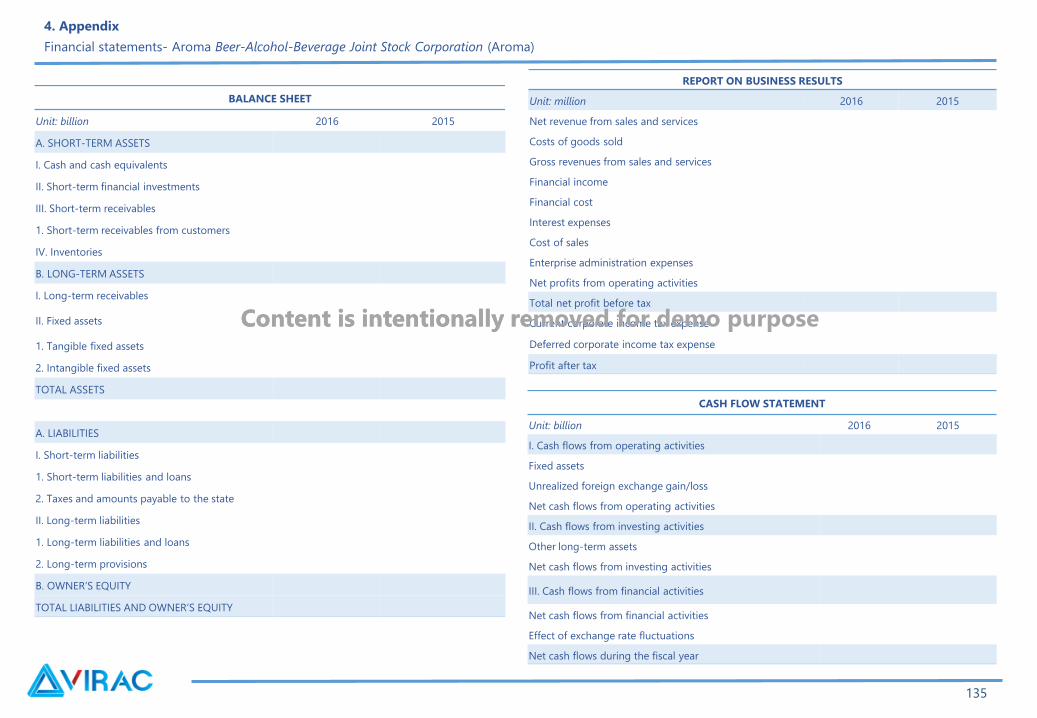
Financial statements- Aroma Beer-Alcohol-Beverage Joint Stock Corporation (Aroma)
Content is intentionally removed for demo purpose
135

Content is intentionally removed for demo purpose
BALANCE SHEET
Unit: billion 2016 2015
A. SHORT-TERM ASSETS
I. Cash and cash equivalents
II. Short-term financial investments
III. Short-term receivables
1. Short-term receivables from customers
IV. Inventories
B. LONG-TERM ASSETS
I. Long-term receivables
II. Fixed assets
1. Tangible fixed assets
2. Intangible fixed assets
TOTAL ASSETS
A. LIABILITIES
I. Short-term liabilities
1. Short-term liabilities and loans
2. Taxes and amounts payable to the state
II. Long-term liabilities
1. Long-term liabilities and loans
2. Long-term provisions
B. OWNER’S EQUITY
TOTAL LIABILITIES AND OWNER’S EQUITY
REPORT ON BUSINESS RESULTS
Unit: billion 2016 2015
Net revenue from sales and services
Costs of goods sold
Gross revenues from sales and services
Financial income
Financial cost
Interest expenses
Cost of sales
Enterprise administration expenses
Net profits from operating activities
Total net profit before tax
Current corporate income tax expense
Deferred corporate income tax expense
Profit after tax
CASH FLOW STATEMENT
Unit: billion 2016 2015
I. Cash flows from operating activities
Fixed assets
Unrealized foreign exchange gain/loss
Net cash flows from operating activities
II. Cash flows from investing activities
Other long-term assets
Net cash flows from investing activities
III. Cash flows from financial activities
Net cash flows from financial activities
Effect of exchange rate fluctuations
Net cash flows during the fiscal year
4. Appendix
Financial statements- Thang Long Wine Joint Stock Company
Content is intentionally removed for demo purpose
136

Content is intentionally removed for demo purpose
BALANCE SHEET
Unit: billion 2016 2015
A. SHORT-TERM ASSETS
I. Cash and cash equivalents
II. Short-term financial investments
III. Short-term receivables
1. Short-term receivables from customers
IV. Inventories
B. LONG-TERM ASSETS
I. Long-term receivables
II. Fixed assets
1. Tangible fixed assets
2. Intangible fixed assets
TOTAL ASSETS
A. LIABILITIES
I. Short-term liabilities
1. Short-term liabilities and loans
2. Taxes and amounts payable to the state
II. Long-term liabilities
1. Long-term liabilities and loans
2. Long-term provisions
B. OWNER’S EQUITY
TOTAL LIABILITIES AND OWNER’S EQUITY
REPORT ON BUSINESS RESULTS
Unit: billion 2016 2015
Net revenue from sales and services
Costs of goods sold
Gross revenues from sales and services
Financial income
Financial cost
Interest expenses
Cost of sales
Enterprise administration expenses
Net profits from operating activities
Total net profit before tax
Current corporate income tax expense
Deferred corporate income tax expense
Profit after tax
CASH FLOW STATEMENT
Unit: billion 2016 2015
I. Cash flows from operating activities
Fixed assets
Unrealized foreign exchange gain/loss
Net cash flows from operating activities
II. Cash flows from investing activities
Other long-term assets
Net cash flows from investing activities
III. Cash flows from financial activities
Net cash flows from financial activities
Effect of exchange rate fluctuations
Net cash flows during the fiscal year
4. Appendix
Financial report- Ladofood Company Ltd.
Content is intentionally removed for demo purpose
137
Content is intentionally removed for demo purpose
BALANCE SHEET
Unit: billion 2016 2015
A. SHORT-TERM ASSETS
I. Cash and cash equivalents
II. Short-term financial investments
III. Short-term receivables
1. Short-term receivables from customers
IV. Inventories
B. LONG-TERM ASSETS
I. Long-term receivables
II. Fixed assets
1. Tangible fixed assets
2. Intangible fixed assets
TOTAL ASSETS
A. LIABILITIES
I. Short-term liabilities
1. Short-term liabilities and loans
2. Taxes and amounts payable to the state
II. Long-term liabilities
1. Long-term liabilities and loans
2. Long-term provisions
B. OWNER’S EQUITY
TOTAL LIABILITIES AND OWNER’S EQUITY
REPORT ON BUSINESS RESULTS
Unit: billion 2016 2015
Net revenue from sales and services
Costs of goods sold
Gross revenues from sales and services
Financial income
Financial cost
Interest expenses
Cost of sales
Enterprise administration expenses
Net profits from operating activities
Total net profit before tax
Current corporate income tax expense
Deferred corporate income tax expense
Profit after tax
CASH FLOW STATEMENT
Unit: billion 2016 2015
I. Cash flows from operating activities
Fixed assets
Unrealized foreign exchange gain/loss
Net cash flows from operating activities
II. Cash flows from investing activities
Other long-term assets
Net cash flows from investing activities
III. Cash flows from financial activities
Net cash flows from financial activities
Effect of exchange rate fluctuations
Net cash flows during the fiscal year
4. Appendix
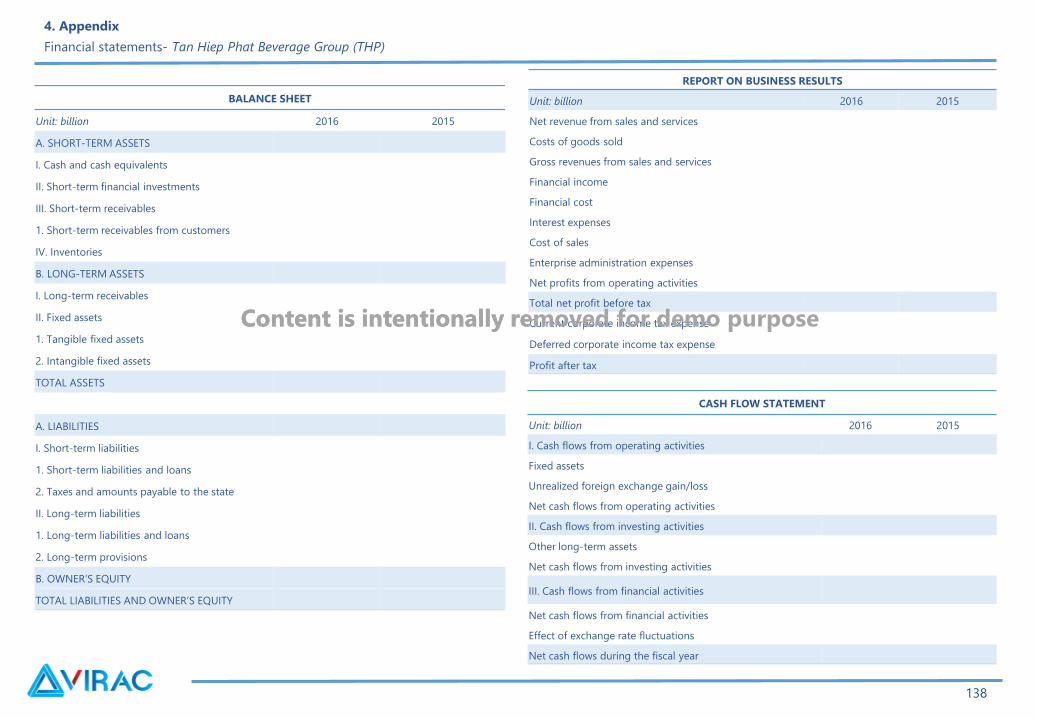
Financial statements- Tan Hiep Phat Beverage Group (THP)
Content is intentionally removed for demo purpose
138

Content is intentionally removed for demo purpose
BALANCE SHEET
Unit: billion 2016 2015
A. SHORT-TERM ASSETS
I. Cash and cash equivalents
II. Short-term financial investments
III. Short-term receivables
1. Short-term receivables from customers
IV. Inventories
B. LONG-TERM ASSETS
I. Long-term receivables
II. Fixed assets
1. Tangible fixed assets
2. Intangible fixed assets
TOTAL ASSETS
A. LIABILITIES
I. Short-term liabilities
1. Short-term liabilities and loans
2. Taxes and amounts payable to the state
II. Long-term liabilities
1. Long-term liabilities and loans
2. Long-term provisions
B. OWNER’S EQUITY
TOTAL LIABILITIES AND OWNER’S EQUITY
REPORT ON BUSINESS RESULTS
Unit: billion 2016 2015
Net revenue from sales and services
Costs of goods sold
Gross revenues from sales and services
Financial income
Financial cost
Interest expenses
Cost of sales
Enterprise administration expenses
Net profits from operating activities
Total net profit before tax
Current corporate income tax expense
Deferred corporate income tax expense
Profit after tax
CASH FLOW STATEMENT
Unit: billion 2016 2015
I. Cash flows from operating activities
Fixed assets
Unrealized foreign exchange gain/loss
Net cash flows from operating activities
II. Cash flows from investing activities
Other long-term assets
Net cash flows from investing activities
III. Cash flows from financial activities
Net cash flows from financial activities
Effect of exchange rate fluctuations
Net cash flows during the fiscal year
4. Appendix
Financial statements- URC Vietnam Co., Ltd
Content is intentionally removed for demo purpose
139

Content is intentionally removed for demo purpose
BALANCE SHEET
Unit: billion 2016 2015
A. SHORT-TERM ASSETS
I. Cash and cash equivalents
II. Short-term financial investments
III. Short-term receivables
1. Short-term receivables from customers
IV. Inventories
B. LONG-TERM ASSETS
I. Long-term receivables
II. Fixed assets
1. Tangible fixed assets
2. Intangible fixed assets
TOTAL ASSETS
A. LIABILITIES
I. Short-term liabilities
1. Short-term liabilities and loans
2. Taxes and amounts payable to the state
II. Long-term liabilities
1. Long-term liabilities and loans
2. Long-term provisions
B. OWNER’S EQUITY
TOTAL LIABILITIES AND OWNER’S EQUITY
REPORT ON BUSINESS RESULTS
Unit: billion 2016 2015
Net revenue from sales and services
Costs of goods sold
Gross revenues from sales and services
Financial income
Financial cost
Interest expenses
Cost of sales
Enterprise administration expenses
Net profits from operating activities
Total net profit before tax
Current corporate income tax expense
Deferred corporate income tax expense
Profit after tax
CASH FLOW STATEMENT
Unit: billion 2016 2015
I. Cash flows from operating activities
Fixed assets
Unrealized foreign exchange gain/loss
Net cash flows from operating activities
II. Cash flows from investing activities
Other long-term assets
Net cash flows from investing activities
III. Cash flows from financial activities
Net cash flows from financial activities
Effect of exchange rate fluctuations
Net cash flows during the fiscal year
4. Appendix
Financial statements- Aroma Beer-Alcohol-Beverage Joint Stock Corporation (Aroma)
Content is intentionally removed for demo purpose
140
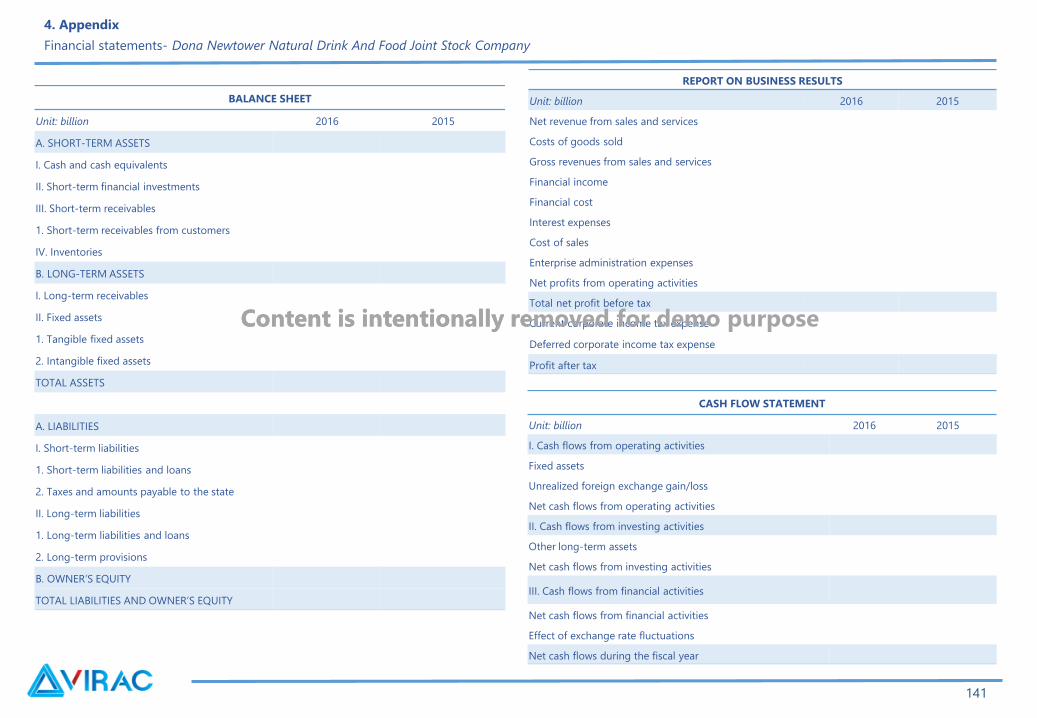
Content is intentionally removed for demo purpose
BALANCE SHEET
Unit: billion 2016 2015
A. SHORT-TERM ASSETS
I. Cash and cash equivalents
II. Short-term financial investments
III. Short-term receivables
1. Short-term receivables from customers
IV. Inventories
B. LONG-TERM ASSETS
I. Long-term receivables
II. Fixed assets
1. Tangible fixed assets
2. Intangible fixed assets
TOTAL ASSETS
A. LIABILITIES
I. Short-term liabilities
1. Short-term liabilities and loans
2. Taxes and amounts payable to the state
II. Long-term liabilities
1. Long-term liabilities and loans
2. Long-term provisions
B. OWNER’S EQUITY
TOTAL LIABILITIES AND OWNER’S EQUITY
REPORT ON BUSINESS RESULTS
Unit: billion 2016 2015
Net revenue from sales and services
Costs of goods sold
Gross revenues from sales and services
Financial income
Financial cost
Interest expenses
Cost of sales
Enterprise administration expenses
Net profits from operating activities
Total net profit before tax
Current corporate income tax expense
Deferred corporate income tax expense
Profit after tax
CASH FLOW STATEMENT
Unit: billion 2016 2015
I. Cash flows from operating activities
Fixed assets
Unrealized foreign exchange gain/loss
Net cash flows from operating activities
II. Cash flows from investing activities
Other long-term assets
Net cash flows from investing activities
III. Cash flows from financial activities
Net cash flows from financial activities
Effect of exchange rate fluctuations
Net cash flows during the fiscal year
4. Appendix
Financial statements- Dona Newtower Natural Drink And Food Joint Stock Company
Content is intentionally removed for demo purpose
141

Content is intentionally removed for demo purpose
Recommendation
Recommended use
This report is made Vietnam Industry Research and Consultancy (VIRAC), providing only the industry overview and business analysis. All information, statements
and projections are based on reliable sources with ultimate prudence as of the time of writing. However, due to subjective and objective reasons in terms of
published formation sources, VIRAC does not guarantee or bear any responsibility for information accuracy and no liability for damages on using this report
partly or wholly. All viewpoints and statements in this report are subjected to changes without notice. This publication is protected by copyright owned by
Vietnam Industry Research and Consultancy (VIRAC). Copying, modifying and printing without permission are strictly prohibited.
Please contact us for more details:
VIETNAM INDUSTRY RESEARCH AND CONSULTANCY
Floor 6, Anh Minh Building, 36 Hoang Cau Street, O Cho Dua Ward, Dong Da District, Hanoi
Email: [email protected] | Phone: +84 463289520
142

Content is intentionally removed for demo purpose
Thank you !