victorian railwaysvictorianrailways.net/vr history/annual_reports/vrar1973.pdf · a modern and...
TRANSCRIPT

1973
VICTORIA
VICTORIAN RAILWAYS
REPORT
OF THE
VICTORIAN RAILWAYS BOARD
FOR THE
YEAR ENDED JUNE 30, 1973
PRESENTED TO 80TH HOUSES OF PARLIAMENT PURSUANT TO ACT 7 ELIZABETH 11. No. 6355
By Authority: C. H. RIXON, Government Printer, Melbourne.
No. 24.-11973/73.-PRICE 40 cents.


1
December 6, 1973
The Honorable E. R. MEAGHER, M.B.E., E.D., M.P.,
Minister of Transport.
Dear Mr. Minister,
In accordance with Section 105 of the Railways Act, the Report of the Victorian Railways Board for the year ended June 30, 1973 is submitted to Parliament.
Yours sincerely,
A. G. GIBBS,
Chairman, Victorian Railways Board.
CONTENTS
TRANSITION
BOARD'S REPORT
APPENDICES-
Balance-sheet
Financial Results (Totals), Summary of
Reconciliation of Railway and Treasury Figures (Revenue and Working Expenses)
Statistics : Passengers, Goods Traffic, &c.
New Lines Opened for Traffic or Under Construction, &c.
Mileage of Railways and Tracks
Railways Stores Suspense Account
Railway Renewals and Replacements Fund
Depreciation-Provision and Accrual
Capital Expenditure in Years Ended June 30, 1973 and 1972
PAGE
2
3
14
16
17
18
19
19
20
20
20
21
.2
TRANSITION
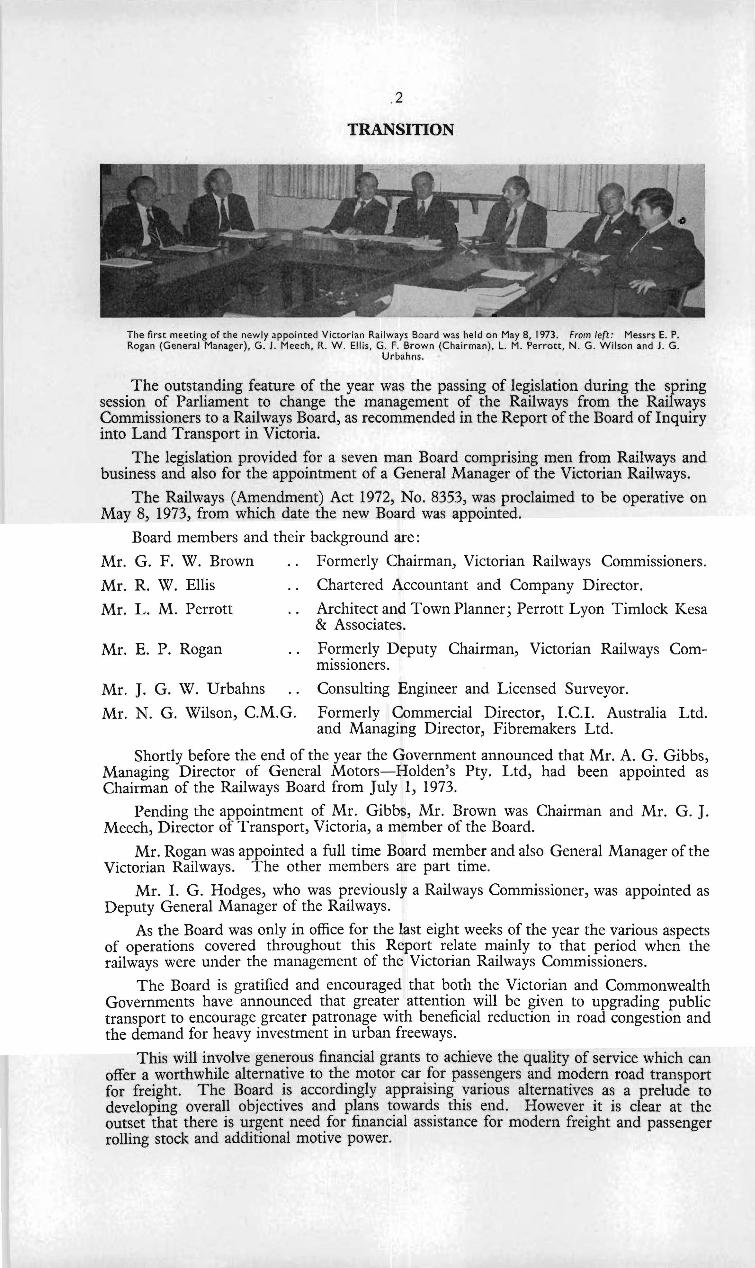
The first meeting of the newly appointed Victorian Railways Board was held on May 8, 1973. From left: Messrs E. P. Rogan (General Manager), G. J. Meech, R. W . Ellis, G. F. Brown (Chairman), L. M. Perrott, N. G. Wilson and J. G.
Urbahns.
The outstanding feature of the year was the passing of legislation during the spring session of Parliament to change the management of the Railways from the Railways Commissioners to a Railways Board, as recommended in the Report of the Board of Inquiry into Land Transport in Victoria.
The legislation provided for a seven man Board comprising men from Railways and business and also for the appointment of a General Manager of the Victorian Railways.
The Railways (Amendment) Act 1972, No. 8353, was proclaimed to be operative on May 8, 1973, from which date the new Board was appointed.
Board members and their background are:
Mr. G. F. W. Brown Formerly Chairman, Victorian Railways Commissioners.
Mr. R. W. Ellis Chartered Accountant and Company Director.
Mr. L. M. Perrott Architect and Town Planner; Perrott Lyon Timlock Kesa & Associates.
Mr. E. P. Rogan
Mr. J. G. W. Urbahns
Formerly Deputy Chairman, Victorian Railways Commissioners.
Consulting Engineer and Licensed Surveyor.
Mr. N. G. Wilson, C.M.G. Formerly Commercial Director, I.C.I. Australia Ltd. and Managing Director, Fibremakers Ltd.
Shortly before the end of the year the Government announced that Mr. A. G. Gibbs, Managing Director of General Motors-Holden's Pty. Ltd, had been appointed as Chairman of the Railways Board from July 1, 1973.
Pending the appointment of Mr. Gibbs, Mr. Brown was Chairman and Mr. G. }. Meech, Director of Transport, Victoria, a member of the Board.
Mr. Rogan was appointed a full time Board member and also General Manager of the Victorian Railways. The other members are part time.
Mr. I. G. Hodges, who was previously a Railways Commissioner, was appointed as Deputy General Manager of the Railways.
As the Board was only in office for the last eight weeks of the year the various aspects of operations covered throughout this Report relate mainly to that period when the railways were under the management of the Victorian Railways Commissioners.
The Board is gratified and encouraged that both the Victorian and Commonwealth Governments have announced that greater attention will be given to upgrading public transport to encourage greater patronage with beneficial reduction in road congestion and the demand for heavy investment in urban freeways.
This will involve generous financial grants to achieve the quality of service which can offer a worthwhile alternative to the motor car for passengers and modern road transport for freight. The Board is accordingly appraising various alternatives as a prelude to developing overall objectives and plans towards this end. However it is clear at the outset that there is urgent need for financial assistance for modern freight and passenger rolling stock and additional motive power.

REPORT OF THE
VICTORIAN RAILWAYS BOARD
FOR THE YEAR ENDED
JUNE 30, 1973
FINANCIAL RESULTS
GROSS INCOME WORKING EXPENSES CHARGED
AGAINST REVENUE
LOSS ON CURRENT OPERATIONS
Interest charges and expenses . . Exchange on interest payments . . Contribution to National Debt Sinking Fund
TOTAL INTEREST, EXCHANGE, ETC.
DEFICIT . . . . .. . .
..
..
..
..
.. I
.. !
1972-73 $
110,410,116
156,326,972
45,916,856
10,020,511 65,982
419,291
10,505,784
56,422,640
'
1971-72 $
111,966,605
138,899,614
26,933,009
9,077,394 81,472
393,013
9,551,879
36,484,888
Compared with last year, income was down $1.5 million whilst working expenses increased by $1 7.4 million.
The increase in expenditure was due mainly to $14.8 million for wages awards. The decrease in revenue was mainly due to the effect of the severe drought on some of our major freight items.
In comparison with last year, revenue for wheat movements fell by $2.6 million and revenue for oats and barley by $1.5 million.
For many years now we have advocated the separation in the accounts of all our social service activities from our commercial activities, but to date this has only occurred piecemeal.
Included in revenue was a recoup of $1.25 million towards concessions granted to pensioners and scholars for school travel and $286,000 for parcels and goods freight concessions. However if reimbursements had been made for other social services provided during the year the approximate amounts would have been:
Suburban Passenger Services*
Country Passenger Services'x'
$14,800,000
$12,600,000
(* Excludes interest payments and depreciation for which no cash provision was made.)

4
LOAN FUNDS
Interest bearing funds totalling $16,019,804 were allotted by the Treasury for expenditure during the year, an increase of $575,570 over the previous year.
They were used as follows:
RENEWALS AND REPLACEMENTS
Way & Works Rolling Stock
CAPITAL WORKS
Way & Works New Lines
$ 2,565,733 8,086,241
5,263,886 103,944
$
10,651,974
5,367,830
16,019,804
As has been the case for many years, the major portion of the loan allotment was again used to finance renewals and replacements amounting to 66.5% of the allotment. In fact since July 1, 1960, from total loan allocations of $206.8 million, $123.4 million has been expended on renewals and replacements for which we pay interest but receive no return.
Whilst the purchasing power of funds continues to diminish, there has been no reduction in the many capital works that must be carried out urgently if we are to provide a modern and highly efficient rail system. As part of its programme to upgrade public transport the Government proposes to make many improvements to the suburban system. If we are to undertake these important works, we emphasize the necessity to change the present financial system of our loan funds. The seriousness of this is evident from the accompanying graph.:
$
M
l
l
0
N
s
17
16
15
: 14
13
12
11:
10
PU~C.-iAS!NG POWER LOSS BECA0St --OF DECREASING MONEY VALUES
1956 '57 '58 '59 '6{) '61 '62 '63 '64 '65 '66 '67 '68 '69 '70 '71 ?2 '73
YEAR ENDING JUNE 30TH

5
MARKETING
Reorganization and expansion of the Marketing division, providing for Marketing Managers assigned to specialize in various groups of major commodities, was begun. A significant early achievement has been the introduction of block train operation for petroleum products between Melbourne and common facilities at Wodonga. Negotiations are proceeding for extension of the system to other parts of the State.
There has been no abatement of the fierce road competition particularly interstate and in the ever expanding area inside the state borders serviced by "border hoppers". We are most disturbed at the apparent ease with which the latter operators are allowed to function under the protection of Section 92 of the Constitution of the Commonwealth of Australia, by giving a legal interstate character to what are essentially intrastate road movements.
Despite this growing road competition our staff was successful in securing new custom worth more than $300,000.
We are fully conscious of the importance to provide modern techniques for handling and packaging of customers goods. Emphasis given to this area of our operations by our specialists has resulted in a highly efficient service to customers.
During the year approval was given to operate our own road vehicles to pick up from and deliver goods direct to clients premises in the metropolitan area. Although only operating in a restricted area at present, the additional service has proven popular with customers and we expect will be of great advantage to us in securing new business.
The Minister of State Development and Decentralisation approved a further 165 industries as eligible for special rates applicable to "Approved Decentralized Secondary Industries" bringing the total to 1,005.
In August, the overnight train to Mildura was modernised with airconditioned sleeping carriages. Named "The Vinelander" the train's popularity is evident by an increased patronage of 25% during the first ten months of operation. The number of motor cars carried on the MotoRail wagon to Mildura has doubled during the year.
"The Vinelander ", the modernised overnight sleeping train operating between Melbourne and Mildura, wa$ intro· duced on August 9, 1972.
A Package Tours Promotion Section established recently has been most successful in organising tours to several popular intrastate and interstate locations. Promotion of the tours resulted in considerable new rail traffic. The Section is constantly researching potential areas for expansion of the service.

6
PASSENGER OPERATION
Although the number of suburban passenger journeys fell by 2.2 per cent to 131.01 million, patronage of peak hour suburban services continued to increase. Country and interstate journeys increased by 6.01 per cent and 3.83 per cent respectively.
Special trains carried 217,000 passengers to the Royal Show. This was an increase of more than 10,000 over the previous year.
The 40th Eucharistic Congress held in Melbourne in February involved organising for the biggest ever rail movement of people in a limited time.
The major task for railway staff was to transport nearly 75,000 school children to and from the Children's Mass at the Melbourne Cricket Ground, within a two hour period each way, using 55 suburban and 26 country trains. At the same time normal commuter services were required to be operated.
Appreciation was expressed by Congress officials for the vital role played by railway staff in moving people during the Congress week.
The Railways played a vital role in moving people during the Eucharistic Congress. Richmond station was the main terminal for special trains transporting school children to the Children's Mass at the Melbourne Cricket Ground.
To cater for patrons attending sporting events in Melbourne a day return service on Saturday was introduced from Portland and Dimboola.
Train times to Sale and Bairnsdale have been improved considerably.
FREIGHT OPERATION
One of the most significant factors which can influence our "bread and butter" item for freight revenue unfortunately struck again during the year. "DROUGHT". Its devastating effect on our annual major wheat haul is highlighted by the poor wheat harvest which was 513,495 tons below the previous year's. Also the amount of wheat exported was 716,806 tons less.
Similarly other grains produced poor crops and revenue suffered further.
Previous experience is that the. full effect of a drought is not confined to one year's operations, nor to primary products.

7
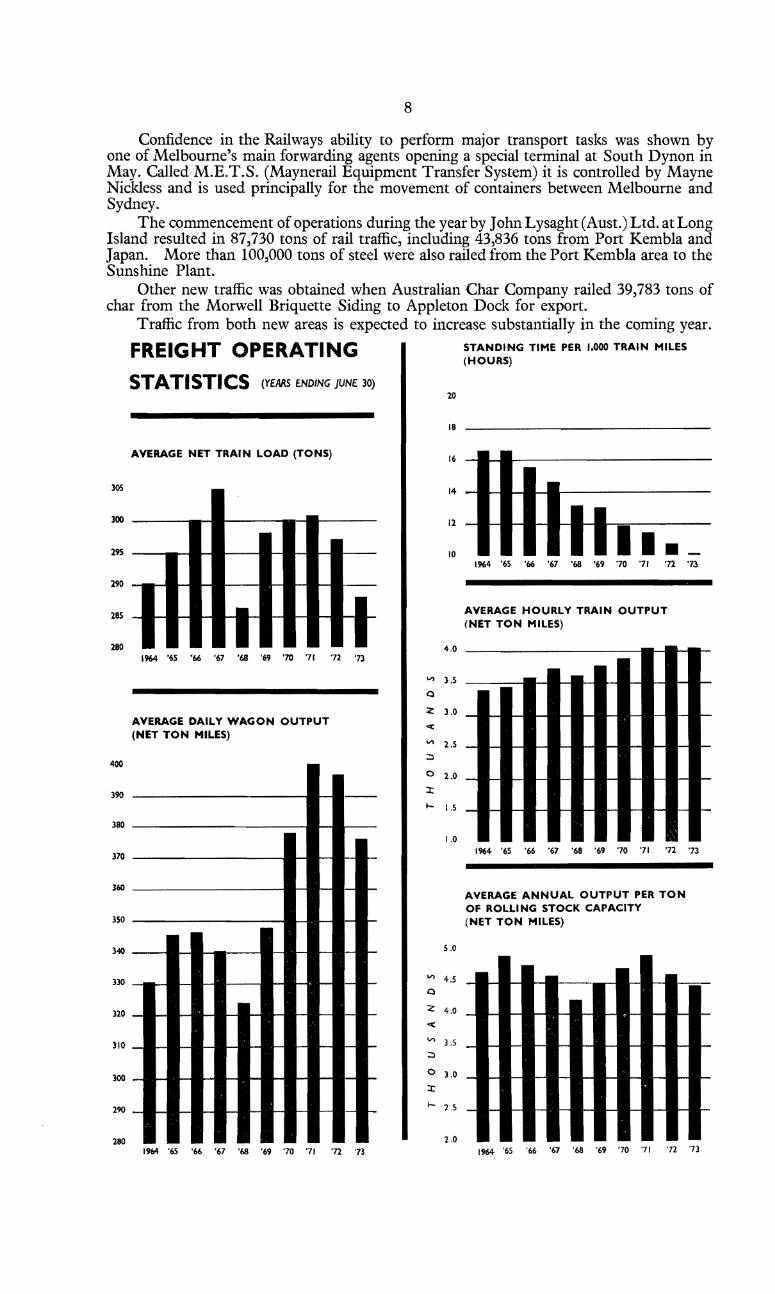
Despite a reduction of 714,000 tons in major grain traffic compared with 1971/72, the total tonnage of all commodities as indicated hereunder was only down 314,000 tons This was mainly due to increased commercial activities in the second half of the year following the breaking of the drought and the improvement in economic conditions throughout the State.
1972-73 1971-72 1970-71 '
Total goods and livestock tonnage .. 11,294,101 11,608,739 12,490,335 Average haul per ton of goods (miles) .. 171 172 170 Total net ton miles (goods and livestock) in 1,935 1,996 2,119
millions Average miles per wagon per day .. . . 34.71 37.10 36.61 Average daily wagon output (net ton miles) .. 376 397 400 Average net wagon load (tons) .. . . 15.99 16.11 16.39 Average ton miles (net) per goods train hour .. 4,083 4,088 4,047 Average net train load (tons) . . .. 288 297 301 Standing time (hours) per 1,000 train miles .. 10.1 10.6 11.3
I
Wagon loads of livestock traffic decreased by 10% over last year. Sheep traffic was down 4 7% but this was due to farmers withholding sheep from sales following the high rise in wool prices. Cattle, however, showed a 25% increase due mainly to the movement of fat and store stock to New South Wales and Queensland.
Superphosphate traffic showed an increase of 112,744 tons, but it was disheartening that a record amount was carried by road.
Growth in container traffic continued to increase rapidly, to a record total of 58,857 containers-an increase of 27% on the previous year.
Traffic in cement also registered an increase.
Motor car traffic was 17% below last year but this was due mainly to industrial disputes in the industry, and the closing down of a plant at Port Melbourne.
Co-operation between the Victorian Railw<.ys '!nd road tra.nsport resulted in a new forwarding agent's terminal in Melbourne with speedy transfer of containers. The steam locomotive symbolised the past method of freight hand
ling at the official opening in May 1973 .
8
Confidence in the Railways ability to perform major transport tasks was shown by one of Melbourne's main forwarding agents opening a special terminal at South Dynon in May. Called M.E.T.S. (Maynerail Equipment Transfer System) it is controlled by Mayne Nickless and is used principally for the movement of containers between Melbourne and Sydney.
The commencement of operations during the year by John Lysaght (Aust.) Ltd. at Long Island resulted in 87,730 tons of rail traffic, including 43,836 tons from Port Kembla and Japan. More than 100,000 tons of steel were also railed from the Port Kembla area to the Sunshine Plant.
Other new traffic was obtained when Australian Char Company railed 39,783 tons of char from the Morwell Briquette Siding to Appleton Dock for export.
Traffic from both new areas is expected to increase substantially in the coming year.
FREIGHT OPERATING STATISTICS (YEAAS ENDING JUNE 30)
AVERAGE NET TRAIN LOAD (TONS)
305
300 - r-
295- r- - - - - r- r--
290 - r- 1- - - - 1- r- r--
285 - 1- I- .... 1- 1- - r- - I- r-
180 1964 '6S '66 '67 '68 '69 '70 '71 72 '73
AVERAGE DAILY WAGON OUTPUT (NET TON MILES)
400
390 - -
380 - ,....._
370 1- - 1- 1-
360 1- '-- 1- 1-
3SO - - 1- 1-
3-40- r- 1- ~ - - - 1- 1-
330 - - - 1- r-- - - - 1- -
320 - - - 1- r- - 1- - - 1- -
310- - - r- 1- - 1- - - - -300 - 1- - 1- 1- - 1- - - - -290 - '- - 1- 1- - - - '--- - -280
1964 '65 '66 '67 '68 '69 '70 '71 '72 '73
20
18
16
14
12
10
""' 3.5 Q
:z 3.0
<
""' 2.5 ;:)
0 2.0
J:
.... 1.5
1.0
5.0
""' 4.5 Q
:z 4.0
<
V) 3.5 ;:)
0 3.0
J:
,._ '2 _s
2.0
STANDING TIME PER 1,000 TRAIN MILES (HOURS)
1964 '65 '66 '67 '68 '69 '70 '71 '72 '73
AVERAGE HOURLY TRAIN OUTPUT (NET TON MILES)
1964 '65 '66 '67 '68 '69 '70 '71 '72 '73
AVERAGE ANNUAL OUTPUT PER TON OF ROLLING STOCK CAPACITY (NET TON MILES)
1964 '65 '66 '67 '68 '69 '70 '71 ·n ·n
9
PROGRESS
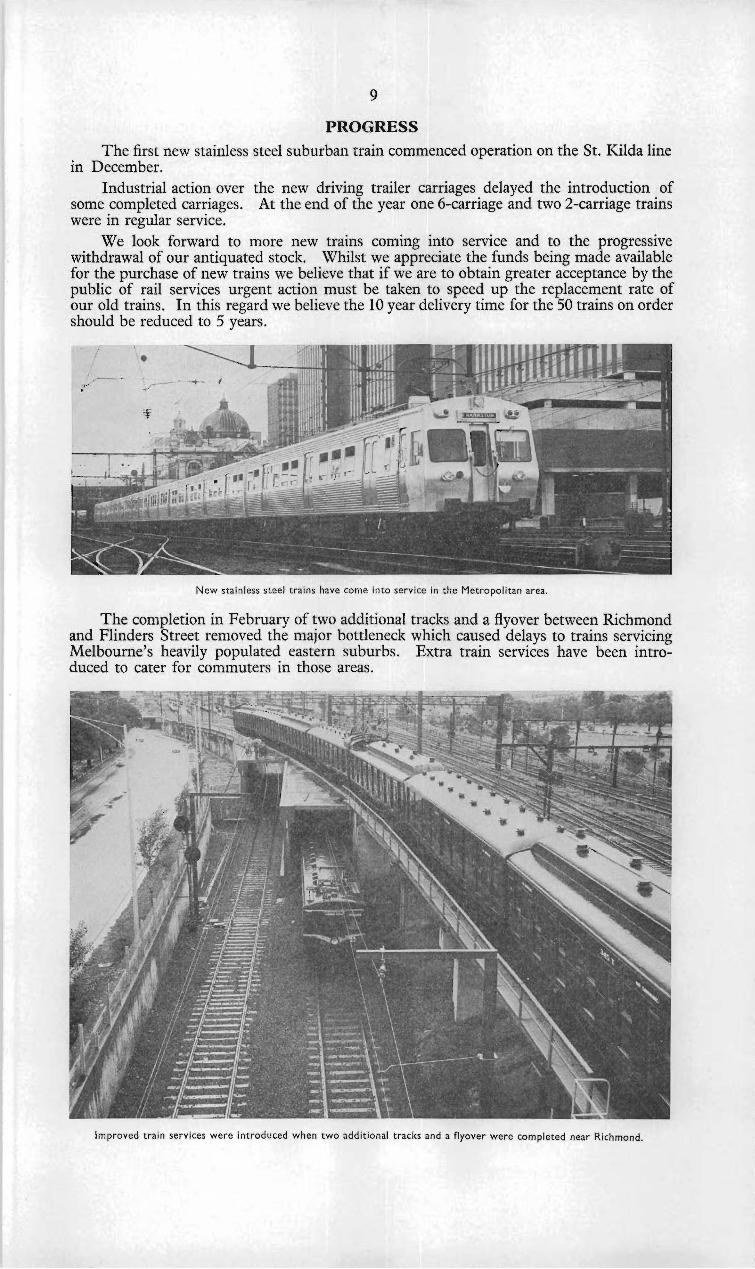
The first new stainless steel suburban train commenced operation on the St. Kilda line m December.
Industrial action over the new driving trailer carriages delayed the introduction of some completed carriages. At the end of the year one 6-carriage and two 2-carriage trains were in regular service.
We look forward to more new trains coming into service and to the progressive withdrawal of our antiquated stock. \Vhilst we appreciate the funds being made available for the purchase of new trains we believe that if we are to obtain greater acceptance by the public of rail services urgent action must be taken to speed up the replacement rate of our old trains. In this regard we believe the 10 year delivery time for the 50 trains on order should be reduced to 5 years.
New stainless steel trains have come into service in the Metropolitan area.
The completion in February of two additional tracks and a flyover between Richmond and Flinders Street removed the major bottleneck which caused delays to trains servicing Melbourne's heavily populated eastern suburbs. Extra train services have been introduced to cater for commuters in those areas.
Improved train services were introduced when two add itional tracks and a flyover were completed near Richmond.

10
Free commuter car parking spaces now number 12,425 at 142 stations throughout the metropolitan area. The programme recently announced by the Government to upgrade public transport included provision of a total of 25,000 spaces. As these facilities will assist in reducing the increasing congestion on roads we believe we should not be solely responsible for their cost.
More than $70,000 has been spent in providing new modern equipment in our various workshops.
Work in connection with the Underground Rail Loop Project was centred mainly in three areas. At J olimont two sections of tunnel for the Caulfield and Sandringham lines have been completed, together with 500 feet of box tunnel and 545 feet of ramp work for the Burnley lines. Other ramp works are in progress in the area. A contract was let by the Melbourne Underground Rail Loop Authority for construction of a ramp and associated works to link with the northern loop tunnel near North Melbourne. To provide a suitable working area for the contractor two platforms at North 1\.1.elbourne station have been temporarily closed and an access road made from street to track level. Preliminary works commenced for construction of underpass tunnels and ramps in the vicinity of Spencer Street station.
The programme of extending suburban platforms to cater for eight carriage trains to meet the increase in rai] patronage during peak hours has continued.
In co-operation with the Country Roads Board, three more level crossings have been eliminated by grade separation. During the year an additionall8level crossings were fitted with flashing light signals, whilst boom barriers were installed at three locations.
PERSONNEL AND ADMINISTRATION At June 30, 1973, the total staff (including casual labour equivalent to 685 men
working full time) was 25,182 compared with 25,715 at the end of last year.
Flooding at Seymour in February caused severe damage to the main Melbourne to Sydney rail tracks. The standard gauge track is on the right.

11
We take the opportunity to express our appreciation to the staff for their work in all phases of operations during the year. An outstanding achievement worthy of particular reference was the ability and dedication shown by staff in restoring rail operations following heavy flooding at Seymour in February. Severely damaged rail track and other vital installations promptly repaired under extremely difficult conditions resulted in minimal delays to rail services.
On July 1, 1973, railway business was converted to the metric system. The smoothness of the change was a tribute to the Committee which undertook the massive task of organizing the changes to be made and supervising the comprehensive educational programme.
Development of staff training programmes was expanded throughout the year. A new training centre was opened at Princes Gate where courses covering a wide range of railway operations were conducted under the control of the Education Officer. As in past years, senior officers also attended outside management and business courses.
The Management Services Division continued to work in close co-operation with Branches to develop new techniques and ways to improve the efficiency of operations.
Station staff at Blackburn has been issued with a new uniform for testing under working conditions. Staff and passenger reaction will determine whether the uniform, lighter in colour and weight than the present navy blue one, will become standard attire for station staff.
A new uniform for station staff is being tested under working conditions by staff at Blackburn.

12
A second computer is now in use to meet the growing demand within the Department for more and more detailed and specific information about the many aspects of railway operations.
Membership of the Victorian Railways Institute increased for the first time in many years. The Institute was successful in joining with another organisation to establish a Trading Company for the benefit of railway staff and their families.
During the year salary and wage increases were granted to a number of railway grades by the Commonwealth Conciliation and Arbitration Commission. It is estimated that the additional cost of these increases will be $29.2 million in a full year.
The average annual payment, including overtime penalty payments to all officers and employes, including juniors, was $4,647 compared with $3,992 the previous year.
Mr. L. A. McCallum, Deputy Chief Civil Engineer visited Europe during April, 1973 to study matters associated with the construction of the Melbourne Underground Rail Loop.
Two Heads of Branches retired on reaching the age of 65. Mr. A. W. Thomson, Comptroller of Stores, on October 20, 1972 and Mr. N. L. Miller, Comptroller of Accounts, on Aprilll, 1973. We are pleased to record our appreciation of the very capable way these officers administered their Branches.
Mr. A. J. Fell (formerly Assistant Comptroller of Stores) succeeded Mr. Thomson and Mr. J. K. McGowan (formerly Acting Assistant Comptroller of Accounts) succeeded Mr. Miller.
At June 30, 1973 the Heads of Branches were:
Secretary
Chief Mechanical Engineer
Chief Civil Engineer
Chief Traffic Manager
Chief Commercial Manager
Chief Electrical Engineer
Comptroller of Accounts
Comptroller of Stores
Superintendent of Refreshment Services
Mr. C. S. Morris
Mr. S. F. Keane
Mr. D. D. Wade
Mr. J. C. Crute
Mr. A. W. Weeks
Mr. A. Firth
Mr. J. K. McGowan
Mr. A. J. Fell
Mr. J. L. Anderson

13
CERTIFICATES OF HEADS OF BRANCHES
I hereby certify that the rolling stock, machinery and equipment under my control were maintained in good working order and repair during the year ended 30th June, 1973.
S. F. KEANE, Chief Mechanical Engineer.
August 23, 1973.
I hereby certify that the permanent way, stations, buildings, bridges, signalling, safeworking equipment and other works under my control were maintained in good working order and repair during the year ended 30th June, 1973.
D. D. WADE, Chief Civil Engineer.
August 23, 1973.
I hereby certify that the sub-stations, transmission system, overhead equipment and depots under my control were maintained in good working order and repair during the year ended 30th June, 1973.
A. FIRTH, Chief Electrical Engineer.
August 23, 1973.
I hereby certify that the stock of Stores has been carefully and systematically inspected during the year and that its value at the 30th June, 1973, was $7,969,087.
APPENDICES
A. J. FELL, Comptroller of Stores.
August 23, 1973.
The balance sheet for the year and various accounts, statements and other information are embodied in the appendices, a list of which appears at the front of this Report.
VICTORIAN RAILWAYS BOARD
G. F. W. BROWN, Chairman
R. W. ELLIS, Member
G. J. MEECH, Member
L. M. PERROTT, Member
E. P. ROGAN, Member
J. G. W. URBAHNS, Member
N. G. WILSON, Member

1971
$
382,029,488
55,959,274
72,401,667
16,437,107
6,352,384
533,179,920
14
Nature and source of funds
FUNDS PROVIDED BY THE STATE TREASURER: For capital purposes-
From loans raised on behalf of the State Less-Equity in the National Debt Sinking Fund
Net liability Less-Loan for renewals, replacements and maintenance
works not represented by assets Discounts and expenses on loans
Total net funds provided from Loans
For special purposes-From-
Sundry specie.! funds Boom Barriers Level Crossings Fund Uniform Railway Gauge Trust Fund Less repayment to Commonwealth
From Public AccountAct 6345 Section 15
17 (I)
RESERVES-
National Debt Sinking Fund Reserve Railway Accident & Fire Insurance Reserve Uniform Railway Gauge Reserve
CURRENT LIABILITIES-
Sundry creditorsStores and services Revenue Trust
SPECIAL FUNDS FOR WORKING PURPOSES-
Sundry provisions prior to 30.6.72 Commonwealth Grant Metro. & Rural Employment Works & Services Act-Metric Conversion
Amount contributed from general revenue of State to meet losses
To 30.6.37 From 1.7.37 to 30.6.72 Contribution for year ended 30.6.73
Loss on operation To 30.6.37 From 1.7.37 to 30.6.72
For year ended 30.6.73 Commonwealth Grant Metro. & Rural Employment Works & Services Act-Metric Conversion
Outstanding income 30.6.73
* This amount is exclusive of provision for depreciation $8,222,099 and forAnnual leave accrued during the year, 59,552 days. Annual leave aggregate liability at 30.6.73 (552,946 days) $8,355,014
54,902,387* 1,053,002
12,326
BALANCE SHEET AS AT
$ $
1,050,000 7.435,319
31,600,000 1,158,213
----
834 1,399,354
------
4,695,432 1,053.002
12,326
220,726,617 56,422,640
217,i29,096
55.967,715
38,949,674
277,149,257
40,390,243
273,596,811 ----
$
477,446,313 76,336,379
401' 109,934
8,485,319
13,722,240 445,037
10,-167,302
30,441,787
55,076,366
1,400,188
76,336,379 200,000
1,158,213
9,170,820 712,496
4,166,089
5,760,760
316,098,931
J21,859,691
313,987,054
1973
$
392,624,615
56,476,554
77,694,592
14.049,405
7,872,637
548,717,803
The above statement has been examined and is in agreement with the accounts and records of the Victorian Railways Board. Subject to comments contained in Part V of my Report to the Legislative Assembly for the year 1972-73, the above statement, in my opinion, fairly summarises the nature and sources of the funds provided to the Board and the purposes to which such funds have been applied.
B. HAMILTON
Auditor General.
19th October 1973

15
JUNE 30, 1973
1972
$
499,651,865
9.513,563
24,014,492
533,179,920
11973/73.-2
Disposal of funds
EXPENDITURE ON-
Railways-Way, works, building, machinery and plant Rolling stock general equipment
Road motor public services-Buildings and equipment Rolling stock
Railways under construction Surveys
Lines closed for trafficRailways
DEPRECIATION ACCOUNT-
Depreciation not provided for by cash appropriations to 30.6.72 Normal depreciation for the year
Less amount provided
Under provision for the year
FUNDS FOR SPECIAL PURPOSES held by the State Treasurer-
Railway Accident & Fire Insurance Fund Railway Charges in Suspense Account Railways Stores Suspense Account Railways Repayment Account
CURRENT ASSETS-
Works in progress-Manufacturing account Stores and materials on hand and in transit
Railways Construction Board Equalization Account
Refreshments Servicu stock & equipment
Securities held in trust
Sundry debtorsRevenue Others
Income cash on hand and in transit
Advances-To Accounting Offices, Stations, etc. To Agent General for purpose of stores etc.
8,691,289 469,190
$
291,714,755 110,981,963
14,462 4,750
267,089 294,383
104,116,633
8,222,099
7,969,087 11,114 61,320
7,898,894 1,634,800
598,802 48,515
402,696,718
19,212
561,472
460,789
403,738,191
112,338,732
200,000 5,259,606 2,519,749
11,635
961,008
8,041,521
625,657
4,154,454
9,533,694 686,239
647,317 ----
J. K. McGOWAN
Comptroller of Accounts
19th October 1973 ·
1973
$
516,076,923
7,990,990
24,649,890
548,717,803

16
SUMMARY OF THE FINANCIAL RESULTS BY CONTRAST WITH THOSE IN THE PRECEDING YEAR.
I Increase ( +) or Year 1972-73
! - Year 1971-72 Decrease (-) In 1972-73
I $ GROSS REVENUE-
$ I $
*Railways Ill ,856,536. 96 112,719,558.65 - 863,021.69
Road motor public services 73,832.47 71,383.66 2,448.81
Total Ill ,930,369.43 112,790,942.31 - 860,572.88
WORKING EXPENSES-
Railways 156,119,623.83 138,721,542.87 + 17,393,080.96
Road motor public services 207,348.29 178,071.52 + 29,276.77
WORKING EXPENSES CHARGED AGAINST REVENUE 156,326,972.12 138,899,614.39 17,427,357.73
DEFICIT ON CURRENT OPERATIONS 44,396,602. 69 26,108,672.08 18,287,930.61
Interest charges, exchange and contribution to the National Debt Sinking Fund 10,505,784.24 9,551 ,878. 86 + 953,905.33
DEFICIT 54,902,386. 93 35,660,550.94 + 19,241,835.99
* Includes-$ I ,250,000 fares concessions, $62,000 parcels recoup, $224,000 goo::ls freight recoup.

17
RECONCILIATION OF THE RAILWAY AND THE TREASURY FIGURES RELATING TO REVENUE AND WORKING EXPENSES, FOR THE YEAR 1972-73
REVENUE
Revenue shown by the Railways
To bring this amount into agreement with the Treasury figures deduct-
Outstanding at June 30, 1973, not included in the Treasury figures
and add-Outstanding at June 30, 1972, collected in 1972-73 and therefore
included by the Treasury in that year
Revenue as shown by the Treasury
WORKING EXPENSES
Working expenses as shown by the Railways Add-Interest and exchange charges, loan conversion expenses and con
tribution to the National Debt Sinking Fund shown by the Railways and the Treasury
Less deficit as shown by the Treasury
Working expenses as shown by the Treasury
RAILWAY POSITION SUMMARIZED
Revenue
Working expenses
Loss on current operations
Interest and exchange charges, loan conversion expenses and contribution to National Debt Sinking Fund
Deficit
$ 11 I. 930,369.43
7,872,637.02
104,057,732.41
6,352,383. 65
156,326,972.12
10,505,784.24
166,832,756.36 56,422,640. 30
Ill ,930,369.43
156,326,972.12
44,396,602. 69
I 0,505,784. 24
54,902,386.93
$
110,410,116.06
110,410,116.06

18
STATISTICAL STATEMENT (EXCLUSIVE OF ROAD MOTOR PUBLIC SERVICES.)
Particulars Year 1972-73 Year 1971-72
I. Average Mileage of Railways open for Traffic 4,155 4,163
PASSENGER TRAFFIC Interstate 674,004 682,356
2. Passenger Train Mileage Country 4,139,719 4,078,226 Suburban 8,258,428 8,287,145 Interstate $3,476,222 $3,274,864
3. Earnings from Passengers Carried Country $5,262,082 $4,693,550 Suburban $27,167,299 $26,773,347 Interstate 553,694 533,275
4. Number of Passengers Carried Country 3,626,205 3,420,707 Suburban 131 ,008,882 133,840,007 Interstate 132,578,95 I 129,193,182
5. Number of Passengers Carried One Mile Country 216,179,978 203,206,411 Suburban 1,226,516,161 I ,206,389,899
~.Interstate 239.44 242.26 6. Average Miles each Passenger was Carried Country 59.62 59.40
Suburban 9.36 9.01 ~interstate 16 16
7. Average Number of Passengers per Carriage Country 10 10 Suburban 25 29
>'interstate 627 .82c 614.10c 8. Average Earnings from each Passenger Journey .. Country 14S.IIc 137.21c
Suburban 20.74c 20.00c >interstate 2.62c 2.53c
9. Average Earnings per Passenger Mile .• ..~ Country 2.43c 2.31c Suburban 2.22c 2.22c
Per Average Mile of Railway Open Interstate 1,135 1,093
10. Number of Passengers Carried Country 893 840 Suburban 441,107 450,640 Interstate 271,678 264,740
11. Number of Passengers Carried One Mile Country 53,233 49,916 Suburban 4,129,684 4,061,919 Interstate 1,381 1,398
12. Passenger Train Mileage Country 1,019 1,002 Suburban 27,806 27,903 Interstate $7,123.41 $6,710.78
13. Earnings from Passengers Carried Country $1,295.76 $1,152.92 Suburban $91,472.39 $90,145.94
Per Passenger Train Mile Interstate 197 189
14. Average Number of Passengers Country 52 so Suburban 149 146
>interstate 12 12 IS. Average Number of Carriages .. Country 5 5
Suburban 6 5 Interstate 515.7Sc 479.93c
16. Average Earnings from Passengers Carried ..-\ Country 127.11c 115.08c Suburban 328.97c 323.07c
GOODS AND LIVE STOCK TRAFFIC-PAYING
17. Goods Train Mileage 7,469,178 7,566,362 18. Earnings from Goods and Live Stock .. $62,029,342 $64,551,698 19. Number of Tons Carried 11,294,101 11,608,739 20. Number of Tons Carried One Mile .. 1,935,412,140 I ,996,243,409 21. Average Haul per Ton of Goods (Miles) 171.36 171.96 22. Average Tonnage per Loaded Wagon .. 15.99 16. 11 23. Average Train Load (Tons) . • . . 287.18 296.75 24. Average Earnings per Goods Train Mile 830 .47c 853.14c 25. Average Earnings per Ton .. 549.22c 556.06c 26. Average Earnings per Ton Mile 3.20c 3.23c
Per Average Mile of Railway Open
27. Number of Tons Carried (Paying Traffic) .. 2,718 2,789 28. Number of Tons Carried One Mile (Paying Traffic) 465,803 479,520 29. Goods Train Mileage 1,798 1,818 30. Earnings from Goods and Live Stock .. $14,928.84 $15,506.05
GOODS AND LIVE STOCK TRAFFIC-GROSS
31. Average Tonnage per Loaded Wagon .. 29.63 29.15 32. Average Train Load (Tons) . . . . 650 659 33. Average Number of Vehicles per Train-Loaded 17.96 18 34. Average Number of Vehicles per Train-Empty 8.53 9

19
NEW LINES UNDER CONSTRUCTION AT JUNE 30, 1973
Section
Tyabb to Long Island Railway. (Traffic conducted from 29.4.'69)
Barry Beach Line. (Traffic conducted from 2.4.'69)
Melbourne Underground Loop
LINES CLOSED FOR TRAFFIC DURING THE YEAR ENDED JUNE 30, 1973
Section Miles
Nil
MILEAGE OF RAILWAYS AND TRACKS
Mileage open for Traffic at June 30 .
Tracks 'I Railways
Ten I Eight I Seven I Six ! Four i
Three I
Tracks Sidings Total tracks i tracks ! tracks
1
tracks I tracks I tracks
~ r ,. o,,. 4582.61 941 .37 5523 . 98 } 0.381 I .34'
i
::!: 4' Sf' Gauge 206.46 40.95 247.41 0.88 . I .55 17.08 ! 63.32 ~ Dual Gauge 5.34 3 .48 8.82
I I
I I -;:: 2' 6" Gauge 8.48 0.78 9.26 I
"' .;!. Total 4802.89 986 .58 5789 .47 0.38 I .34
1
0.88 1.55 17.08 i 63.32
IS' 3" gauge 4571.18 947.82 5519.00 } 0.38 17.08' 1 ~ 4' Sin gauge 206.46 39.15 245.61 1.34 0.88 1.55 61.63
- Dual gauge 5.34 3.48 8.82 I
_ 2' 6• gauge 8.48 0.78 9.26
17.08 1 .... I "' l Total 4791.46 991.23 5782.69 0.38 1.34 0.88 I. 55 61.63 "' >-
Average mileage open for traffic during the year
I Tracks Railways
Two i
tracks
445.39
445.39
437.34
!
Miles
1.5
3
2
Date closed
One J track Total
3615.37 14145.31
8.48 : 8.48
3623.85 14153.7~
3625.11 4145.31
8.48 8.48
437.34 13633.59 4153.79
i Ten Eight Seven Six 1 Four I Three I Two I One Tracks Sidings Total tracks tracks tracks tracks · tracks tracks tracks : track Total "" I 5' 3" Gauge 4578.01 941.55 5519.56 ~ 0.38 I ::!: 4' 8t'' Gauge 206.46 40.05 246.51 1.34 0.88 I .55 17.08 62.43 440.89 3622.44 4146.99
S: Dual Gauge 5.34 3.48 8.82 )
I .J I !
; 12' 6n Gauge 8.48 0.78 9.26 i ! 8.48 8.48
i i i .;!. Total 4798.29 985.86 5784 .IS ! 0.38 i 0.88 I .55 ! 17.08 62.43 440.89 3630.92 4155.47
"' IS' 3" gauge 14570.14 953.47 5523.61 I}., 1.551 'I' I 4' 8!n gauge 206.46 39.12 245.58 1.34 0.88 17.08 60.22 438.75 3634.78 4154.98 ;::: ~ Dual gauge 5.34 3.48 8.82
o.aal ~ 2' 6n gauge I .... 0.78 9.26
1.551
8.48 8.48
~ ~Total 4790.42 996.85 5787.27 0.38 1.34 17.08 60.22 438.75 3643.26 ~163.46 >-

20
RAILWAYS STORES SUSPENSE ACCOUNT
Funds provided at the date of the authorization of the Stores Suspense Account (June 30, 1896)
Less expended on special and deferred repairs in accordance with S e c t i o n 3 of Act 1820
$
I, 118,881 . 62
100.000.00
Advances from Loan Account subsequent to June 30, 1896
Total funds provided Sundry creditors
$
1,018,881.62
7,981,118.38 --·----11
9,000,000.00 1,759,522.81
10,759,522.81
Stores and materials on handRailways Construction Board Equalization Account
Sundry debtors Cash in Treasury at June 30, 1973 Advances with Agent General
APPENDIX No. 17
$
7,969,087.35 11,113.96 61,319.22
RAILWAYS RENEWALS AND REPLACEMENTS FUND
Nature and source of funds Disposal of funds
During the year Period July I During the year ended June 30, 1937, to June 30, ended June 30,
1973 1973 !
1973
$ $ $ Balance at June 30, 1972 - - Renewals and replacements Funds specially appropriated Traffic -under Act No. 6355 400,000.00 14,400,000.00 Rolling Stock 120,825.27
Additional funds authorised Way and Works I ,I 31 ,365 . 50 by Parliament - 11,500,000.00 Electrical Engineering -
Rail motor and road motor, &c. depreciation 69,190.45 4,509,392.74
Sundry sales, abolitions, &c. 783,000.32 10,539,194.78 Interest on investments - 1,406,582.80 Amount charged Item 5
119,193.183.54 Loan Acts -1,252, 190.77 161,548,353.86 1,252,190. 77
APPENDIX No. 18
DEPRECIATION-PROVISION AND ACCRUAL
During the year Period July I, 11 I During the year I ended 1937, to ended June 30, 1973 June 30, 1973
i i June 30, 1973
$ $ $
Special appropriations Additional funds authorised
400,000.00 14,400,000.00 Normal depreciation-Way, works, buildings, &c. 1,218,286. 00
by Parliament - 11 ,500,000. 00 Rolling stock (including Sundry depreciation pro-
69,190.45 4,509,392.74 machinery and equip-
vided in working expenses ment in Rolling Stock Provision from sundry sales Workshops) 6,044,644. 00 &c., included as additional Electrical Engineering plant depreciation - 687,993.39 and equipment 369,352.00
Interest on investments - I ,406,582.80 Rail motors and road B a I an c e at J u ne 30, 1973 motors 59,007.45 amount short provided 8,222,099. 00 112,338,771 . 59
$
8,041,520. 53
149,738.15 2,519,748.93
48,515.20
10,'?59,522.81
Period July I. 1937, to June 30,
1973
$
486,131.42 114,564,898. 38 40,056,169.87
6,441,154.19
161,548,353.86
Period July I, 1937, to
June 30, 1973
$
41,101,567.53
90,390,720.35
8,915,323.32
4,435,129. 32
------ ,-----···-8,691,289. 45 144,842,740.52 8,691 ,289.45 144,842,740.52

21
STATEMENT OF CAPITAL EXPENDITURE
New lines and surveysGross expenditure
Credits
Net expenditure
Additions and improvements on existing lines-Gross expenditure Credits
Net expenditure
Rolling stock-Gross expenditure
Credits
Net expenditure
Electrification of Melbourne suburban lines-Gross expenditure Credits
Net expenditure
Total railways-Gross expenditure Credits
Net expenditure
Road motor public service (including garage accommodation)-Gross expenditure Credits
Net expenditure
Total-Gross expenditure Credits
Net expenditure
'
Year ended June 30, 1973
$
103,945
103,945
8,542,923 1,131,365
7,411,558
8,207,067 120,825
8,086,242
418,059
418,059
17,271,994 1,252,190
16,019,804 ------
-
17,271,994 1,252,190
16,019,804 I
Year ended June 30, 1972
$
142,409
142,409
9,730,206 1,096,478
8,633,728
6,625,691 126,895
6,498,796
169,301
169,301
16,667,607 I ,223,373
15,444,234
--
16,667,607 1,223,373
15,444,234