vibrational sum frequency and raman … an interface specific technique that provides direct...
TRANSCRIPT

VIBRATIONAL SUM FREQUENCY AND RAMAN SPECTROSCOPIC STUDIES
OF AIR-AQUEOUS INTERFACES AND SOLUTIONS OF NITRATE SALTS, AND AIR-SILICA SURFACE ADSORPTION STUDIES
DISSERTATION
Presented in Partial Fulfillment of the Requirements for
the Degree Doctor of Philosophy in the Graduate
School of The Ohio State University
By
Man Xu
*****
The Ohio State University
2008
Approved by
Dissertation Committee:
Professor Heather C. Allen, Advisor _______________________________
Professor James V. Coe Advisor
Professor John Lenhart Environmental Science Graduate Program

ii
ABSTRACT
Nitrate ions are ubiquitous in aqueous-phase atmospheric aerosols as well as surface
and ground waters, and are involved in a variety of reactions in the atmosphere,
hydrosphere, and biosphere. A fundamental understanding of nitrate ions at the air-
aqueous interface is of prime importance with respect to understanding heterogeneous
atmospheric chemistry and geochemistry. Surface activity at the air-aqueous interface
may have consequences for diffusion rates and reaction pathways within the interface.
Although numerous arguments have been proposed concerning the nature of nitrate ions
at aqueous interfaces, there is a lack of detailed molecular-scale experimental evidence.
In the studies presented in this dissertation, vibrational sum frequency generation (VSFG)
spectroscopy, an interface specific technique that provides direct molecular-level
interfacial information, was employed as the primary investigational technique to
elucidate the nature of nitrate ions and formation of ion pairs at the air-aqueous interface,
and to reveal their influence on the interfacial water structure. Raman and infrared
spectroscopies were utilized in addition to VSFG spectroscopy.
Investigations of ion pairing in a series of divalent metal-nitrate solutions were
carried out using Raman and infrared spectroscopies. The spectral features of the nitrate
vibrational modes indicate that the ion pairing in the metal-nitrate aqueous solutions are
concentration and cation dependent. Pb2+ has a strong tendency to form ion pairs with

iii
nitrate anions, and the formation of contact ion pairs decreases with decreasing cation
size and increasing cation charge density: Pb2+ > Sr2+ > Ca2+ > Mg2+.
At the air-aqueous interface, the vibrational symmetric stretch mode of nitrate ions
was directly probed by VSFG. Analysis of the VSFG spectra reveals the perturbation
from cation-anion interactions on interfacial nitrate ions. Mg(NO3)2 is particularly
interesting at the air-aqueous interface. At low bulk concentration of Mg(NO3)2,
interfacial nitrate anions are relatively free from Coulombic effects of Mg2+ cations,
which indicates that the number of water molecules available for solvation significantly
affects the extent of interfacial ion pairing. This finding and the associated spectral
identification shed additional light on the level of interaction between Mg2+ and nitrate in
the bulk solution. That is, in previous bulk studies, it has been accepted that Mg2+ causes
negligible perturbation on nitrate and therefore, no significant ion pairing interactions
were concluded. With the results from this dissertation, although the frequency of the
nitrate symmetric stretch does not change significantly in bulk aqueous Mg(NO3)2
systems with concentration, the bulk frequency is in fact evidence of Mg2+−nitrate
interaction, solvent-shared or solvent-separated ion pairing most likely. This is clear only
after the completion of our interfacial studies that reveal a never before observed
frequency from aqueous Mg(NO3)2 systems.
The addition of nitrate salts also has considerable effects on the interfacial water
structure, as observed in our VSFG studies of the OH stretching modes. The sum

iv
frequency spectral features reveal that the presence of nitrate anions, metal cations, and
the ion pairs perturbs the water hydrogen-bonding network at the air-aqueous interface,
and the perturbation varies with cation. We propose an increasing interfacial depth as the
cation size increases: Mg2+ < Ca2+ < Sr2+. Interfacial depth is defined by non-bulk
behavior. That is, the cation and anion concentrations are not constant in the first few
layers of the air-aqueous interface. Alternatively, concentrations are changing deeper into
what is traditionally called the bulk liquid.
In additional studies, distinct from the ion-pairing work at the air-aqueous interface,
the surface acidity of silica, which is also atmospherically and geochemically important,
was determined by using a surface acidity probe molecule, ethylenediamine
(H2N(CH2)2NH2, EDA). The VSFG study of EDA adsorption onto silica surfaces indicate
that the adsorption occurs via protonation of an amine group by a silica surface silanol
site. The surface acidity of silica is therefore in the range of two pKa values of EDA: 7.56
to 10.71.

v
Dedicated to Honglu and my parents

vi
ACKNOWLEDGMENTS
I wish to thank my advisor, Dr. Heather Allen, for her guidance, support, and
encouragement, which made it possible for me to accomplish the research necessary to
complete this degree. I also wish to thank all of the Allen lab members, past and present.
In particular, I am grateful to Dr. Dingfang Liu and Dr. Gang Ma, who were always
readily available to assist when obstacles arose. I also want to thank Dr. Laura Voss, Dr.
Lisa Van Loon, Cheng Y. Tang, and Xiangke Chen, the discussions with whom were
instrumental in the success of this work. I thank my parents for their continual support. I
especially thank my husband Honglu Liu. Without his constant encouragement and
support, this achievement would not have been possible. Finally, I gratefully
acknowledge funding of this work from the Department of Energy (DOE-BES, DE-
FG02-04ER15495).
vii
VITA
March 22, 1978.......................................................………………...Born – Jiangsu, China
June 1999 ................................................................……………………...B. Sc. Chemistry
Nanjing University
June 2002 ................................................................………..M. Sc. Environmental Science
Nanjing University
2002 – 2008 ............................................................………...Graduate Teaching Associate
The Ohio State University
2002 – 2008 ............................................................…………Graduate Research Associate
The Ohio State University
PUBLICATIONS
Xu, M.; Liu, D.; Allen, H. C. Ethylenediamine at air-aqueous and air-silica interfaces: protonation versus hydrogen bonding investigated by sum frequency generation spectroscopy. Environmental Science and Technology, 2006, 40(5), 1566.
Liu, D.; Ma, G.; Xu, M.; Allen, H. C. Adsorption of ethylene glycol vapor on α-Al2O3 (0001) and amorphous SiO2 surfaces: observation of molecular orientation and surface hydroxyl groups as sorption sites. Environmental Science and Technology, 2005, 39(1), 206.
FIELDS OF STUDY
Major Field: Environmental Science

viii
TABLE OF CONTENTS
Page
ABSTRACT........................................................................................................................ ii
ACKNOWLEDGMENTS ................................................................................................. vi
VITA................................................................................................................................. vii
LIST OF TABLES............................................................................................................. xi
LIST OF FIGURES .......................................................................................................... xii
LIST OF ABBREVIATIONS........................................................................................... xv
CHAPTERS
1 INTRODUCTION .......................................................................................................... 1
2 THEORIES ..................................................................................................................... 6
2.1 Vibrational Sum Frequency Generation Theory................................................... 6 2.1.1 Vibrational Sum Frequency Generation .................................................... 6 2.1.2 Fresnel Factors ........................................................................................... 9
2.2 Raman Spectroscopy: Raman Depolarization Ratio and VSFG Hyperpolarizability Ratio.......................................................................................... 11 2.3 Refractive Indices and Kramers-Kronig Relations ............................................. 14
3 EXPERIMENTAL........................................................................................................ 18
3.1 Scanning Vibrational Sum Frequency Generation Instrumentation ................... 18 3.2 Raman Instrumentation....................................................................................... 21

ix
3.3 FTIR Instrumentation.......................................................................................... 22 3.4 Curve-Fitting Analysis........................................................................................ 23
4 NITRATE IONS AND ION PAIRING IN AQUEOUS SOLUTIONS........................ 25
4.1 Material ............................................................................................................... 26 4.2 Experimental Method.......................................................................................... 27 4.3 Results and Discussion ....................................................................................... 27 4.4 Conclusions......................................................................................................... 36
5 NITRATE IONS AND ION PAIRING AT THE AIR-AQUEOUS INTERFACE...... 49
5.1 Materials ............................................................................................................. 50 5.2 Experimental Method.......................................................................................... 51 5.3 Results and Discussion ....................................................................................... 52 5.4 Conclusions......................................................................................................... 58
6 WATER STRUCTURE AT THE AIR-AQUEOUS NITRATE INTERFACE ........... 65
6.1 Materials ............................................................................................................. 66 6.2 Experimental Method.......................................................................................... 67 6.3 Results and Discussion ....................................................................................... 67 6.4 Conclusions......................................................................................................... 75
7 ETHYLENEDIAMINE AT AIR-AQUEOUS AND AIR-SILICA INTERFACES..... 80
7.1 Materials ............................................................................................................. 82 7.2 Experimental Method.......................................................................................... 82 7.3 Results and Discussion ....................................................................................... 84 7.4 Conclusions......................................................................................................... 93
8 ENVIRONMENTAL IMPLICATIONS AND CONCLUSIONS.............................. 101
APPENDICES
A VSFG SPECTRUM NORMALIZATION................................................................. 103
B LOW-FREQUENCY RAMAN INSTRUMENTATION .......................................... 109

x
C ESTIMATION OF SURFACE MOLE FRACTION................................................. 114
D ORIENTATION CALCULATIONS......................................................................... 117
LIST OF REFERENCES................................................................................................ 122
xi
LIST OF TABLES
Page
Table 4.1 Concentrations of the nitrate aqueous solutions. .............................................. 44
Table 4.2 Curve-fitting results of nitrate in-plane deformation bands in Raman spectra. 45
Table 4.3 Curve-fitting results of nitrate symmetric stretching bands in Raman spectra. 46
Table 4.4 Curve-fitting results of nitrate symmetric stretching bands in IR spectra. ....... 47
Table 4.5 Curve-fitting analysis of nitrate asymmetric stretching bands in Raman spectra................................................................................................................................... 48
Table 5.1 Curve-fitting results of nitrate VSFG spectra. Surface number density ratio of ion-paired to relatively free nitrate (SDRIP/free) is shown.......................................... 64
Table 6.1 Polarizability values of cations and anions. Sr2+ and I- polarizabilities did not converge.................................................................................................................... 79
Table 7.1 Curve-fitting and orientation calculation124-126 results of VSFG spectra (see Appendix D for details of orientation calculations)................................................ 100
Table D.1 Orientation calculation results of VSFG spectra (error in θ was determined by the error in the reproducible fits). ........................................................................... 121

xii
LIST OF FIGURES
Page
Figure 4.1 Raman spectra of saturated aqueous solutions of Mg(NO3)2, Ca(NO3)2, Sr(NO3)2, and Pb(NO3)2. The inset: Raman spectra of the nitrate symmetric stretch modes. Water spectrum is shown in gray in the left panel for comparison. ............. 37
Figure 4.2 IR spectra of nitrate symmetric stretching modes: a) Mg(NO3)2 solutions; b) Ca(NO3)2 solutions; c) Sr(NO3)2 solutions; d) Pb(NO3)2 solutions. ......................... 38
Figure 4.3 Raman spectra of nitrate in-plane deformation modes: a) NH4NO3 solutions; b) Mg(NO3)2 solutions; c) Ca(NO3)2 solutions; d) Sr(NO3)2 solutions; e) Pb(NO3)2 solutions; f) 1.0 m solutions; g) 1.7 m solutions. In panel f) and g), NH4NO3 has the same nitrate concentrations with divalent metal-nitrate solutions, i.e. 2.0 m and 3.4 m respectively. .......................................................................................................... 39
Figure 4.4 Raman intensities of nitrate in-plane deformation modes as a function of concentration: a) sum intensity of the free and ion paired nitrate as a function of molality; b) relative intensity of the contact ion paired nitrate as a function of molarity. .................................................................................................................... 40
Figure 4.5 Raman spectra of nitrate symmetric stretching modes: a) NH4NO3 solutions; b) Mg(NO3)2 solutions; c) Ca(NO3)2 solutions; d) Sr(NO3)2 solutions; e) Pb(NO3)2 solutions; f) 1.0 m solutions; g) 1.7 m solutions. In panel a), exposure time 25 s instead of 50 s was used for 24 m NH4NO3 because of the saturation issue. In panel f) and g), NH4NO3 has the same nitrate concentrations with dication nitrate solutions, i.e. 2.0 m and 3.4 m respectively. ............................................................................. 41
Figure 4.6 Nitrate symmetric stretching peaks in Raman spectra of NaNO3 solutions.... 42
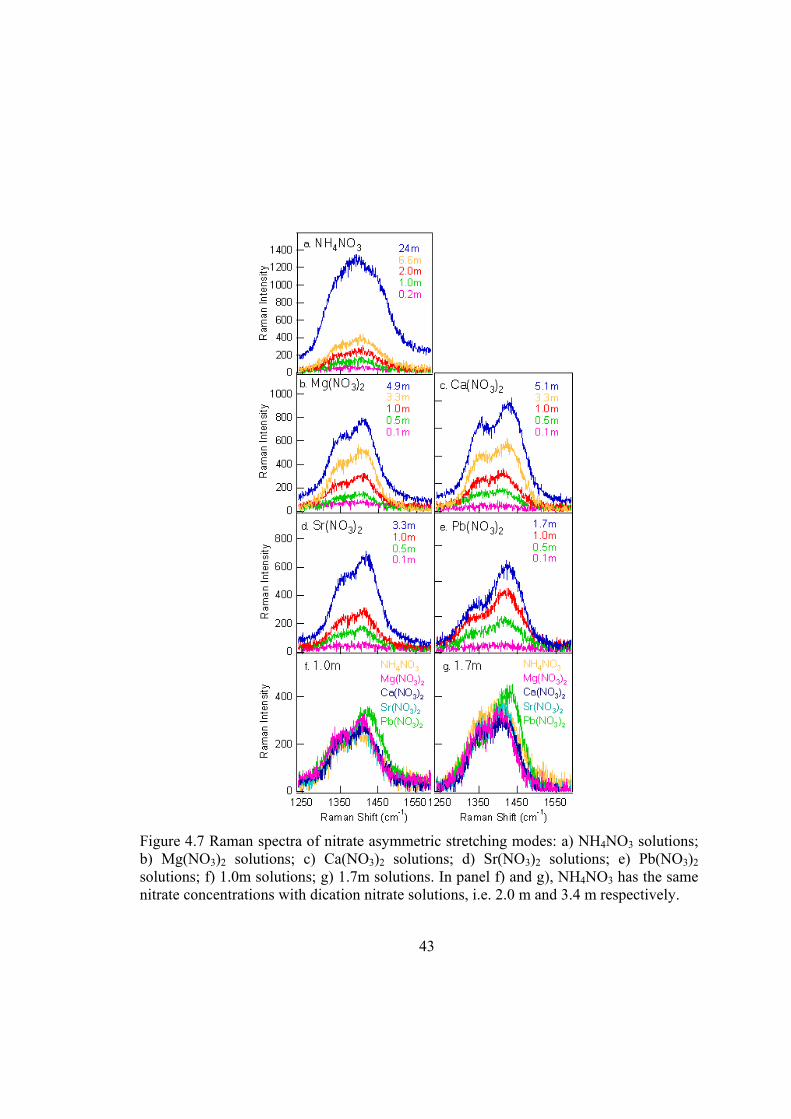
Figure 4.7 Raman spectra of nitrate asymmetric stretching modes: a) NH4NO3 solutions; b) Mg(NO3)2 solutions; c) Ca(NO3)2 solutions; d) Sr(NO3)2 solutions; e) Pb(NO3)2 solutions; f) 1.0m solutions; g) 1.7m solutions. In panel f) and g), NH4NO3 has the same nitrate concentrations with dication nitrate solutions, i.e. 2.0 m and 3.4 m respectively. .............................................................................................................. 43
Figure 5.1 VSFG spectra of aqueous Mg(NO3)2 solutions with ssp polarization: a) 2.6 m Mg(NO3)2; b) 3.3 m Mg(NO3)2. Pink circles: experimental data with error bars; pink solid lines: overall fits; red dashed lines: Lorentzian component peaks................... 60
Figure 5.2 Raman and IR spectra of aqueous Mg(NO3)2 solutions with concentration 2.6 m and 3.3 m: a) Raman spectra; b) IR spectra. Coloring scheme: 2.6 m Mg(NO3)2, pink; 3.3 m Mg(NO3)2, green.................................................................................... 61
Figure 5.3 Raman (a) and IR (b) intensities of nitrate symmetric stretch peak as a function

xiii
of concentration. ....................................................................................................... 62
Figure 5.4 VSFG spectra of aqueous Ca(NO3)2 and Sr(NO3)2 solutions with ssp polarization: a) 2.6 m Ca(NO3)2; b) 3.3 m Ca(NO3)2; c) 2.6 m Sr(NO3)2; d) 3.3 m Sr(NO3)2. Blue circles: experimental data with error bars; solid lines: overall fits; red dashed lines: Lorentzian component peaks. ............................................................. 63
Figure 6.1 (a) ssp-polarized VSFG spectrum of the air−water interface; (b) Raman spectrum of neat water; (c) IR spectrum of neat water............................................. 76
Figure 6.2 Raman and infrared spectra of aqueous nitrate solutions and neat water: a) Raman spectra of nitrate solutions with concentration 2.6 m; b) Raman spectra of nitrate solutions with concentration 3.3 m; c) IR spectra of nitrate solutions with concentration 2.6 m; d) IR spectra of nitrate solutions with concentration 3.3 m. The spectrum of neat water is plotted in each figure for comparison.............................. 77
Figure 6.3 ssp-polarized VSFG spectra of (a) 2.6 m and 3.3 m Mg(NO3)2, (b) 2.6 m and 3.3 m Ca(NO3)2, (c) 2.6 m and 3.3 m Sr(NO3)2. Inset of (a) ssp-polarized spectrum of 0.5 m Mg(NO3)2. The neat water VSFG spectrum is plotted in each figure for comparison................................................................................................................ 78
Figure 7.1 ssp-polarized VSFG spectra of a) neat water; b) 0.05 m.f. ethylenediamine at the air-aqueous interface; c) 0.2 m.f. ethylenediamine at the air-aqueous interface; inset of c) the free OH peak expanded. Dark blue circles: experimental data with error bars; blue solid lines: overall fits; red dashed lines: Lorentzian component peaks. ........................................................................................................................ 95
Figure 7.2 sps-polarized VSFG spectra of a) neat water (scaled to the EDA experimental conditions); b) 0.05 m.f. ethylenediamine at the air-aqueous interface; c) 0.2 m.f. ethylenediamine at the air-aqueous interface............................................................ 96
Figure 7.3 VSFG spectra of amorphous SiO2 at the air-solid interface: a) before exposure to ethylenediamine; b) after exposure to ethylenediamine vapor and purged with organic free air for 5 minutes; c) after exposure to ethylenediamine vapor and purged for 24 hours. Dark blue circles: experimental data with error bars; blue solid lines: overall fits in the CH region; red dashed lines: Lorentzian component peaks.97
Figure 7.4 Schematic representation of adsorption scenarios: I) liquidlike aqueous layer; II) hydrogen-bonding of EDA with a surface silanol group; III) singly protonated EDA by a surface silanol group; IV) doubly protonated EDA by two surface silanol groups. In all four scenarios, water can coexist on the surface................................. 98
Figure 7.5 VSFG spectra in the CH stretching region of a) 0.05 m.f. ethylenediamine at the air-aqueous interface; b) 0.07 m.f. singly protonated ethylenediamine at the air-aqueous interface; c) 0.05 m.f. ethylenediamine dichloride at the air-aqueous interface; d) ethylenediamine at the air-silica interface with 5 minutes purging
xiv
(component peaks at 2852.0 cm-1 and 2918.9 cm-1 have been multiplied by 10); e) ethylenediamine at the air-silica interface with 24 hours purging. Blue circles: experimental; blue solid lines: overall fits; red dashed lines: Lorentzian component peaks. f) Probe peak frequencies in the reference systems and the adsorption mechanism are shown. .............................................................................................. 99
Figure A.1 (a) Refractive index of water as a function of wavelength in the visible region; (b) Refractive index of water as a function of wavenumbers of IR.139,140 .............. 106
Figure A.2 Fresnel factors Lyy(ωVSFG) and Lzz(ωIR) as a function of wavenumber of incident IR............................................................................................................... 107
Figure A.3 ssp-polairzed VSFG spectra at the air−neat water interface: (a) VSFG spectrum before normalization; (b) VSFG spectrum normalized to real-time IR; (c) VSFG spectrum normalized to F factor and real-time IR....................................... 108
Figure B.1 Schematic layout of low-frequency Raman setup: (a) Spectra-Physics Millennia II laser; (b) fiber optic Raman probe; (c) sample holder; (d) focusing lens (FL = 75 mm); (e) 535 nm long-pass filter (Omega Optical, Custom); (f) monochromator and CCD....................................................................................... 111
Figure B.2 Raman spectra of neat water and saturated aqueous solutions of Mg(NO3)2, Ca(NO3)2, Sr(NO3)2, Pb(NO3)2, and NH4NO3 obtained using the low-frequency Raman setup. The Raman spectrum of neat water measured with the Raman probe (red dashed line) is shown for comparison. ............................................................ 112
Figure B.3 Transmission curve of the 535 nm long-pass filter (Omega Optical, Custom)................................................................................................................................. 113
Figure C.1 (a) Surface tension values versus bulk mole fraction of ethylenediamine. Data points: experimental data with error bars; dashed line: linear regression. (b) Activity coefficient f of ethylenediamine in aqueous solutions. (c) Relative adsorption ( 1,2Γ ) of ethylenediamine in aqueous solutions. (d) Surface mole fraction of EDA versus bulk mole fraction of EDA. .................................................................................... 116
Figure D.1 (a) Second order susceptibilities for the symmetric (SS) and asymmetric (AS) stretch of methylene as a function of tilt angle. (b) The ratio between them as a function of tilt angle................................................................................................ 120

xv
LIST OF ABBREVIATIONS
Å Angstrom AS asymmetric stretch ATR attenuated total reflection A.U. arbitrary units CIP contact ion pair CCD charge-coupled device ºC degrees Celsius CW continuous wave EDA ethylenediamine FTIR Fourier transform infrared FL focal length fwhm full width at half maximum hwhm half width at half maximum IPD in-plane deformation IR infrared K-K Kramers-Kronig M moles per liter m moles of solute per kilogram of water MD molecular dynamics

xvi
m.f. mole fraction m.f.s surface mole fraction µm micrometer nm nanometer OPD out-of-plane deformation ps picosecond RH relative humidity SDS sodium dodecyl sulfate SS symmetric stretch SSHIP solvent-shared ion pair SSIP solvent-separated ion pair SDRIP/free surface number density ratio of ion-paired to relative free nitrate VSFG vibrational sum frequency generation VIS visible cm-1 wavenumber

1
CHAPTER 1
INTRODUCTION
The work presented in this dissertation was motivated by a desire to contribute to a
better understanding of ion pairing (cation-anion association) and surface complex
formation of divalent metals at the air-aqueous interface and the aqueous-mineral oxide
interface. In-depth understanding of these processes is of significant importance in
heterogeneous atmospheric chemistry and aqueous geochemistry. This research focuses
on the ion pairing of nitrate-containing aqueous systems.
Nitrate, an important nitrogen species in the nitrogen cycle, is of great environmental
interest. In the atmosphere, nitrate is pervasive in the form of nitrate radicals and nitrate
ions. Nitrate radicals have been studied extensively with respect to their role in night-time
gas-phase atmospheric chemistry.1,2 Like the gas-phase nitrate radical in the atmosphere,
the aqueous-phase nitrate ion is a common constituent of atmospheric aerosols. Gaseous
ammonia reacts with nitric acid in the atmosphere and forms aerosol ammonium nitrate.
The generated nitrate aerosols are in the aqueous state at the relative humidity conditions
above the deliquescence.3 In marine regions, the formation of nitrate aerosols is
associated with significant chloride ion depletion in sea salt aerosols as a result of NaCl
reaction with HNO3, NO3 radicals, N2O5, and ClONO2.1,2,4,5 Water induced
2
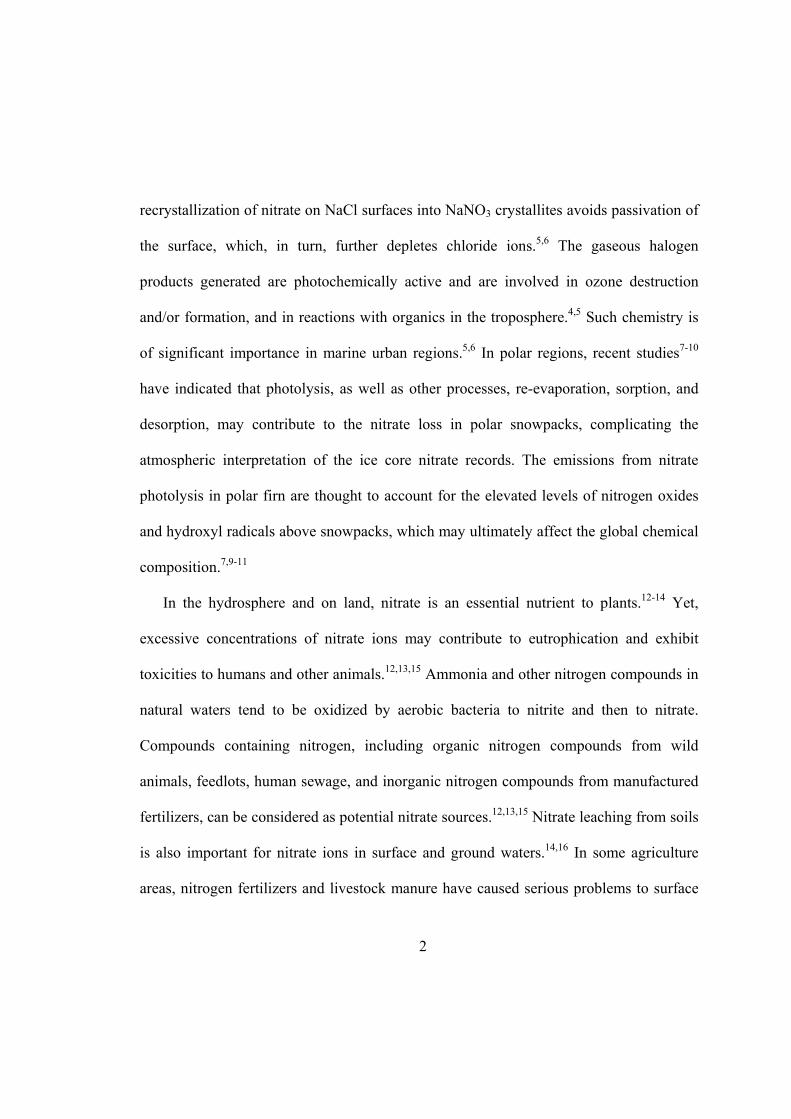
recrystallization of nitrate on NaCl surfaces into NaNO3 crystallites avoids passivation of
the surface, which, in turn, further depletes chloride ions.5,6 The gaseous halogen
products generated are photochemically active and are involved in ozone destruction
and/or formation, and in reactions with organics in the troposphere.4,5 Such chemistry is
of significant importance in marine urban regions.5,6 In polar regions, recent studies7-10
have indicated that photolysis, as well as other processes, re-evaporation, sorption, and
desorption, may contribute to the nitrate loss in polar snowpacks, complicating the
atmospheric interpretation of the ice core nitrate records. The emissions from nitrate
photolysis in polar firn are thought to account for the elevated levels of nitrogen oxides
and hydroxyl radicals above snowpacks, which may ultimately affect the global chemical
composition.7,9-11
In the hydrosphere and on land, nitrate is an essential nutrient to plants.12-14 Yet,
excessive concentrations of nitrate ions may contribute to eutrophication and exhibit
toxicities to humans and other animals.12,13,15 Ammonia and other nitrogen compounds in
natural waters tend to be oxidized by aerobic bacteria to nitrite and then to nitrate.
Compounds containing nitrogen, including organic nitrogen compounds from wild
animals, feedlots, human sewage, and inorganic nitrogen compounds from manufactured
fertilizers, can be considered as potential nitrate sources.12,13,15 Nitrate leaching from soils
is also important for nitrate ions in surface and ground waters.14,16 In some agriculture
areas, nitrogen fertilizers and livestock manure have caused serious problems to surface
3
waters and ground waters.12,15 Being an essential nutrient for aquatic microorganisms and
plants, excess nitrate ions could result in eutrophication in water bodies, though most
often phosphorus is the limiting nutrient.17 Another consequence of high nitrate
concentrations in water systems is the toxicity to humans and aquatic life.12,13,15 Nitrate
itself is not toxic; however, nitrite produced through the reduction of nitrate is highly
toxic to humans, especially to infants.
The nature of nitrate ions at the aqueous interface has received considerable attention.
Recent computational studies of nitrate ions have produced conflicting results concerning
the propensity of nitrate ions for the air-aqueous interface.18-21 Salvador et al. proposed
that the nitrate ion might prefer interfacial over bulk solvation,18 whereas Dang et al.
predicted that the nitrate ion was preferentially localized below the Gibbs dividing
surface.19 The Gibbs dividing surface is where the interfacial water density is half its bulk
value. More recent molecular dynamics (MD) simulations suggested that nitrate ions
exhibit a very weak surface propensity and a small amount of nitrate ions reside at the
water surface.20,21
The studies presented in this dissertation aim at elucidating the nature of nitrate ions
and metal-nitrate ion pairing at the air-aqueous interface, as well as their effects on the
interfacial water structure. Vibrational sum frequency generation (VSFG) spectroscopy,
an interface specific technique that provides direct molecular-level interfacial information,
was employed as the primary investigational technique for the interfacial studies. Raman
4
and infrared spectroscopies that provide the bulk information were utilized to
complement the VSFG studies. The related theories are presented in Chapter 2.
Experimental details can be found in Chapter 3 and in subsequent chapters.
In order to understand the metal-nitrate ion pairing in the interfacial region, first of all,
it is critical to study the ion pairing in aqueous solutions. This is the focus of Chapter 4.
Results reveal that Pb2+ has a strong tendency to form ion pairs with the nitrate anions
relative to Sr2+, Ca2+, and Mg2+ in their aqueous solutions, and contact ion pair formation
decreases with increasing cation charge density: Pb2+ > Sr2+ > Ca2+ > Mg2+. Chapters 5
and 6 investigate the divalent metal-nitrate ion pairing at the air-aqueous interface and the
influence on the interfacial water structure. For the first time, a vibrational mode of the
nitrate ion at the air-aqueous interface is directly probed by VSFG. The VSFG results of
the nitrate vibrational modes reveal that the interfacial nitrate anion follows bulk ion
pairing trends. Mg(NO3)2 is particularly interesting at the air-aqueous interface. Nitrate is
relatively free from the Coulombic effects of cations for lower concentration Mg(NO3)2
aqueous solutions. The sum frequency spectral features in the water OH stretching region
indicate the effects of divalent metal cations and nitrate anions on the interfacial structure
of water, revealing that water solvation and metal-nitrate ion pairing perturb the water
structure at the air-aqueous interface. A thickening of the air-aqueous interface is
suggested as the cation size increases: Mg2+ < Ca2+ < Sr2+. Additionally, a quantitative
study of surface acidity of silica, one important mineral oxide, is presented in Chapter 7.

5
Ethylenediamine (EDA) that has the amine moieties of many widely used environmental
contaminants was employed as the surface acidity probe. The study of EDA adsorption
onto silica surfaces indicates that the adsorption occurs through protonation of an amine
group by a silica surface silanol site, and the surface acidity of silica is quantified to be in
the range of two pKa values of EDA: 7.56 to 10.71. Such quantitative surface acidity
information of mineral oxides helps to better understand chemical processes on mineral
oxide surfaces, such as adsorption, desorption, and heterogeneous reactions in controlled
or natural environments, and is useful in future studies of metal adsorption and metal-
anion pairing at aqueous-mineral oxide interfaces.

6
CHAPTER 2
THEORIES
2.1 Vibrational Sum Frequency Generation Theory
2.1.1 Vibrational Sum Frequency Generation
Detailed theoretical descriptions of the VSFG process are available in the literature.22-
25 A brief introduction of this spectroscopic technique is given here. VSFG is a second-
order nonlinear process that occurs in noncentrosymmetric environments such as
interfaces under the electric-dipole approximation. In the VSFG process, coherent sum
frequency photons are generated by spatially and temporally overlapping of a visible
beam and an infrared beam at a sample surface. The resulting sum frequency light pulses
have a frequency, VSFGω , which is the sum of the frequencies of the two incident pulses,
ωVIS and ω IR . Both reflected and transmitted sum frequency signals are generated. When
visible and IR light pulses are in co-propagating geometry, the reflected sum frequency
occurs at an angle θ VSFG given by:
IRIRVISVISVSFGVSFG kkk θθθ sinsinsin += (2.1)
θ is the angle of the indicated beam to the surface normal, and k refers to the phase that
equals cn /ω , where n is the real refractive index (details see section 2.3) of the medium
through which the indicated beam travels, ω is the frequency of the indicated beam, and c
7
is the speed of light in vacuum.
The VSFG intensity, VSFGI , is proportional to the absolute square of the effective sum
frequency susceptibility, )2(effχ , and to the intensities of the visible and infrared incident
pulses:
)()(||)()()(
sec8 2)2(
1113
223
IRviseffIRvisVSFG
VSFGVSFGVSFG II
nnncI ωωχ
ωωωθωπ
= (2.2)
with
[ ] [ ] [ ])(ˆ)()(ˆ)(:)()(ˆ )2()2(IRIRvisvisVSFGVSFGeff eLeLLe ωωωωχωωχ ⋅⋅⋅⋅⋅= (2.3)
Here, n1(ω) is the refractive index of the bulk medium 1 at frequency ω, )(ˆ ωe is the unit
electric field vector, and L(ω) is the Fresnel factor at frequency ω. (Detailed information
on Fresnel factors is presented in section 2.1.2.) The macroscopic second-order nonlinear
susceptibility, )2(χ , is comprised of a nonresonant term, )2(
NRχ , and a sum of resonant
terms, )2(νχ , as shown in equation 2.4.
∑+=ν
νχχχ )2()2()2(NR (2.4)
A single resonant susceptibility term )2(νχ is described by
νν
νν ωω
χΓ−−
∝i
A
IR
)2( (2.5)
in which Aν is the amplitude of the VSFG transition moment of vibrational mode ν , νω

8
is the center frequency of the transition, and νΓ describes the line-width of the transition.
When the frequency of the incident infrared photons, ω IR , is resonant with a vibrational
mode ν of an interfacial molecule, νωω −IR approaches zero and thus the value of )2(νχ
increases. Consequently, the resonant susceptibility term )2(νχ dominates the nonlinear
susceptibility )2(χ for dielectrics and a VSFG intensity enhancement is observed
(equation 2.2-2.5).
The macroscopic resonant susceptibility )2(νχ is a third-rank tensor with 27 individual
elements. Thus, )2(νχ can be denoted as )2(
,νχ IJK , where I, J and K represent Cartesian
coordinates in the laboratory reference frame. )2(,νχ IJK is related to the number density of
the interfacial molecules and to the molecular hyperpolarizability:
⟩⟨= )2(,
)2(, νν βχ IJKsIJK N (2.6)
where Ns represents the number density of the interfacial molecules, νβ ,IJK represents the
molecular hyperpolarizability for vibrational mode ν in the laboratory coordinate system,
and ⟨⟩ represents an average over the orientational distribution of the molecules. An
Euler angle transformation relates the molecular coordinate system (l, m, n) to the
laboratory coordinate system (I, J, K)
)2(,:
)2(, νν βµβ lmn
lmnlmnIJKIJK ∑= (2.7)
where µIJK :lmn is the Euler angle transformation between the laboratory

9
coordinates and the molecular coordinates. In VSFG, the second-order molecular
polarizability is
∑ Γ+−+=
ν νν
ν
ωωβββ
iIRNR
)2()2( (2.8)
The tensor elements of sum frequency strength factor νβ are related to the Raman and IR
properties of the vibrational mode:
gvvg nlmlmn µαβ ν ⟩⟨∝, (2.9)
Here, g refers to the ground vibrational state and v refers to the excited vibrational state.
lmα represents the Raman polarizability tensor, and nµ represents the infrared transition
dipole moment. νβ ,lmn is nonzero only when both the Raman and the IR transition
moments are nonzero. Therefore, a VSFG active vibrational mode must be both Raman
and IR active, which is a selection rule for the VSFG process.
2.1.2 Fresnel Factors
The effective sum frequency susceptibility )2(effχ (equation 2.3) depends on the
experimental polarization and geometry. Under polarization combinations ssp, sps, pss
and ppp, )2(effχ can be expressed as equation 2.10-2.13.22,26 Polarization combination, for
instance ssp, refers to the polarization of the sum frequency, visible, and infrared photons,
respectively. The s-polarized light has its electric field vector perpendicular to the plane

10
of incidence, while the p-polarized light has its electric field vector parallel to the plane
of incidence.
yyzIRIRzzvisyyVSFGyysspeff LLL χθωωωχ sin)()()()2(, = (2.10)
yzyvisIRyyviszzVSFGyyspseff LLL χθωωωχ sin)()()()2(, = (2.11)
zyyVSFGIRyyvisyyVSFGzzpsseff LLL χθωωωχ sin)()()()2(, = (2.12)
zzzIRvisVSFGIRzzviszzVSFGzz
zxxIRvisVSFGIRxxvisxxVSFGzz
xzxIRvisVSFGIRxxviszzVSFGxx
xxzIRvisVSFGIRzzvisxxVSFGxxpppeff
LLLLLLLLL
LLL
χθθθωωωχθθθωωωχθθθωωω
χθθθωωωχ
sinsinsin)()()(coscossin)()()(cossincos)()()(
sincoscos)()()()2(,
++−
−=
(2.13)
The Fresnel factors are functions of the refractive indices of the beam in different
media, and the experimental geometry22,26
iiii
iiixx nn
nLθωγω
γωωcos)(cos)(
cos)(2)(21
1
+= (2.14)
iiii
iiiyy nn
nLγωθω
θωωcos)(cos)(
cos)(2)(21
1
+= (2.15)
2
1
21
2
)(')(
cos)(cos)(cos)(2)(
+
=i
i
iiii
iiizz n
nnn
nLωω
θωγωθωω (2.16)
where nm(ωi) is the refractive index of the bulk medium m (m = 1, 2, ′) at frequency ωi (i
= VSFG, vis, IR). One method to determine nm(ωi) at different frequencies is the Kramer-
Kronig method, as presented in section 2.3. γi is refractive angle into medium 2 defined
by Snell’s law iiii nn γωθω sin)(sin)( 21 = . θI is the incident or reflection angle from the
11
interface normal for the beam in consideration. n′ (ωi) is the effective refractive index of
the interface that can be estimated by equation 2.17.22
)5)()((2)(4
)('1
22
22
22
2
++
=
ii
i
i nnn
n ωωω
ω (2.17)
According to equation 2.2, 2.3 and 2.10-2.13, the VSFG intensity is associated with
the Fresnel factors. Therefore, when performing the normalization of VSFG spectra, the
Fresnel factors should be considered in addition to IR and visible intensities. Appendix A
gives an example of normalizing the VSFG spectrum of neat water by using Fresnel
factors and the real-time IR profile. The normalized spectrum is compared with the
spectrum normalized to IR.
2.2 Raman Spectroscopy: Raman Depolarization Ratio and VSFG
Hyperpolarizability Ratio
The Raman depolarization ratio ρ is given by26-28
22
2
4453
γαγρ+
== ⊥
IIII (2.18)
⊥I is the intensity of scattered light polarized perpendicular to the incident light, and III
is the intensity of Raman scattering polarized in the same plane as the incident light. α is
the mean polarizability, γ is the anisotropy, with
12
)(31
ccbbaa αααα ++= (2.19)
])()()[(21 2222
ccbbccaabbaa ααααααγ −+−+−= (2.20)
when considering the symmetric stretching vibration of a C3v group. αlm (l = m = a, b, c)
is the Raman tensor in the molecular coordinate system.
Combining equation 2.18-2.20,
−+
+=
11254
3
RR
ρ with cc
aaRαα
= (2.21)
According to equation 2.9, the VSFG process is considered to be anti-Stokes Raman
scattering of a vibrationally excited state with nlmlmn µαβ ⋅∝ . Therefore, the VSFG
hyperpolarizability ratio Rcc
aa
ccc
caa
ccc
aac ==⋅⋅
=αα
µαµα
ββ . Equation 2.21 gives the expression
for the hyperpolarizability ratio R in terms of the Raman polarization ratio ρ
21
+−
=QQR or
21
−+
=QQR (2.22)
with
−=
341
53
ρQ .
Only one of these two R values from equation 2.22 is physically correct and can be
applied to the orientation analysis. Eisenthal et al.29 developed a method using polarized
VSFG measurements to determine the correct R value. Briefly, the macroscopic

13
susceptibility, χ, is related to the molecular hyperpolarizability, β. In the symmetric
stretching vibrational mode of a C3v group, for example, the relationship is given by26,29
]cossin)1(cos2[21 23 θθθβχχ RRN cccs
SSyyz
SSxxz ++== (2.23)
]cossin)1[(21 2 θθβχχ RN cccs
SSyzy
SSxzx −== (2.24)
where θ is the orientation angle. The relative sign of χxxz and χxzx of the symmetric stretch
can therefore differentiate whether R is less than or greater than 1. One way to determine
the relative sign of the susceptibility elements is through phase studies.30,31 The
polarization method,29 however, provides an alternative and experimentally easier way to
determine the relative sign of χxxz and χxzx.
The s-polarized VSFG polarization, VSFGxP , where
IRx
viszxzx
IRz
visxxxz
VSFGx EEEEP χχ += (2.25)
describes the incoming electric field, E, along the indicated axis. The intensities of the s-
polarized VSFG were measured with the input visible and IR pulses polarized 45° and
parallel to each other, and with the input visible and IR both polarized 45° but
perpendicular to each other.29 In the first case, IRz
visx EE and IR
xvisz EE have the same sign,
whereas in the latter case IRz
visx EE and IR
xvisz EE have the opposite sign. Therefore,
comparison between the two s-polarized VSFG intensities gives the relative sign of χxxz
and χxzx (equation 2.25), which in turn can determine the correct R value of equation 2.22.
14
2.3 Refractive Indices and Kramers-Kronig Relations
The VSFG intensity as well as the Fresnel factors depend on the value of the real
refractive indices. One method to extract the refractive indices at different frequencies is
the Kramer-Kronig (K-K) method. Infrared spectra are usually plots of the absorbance A
or the transmittance T versus wavenumber. In transmission infrared spectroscopy,
absorbance A is expressed as equation 2.26 for a given sample thickness l, in accord with
the Beer-Lambert Law.
lIIA s α=−=
010log (2.26)
where Is is the intensity after passing through the sample, I0 is the intensity of the incident
light, and α is the absorption coefficient which is related to the extinction coefficient k by
λπα k4
= (2.27)
k is also the imaginary part of the complex refractive index n~ :
iknn +=~ (2.28)
n is often called the refractive index, which follows Snell’s law 2211 sinsin θθ nn = ; k
represents the damping of an electromagnetic wave inside the material. Both n and k are
functions of wavelength λ.
Based on equation 2.26 and 2.27, at a certain wavelength λ, the dominant factor that
affects the absorbance is the imaginary refractive index k. However, the real part
15
n of the refractive index also plays a role in the absorption process. Physically, the
refractive index of a material is a function describing the response of the material to the
applied electromagnetic radiation. The real part n and the imaginary part k are therefore
not wholly independent but are connected by the Principle of Causality which is
formulated mathematically by the K-K relations:32-35
ννννν
πν dkPnn ∫
∞
∞ ′−=−′
0 22
)(2)( (2.29)
ννν
νπνν dnPk ∫
∞
′−′
−=′0 22
)(2)( (2.30)
Here ν is the wavenumber. P refers to the Cauchy principle value. The integral in
equation 2.29 and 2.30 is considered as a Cauchy principle value because of the possible
singularity at 'νν = (improper integral).
K-K relations can be employed to determine the real and imaginary parts of the
complex refractive index.33,34 The Beer-Lambert Law (equation 2.26 and 2.27) allows us
to estimate a value of k(ν) for each wavenumber from the absorbance spectrum in the
zeroth approximation. The approximate k(ν) values are K-K transformed to obtain the
values of the real refractive index n(ν). Then, the approximate k(ν) and n(ν) values are
used to calculate an absorbance spectrum. The new absorbance spectrum is compared
with the original experimental spectrum and k(ν) values are adjusted. The updated k(ν)
values are then employed to calculate better approximations to n(ν). These steps are
iterated until k(ν) and n(ν) become constant.

16
In the case of reflection infrared spectroscopy, the procedure of determining the real
and imaginary refractive indices is somewhat different.36 Generally speaking, for
transmission spectroscopy, the imaginary part k is estimated from experiments and the
real part n is obtained by the K-K relation, as discussed above, whereas for reflection
spectroscopy, the intensity is measured and the phase is calculated by the K-K relation.
In a reflection spectrum, the measured reflectance R is the power ratio of reflected
light to incident light.37 R corresponds to the absolute square of the reflection
coefficient36,37
2rR = (2.31)
At normal or near-normal incidence and when one medium is air (or vacuum),36,37
1~1~
+−
=nnr (2.32)
n~ is the complex refractive index as shown in equation 2.28. Thus, r is also complex
with modulus r and phase θ, θierr = . By incorporating equation 2.31, we obtain
θθθθ sincos RiReRerr ii +=== (2.33)
θiRr += ln21ln (2.34)
The imaginary part θ correlates with the experimentally measured reflectance R by a K-K
relation32,36

17
νννν
πννθ dRP∫
∞
′−′
−=′0 22
)(ln)( (2.35)
From equation 2.28 and 2.32, r can be expressed as a function of real (n) and imaginary
(k) refractive indices:
2222
22
)1(2
)1(1
knki
knknr
+++
++−+
= (2.36)
By comparing 2.33 and 2.36, n and k are associated with R and θ :
θcos)1(
122
22
Rkn
kn=
++−+ (2.37)
θsin)1(2
22 Rkn
k=
++ (2.38)
Therefore, in the near-normal reflection spectroscopy, the real and imaginary refractive
indices are estimated using the measured reflectance and the calculated phase from K-K.

18
CHAPTER 3
EXPERIMENTAL
3.1 Scanning Vibrational Sum Frequency Generation Instrumentation
Two scanning VSFG systems, both available in the Allen lab, were used in the studies
presented in this dissertation. The VSFG scanning systems, described as the 20 Hz and
the 10 Hz systems, are described below. Additional details of these two systems can be
found in previous publications.38-40 In both scanning VSFG systems, the VSFG spectra
were acquired using a visible beam at 532 nm and a tunable infrared beam.
The 20 Hz scanning VSFG system was utilized for the study of vibrational modes of
interfacial nitrate ions. In the 20 Hz VSFG system, the 532 nm visible pulse is generated
by doubling the frequency (second harmonic) of the 1064 nm pump source from an
Nd:YAG laser (27 ps pulse duration and 20 Hz repetition rate, EKSPLA, PL
2143A/20/SS). The infrared pulse tunable from 1000 cm-1 to 4000 cm-1 with spectral
width < 6 cm-1 is generated from an optical parametric generator (EKSPLA,
PG401/DFG2-16P). The 532 nm visible beam is focused 40 mm after the sample surface
by a plano convex lens (700 mm focal length). At the sample surface the 532 nm beam
has a diameter of 1 mm and an intensity of ~400 µJ/pulse. The infrared beam is focused
at the sample surface by using a ZnSe lens (50 mm focal length) to yield a < 0.5 mm

19
beam diameter of the infrared light at the sample surface with an intensity of ~40
µJ/pulse at 1050 cm-1. The input angles of the 532 nm and infrared beams are 60° and
55° from the surface normal, respectively. The 532 nm and infrared pulses are
overlapped at the interface spatially and temporally. After the sample stage, a series of
mirrors and irises are used to separate the VSFG signal and the 532 nm beam, followed
by a Glan Thompson, a halfwave plate, and a notch filter to further filter out scattered
532 nm light and to change the VSFG polarization. The VSFG signal is focused to the
monochromator by using a 200 mm focusing lens. After filtration in the monochromator,
sum frequency light is collected using a cooled charge-coupled device (CCD) camera
(Andor Technology, DV412).
The 10 Hz scanning VSFG system was employed to study vibrational modes in the
OH stretching region of water and the CH and NH stretching regions of ethylenediamine.
The 10 Hz system uses a pulsed Nd:YAG laser (29 ps pulse duration and 10 Hz
repetition rate, ESKPLA, PL 2143A/SS) that pumps a KTP-KTA based optical
parametric generator/amplifier (LaserVision). The mid-infrared beam generated is
tunable from 2500 cm-1 to 4000 cm-1 with a bandwidth of 4-8 cm-1 and energy of 200-
500 µJ/pulse at the sample surface, depending on the spectral region. The 532 nm visible
beam is ~550 µJ/pulse at the sample surface. The input angles are set to 45° and 53° from
the surface normal for the 532 nm and infrared beams, respectively. A cooled CCD
camera (Andor Technology, DV887ECS-BV) is utilized to collect the VSFG signal. An
20
iris, a Schott glass filter (BG 25, CVI Laser), a short pass filter (SPF500, CVI laser), and
two holographic notch plus filters (Kaiser Optical System, Inc.) are used before the CCD
camera to block the 532 nm scattered light.
Both scanning VSFG systems were calibrated using a polystyrene thin film and the
non-resonant VSFG spectra of a gold surface. The calibration spectrum was collected by
placing a thin film of polystyrene, whose infrared absorbances are well known, in the
path of the infrared beam prior to beam overlap on the gold surface. The resultant
infrared beam is structured due to absorbance by the polystyrene film, which leads to a
structured non-resonant VSFG spectrum of gold. The peak positions (dips) in the
calibration VSFG spectrum are used to calibrate the VSFG spectra. To ensure the
stability of the VSFG system and to confirm the reproducibility of the spectra, VSFG
spectra of neat water or an 8.0 mM sodium dodecyl sulfate (SDS) solution were also
obtained at the beginning and the end of daily experiments.
All VSFG spectra presented in this dissertation are plots of the sum frequency
intensity versus the incident infrared frequency, and are the average of three to six
replicate spectra. The VSFG spectra were normalized to IR profiles detected in real time
with VSFG.
21
3.2 Raman Instrumentation
Raman spectra were obtained by passing an unpolarized 532 nm light (Spectra-
Physics, Millennia II) or 785 nm light (Raman System Inc) from a continuous wave laser
onto the sample using a 5 mm or 7.5 mm focusing Raman probe (InPhotonics),
depending on the experiment. The Raman scatter was focused onto the entrance slit of a
500 mm monochromator (Acton Research, SpectroPro SP-500) through a fiber optic
imaging coupler (Acton Research, FC-446-030), dispersed by a 600 groove/mm grating
blazed at 1 µm, and collected on a liquid nitrogen cooled CCD camera (Roper Scientific,
LN400EB, 1340 × 400 pixel array, back-illuminated and deep depletion CCD). The
power of the 532 nm beam for sample illumination was ~100 mW, and the power of the
785 nm beam was ~240 mW. The slit width of the monochromator entrance slit was set
to 50 µm, and the resolution was 3.2 cm-1. Raman spectra were collected with an
exposure time of 50 s. Before data collection, the monochromator was calibrated using
the 435.833 nm Hg line of a fluorescent light, and was verified by comparison to the
Raman spectrum of crystalline naphthalene.
In the Raman setup, a Raman probe (Inphotonics) was employed to illuminate the
sample and to filter and collect the scattered radiation. In order to study the metal-nitrate
interaction which has intermolecular vibrational bands at ~250 cm-1 or lower, a Raman
setup that can detect lower frequencies was designed and utilized. Details of the low
frequency Raman instrumentation are presented in Appendix B. In the obtained low-

22
frequency Raman spectra, the interference of water-water hydrogen bonding hinders
direct interpretation of low-frequency Raman spectra of the nitrate aqueous solutions.
Therefore, in this dissertation, discussions are focused on the nitrate vibrational modes in
the region 300 cm-1 to 4000 cm-1 acquired using the Raman probe.
3.3 FTIR Instrumentation
A Thermo Nicolet Fourier transform infrared (FTIR) spectrometer (Thermo Electron
Corporation, Avatar 370) was employed to acquire attenuated total reflection Fourier
transform infrared (ATR-FTIR) spectra. ATR-FTIR instead of transmission FTIR was
used as a bulk probe for ease of comparison. IR penetration depth for ATR-FTIR is on
the order of the wavelength of the incident light, and the IR absorption is therefore
dominated by the bulk. We have assumed that the refractive indices of aqueous solutions
are relatively constant. A 45º single-bounce ZnSe crystal trough mounted on an accessory
(Thermo Electron Corporation, Smart SpeculATR) was employed to collect spectra at a
spectral resolution of 4 cm-1. The obtained ATR-FTIR spectra will be referred as IR
spectra in future chapters. All IR spectra shown in this dissertation were averaged over
128 scans.
23
3.4 Curve-Fitting Analysis
When several overlapping peaks contribute to a spectral intensity, it is difficult to
assign the accurate peak positions. Curve-fitting techniques were used to determine the
positions, amplitudes, and areas of the component peaks of a spectrum. The VSFG
spectra were fit with the peak-fitting function in IgorPro 4.05A software (WaveMetrics,
Inc.) using a home-written program to incorporate phase.41 The mathematical model
describing the profile of bands was the Lorentzian model. The VSFG intensity VSFGI is
proportional to the absolute square of the summation of resonant )2(
νχ and nonresonant
)2(
NRχ susceptibility terms, as shown in equation 2.2 to 2.4. Unlike Raman and IR, VSFG
is coherent. The relative phase of the VSFG response for each overlapping vibrational
mode can have a profound effect on the shape of the resultant VSFG spectra, and
therefore was included in the curve-fitting process of the VSFG spectra. When
performing the curve-fitting analysis, input of the following parameters was required: two
non-resonant terms (real and imaginary), peak amplitudes and phases, peak positions, and
peak widths for each component peak. Since a VSFG active vibrational mode must be
both Raman and IR active, Raman and IR spectra of the chemicals of interest were
acquired before the VSFG curve-fitting analysis. By performing curve-fits on the Raman
and IR spectra, the number of peaks, peak positions and peak widths of Raman and IR
active modes were obtained. These peak parameters were used as references for the initial
24
guess in the VSFG curve-fitting process.
The curve-fitting analysis of the Raman and IR spectra was conducted using the
multipeak fitting function in IgorPro 4.05A, with the Voigt line shape and the
background subtraction option enabled. In order to properly compare the fitting results,
the best-fit Voigt line shapes were held to be relatively constant.

25
CHAPTER 4
NITRATE IONS AND ION PAIRING IN AQUEOUS SOLUTIONS
Ion pairing, the association of oppositely charged ions in electrolyte solutions to form
distinct chemical species, ion pairs, is of prime importance in many areas including
solution chemistry, environmental chemistry, geochemistry, and biology.20,42-45 Ion pairs
are classified as three types: solvent-separated ion pairs (SSIPs) where the primary
solvation shells of the cation and the anion remain intact, solvent-shared ion pairs
(SSHIPs) when a single solvent layer exists between the cation and the anion, and contact
ion pairs (CIPs) when no solvent exists between the ion partners of the pair and ions are
in direct contact.42,46 Ion pairing in systems containing nitrate anion, an environmentally
and biologically important ion, has attracted considerable interest.6,10,19,21,47-49 The
formation of ion pairs with a counter cation changes the environment of the nitrate anion.
This has implications for surface reactivity and reaction mechanism in atmospheric and
geochemical systems.
This chapter presents a Raman spectroscopic study of ion pairing in aqueous solutions
between nitrate anions and divalent metal cations, Mg2+, Ca2+, Sr2+, and Pb2+, from 0.1 m
to saturated concentrations at room temperature. Ammonium nitrate solutions that give
little indication of disturbance of the nitrate anion by the cation are studied for

26
comparison.50 Raman spectra of nitrate vibrational modes are interpreted carefully to
elucidate effects of different divalent cations. IR experiments were also conducted,
complementing the Raman study. The work presented in this chapter is different from
previous research in that other research51-55 has mainly focused on individual metal-
nitrate salts and few studies45,51,56,57 have been conducted to understand relative
differences between different cations with nitrate. In the present work we elucidate
effects of different metal dications, Mg2+, Ca2+, Sr2+, and Pb2+, on metal-nitrate ion
pairing by a comprehensive spectroscopic study.
4.1 Material
All nitrate salts, Mg(NO3)2⋅6H2O (Certified ACS, 98.0-102.0%), Ca(NO3)2⋅4H2O
(Certified ACS, 99.0-103.0%), Sr(NO3)2 (Certified ACS, 99.0%), and Pb(NO3)2
(Certified ACS, 99.0%) were purchased from Fisher Scientific and were used as received.
The aqueous solutions were made using Nanopure water with resistivity 18.0-18.3 MΩ
cm.
Molality (m), which is defined as the moles of solute per kg of water, is used as the
concentration unit for the nitrate salt solutions in this chapter. Table 4.1 shows the
concentrations of the aqueous solutions in molality (m), mole fraction (m.f.), and moles
per liter (M).

27
4.2 Experimental Method
The Raman spectrometer with a 785 nm continuous wave laser (Raman System Inc)
was employed as the primary instrument for the work presented in this chapter. The
power of the 785 nm illumination light was ~240 mW. The slit width of the
monochromator entrance slit was set to 50 µm, the grating used was 600 groove/mm, and
the resolution was 3.2 cm-1. Raman spectra were collected with an exposure time of 50 s.
Detailed information of Raman and IR instrumentation can be found in section 3.2 and
3.3.
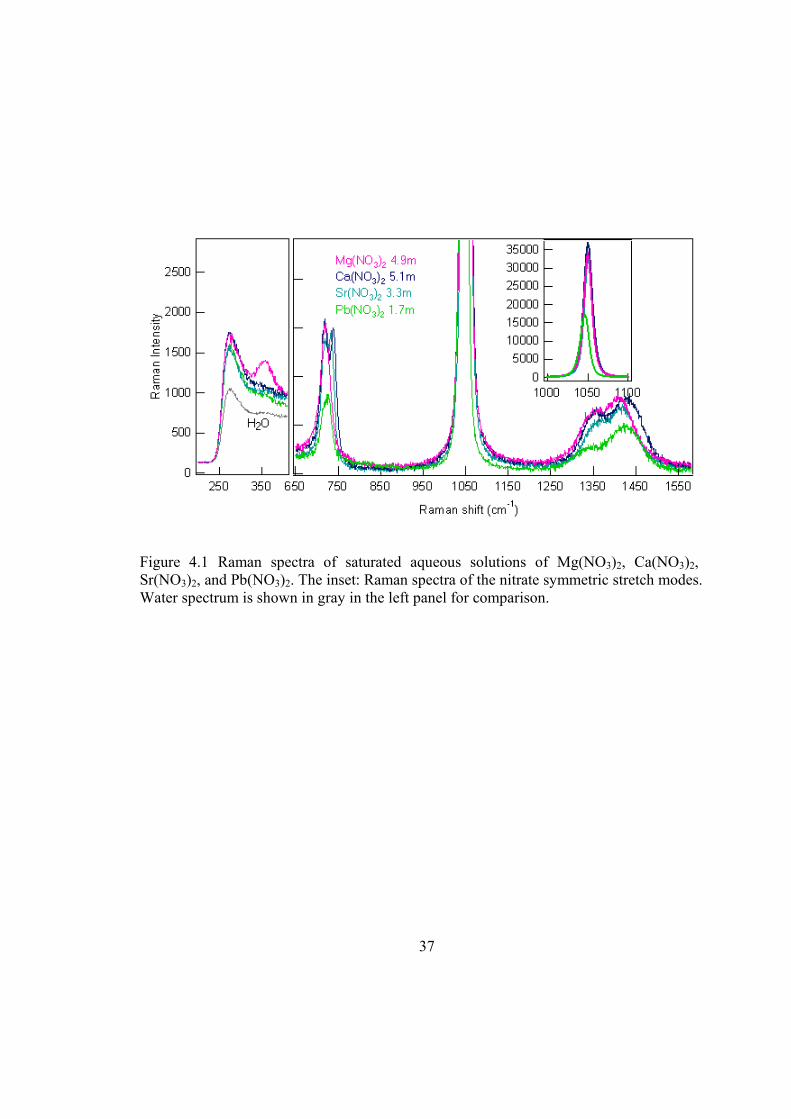
4.3 Results and Discussion
Raman spectra were obtained from metal-nitrate aqueous solutions that ranged in
concentration from 0.1 m to saturation at room temperature. The Raman spectra of
saturated Mg(NO3)2, Ca(NO3)2, Sr(NO3)2, and Pb(NO3)2 solutions are shown in Figure
4.1. There are three nitrate vibrational bands in the spectra shown in the right panel of
Figure 4.1: in-plane deformation (IPD) modes at ~719 cm-1, symmetric stretching (SS)
modes at ~1049 cm-1 (also shown in the inset of Figure 4.1), and asymmetric stretching
(AS) modes at ~1370 cm-1. In the saturated solution of Mg(NO3)2, the nitrate IPD occurs
as a well defined single peak, whereas peak splitting or an asymmetric peak shape of the
IPD is observed for Ca(NO3)2, Sr(NO3)2, and Pb(NO3)2. For the nitrate SS modes shown
in Figure 4.1 and the inset, the frequency differences between Pb(NO3)2 and other nitrate

28
solutions are observed. In the case of the AS modes, small variations are observed for
different divalent cation-nitrate saturated solutions. The left panel of Figure 4.1 shows the
Raman spectra of the intermolecular metal-water vibrational modes, which will be
discussed later.
The spectral features of the nitrate vibrational bands arise from the symmetry changes
of nitrate. Unperturbed nitrate ion has a D3h symmetry and is expected to exhibit a four-
band spectrum: SS band ν1(A1’) at ~1049 cm-1, out-of-plane deformation (OPD) band
ν2(A2”) at ~830 cm-1, AS ν3(E’) at ~1370 cm-1, and IPD ν4(E’) at ~719 cm-1.51,58,59 The
AS and IPD modes are both Raman and IR active, while the SS is Raman active only and
the OPD is IR active only. In aqueous solutions, the perturbation from metal cations and
water molecules causes a lowering of nitrate symmetry from D3h to C2v or Cs, resulting in
more vibrational bands.51,52,58 Vibrational bands in the SS and OPD regions become both
Raman and IR active, with frequencies similar to those of unperturbed nitrate. As shown
in Figure 4.2, the nitrate SS peak occurs in the IR spectra of the metal-nitrate aqueous
solutions and this peak amplifies as concentration increases. In the AS region two bands
are expected to arise from the lifting of degeneracy of the AS band as the nitrate
symmetry lowers, and two bands in the IPD region arise from the lifting of degeneracy of
the IPD. These are in accord with the results of our Raman spectra (Figure 4.1, for
instance). Two AS bands at ~1345 cm-1 and ~1420 cm-1 are observed in Raman spectra of
the nitrate aqueous solutions. Two IPD bands instead of one IPD band are present in the

29
Raman spectra of Ca(NO3)2, Sr(NO3)2, and Pb(NO3)2 solutions. The OPD band cannot be
observed in the Raman spectra of our concentration range. In the following paragraphs,
the spectral changes of the IPD, the SS, and the AS bands will be discussed in detail.
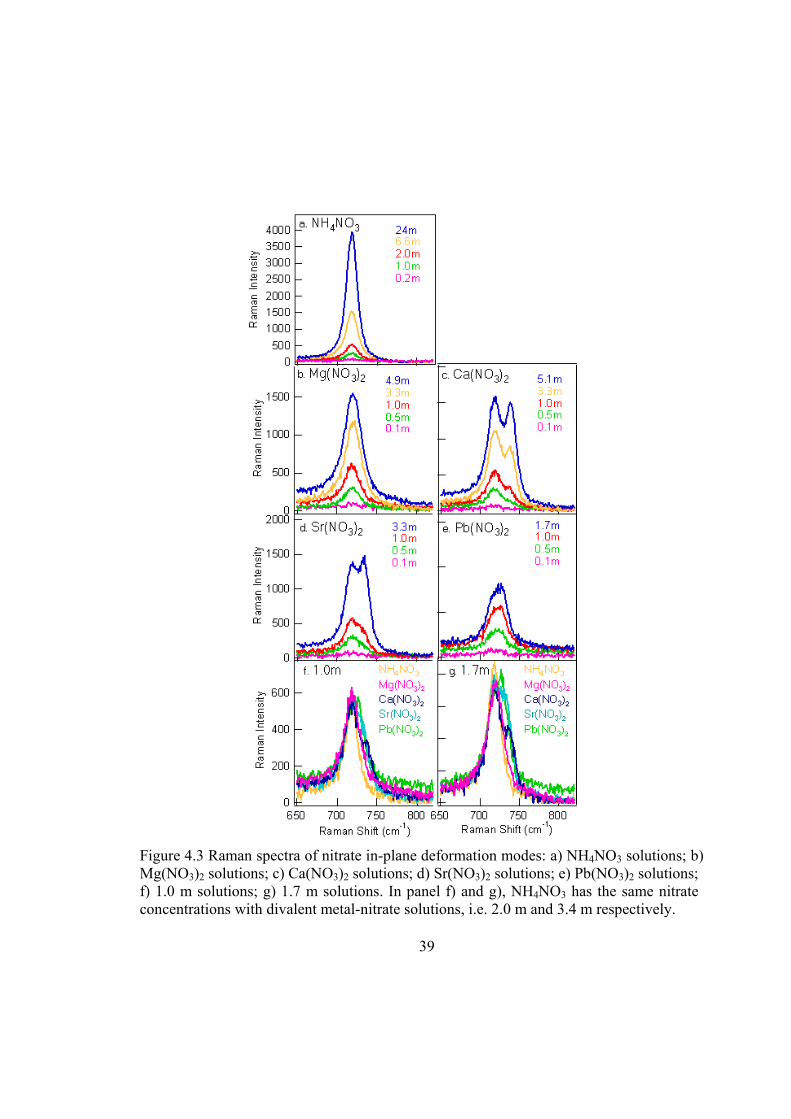
In-plane deformation. The splitting of the nitrate IPD band has been used as a
criterion for the CIP formation.45,56,59-61 The Raman spectra of the nitrate IPD modes of
NH4NO3, Mg(NO3)2, Ca(NO3)2, Sr(NO3)2, and Pb(NO3)2 are shown in Figure 4.3. The
Raman spectra of NH4NO3 solutions, in which the Coulombic perturbation of ammonium
cation on nitrate is relatively small, are shown for comparison. In the spectra of NH4NO3
solutions (Figure 4.3a), neither peak splitting nor frequency shift is observed, consistent
with the fact that nitrate is relatively “free” from NH4+ in aqueous solutions. As for
Mg(NO3)2 solutions, spectra in Figure 4.3b show no obvious peak splitting of the IPD in
our concentration range, but an increase in the band width, suggesting a low degree of
CIPs in the Mg(NO3)2 solutions.57,61 The slight frequency shift of the IPD band to higher
frequency (~1 cm-1) with increasing concentration of Mg(NO3)2 indicates the presence of
SSHIPs and/or SSIPs.59 The IPD band is not sensitive enough to differentiate between
SSHIPs and SSIPs. Detailed information of peak frequencies and areas is shown in Table
4.2. In the aqueous solutions of Ca(NO3)2, Sr(NO3)2, and Pb(NO3)2 (Figure 4.3c-e),
nitrate exhibits a single peak at 720 ± 1 cm-1 at concentration lower than 0.5 m. The
single IPD peak implies no or low degree of CIP formation between metal cations and
nitrate anions. As the concentration increases to 1.0 m, a shoulder appears at 738 cm-1,

30
732 cm-1, and 728 cm-1 for Ca(NO3)2, Sr(NO3)2, and Pb(NO3)2, respectively (Figure 4.3c-
f). With further increase in the concentration, this high frequency shoulder gradually
increases in intensity, and shifts to higher frequency. Notice here the high frequency side
of the IPD band for Pb(NO3)2 is at a lower frequency compared to Ca(NO3)2 and
Sr(NO3)2 (729 cm-1 versus 740 cm-1 and 735 cm-1 in saturated solutions, for example).
This may reflect differences in the polarizing power of the cations.45 The value 729 cm-1
is still within the range assigned to CIPs in aqueous solutions. Therefore, we assign the
low frequency component peak at ~718 cm-1 to the hydrated nitrate ions, containing
SSIPs and/or SSHIPs, and the high frequency component peak at 728-740 cm-1 to the
contact ion paired (CIPd) nitrate ions.
Figure 4.4a shows the relative peak intensity of the CIPd nitrate (the ratio of the
intensity of the ~740 cm-1 peak to the sum intensity of the ~720 cm-1 peak and the ~740
cm-1 peak) as a function of concentration for different metal-nitrate solutions. The
relative peak intensity has been used to estimate the percentage of the CIPd species in
previous studies, assuming that the molar Raman intensity remains the same for free and
ion paired forms of nitrate.45,56 Figure 4.4b reveals a linear correlation between the sum
intensity of the nitrate IPD bands and the molarity, which implies that the IPD intensity is
not sensitive to the relative amount of free or ion paired species. Therefore the
assumption used by Fleissner et al. is reasonable and the relative amount of the CIPd
nitrate species is then extracted from Figure 4.4a. For example, at concentration 3.3 m

31
there are 24% CIPd nitrate and 76% hydrated nitrate (may include SSIP and SSHIP) in
the Ca(NO3)2 solution. This is consistent with Irish and Walrafen.51 When comparing
different divalent metal-nitrate solutions with the same concentration, the degree of CIP
follows: Pb(NO3)2 > Sr(NO3)2 > Ca(NO3)2 > Mg(NO3)2. For instance, at concentration
1.7 m, 45% of nitrate in the Pb(NO3)2 solution is CIPd, and this number decreases to 31%
for Sr(NO3)2, 20% for Ca(NO3)2, and almost no CIP for Mg(NO3)2. The trend for
Sr(NO3)2, Ca(NO3)2, and Mg(NO3)2 in aqueous solutions agrees with Chang and Irish’s
studies,51,57 though in the glassy state the trend has been found to be Sr(NO3)2 >
Ca(NO3)2 ≈ Mg(NO3)2.45
Hydration by water molecules competes with cation-anion ion pairing.44,62,63 Having a
large ionic radius and a small surface charge density, Pb2+ binds to water molecules
relatively loosely compared to other dications. Therefore, it is relatively easy for nitrate
to enter the first hydration shell of Pb2+ to form CIPs. Mg2+, on the other hand, has a
small ionic radius and a large surface charge density. The hydrated ions of Mg(H2O)62+
are thus very stable.64 As shown in the left panel of Figure 4.1, the intermolecular metal-
water band at ~350 cm-1 predominates in the Raman spectrum of the Mg(NO3)2 aqueous
solution, indicating strong hydration of Mg2+ cations. Water molecules of the Mg2+
hydration shell compete against the nitrate anion successfully. Hence, a relatively low
degree of CIP is present in the Mg(NO3)2 aqueous solutions at room temperature. This is
consistent with results from the Raman IPD modes; the CIP formation between divalent
32
metal cations and nitrate anions decreases with increasing ionic surface charge density:
Pb2+ > Sr2+ > Ca2+ > Mg2+.
Symmetric stretch. The variation of the full width at half maximum (fwhm) and the
frequency of the nitrate SS band indicate the perturbation of metal cations on nitrate
anions via hydration water molecules. Figure 4.5 shows the Raman spectra of the nitrate
SS modes. Detailed fwhm and frequency values are listed in Table 4.3. As the
concentration increases from 0.5 m to saturate, the fwhm of the nitrate SS band increases
10-20% for divalent metal-nitrate solutions (Figure 4.5b-e, Table 4.3). For comparison, in
the case of NH4NO3 aqueous solutions, the SS fwhm variation is below 5% (Figure 4.5a,
Table 4.3). Vollmar65 has suggested that the increase in the fwhm is caused by the
breaking down of the solution structure, creating a more disordered environment for the
nitrate ions. In the studies of Zn(NO3)2 at high temperatures and pressures, it has been
proposed that the bound (ion-paired) nitrate species relaxes faster than the free species,
resulting in a larger bandwidth of the bound species.56,66 The increase in bandwidth
(Figure 4.5b-e) therefore can be explained by the interaction of the cation with the nitrate
anion, which causes faster relaxation. Nitrate and its counter cation have a stronger
tendency to form ion pairs at higher concentrations and, consequently, the long-range
Coulombic perturbation of metal cations on nitrate anions broadens the SS band. When
comparing different nitrate solutions with the same nitrate concentration (Figure 4.5f-g),
the fwhm follows a trend Pb(NO3)2 > Sr(NO3)2 ≈ Ca(NO3)2 > Mg(NO3)2 > NH4NO3. For

33
instance, the fwhms are 13.0 cm-1, 11.1 cm-1, 11.0 cm-1, 10.5 cm-1, and 8.0 cm-1 for
Pb(NO3)2, Sr(NO3)2, Ca(NO3)2, Mg(NO3)2, and NH4NO3, at molaility 1.7 m (NH4NO3
has concentration 3.4 m). This trend implies strong Coulombic effects of Pb2+ on nitrate
relative to Sr2+, Ca2+, and Mg2+. Nitrate is almost free from NH4+ Coulombic effects.
Peak position of the nitrate SS band is also concentration dependent and cation
dependent. For Mg(NO3)2, Ca(NO3)2, and Sr(NO3)2 aqueous solutions, the frequency
slightly blue shifts from 1049 cm-1 at 0.1 m to 1050 cm-1 at saturated concentrations
(Figure 4.5b-d). Interestingly, the SS frequency red shifts as concentration increases in
Pb(NO3)2 solutions (Figure 4.5e). For different salt solutions with the same concentration,
the peak position of Pb(NO3)2 is always at lower frequency compared to other metal
cations (Figure 4.5f-g). Similar shifts of the SS band are observed in the infrared spectra
(Figure 4.2; peak positions of the SS in the IR spectra are listed in Table 4.4).
The blue shift of the SS band for Mg(NO3)2, Ca(NO3)2, and Sr(NO3)2 and the red shift
for Pb(NO3)2 can be interpreted by two competitive forces: the weakening of the nitrate-
water hydrogen-bonding that causes a SS blue shift, and the ion pairing between metal
cation and nitrate that results in a red shift of the SS. On one hand, metal cations in
aqueous solutions interact with or even replace water molecules around nitrate, resulting
in a weakening of the nitrate-water hydrogen-bonding. Nitrate-water hydrogen-bonding
(water solvation) usually decreases the frequency of the nitrate SS vibration.65 Therefore,
the weakening of the nitrate-water hydrogen-bonding leads to a blue shift of the nitrate

34
SS band. On the other hand, the strong cation-nitrate interaction weakens the covalent N-
O bond, and causes a red shift of the nitrate SS band66. In the case of Mg(NO3)2,
Ca(NO3)2, and Sr(NO3)2 solutions, the effects of weakening nitrate-water hydrogen-
bonding dominate. Consequently, the nitrate SS band blue shifts as concentration
increases in their aqueous solutions. Similar frequency shifts have been observed in
previous studies of nitrate and sulfate.45,59,63,65,67,68 For Pb(NO3)2 aqueous solutions,
however, the effects of metal-nitrate interaction dominate. Having a large ionic radius
and a relatively small surface charge density, Pb2+ binds water molecules relatively
loosely compared to other dications used in this study. The Coulombic perturbation of
Pb2+ on nitrate exceeds the effect of nitrate-water hydrogen-bond weakening. Similar red
shifts have been observed for Pb(NO3)2-N-methylacetamide solutions and Zn(NO3)2
aqueous solutions.56,66,69 In the case of NaNO3, though the surface charge density of Na+
is smaller than that of Pb2+ (0.76 vs. 1.12), a blue shift rather than a red shift is observed,
as shown in Figure 4.6. This phenomenon reflects the differences between monovalent
and divalent metal ions. Low surface charge density of Na+ leads to weak Na+-water
binding. Meanwhile, the Na+-nitrate interaction is even weaker as a result of the single
charge of Na+ cations. It is the relative strengths of these two competitive effects that
dictate the direction of the frequency shift of the nitrate SS band.
Asymmetric stretch. Unperturbed nitrate gives rise to a single asymmetric stretching
ν3(E’) band at ~1370 cm-1.49,53,61 In the aqueous nitrate solutions, two AS component

35
peaks are observed, as shown in Figure 4.1 and 4.7. Unlike the IPD modes, the
degeneracy of the AS modes is caused by perturbation from water molecules as well as
long-range Coulombic perturbation from cations.53,59-61,69 Ab initio calculations on
isolated complexes of nitrate ion with a single water molecule have identified two
structures with C2v and Cs symmetries. In both symmetries the two component peaks of
the AS are separated by ~50 cm-1, which is consistent with the minimal splitting in dilute
aqueous solutions detected by previous experimental studies.49,70,71 In the present study,
the separation of the two component peaks varies from 63 cm-1 for 0.5 m Mg(NO3)2 to 90
cm-1 for saturated Pb(NO3)2 (Figure 4.7a-g), suggesting the cation Coulombic effects on
nitrate. Detailed peak separation values are listed in Table 4.5. (In the aqueous solutions
of NH4NO3, the separation is in the range 63 to 69 cm-1, which may suggest that nitrate is
not totally but relatively free from the Coulombic effects of NH4+.) It is important to note
that effects from cations and water molecules coexist in aqueous solutions, and the
perturbation from water varies as concentration changes. The peak separation of the
nitrate AS modes is therefore not an accurate measurement for the strength of ion pairing.
However, considering the magnitude of the difference, Pb(NO3)2 has the largest peak
separation among these metal-nitrate solutions (Figure 4.7f-g). We therefore conclude
that Pb2+ has the strongest tendency to form ion pairs with nitrate compared to the other
cations in this work. This is consistent with the results from the IPD and the SS modes
discussed above.

36
4.4 Conclusions
Studies of the divalent metal-nitrate aqueous solutions, Mg(NO3)2, Ca(NO3)2,
Sr(NO3)2, and Pb(NO3)2, were conducted using Raman and infrared spectroscopies. The
perturbation of metal-nitrate ion pairing and water hydration lowers the symmetry of
nitrate. Therefore peak shifting, splitting, and broadening are observed in the Raman and
IR spectra of the nitrate aqueous solutions. Analysis of the spectral features reveal that
Pb2+ has a strong tendency to form ion pairs with nitrate relative to Sr2+, Ca2+, and Mg2+,
and contact ion pair formation decreases with decreasing cation size and increasing cation
charge density: Pb2+ > Sr2+ > Ca2+ > Mg2+. The effects of Mg2+ and Ca2+ on ion paring
are significantly different. Recent molecular dynamics simulations72 showed that the
contact ion pairing in Mg(NO3)2 is thermodynamically unfavorable because there is a
large activation barrier to remove water from the first hydration shell of Mg2+ and to form
a contact ion pair; whereas in Ca(NO3)2 the contact ion pairing is preferred over the
solvent-shared and solvent-separated ion pairing due to the low free energy of the contact
ion pair formation. This provides thermodynamic support to our spectroscopic results.
37
Figure 4.1 Raman spectra of saturated aqueous solutions of Mg(NO3)2, Ca(NO3)2, Sr(NO3)2, and Pb(NO3)2. The inset: Raman spectra of the nitrate symmetric stretch modes. Water spectrum is shown in gray in the left panel for comparison.

38
Figure 4.2 IR spectra of nitrate symmetric stretching modes: a) Mg(NO3)2 solutions; b) Ca(NO3)2 solutions; c) Sr(NO3)2 solutions; d) Pb(NO3)2 solutions.
39
Figure 4.3 Raman spectra of nitrate in-plane deformation modes: a) NH4NO3 solutions; b) Mg(NO3)2 solutions; c) Ca(NO3)2 solutions; d) Sr(NO3)2 solutions; e) Pb(NO3)2 solutions; f) 1.0 m solutions; g) 1.7 m solutions. In panel f) and g), NH4NO3 has the same nitrate concentrations with divalent metal-nitrate solutions, i.e. 2.0 m and 3.4 m respectively.

40
Figure 4.4 Raman intensities of nitrate in-plane deformation modes as a function of concentration: a) relative intensity of the contact ion paired nitrate as a function of molality; b) sum intensity of the free and ion paired nitrate as a function of molarity.

41
Figure 4.5 Raman spectra of nitrate symmetric stretching modes: a) NH4NO3 solutions; b) Mg(NO3)2 solutions; c) Ca(NO3)2 solutions; d) Sr(NO3)2 solutions; e) Pb(NO3)2 solutions; f) 1.0 m solutions; g) 1.7 m solutions. In panel a), exposure time 25 s instead of 50 s was used for 24 m NH4NO3 because of the saturation issue. In panel f) and g), NH4NO3 has the same nitrate concentrations with dication nitrate solutions, i.e. 2.0 m and 3.4 m respectively.

42
Figure 4.6 Nitrate symmetric stretching peaks in Raman spectra of NaNO3 solutions.
43
Figure 4.7 Raman spectra of nitrate asymmetric stretching modes: a) NH4NO3 solutions; b) Mg(NO3)2 solutions; c) Ca(NO3)2 solutions; d) Sr(NO3)2 solutions; e) Pb(NO3)2 solutions; f) 1.0m solutions; g) 1.7m solutions. In panel f) and g), NH4NO3 has the same nitrate concentrations with dication nitrate solutions, i.e. 2.0 m and 3.4 m respectively.

44
Molarity (moles per liter) Molality
(moles per kg of water)
Salt Mole Fraction (m.f.) Mg(NO3)2 Ca(NO3)2 Sr(NO3)2 Pb(NO3)2
0.10 0.0018 0.089 0.092 0.10 0.10 0.50 0.0089 0.47 0.46 0.49 0.49 1.0 0.018 0.88 0.90 0.96 0.94 1.7 0.030 1.3 1.4 1.6 1.6 2.6 0.045 1.9 2.0 2.3 - 3.3 0.056 2.2 2.3 2.7 - 4.9 0.081 2.8 - - - 5.1 0.084 - 3.2 - -
Table 4.1 Concentrations of the nitrate aqueous solutions.

45
0.5 m 1 m 1.7 m
Position (cm-1) Area Position (cm-1) Area
Position Area #1 #2 #1 #2 #1 #2 #1 #2
NH4NO31 718.0 6662 718.1 - 12623 - 718.2 - 21496 -
Mg(NO3)2 719.0 8007 718.8 - 16535 - 719.9 - 21943 - Ca(NO3)2 719.0 10188 718.6 738.2 16241 3276 718.6 738.4 19972 5139Sr(NO3)2 720.4 9429 717.8 732.3 14850 3926 717.9 733.5 19132 8478Pb(NO3)2 721.1 6168 716.6 727.8 10327 6634 716.7 729.3 12673 10169
3.3 m Saturated Position (cm-1) Area Position (cm-1) Area #1 #2 #1 #2 #1 #2 #1 #2
NH4NO31 718.3 - 39324 - 718.2 - 88443 -
Mg(NO3)2 720.4 - 37953 - 720.1 - 48296 - Ca(NO3)2 719.1 739.5 32589 10262 718.5 739.7 41380 23187 Sr(NO3)2 718.4 734.9 33914 19443 718.4 734.9 33914 19443 Pb(NO3)2 - - - - 716.7 729.3 12673 10169
Table 4.2 Curve-fitting results of nitrate in-plane deformation bands in Raman spectra.
1 NH4NO3 has the same nitrate concentration as the divalent cation-nitrate solutions. The concentrations for NH4NO3 solutions are 1 m, 2 m, 3.4 m, 6.6 m and saturated.

46
0.5 m 1.0 m 1.7 m Position (cm-1)
FWHM (cm-1)
Position(cm-1)
FWHM (cm-1)
Position (cm-1)
FWHM (cm-1)
NH4NO32 1047.9 7.9 1047.8 7.9 1047.8 8.0
Mg(NO3)2 1048.9 9.9 1048.9 10.3 1049.9 10.5 Ca(NO3)2 1048.7 10.2 1049.1 10.6 1049.9 11.0 Sr(NO3)2 1049.0 10.1 1049.5 10.7 1050.5 11.1 Pb(NO3)2 1046.9 12.2 1046.3 12.8 1046.1 13.0
3.3 m Saturated Position
(cm-1) FWHM (cm-1)
Position(cm-1)
FWHM (cm-1)
NH4NO32 1047.8 8.1 1047.6 8.5
Mg(NO3)2 1050.5 11.1 1050.2 11.8 Ca(NO3)2 1050.4 11.8 1050.3 12.8 Sr(NO3)2 1050.6 12.1 1050.6 12.1 Pb(NO3)2 - - 1046.1 13.0
Table 4.3 Curve-fitting results of nitrate symmetric stretching bands in Raman spectra.
2 NH4NO3 has the same nitrate concentration as the divalent cation-nitrate solutions. The concentrations for NH4NO3 solutions are 1 m, 2 m, 3.4 m, 6.6 m and saturated.
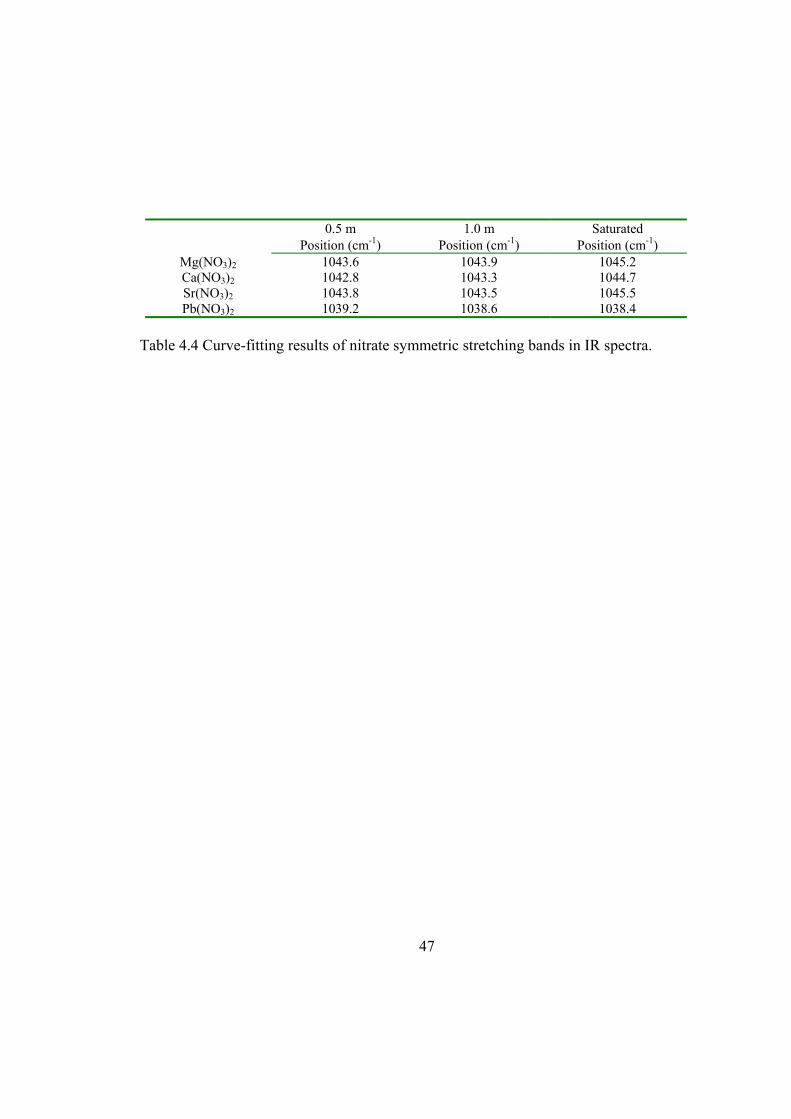
47
0.5 m 1.0 m Saturated
Position (cm-1) Position (cm-1) Position (cm-1) Mg(NO3)2 1043.6 1043.9 1045.2 Ca(NO3)2 1042.8 1043.3 1044.7 Sr(NO3)2 1043.8 1043.5 1045.5 Pb(NO3)2 1039.2 1038.6 1038.4
Table 4.4 Curve-fitting results of nitrate symmetric stretching bands in IR spectra.

48
0.5 m 1.0 m 1.7 m Position (cm-1)
Position (cm-1)
Position (cm-1)
#1 #2
Separation #1 #2
Separation #1 #2
Separation
NH4NO33 1343.4 1406.7 63.3 1336.5 1405.6 69.1 1337.3 1406.3 69.0
Mg(NO3)2 1344.7 1407.9 63.2 1344.5 1410.7 66.2 1342.3 1409.1 66.8 Ca(NO3)2 1350.8 1415.2 64.4 1347.4 1415.1 67.7 1348.0 1418.9 70.9 Sr(NO3)2 1347.3 1412.2 64.9 1350.8 1415.3 64.5 1353.0 1418.1 65.1 Pb(NO3)2 1335.4 1418.3 82.9 1335.8 1423.3 87.5 1336.3 1426.7 90.4
3.3 m Saturated Position
(cm-1) Position (cm-1)
#1 #2
Separation #1 #2
Separation
NH4NO33 1333.8 1403.5 69.7 1335.9 1406.2 70.3
Mg(NO3)2 1344.3 1412.0 67.7 1344.1 1412.6 68.5 Ca(NO3)2 1349.2 1426.0 76.8 1349.6 1430.9 81.3 Sr(NO3)2 1354.4 1421.5 67.1 1354.4 1421.5 67.1 Pb(NO3)2 - - - 1336.3 1426.7 90.4
Table 4.5 Curve-fitting analysis of nitrate asymmetric stretching bands in Raman spectra.
3 NH4NO3 has the same nitrate concentration as the divalent cation-nitrate solutions. The concentrations for NH4NO3 solutions are 1 m, 2 m, 3.4 m, 6.6 m and saturated.
49
CHAPTER 5
NITRATE IONS AND ION PAIRING AT THE AIR-AQUEOUS INTERFACE
The nature of nitrate ions at the air-aqueous interface has received special attention
recently because of the growing awareness of their key role in the surface chemistry of
atmospheric aerosols and aqueous systems.6,10,19,21 Nitrate ions are ubiquitous in aqueous-
phase atmospheric aerosols from the polluted to the remote troposphere, and are involved
in a variety of atmospheric heterogeneous reactions.1,4-6,9,10 Meanwhile, nitrate plays an
important role in aqueous geochemistry, and has potential toxicities to humans and other
animals. Thus, a fundamental understanding of nitrate at air-aqueous interfaces may
provide insight into the role of nitrate ions at the surface of water systems and aqueous-
phase atmospheric aerosols.
In the work reported here, for the first time, a vibrational mode of the nitrate ion at
the air-aqueous interface is directly probed by an interface specific technique, vibrational
sum frequency generation spectroscopy. Kido Soule et al.73 have studied nitric acid in a
different spectral region. Other previous VSFG studies of nitrate aqueous solutions
mainly focused on the influence of ions on the interfacial water structure.74 Our VSFG
study directly probes nitrate at the interface and reveals that the interfacial nitrate anion
follows bulk ion pairing trends with Mg2+−nitrate ion pairing weaker than Ca2+−nitrate

50
and Sr2+−nitrate ion pairing.72 Ion pairing refers to the interaction and association of
oppositely charged ions,42,75 where the long-range electrostatic Coulombic forces play a
major role.42 Mg(NO3)2 is particularly interesting at the air-aqueous interface. We
observed two distinct nitrate populations for aqueous Mg(NO3)2 solution interfaces,
where the population defines the extent of ion-ion interaction. The amount of relatively
free nitrate ions (negligible ion-ion interaction) at the air-aqueous interface becomes
significant at lower bulk concentration of Mg(NO3)2. This phenomenon is not observed in
the bulk. It appears that the number of water molecules available to solvate the nitrate ion
plays a pivotal role for ion pairing, or lack of it, at the air-aqueous interface.
5.1 Materials
Nitrate salts, Mg(NO3)2, Ca(NO3)2, and Sr(NO3)2, were purchased from Fisher
Scientific. Nanopure water with resistivity 18.0-18.3 MΩ cm was used to make the
aqueous solutions. To remove organic impurities, aqueous solutions were filtered three to
six times by using a carbon filter (Whatman Carbon-Cap 150). VSFG spectra in the 2800
cm-1 to 3000 cm-1 region were obtained to check for organic impurities in these nitrate
aqueous solutions.
Solutions of concentrations 2.6 m and 3.3 m were studied in this work. According to
densities of nitrate solutions at room temperature (297 K), 2.6 m corresponds to 0.045 m.f.
(salt mole fraction) for all salts, and 1.9 M (mol/L) for Mg(NO3)2, 2.0 M for Ca(NO3)2,

51
and 2.3 M for Sr(NO3)2; 3.3 m corresponds to 0.056 m.f. for all salts, and 2.2 M for
Mg(NO3)2, 2.3 M for Ca(NO3)2, and 2.7 M for Sr(NO3)2 (see Table 4.1).
5.2 Experimental Method
The VSFG spectra presented in this chapter were acquired using the 20 Hz scanning
VSFG system (EKSPLA). The polarizations were ssp for the sum frequency, visible and
infrared pulses, respectively. The VSFG spectra were acquired using a 30 s exposure time
for each data point and were normalized to the real-time IR profile. All VSFG spectra
shown in this chapter are an average of four to six replicate spectra.
Complementary to the VSFG study that provides interfacial information, the Raman
and IR spectra of the nitrate bulk solutions were obtained. In the Raman instrumentation,
a 785 nm light from a continuous wave laser (Raman System Inc.) was used for sample
illumination. The power of the 785 nm light was ~240 mW. The slit width of the
monochromator entrance slit was 50 µm, the grating used was 600 grooves/mm, and the
resolution was 3.2 cm-1. Raman spectra were collected with an exposure time of 50 s. In
the IR experiments, a 45° single-bounce ZnSe crystal trough was employed to collect the
IR spectra. Additional details of VSFG, Raman and IR instrumentation are in Chapter 3.
In the curve-fitting analysis, the VSFG spectra were fit with the peak-fitting function
in IgorPro 4.05A software (WaveMetrics, Inc.) using a home-written program to
incorporate phase.41 The mathematical model describing the profile of bands was the

52
Lorentzian model. Detailed information of VSFG curve-fitting analysis is shown in
Chapter 3. In the fit of nitrate VSFG spectra, standard deviations of the experimental data
were considered and included as the weighting factor.
5.3 Results and Discussion
Figure 5.1 shows the ssp-polarized VSFG spectra of Mg(NO3)2 aqueous solutions at
the air-aqueous interface. In the spectrum of the 2.6 m Mg(NO3)2 aqueous solution
(Figure 5.1a), a peak at 1063 cm-1 and a shoulder at 1047 cm-1 are observed, whereas in
the spectrum of the 3.3 m Mg(NO3)2 solution (Figure 5.1b) the dominant peak position is
at 1047 cm-1. To assign the observed VSFG peaks, Raman and IR spectra were obtained
from the Mg(NO3)2 aqueous solutions, as shown in Figure 5.2. The peaks at 1050 cm-1 in
the Raman spectra (Figure 5.2a) and 1044 cm-1 in the IR spectra (Figure 5.2b) are
assigned to the symmetric stretch modes of nitrate. For free nitrate with a D3h symmetry,
the symmetric stretch band is IR inactive.51,58 The symmetric stretch however occurs in
the IR spectra (Figure 5.2b) as a result of the perturbation of cations and/or water
molecules that lowers the symmetry of nitrate.51,58,59 The noncoincidence between Raman
and IR frequencies may arise from the strong intermolecular resonant vibrational
coupling that leads to rapid transfer of vibrational excitations in the time domain and
delocalization of vibrational modes in the frequency domain.76,77 Therefore, the peaks
around 1047 cm-1 and 1063 cm-1 in the VSFG spectra of Mg(NO3)2 (Figure 5.1) are
53
assigned to the symmetric stretch modes of nitrate anions at the air-aqueous interface.
In Figure 5.1a and b the dominant VSFG peak position of the nitrate symmetric
stretch has changed from 1063 cm-1 to 1047 cm-1 as the bulk concentration of Mg(NO3)2
increases from 2.6 m to 3.3 m. Unlike VSFG spectra that provide vibrational information
at the interface, Raman and IR spectra shown in Figure 5.2 provide bulk information.
Raman spectra (Figure 5.2a) show only a slight frequency shift of the nitrate symmetric
stretch band from 1049 cm-1 to 1050 cm-1 when Mg(NO3)2 concentration increases from
2.6 m to 3.3 m. In the IR spectra (Figure 5.2b), a similar frequency shift (from 1044 cm-1
to 1045 cm-1) is observed. When the concentration of Mg(NO3)2 varies in a much broader
range (0.5 m to saturated), the frequency shift is less than 2 cm-1 (see Figure 4.5b and
Table 4.3 in the previous chapter). Note in both Raman and IR spectra the symmetric
stretch peak shifts 1-2 cm-1 to higher frequency with increasing concentration. This blue
shift has been interpreted by the weakening of the nitrate-water hydrogen-bonding.65,72 In
the VSFG spectra, there are two resolvable component peaks that are 16 cm-1 apart,
where the 1063 cm-1 peak and the 1047 cm-1 peak are dominant for the 2.6 m and 3.3 m
Mg(NO3)2 solutions, respectively. The VSFG shift in frequency for the dominant peak is
opposite to what is observed in the bulk studies. Therefore, the 16 cm-1 frequency change
of the nitrate symmetric stretch band in the VSFG spectra cannot be simply explained by
a bulk-like ion pairing trend. Only the 3.3 m symmetric stretch frequency is similar to the
observed bulk symmetric stretch frequencies, whereas the 2.6 m symmetric stretch

54
frequency has never before been observed for either interfacial or bulk aqueous
Mg(NO3)2. Clearly, at the lower 2.6 m solution air-aqueous interface, unique behavior is
observed. Deconvolution of the symmetric stretch peak further confirms a two-
component band, consisting of two populations.
At the air-aqueous interface, the two populations associated with the component
bands at 1047 cm-1 and 1063 cm-1 are ion-paired and relatively free nitrate, respectively.
Nitrate anions located in the air-aqueous interfacial region attract Mg2+ cations toward the
interface. This interface-driving electroneutrality force competes with the bulk-driving
electrostatic force.20,78 According to previous theoretical and experimental studies,
Mg(NO3)2 aqueous solutions are well-behaved, close-to-ideal solutions with extensive
ion-water mixing and virtually no formation of contact ion pairs between Mg2+ and
nitrate.20,59,72 At the air-aqueous interface, nitrate anions exhibit only a very weak
propensity for the interface, as suggested by previous MD simulations.20,21,78 The VSFG
data presented here reveal that the electroneutrality effect of nitrate within the interface
on Mg2+ is relatively weak, and the electrostatic repulsion of Mg2+ from the interface
dominates. It is well accepted that small “hard” Mg2+ ions are strongly repelled from the
air-aqueous interface, in accord with classical theory of electrolyte surfaces.20,79 In the 2.6
m Mg(NO3)2 aqueous solution, Mg2+ cations reside preferentially deep in the bulk. The
Coulombic interaction and the ion pairing between Mg2+ and interfacial nitrate is
relatively weak, as just discussed. A lack (or significant weakening) of interaction would

55
reasonably shift the nitrate symmetric stretch to higher frequency compared with the
nitrate ions where the interaction is stronger at the air-aqueous interface of the 3.3 m
Mg(NO3)2 solution. Recently, Thomas et al.21 found that for nitrate anions that approach
the air-aqueous interface there is a decrease in the number of water molecules
coordinating to the interfacial nitrate relative to the bulk nitrate. The low coordination
number could shift the nitrate symmetric stretch peak to higher frequency compared to
the bulk. However, this would also be expected to occur for the 3.3 m Mg(NO3)2 solution,
but is not observed in the VSFG spectrum (Figure 5.1b). In fact, the 1047 cm-1 peak
position that dominates the 3.3 m solution is close to which is observed in bulk studies.
Therefore, we conclude that the electrostatic repulsion of Mg2+ from the interface is the
dominant effect that results in a weak Columbic interaction between Mg2+ and interfacial
nitrate for 2.6 m Mg(NO3)2 solution. Hence, at the air-aqueous interface, the VSFG
frequency at 1063 cm-1 is assigned to the symmetric stretch of relatively free interfacial
nitrate species, and the component peak at 1047 cm-1 is assigned to the symmetric stretch
of ion-paired interfacial nitrate, likely a SSIP or SSHIP.
The 1063 cm-1 peak has not been observed from Raman or IR Mg(NO3)2 ion pairing
studies. The assignment of this peak frequency to a relatively free nitrate anion allows us
to further shed light on bulk studies. Although Mg2+ has been considered to be ineffective
at ion pairing with nitrate from previous bulk studies,57,59 it is not. This is clearly
demonstrated by the present work, which reveals that ion pairing dominates at the air-

56
aqueous interface of the 3.3 m Mg(NO3)2 solution, and provides additional reference
frequencies for perturbed nitrate. Therefore, ion-ion interactions are stronger than
previously thought in the bulk Mg(NO3)2 aqueous solutions.
To better understand the VSFG spectra of 2.6 m and 3.3 m Mg(NO3)2 solutions,
curve-fitting analysis was completed for nitrate symmetric stretch modes. Component
peaks at 1047 cm-1 and 1063 cm-1 were employed in the curve-fitting analysis. Curve-
fitting results are presented in Table 5.1 and component peaks are shown in red dashed
lines in figures. In the VSFG spectrum of 2.6 m Mg(NO3)2, the component peak at 1063
cm-1 is the dominant peak, and the area ratio of the peak at 1047 cm-1 to the peak at 1063
cm-1 is 0.12. Recall that VSFG intensity is related to orientation and is proportional to the
square of the interfacial number density. Assuming that the interfacial nitrate orientation
relative to the surface normal remains constant for relatively free and ion-paired nitrate,21
the surface number density ratio of ion-paired to relatively free nitrate (SDRIP/free) is
therefore 0.34. In other words, the majority of interfacial nitrate ions are relatively free at
the air-aqueous interface of a 2.6 m Mg(NO3)2 aqueous solution.
As the concentration of the Mg(NO3)2 solution increases, the Coulombic interaction
as well as the ion pairing between Mg2+ cations and interfacial nitrate anions becomes
stronger and the number of water molecules available for ion solvation decreases. Note
that the 2.6 m (0.045 m.f.) solution has approximately one more water molecule per ion
relative to the 3.3 m (0.056 m.f.) solution, that is, at 2.6 m there are seven water

57
molecules per ion (cation or anion), and at 3.3 m there are six water molecules per ion. At
concentration 3.3 m, more Mg2+ cations are forced to approach the air-aqueous interface
relative to the 2.6 m solution. The interfacial nitrate is therefore more ion-paired for the
3.3 m Mg(NO3)2 solution. According to our curve-fitting results and obvious from the
spectrum (Figure 5.1b, Table 5.1), the SDRIP/free is 1.7 at the air-aqueous interface of 3.3
m Mg(NO3)2. The ion-paired nitrate, SSIP or SSHIP, becomes the dominant interfacial
species at the air-aqueous interface of the 3.3 m Mg(NO3)2 solution.
Interestingly, the total peak intensity of the 3.3 m Mg(NO3)2 aqueous solution is not
higher than that of the 2.6 m Mg(NO3)2 solution as one might expect. Recall that the
VSFG intensity depends on the square of the number density of interfacial molecules,
their orientation, and the Raman and IR transition strengths of the vibrational mode.22-25
As indicated in the Raman and IR intensities shown in Figure 5.3, there is no significant
change in transition moment strengths for the low frequency peak with concentration.
However, the 1063 cm-1 component peak has not been observed in bulk systems. An
argument can be made for a change in interfacial number densities of nitrate ions if one
assumes negligible orientation changes. Based on previous computational studies,21 the
interfacial nitrate ions are preferentially oriented with the plane of nitrate parallel to the
interface. The assumption of negligible orientation changes of interfacial nitrate is thus
reasonable. Therefore, the VSFG data suggests a larger number density of interfacial
nitrate ions for the lower concentration Mg(NO3)2 solution, 2.6 m.
58
The VSFG spectra of Ca(NO3)2 and Sr(NO3)2 solutions at the air-aqueous interface
are somewhat different relative to the Mg(NO3)2 solutions. The VSFG spectra of
Ca(NO3)2 and Sr(NO3)2 with concentrations 2.6 m and 3.3 m are shown in Figure 5.4.
According to these spectra and curve-fitting results (Table 5.1), the dominant symmetric
stretch peak of nitrate is at 1047 cm-1 rather than 1063 cm-1, and the SDRIP/free varies from
2.4 to 4.5, indicating that the dominant interfacial nitrate species are ion-paired rather
than free for Ca(NO3)2 and Sr(NO3)2 solutions. If we compare Mg(NO3)2, Ca(NO3)2, and
Sr(NO3)2 with the same concentration, 3.3 m, the VSFG results show that the SDRIP/free is
1.7 for Mg(NO3)2, 2.8 for Ca(NO3)2, and 4.5 for Sr(NO3)2. At the air-aqueous interface,
the strong Coulombic cation-nitrate interaction results in more ion-paired nitrate for
Sr(NO3)2 and Ca(NO3)2 solutions compared to Mg(NO3)2 solution of the same
concentration. The trend of the Coulombic interaction with nitrate, Sr2+ > Ca2+ > Mg2+, is
similar to previous bulk ion pairing studies,51,57,72 where Ca2+ and Sr2+ have been found to
have a stronger tendency to form ion pairs with NO3- in aqueous solutions, with
Sr2+−nitrate ion pairing slightly stronger than Ca2+−nitrate ion pairing.
5.4 Conclusions
The air-aqueous interface of divalent metal-nitrate solutions was investigated using
vibrational sum frequency generation spectroscopy. Sum frequency results reveal a lack
of ion-ion interaction, and thus, lack of ion-pairing at the air-aqueous interface for a 2.6

59
m (0.045 m.f.) aqueous solution of Mg(NO3)2. Results also suggest that full solvation, or
lack of it, at the air-aqueous interface of Mg(NO3)2 solutions has significant implications
for ion pairing between interfacial nitrate and the small, densely charged Mg2+ cation.
The interface appears to be highly sensitive, particularly when full solvation of the
interfacial anion is compromised. The fact that relatively free nitrate anions exist at the
air-aqueous interface is surprising.

60
Figure 5.1 VSFG spectra of aqueous Mg(NO3)2 solutions with ssp polarization: a) 2.6 m Mg(NO3)2; b) 3.3 m Mg(NO3)2. Pink circles: experimental data with error bars; pink solid lines: overall fits; red dashed lines: Lorentzian component peaks.

61
Figure 5.2 Raman and IR spectra of aqueous Mg(NO3)2 solutions with concentration 2.6 m and 3.3 m: a) Raman spectra; b) IR spectra. Coloring scheme: 2.6 m Mg(NO3)2, pink; 3.3 m Mg(NO3)2, green.

62
Figure 5.3 Raman (a) and IR (b) intensities of nitrate symmetric stretch peak as a function of concentration.
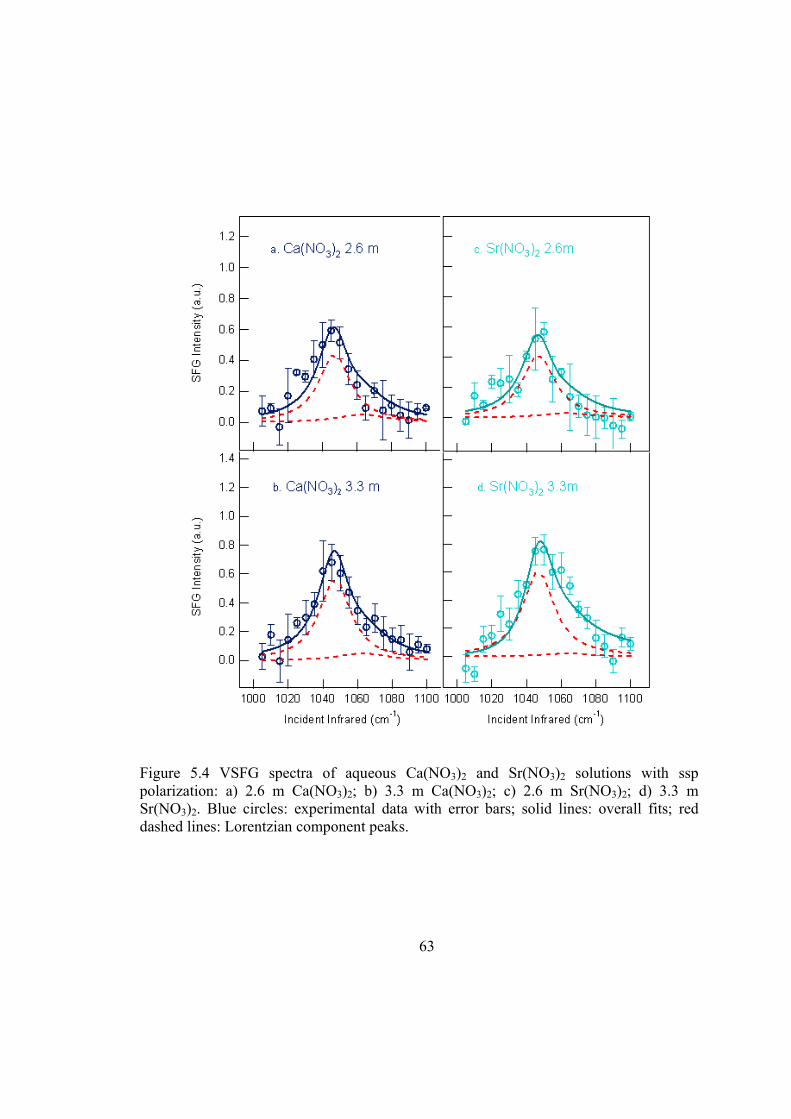
63
Figure 5.4 VSFG spectra of aqueous Ca(NO3)2 and Sr(NO3)2 solutions with ssp polarization: a) 2.6 m Ca(NO3)2; b) 3.3 m Ca(NO3)2; c) 2.6 m Sr(NO3)2; d) 3.3 m Sr(NO3)2. Blue circles: experimental data with error bars; solid lines: overall fits; red dashed lines: Lorentzian component peaks.

64
Non-resonant terms
Molality
(m) Real Imaginary
I1047 hwhm1047 I1063 hwhm1063 I1047/I1063 SDRIP/free
2.6 0.002 0.01 2.9 10.9 25.0 16.8 0.12 0.34 Mg(NO3)2 3.3 0.002 0.01 14.1 10.9 4.7 16.8 3.0 1.7
2.6 0.002 0.01 13.0 10.9 2.2 16.8 5.9 2.4 Ca(NO3)2 3.3 0.002 0.01 16.8 10.9 2.1 16.8 8.0 2.8
2.6 0.002 0.01 12.5 10.9 1.3 16.8 9.6 3.1 Sr(NO3)2 3.3 0.002 0.01 18.3 10.9 0.91 16.8 20 4.5
Table 5.1 Curve-fitting results of nitrate VSFG spectra. Surface number density ratio of ion-paired to relatively free nitrate (SDRIP/free) is shown.
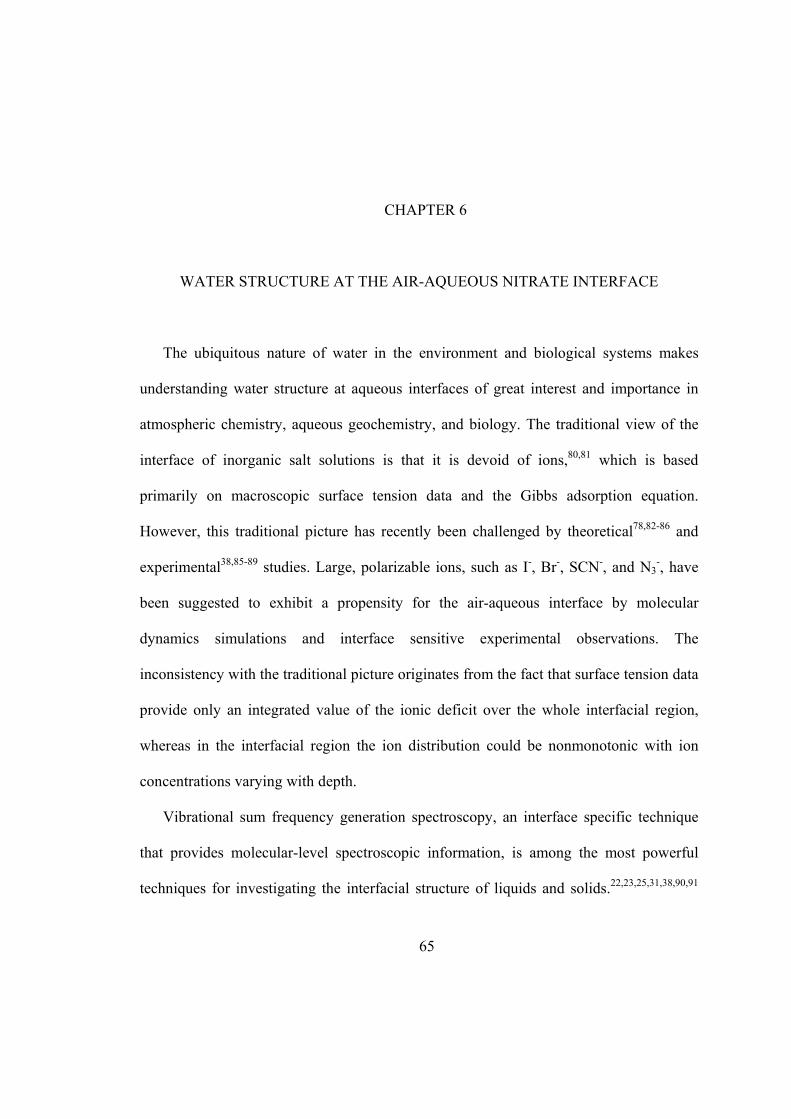
65
CHAPTER 6
WATER STRUCTURE AT THE AIR-AQUEOUS NITRATE INTERFACE
The ubiquitous nature of water in the environment and biological systems makes
understanding water structure at aqueous interfaces of great interest and importance in
atmospheric chemistry, aqueous geochemistry, and biology. The traditional view of the
interface of inorganic salt solutions is that it is devoid of ions,80,81 which is based
primarily on macroscopic surface tension data and the Gibbs adsorption equation.
However, this traditional picture has recently been challenged by theoretical78,82-86 and
experimental38,85-89 studies. Large, polarizable ions, such as I-, Br-, SCN-, and N3-, have
been suggested to exhibit a propensity for the air-aqueous interface by molecular
dynamics simulations and interface sensitive experimental observations. The
inconsistency with the traditional picture originates from the fact that surface tension data
provide only an integrated value of the ionic deficit over the whole interfacial region,
whereas in the interfacial region the ion distribution could be nonmonotonic with ion
concentrations varying with depth.
Vibrational sum frequency generation spectroscopy, an interface specific technique
that provides molecular-level spectroscopic information, is among the most powerful
techniques for investigating the interfacial structure of liquids and solids.22,23,25,31,38,90,91

66
The work in Chapter 5 directly probed nitrate ions and metal-nitrate ion pairing at the
aqueous interface. The presence of these ions and the formation of ion pairs may have
considerable effects on the hydrogen-bonded structure of water at the air-aqueous
interface. Therefore, the aim of the work presented in this chapter is to elucidate the
perturbation of nitrate anions, metal cations, and ion pairs on water structure at the air-
aqueous interface by investigating water OH stretching modes. The sum frequency
spectral changes indicate different effects of cations, Mg2+, Ca2+, and Sr2+, on the
interfacial water hydrogen-bonding network. A thickening of the air-aqueous interface
with increasing cation size is proposed.
6.1 Materials
All nitrate salts were purchased from Fisher Scientific. The aqueous solutions were
made using Nanopure water with resistivity 18.0-18.3 MΩ cm, and filtered, typically
three to six times, using a carbon filter (Whatman Carbon-Cap 150) to remove organic
impurities. VSFG spectra in the 2800 cm-1 to 3000 cm-1 region were obtained to check for
organic impurities in the salt solutions. Aqueous solutions of 2.6 m and 3.3 m were
studied in the present work. 2.6 m corresponds to 0.045 m.f., and 3.3 m corresponds to
0.056 m.f. for all salts (see Table 4.1).

67
6.2 Experimental Method
The VSFG spectra presented in this chapter were acquired using the 10 Hz scanning
VSFG system. The polarizations were ssp for the sum frequency, visible and infrared
light pulses, respectively. The ssp-polarized VSFG spectra presented in this chapter are
the average of three replicate spectra with a 15 s exposure time for each data point,
normalized to the real-time IR profile. A VSFG spectrum of neat water was obtained at
the beginning and at the end of each experiment.
In addition to the VSFG study that provides information of the interfacial region,
Raman and infrared experiments that provide bulk information were conducted. In the
Raman instrumentation, 532 nm photons from a continuous wave laser (Spectra-Physics,
Millennia II) were used for sample illumination. The power at 532 nm was ~100 mW.
The grating used was 600 grooves/mm, the slit width of the monochromator entrance slit
was 50 µm, and the spectral resolution was 3.2 cm-1. Raman spectra presented in this
chapter were collected with an exposure time of 50 s. Additional details of VSFG, Raman
and IR instrumentation are in Chapter 3.
6.3 Results and Discussion
The VSFG spectrum of the air−neat water interface and the Raman and IR spectra of
bulk water in the OH stretching region (3000-3800 cm-1) are shown in Figure 6.1. The
broad continuum spanning from ~3000 cm-1 to ~3600 cm-1 of the VSFG (Figure 6.1a),

68
Raman (Figure 6.1b) and IR (Figure 6.1c) spectra is assigned to the OH stretching modes
of hydrogen-bonded water molecules. Though the precise assignment of the 3000-3600
cm-1 continuum remains controversial,31,90-92 it is safe to say that there is a unique
relationship between the frequency of the OH stretch and the length and strength of the
hydrogen-bonds.93 The lower frequencies beginning at ~3000 cm-1 arise from the OH
stretching modes of strongly hydrogen-bonded water molecules within the hydrogen-
bonding network. The observed resonances at higher frequencies arise from less strongly
hydrogen-bonded water molecules. Not part of the continuum in the VSFG spectrum
shown in Figure 6.1a is a narrow peak at 3700 cm-1, which is assigned to the dangling
OH (free OH) stretch of water molecules that straddle the air-water interface with one
uncoupled OH bond directed into the gas phase and the other interacting through
hydrogen-bonding with the liquid phase.
To understand the hydrogen-bonding network of the bulk water after addition of
nitrate salts, a series of Raman and IR spectra were acquired for 2.6 m and 3.3 m
Mg(NO3)2, Ca(NO3)2, and Sr(NO3)2 aqueous solutions. The Raman spectra of these
solutions are shown in Figure 6.2a-b, and the IR spectra are shown in Figure 6.2c-d. With
the addition of nitrate salts to water, the Raman spectra clearly reveal a decrease in the
low frequency side (~3200 cm-1) of the hydrogen-bonded continuum, and a substantial
intensity increase in the high frequency side (~3400 cm-1) of the continuum. The low
frequency side and the high frequency side of the OH stretch in the hydrogen-bonding

69
network will be called the 3200 cm-1 band and the 3400 cm-1 band in this chapter for ease
of comparison. The IR spectra (Figure 6.2c-d) show a decrease and narrowing of the
3200 cm-1 band and no enhancement of the 3400 cm-1 band. The changes in the Raman
and IR spectra of the hydrogen-bonded OH stretch upon the addition of nitrate salts
relative to that of neat water is attributed to the water hydrogen-bonding network
distortion and the solvation of ions. Due to the presence of metal cations and nitrate
anions in aqueous solutions, the displacement of water molecules by these ions would
perturb the strong hydrogen-bonding network, resulting in an intensity loss of the 3200
cm-1 band in the Raman and IR spectra. Meanwhile, the water molecules that solvate the
ions give rise to an intensity enhancement of the 3400 cm-1 band in the Raman spectra.
The difference in the Raman and IR spectra is associated with different selection rules.38
Unlike previous studies of sodium halides and hydrogen halides where the Raman
intensity enhancement of the 3400 cm-1 band has been found to be associated with the
size and the polarizability of the anion (Cl- < Br- < I-),38,87 the intensity of the 3400 cm-1
band in the Raman spectra (Figure 6.2a-b) remains constant when the size and the
polarizability of the metal cation changes in the nitrate solutions. The calculated
polarizability values of cations and anions are listed in Table 6.1. Br- has a polarizability
approximately twice as high as that of Cl-, and the Raman intensity of the 3400 cm-1 band
of NaBr, for example, is higher than that of NaCl.38 The difference is significant
especially in more concentrated solutions (0.036 m.f., which equals 2.1 m).38 For nitrate

70
salt solutions of Mg(NO3)2 and Ca(NO3)2 with similar concentrations (2.6 m and 3.3 m),
however, as shown in Figure 6.2a-b, the 3400 cm-1 band intensity does not vary with the
polarizability of the cation, though Ca2+ has a polarizability ten times as high as that of
Mg2+. The polarizability magnitude of the divalent cations is however much smaller than
that of the halides as shown in Table 6.1. Additional Raman experiments of chloride
solutions, MgCl2 and CaCl2, were conducted and results show that MgCl2 and CaCl2 have
the same Raman intensity of the 3400 cm-1 band (spectra not shown here). The
experiments on chlorides further reveal that Raman intensity is not sensitive to the
polarizability of the cation. Therefore, it is highly likely that the anion solvation effects
rather than the cation solvation effects are the dominant factor that influences the 3400
cm-1 band intensity, and as the size and the polarizability of the anion increases, the
hydrogen-bonding network of water becomes increasingly disrupted by the solvation of
anions.38
The VSFG spectra of aqueous Mg(NO3)2, Ca(NO3)2, and Sr(NO3)2 solutions with the
same concentrations as was used in Raman and IR studies are presented in Figure 6.3.
The VSFG spectrum of neat water is plotted for comparison. Upon the addition of nitrate
salts, the VSFG spectra show a depletion in the 3200 cm-1 band, an intensity
enhancement in the 3400 cm-1 band, and an intensity decrease in the 3700 cm-1 peak
relative to neat water. The enhancement of the 3400 cm-1 band amplifies as the cation of
the nitrate salt varies from Mg2+ to Ca2+ to Sr2+. Additional VSFG experiments of lower

71
concentration (0.5 m) Mg(NO3)2 (the inset of Figure 6.3a) suggest that the spectral
changes become more significant with increasing concentration.
The VSFG spectra at the air-aqueous nitrate interface provide information of the
effects of nitrate salts on the hydrogen-bonding network of water at the air-aqueous
interface. Recall that VSFG transition moments are related to Raman and IR transition
moments;22,23,26 therefore, it is not surprising to observe an intensity decrease of the 3200
cm-1 band in the VSFG spectra of the nitrate solutions relative to neat water. The intensity
loss of the 3200 cm-1 band in the VSFG spectra is correlated with the perturbation of ions
on the strong hydrogen-bonding network of interfacial water molecules. Although if we
think about this with respect to a shift in population, the VSFG spectrum is sampling the
solvation shell of the ions (3400 cm-1 band) and since there are six to seven water
molecules per ion, there are few water molecules that are strongly hydrogen bonded to
other water molecules.
The Shutz group proposed the presence of contact ion pairs in the surface zone of salt
solutions that would neutralize the electric double layer and therefore diminish the 3200
cm-1 band.74 In the case of Ca(NO3)2 and Sr(NO3)2 solutions, the formation of contact ion
pairs between the metal cation and the interfacial nitrate anion is possible and may
contribute to the intensity loss of the 3200 cm-1 band of the VSFG spectra shown in
Figure 6.3b-c. In the case of Mg(NO3)2, however, as suggested by the VSFG study of the
symmetric stretching modes of nitrate,40 interfacial nitrate is relatively free from Mg2+

72
Coulombic effects and the association between Mg2+ and nitrate is relatively weak. Yet,
the presence of solvent-separated and solvent-shared ion pairs is possible. Therefore, the
observed depletion of the 3200 cm-1 band of the VSFG spectra (Figure 6.3) is likely due
to the displacement of interfacial water molecules by ions and relevant ion pairs.
Consistent with the Raman contribution to the VSFG spectra, the VSFG spectra of
nitrate salt solutions (Figure 6.3) reveal an intensity enhancement of the 3400 cm-1 band
relative to neat water. This intensity increase is associated with water molecules solvating
the ions and ion pairs, and disrupting the hydrogen-bonding network at the air-aqueous
interface. Inconsistent with the Raman spectra, however, the increase in intensity of the
3400 cm-1 band in the VSFG spectra amplifies with the size of the cation (Mg2+ < Ca2+ <
Sr2+). This intensity difference of the 3400 cm-1 band is unique at the interface.
It is likely that an increase in interfacial depth accounts for the VSFG intensity
differences of the 3400 cm-1 band. The VSFG intensity is a function of number density
and orientation of molecules at the interface. An increase in interfacial depth would
increase the number of molecules probed by VSFG and thus the intensity of VSFG. In
VSFG studies, the interface is defined by the concentration gradient of different species
and lack of an inversion center; the bulk begins where the concentrations are
homogeneously mixed and there is macroscopic inversion symmetry.38,94 Nitrate anions
in the air-aqueous interfacial region attract the metal cations toward the interface. At the
same time, the cations also impose a bulk-driving force on the nitrate anions at the

73
interface, according to Newton’s Third Law.88 Based on a recent VSFG study of nitrate
aqueous interfaces,40 for cations with relatively large size and low surface charge density,
for instance, Sr2+ and Ca2+, the metal-nitrate ion pairing (the interaction between metal
cations and interfacial nitrate anions) is enhanced relative to Mg2+. Therefore, we expect
that the water solvation of ions and ion pairs also varies with cation identity. The ion
pairing and the water solvation account for the distribution inhomogeneity of ions in the
interfacial region, and different metal cations have different effects. It is likely that for
nitrate solutions with large size of divalent metal cations, the interface probed by VSFG
extends deeper into the solution. In other words, the concentration gradient extends over
a larger region for Sr(NO3)2 and Ca(NO3)2 solutions relative to Mg(NO3)2. This could
explain the observed 3400 cm-1 band enhancement in the VSFG spectra, which follows
the trend Mg(NO3)2 < Ca(NO3)2 < Sr(NO3)2.
The VSFG spectra of the nitrate salt solutions reveal an intensity decrease in the 3700
cm-1 free OH peak relative to neat water, as shown in Figure 6.3. Although clearly
resolved in our spectra and shown in the VSFG nitrate studies completed by the Shultz
group,74 the intensity decrease in the 3700 cm-1 peak is not observed in other VSFG
studies of aqueous inorganic salt solutions.38,94,95 Such intensity decrease is observed for
acid solutions however.87 The interfacial water structure was proposed to undergo a
structural reorganization upon the addition of acid, resulting in a decrease of the number
of OH bonds projecting into the air.87 According to our pH measurements, the pH of
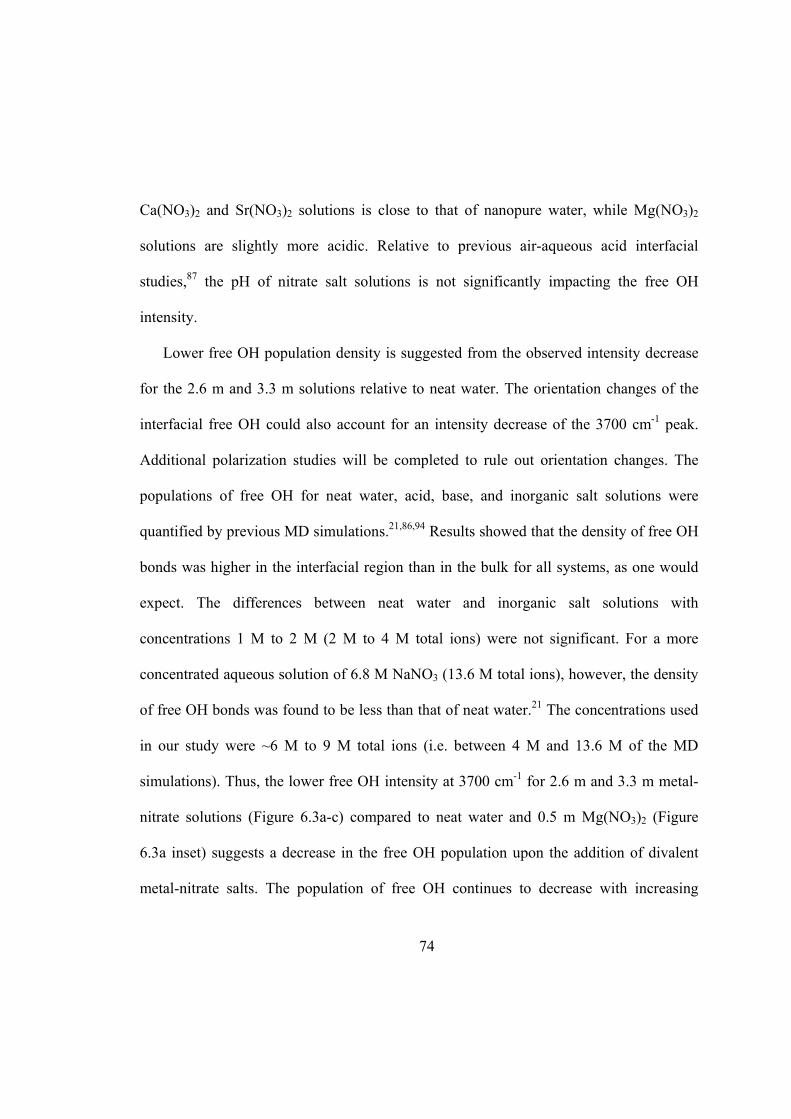
74
Ca(NO3)2 and Sr(NO3)2 solutions is close to that of nanopure water, while Mg(NO3)2
solutions are slightly more acidic. Relative to previous air-aqueous acid interfacial
studies,87 the pH of nitrate salt solutions is not significantly impacting the free OH
intensity.
Lower free OH population density is suggested from the observed intensity decrease
for the 2.6 m and 3.3 m solutions relative to neat water. The orientation changes of the
interfacial free OH could also account for an intensity decrease of the 3700 cm-1 peak.
Additional polarization studies will be completed to rule out orientation changes. The
populations of free OH for neat water, acid, base, and inorganic salt solutions were
quantified by previous MD simulations.21,86,94 Results showed that the density of free OH
bonds was higher in the interfacial region than in the bulk for all systems, as one would
expect. The differences between neat water and inorganic salt solutions with
concentrations 1 M to 2 M (2 M to 4 M total ions) were not significant. For a more
concentrated aqueous solution of 6.8 M NaNO3 (13.6 M total ions), however, the density
of free OH bonds was found to be less than that of neat water.21 The concentrations used
in our study were ~6 M to 9 M total ions (i.e. between 4 M and 13.6 M of the MD
simulations). Thus, the lower free OH intensity at 3700 cm-1 for 2.6 m and 3.3 m metal-
nitrate solutions (Figure 6.3a-c) compared to neat water and 0.5 m Mg(NO3)2 (Figure
6.3a inset) suggests a decrease in the free OH population upon the addition of divalent
metal-nitrate salts. The population of free OH continues to decrease with increasing
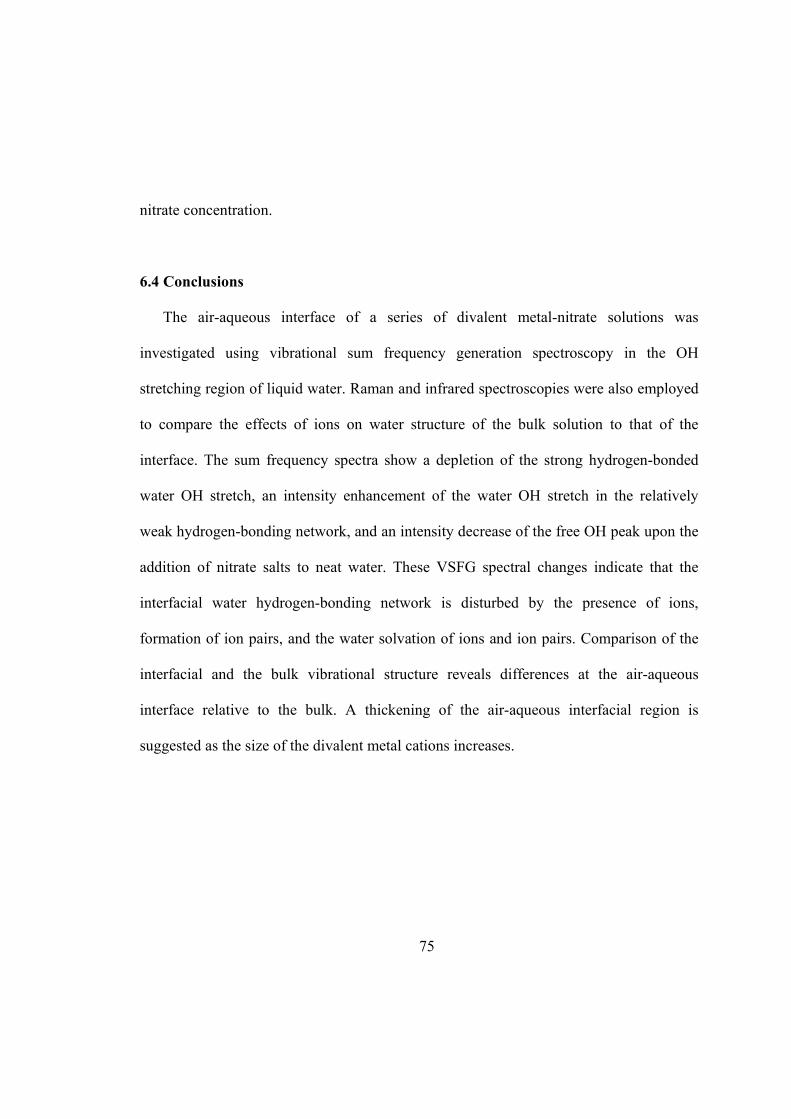
75
nitrate concentration.
6.4 Conclusions
The air-aqueous interface of a series of divalent metal-nitrate solutions was
investigated using vibrational sum frequency generation spectroscopy in the OH
stretching region of liquid water. Raman and infrared spectroscopies were also employed
to compare the effects of ions on water structure of the bulk solution to that of the
interface. The sum frequency spectra show a depletion of the strong hydrogen-bonded
water OH stretch, an intensity enhancement of the water OH stretch in the relatively
weak hydrogen-bonding network, and an intensity decrease of the free OH peak upon the
addition of nitrate salts to neat water. These VSFG spectral changes indicate that the
interfacial water hydrogen-bonding network is disturbed by the presence of ions,
formation of ion pairs, and the water solvation of ions and ion pairs. Comparison of the
interfacial and the bulk vibrational structure reveals differences at the air-aqueous
interface relative to the bulk. A thickening of the air-aqueous interfacial region is
suggested as the size of the divalent metal cations increases.
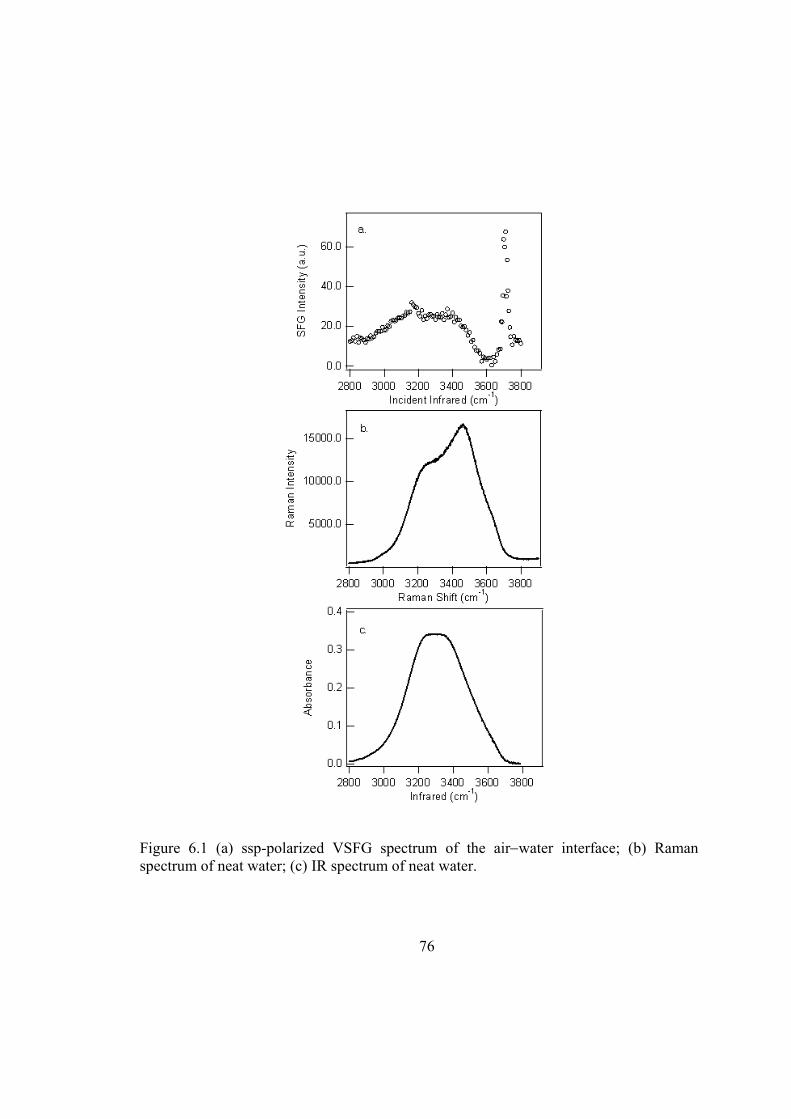
76
Figure 6.1 (a) ssp-polarized VSFG spectrum of the air−water interface; (b) Raman spectrum of neat water; (c) IR spectrum of neat water.

77
Figure 6.2 Raman and infrared spectra of aqueous nitrate solutions and neat water: a) Raman spectra of nitrate solutions with concentration 2.6 m; b) Raman spectra of nitrate solutions with concentration 3.3 m; c) IR spectra of nitrate solutions with concentration 2.6 m; d) IR spectra of nitrate solutions with concentration 3.3 m. The spectrum of neat water is plotted in each figure for comparison.

78
Figure 6.3 ssp-polarized VSFG spectra of (a) 2.6 m and 3.3 m Mg(NO3)2, (b) 2.6 m and 3.3 m Ca(NO3)2, (c) 2.6 m and 3.3 m Sr(NO3)2. Inset of (a) ssp-polarized spectrum of 0.5 m Mg(NO3)2. The neat water VSFG spectrum is plotted in each figure for comparison.

79
Polarizabilities (bohr3) B3PW91/6-311++G(2df,2p)
Be2+
0.045
Mg2+ 0.317
Ca2+ 3.191 Sr2+ - F- 5.157
Cl- 18.783
Br- 30.994
I- - NO3
- 27.231 Table 6.1 Polarizability values of cations and anions.4 Sr2+ and I- polarizabilities did not converge.
4 Polarizability values are provided by Rick Spinney at The Ohio State University.

80
CHAPTER 7
ETHYLENEDIAMINE AT AIR-AQUEOUS AND AIR-SILICA INTERFACES
The adsorption of pollutants onto mineral oxide surfaces plays a critical role in the
spatial and temporal extent of contaminant migration and transformation in the
environment.96,97 Adsorption affects the mobility and distribution of organic pollutants in
the unsaturated soil zone, and in the atmospheric heterogeneous reactions with mineral
aerosols. The development and refinement of effective remediation techniques requires
accurate understanding of adsorption mechanisms at the mineral oxide surfaces.
Therefore, the aim of the present work is to provide molecular level information of
organic adsorption onto mineral oxide surfaces to elucidate adsorption mechanisms, and
to determine the surface acidity of one important mineral oxide – silica.
Ethylenediamine (H2N(CH2)2NH2, EDA), which has the amine moieties of many
widely used environmental contaminants, is employed as the representative model
molecule in the present study. EDA and similar molecules 1,3-diaminopropane and 1,4-
diaminobutane are industrially important and have a wide variety of applications such as
chelating agents for metal ions and corrosion inhibitors in metal-liquid systems. Yet,
EDA itself is of environmental interest although it has been shown not to be carcinogenic
or genotoxic.98 Among the different equilibrium conformations of EDA, the lowest

81
energy conformers have a gauche NCCN arrangement, stabilized by intramolecular
hydrogen-bonding.99-102
Previous theoretical and experimental studies have been completed on the adsorption
of chemical compounds with amine groups onto silica surfaces.103-112 Infrared
spectroscopy has been widely used to study the adsorption of amine compounds onto
silica surfaces.104,109-112 13C NMR spectroscopy was also used to observe the interactions
between the adsorbed amines and the surface acid sites of silica based on the chemical
shift differences between the free and the adsorbed molecules.106 Adsorption kinetics of
polyamidoamine dendrimers onto silica surfaces was investigated with total internal
reflection fluorescence correlation spectroscopy (TIR-FCS).108 X-ray photoelectron
spectroscopy (XPS) was employed to understand the interactions between the adsorbed
amine compounds and the silica surfaces as well as the amount and structure of the
adsorbed amines.104,105,107 Two possible mechanisms of amine compound adsorption onto
the silica surface have been suggested by previous studies:103,104 (1) amine groups form
hydrogen-bonds with the surface silanol groups; (2) amines are chemisorbed onto the
silica surface through protonation reactions.
In the study presented here, the possible adsorption mechanisms of EDA onto silica
surfaces are evaluated by investigating EDA at the air-amorphous SiO2 interface as well
as EDA and its protonated products at the air-aqueous interface using vibrational sum
frequency generation spectroscopy. Results show that the VSFG spectrum of EDA

82
adsorbed on the silica surface and that of the singly protonated EDA solution are similar
in both CH and NH stretching regions. The spectral similarities indicate that EDA
molecules are strongly chemisorbed to the silica surface through the protonation of one
EDA amine group by surface silanol OH groups, thereby forming a (H2N(CH2)2NH3)+(O-
Si≡)- surface complex. The surface acidity of the silanol OH groups (pKa (HOSi≡)) is
therefore quantified to be between the two pKa values of EDA (in the range of 7.56 to
10.71) at the air-silica interface.
7.1 Materials
The infrared-grade fused amorphous silica plates were purchased from Quartz Plus
Inc. Ethylenediamine (redistilled, 99.5+%), ethylenediamine dichloride (98%), and
hydrochloric acid (37.5%) were purchased from Aldrich and used as received. Solutions
were prepared using Nanopure water with a resistivity of 18.0-18.3 MΩ cm. All solutions
were only in contact with glass and Teflon throughout sample preparation.
7.2 Experimental Method
The infrared-grade amorphous silica plates were heated in a muffle oven at 900 ºC for
more than 12 hours before experiments to remove organics from the silica surface. After
the silica plates were cooled to room temperature (297±2 K), they were placed under
ambient conditions for half an hour before the VSFG experiments were performed to

83
ensure equilibrium with water vapor in the air (relative humidity 50±3%). Relative
humidity was measured by a traceable hygrometer (Fisher Scientific) with an accuracy of
±0.2%. The adsorption experiment was performed by placing the silica plate into a sealed
bottle with saturated EDA vapor (vapor pressure 11.4 mmHg113) for 30 minutes, and was
then purged with carbon free dry air (< 1ppm CO2 and water vapor) from FTIR purge gas
generator (Parker Balston, model 75-62NA) for the specified amount of time.
The 10 Hz scanning VSFG system was employed as the primary instrument for this
study. The VSFG spectra were obtained before and after organic adsorption. The
polarization were ssp or sps for the sum frequency, visible, and infrared light beams,
respectively. Both ssp and sps spectra are shown in this dissertation, with discussion
focusing on the ssp-polarized VSFG spectra. Detailed information of VSFG
instrumentation can be found in section 3.1.
The surface tension values of ethylenediamine aqueous solutions were obtained by
using a DeltaPi Tensiometer (Kibron Inc.). Neat water (Nanopure, with a resistivity of
18.3 MΩ cm) was used for calibration. All measurements were completed at constant
temperature (297±2 K). Estimation of the surface mole fractions according to the surface
tension values114-116 is described in Appendix C.

84
7.3 Results and Discussion
Ethylenediamine at the air-aqueous interface. The VSFG spectra of EDA solutions
at the air-aqueous interface were acquired to establish reference systems of vibrational
frequencies to compare against the VSFG spectra from the air-silica interfacial adsorption
studies. The ssp-polarized VSFG spectra of EDA aqueous solutions at air-aqueous
interfaces are shown in Figure 7.1b-c. The spectrum of neat water is shown in Figure 7.1a
for comparison. Of importance to this study are the neat water assignments of the 3700
cm-1 peak to the free OH of surface water, and the 3000 cm-1 to 3600 cm-1 region to the
hydrogen-bonded stretching region of interfacial water. Although vibrational frequencies
of infrared, Raman, and VSFG spectra do not exactly correspond with one another, these
frequencies are generally within a few wavenumbers.117-119 Thus, the peak assignments of
VSFG spectra in the present study are based upon Raman and infrared spectra from the
literature.120-123 In the CH stretching region (2800-3000 cm-1), the peak around 2860 cm-1
is assigned to the CH2 symmetric stretching (CH2-SS) modes, and the peak around 2920
cm-1 is attributed to the CH2 asymmetric stretching (CH2-AS) modes.120,122 In order to
obtain accurate CH peak positions, the VSFG spectra of 0.05 m.f. and 0.2 m.f. EDA
aqueous solutions were fit using Lorientzian profiles in the CH stretching region. The
component peaks are shown as dashed lines in Figure 7.1. The fitting results are
summarized in Table 7.1.
The VSFG spectra can provide information about the orientation of surface molecules.
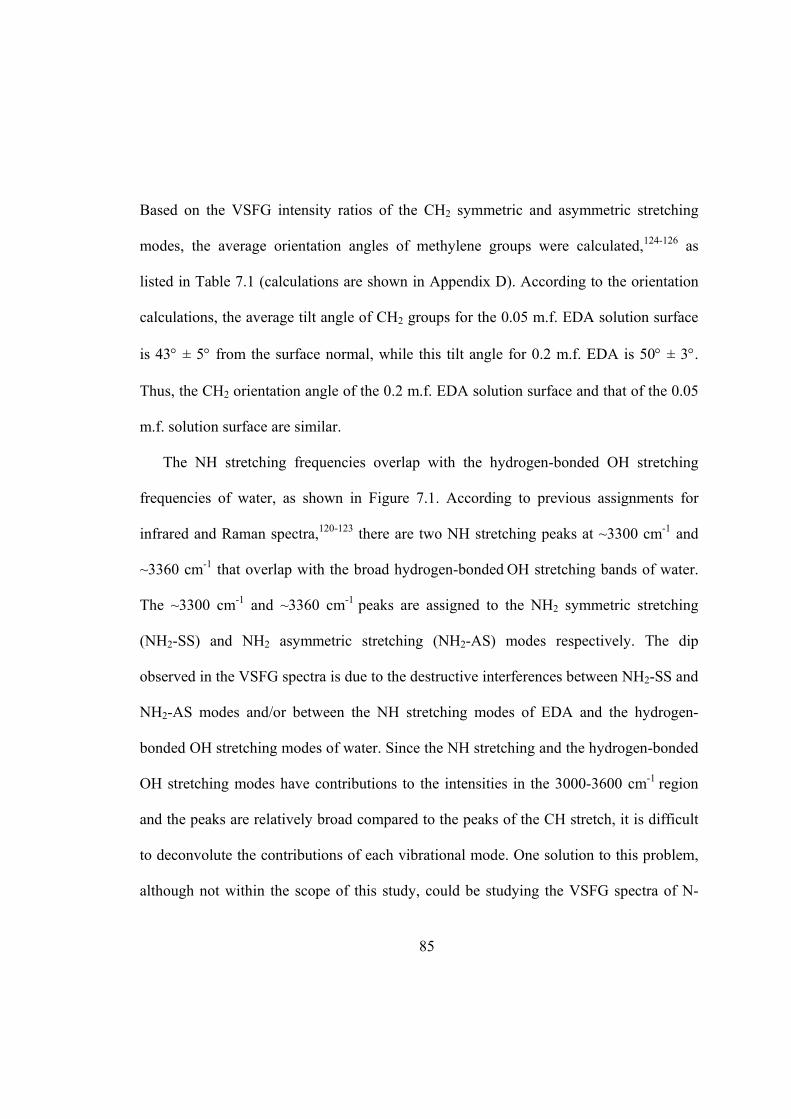
85
Based on the VSFG intensity ratios of the CH2 symmetric and asymmetric stretching
modes, the average orientation angles of methylene groups were calculated,124-126 as
listed in Table 7.1 (calculations are shown in Appendix D). According to the orientation
calculations, the average tilt angle of CH2 groups for the 0.05 m.f. EDA solution surface
is 43° ± 5° from the surface normal, while this tilt angle for 0.2 m.f. EDA is 50° ± 3°.
Thus, the CH2 orientation angle of the 0.2 m.f. EDA solution surface and that of the 0.05
m.f. solution surface are similar.
The NH stretching frequencies overlap with the hydrogen-bonded OH stretching
frequencies of water, as shown in Figure 7.1. According to previous assignments for
infrared and Raman spectra,120-123 there are two NH stretching peaks at ~3300 cm-1 and
~3360 cm-1 that overlap with the broad hydrogen-bonded OH stretching bands of water.
The ~3300 cm-1 and ~3360 cm-1 peaks are assigned to the NH2 symmetric stretching
(NH2-SS) and NH2 asymmetric stretching (NH2-AS) modes respectively. The dip
observed in the VSFG spectra is due to the destructive interferences between NH2-SS and
NH2-AS modes and/or between the NH stretching modes of EDA and the hydrogen-
bonded OH stretching modes of water. Since the NH stretching and the hydrogen-bonded
OH stretching modes have contributions to the intensities in the 3000-3600 cm-1 region
and the peaks are relatively broad compared to the peaks of the CH stretch, it is difficult
to deconvolute the contributions of each vibrational mode. One solution to this problem,
although not within the scope of this study, could be studying the VSFG spectra of N-

86
deuterated EDA aqueous solutions (ND versus NH vibrations). (ND stretching peaks lie
in the 2300-2550 cm-1 region, and these peaks are not affected by vibrational modes of
water.123)
In the VSFG spectra shown in Figure 7.1a-c, the peak at 3700 cm-1 is assigned to the
free OH stretch of water molecules.127-129 The VSFG intensities of the free OH peak are
reduced in the 0.05 m.f. and 0.2 m.f. EDA solutions compared to neat water. Since the
VSFG response is proportional to the square of the interfacial number density and is
related to the orientation of surface molecules, the concentrations of EDA at the interface
were estimated through surface concentration analysis based on the surface tension
measurement results. The calculated surface mole fractions (m.f.s) are approximately 0.08
m.f.s and 0.3 m.f.s, for 0.05 m.f. and 0.2 m.f. EDA solutions, respectively (see Appendix
C for details of calculations). Therefore, the mole fraction of the surface water molecules
for the 0.08 m.f.s EDA and the 0.3 m.f.s EDA are 0.9 m.f.s H2O and 0.7 m.f.s H2O,
respectively. The square root of the VSFG intensity ratio from the free OH peak in the
0.05 m.f. EDA and 0.2 m.f. EDA spectra (Figure 7.1b-c, and c inset) is 1.3. This
corresponds to the mole fraction ratio of interfacial water molecules (0.9/0.7=1.3),
indicating that the orientation of the free OH does not change significantly in the
interfacial region of the 0.2 m.f. EDA solution compared to that of the 0.05 m.f. solution.
This is approximately consistent with the VSFG spectra with the sps polarization
combination, as shown in Figure 7.2. Although the surface tension and the resulting

87
surface number density calculations reveal that there are less water molecules in the
surface region relative to the bulk, the surface of the EDA solutions is still water-rich.
Ethylenediamine at the air-silica interface. The VSFG spectra of the amorphous
silica surface before and after exposure to EDA vapor are shown in Figure 7.3. As
discussed in previous work,130,131 at ambient conditions with relative humidity (RH) at
around 50%, the VSFG spectrum of silica at the air-silica interface (Figure 7.3a) shows
low-intensity hydrogen-bonded OH stretch bands in the 3000-3600 cm-1 region but a
sharp, high-intensity isolated silanol OH stretching peak at ∼3750 cm-1. This suggests that
at 297 K and 50% RH, water molecules only cover a limited portion of the hydrated silica
surface in island-like formations, and that the isolated silanol OH groups are present as
the major surface species. After exposure to EDA vapor, the significant VSFG responses
from the CH and NH stretching modes in Figure 7.3b and c suggest the adsorption of
EDA molecules to the silica surface. The suppression of the silanol OH peak reveals that
the adsorption occurs through the interaction between the surface silanol OH groups and
the amine groups of the EDA molecules.
VSFG spectra of the silica surface after being exposed to EDA vapor and being
purged with organic free air for 5 minutes and then for 24 hours are shown in Figure 7.3b
and c, respectively. One would expect that there should be less EDA molecules on the
silica surface after longer purging times, and, as a result, the VSFG response might
decrease after 24 hours purging compared to 5 minutes purging. However, the peak
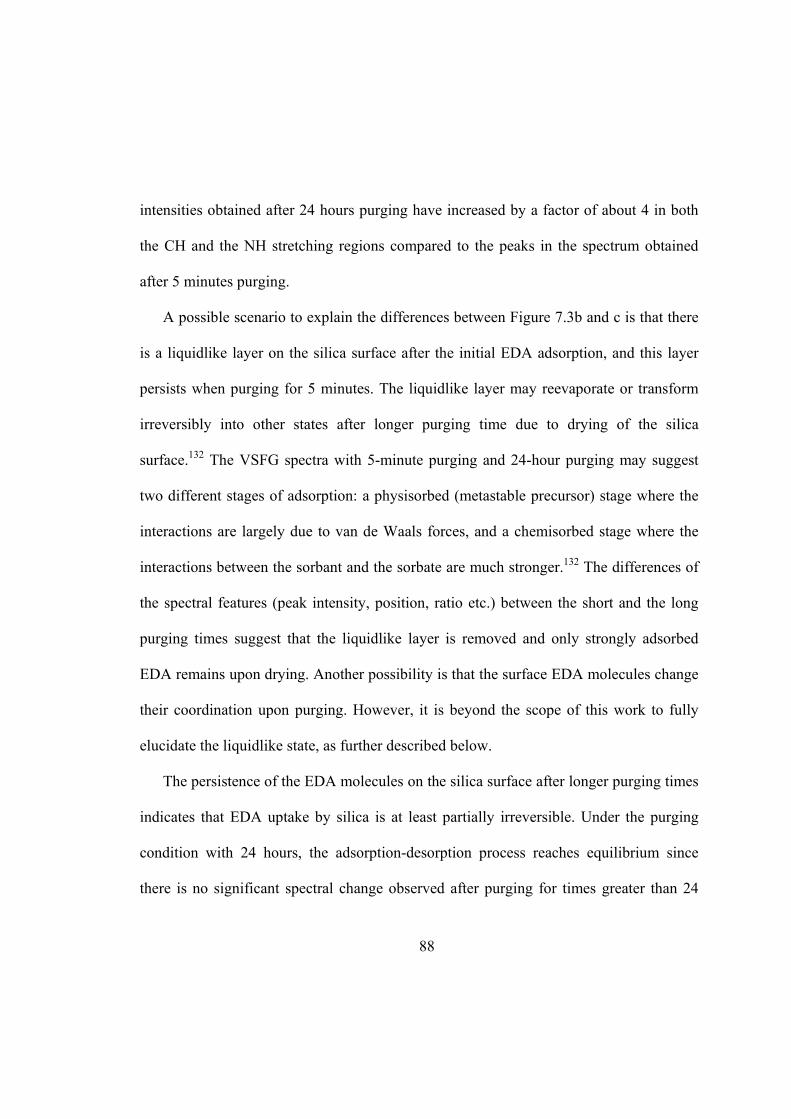
88
intensities obtained after 24 hours purging have increased by a factor of about 4 in both
the CH and the NH stretching regions compared to the peaks in the spectrum obtained
after 5 minutes purging.
A possible scenario to explain the differences between Figure 7.3b and c is that there
is a liquidlike layer on the silica surface after the initial EDA adsorption, and this layer
persists when purging for 5 minutes. The liquidlike layer may reevaporate or transform
irreversibly into other states after longer purging time due to drying of the silica
surface.132 The VSFG spectra with 5-minute purging and 24-hour purging may suggest
two different stages of adsorption: a physisorbed (metastable precursor) stage where the
interactions are largely due to van de Waals forces, and a chemisorbed stage where the
interactions between the sorbant and the sorbate are much stronger.132 The differences of
the spectral features (peak intensity, position, ratio etc.) between the short and the long
purging times suggest that the liquidlike layer is removed and only strongly adsorbed
EDA remains upon drying. Another possibility is that the surface EDA molecules change
their coordination upon purging. However, it is beyond the scope of this work to fully
elucidate the liquidlike state, as further described below.
The persistence of the EDA molecules on the silica surface after longer purging times
indicates that EDA uptake by silica is at least partially irreversible. Under the purging
condition with 24 hours, the adsorption-desorption process reaches equilibrium since
there is no significant spectral change observed after purging for times greater than 24

89
hours (spectra not shown here). Consequently, the VSFG spectrum of silica exposure to
EDA with the 24-hour purging time reveals the adsorption mechanism between EDA
molecules and the SiO2 surface. To elucidate the adsorption mechanism, the 24-hour
purging spectrum was compared to spectroscopic signature frequencies of other carefully
chosen systems.
Adsorption mechanism—hydrogen bonding versus protonation. There are four
possible adsorption mechanism scenarios as shown in Figure 7.4. In scenario I, there is a
liquidlike aqueous layer on the silica surface. In scenario II, the amine groups of EDA
form hydrogen-bonds with the surface silanol OH groups, with the amine group acting as
a proton acceptor and the silanol group being a proton donor. In scenarios III and IV, the
amine groups of EDA molecules are protonated by the surface silanol OH groups and
form (H2N(CH2)2NH3)+(O-Si≡)- complexes through ionic bonds. In scenario III, only one
of the two amine groups of the EDA molecule is protonated (H2N(CH2)2NH3+), while
both of the amine groups are protonated (+H3N(CH2)2NH3+) in scenario IV. In all four
scenarios, water can coexist on the surface (recall ~50% RH).
EDA is a medium-strong base with pKa1 = 7.56, pKa2 = 10.71 for its conjugate acids:
++++ +→ HNH)N(CHHNH)N(CHH 32223223 Ka1 (7.1)
++ +→ HNH)N(CHHNH)N(CHH 22223222 Ka2 (7.2)
The reported pKa values for surface silanol OH groups are generally less than 9.0.133-136
The interaction between the silanol functional groups on the silica surface and EDA can
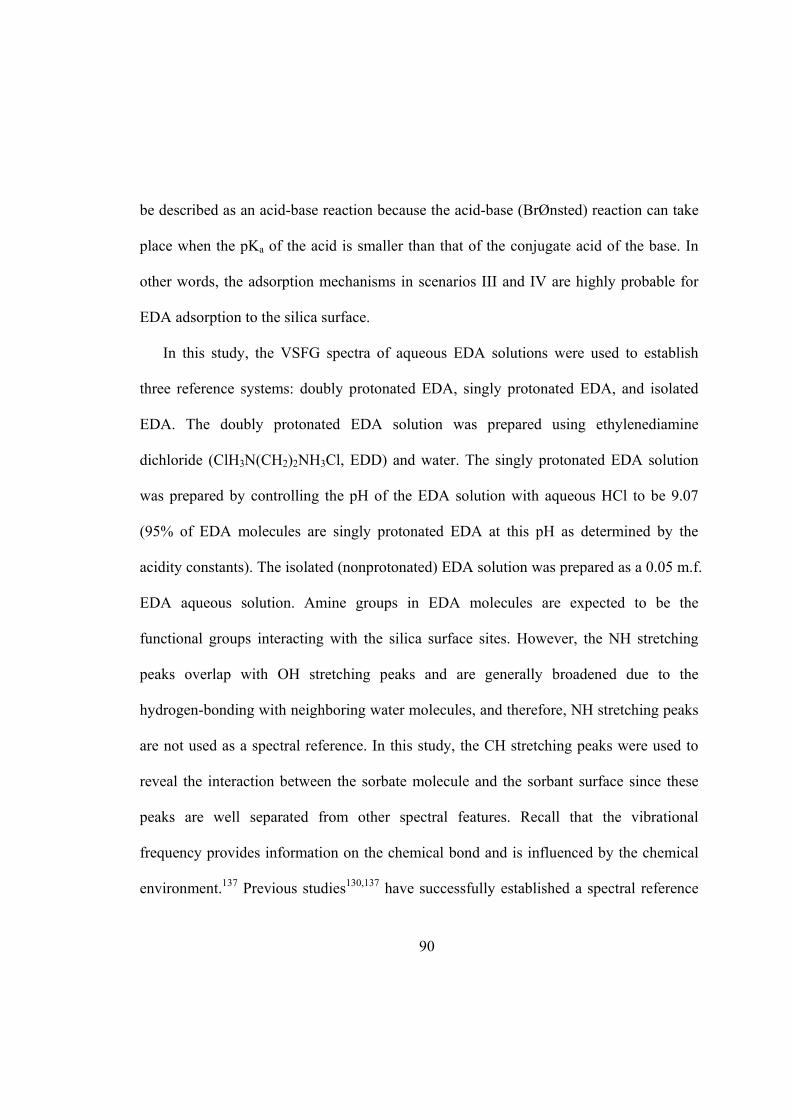
90
be described as an acid-base reaction because the acid-base (BrØnsted) reaction can take
place when the pKa of the acid is smaller than that of the conjugate acid of the base. In
other words, the adsorption mechanisms in scenarios III and IV are highly probable for
EDA adsorption to the silica surface.
In this study, the VSFG spectra of aqueous EDA solutions were used to establish
three reference systems: doubly protonated EDA, singly protonated EDA, and isolated
EDA. The doubly protonated EDA solution was prepared using ethylenediamine
dichloride (ClH3N(CH2)2NH3Cl, EDD) and water. The singly protonated EDA solution
was prepared by controlling the pH of the EDA solution with aqueous HCl to be 9.07
(95% of EDA molecules are singly protonated EDA at this pH as determined by the
acidity constants). The isolated (nonprotonated) EDA solution was prepared as a 0.05 m.f.
EDA aqueous solution. Amine groups in EDA molecules are expected to be the
functional groups interacting with the silica surface sites. However, the NH stretching
peaks overlap with OH stretching peaks and are generally broadened due to the
hydrogen-bonding with neighboring water molecules, and therefore, NH stretching peaks
are not used as a spectral reference. In this study, the CH stretching peaks were used to
reveal the interaction between the sorbate molecule and the sorbant surface since these
peaks are well separated from other spectral features. Recall that the vibrational
frequency provides information on the chemical bond and is influenced by the chemical
environment.137 Previous studies130,137 have successfully established a spectral reference

91
system in the CH stretching region to study the adsorption of piperidine on silica and
alumina surfaces. A similar approach was applied to elucidate the viability of the
adsorption mechanisms for the present study.
Figure 7.5 shows the VSFG spectra in the CH stretching region with the overall
spectral fits for reference systems and EDA adsorbed silica surfaces. The CH2-SS peaks
were chosen as the spectroscopic reference in this study since they are better separated
relative to the CH2-AS peaks from the OH and the NH stretching peaks, and therefore
have minimal spectral interference. There are three significant differences observed for
the CH2-SS peaks after protonation for the reference aqueous EDA solutions. First, the
CH2-SS peak splits into two prominent peaks for both singly and doubly protonated EDA
aqueous solutions. This reveals that protonation changes the distribution of the EDA
conformations in the interfacial region. Second, due to the protonation, the orientation of
the EDA molecules changes significantly. Assuming C2v symmetry for the CH2 groups in
EDA and that the bond angle is 109.5°, orientation calculations show that the average tilt
angle of the CH2 groups in EDA molecules is 43±5o (0.05 m.f. EDA solution) and 50±3o
(0.2 m.f. EDA solution), while this angle changes to 86±4o (0.07 m.f. singly protonated
EDA solution) and 82±2o (0.05 m.f. doubly protonated EDA solution) after protonation,
as listed in Table 7.1 (see Appendix D for details of calculations). Third, the peak
position of the CH2-SS blue shifts from ~2862 cm-1 for the 0.2 m.f. EDA aqueous
solution to ~2872 cm-1 for the singly protonated EDA aqueous solution, and eventually to

92
~2883 cm-1 for the doubly protonated EDA aqueous solution (Figure 7.5, Table 7.1). This
result is consistent with previous studies, which revealed that protonation causes a blue
shift of the CH2-SS peak for piperidine in aqueous solution as well as on silica and
alumina surfaces.130,137
Compared to the reference spectra (Figure 7.5a-c), the VSFG spectrum of EDA
adsorbed onto the silica surface with 5 minutes purging (Figure 7.5d) has the spectral
features of several species. The peak position of the probe peak in the VSFG spectrum
with 5 minutes purging (~2881 cm-1) is close to that from the doubly protonated EDA
solution (~2882 cm-1); however, orientation results show that the surface CH2 has a
similar average orientation angle (~48°) to that of the isolated EDA solution (~43°) (see
Table 7.1). One explanation is that with the 5-minute purging time, EDA molecules form
a liquidlike aqueous layer on the silica surface (scenario I of Figure 7.4), and this
liquidlike layer together with the underlying liquid/silica interface has contributions to
the VSFG response.
After 24 hours purging for the EDA adsorbed silica surface (Figure 7.5e), the VSFG
response is from the interfacial EDA-silanol complex. The VSFG spectrum of EDA
adsorbed to the silica surface after 24 hours purging reveals the splitting feature of the
CH2-SS peak and a similar average CH2 orientation angle (~81o) compared to that of the
reference systems of singly (Figure 7.5b) and doubly protonated (Figure 7.5c) EDA
solutions. Both features strongly suggest that EDA molecules adsorbed on the silica

93
surface are protonated by the silanol groups. In addition, the probe peak position (~2872
cm-1) is nearly the same as that of the singly protonated EDA aqueous solution (~2872
cm-1) as shown in Figure 7.5 and Table 7.1. Therefore, the adsorption of EDA molecules
onto the silica surface occurs via protonation of an amine group by a silica surface silanol
site as shown in scenario III of Figure 7.4.
In this study, we have also shown that EDA is an effective surface acidity probe
molecule (pKa1 = 7.56 and pKa2 = 10.71), and that VSFG spectroscopy results reveal that
the surface acidity constant of silanol OH groups (pKa (HOSi≡)) from an amorphous
silica surface is in the range of 7.56 to 10.71. This is consistent with previous studies.
Eisenthal et al. showed that the planar fused silica surface had a pKa value of 4.5 for 19%
of the silanols and a pKa value of 8.5 for 81% of the silanols based on the second
harmonic results.133 By using the bond-valence methods Bickmore et al. predicted the
pKa values of the silica surface were 7.74 and 10.45.138
7.4 Conclusions
A mechanistic interpretation of diamine adsorption onto mineral oxide surfaces is
presented in this study. The molecular-scale spectroscopic results indicate that
ethylenediamine molecules are strongly chemisorbed (through ionic forces) to the silica
surface through the protonation of one amine group by surface silanol OH groups,
thereby forming a (H2N(CH2)2NH3)+(O-Si≡)- surface complex. The surface acidity of the

94
amorphous silica is quantified to be in the range of the two pKa values of the probe
molecule EDA: 7.56 to 10.71. Serving as a proxy for the interactions between organic
pollutants and mineral oxide surfaces, this molecular-scale study of diamine molecule
adsorption onto the silica surface enables us to have a more thorough understanding of
diamine pollutant fate on soil and atmospheric particles. Furthermore, detailed
information of the adsorption mechanism helps to guide the development of adsorption
models, the prediction of pollutant migration in the natural environment, and the design
of more efficient remediation methods for pollutant-contaminated natural systems.

95
SFG
Inte
nsity
(a.u
.)
0
10
20
30
40
50
60SF
G In
tens
ity (a
.u.)
0
10
20
30
40
Incident Infrared (cm-1)2800 3000 3200 3400 3600 3800
SFG
Inte
nsity
(a.u
.)
020406080
100120140
a Neat Water
b 0.05x EDA ssp
c 0.2x EDA ssp
Incident Infrared (cm-1)3600 3650 3700 3750
SFG
Inte
nsity
(a.u
.)
0
5
10
15
20
25
Figure 7.1 ssp-polarized VSFG spectra of a) neat water; b) 0.05 m.f. ethylenediamine at the air-aqueous interface; c) 0.2 m.f. ethylenediamine at the air-aqueous interface; inset of c) the free OH peak expanded. Dark blue circles: experimental data with error bars; blue solid lines: overall fits; red dashed lines: Lorentzian component peaks.

96
SFG
Inte
nsity
(a.u
.)
0
5
10
Incident Infrared (cm-1)
2800 3000 3200 3400 3600 3800
SFG
Inte
nsity
(a.u
.)
0
5
10
b 0.05 m.f. EDA, sps
c 0.2 m.f. EDA, sps
SFG
Inte
nsity
(a.u
.)
0
2
4
6a Neat Water, sps
Figure 7.2 sps-polarized VSFG spectra of a) neat water (scaled to the EDA experimental conditions); b) 0.05 m.f. ethylenediamine at the air-aqueous interface; c) 0.2 m.f. ethylenediamine at the air-aqueous interface.
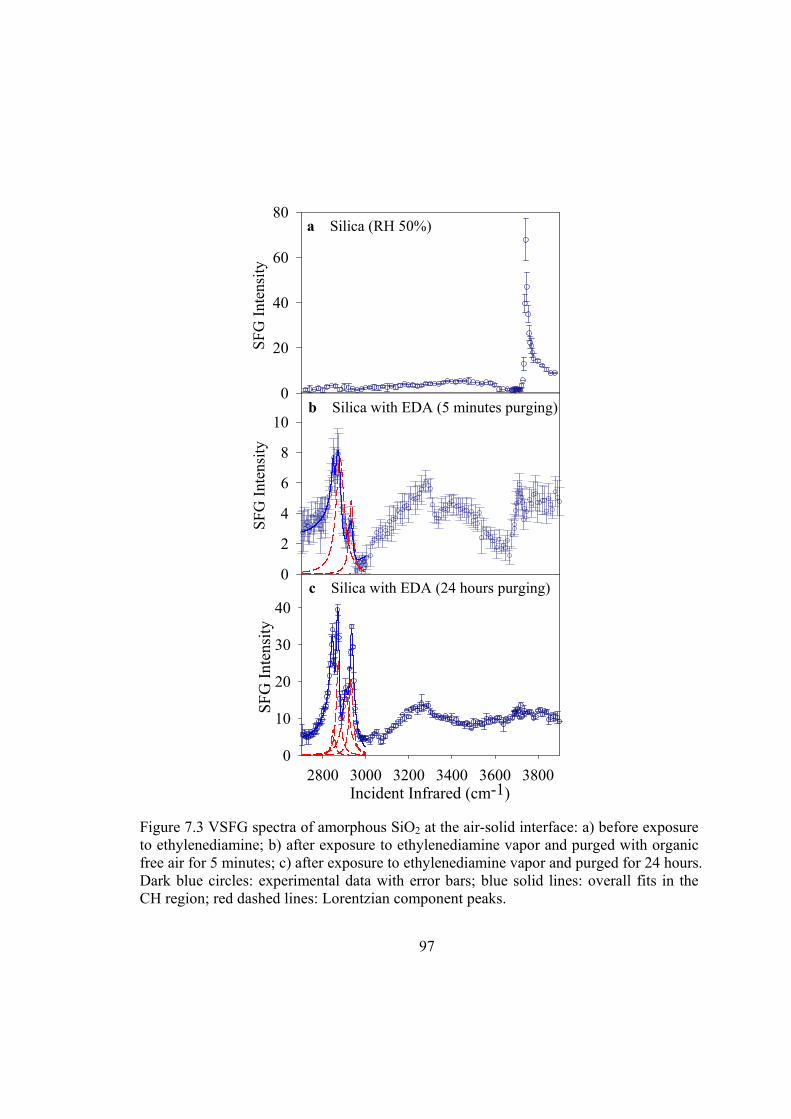
97
SFG
Inte
nsity
0
2
4
6
8
10
SFG
Inte
nsity
0
20
40
60
80
Incident Infrared (cm-1)2800 3000 3200 3400 3600 3800
SFG
Inte
nsity
0
10
20
30
40
a Silica (RH 50%)
b Silica with EDA (5 minutes purging)
c Silica with EDA (24 hours purging)
Figure 7.3 VSFG spectra of amorphous SiO2 at the air-solid interface: a) before exposure to ethylenediamine; b) after exposure to ethylenediamine vapor and purged with organic free air for 5 minutes; c) after exposure to ethylenediamine vapor and purged for 24 hours. Dark blue circles: experimental data with error bars; blue solid lines: overall fits in the CH region; red dashed lines: Lorentzian component peaks.

98
OH
O O O
IV
H
I II III
H
Hydrogen BondWater Molecules
Silica
+
- -H
+
-+
Figure 7.4 Schematic representation of adsorption scenarios: I) liquidlike aqueous layer; II) hydrogen-bonding of EDA with a surface silanol group; III) singly protonated EDA by a surface silanol group; IV) doubly protonated EDA by two surface silanol groups. In all four scenarios, water can coexist on the surface.

99
2861 2866 2872 2882
SFG Frequencycm-1
NH2(CH2)2NH2 NH2(CH2)2NH3+ NH3(CH2)2NH3
2+
-O
+H
Silica
Incident Infrared (cm-1)2700 2750 2800 2850 2900 2950
SFG
Inte
nsity
0
5
10
15
20
25
SFG
Inte
nsity
0
10
20
30
40
50b 0.07 m.f. EDA at pH 9.07 (Singly Protonated EDA)
c 0.05 m.f. EDD (Doubly Protonated EDA) Incident Infrared (cm-1)
2750 2800 2850 2900 2950 3000
SFG
Inte
nsity
0
10
20
30
40
SFG
Inte
nsity
0
10
20
30
40a 0.05 m.f. EDA
SFG
Inte
nsity
0
2
4
6
8
10d Silica with EDA (5 minutes purging)
f
e Silica with EDA (24 hours purging)
x10
x10
Figure 7.5 VSFG spectra in the CH stretching region of a) 0.05 m.f. ethylenediamine at the air-aqueous interface; b) 0.07 m.f. singly protonated ethylenediamine at the air-aqueous interface; c) 0.05 m.f. ethylenediamine dichloride at the air-aqueous interface; d) ethylenediamine at the air-silica interface with 5 minutes purging (component peaks at 2852.0 cm-1 and 2918.9 cm-1 have been multiplied by 10); e) ethylenediamine at the air-silica interface with 24 hours purging. Blue circles: experimental; blue solid lines: overall fits; red dashed lines: Lorentzian component peaks. f) Probe peak frequencies in the reference systems and the adsorption mechanism are shown.

100
CH2-SS (cm-1) CH2-AS (cm-1)
Peak 1 Peak 2 Peak 3 Peak 4
A(SS)5 A(AS)5 χSS /χAS θ
(degrees)
0.05 m.f. EDA 2852.6 2866.0 2917.7 2928.3 1501.6 368.4 2.019 43±5
0.2 m.f. EDA 2849.8 2861.2 2918.0 2932.4 5429.6 2057.3 1.625 50±3
0.07 m.f. singly protonated EDA 2849.6 2872.0 2900.9 2917.6 1134.9 1248.6 0.9534 86±4
0.05 m.f. EDD (doubly protonated
EDA) 2858.8 2882.6 2914.8 2934.0 601.8 638.6 0.9708 82±2
Silica with EDA (5 min purging) 2852.0 2881.0 2918.9 2932.8 505.7 171.2 1.719 48±6
Silica with EDA (24 hr purging) 2848.7 2872.1 2906.8 2932.0 1290.0 1353.7 0.9762 81±7
Table 7.1 Curve-fitting and orientation calculation124-126 results of VSFG spectra (see Appendix D for details of orientation calculations).
5 A(SS): the area of CH2-SS peaks; A(AS): the area of CH2-AS peaks; χSS: the second order macroscopic susceptibility of CH2-SS; χAS: the second order macroscopic susceptibility of CH2-AS.
101
CHAPTER 8
ENVIRONMENTAL IMPLICATIONS AND CONCLUSIONS
The work presented in this dissertation was directed towards elucidating the
interfacial ion pair formation for atmospheric aerosols and natural waters. Ion pairing at
interfaces has impacts on the physical and chemical characteristics of the interface, and
thus affects the migration, transformation, and fate of chemicals in the environment.
Environmentally relevant interfacial systems however are usually complicated and
interrelated factors coexist. Therefore, a thorough investigation of the heterogeneous
chemical and physical processes that occur at such interfaces must start with careful
consideration of fundamental issues. In light of this, the work presented in this
dissertation focuses on a fundamental understanding of ion pairing between nitrate anions
and divalent metal counterions at the air-aqueous interface.
Sum frequency, Raman, and infrared spectra reveal that the formation of ion pairs
between nitrate anions and metal cations increases with increasing cation size, Mg2+ <
Ca2+ < Sr2+, at the interface and in the bulk. Their influences on the interfacial water
structure follow the same trend, and the interfacial depth of the nitrate solution is
expected to extend deeper into the bulk as the size of the cation increases. Yet, Mg(NO3)2
ion pairing properties are uniquely different at the air-aqueous interface relative to the
102
bulk. When the number of water molecules per ion increases by one for Mg(NO3)2
aqueous systems (3.3 m versus 2.6 m), the dominant interfacial nitrate species changes
significantly, from an ion-paired nitrate to a relatively free nitrate species. Such
molecular-level information of interfacial species and structure of nitrate aqueous
systems provides insight into the physical and chemical processes of adsorption,
desorption, and heterogeneous reactions at interfaces of nitrate aerosols and nitrate-
containing aqueous systems. This information also has implications for the development
and refinement of theoretical models for predicting the migration, reaction, and
distribution of chemicals in the natural environment.
The surface acidity of silica was also determined in this work. The quantitative
information of silica surface acidity along with the detailed understanding of ion pairing
between nitrate anions and metal cations prepares us for the next step of the research, a
thorough investigation of the metal-nitrate ion pair formation at silica surfaces.
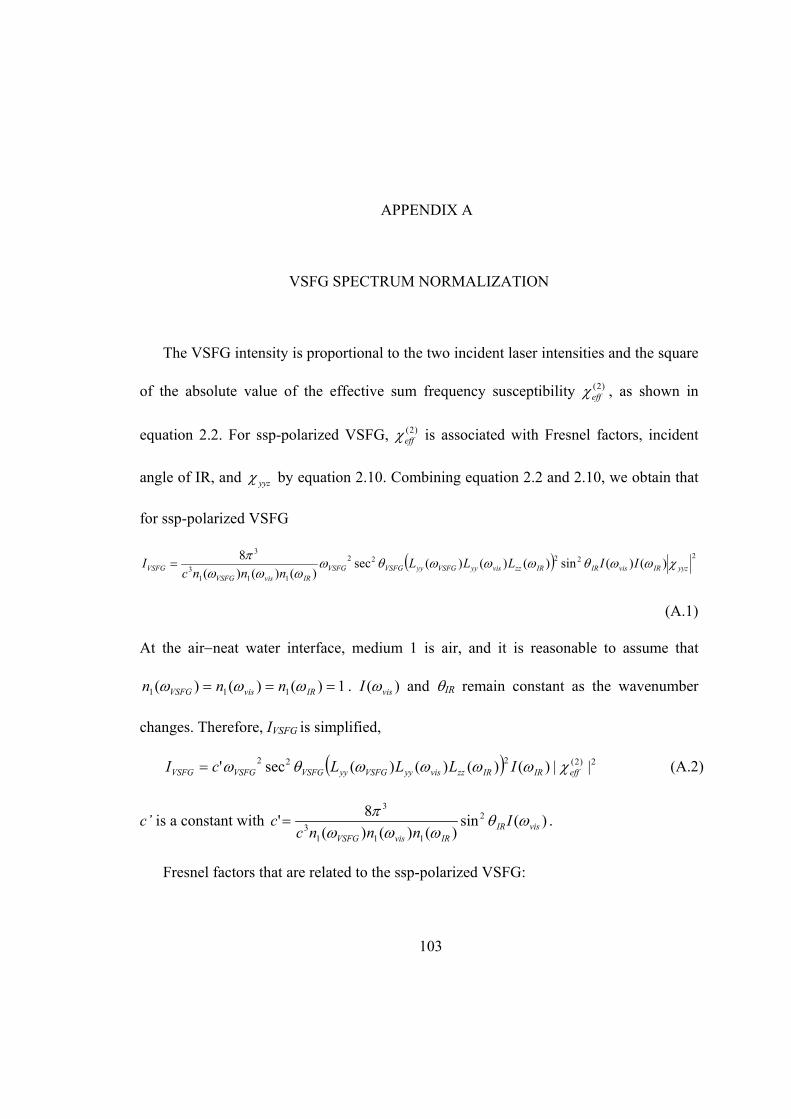
103
APPENDIX A
VSFG SPECTRUM NORMALIZATION
The VSFG intensity is proportional to the two incident laser intensities and the square
of the absolute value of the effective sum frequency susceptibility )2(effχ , as shown in
equation 2.2. For ssp-polarized VSFG, )2(effχ is associated with Fresnel factors, incident
angle of IR, and yyzχ by equation 2.10. Combining equation 2.2 and 2.10, we obtain that
for ssp-polarized VSFG
( ) 22222
1113
3
)()(sin)()()(sec)()()(
8yyzIRvisIRIRzzvisyyVSFGyyVSFGVSFG
IRvisVSFGVSFG IILLL
nnncI χωωθωωωθω
ωωωπ
=
(A.1)
At the air−neat water interface, medium 1 is air, and it is reasonable to assume that
1)()()( 111 === IRvisVSFG nnn ωωω . )( visI ω and θIR remain constant as the wavenumber
changes. Therefore, IVSFG is simplified,
( ) 2)2(222 ||)()()()(sec' effIRIRzzvisyyVSFGyyVSFGVSFGVSFG ILLLcI χωωωωθω= (A.2)
c’ is a constant with )(sin)()()(
8' 2
1113
3
visIRIRvisVSFG
Innnc
c ωθωωω
π= .
Fresnel factors that are related to the ssp-polarized VSFG:
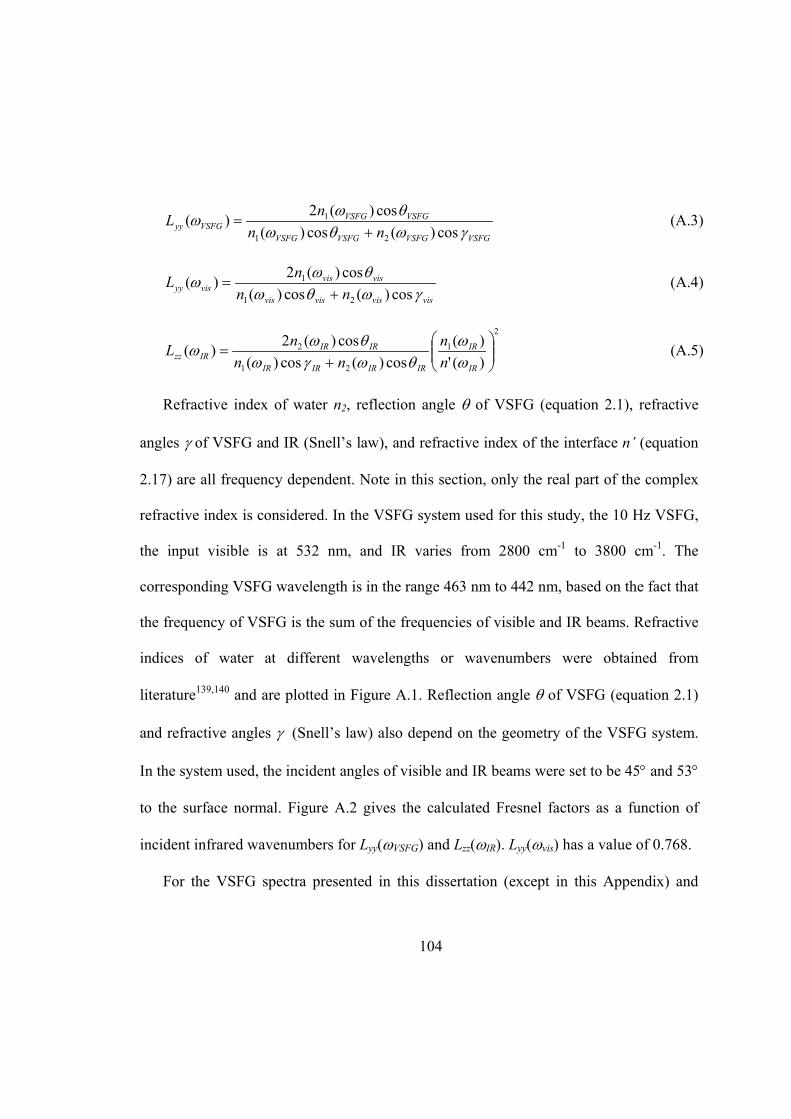
104
VSFGVSFGVSFGVSFG
VSFGVSFGVSFGyy nn
nLγωθω
θωωcos)(cos)(
cos)(2)(21
1
+= (A.3)
visvisvisvis
visvisvisyy nn
nLγωθω
θωωcos)(cos)(
cos)(2)(21
1
+= (A.4)
2
1
21
2
)(')(
cos)(cos)(cos)(2)(
+
=IR
IR
IRIRIRIR
IRIRIRzz n
nnn
nLωω
θωγωθωω (A.5)
Refractive index of water n2, reflection angle θ of VSFG (equation 2.1), refractive
angles γ of VSFG and IR (Snell’s law), and refractive index of the interface n’ (equation
2.17) are all frequency dependent. Note in this section, only the real part of the complex
refractive index is considered. In the VSFG system used for this study, the 10 Hz VSFG,
the input visible is at 532 nm, and IR varies from 2800 cm-1 to 3800 cm-1. The
corresponding VSFG wavelength is in the range 463 nm to 442 nm, based on the fact that
the frequency of VSFG is the sum of the frequencies of visible and IR beams. Refractive
indices of water at different wavelengths or wavenumbers were obtained from
literature139,140 and are plotted in Figure A.1. Reflection angle θ of VSFG (equation 2.1)
and refractive angles γ (Snell’s law) also depend on the geometry of the VSFG system.
In the system used, the incident angles of visible and IR beams were set to be 45° and 53°
to the surface normal. Figure A.2 gives the calculated Fresnel factors as a function of
incident infrared wavenumbers for Lyy(ωVSFG) and Lzz(ωIR). Lyy(ωvis) has a value of 0.768.
For the VSFG spectra presented in this dissertation (except in this Appendix) and
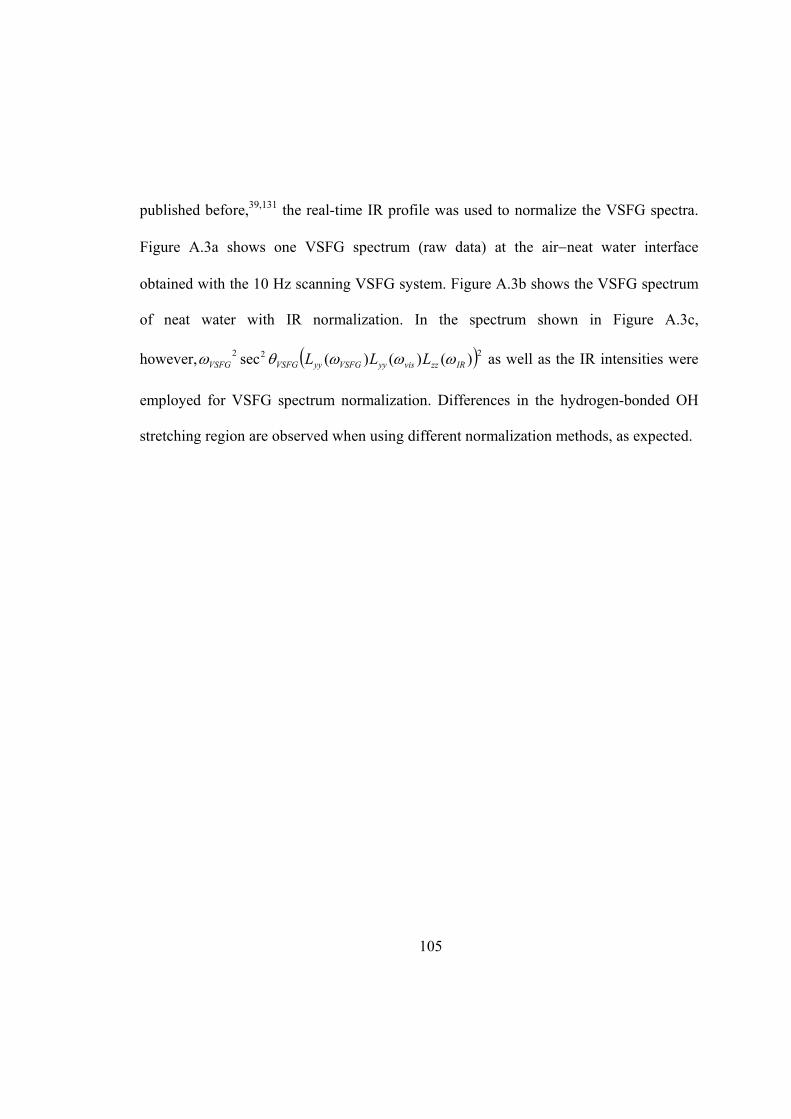
105
published before,39,131 the real-time IR profile was used to normalize the VSFG spectra.
Figure A.3a shows one VSFG spectrum (raw data) at the air−neat water interface
obtained with the 10 Hz scanning VSFG system. Figure A.3b shows the VSFG spectrum
of neat water with IR normalization. In the spectrum shown in Figure A.3c,
however, ( )222 )()()(sec IRzzvisyyVSFGyyVSFGVSFG LLL ωωωθω as well as the IR intensities were
employed for VSFG spectrum normalization. Differences in the hydrogen-bonded OH
stretching region are observed when using different normalization methods, as expected.
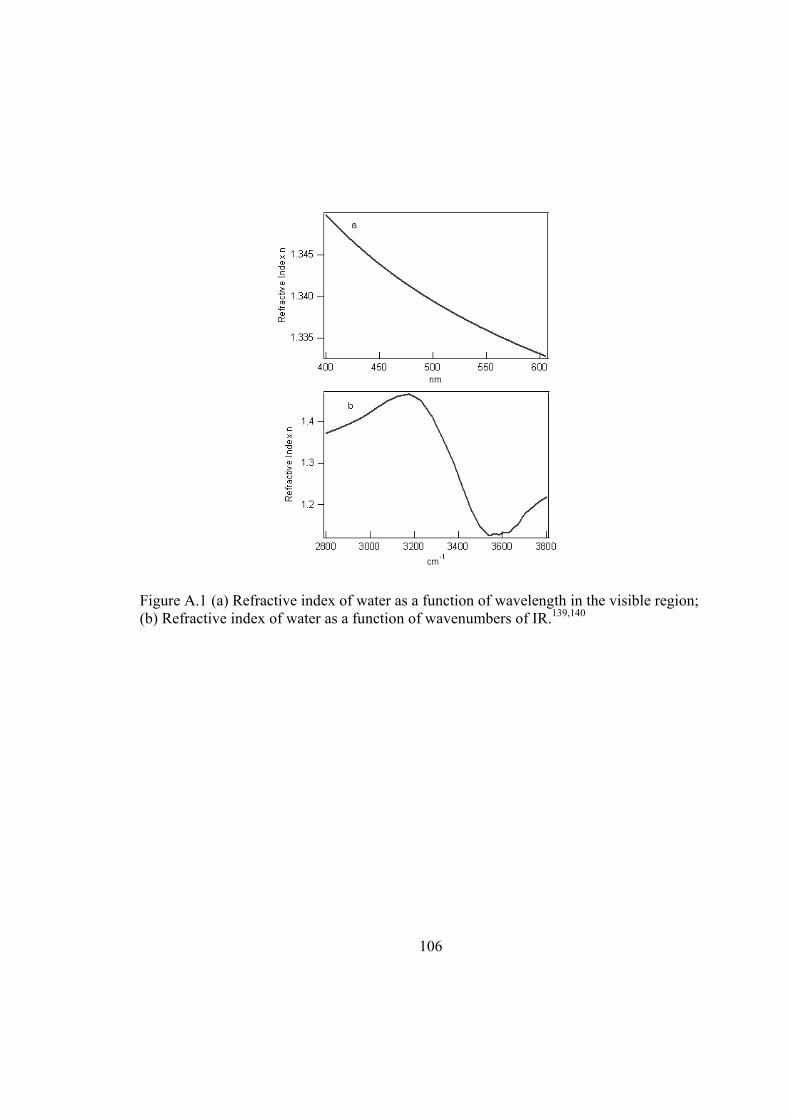
106
Figure A.1 (a) Refractive index of water as a function of wavelength in the visible region; (b) Refractive index of water as a function of wavenumbers of IR.139,140
107
Figure A.2 Fresnel factors Lyy(ωVSFG) and Lzz(ωIR) as a function of wavenumber of incident IR.

108
Figure A.3 ssp-polairzed VSFG spectra at the air−neat water interface: (a) VSFG spectrum before normalization; (b) VSFG spectrum normalized to real-time IR; (c) VSFG spectrum normalized to F factor (F= ( )222 )()()(sec IRzzvisyyVSFGyyVSFGVSFG LLL ωωωθω ) and real-time IR.
109
APPENDIX B
LOW-FREQUENCY RAMAN INSTRUMENTATION
In our Raman spectrometer, a Raman probe (Inphotonics) is employed to illuminate
the sample and to filter and collect the scattered radiation. This coaxial, two-fiber probe is
very convenient and efficient for Raman experiments. However, the Raman probe we
used for 532 nm excitation laser has a cut-off at 250 cm-1, as shown (red dashed line) in
Figure B.2. In order to study the metal-nitrate interaction which has intermolecular
vibrational bands at ~250 cm-1 or lower, a Raman setup that can detect lower frequencies
was designed and utilized. As shown in Figure B.1, in this setup, a 90° configuration for
the incoming laser beam and detection is used. The 532 nm light from the CW laser
(Spectra-Physics, Millennia II) is focused on the sample by the fiber optic probe
(Inphotonics, RPS532/12-10). The scatter is focused onto the monochromator entrance
slit using a BK7 lens. A long-pass 535 nm filter (Omega Optical, Custom) is placed
(slightly tilted) in the light path before the monochromator to remove the 532 nm light.
(The transmission curve of the long-pass 535 nm filter is shown in Figure B.3.) Raman
bands with frequencies as low as 140 cm-1 can be detected using this low-frequency
Raman setup. Figure B.2 shows the low-frequency Raman spectra of neat water and
aqueous nitrate solutions with a slit width 40 µm and an exposure time 50 s. Two peaks

110
at 172 cm-1 and 216 cm-1 are observed, which are assigned to the stretching modes of
hydrogen bonds.
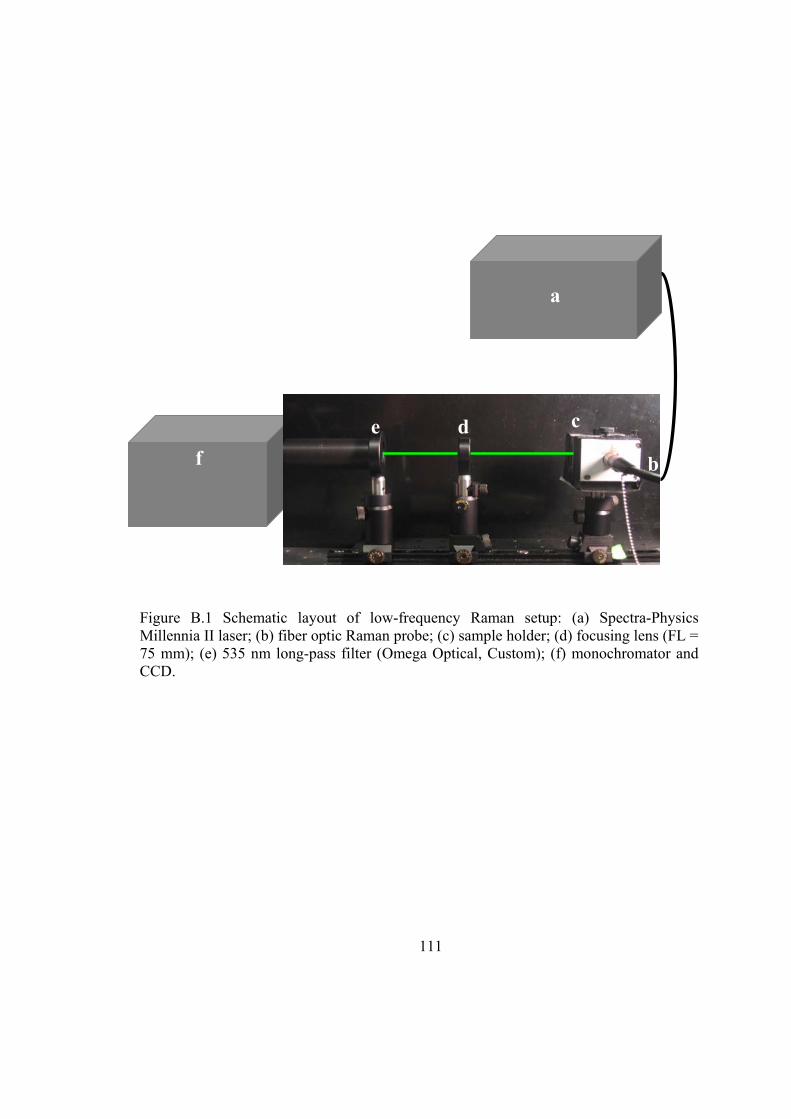
111
Figure B.1 Schematic layout of low-frequency Raman setup: (a) Spectra-Physics Millennia II laser; (b) fiber optic Raman probe; (c) sample holder; (d) focusing lens (FL = 75 mm); (e) 535 nm long-pass filter (Omega Optical, Custom); (f) monochromator and CCD.
f
a
c
b
de

112
Figure B.2 Raman spectra of neat water and saturated aqueous solutions of Mg(NO3)2, Ca(NO3)2, Sr(NO3)2, Pb(NO3)2, and NH4NO3 obtained using the low-frequency Raman setup. The Raman spectrum of neat water measured with the Raman probe (red dashed line) is shown for comparison.
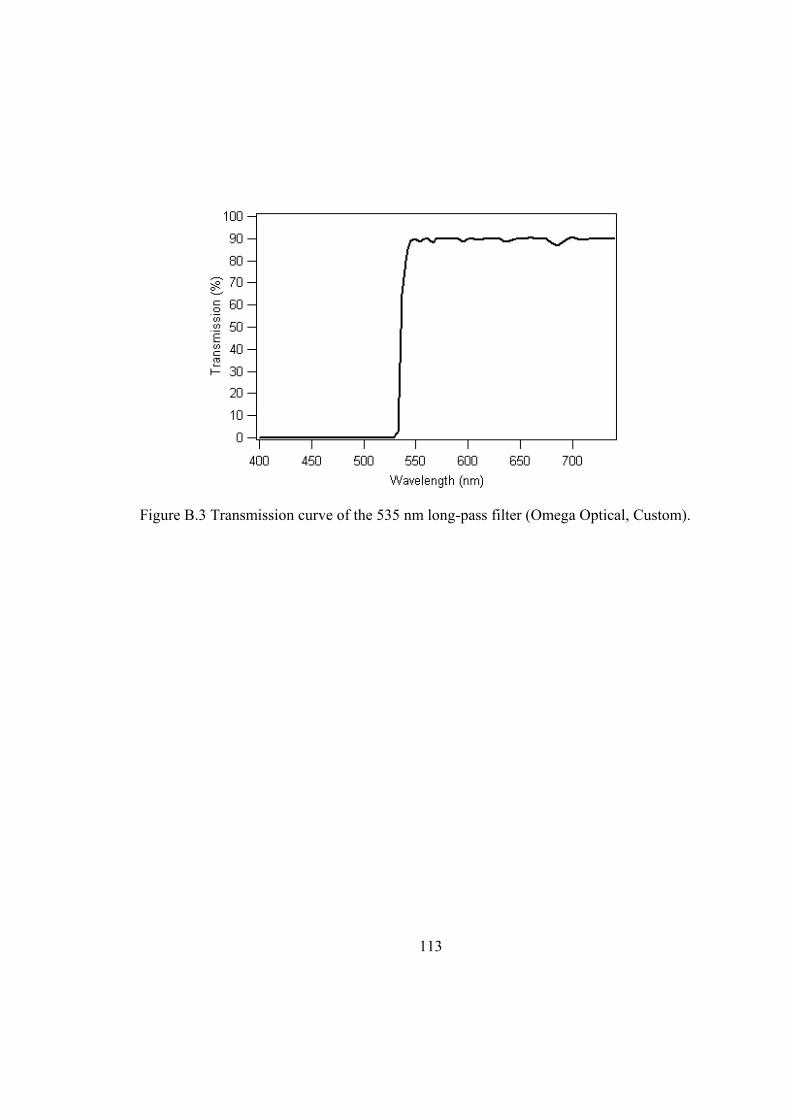
113
Figure B.3 Transmission curve of the 535 nm long-pass filter (Omega Optical, Custom).

114
APPENDIX C
ESTIMATION OF SURFACE MOLE FRACTION
The adsorption of a solute at the air-aqueous interface, hence the surface mole
fraction, is characterized by the relative adsorption (Γ2,1).115,116 The relative adsorption is
related to the surface tension (γ) through the Gibbs equation:114,115,141
xx
xfxRT
xx PT
−Γ−Γ=
∂∂
+
∂∂
−=Γ1)ln1(
)(12
,
1,2
γ
(C.1)
where x refers to the bulk mole fraction of the solute, EDA, f is the activity coefficient of
EDA in the solution, R is the universal gas constant 8.314 J/(K⋅mol), T refers to the
temperature, and Γ1 and Γ2 refer to the surface excess of water and EDA, with the unit
µmol/m2. In the present work, the surface tension values of EDA aqueous solutions were
obtained by using a DeltaPi Tensiometer (Kibron Inc.) at ~297 K. According to the linear
regression result of the experimental surface tension data (Figure C.1a), PTx ,)(∂∂γ is
constant which equals –30.0. The activity coefficient f for EDA in the binary system of
EDA and water is predicted by using the UNIFAC group-contribution method,142,143 as
shown in Figure C.1b. The relative adsorption Γ2,1 versus bulk mole fraction of EDA is
plotted in Figure C.1c.
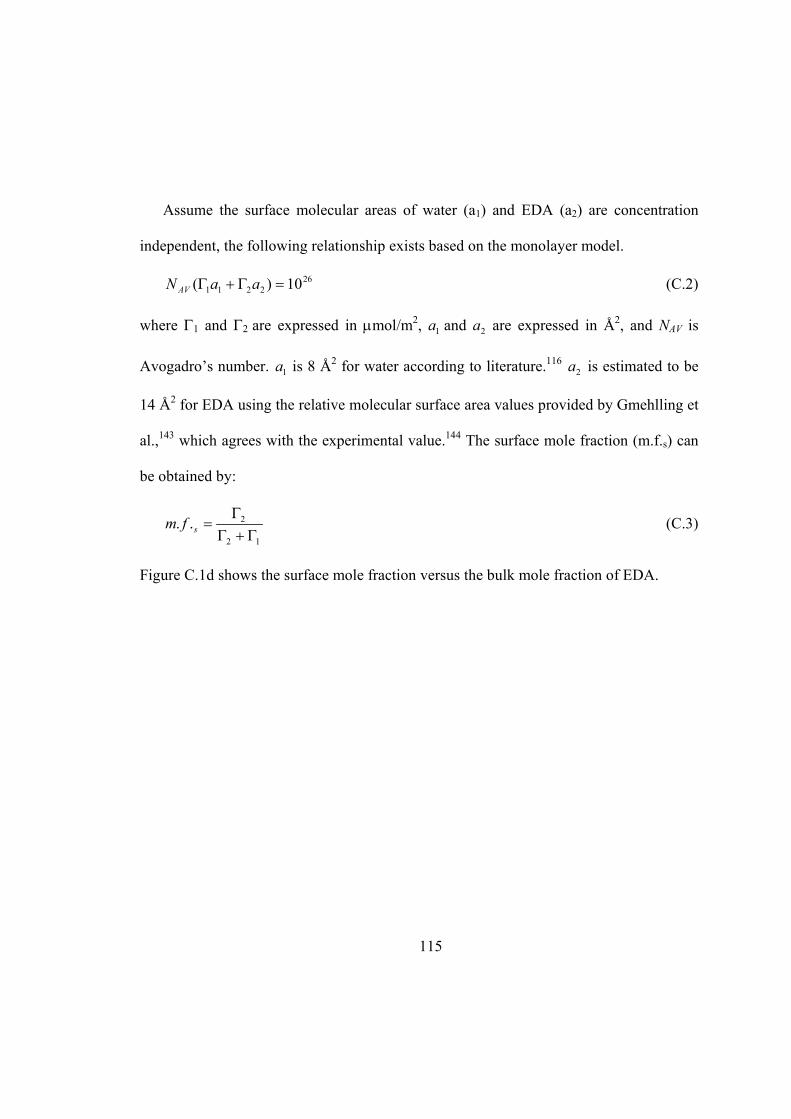
115
Assume the surface molecular areas of water (a1) and EDA (a2) are concentration
independent, the following relationship exists based on the monolayer model.
262211 10)( =Γ+Γ aaN AV (C.2)
where Γ1 and Γ2 are expressed in µmol/m2, 1a and 2a are expressed in Å2, and NAV is
Avogadro’s number. 1a is 8 Å2 for water according to literature.116 2a is estimated to be
14 Å2 for EDA using the relative molecular surface area values provided by Gmehlling et
al.,143 which agrees with the experimental value.144 The surface mole fraction (m.f.s) can
be obtained by:
12
2..Γ+Γ
Γ=sfm (C.3)
Figure C.1d shows the surface mole fraction versus the bulk mole fraction of EDA.

116
Surf
ace
Tens
ion
(mN
/m)
20
30
40
50
60
70
80
y=-29.964x+70.228
R2=0.9659
a
Γ 2,1 (
µmol
/m2 )
0
2
4
6
8
10
12
Bulk Mole Fraction of EDA0.0 0.2 0.4 0.6 0.8 1.0
Surf
ace
Mol
e Fr
actio
n of
ED
A
0.0
0.2
0.4
0.6
0.8
f
1.00
1.05
1.10
1.15
1.20
1.25b
c
d
Figure C.1 (a) Surface tension values versus bulk mole fraction of ethylenediamine. Data points: experimental data with error bars; dashed line: linear regression. (b) Activity coefficient f of ethylenediamine in aqueous solutions. (c) Relative adsorption ( 1,2Γ ) of ethylenediamine in aqueous solutions. (d) Surface mole fraction of EDA versus bulk mole fraction of EDA.

117
APPENDIX D
ORIENTATION CALCULATIONS
The capability of determining molecular orientation is a significant advantage of
VSFG studies.145 Different components of χ(2) are related to the spectroscopically active
components of the molecular hyperpolarizability tensor β(2) by the average orientation
angle of the functional group.124,125,145-147 The molecular symmetry determines the
nonzero elements of β(2).125 In the present work the methylene groups of ethylenediamine
are treated as having a C2v symmetry. For the methylene group, the nonzero VSFG tensor
elements of the symmetric stretch are βaac, βbbc, and βccc that are related by
cccbbcaac βββ 2=+ for methylene at the standard bond angle 109.5°.124-126 Though the
bond angle in EDA is not exactly 109.5°, the value of cccbbcaac βββ 2−+ remains a small
number close to zero. For the asymmetric mode, βaca equals βcaa.124-126 The abc represents
the molecular coordination system.
The components of χ for the symmetric stretch (SS) are given by Lu et al.,125 χ is
described in the laboratory (xyz) coordinate system:
θβββθβββχχ 3cos)2(41cos)2(
41
cccbbcaacscccbbcaacsSS
yyzSS
xxz NN −++++== (D.1)

118
)coscos)(2(41 3 θθβββχχχχ −−+−==== cccbbcaacs
SSzyy
SSyzy
SSzxx
SSxzx N (D.2)
θβββθββχ 3cos)2(21cos)(
21
cccbbcaacsbbcaacsSS
zzz NN −+−+= (D.3)
For the asymmetric stretch (AS), the components of χ are:146
)coscos(21 3 θθβχχ −−== acas
ASyyz
ASxxz N (D.4)
θβχχχχ 3cos21
acasAS
zyyAS
yzyAS
zxxAS
xzx N==== (D.5)
)coscos( 3 θθβχ −= acasAS
zzz N (D.6)
where θ is the tilt angle from the surface normal.
SSxxzχ and AS
xxzχ are related to the VSFG spectra using the ssp polarization
combination. According to previous work,124 the relationships between βccc, βaac, and βcaa
are cccaac ββ ⋅= 2 and aaccaa ββ ⋅= 053.1 for CH2 with C2v symmetry. Combined with the
relationships cccbbcaac βββ 2=+ and caaaca ββ = shown above, and assuming that
00.121
=cccsN β arbitrary unite (a.u.), equation D.1 and D.4 can be greatly simplified:
θχ cos2=SSxxz (D.7)
)coscos(106.2 3 θθχ −−=ASxxz (D.8)
Here, absolute values of χ are used for the asymmetric stretch.

119
)coscos(106.2 3 θθχ −−=ASxxz (D.9)
Figure D.1 shows the dependence of second order susceptibilities on the tilt angle.
The calculated tilt angle θ from the VSFG intensity ratio of the symmetric and
asymmetric stretch are listed in Table D.1.

120
0.0
0.5
1.0
1.5
2.0
2.5
ssp, SSssp, AS
0 20 40 60 80 1000
200
400
600
800ASsspSSssp ,, / χχ
ASsspSSssp ,, / χχ
a
b
sspχ
)(deg reeθ
Figure D.1 (a) Second order susceptibilities for the symmetric (SS) and asymmetric (AS) stretch of methylene as a function of tilt angle. (b) The ratio between them as a function of tilt angle.

121
A(SS)6 A(AS)6 A(SS)/A(AS) χSS/χAS6 cos (θ) θ (degree)
0.05 m.f. EDA 1502 368 4.08 2.02 0.7278 43±5
0.2 m.f. EDA 5430 2057 2.64 1.62 0.6445 50±3
Silica with EDA (5min) 506 171 2.96 1.72 0.6689 48±6
Singly protonated EDA 1135 1249 0.909 0.953 0.06211 86±4 EDD (doubly protonated
EDA) 602 639 0.942 0.971 0.1473 82±2
Silica with EDA (24hr) 1290 1354 0.953 0.976 0.1647 81±7
Table D.1 Orientation calculation results of VSFG spectra (error in θ was determined by the error in the reproducible fits).
6 A(SS): the area of CH2-SS peaks; A(AS): the area of CH2-AS peaks; χSS: the second order macroscopic nonlinear susceptibility of CH2-SS; χAS: the second order macroscopic nonlinear susceptibility of CH2-AS.

122
LIST OF REFERENCES
(1) Finlayson-Pitts, B. J.; Pitts Jr., J. N. Tropospheric air pollution: Ozone, airborne toxics, polycyclic aromatic hydrocarbons, and particles. Science 1997, 276, 1045-1052.
(2) Finlayson-Pitts, B. J.; Pitts Jr., J. N. Chemistry of the Upper and Lower Atmosphere: Theory, Experiments and Applications. Academic Press: San Diego, CA, 2000.
(3) Bauer, S. E.; Koch, D.; Unger, N.; Metzger, S. M.; Shindell, D. T.; Streets, D. G. Nitrate aerosols today and in 2030: a global simulation including aerosols and traposphere ozone. Atmos. Chem. Phys. 2007, 7, 5043-5059.
(4) Finlayson-Pitts, B. J.; Hemminger, J. C. Phyical chemistry of airborne sea salt particles and their components. J. Phys. Chem. A 2000, 104, 11463-11477.
(5) Finlayson-Pitts, B. J. The tropospheric chemistry of sea salt: A molecular-level view of the chemistry of NaCl and NaBr. Chem. Rev. 2003, 103, 4801-4822.
(6) Hoffmann, M. R.; Laskin, A.; Finlayson-Pitts, B. J. Sodium nitrate particles: physical and chemical properties during hydration and dehydration, and implications for aged sea salt aerosols. Aerosol Sci. 2004, 35, 869-887.
(7) Wolff, E. W.; Jones, A. E.; Martin, T. J.; Grenfell, T. C. Modelling photochemical NOx production and nitrate loss in the upper snowpack of Antarctica. Geophys. Res. Lett. 2002, 29, 5.
(8) Blunier, T.; Floch, G. L.; Jacobi, H.-W.; Quansah, E. Isotopic view on nitrate loss in Antarctic surface snow. Geophys. Res. Lett. 2005, 32, L13501.
(9) Domine, F.; Shepson, P. B. Air-snow interactions and atmospheric chemistry. Science 2002, 297, 1506-1510.
(10) Boxe, C. S.; Colussi, A. J.; Hoffmann, M. R.; Perez, I. M.; Murphy, J. G.; Cohen, R. C. Kinerics of NO and NO2 evolution from illuminated frozen nitrate solutions. J. Phys. Chem. A 2006, 110, 3578-3583.
(11) Davis, D.; Nowak, J. B.; Chen, G.; Buhr, M.; Arimoto, R.; Hogan, A.; Eisele, F.; Mauldin, L.; Tanner, D.; Shetter, R.; Lefer, B.; McMurry, P. Unexpected high levels of NO oberved at South Pole. Geophys. Res. Lett. 2001, 28, 3625-3628.
(12) Manahan, S. E. Fundamentals of Environmental Chemistry. Lewis Publishers: Boca Raton, Fla., 2001.
(13) Weiner, E. R. Applications of Environmental Chemistry: A Practical Guide for Environmental Professionals. Lewis Publishers: Boca Raton, 2000.

123
(14) VanLoon, G. W.; Duffy, S. J. Environmental Chemistry: A Global Perspective. Oxford University Press: Oxford ; New York, 2000.
(15) Jones, J. B.; Holmes, R. M. Surface-subsurface interactions in stream ecosystems. Trends in Ecology & Evolution 1996, 11, 239-242.
(16) Wu, L.; Green, R.; Yates, M. V.; Pacheco, P.; Klein, G. Nitrate leaching in overseeded bermudagrass fairways. Crop Science 2007, 47, 2521-2528.
(17) Spiro, T. G.; Stigliani, W. M. Chemistry of the Envionment. Prentice Hall: Upper Saddle River, New Jersey, 2003.
(18) Salvador, P.; Curtis, J. E.; tobias, D. J.; Jungwirth, P. Polarizability of the nitrate anion and its solvation at the air/water interface. Phys. Chem. Chem. Phys. 2003, 5, 3752-3757.
(19) Dang, L. X.; Chang, T.-M.; Roeselova, M.; Garrett, B. C.; Tobias, D. J. On NO3−H2O interactions in aqueous solutions and at interfaces. J. Chem. Phys. 2006, 124, 066101.
(20) Minofar, B.; Vacha, R.; Wahab, A.; Mahiuddin, S.; Kunz, W.; Jungwirth, P. Prepensity for the air/water interface and ion pairing in magnesium acetate vs magnisium nitrate solutions: molecular dynamics simulations and surface tension measurements. J. Phys. Chem. B 2006, 15939-15944.
(21) Thomas, J. L.; Roeselova, M.; Dang, L. X.; Tobias, D. J. Molecular dynamics simulations of the solution-air interface of aqueous nitrate. J. Phys. Chem. A 2007, 111, 3091-3098.
(22) Zhuang, X.; Miranda, P. B.; Kim, D.; Shen, Y. R. Mapping molecular orientation and conformation at interfaces by surface nonlinear optics. Phys. Rev. B 1999, 59, 12632-12640.
(23) Lambert, A. G.; Davies, P. B. Implementing the theory of sum frequency generation vibrational spectroscopy: A tutorial review. Appl. Spectrosc. Rev. 2005, 40, 103-145.
(24) Moad, A. J.; Simpson, G. J. A Unified Treatment of Selection Rules and Symmetry Relations for Sum-Frequency and Second Harmonic Spectroscopies. J. Phys. Chem. B 2004, 108, 3548.
(25) Gopalakrishnan, S.; Liu, D.; Allen, H. C.; Kuo, M.; Shultz, M. J. Vibrational spectroscopic studies of aqueous interfaces: Salts, acids, and nanodrops. Chem. Rev. 2006, 106, 1155-1175.
(26) Wang, H.-F.; Gan, W.; Lu, R.; Rao, Y.; Wu, B.-H. Quantitative spectral and orientational analysis in surface sum frequency generation vibrational spectroscopy (SFG-VS). Int. Rev. Phys. Chem. 2005, 24, 191-256.

124
(27) Long, D. A. The Raman Effect: A Unified Treatment of the Theory of Raman Scattering by Molecules. John Wiley & Sons: Chichester, England, 2001.
(28) Harris, D. C.; Bertolucci, M. D. Symmetry and Spectroscopy: An Introduction to Vibrational and Electronic Spectroscopy. Dover Publications: New York, 1989.
(29) Zhang, D.; Gutow, J.; Eisenthal, K. B. Vibrational spectra, orientations, and phase transitions in long-chain amphiphiles at the air/water interface: Probing the head and tail groups by sum frequency generation. J. Phys. Chem. 1994, 98, 13729-13734.
(30) Superfine, R.; Huang, J. Y.; Shen, Y. R. Experimental determinantion of the sign of molecular dipole moment derivatives: An infrared-visible sum frequency generation absolute phase measurement study. Chem. Phys. Lett. 1990, 172, 303-306.
(31) Shen, Y. R.; Ostroverkhov, V. Sum-frequency vibrational spectroscopy on water interfaces: Polar orientation of water molecules at interfaces. Chem. Rev. 2006, 106, 1140-1154.
(32) Lucarini, V.; Saarinen, J. J.; Peiponen, K.-E.; Vartiainen, E. M. Kramers-Kronig Relations in Optical Materials Research. Springer: Berlin ; New York, 2005.
(33) Zelsmann, H. R. Temperature dependence of the optical constants for liquid H2O and D2O in the far IR region. J. Mol. Struct. 1995, 350, 95-114.
(34) Bertie, J. E.; Eysel, H. H. Infrared intensities of liquids I: Determination of infrared optical and dielectric constants by FT-IR using the CIRCLE ATR Cell. Appl. Spectrosc. 1985, 39, 392-401.
(35) Bertie, J. E.; Lan, Z. Infrared intensities of liquids XX: The intensity of the OH stretching band of liquid water revisitedm and the best current values of the optical constants of H2O(l) at 25°C between 15,000 and 1 cm-1. Appl. Spectrosc. 1996, 50, 1047-1057.
(36) Kocak, A.; Berets, S. L.; Milosevic, V.; Milosevic, M. Using the Kramers-Kronig method to determine optical constants and evaluating its suitability as a linear transform for near-normal front-surface reflectance spectra. Appl. Spectrosc. 2006, 60, 1004-1007.
(37) Iizuka, K. Elements of Photonics. Wiley-Interscience: New York, N. Y., 2002.
(38) Liu, D.; Ma, G.; Levering, L. M.; Allen, H. C. Vibrational spectroscopy of aqueous sodium halide solutions and air-liquid interfaces: Observation of increased interfacial depth. J. Phys. Chem. B 2004, 108, 2252-2260.

125
(39) Xu, M.; Liu, D.; Allen, H. C. Ethylenediamine at air/liquid and air/silica interfaces: Protonation versus hydrogen bonding investigated by sum frequency generation spectroscopy. Environ. Sci. Technol. 2006, 40, 1566 -1572.
(40) Xu, M.; Callahan, K. M.; Tang, C. Y.; Tobias, D. J.; Allen, H. C. Nitrate ions and ion pairing at the air-aqueous interface. In preparation. 2008.
(41) Hommel, E. L. A broad bandwidth sum frequency generation spectroscopic investigation of organic liquid surfaces. The Ohio State University, 2003.
(42) Marcus, Y.; Hefter, G. Ion pairing. Chem. Rev. 2006, 106, 4585-4621.
(43) Buchner, R.; Chen, T.; Hefter, G. Complexity in "simple" electrolyte solutions: Ion pairing in MgSO4(aq). J. Phys. Chem. B 2004, 108, 2365-2375.
(44) Collins, K. D. Charge density-dependent strength of hydration and biological structure. Biophys. J. 1997, 72, 65-76.
(45) Fleissner, G.; Hallbrucker, A.; Mayer, E. Increasing contact ion pairing in the supercooled and glassy states of "dilute" aqueous magnesium, calcium, and strontium nitrate solution. Implications for biomolecules. J. Phys. Chem. 1993, 97, 4806-4814.
(46) Marcus, Y. Ion solvation. Wiley: Chichester, U. K., 1985.
(47) Irish, D. E.; Davis, A. R.; Plane, R. A. Types of interaction in some aqueous metal nitrate systems. J. Chem. Phys. 1969, 50, 2262-2263.
(48) Fleissner, G.; Hallbrucker, A.; Mayer, E. Raman spectroscopic evidence for increasing contact-ion pairing in the glassy states of "dilute" aqueous calcium nitrate solutions. Chem. Phys. Lett. 1994, 218, 93-99.
(49) Waterland, M. R.; Stockwell, D.; Kelley, A. M. Symmetry breaking effects in NO3-: Raman spectra of nitrate salts and ab initio resonance Raman spectra of nitrate-water complexes. J. Chem. Phys. 2001, 114, 6249-6258.
(50) Frost, R. L.; James, D. W. Ion-ion-solvent interactions in solution part 4. Raman spectra of aqueous solutions of some nitrates with monovalent cations. J. Chem. Soc., Faraday Trans. 1982, 78, 3235-3247.
(51) Irish, D. E.; Walrafen, G. E. Raman and infrared spectral studies of aqueous calcium nitrate solutions. J. Chem. Phys. 1967, 46, 378-384.
(52) Hester, R. E.; Plane, R. A. Raman spectrophotometric study of complex formation in aquesous solutions of calcium nitrate. J. Chem. Phys. 1964, 40, 411-414.
(53) Peleg, M. A Raman spectroscopic investigation of megnesium nitrate-water system. J. Phys. Chem. 1972, 76, 1019-1025.
(54) Smirnov, P.; Yamagami, M.; Wakita, H.; Yamaguchi, T. An X-ray diffraction study on concentrated aqueous calcium nitrate solutions at subzero

126
temperatures. J. Mol. Liq. 1997, 73/74, 305-316.
(55) Rohman, N.; Wahab, A.; Mahiuddin, S. Isentropic compressibility, shear relaxation time, and Raman spectra of aqueous calcium nitrate and cadmium nitrate solutions. J. Solution Chem. 2005, 34, 77-94.
(56) Spohn, P. D.; Brill, T. B. Raman spectroscopy of the species in concentrated aqueous solutions of Zn(NO3)2, Ca(NO3)2, Cd(NO3)2, LiNO3, and NaNO3 up to 450°C and 30 MPa. J. Phys. Chem. 1989, 93, 6224-6231.
(57) Chang, T. G.; Irish, D. E. Raman and infrared spectral study of magnesium nitrate-water systems. J. Phys. Chem. 1973, 77, 52-57.
(58) Hester, R. E.; Plane, R. A. Vibrational spectroscopies study of contact ion pairing between Zn++ and NO3
- in water. J. Chem. Phys. 1966, 45, 4588-4593.
(59) Wahab, A.; Mahiuddin, S.; Hefter, G.; Kunz, W.; Minofar, B.; Jungwirth, P. Ultrasonic velocities, densities, viscosities, electrical conductivites, Raman spectra, and molecular dynamics simulations of aqueous solutions of Mg(OAc)2 and Mg(NO3)2: Hofmeister effects and ion pair formation. J. Phys. Chem. B 2005, 109, 24108-24120.
(60) Irish, D. E.; Davis, A. R. Interactions in aqueous alkali metal nitrate solutions. Can. J. Chem. 1968, 46, 943-951.
(61) Irish, D. E.; Chang, G.; Nelson, D. L. Concerning cation-nitrate ion contact in aquesous solutions. Inorg. Chem. 1970, 9, 425-426.
(62) Kiriukhin, M. Y.; Collins, K. D. Dynamic hydration numbers for biologically important ions. Biophys. Chem. 2002, 99, 155-168.
(63) Watanabe, D.; Hamaguchi, H. Ion association dynamics in aqueous solutions of sulfate salts as studied by Raman band shape analysis. J. Chem. Phys. 2005, 123, 034508.
(64) Rudolph, W. W.; Irmer, G.; Hefter, G. T. Raman spectroscopic investigation of speciation in MgSO4 (aq). Phys. Chem. Chem. Phys. 2003, 5, 5253-5261.
(65) Vollmar, P. M. Ionic interactions in aquesous solution: a Raman spectral study. J. Chem. Phys. 1963, 39, 2236-2248.
(66) Ikushima, Y.; Saito, N.; Arai, M. Raman spectal stdies of aqueous zinc nitrate solution at high temperatures and at a high pressure of 30 MPa. J. Phys. Chem. B 1998, 102, 3029-3035.
(67) Zhang, Y.-H.; Choi, M. Y.; Chan, C. K. Relating hygroscopic properties of magnesium nitrate to the formation of contact ion pairs. J. Phys. Chem. A 2004, 108, 1712-1718.
(68) Frank, H. S.; Wen, W.-Y. Structural aspects of ion-solvent interaction in

127
aqueous solutions: A suggested picture of water structure. Discuss. Faraday Soc. 1957, 24, 133.
(69) Irish, D. E.; Chang, T. G.; Tang, S.-Y. Raman and ultrasonic relaxation studies of some nitrate salts in N-methylacetamide. J. Phys. Chem. 1981, 85, 1686-1692.
(70) Shen, M.; Xie, Y.; Schaefer, H. F. Hydrogen bonding between the nitrate anion (conventional and peroxy forms) and water molecule. J. Chem. Phys. 1990, 93, 3379-3388.
(71) Waterland, M. R.; Kelley, A. M. Far-ultraviolet resonance Raman spectroscopy of nitrate ion in solution. J. Chem. Phys. 2000, 113, 6760-6773.
(72) Xu, M.; Larentzos, J.; Roshdy, M.; Spinney, R.; Criscenti, L. J.; Allen, H. C. Raman studies of aqueous metal-nitrate solutions: Hydration versus ion pairing. In preparation. 2008.
(73) Kido Soule, M. C.; Blower, P. G.; Richmond, G. L. Nonliear vibrational spectroscopic studies of the adsorption and speciation of nitric acid at the vapor/acid solution interface. J. Phys. Chem. A 2007, 111, 3349-3357.
(74) Schnitzer, C. S.; Baldelli, S.; Shultz, M. J. Sum frequency generation of water on NaCl, NaNO3, KHSO4, HCl, HNO3, and H2SO4 aqueous solutions. J. Phys. Chem. B 2000, 104, 585-590.
(75) Lilley, T. H. Thermodynamic introduction to solute-solute and solute-solvent interactions in biological fluids. In Handbook of Metal-Ligand Interactions in Biological Fluids. Bioinorganic Chemistry. Berthon, G., Ed.; Marcel Dekker, Inc.: New York, 1995; Vol. 1.
(76) Bertie, J. E.; Michaelian, K. H. Comparison of infrared and Raman wave numbers of neat molecular liquids: Which is the correct infrared wave number to use? J. Chem. Phys. 1998, 109, 6764-6771.
(77) Torii, H. Time-domain calculations of the polarized Raman spectra, the transient infrared absorption anisotropy, and the extent of delocalization of the OH stretching mode of liquid water. J. Phys. Chem. A 2006, 110, 9469-9477.
(78) Jungwirth, P.; Tobias, D. J. Specific ion effects at the air/water interface. Chem. Rev. 2006, 106, 1259-1281.
(79) Petersen, P. B.; Saykally, R. J. On the nature of ions at the liquid water surface. Annu. Rev. Phys. Chem. 2006, 57, 333-364.
(80) Durand-Vidal, S.; Simonin, J. P.; Turq, P. Electrolytes at interfaces. Kluwer Academic: Dordrecht ; Boston, 2000.
(81) Adamson, A. W.; Gast, A. P. Physical chemistry of surfaces. Wiley: New

128
York, 1997.
(82) Jungwirth, P. T., Douglas J. Molecular structure of salt solutions: A new view of the interface with implications for heterogeneous atmospheric chemistry. J. Phy. Chem. B 2001, 105, 10468-10472.
(83) Jungwirth, P.; Tobias, D. J. Ions at the air/water interface. J. Phys. Chem. B 2002, 106, 6361-6373.
(84) Dang, L. X.; Chang, T. M. Molecular mechanism of ion binding to the liquid/vapor interface of water. J. Phy. Chem. B 2002, 106, 235-238.
(85) Petersen, P. B.; Saykally, R. J.; Mucha, M.; Jungwirth, P. Enhanced concentration of polarizable anions at the liquid water surface: SHG spectroscopy and MD simulations of sodium thiocyanide. J. Phy. Chem. B 2005, 109, 10915-10921.
(86) Mucha, M.; Frigato, T.; Levering, L. M.; Allen, H. C.; Tobias, D. J.; Dang, L. X.; Jungwirth, P. Unified molecular picture of the surfaces of aqueous acid, base, and salt solutions. J. Phys. Chem. B 2005, 109, 7617-7623.
(87) Levering, L. M.; Sierra-Hernandez, M. R.; Allen, H. C. Observation of hydronium ions at the air-aqueous acid interface: Vibrational spectroscopic studies of aqueous HCl, HBr, and HI. J. Phys. Chem. C 2007, 111, 8814-8826.
(88) Petersen, P. B.; Saykally, R. J. Evidence of an enhanced hydronium concentration at the liquid water surface. J. Phys. Chem. B 2005, 109, 7976-7980.
(89) Yang, X.; Kiran, B.; Wang, X. B.; Wang, L. S.; Mucha, M.; Jungwirth, P. Solvation of the azide anion (N3
-) in water clusters and aqueous interface: A combined investigation by photoelectron spectroscopy, density functional calculations, and molecular dynamics simulations. J. Phy. Chem. A 2004, 108, 7820-7826.
(90) Shultz, M. J.; Baldelli, S.; Schnitzer, C.; Simonelli, D. Aqueous solutions/air interfaces probed with sum frequency generation spectroscopy. J. Phys. Chem. B 2002, 106, 5313-5324.
(91) Richmond, G. L. Molecular Bonding and Interactions at Aqueous Surfaces as Probed by Vibrational Sum frequency Spectroscopy. Chem. Rev. 2002, 102, 2693-2724.
(92) Smith, J. D.; Cappa, C. D.; Wilson, K. R.; Cohen, R. C.; Geissler, P. L.; Saykally, R. J. Unified description of temperature-dependent hydrogen-bond rearrangement in liquid water. Proc. Natl. Acad. Sci. 2005, 102, 14171-14174.
(93) Wang, Z.; Pang, Y.; Dlott, D. D. Hydrogen-bond disruption by vibrational excitations in water. J. Phys. Chem. A 2007, 111, 3196-3208.
(94) Gopalakrishnan, S.; Jungwirth, P.; Tobias, D. J.; Allen, H. C. Air-liquid

129
interfaces of aqueous solution containing ammonum and sulfate: Spectroscopic and molecular dynamics studies. J. Phys. Chem. B 2005, 109, 8861-8872.
(95) Raymond, E. A.; Richmond, G. L. Probing the molecular structure and bonding of the surface of aqueous salt solutions. J. Phys. Chem. B 2004, 108, 5051-5059.
(96) Al-Abadleh, H. A.; Grassian, V. H. Oxide surfaces as environmental interfaces. Surf. Sci. Rep. 2003, 52, 63.
(97) Usher, C. R.; Michel, A. E.; Grassian, V. H. Reactions on mineral dust. Chem. Rev. 2003, 103, 4883.
(98) Leung, H.-W. Evaluation of the genotoxic potential of alkyleneamines. Mutat. Res. 1994, 320, 31-43.
(99) Bultinck, P.; Goeminne, A.; Van de Vondel, D. Ab initio conformational analysis of the chelating bidentate ligands ethylenediamine and 1,3-propanediamine. J. Mol. Struct. (Theochem) 1995, 339, 1-14.
(100) Rasmussen, K.; Tosi, C. Conformational analysis of 1,2-ethanediamine and 1,3-propanediamine by CFF, PCILO and ab initio methods. Acta Chemica Scandinavica A 1983, 37, 79-91.
(101) Kazerouni, M. R.; Hedberg, L.; Hedberg, K. Conformational analysis. 16. ethylenediamine. an electron-diffraction and ab initio investigation of molecular strcture, conformational composition, anti-gauche energy and entropy differences, and implications for internal hydrogen bonding. J. Am. Chem. Soc. 1994, 116, 5279-5284.
(102) Van Alsenoy, C.; Siam, K.; Ewbank, J. D.; Schafer, L. Ab initio studies of structural features not easily amenable to experiment. J. Mol. Struct. (Theochem) 1986, 136, 77-91.
(103) Adsorption on Silica Surface. Papirer, E., Ed.; Marcel Dekker, Inc.: New York, 2000; Vol. 90.
(104) Vidyadhar, A.; Rao, K. H.; Chernyshova, I. V. Mechanisms of amine-quartz interaction in the absence and presence of alcohols studied by spectroscopic methods. J. Colloid Interface Sci. 2002, 256, 59-72.
(105) Hirva, P.; Pakkanen, T. A. Modeling the interaction of amine bases on isolated and geminal hydroxyl groups on silica. Surface Science 1992, 271, 530-538.
(106) Gay, I. D.; Liang, S. Investigation of surface acidity by 13C NMR: adsorption of amines on silica, alumina, and mixed silica-alumina. J. Catal. 1976, 44, 306-313.
(107) Bucatariu, F.; Simon, F.; Spange, S.; Schwarz, S.; Dragan, S. Adsorption of poly(vinyl formamide-co-vinyl amine) onto silica particle surfaces and stability of the
130
formaed hybrid materials. Macromol. Symp. 2004, 210, 219-228.
(108) McCain, K. S.; Schluesche, P.; Harris, J. M. Modifying the adsorption behavior of polyamidoamine dendrimers at silica surfaces investigated by total internal reflection fluorescence correlation spectroscopy. Anal. Chem. 2004, 76, 930-938.
(109) Sokoll, R.; Hobert, H. Thermal desorption and infrared studies of amine adsorbed on SiO2, Al2O3, Fe2O3, MgO and CaO: III. aniline and t-butylamine. J. Catal. 1990, 125, 285-291.
(110) Sokoll, R.; Hobert, H.; Schmuck, I. Thermal desorption and infrared studies of amine adsorbed on SiO2, Al2O3, Fe2O3, MgO and CaO: I. diethylamine and triethylamine. J. Catal. 1990, 121, 153-164.
(111) Sokoll, R.; Hobert, H.; Schmuck, I. Thermal desorption and infrared studies of amine adsorbed on SiO2, Al2O3, Fe2O3, MgO and CaO: II. isopropylamine and cyclohexylamine. J. Catal. 1990, 125, 276-284.
(112) Chabal, Y. J.; Hines, M. A.; Feijoo, D. Characterization of silicon surfaces and interfaces by optical vibrational spectroscopy. J. Vac. Sci. Technol. A 1995, 13, 1719-1727.
(113) Yaws, C. L.; Yang, H.-C. Henry's law constant for compound in water. In Thermodynamic and Physical Property Data; Yaws, C. L., Ed.; Gulf Publishing Company: Houston, TX, 1992; Vol.; pp 181-206.
(114) Defay, R.; Prigogine, I.; Bellemans, A. Surface Tension and Adsorption. John Wiley and Sons, Inc.: New York, NY, 1966.
(115) Jonsson, B.; B., L.; Holmberg, K.; Kronberg, B. Surfactants and Polymers in Aqueous Solution. John Wiley & Sons Ltd:, 1998.
(116) Tyrode, E.; Johnson, C. M.; Baldelli, S.; Leygraf, C.; Rutland, M. W. A vibrational sum frequency spectroscopy study of the liquid-gas interface of acetic acid-water mixtures: 2. orientation analysis. J. Phy. Chem. B 2005, 109, 329.
(117) Miranda, P. B.; Shen, Y. R. Liquid Interfaces: A Study by Sum-Frequency Vibrational Spectroscopy. J. Phys. Chem. B 1999, 103, 3292-3307.
(118) Buck, M.; Himmelhaus, M. Vibrational spectroscopy of interfaces by infrared-visible sum frequency generation. J. Vac. Sci. Technol. A 2001, 19, 2717-2736.
(119) Allen, H. C.; Raymond, E., A.; Richmond, G. L. Nonlinear vibrational sum frequency generation spectroscopy of atmospherically relevant molecules at aqueous solution surfaces. Curr. Opin. Colloid Interface Sci. 2000, 5, 74-80.
(120) Righini, R.; Calfano, S. The vibrational optical spectrum of ethylenediamine crystal: calculation of the one-phonon spectrum of the high-temperature

131
crystal form. Chemical Physics 1976, 17, 45-57.
(121) Kudoh, S.; TAkayanagi, M.; Nakata, M.; Ishibashi, T.; M., T. Infrared-induced rotational isomerization of 1,2-ethanediamine in argon matrices and conformational analysis by DFT calculation. J. Mol. Struct. 1999, 479, 41-52.
(122) Giorgini, M. G.; Pelletti, M. R.; Paliani, G.; Cataliotti, R. S. Vibrational Spectra and Assignments of Ethylene-Diamine and its Deuterated Derivatives. J. Raman Spectrosc. 1983, 14, 16-21.
(123) Batista de Carvalho, L. A. E.; Lourenco, L. E.; Margues, M. P. M. Confirmational study of 1,2-diaminoethane by combined ab initio MO calculations and Raman spectroscopy. J. Mol. Struct. 1999, 482-483, 639-646.
(124) Hirose, C.; Akamatsu, N.; Domen, K. Formulas for the analysis of surface sum-frequency generation spectrum by CH stretching modes of methyl and methylene groups. J. Chem. Phys. 1992, 96, 997-1004.
(125) Lu, R.; Gan, W.; Wu, B.-H.; Chen, H.; Wang, H.-f. Vibrational polarization spectroscopy of CH stretching modes of the methylene group at the vapor/liquid interfaces with sum frequency generation. J. Phy. Chem. B 2004, 1008.
(126) Wei, X.; Hong, S.; Zhuang, X.; Goto, T.; Shen, Y. R. Nonlinear optical studies of liquid crystal alignment on a rubbed polyvinyl alcohol surface. Phys. Rev. E: Statistical Physics, Plasmas, Fluids, and Related Interdisciplinary Topics 2000, 62, 5160-5172.
(127) Scherer, J. R. The Vibrational Spectroscopy of Water. In Advances in Infrared and Raman Spectroscopy; Clark, R. J. H., Hester, R. E., Ed.; Heyden: Philadelphia, 1978; Vol. 5; pp 149-216.
(128) Allen, H. C.; Raymond, E. A.; Richmond, G. L. Surface structural studies of methanesulfonic acid at air/aqueous solution interfaces using vibrational sum frequency spectroscopy. J. Phys. Chem. A 2001, 105, 1649-1655.
(129) Buch, V.; Devlin, J. P. A New Interpretation of the OH-Stretch Spectrum of Ice. J. Chem. Phys. 1999, 110, 3437-3443.
(130) Liu, D.; Ma, G.; Allen, H. C. Adsorption of 4-picoline and piperidine onto hydrated SiO2 surface: Probing the surface acidity with vibrational sum frequency generation spectroscopy. Environ. Sci. Technol. 2005, 39, 2025-2032.
(131) Liu, D.; Ma, G.; Xu, M.; Allen, H. C. Adsorption of ethylene glycol vapor on a-Al2O3 (0001) and amorphous SiO2 surfaces: observation of molecular orientation and surface hydroxyl groups as sorption sites. Environ. Sci. Technol. 2005, 39, 206-212.
(132) Venables, J. A. Introduction to Surface and Thin Film Process. Cambridge University Press: Cambridge, UK, 2000.

132
(133) Ong, S.; Zhao, X.; Eisenthal, K. B. Polarization of water molecules at a chaged interface: Second harmonic studies of the silica/water interface. Chem. Phys. Lett. 1992, 191, 327.
(134) Sahai, N. Is Silica Really an Anomalous Oxide? Surface Acidity and Aqueous Hydrolysis Revisited. Environ. Sci. Technol. 2002, 36, 445.
(135) Dines, T. J.; MacGregor, L. D.; Rochester, C. H. The surface acidity of oxides probed by IR spectroscopy of adsorbed diazines. Phys. Chem. Chem. Phys. 2001, 3, 2676.
(136) Hiemstra, T.; Venema, P.; Van Riemsdijk, W. H. Intrinsic proton affinity of reactive surface groups of metal hydroxides: the bond valence principle. J. Colloid Interface Sci. 1996, 184, 680-692.
(137) Ma, G.; Liu, D.; Allen, H. C. Piperidine adsorption on hydrated a-alumina (0001) surface studied by vibrational sum frequency generation spectroscopy. Langmuir 2004.
(138) Bickmore, B. R.; Tadanier, C. J.; Rosso, K. M.; Monn, W. D.; Eggett, D. L. Bond-valence methods for pKa prediction: critical reanalysis and a new approach. Geochim. Cosmochim. Acta 2004, 68, 2025-2042.
(139) Querry, M. R.; Wieliczka, D. M.; Segelstein, D. J. Water (H2O). In Handbook of Optical Constants of Solids II. Palik, E. D., Ed.; Academic: Boston, 1991; pp 1059-1077.
(140) Segelstein, D. J. The Complex Refractive Index of Water. University of Missouri, Kansas City, 1981.
(141) Alberty, R. A. On the derivation of the Gibbs adsorption equation. Langmuir 1995, 11, 3598-3600.
(142) Smith, J. M.; Van Ness, H. C. Introduction to Chemical Engineering, 4th ed.; McGraw-Hill: New York, NY, 1987.
(143) Gmehlling, J.; Rasmussen, P.; Fredenslund, A. Vapor-liquid equlibria by UNIFAC group contribution. Revision and extension. 2. Ind. Eng. Chem. Process Des. Dev. 1982, 21, 118-127.
(144) Gaines, J., G. L. Langmuir-blodgett films of long-chain amines. Nature 1982, 298, 544-545.
(145) Wang, C.; Groenzin, H.; Shultz, M. J. Surface characterization of nanoscale TiO2 film by sum frequency generation using methanol as a molecular probe. J. Phys. Chem. B 2004, 108, 265-272.
(146) Brown, M. G.; Raymond, E. A.; Allen, H. C.; Scatena, L. F.; Richmond, G.
133
L. The Analysis of Interference Effects in the Sum Frequency Spectra of Water Interfaces. J. Phys. Chem. A 2000, 104, 10220-10226.
(147) Wang, J.; Chen, C.; Buck, S. M.; Chen, Z. Molecular chemical structure on poly(methyl methacrylate) (PMMA) surface studies by sum frequency generation (SFG) vibrational spectroscopy. J. Phys. Chem. B 2001, 105, 12118-12125.