vi. water quality · department of water resources, southern district, water resources of the...
TRANSCRIPT
Department of Water Resources, Southern District, Water Resources of the Arroyo Grande - Nipomo Mesa Area, 2002
1Discussions of the significance of these constituents may be found in McKee and Wolfe (1963) andsimilar water quality texts.
105 � Water Quality
VI. WATER QUALITY
Water quality reflects the composition of water as affected by natural causes and humanactivities, expressed in terms of measurable quantities and related to intended use. This chapterdiscusses the mineral quality conditions of both groundwater and surface water in the study area.
Because both groundwater and surface water are used for domestic supply within the study area,the California Department of Health Services’ Drinking Water Standards and relative hardnessare the criteria used in this study to evaluate the water quality. The concentrations of totaldissolved solids (TDS), sulfate, chloride, and nitrate from the list of constituents in the DrinkingWater Standards, along with the Department’s classification of relative hardness, were selectedas indicators of water quality (Table 22). High concentrations of any of these constituents wouldcompromise the suitability of a water as a potable supply.
The California Department of Health Services set primary standards for nitrate concentrations indrinking water--the primary standards pertain to constituents that present a health hazard. Thepotential health effects of high nitrate concentrations in potable water have long been recognized. Infants may suffer from methemoglobinemia following ingestion of water with nitrateconcentrations greater than 45 milligrams per liter (mg/L) as nitrate (Keeney, 1986). Otherpotential health effects include birth defects, cancer, and nervous system impairments (Ibid.).
Secondary standards for drinking water set by the California Department of Health Servicespertain to constituents that in excessive amounts may affect aesthetic qualities of water byimparting taste and odor and by staining fixtures. TDS, sulfate, and chloride have secondarystandards.1
Hardness can reduce the effectiveness of soap and shorten the life of hot water appliances,particularly water heaters and hot water piping.
The quality of water used for agriculture can also be measured relative to guidelines for irrigationor livestock. There are no government regulations for agricultural waters, but limits have beenrecommended by Ayers (1977), McKee and Wolfe (1963), National Academy of Sciences andNational Academy of Engineering (1973), and others. Limits vary by soil type and farmingpractices. Water quality guidelines for agriculture are in Appendix F.

Department of Water Resources, Southern District, Water Resources of the Arroyo Grande - Nipomo Mesa Area, 2002
2Organic chemical and metal contamination of groundwaters that can result from human activities is awater quality concern for all groundwater resources; however, this type of water quality degradation is not withinthe scope of this study.
106� Water Quality
TABLE 22DRINKING WATER STANDARDS FOR SELECTED CONSTITUENTS*
AND CLASSIFICATION OF RELATIVE HARDNESS
Constituents UnitsRecommended Limits Upper Limits**
Short Term Limits MCL*** Other Limits
Total Dissolved Solids
mg/L <500 1,000 1,500 -- --
Specific Conductance
micro-mhos/cm
900 1,600 2,200 -- --
SulfateChlorideNitrate
mg/Lmg/Lmg/L
<250<250 --
500500--
600600--
----45
------
Department of Water Resources classification of relative hardness. Hardness as CaCO3
SoftModerateVery hard
mg/Lmg/Lmg/L
------
------
------
<100100-200
>200 *From: California Administrative Code, 1989, California Domestic Water Quality and Monitoring Regulations: Sections 64435 (a), 64444.5, and 64473 (a), Chapter 15, Title 22. **Maximum permissible when no other water available***Maximum Contaminant Level
Factors Affecting Groundwater Quality
Groundwater begins as rain or snow containing only traces of chemical constituents acquiredfrom atmospheric gases, vapors, and airborne particulates. Runoff then infiltrates and picks updissolved chemicals from the soil and the geologic environment. Human activities also mayaffect the quality of groundwater. These activities include use and reuse of groundwater, wastedisposal practices, application of agricultural fertilizers and pesticides, irrigation return flow,urban runoff, leakage of solvents and gasoline from underground storage tanks and piping, andoil field operations.2 Effects from human activities can be obscured by the strong influence thatnatural hydrogeologic and geochemical effects may have in some areas. These changes ingroundwater quality are largely unavoidable and would become of concern only if they threatenongoing and potential beneficial uses of the groundwater supply.
Probable sources impairing the groundwater quality can be categorized as nonwaste related andwaste related.

Department of Water Resources, Southern District, Water Resources of the Arroyo Grande - Nipomo Mesa Area, 2002
107 � Water Quality
Nonwaste-related Sources
Nonwaste-related sources of impairment are: (1) local rocks, (2) mineralized zones, (3) residualsaline deposits, (4) connate water, and (5) sea water intrusion.
1. Depending upon their chemical composition, local rocks will contribute a wide range ofchemicals in solution to the groundwater. The Jurassic rocks underlying the basin andforming much of the hills and mountains of the watershed contribute calcium,magnesium, bicarbonate, and TDS to the groundwater. These chemicals contribute to thehardness of the water.
2. Fractured and pulverized rock in and near faults creates mineralized zones that morereadily yield chemicals to groundwater than do adjacent undisturbed areas.
3. Residual saline deposits contain salts deposited in the past by ocean water in some marineterraces or trapped in the sediments of estuary or lagoonal deposits. Unusually highchloride concentrations in groundwater would suggest residual saline deposits as apossible source, but contributions from these deposits may be indistinguishable fromlocal sea water intrusion.
4. Connate water is water trapped in the interstices of sedimentary rocks at the time of theirdeposition. It traditionally applies to old sediments. Waters that have been in long-timecontact with old sediments contain greater concentrations of minerals than doesgroundwater at shallow depths where the groundwater has been in the sedimentsrelatively briefly. Connate waters are high in TDS and sulfate concentrations.
5. Sea water intrusion, the movement of sea water into the freshwater aquifers underlyingland, occurs when the normal seaward gradient of groundwater is reversed to a landwardgradient by heavy pumping or by drought conditions that lower the groundwater levelnear or below sea level. Sea water intrusion may occur in unconfined water tableconditions or in discrete aquifers at depth. A rise in the chloride concentration in thegroundwater may be the first sign of sea water intrusion.
Waste-related Sources
In the study area, this category includes: (1) domestic and municipal waste discharges and (2)irrigation return water and livestock waste.
1. When discharged to land, domestic and municipal wastewater, whether treated oruntreated, will contribute solutes to the groundwater, notably chloride, nitrate, and TDS.
Wastewater from Arroyo Grande, Oceano, and Grover Beach is treated in the South SanLuis Obispo County Sanitation District’s WWTP, and the effluent is discharged via anocean outfall. Wastewater from the Pismo Beach WWTP is discharged through the South

Department of Water Resources, Southern District, Water Resources of the Arroyo Grande - Nipomo Mesa Area, 2002
3No recent quality data were available for the Arroyo Grande Plain and Los Berros Creek parts of the Tri-Cities Mesa - Arroyo Grande Plain portion of the main Santa Maria Basin.
108� Water Quality
San Luis Obispo County Sanitation District’s ocean outfall. Because wastewater fromthese communities is discharged out of the basin, it does not affect groundwater quality. In Nipomo Mesa, however, the two Nipomo Community Services District’s WWTPspractice land disposal and discharge treated effluent to percolation ponds or use it toirrigate a golf course.
Before the construction of the South San Luis Obispo Sanitation District’s WWTP andocean outfall, wastewater was treated in cesspools, in septic tanks, or in the old ArroyoGrande community WWTP, which discharged to percolation ponds. Use of the plant wasdiscontinued in June 1966. These old waste discharges probably continue to leach wastecomponents to the groundwater during heavy rains or high groundwater conditions andcan affect local groundwater quality.
The only large industrial waste discharger, an oil refinery near Highway 1 on NipomoMesa, discharges its wastewater to the ocean and out of the area.
2. Return flow from irrigation adds many different compounds to groundwater includingsulfate, nitrate, and TDS. Evapotranspiration then concentrates the constituents in theapplied supply water. The contributions from livestock waste are similar to those fromirrigation.
Groundwater Quality
To evaluate groundwater quality in this study, mineral quality data for the study area werecompiled from various sources, including the Department's own files, State Water ResourcesControl Board, California Department of Health Services, USGS, and local agencies. Samplingand analyses of groundwater were not conducted in this study (these activities were not withinthe scope of study). The decision to sample the seven sea water intrusion monitoring wells wasmade after work began on the study. These wells were sampled in March 1996.
The compiled database contains mineral analyses of groundwater from 403 wells sampledbetween 1927 and 2000 within the study area. Of these wells, about 50 percent were sampledonly once. Analyses for some well waters are only partial (just one or two constituents). Thecation-anion balances were checked for all complete analyses. Analyses that did not exhibit acation-anion balance were omitted from the compiled database.
Groundwater sampling in the study area has not been uniform temporally or spatially and theextent of recent available data varies greatly. Municipal system wells in the Tri-Cities Mesa3 andNipomo Mesa parts of the groundwater basin have been sampled at regular intervals and water
Department of Water Resources, Southern District, Water Resources of the Arroyo Grande - Nipomo Mesa Area, 2002
109 � Water Quality
quality data are available for these wells for the period of record through 2000. In NipomoValley Subbasin, a few wells were sampled once or twice in the 1990s and one well was sampledin 2000. Elsewhere in the basin, groundwater from wells was last sampled and analyzed in thelate 1960s or 1970s, except for a few wells sampled in 1987. Groundwater in some parts of thebasin has never been sampled.
The available groundwater quality data represent samples obtained from production wells, exceptfor samples from the sea water intrusion monitoring wells. Production wells generally have longscreened intervals, perforating multiple aquifers. Each aquifer may contain water of distinctlydifferent quality, and each aquifer may yield water to the production well at different or variablerates. Thus, the water quality samples represent mixtures of groundwater from different aquifers. Only the sea water intrusion monitoring wells have piezometers at selected depths and yielddepth-dependent samples.
Because of the available database for this study, the evaluation of groundwater quality in thestudy area is limited to graphical techniques and summary statistical analysis, including Stiff andtrilinear diagrams, boxplots, and chemical hydrographs.
Stiff diagrams were constructed and are presented on a map of the study area (Plate 15). Stiffdiagrams illustrate the relative abundance of the major mineral ions in water samples. Theshapes of the diagrams indicate dominant cations and anions characterizing the water and thewidth of the diagram is an approximation of the total ionic content. The character of a water maybe considered as a unique signature that often persists even after mixing with another water. Spatial relationships and patterns of differences and similarities in groundwater compositionwithin the study area may be perceived from the plate. The Stiff diagrams are based on analysesof groundwater sampled between 1990 and 2000, except for some 1980s analyses in parts of thebasin lacking more recent data. In these parts of the basin, the Stiff diagrams are shown in grayon the plate.
Because of the complexity of the basin, a trilinear diagram was prepared as another means ofrepresenting the chemical character of groundwater (Figure 25). Analyses from 79 wells wereplotted on the diagram. The wells were sampled between 1990 and 2000, except four wellssampled in the 1980s. A trilinear diagram shows the relative contribution of major cations andanions, on a charge-equivalent basis, to the total ionic content of the groundwater. Cations areshown in the left triangle and anions in the right triangle; the central diamond integrates the data. This diagram is useful for comparing large number of groundwater analyses throughout thebasin, and it points out arrays of data and singularities. It can also be helpful for showing theeffects of mixing two waters from different sources.
Plate 15 shows the areal distribution of groundwater quality, but does not show variations inchemical quality with depth. To evaluate vertical variability in groundwater quality, Stiffdiagrams were constructed and plotted on the coastal cross-section A-A’ (Plate 16). Thediagrams were constructed from the analyses of depth-dependent groundwater samples collectedin March 1996 from the piezometers of seven sea water intrusion monitoring wells.


Department of Water Resources, Southern District, Water Resources of the Arroyo Grande - Nipomo Mesa Area, 2002
111 � Water Quality
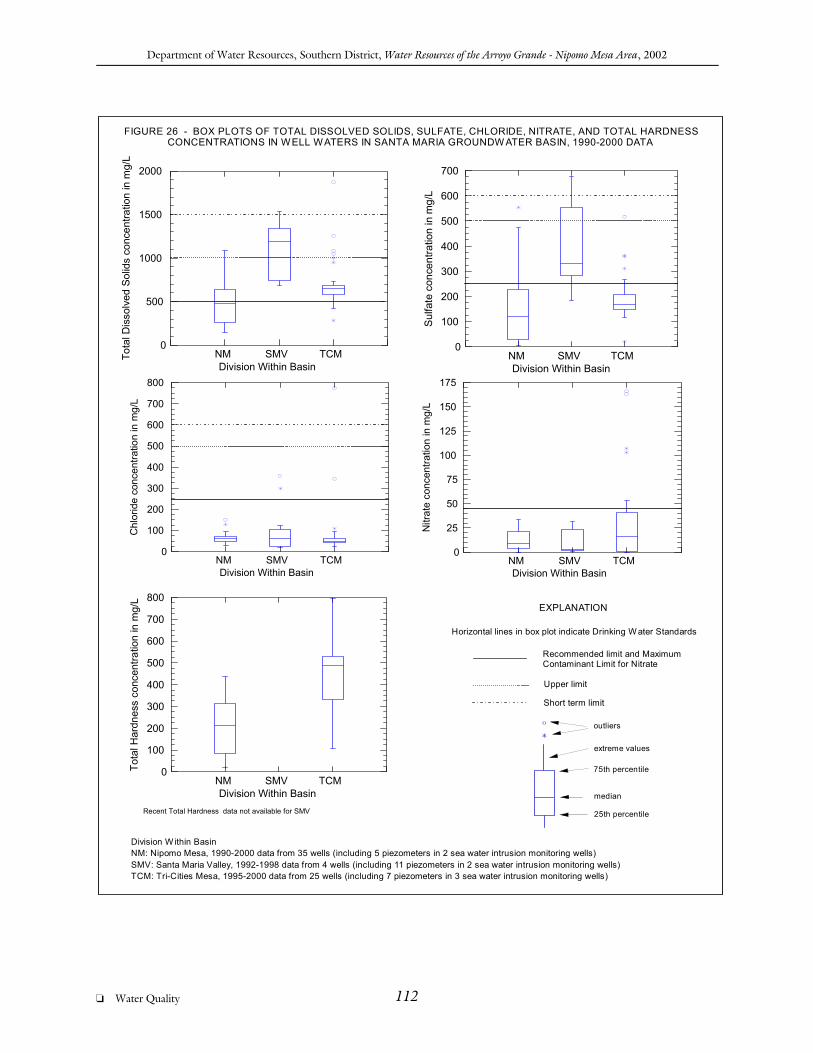
Boxplots were constructed to depict graphically the statistical descriptors of the recent data (1990through 2000) for quality constituents--TDS, sulfate, chloride, nitrate, and total hardness (Figure 26). These plots display the main aspects of the data--the middle 50 percent of the data values,between the values in the upper and lower 25 percent quartiles; the whiskers indicate the range ofvalues outside an interval of the interquartile range; and values outside the whisker range areplotted individually as outliers and extremes. Outlier and extreme values play important roles inproviding information on a data set. These values may represent unusual hydrogeologicconditions or degradation from human activities. The variability of the selected constituents, aswell as differences in quality between divisions within the groundwater basin, can be observedfrom these boxplots.
Chloride is a useful constituent to detect quality changes. In hydrochemical groundwaterevolution, the chloride ion tends to be the most conservative, being affected very little bybiological processes, by precipitation, or by anion exchange reactions in the soil (Pomeroy andOrlob, 1967). Chloride concentrations therefore normally increase down the hydraulic gradientand with groundwater residence (Lloyd and Heathcote, 1985). The normal increase in chlorideconcentration is disturbed only where pollution or dilution occurs. Thus, chloride is an excellentindicator of the direction of groundwater flow and of changes associated with long-term cycles ofrainfall or runoff or changes in land or water use.
Because chloride concentrations in groundwater may indicate quality changes over time, thisparameter was used to evaluate trends in the groundwater quality--if degradation has occurredover time. Wells with recurrent analyses of chloride concentrations over their period of recordwere evaluated and statistically tested to see if any trend existed. Three hydrographs are given asfigures accompanying the text for that part of the groundwater basin.
Care must be taken in interpreting any apparent trends in groundwater quality from the graphsand in extrapolating from data from a few wells to an entire basin. A basin will not changeuniformly in quality. The geologic fabric and chemical composition, character, and hydraulicproperties of groundwater are highly variable from place to place. Groundwater quality tends tochange at “points.” Any changes in quality over time are essentially specific to the wellsrepresented in the graphs.
A compilation of groundwater quality data for the study area is given in Appendix F.
Tri-Cities Mesa - Arroyo Grande Plain
Tri-Cities Mesa. In the Tri-Cities Mesa part of the basin, mineral quality constituents ingroundwater from 115 wells were analyzed from samples obtained between 1952 and 2000. Ofthose wells, 25 were sampled between 1995 and 2000, including seven piezometers in three seawater intrusion monitoring wells. Most of these wells with recent data are water agency wellsand are sampled recurrently. Sampled wells ranged from 36 to 610 feet in depth and extractedgroundwater from either the alluvium or the Paso Robles Formation only, from both thosedeposits, from the Squire Member of the Pismo Formation, or from the Squire Member in
Department of Water Resources, Southern District, Water Resources of the Arroyo Grande - Nipomo Mesa Area, 2002
112� Water Quality
NM SMV TCMDivision Within Basin
0
100
200
300
400
500
600
700
800
Chl
orid
e co
ncen
tratio
n in
mg/
L
NM SMV TCMDivision Within Basin
0
100
200
300
400
500
600
700
Sulfa
te c
o nce
ntra
tion
in m
g/L
NM SMV TCMDivision Within Basin
0
25
50
75
100
125
150
175
Nitr
ate
conc
entra
tion
in m
g/L
NM SMV TCMDivision Within Basin
0
500
1000
1500
2000
Tota
l Dis
solv
ed S
olid
s co
ncen
tratio
n in
mg/
L
Horizontal lines in box plot indicate Drinking W ater Standards
FIGURE 26 - BOX PLOTS OF TOTAL DISSOLVED SOLIDS, SULFATE, CHLORIDE, NITRATE, AND TOTAL HARDNESS CONCENTRATIONS IN WELL WATERS IN SANTA MARIA GROUNDW ATER BASIN, 1990-2000 DATA
EXPLANATION
outliers
extreme values
75th percentile
median
25th percentile
*
Recommended limit and Maximum Contaminant Limit for Nitrate
Upper limit
Short term limit
O
Division W ithin BasinNM: Nipomo Mesa, 1990-2000 data from 35 wells (including 5 piezometers in 2 sea water intrusion monitoring wells)SMV: Santa Maria Valley, 1992-1998 data from 4 wells (including 11 piezometers in 2 sea water intrusion monitoring wells)TCM: Tri-Cities Mesa, 1995-2000 data from 25 wells (including 7 piezometers in 3 sea water intrusion monitoring wells)
NM SMV TCMDivision Within Basin
0
100
200
300
400
500
600
700
800
Tota
l Har
dnes
s co
ncen
tratio
n i n
mg/
L
Recent Total Hardness data not available for SMV

Department of Water Resources, Southern District, Water Resources of the Arroyo Grande - Nipomo Mesa Area, 2002
113 � Water Quality
combination with the Paso Robles Formation.
Stiff diagrams in Plate 15 show that the dominant cation is calcium and the dominant anions arebicarbonate and sulfate, except for groundwater near the Wilmar Avenue fault. Wells near thefault (18P01 and 19B01) extract groundwater from the Squire Member and are sodium chloridein character. Well 32D11 and piezometer 24B03 are perforated in the Squire Member and wells30K19 and 19Q02 are perforated in both the Squire Member and the Paso Robles Formation. The other wells with diagrams are perforated in the Paso Robles Formation.
Figure 25 plots the recent data from 25 wells, including seven piezometers in three sea waterintrusion monitoring wells. The trilinear diagram shows the similarity of character of mostgroundwater found in this part of the basin, as well as the different character of groundwaterfound near the Wilmar Avenue fault.
Plate 16 illustrates vertical variability in groundwater quality in seven piezometers in three seawater intrusion monitoring wells, 32S/12E-24B, 32S/13E-30F, and 32S/13E-30N, in the Tri-Cities Mesa part of the basin. Piezometer 30N02 shows a mineral gain with depth in the PasoRobles Formation. This increase of about 400 mg/L in TDS content may result from the finergrained facies of the aquifer in this part of the basin. The Stiff diagrams show little variation inquality with depth of those piezometers in the Squire Member of the Pismo Formation. Groundwater from piezometer 24B01 in the alluvium of Pismo Creek shows a distinctly differentquality and character than the groundwater from the other piezometers. This situation was foundto be the result of solution of residual marine and evaporative salts indigenous to the geologicenvironment in this part of the basin (California Department of Water Resources, 1970).
Boxplots of 1995 to 2000 analyses of groundwater for quality parameters– TDS, sulfate,chloride, nitrate, and total hardness– for Tri-Cities Mesa are shown in Figure 26 along withboxplots of recent data for Nipomo Mesa and Santa Maria Valley. The analyses are from 25wells, including seven piezometers in three sea water intrusion monitoring wells.
The boxplot for TDS shows that most wells extracted groundwater with concentrations betweenabout 500 and 700 mg/L, meeting the upper limit Drinking Water Standard. The TDSconcentrations above 1,000 mg/L were found in two of the sea water intrusion monitoring wells,one well near the Wilmar Avenue fault and in a tributary of Pismo Creek, and two wells about150 feet deep near Arroyo Grande Creek. Most of the wells extract groundwater with sulfate andchloride concentrations below 250 mg/L, the recommended Drinking Water Standard for bothconstituents. Six of the analyses for nitrate concentrations in water from wells exceeded theMCL. The wells have a top-perforated interval of less than 100 feet in depth. Most of thegroundwater is classified as very hard, although a few wells in the northern part of the mesaproduce groundwater classified as moderate. Groundwater quality in wells in proximity to the Wilmar Avenue fault and along the coast maybe affected by mineralization from the fault zone, old saline deposits, or possibly local sea waterintrusion in the shallower deposits.
Department of Water Resources, Southern District, Water Resources of the Arroyo Grande - Nipomo Mesa Area, 2002
114� Water Quality
Groundwater is classified as suitable to marginal under water quality guidelines for agriculturalirrigation.
Historically, concentrations of TDS in groundwater were as high as 3,640 mg/L; sulfate, 644mg/L; and chloride, 1,626 mg/L. The wells with these high concentrations typically were alonglow marshy coastal areas, in the drainage of Pismo Creek, and in the southern part of the mesanear Arroyo Grande Creek. The concentrations were attributed to tidal inflows in lagoons nearthe shallow wells (California Department of Water Resources, 1970).
To determine if groundwater quality has changed over time, a chloride hydrograph of data fromeight wells sampled recurrently was constructed and the data were regressed over time (Figure27). Of those wells, only well 32S/13E-19Q02 had a statistically significant increase in chlorideconcentrations over time. This well extracts groundwater from the Paso Robles Formation andthe Squire Member of the Pismo Formation. Chloride concentrations rose about 35 mg/L over25 years. Well 32S/13E-29E01 had a statistically significant downward trend in chlorideconcentrations over time. This well extracts groundwater from the Paso Robles Formation. Chloride concentrations in groundwater extracted by the other wells show no significant trendsover time. The generally stable chloride quality over time is indicative of a net outflow ofgroundwater to the ocean.
Arroyo Grande Plain and Los Berros Creek. The plain is an area of intense farming. Inaddition, it receives runoff from Arroyo Grande Valley, also a farming area, and Los BerrosCreek, a small valley with orchards and small farm acreage, and in the past, a small feedlot forcattle.
No recent quality data were available for the Arroyo Grande Plain and Los Berros Creek parts ofthe basin. Given the data limitations, no trend analysis or box plots were developed for this partof the basin. Mineral constituents in groundwater from 41 wells were analyzed from samplestaken between 1950 and 1987. Of those wells, about three-fourths were sampled only once. Sampled wells are 38 to 396 feet deep, with most in the 90- to 100-foot range.
The chemical character of groundwater in the Arroyo Grande Plain part of the basin was typicallyeither calcium-magnesium sulfate or calcium-magnesium sulfate-bicarbonate. Plate 15 showsdiagrams for two 1987 analyses from well samples collected in Los Berros Creek. The dominantcations were calcium or sodium and the dominant anions were sulfate or chloride.
Historical data show that only 10 percent of the sampled wells produced groundwater with TDSconcentrations of less than 500 mg/L and about half the wells produced groundwater with sulfateconcentrations of less than 250 mg/L. About 15 percent of the sampled wells producedgroundwater with concentrations of TDS greater than 1,500 mg/L and sulfate greater than 500mg/L. These wells are generally near the confluence of Los Berros Creek with Arroyo GrandeCreek and in the southern part of the plain. Chloride concentrations in groundwater met therecommended Drinking Water Standard. About 40 percent of the wells produced groundwater

FIGURE 27 - TREND IN CHLORIDE CONCENTRATIONS IN GROUNDWATER, TRI-CITIES MESA
0.0
10.0
20.0
30.0
40.0
50.0
60.0
70.0
80.0
1951 1956 1961 1966 1971 1976 1981 1986 1991 1996 2001
Water Year
Chl
orid
e co
ncen
tratio
ns in
mg/
L
32S/13E-19Q02 32S/13E-29E01 32S/13E-29E07 32S/13E-29G01 32S/13E-29G1532S/13E-32D03 32S/13E-32D10 Linear (32S/13E-19Q02) Linear (32S/13E-29E01) Linear (32S/13E-29E07)Linear (32S/13E-29G01) Linear (32S/13E-29G15) Linear (32S/13E-32D03) Linear (32S/13E-32D10)
Departm
ent of Water R
esources, Southern District, W
ater Resources of the A
rroyo Grande - N
ipomo M
esa Area, 2002
115�
Water Q
uality

Department of Water Resources, Southern District, Water Resources of the Arroyo Grande - Nipomo Mesa Area, 2002
116� Water Quality
with concentrations of nitrate that exceeded the MCL. Groundwater quality was likely impairedby return irrigation water. The data indicate that most of the sampled groundwater was veryhard.
Some wells produced groundwater classified as marginal under water quality guidelines foragricultural irrigation.
Nipomo Mesa
In the Nipomo Mesa part of the basin, mineral quality constituents in groundwater from 101wells were analyzed from samples taken between 1953 and 2000. Of those wells, 35 have recentdata from 1990 through 2000, including two sea water intrusion monitoring wells with fivepiezometers. Most of these wells with recent data are water agency wells and are sampledrecurrently. Sampled wells range in depth from 24 to 810 feet, with well depth typicallyincreasing toward the west and south. South of the Santa Maria River fault, wells extractgroundwater from the Paso Robles Formation, with the deeper wells extracting from the CareagaFormation as well. North of the Santa Maria River fault, wells extract groundwater from thePaso Robles Formation and the Squire Member of the Pismo Formation, but none of these wellshas been sampled recently.
The Stiff diagrams in Plate 15 illustrate the varied chemical character and generally lower TDSconcentrations found in groundwater in Nipomo Mesa. Well 14E01 and wells south of MesaRoad (shown in Plate 15) in Nipomo Mesa extract groundwater from both the Paso Robles andCareaga Formations, except for well 24L01. This well is screened over 520 feet and representsquality from the older dune sand and the Paso Robles and Careaga Formations. Piezometer36L02 is perforated in the Careaga Formation. The other wells with diagrams in the mesa extractgroundwater from the Paso Robles Formation. North of Black Lake Canyon, many wells extractgroundwater with sodium as the dominant cation and chloride or bicarbonate as the dominantanion. South of the canyon, no one cation in extracted groundwater typically dominates, butsome wells extract groundwater with sulfate as the dominant anion. Figure 25 clearly shows the diversity of chemical character of groundwater extracted from themesa. The diagram plots the recent data from 35 wells. The diverse character reflects thecomplex hydrogeological environment of this part of the basin.
Vertical variability in groundwater quality in Nipomo Mesa is shown in Plate 16 with Stiffdiagrams for five piezometers in two sea water intrusion monitoring wells, 12N/36W-36L and11N/36W-12C. The chemical character of groundwater from piezometers 36L01, 12C01, and12C02 in the Paso Robles Formation is the same, calcium-magnesium-sodium sulfate. Groundwater from piezometer 12C02 shows a small mineral gain with depth, an increase ofabout 130 mg/L in TDS concentration. Groundwater from piezometers 36L02 and 12C03 in theCareaga Formation has a lower mineral content than the groundwater in the overlying PasoRobles Formation, a decrease of about 100 to 300 mg/L in TDS concentration. TDSconcentrations can be lower in the Careaga Formation than in the Paso Robles Formation. The
Department of Water Resources, Southern District, Water Resources of the Arroyo Grande - Nipomo Mesa Area, 2002
117 � Water Quality
formation is composed largely of quartz sand, rather than reworked Monterey shale as in the PasoRobles Formation, and is therefore less soluble, tending to decrease TDS concentrations. Themajor cation in the groundwater from these two piezometers may be either sodium or calciumwith secondary cations and the dominant anion is bicarbonate with either sulfate or chloride as asecondary anion.
Boxplots of 1990 to 2000 analyses of groundwater for quality parameters– TDS, sulfate,chloride, nitrate, and total hardness– for Nipomo Mesa are shown in Figure 26. The analyses arefrom 35 wells, including five piezometers in two sea water intrusion monitoring wells. Aboutthree-fourths of the sampled wells produced groundwater with TDS concentrations that are lessthan 500 mg/L and about 85 percent of the wells produced groundwater with sulfateconcentrations that are less than 250 mg/L. The higher sulfate and TDS concentrations ingroundwater are generally found in deeper wells and in the western and southern parts of themesa. Chloride concentrations in extracted groundwater are low, less than about 130 mg/L. Nitrate concentrations in groundwater from these wells met the MCL. About one-third of thesampled wells extract groundwater classified as soft; otherwise, it ranges from moderate to veryhard. The soft groundwater is mainly sodium chloride in character. Groundwater is classified as suitable to marginal under water quality guidelines for agriculturalirrigation.
To determine if groundwater quality has changed over time, a chloride hydrograph of data fromfive wells sampled recurrently was constructed and the data were regressed over time (Figure28). Of those wells, only well 11N/35W-24J01 had a statistically significant decline in chlorideconcentrations over time. This well extracts groundwater from the Paso Robles Formation. Chloride concentrations declined about 30 mg/L over about 20 years. Wells 11N/35W-10G04and 11N/34W-19L03 had statistically significant increases in chloride concentrations over time,rising about 7 mg/L in about 13 years in well 10G04 and about 18 mg/L in about 30 years in well19L03. Well 10G04 extracts groundwater from the Paso Robles Formation and is within the areaof the pumping depression shown in Plate 14. Well 19L03 extracts groundwater from the PasoRobles and Careaga Formations. Chloride concentrations in groundwater extracted by the otherwells show no significant trends over time.
Although wells 11N/35W-24L01 and 11N/35W-24L02 showed no increasing trend in chlorideconcentrations, well 24L02 and another well, 11N/35W-24L03, have shown increases in sulfateand TDS concentrations over their period of record. These wells are within the depressionshown in Plate 14 and the increases in concentrations of these two constituents may reflectgroundwater inflow from Santa Maria Valley. Data are not available to show any reduction inthe quality of groundwater in the mesa from the depression (Plate 14) and subsurface inflow ofgroundwater from Santa Maria Valley. Santa Maria Valley
Within the study area, the Santa Maria Valley is largely an agricultural area, with thousands of

FIGURE 28 - TREND IN CHLORIDE CONCENTRATIONS IN GROUNDWATER, NIPOMO MESA
0.0
20.0
40.0
60.0
80.0
100.0
120.0
1966 1971 1976 1981 1986 1991 1996 2001
Water Year
Chl
orid
e co
ncen
tratio
n in
mg/
L
11N/34W-19L03 11N/35W-10G04 11N/35W-24J01 11N/35W-24L01 S 11N/35W-24L02Linear (11N/34W-19L03) Linear (11N/35W-10G04) Linear (11N/35W-24J01) Linear (11N/35W-24L01 S) Linear (11N/35W-24L02)
Departm
ent of Water R
esources, Southern District, W
ater Resources of the A
rroyo Grande - N
ipomo M
esa Area, 2002
118�
Water Q
uality

Department of Water Resources, Southern District, Water Resources of the Arroyo Grande - Nipomo Mesa Area, 2002
119 � Water Quality
acres under irrigation.
In the Santa Maria Valley part of the basin, mineral quality constituents in groundwater from 74wells were analyzed from samples taken between 1927 and 1998. Only four wells have recentanalyses (1992 through 1998)– these were the two sea water intrusion monitoring wells withrecent data for 11 piezometers and two wells with partial analyses. Other than the sea waterintrusion monitoring wells, a complete mineral analysis of groundwater was last performed on asample from only one well in 1987. Data were available for one sample collected in 1985 andone in 1981. The lack of recent data is clearly seen in Plate 15. Sampled wells ranged from lessthan 50 feet to greater than 600 feet in depth and are perforated in alluvium or the Paso RoblesFormation or in both deposits.
Most groundwater in the valley may be characterized as a calcium-magnesium sulfate type (Plate15). This water type reflects the quality of recharge from the Santa Maria River, which receivesits flow from the Cuyama and Sisquoc Rivers. Gypsum deposits in Tertiary and pre-Tertiarymarine deposits in the Cuyama Valley have been thought to influence the quality of runoff in theCuyama River (Singer and Swarzenski, 1970).
The trilinear diagram in Figure 25 shows the dominant calcium-magnesium sulfate type ofgroundwater. Because the only recent complete analyses available were from the 11 piezometersin the two sea water intrusion monitoring wells, the data from the four wells sampled in the1980s were included in the diagram.
Plate 16 illustrates vertical variability in groundwater quality for 11 piezometers in two sea waterintrusion monitoring wells in the alluvium and the Paso Robles Formation in Santa Maria Valley,11N/36W-35J and 10N/36W-02Q. The Stiff diagrams show the large mineral decrease ingroundwater in the Paso Robles Formation from groundwater in the alluvium, as much as aboutan 800 mg/L decrease in TDS content. The quality of groundwater in the Paso Robles Formationis generally about the same regardless of depth, except for piezometer 35J03. The groundwaterin this piezometer may be affected by downward percolation of poorer quality water from thealluvium or possibly oil field activity.
Boxplots of the recent data shown in Figure 26 illustrate the high concentrations of TDS andsulfate found in the four wells described at the beginning of this section. The concentrations didnot meet recommended Drinking Water Standards. Except for one shallow piezometer and onewell near Highway 101, chloride concentrations met the recommended Drinking Water Standardand nitrate concentrations met the MCL. The groundwater extracted from these wells was notanalyzed for total hardness concentrations. The use and reuse of groundwater for irrigation have been considered the major factors affectingquality of groundwater in the valley within the study area. The deep percolation of applied waterwith salts added from use tends to increase the salt concentrations in groundwater with eachcycle of use.

Department of Water Resources, Southern District, Water Resources of the Arroyo Grande - Nipomo Mesa Area, 2002
120� Water Quality
Historical data show that concentrations of TDS and sulfate in groundwater from about three-fourths of the sampled wells met the upper limits for drinking water. The groundwater wasclassified as marginal to unsuitable under water quality guidelines for agricultural irrigation. About 25 percent of sampled wells extracted groundwater with nitrate concentrations thatexceeded the MCL; concentrations were as high as 240 mg/L. The higher concentrations tendedto be found in the shallower wells. Chloride concentrations in groundwater were generally lessthan 250 mg/L. Most of the groundwater was classified as very hard.
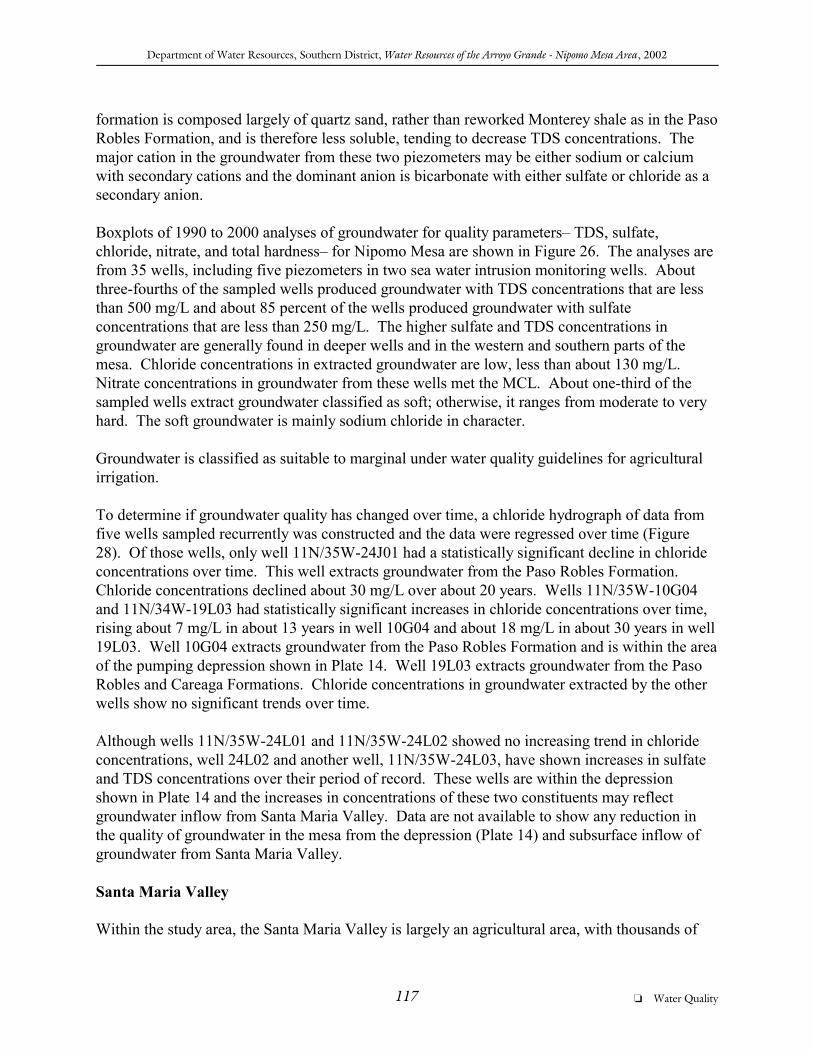
To determine if groundwater quality has changed over time, a chloride hydrograph of data fromeight piezometers in two sea water intrusion monitoring wells sampled recurrently wasconstructed and the data were regressed over time (Figure 29). Except for the shallowest alluvialpiezometer, 10N/36W-2Q07, chloride concentrations have been stable over time. The generallystable chloride quality over time is indicative of a net outflow of groundwater to the ocean. Theincrease in chloride concentrations in this piezometer is discussed in the section on sea waterintrusion in this chapter.
Arroyo Grande Valley Subbasin
No recent quality data were available for Arroyo Grande Valley Subbasin, except for a partialanalysis of a sample from one well in 1996. Given the data limitations, no trend analysis or boxplots were developed for this part of the basin. Mineral quality constituents in groundwater from21 wells were analyzed from samples collected between 1954 and 1987. Of those wells, 13 weresampled only once.
The Stiff diagrams of 1980s analyses in Plate 15 show the progressive deterioration of thegroundwater quality in a downstream direction. The chemical character of groundwater in thevalley is calcium-magnesium bicarbonate in the upstream section above the confluence with TarSpring Creek and calcium-magnesium sulfate in the downstream section below Tar SpringCreek. This downstream section overlies a zone of multiple faults that is probably highlymineralized and may impact the quality of the groundwater. Irrigation return water also mayimpact the quality. Sampled wells in the valley are 60 to 150 feet deep.
The historical data show that, except for concentrations of TDS and sulfate in water from onewell, concentrations of TDS, sulfate, and chloride in groundwater in the upstream section metDrinking Water Standards and the water was classified as suitable under water quality guidelinesfor agricultural irrigation. In the downstream section, TDS concentrations in extractedgroundwater were typically more than 1,500 mg/L and exceeded the short-term Drinking WaterStandard. Likewise, the sulfate concentrations were more than about 500 mg/L and exceeded theupper limit of the standard. The concentrations of these constituents also led to the groundwaterbeing classified as marginal to unsuitable under water quality guidelines for agriculturalirrigation. Chloride concentrations ranged between 17 and 136 mg/L and met the recommendedDrinking Water Standard. Nitrate concentrations in groundwater met the MCL, except in waterfrom two wells. Concentrations in these wells, sampled only one time, were 68 and 102 mg/L. Groundwater in the valley was classified as very hard.
FIGURE 29 - TREND IN CHLORIDE CONCENTRATIONS IN GROUNDWATER, SANTA MARIA VALLEY
0.0
50.0
100.0
150.0
200.0
250.0
300.0
350.0
400.0
450.0
500.0
550.0
1965 1970 1975 1980 1985 1990 1995 2000
Water Year
Chl
orid
e co
ncen
tratio
n in
mg/
L
10N/36W-02Q01 10N/36W-02Q03 10N/36W-02Q04 10N/36W-02Q07 11N/36W-35J0211N/36W-35J03 11N/36W-35J04 11N/36W-35J05 Linear (10N/36W-02Q01) Linear (10N/36W-02Q03)Linear (10N/36W-02Q04) Linear (10N/36W-02Q07) Linear (11N/36W-35J02) Linear (11N/36W-35J03) Linear (11N/36W-35J04)
Departm
ent of Water R
esources, Southern District, W
ater Resources of the A
rroyo Grande - N
ipomo M
esa Area, 2002
121�
Water Q
uality
Department of Water Resources, Southern District, Water Resources of the Arroyo Grande - Nipomo Mesa Area, 2002
122� Water Quality
Newsom’s Hot Springs are in Newsom Canyon, a tributary of Arroyo Grande Valley. The hotsulfur springs, emanating from Miocene rocks, occur probably along mineralized zones. Thesprings had been developed for public use. One of the springs issued water of 100�F. An 1888chemical analysis showed that the spring water was magnesium-calcium-sodium bicarbonate incharacter and had a TDS concentration of 630 mg/L.
Pismo Creek Valley Subbasin
No recent groundwater quality data were available for Pismo Creek Valley Subbasin. Thehistorical data consist of analyses from seven wells sampled in the 1950s and 1960s. Given thedata limitations, no trend analysis or box plots were developed for this part of the basin. Thedata indicate that groundwater quality in Pismo Creek Valley Subbasin generally did not meetDrinking Water Standards for sulfate, chloride, and TDS. Concentrations of sulfate ranged from740 to 1 mg/L; chloride, from 766 to 49 mg/L; and TDS, from 2,390 to 790 mg/L. Nitrateconcentrations in two wells exceeded the MCL. The dominant ions were sodium and chloride-bicarbonate or sulfate-chloride. A study by the Department in 1965 concluded that the poorquality of groundwater in lower Pismo Creek resulted from the presence of faults andmineralized zones, residual saline deposits, and local sea water intrusion. Sampled well depthsranged from 30 to 102 feet.
Nipomo Valley Subbasin
In Nipomo Valley Subbasin, mineral quality constituents in groundwater from 22 wells wereanalyzed from samples taken between 1962 and 2000. Of those wells, only six were sampledbetween 1992 and 2000. Sampled wells are between 40 and 400 feet deep. Groundwater isextracted mainly from the Obispo and Monterey Formations.
The chemical character of the groundwater, as shown by Stiff diagrams for wells in NipomoValley Subbasin in Plate 15, is mixed, no one cation or anion dominates.
TDS concentrations in groundwater sampled recently ranged between 750 and 1,300 mg/L;sulfate concentrations, between 200 and 340 mg/L; chloride concentrations, between 64 and 130mg/L; and nitrate concentrations, between not detected and 3.5 mg/L. Like most of thegroundwater in the study area, the groundwater is classified as very hard. Historical data showthat groundwater in two wells had nitrate concentrations that exceeded the MCL.
Groundwater is classified as suitable to marginal under water quality guidelines for agriculturalirrigation.
Occurrence of Nitrate
Nitrate is one of the most problematic of all groundwater mineral constituents and its toxicologyis such that Department of Health Services established the 45 mg/L (as nitrate) MCL.

Department of Water Resources, Southern District, Water Resources of the Arroyo Grande - Nipomo Mesa Area, 2002
4Because of the variability in nitrate concentrations, the median value of 30 mg/L was used for Plate 17.
123 � Water Quality
Because nitrate does not occur naturally in the study area, the nitrate found in the groundwater isa result of human activity. The main sources of nitrate are applied fertilizers and wastewater. Minor sources of nitrate are the animal waste produced by cattle feedlots, chicken and hogranches, and miscellaneous livestock. Some of these sources no longer exist, but the residualnitrate in the soils at the sites may continue to leach out, possibly affecting groundwater quality.
Nitrate from fertilizers is introduced into the groundwater basin over a broad area whereverirrigated acreage exists. Farms and orchards are found in all parts of the basin, but areconcentrated in Arroyo Grande Valley and Plain and in Santa Maria Valley. There are alsoseveral hundred acres of farms in Nipomo Valley Subbasin. The nitrate and nitrogen compoundsin the applied fertilizers are carried to groundwater with deep percolation of rainwater orirrigation return.
In the past, nitrate from wastewater effluent was also introduced into the groundwater basin overa broad area. Before the construction of wastewater collection systems and treatment plants, thestandard disposal method was by septic tanks and leachfields and cesspools wherever there was ahome, business, or farm. Later and until 1966, the City of Arroyo Grande operated a limitedcollection system and treatment plant, discharging its treated effluent to percolation ponds andspreading grounds southeast of Grover Beach. These old septic tank leachfields, cesspools, andponds are no longer operating, but they can continue to contribute nitrate and other minerals togroundwater as rainwater and irrigation return infiltrate to the underlying sediments and leach thenitrate compounds retained in the sediments. The rise and fall of groundwater levels during verywet seasons may also leach nitrate from the vadose zone above the water table.
With the building of the South San Luis Obispo County Sanitation District WWTP’s oceanoutfall, wastewater from this part of the groundwater basin has largely been removed as anongoing source of nitrate.
Nipomo Community Services District operates the Black Lake Golf Course and SouthlandWWTPs. Wastewater from the Black Lake Golf Course WWTP discharges to an aerated lagoonand ultimately is used to irrigate portions of the adjacent golf course. Sampled well water nearthe Black Lake Golf Course WWTP had low nitrate concentrations. The Southland WWTP,located southwest of Nipomo, collects and treats wastewater from Nipomo and a small part of themesa. After treatment, the effluent is discharged to percolation ponds from which it incidentallyrecharges the groundwater basin. Semi-annual sampling, between January 1995 and July 2000,of groundwater from Southland WWTP Monitoring Well Number 1 showed variable nitrateconcentrations, ranging between not detected and 301 mg/L, with a median concentration of 30mg/L (data provided by Doug Jones of Nipomo Community Services District).4 The nitrateconcentration in the well water was 4.4 mg/L in July 2000.
Grover Beach has continued to use the local groundwater, which is high in nitrate, by reducing

Department of Water Resources, Southern District, Water Resources of the Arroyo Grande - Nipomo Mesa Area, 2002
124� Water Quality
the nitrate concentrations to acceptable levels. In 1989, the city constructed a 2.3-million-gallonper day ion exchange plant. The supply wells are nearby. The product water from the plant ispiped directly into the water supply system. A report in 1993 indicated that of the 1,750 AF ofwater required by the city annually, 500 AF is produced by the nitrate removal plant.
Nitrate concentrations found in water from wells sampled between 1990 and 2000 are plotted inPlate 17. It graphically shows three ranges of nitrate concentrations in groundwater fromsampled wells. As can be seen on the plate, groundwater with nitrate concentrations exceedingthe MCL is found mainly in the Tri-Cities Mesa part of the basin.
The plate also shows the lack of recent data for large portions of the study area, particularly foragricultural areas (Santa Maria Valley and Arroyo Grande Plain and Valley). Historically,groundwater in these agricultural areas exceeded the MCL. The high nitrate concentrations hadbeen attributed to the ongoing agricultural activities.
In 1979, McCulley published results of a study that used isotopic analyses of nitrate ingroundwater to determine the source of nitrate in the Tri-Cities Mesa - Arroyo Grande Plainportion of the basin. Previous studies had been unable to determine whether cultivationpractices, fertilizer, or infiltration of wastewater from septic tanks is the source of nitrate. McCulley found that the congruent isotopic range of nitrate in groundwater and agricultural soilsdemonstrated that most of the nitrate in groundwater was from agricultural land use (1979, p.827). The study could not differentiate between nitrate derived from nitrogenous fertilizer andfrom oxidation of organic nitrogen.
The influence from the use of fertilizers will likely continue to be the major factor determiningnitrate concentrations in groundwater. Because nitrate concentrations may exceed the CaliforniaDepartment of Health Services’s MCL in some areas, it would be useful to routinely test fornitrate content in groundwater supplies for domestic use.
Sea Water Intrusion
The Santa Maria Groundwater Basin is hydraulically continuous offshore beneath the ocean. Ifgroundwater pumpage were to exceed recharge to the basin, the natural seaward gradient wouldreverse and sea water would migrate landward, displacing freshwater in the aquifer. This caneventually result in sea water intrusion into the inland basin and in water supply wells; however,sea water can migrate landward for many years before the inland basin is intruded. Seasons ofheavy rainfall, which result in increased recharge to the basin and reduced pumping from thebasin, will increase the seaward head in the groundwater and slow encroachment of sea water oreven reverse the process.
Data are inadequate to define the configuration and storage of the offshore aquifer and theoccurrence and extent of possible sea water intrusion in that aquifer. Thus, a monitoring programfor early detection of sea water intrusion into the landward groundwater basin is important for
Department of Water Resources, Southern District, Water Resources of the Arroyo Grande - Nipomo Mesa Area, 2002
5Samples could not be obtained from three shallow piezometers, 32S/13E-30F01, 32S/13E-30N01, and11N/36W-35J06, because they were dry.
125 � Water Quality
protection of the Santa Maria Groundwater Basin. The monitoring program should include plansto mitigate sea water intrusion before it occurs. Such plans might initially consider changes inspatial distribution and quantity of groundwater pumpage, along with surface water deliveries forartificial recharge.
Concentrations of 100 mg/L or more of chloride in samples are generally considered anindication of sea water intrusion (Izbicki, 1991). Nevertheless, chloride can come from othersources, such as natural mineral deposits, fertilizers, and naturally poor quality water. Consequently, a high concentration of chloride alone as an indicator of sea water intrusion can bemisleading. Other indicators of sea water intrusion should be considered together with the highchloride content in determining the presence of sea water intrusion.
In previous studies, the State and San Luis Obispo County constructed sea water intrusionmonitoring wells along the coast, between the City of Pismo Beach and the San Luis Obispo-Santa Barbara County line, a distance of about 12 miles. A typical monitoring well contains twoor more piezometers, separated by cement plugs to ensure discrete samples from selected depths.
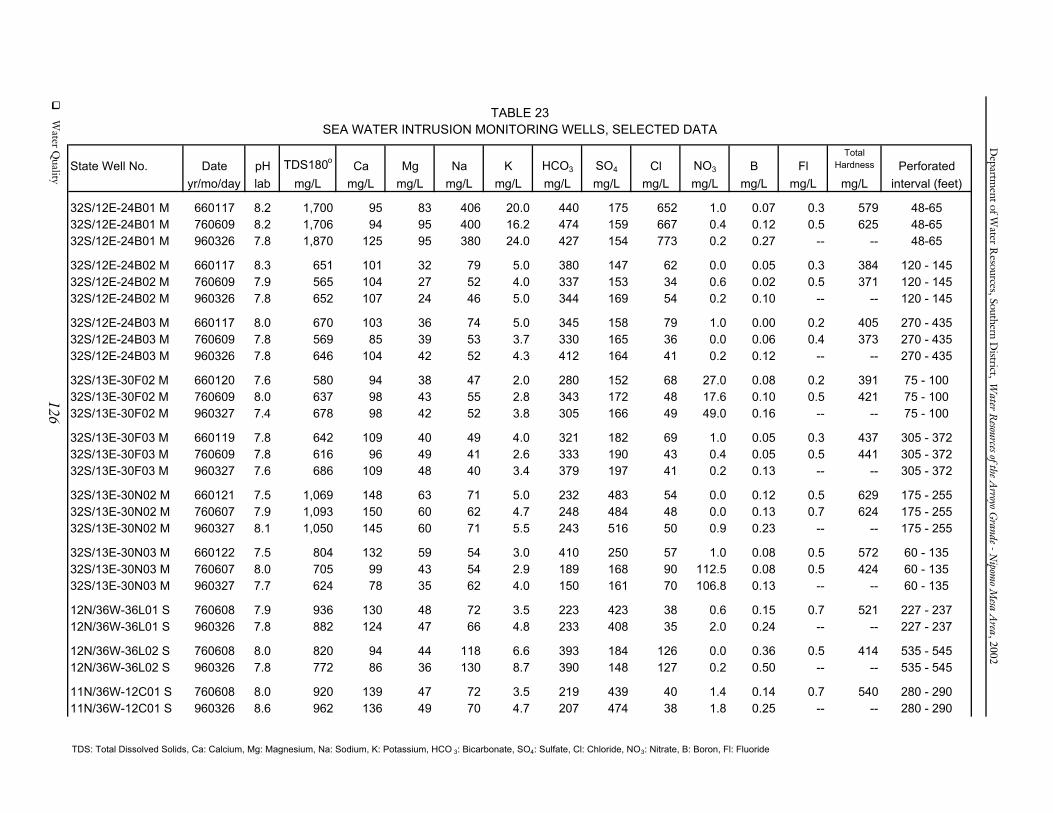
Seven of these monitoring wells, containing a total of 26 piezometers, were sampled in March1996 for this study.5 The 1996 water quality data, plus historical data, for these wells are listed inTable 23. The piezometers are identified by State Well Numbers and their piezometer depths aregiven. Their locations are shown in Plate 18. The data were reviewed to evaluate the status ofsea water intrusion in the study area.
In the Pismo Beach-Oceano area, three wells containing nine piezometers sample groundwaterfrom 48 to 435 feet deep. Samples from the shallow piezometer, 32S/12E-24B01, show highconcentrations of chloride. However, samples from this depth have historically shown highconcentrations of sodium chloride. This situation was found to be the result of solution ofresidual marine and evaporative salts indigenous to the geologic environment in this part of thebasin (California Department of Water Resources, 1970). Samples from piezometers 32S/12E-24B02 and 32S/12E-24B03 show no sign of sea water intrusion. In addition, the four otherpiezometers in this part of the basin--32S/13E-30F02 and 30F03 and 32S/13E-30N02 and30N03--show no sign of sea water intrusion.
Seaward of Nipomo Mesa, two wells containing five piezometers monitor depths of 227 to 730feet. No sign of sea water intrusion is shown by the two piezometers 12N/36W-36L01 and36L02 nor by the three piezometers 11N/36W-12C01, 12C02, and 12C03, which are on thebeach west of Nipomo Mesa.
In Santa Maria Valley near the coast, two wells contain 12 piezometers monitoring groundwaterat depths of 18 to 671 feet. The shallow piezometer, 10N/36W-02Q07, has shown high chloride
State Well No. Date pH TDS180o Ca Mg Na K HCO3 SO4 Cl NO3 B FlTotal
Hardness Perforatedyr/mo/day lab mg/L mg/L mg/L mg/L mg/L mg/L mg/L mg/L mg/L mg/L mg/L mg/L interval (feet)
32S/12E-24B01 M 660117 8.2 1,700 95 83 406 20.0 440 175 652 1.0 0.07 0.3 579 48-6532S/12E-24B01 M 760609 8.2 1,706 94 95 400 16.2 474 159 667 0.4 0.12 0.5 625 48-6532S/12E-24B01 M 960326 7.8 1,870 125 95 380 24.0 427 154 773 0.2 0.27 -- -- 48-65 32S/12E-24B02 M 660117 8.3 651 101 32 79 5.0 380 147 62 0.0 0.05 0.3 384 120 - 14532S/12E-24B02 M 760609 7.9 565 104 27 52 4.0 337 153 34 0.6 0.02 0.5 371 120 - 14532S/12E-24B02 M 960326 7.8 652 107 24 46 5.0 344 169 54 0.2 0.10 -- -- 120 - 145 32S/12E-24B03 M 660117 8.0 670 103 36 74 5.0 345 158 79 1.0 0.00 0.2 405 270 - 43532S/12E-24B03 M 760609 7.8 569 85 39 53 3.7 330 165 36 0.0 0.06 0.4 373 270 - 43532S/12E-24B03 M 960326 7.8 646 104 42 52 4.3 412 164 41 0.2 0.12 -- -- 270 - 435 32S/13E-30F02 M 660120 7.6 580 94 38 47 2.0 280 152 68 27.0 0.08 0.2 391 75 - 10032S/13E-30F02 M 760609 8.0 637 98 43 55 2.8 343 172 48 17.6 0.10 0.5 421 75 - 10032S/13E-30F02 M 960327 7.4 678 98 42 52 3.8 305 166 49 49.0 0.16 -- -- 75 - 100 32S/13E-30F03 M 660119 7.8 642 109 40 49 4.0 321 182 69 1.0 0.05 0.3 437 305 - 37232S/13E-30F03 M 760609 7.8 616 96 49 41 2.6 333 190 43 0.4 0.05 0.5 441 305 - 37232S/13E-30F03 M 960327 7.6 686 109 48 40 3.4 379 197 41 0.2 0.13 -- -- 305 - 372 32S/13E-30N02 M 660121 7.5 1,069 148 63 71 5.0 232 483 54 0.0 0.12 0.5 629 175 - 25532S/13E-30N02 M 760607 7.9 1,093 150 60 62 4.7 248 484 48 0.0 0.13 0.7 624 175 - 25532S/13E-30N02 M 960327 8.1 1,050 145 60 71 5.5 243 516 50 0.9 0.23 -- -- 175 - 255 32S/13E-30N03 M 660122 7.5 804 132 59 54 3.0 410 250 57 1.0 0.08 0.5 572 60 - 13532S/13E-30N03 M 760607 8.0 705 99 43 54 2.9 189 168 90 112.5 0.08 0.5 424 60 - 13532S/13E-30N03 M 960327 7.7 624 78 35 62 4.0 150 161 70 106.8 0.13 -- -- 60 - 135 12N/36W-36L01 S 760608 7.9 936 130 48 72 3.5 223 423 38 0.6 0.15 0.7 521 227 - 23712N/36W-36L01 S 960326 7.8 882 124 47 66 4.8 233 408 35 2.0 0.24 -- -- 227 - 237 12N/36W-36L02 S 760608 8.0 820 94 44 118 6.6 393 184 126 0.0 0.36 0.5 414 535 - 54512N/36W-36L02 S 960326 7.8 772 86 36 130 8.7 390 148 127 0.2 0.50 -- -- 535 - 545 11N/36W-12C01 S 760608 8.0 920 139 47 72 3.5 219 439 40 1.4 0.14 0.7 540 280 - 29011N/36W-12C01 S 960326 8.6 962 136 49 70 4.7 207 474 38 1.8 0.25 -- -- 280 - 290
Departm
ent of Water R
esources, Southern District, W
ater Resources of the A
rroyo Grande - N
ipomo M
esa Area , 2002
TABLE 23SEA WATER INTRUSION MONITORING WELLS, SELECTED DATA
��
Water Q
uality 126
TDS: Total Dissolved Solids, Ca: Calcium, Mg: Magnesium, Na: Sodium, K: Potassium, HCO 3: Bicarbonate, SO4: Sulfate, Cl: Chloride, NO3: Nitrate, B: Boron, Fl: Fluoride

State Well No. Date pH TDS180o Ca Mg Na K HCO3 SO4 Cl NO3 B FlTotal
Hardness Perforatedyr/mo/day lab mg/L mg/L mg/L mg/L mg/L mg/L mg/L mg/L mg/L mg/L mg/L mg/L interval (feet)
11N/36W-12C02 S 760608 7.7 1,015 129 52 90 4.6 184 488 48 1.4 0.16 0.5 536 450 - 46011N/36W-12C02 S 960326 8.1 1,090 150 52 80 5.2 246 552 46 1.2 0.27 -- -- 450 - 460 11N/36W-12C03 S 760608 7.8 813 89 43 98 5.9 293 235 94 0.4 0.24 0.4 399 720 - 73011N/36W-12C03 S 960326 8.1 790 97 51 92 6.0 317 246 91 0.2 0.32 -- -- 720 - 730
11N/36W-35J02 S 670928 7.7 811 106 46 63 4.0 261 332 28 1.3 0.12 0.4 454 527 - 61511N/36W-35J02 S 770726 -- 860 110 49 60 3.2 260 340 28 -- 0.10 -- 470 527 - 61511N/36W-35J02 S 871028 7.5 773 110 48 56 2.2 277 340 26 2.1 0.15 0.2 -- 527 - 61511N/36W-35J02 S 960327 7.4 776 107 52 57 3.2 261 362 27 2.2 0.20 -- -- 527 - 615
11N/36W-35J03 S 670928 7.8 1,031 132 55 89 4.0 239 462 54 10.8 0.18 0.6 556 247 - 49011N/36W-35J03 S 770726 -- 1,130 150 58 87 3.5 250 490 54 -- 0.10 -- 610 247 - 49011N/36W-35J03 S 871028 7.7 1,200 170 70 85 3.9 279 580 61 15.5 0.21 0.4 -- 247 - 49011N/36W-35J03 S 960327 7.4 1,230 179 64 88 4.0 291 556 57 26.3 0.28 -- -- 247 - 49011N/36W-35J03 S 981117 7.38 1,198 165 74 86 3.9 278 550 62 31.3 0.23 0.4 -- 247 - 490 11N/36W-35J04 S 670928 7.5 1,177 159 67 90 4.0 265 530 66 11.5 0.14 0.7 673 175 - 22811N/36W-35J04 S 770726 -- 1,460 190 73 86 4.3 300 600 72 -- 0.20 -- 780 175 - 22811N/36W-35J04 S 871028 7.5 1,490 220 86 90 0.3 346 740 77 12.8 0.23 0.4 -- 175 - 22811N/36W-35J04 S 960327 7.4 1,500 343 21 96 4.4 358 665 72 22.7 0.33 -- -- 175 - 22811N/36W-35J04 S 981117 7.3 1,470 202 93 93 4.4 344 664 77 27.3 0.25 0.4 -- 175 - 228 11N/36W-35J05 S 670928 7.4 1,029 134 57 81 4.0 260 453 45 5.0 0.13 0.7 569 74 - 13811N/36W-35J05 S 770726 -- 955 160 60 75 3.5 269 500 49 -- 0.10 -- 650 74 - 13811N/36W-35J05 S 871028 7.5 1,100 170 66 75 3.6 305 520 52 5.3 0.19 0.5 -- 74 - 13811N/36W-35J05 S 960327 7.4 1,210 -- 69 82 3.8 316 554 53 8.9 0.27 -- -- 74 - 13811N/36W-35J05 S 981117 7.3 1,216 163 75 78 4.1 293 555 59 11.4 0.21 0.5 -- 74 - 138 10N/36W-02Q01 S 670929 7.9 818 101 52 57 4.0 229 353 29 1.5 0.11 0.4 466 567 - 67110N/36W-02Q01 S 770726 -- 890 120 51 56 3.1 250 360 28 -- 0.10 -- 500 567 - 67110N/36W-02Q01 S 871028 7.7 799 110 50 52 3.2 249 370 27 1.9 0.13 0.2 -- 567 - 67110N/36W-02Q01 S 960327 7.2 824 113 55 56 3.7 261 352 30 2.1 0.19 -- -- 567 - 67110N/36W-02Q01 S 981116 7.4 716 91 46 50 3.2 229 287 23 2.0 0.15 0.2 -- 567 - 671
Departm
ent of Water R
esources, Southern District, W
ater Resources of the A
rroyo Grande - N
ipomo M
esa Area , 2002
TABLE 23 continuedSEA WATER INTRUSION MONITORING WELLS, SELECTED DATA
127��
Water Q
uality
TDS: Total Dissolved Solids, Ca: Calcium, Mg: Magnesium, Na: Sodium, K: Potassium, HCO 3: Bicarbonate, SO4: Sulfate, Cl: Chloride, NO3: Nitrate, B: Boron, Fl: Fluoride

State Well No. Date pH TDS180o Ca Mg Na K HCO3 SO4 Cl NO3 B FlTotal
Hardness Perforatedyr/mo/day lab mg/L mg/L mg/L mg/L mg/L mg/L mg/L mg/L mg/L mg/L mg/L mg/L interval (feet)
10N/36W-02Q02 S 670929 7.9 726 90 41 67 4.0 254 294 24 1.3 0.11 0.4 393 467 - 53510N/36W-02Q02 S 770726 -- 780 99 44 59 3.2 260 300 24 -- 0.10 -- 430 467 - 53510N/36W-02Q02 S 960327 8.0 758 102 49 56 3.1 273 278 27 2.0 0.19 -- -- 467 - 535
10N/36W-02Q03 S 670929 7.8 741 95 47 53 3.0 249 303 22 1.0 0.09 0.4 431 397 - 44410N/36W-02Q03 S 770726 -- 800 100 47 53 2.9 250 310 24 -- 0.10 -- 440 397 - 44410N/36W-02Q03 S 871028 7.7 696 99 46 47 3.0 248 300 21 1.9 0.13 0.2 -- 397 - 44410N/36W-02Q03 S 960327 7.2 706 92 45 53 3.5 262 286 26 1.9 0.20 -- -- 397 - 44410N/36W-02Q03 S 981116 7.4 727 92 49 50 3.0 243 297 22 2.0 0.14 0.2 -- 397 - 444 10N/36W-02Q04 S 670929 8.1 712 93 44 53 3.0 248 291 24 1.5 0.09 0.4 413 291 - 37810N/36W-02Q04 S 770726 -- 750 100 46 49 2.6 250 290 23 -- 0.10 -- 440 291 - 37810N/36W-02Q04 S 871028 7.9 698 96 44 47 2.7 250 300 22 2.3 0.13 0.2 -- 291 - 37810N/36W-02Q04 S 960327 7.0 730 98 46 49 2.7 255 312 23 2.8 0.19 -- -- 291 - 37810N/36W-02Q04 S 981116 7.5 685 88 47 49 2.5 222 277 21 2.7 0.14 0.2 -- 291 - 378 10N/36W-02Q05 S 670929 7.6 973 131 54 75 3.0 245 417 56 5.3 0.14 0.5 549 185 - 246 10N/36W-02Q05 S 760521 8.0 943 141 54 77 2.7 254 420 64 6.8 0.18 0.7 574 185 - 246 10N/36W-02Q05 S 960327 8.0 1,200 178 71 83 3.9 261 534 85 7.0 0.27 -- -- 185 - 246 10N/36W-02Q06 S 670929 7.8 1,000 139 54 82 3.0 250 439 61 3.5 0.18 0.6 569 130 - 17010N/36W-02Q06 S 760521 7.9 813 119 52 61 2.6 258 355 42 4.4 0.08 0.6 511 130 - 17010N/36W-02Q06 S 960327 7.2 1,530 286 58 101 4.4 297 675 124 1.2 0.32 -- -- 130 - 170 10N/36W-02Q07 S 670929 7.4 747 103 44 74 4.0 319 214 81 11.0 0.14 0.5 438 19 - 4710N/36W-02Q07 S 760604 8.2 683 89 40 66 3.5 278 170 89 10.0 0.06 0.7 387 19 - 4710N/36W-02Q07 S 871028 7.5 839 130 49 91 5.7 322 120 210 -- 0.15 0.3 -- 19 - 4710N/36W-02Q07 S 960327 7.2 1,310 195 32 190 11.5 415 190 387 0.3 0.40 -- -- 19 - 4710N/36W-02Q07 S 981116 7.4 1,186 158 73 153 5.6 397 182 358 0.4 0.52 0.4 -- 19 - 47
Departm
ent of Water R
esources, Southern District, W
ater Resources of the A
rroyo Grande - N
ipomo M
esa Area, 2002
TABLE 23 continuedSEA WATER INTRUSION MONITORING WELLS, SELECTED DATA
128��
Water Q
uality
TDS: Total Dissolved Solids, Ca: Calcium, Mg: Magnesium, Na: Sodium, K: Potassium, HCO 3: Bicarbonate, SO4: Sulfate, Cl: Chloride, NO3: Nitrate, B: Boron, Fl: Fluoride

Department of Water Resources, Southern District, Water Resources of the Arroyo Grande - Nipomo Mesa Area, 2002
129 � Water Quality
concentrations, and in 1991, it showed a marked increase. This increase has diminished, but theconcentration remains higher than its historical values, which may be an indication of sea waterintrusion into the shallow aquifer. However, because of the shallow depth, this high chlorideconcentration may result from tidal action and percolation of poor quality surface waters ratherthan sea water intrusion. The piezometer 10N/36W-02Q06 showed a relatively high chloridereading in 1996. It also had a high sulfate to chloride ratio. Because sea water normally has alow sulfate to chloride ratio, the high sulfate to chloride ratio suggests a strong influence fromsurface waters and fertilizers. The turbulence resulting from the creation and recovery ofpumping depressions may have carried surface waters down to the lower levels. The five otherpiezometers in this well showed no sign of sea water intrusion.
Piezometers 11N/36W-35J02, 35J03, 35J04, and 35J05 also showed no sign of sea waterintrusion. To protect the quality of the groundwater, a regular yearly sea water intrusion monitoringprogram would help, with particular attention paid to piezometer 10N/36W-02Q06. Amonitoring program, with sampling and analyses of major ions and boron, bromide, iodine,deuterium, and oxygen -16 and -18, would record any trends indicating changes that are notwholly caused by infiltrating surface waters, but may also be caused by sea water intrusion.
Surface Water Quality
The chemical character and quality of surface waters are a function of a complex interrelation ofclimate, geology, topography, vegetation, runoff, aquifer-stream interconnection, and humanactivities such as land and water use and waste disposal practices. Surface water quality variesfrom time to time and from place to place, and quality changes can be pronounced. Typically,the quality varies inversely to the rate of discharge, with waters of lower TDS concentrationobserved during higher flows. In contrast with the quality of groundwater, the quality of surfacewater can be highly variable.
The quality of the surface waters recharging the groundwater basin from Arroyo Grande andPismo Creeks and their tributary creeks and Santa Maria River and Nipomo Creek reflects bothbase flow and runoff from rainfall. Stormflow results from precipitation runoff and subsurfacedischarge during the storm period. Baseflow of the Santa Maria River is composed of risingwater, discharges of treated wastewater, releases of water stored in Twitchell Reservoir, bankseepage, and nonpoint discharges, including uncontrolled runoff from agricultural and urbanareas not related to stormflows. Baseflow of Arroyo Grande Creek is composed of rising water,releases of water stored in Lopez Reservoir, bank seepage, and nonpoint discharges, includinguncontrolled runoff from agricultural and urban areas not related to stormflows.
Surface water within the study area has not been sampled for quality since the 1960s and 1970sand this historical sampling was very infrequent.

Department of Water Resources, Southern District, Water Resources of the Arroyo Grande - Nipomo Mesa Area, 2002
130� Water Quality
It is unreasonable to expect that a few samples, as exist for much of the surface waters in thestudy area, could adequately characterize the spatial and temporal variations in surface waterquality, particularly with the dominant control that natural variations in hydrology exercise overvariations in quality. "The more water quality varies, the more samples will be required to obtaina reliable estimate of statistical parameters used to describe its behavior "(Sanders et al., 1983, p.153). With sparse data, the reality of some apparent changes in quality may be questionablebecause many natural and societal factors may affect quality. Therefore, this section will justbriefly summarize the historical quality of surface waters in the study area.
Water from the Arroyo Grande, Tar Spring, Nipomo, and Pismo Creeks have had TDSconcentrations generally between 500 and 1,000 mg/L. Water in these creeks has generally beencalcium-magnesium bicarbonate in character and has not been used directly for drinking water. Water from Los Berros Creek has contained concentrations of TDS as high as 1,900 mg/L,sulfate as high as 689 mg/L, and nitrate as high as 87.5 mg/L and has been calcium-magnesiumsulfate in character. Los Berros Creek water has also not been used directly for drinking water.
Water in the shallow perennial dune lakes near the coast, which are in part recharged byagricultural runoff and irrigation return, has been considered marginal to unsuitable for irrigation. TDS concentrations have ranged between 500 and 3,000 mg/L. High concentrations of nitrate inthese lakes have led to increased eutrophication rates (California Department of Fish and Game,1976). These waters are not used directly for drinking water. Some of the lakes have water thathas been sodium chloride in character, and that from others has been calcium-magnesium sulfate.
The surface waters in the Santa Maria River have ranged from storm runoff with TDSconcentrations of 250 mg/L to slight runoff with TDS concentrations of 1,600 mg/L and sulfateconcentrations of 680 mg/L. The chemical character of the storm runoff is typically calcium-magnesium bicarbonate and that of lower flows calcium-magnesium sulfate. Water from theSanta Maria River is not used directly for drinking water.
Lopez Reservoir (not within the study area) is an important supply source within the study.Concentrations of mineral constituents in water from Lopez Reservoir, before treatment, meetDrinking Water Standards. Concentrations of TDS typically range from about 400 to 600 mg/L;sulfate, about 100 to 140 mg/L; chloride, 15 to 20 mg/l; and nitrate, 0.2 to 0.8 mg/L. The wateris classified as very hard. The chemical character of the water is typically calcium-magnesiumbicarbonate.
Future Needs
The lack of recent and adequate water quality data throughout the study area is evident in thisstudy. Groundwater in parts of the basin and surface water, except for Lopez Reservoir water,have not been sampled and analyzed since the late 1960s or 1970s. Moreover, vertically discretegroundwater samples were available only for the sea water intrusion monitoring wells. Abasinwide study of groundwater quality, characterizing spatial conditions, both areally and with

Department of Water Resources, Southern District, Water Resources of the Arroyo Grande - Nipomo Mesa Area, 2002
131 � Water Quality
depth, and surface water quality has never been conducted.
Given the importance of the resource, there is need for the county to undertake a comprehensivewater quality assessment of the water resources in the study area that includes sampling for anarray of quality constituents (inorganic constituents, physical measurements, isotopes, andselected organic constituents) with spatially distributed sample locations (areally and with depth)throughout the basin and be unbiased with respect to known or suspected local problem areas. Such an effort will provide the information necessary to design an effective monitoring program. It is beyond the scope of this study to design the needed assessment or monitoring plan.

This Page Intentionally Blank
Department of Water Resources, Southern District, Water Resources of the Arroyo Grande - Nipomo Mesa Area, 2002
132� Water Quality