vi 3 application of combustion sound level csl … · application of combustion sound level (csl)...
TRANSCRIPT

2009-01-2168
Application of Combustion Sound Level (CSL) Analysis for Powertrain NVH Development and Benchmarking
Todd Tousignant, Thomas Wellmann and Kiran Govindswamy FEV Inc.
Stefan Heuer FEV Motorentechnik GmbH
Michael Workings Chrysler LLC
Copyright © 2009 SAE International
ABSTRACT
Powertrain noise is a significant factor in determination of the overall vehicle refinement expected by today’s discriminating automotive customer. Development of a powertrain to meet these expectations requires a thorough understanding of the contributing noise sources. Specifically, combustion noise greatly impacts the perception of sound levels and quality. The relevance of combustion noise development has increased with the advent of newer efficiency-driven technologies such as direct injection or homogeneous charge compression ignition.
This paper discusses the application of a CSL (Combustion Sound Level) analysis – a method for the identification and optimization of combustion noise. Using CSL, it is possible to separate mechanical and combustion noise sources. Combustion noise is then further classified as direct combustion noise (directly proportional to the combustion gas pressures), indirect combustion noise (proportional to rotational forces as well as combustion-induced piston side forces) and flow noise.
During the development stage of new powertrains, benchmarking testing and analysis helps to identify the state-of-the-art. Incorporation of the CSL process into the benchmarking process facilitates a
more in-depth comparison of powertrains, providing valuable information to drive potential design improvements. In this investigation, two benchmark four cylinder engines were compared using the CSL process. This provided a comprehensive comparison of the noise shares as well as the combustion excitation levels. In addition, the paper compares engine specific combustion noise share weighting functions to obtain insights into the relative strengths and weaknesses of each benchmarked engine.
INTRODUCTION
The competitive nature of today’s automotive industry drives the necessity to fully optimize powertrains for performance, fuel economy and NVH as well as cost. An essential part of developing the appropriate balance of these characteristics is benchmarking. This process provides automotive manufacturers with knowledge of the state of industry allowing them to properly position themselves for a given application.
The process of benchmarking must evolve with the state of the industry – simple radiated noise measurements no longer provide an adequate description of a competitor’s capabilities. More in-depth analysis is required to properly understand the advantages and disadvantages of various applied technologies. This becomes increasingly important
when evaluating the NVH influence of newer trends such as direct injection, variable valve lift and timing and the downsizing to small displacement air charged engines [1].
Combustion Sound Level analysis is a technique aligned with the additional analysis requirements for comprehensive benchmarking investigations. Though mainly a development tool, CSL facilitates the identification and evaluation of individual noise sources for a given powertrain. The work herein will describe the means in which CSL provides information about not only cylinder pressure excitation, but also about the response of the engine hardware to this excitation.
THEORY AND APPLICATIONS OF CSL
Combustion Sound Level (CSL) analysis is a set of methods which provide combustion noise information to guide multiple stages of engine development.
As seen in Figure 1, overall engine noise can be broken down into mechanical noise, combustion noise and accessory noise. Of these categories, combustion noise can be further classified as direct combustion noise, indirect combustion noise and flow noise.
Engine Noise
IndirectCombustion
Noise
DirectCombustion
Noise
FlowNoise
Accessory
Noise
Mechanical
Noise
Combustion
Noise
Engine Noise
IndirectCombustion
Noise
DirectCombustion
Noise
FlowNoise
IndirectCombustion
Noise
DirectCombustion
Noise
FlowNoise
Accessory
Noise
Mechanical
Noise
Combustion
NoiseAccessory
Noise
Mechanical
Noise
Combustion
Noise
Combustion
Noise
Figure 1: Engine Noise Contributions
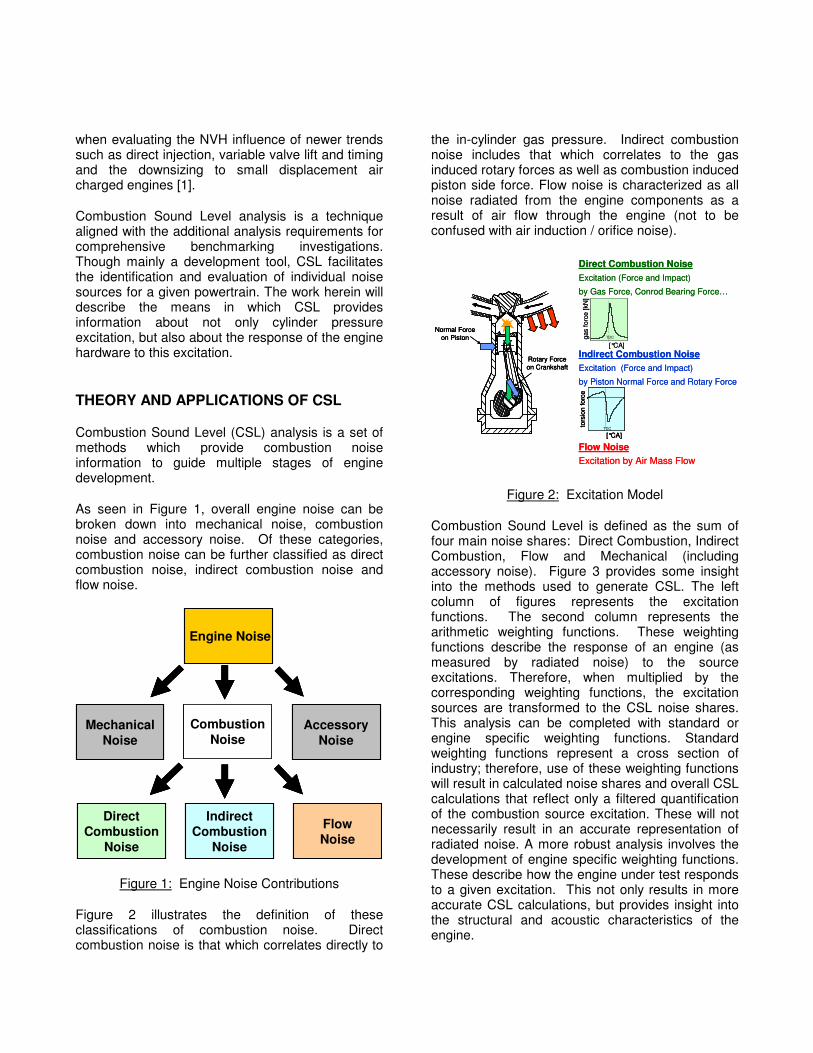
Figure 2 illustrates the definition of these classifications of combustion noise. Direct combustion noise is that which correlates directly to
the in-cylinder gas pressure. Indirect combustion noise includes that which correlates to the gas induced rotary forces as well as combustion induced piston side force. Flow noise is characterized as all noise radiated from the engine components as a result of air flow through the engine (not to be confused with air induction / orifice noise).
Direct Combustion Noise
Excitation (Force and Impact)
by Gas Force, Conrod Bearing Force…
Indirect Combustion Noise
Excitation (Force and Impact)
by Piston Normal Force and Rotary Force
Flow Noise
Excitation by Air Mass Flow
gas forc
e [kN
]
TDC
[°CA]
tors
ion
forc
e
[°CA]TDC
Normal Force on Piston
Rotary Force on Crankshaft
Direct Combustion Noise
Excitation (Force and Impact)
by Gas Force, Conrod Bearing Force…
Indirect Combustion Noise
Excitation (Force and Impact)
by Piston Normal Force and Rotary Force
Flow Noise
Excitation by Air Mass Flow
gas forc
e [kN
]
TDC
[°CA]
tors
ion
forc
e
[°CA]TDC
tors
ion
forc
e
[°CA]TDC
Normal Force on Piston
Rotary Force on Crankshaft
Normal Force on Piston
Rotary Force on Crankshaft
Figure 2: Excitation Model
Combustion Sound Level is defined as the sum of four main noise shares: Direct Combustion, Indirect Combustion, Flow and Mechanical (including accessory noise). Figure 3 provides some insight into the methods used to generate CSL. The left column of figures represents the excitation functions. The second column represents the arithmetic weighting functions. These weighting functions describe the response of an engine (as measured by radiated noise) to the source excitations. Therefore, when multiplied by the corresponding weighting functions, the excitation sources are transformed to the CSL noise shares. This analysis can be completed with standard or engine specific weighting functions. Standard weighting functions represent a cross section of industry; therefore, use of these weighting functions will result in calculated noise shares and overall CSL calculations that reflect only a filtered quantification of the combustion source excitation. These will not necessarily result in an accurate representation of radiated noise. A more robust analysis involves the development of engine specific weighting functions. These describe how the engine under test responds to a given excitation. This not only results in more accurate CSL calculations, but provides insight into the structural and acoustic characteristics of the engine.

Excitation Arithmetic Noise Share
gas mass flow
flow
noise
weighting function
flow noise
.m
engine speed
weighting function
mechanical noise
mechanical
noisen
weighting function
direct
combustion noise
direct
combustion
noisegas force
weighting functionindirect
combustion noise
indirect
combustion
noiserotary force
FEV-CSL
engine speed [rpm]
Weighting Functions
str
uctu
re w
eig
htin
g fu
nctio
n [dB
(A)]
engine speed [rpm]
frequency [Hz]
frequency [Hz]
Attenuation
vs.
Frequency
Attenuation
vs.
Frequency
Attenuation
vs.
Frequency
Attenuation
vs.
Speed
FEV CSL
vs.
Speed
Excitation Arithmetic Noise ShareExcitation Arithmetic Noise Share
gas mass flow
flow
noise
weighting function
flow noise
.weighting function
flow noise
.mmmmm
engine speed
weighting function
mechanical noise
mechanical
noisen
weighting function
direct
combustion noise
direct
combustion
noisegas force
weighting functionindirect
combustion noise
indirect
combustion
noiserotary force
FEV-CSL
engine speed [rpm]
Weighting Functions
str
uctu
re w
eig
htin
g fu
nctio
n [dB
(A)]
engine speed [rpm]
frequency [Hz]
frequency [Hz]
Attenuation
vs.
Frequency
Attenuation
vs.
Frequency
Attenuation
vs.
Frequency
Attenuation
vs.
Speed
FEV CSL
vs.
Speed
Excitation Arithmeticby weighting functions
Noise Sharethird octave based
� Föller-Estimation� WF = Weighting Function
(FEV standard WF or engine specific)
air mass flow flow noise
(m x WFflow�) X
.m
Freq. [Hz]
Leve
l[d
B(A
)]
engine speed
WFmech� x n
+ …n5
mechanical noise
nFreq. [Hz]
Leve
l[d
B(A
)]
FEV-CSL
Freq. [Hz]
Leve
l[d
B(A
)]
Spectrum�
xWFIndirect
�direct comb. noise
Freq. [Hz]
Leve
l
[dB
(A)]
gas force
Spectrum�
xWFindirect
�indirect comb. noise
Freq. [Hz]
Leve
l[d
B(A
)]
rotary force
88,3 dB(A)87,4 dB(A)
CSLmeasured
frequency [Hz]
EXAMPLE
leve
l[dB
(A)]
Excitation Arithmeticby weighting functions
Noise Sharethird octave based
Excitation Arithmeticby weighting functions
Noise Sharethird octave based
� Föller-Estimation� WF = Weighting Function
(FEV standard WF or engine specific)
air mass flow flow noise
(m x WFflow�) X
.(m x WFflow
�) X.
mmmmmFreq. [Hz]
Leve
l[d
B(A
)]
Freq. [Hz]
Leve
l[d
B(A
)]
engine speed
WFmech� x n
+ …n5
mechanical noise
nFreq. [Hz]
Leve
l[d
B(A
)]
Freq. [Hz]
Leve
l[d
B(A
)]
FEV-CSL
Freq. [Hz]
Leve
l[d
B(A
)]
Freq. [Hz]
Leve
l[d
B(A
)]
Spectrum�
xWFIndirect
�direct comb. noise
Freq. [Hz]
Leve
l
[dB
(A)]
Freq. [Hz]
Leve
l
[dB
(A)]
gas force
Spectrum�
xWFindirect
�indirect comb. noise
Freq. [Hz]
Leve
l[d
B(A
)]
Freq. [Hz]
Leve
l[d
B(A
)]
rotary force
88,3 dB(A)87,4 dB(A)
CSLmeasured
frequency [Hz]
EXAMPLE
leve
l[dB
(A)]
Figure 4 is a similar representation of the CSL process, but with an important difference. This figure illustrates the advantage of combining the CSL process with an extensive database of benchmarked engines. Armed with this data, each stage of the process can be compared to the state of the industry. Raw excitation data can be compared to scatterbands (not shown here) to determine if the combustion process is too aggressive for NVH. Comparison of engine specific weighting functions can provide information about the engine structural response to direct and indirect combustion noise. These can also provide information about how efficiently noise is radiated from induction or exhaust components or they can determine if work needs to be done on mechanical noise levels. Analysis of the noise shares and overall CSL can provide information about the status of overall noise radiation and where the engine can most benefit from improvements.
Figure 3: CSL Noise Share Development
Figure 4: CSL Noise Share Scatterbands
Once the engine specific weighting functions are developed, the noise shares and overall CSL can be calculated from data acquired in a performance and emissions (non-NVH) test cell. This provides the possibility of effectively integrating NVH development into the calibration process [2,3] allowing up front optimization. This avoids the potential need to change calibration late in the development process to eliminate objectionable NVH issues.
ENGINE BENCHMARKING STUDY
The competitive nature of the 21st century
automotive industry creates pressure to carefully balance powertrain performance, fuel economy, NVH and cost. An effective tool for establishing appropriate levels for each target is benchmarking. Benchmarking of competitive powertrains provides information about the state of the industry. A powertrain level investigation is valuable for development teams to isolate powertrain specific information from issues related to vehicle sensitivities and integration.
Two approaches can be followed when targeting powertrain NVH based on benchmarking: A single powertrain can be utilized to determine target performance. The biggest difficulty with this approach is the choice of an appropriate target powertrain - one exhibiting best-in-class behavior in all characteristics to be evaluated. An alternative approach is available if a large database of engines has been acquired. Based on this database, a scatterband can be developed for each characteristic under investigation. Using this scatterband, the manufacturer can make a judgment about where the given application should fall within the population.
An example comparing radiated noise of two powertrains is shown in Figure 5. This plot shows four microphone average sound pressure level acquired under full load according to the SAE J1074 standard. As can be observed in this figure, the two powertrains are comparable for overall sound pressure in the middle to high engine speeds, but Engine B performs better in the low speed range. Another observation is that both powertrains lie at the top of the FEV Scatterband at middle to high engine speeds, suggesting that neither engine would be an appropriate benchmark if the target is to be chosen from best-in-class.

Figure 5: Four-Microphone Average SPL (WOT)
To gain more insight into the radiated noise characteristics, a directivity study can be conducted. As shown in Figure 6, a directivity study looks at the individual microphones that contribute to the four microphone average (front, top, left and right of engine – shown here for Engine B). This type of investigation can be complicated if the powertrains being tested have different characteristics such as engine installation angle (resulting in increased oil pan radiation to the left or right microphones) or orientation of the engine in the vehicle (exhaust on the left or right side of the engine).
Figure 6: Directivity Study (Engine B)
As part of a standard benchmarking study, an influence of load investigation can be carried out. Load contribution data is displayed in Figure 7 for Engine B. This provides some information about the contribution of combustion noise throughout the operating speed of the engine. Again, with a database of engines tested, this can be compared to a scatterband to determine whether the influence of load is comparable to that generally observed in industry. It can be observed that Engine B has high influence of load at both low and high speeds. However, it would be useful to identify the root cause of this increased contribution level.
Figure 7: Contribution of Load (Engine B)
COMBUSTION SOUND LEVEL COMPARISON
Combustion Sound Level (CSL) analysis is a set of methods which can be used at multiple stages of engine development to provide detailed information about combustion noise contribution. Among the information obtained during this analysis are the excitations, weighting functions and noise shares.
The combustion excitations include the frequency content of the in-cylinder pressure trace, mass air flow through the engine and engine speed. Figure 8 shows a comparison of the cylinder pressure excitation for Engine A and Engine B. It can be observed that at low frequencies, the cylinder pressure from each engine shows the same character. However, at higher frequencies, Engine B shows significantly higher excitation. In fact, in the mid-frequency range, the engines lie on opposite ends of the FEV Scatterband. Based on the measured in-cylinder peak pressure and pressure rise rates, a Föller estimation [4] is created

which is then used to define the direct combustion noise excitation. When combined with the engine geometry, cylinder pressure serves as the input to the combustion based rotary force which acts as the excitation function for indirect combustion noise.
FEV ScatterbandFEV Scatterband
Figure 8: Cylinder Pressure Excitation Comparison
When the excitation functions are analyzed in parallel with radiated sound measurements, engine specific weighting functions can be derived. These weighting functions provide information about the response of the engine to given combustion excitations.
Figure 9 shows the direct and indirect weighting functions for Engine A and Engine B. As these functions should ideally be minimized (“lower-is-better”), it can be observed that both powertrains are in the worst quartile and above the FEV Scatterband for both direct and indirect combustion. Therefore, neither would be an aggressive target for combustion NVH response.
FEV ScatterbandFEV Scatterband
Figure 9: Engine Specific Weighting Functions: Direct and Indirect Combustion
Figure 10 shows one representation of the flow and mechanical noise weighting functions. Here, flow noise is presented as a function of frequency at a single operating condition. It can be observed that both powertrains exhibit low flow noise at frequencies below 1000 Hz, but are at the top end of the Scatterband at higher frequencies. This figure also shows that at this load condition Engine A radiates more flow noise than Engine B across the analyzed frequency range. The mechanical noise plot indicates that both engines radiate excessive noise under motored conditions (most significant at mid speed range). Throughout most of the speed range, Engine A radiated higher mechanical noise than Engine B.
250 500 1000 2000 4000 8000
Engine A
Engine B
Scatterband
Flo
w N
ois
e [
dB
(A)]
Frequency [Hz]
Scatterband
10 dBA
RPM
Me
ch
an
ica
l N
ois
e [
dB
A]
Engine B
Engine A
10 dBA
Figure 10: Engine Specific Weighting Functions: Mechanical and Flow Noise
In Figure 11, the overall combustion sound level is presented based on both the FEV Standard Weighting Functions as well as engine specific weighting functions. The use of standard weighting functions is common in combustion noise analysis. Although this can provide valuable information about the cylinder pressure excitation, it does little to show how the given engine responds to such excitation. Based on the standard weighting function CSL level, the excitation is high for low engine loads, but becomes moderate with increasing load. The fact that these weighting functions are sub-standard relative to the current database of engines is reflected in the large difference between CSL as calculated using the standard and engine specific weighting functions.

FEV ScatterbandFEV Scatterband
Figure 11: Overall Combustion Noise Level (Standard and Engine Specific Weighting Functions)
Flow noise share is presented in Figure 12 over the full map of engine operating conditions for Engine A and Engine B. Although the overall trend is similar, two main differences stand out between the two engines. At low to middle engine speeds it can be observed that Engine A exhibits higher noise radiation as a result of air flow through the engine. This is particularly apparent at approximately 2500 erpm, full load. Engine B shows higher flow noise at high engine speeds; however, this is a result of higher flow rates and not diminished capability to attenuate this noise.
Lo
ad
[b
ar]
0
2
4
6
8
10
12
1000 1500 2000 2500 3000 3500 4000 4500 5000 5500 6000
Lo
ad
[b
ar]
0
2
4
6
8
10
12
Engine Speed [rpm]
1000 1500 2000 2500 3000 3500 4000 4500 5000 5500 6000
Engine A
Engine B
Lo
ad
[b
ar]
0
2
4
6
8
10
12
1000 1500 2000 2500 3000 3500 4000 4500 5000 5500 6000
Lo
ad
[b
ar]
0
2
4
6
8
10
12
Engine Speed [rpm]
1000 1500 2000 2500 3000 3500 4000 4500 5000 5500 6000
Engine A
Engine B
Figure 12: Flow Noise Share
Figure 13 shows the combined noise shares from Direct Combustion, Indirect Combustion and Flow. This plot would best correlate to the influence of load data shown in the standard benchmarking plot. It can be observed that overall combustion noise is higher on Engine B. As it was observed that the engine specific weighting functions were
comparable between the two engines, these differences are mainly attributed to the cylinder pressure excitation. Therefore, any efforts to “close the gap” between these two powertrains in terms of combustion noise should be focused on engine calibration – tailoring the cylinder pressure traces to produce lower excitations.
Lo
ad
[b
ar]
0
2
4
6
8
10
12
Drehzahl [1/min]
1000 1500 2000 2500 3000 3500 4000 4500 5000 5500 6000
Lo
ad
[b
ar]
0
2
4
6
8
10
12
Engine Speed [rpm]
1000 1500 2000 2500 3000 3500 4000 4500 5000 5500 6000
Engine A
Engine B
Lo
ad
[b
ar]
0
2
4
6
8
10
12
Drehzahl [1/min]
1000 1500 2000 2500 3000 3500 4000 4500 5000 5500 6000
Lo
ad
[b
ar]
0
2
4
6
8
10
12
Engine Speed [rpm]
1000 1500 2000 2500 3000 3500 4000 4500 5000 5500 6000
Engine A
Engine B
Figure 13: Direct Combustion + Indirect Combustion + Flow Noise
Further insight can be obtained by breaking down the four noise shares into their percent contribution to the overall combustion sound level. Such analysis has been shown in Figures 14 and 15 for Engine A and Engine B respectively.
Figure 14 illustrates that for Engine A, mechanical noise share is quite dominant throughout the low load region of engine operation and is more prevalent at higher engine speeds. Conversely, overall combustion noise contribution increases with load: Direct combustion dominates the mid load conditions and indirect becomes the greater influence towards full load. Flow noise contribution peaks at full load, near 2000 rpm. This trails off with increased engine speed and drops off sharply below 80 % load.

Lo
ad
[%
]
0
20
40
60
80
100
1000 2000 3000 4000 5000 6000
5
10
15
20
25
30
35
40
0
20
40
60
80
100
1000 2000 3000 4000 5000 6000
5
10
15
20
25
30
35
40
Lo
ad
[%
]
0
20
40
60
80
100
1000 2000 3000 4000 5000 6000
20
30
40
50
60
70
80
90
0
20
40
60
80
100
1000 2000 3000 4000 5000 6000
0
5
10
15
20
25
30
35
40
Mechanical Flow
Direct
Combustion
Indirect
Combustion
Lo
ad
[%
]
0
20
40
60
80
100
1000 2000 3000 4000 5000 6000
5
10
15
20
25
30
35
40
0
20
40
60
80
100
1000 2000 3000 4000 5000 6000
5
10
15
20
25
30
35
40
Lo
ad
[%
]
0
20
40
60
80
100
1000 2000 3000 4000 5000 6000
20
30
40
50
60
70
80
90
0
20
40
60
80
100
1000 2000 3000 4000 5000 6000
0
5
10
15
20
25
30
35
40
Lo
ad
[%
]
0
20
40
60
80
100
1000 2000 3000 4000 5000 6000
5
10
15
20
25
30
35
40
0
20
40
60
80
100
1000 2000 3000 4000 5000 6000
5
10
15
20
25
30
35
40
Lo
ad
[%
]
0
20
40
60
80
100
1000 2000 3000 4000 5000 6000
20
30
40
50
60
70
80
90
0
20
40
60
80
100
1000 2000 3000 4000 5000 6000
0
5
10
15
20
25
30
35
40
Mechanical Flow
Direct
Combustion
Indirect
Combustion
Figure 14: CSL Percent Noise Share – Engine A
Figure 15 illustrates that for Engine B, although the same anticipated trends are apparent in the mechanical noise, the combustion noise generally shows a greater contribution to the overall. As seen in Engine A, indirect combustion noise increases with load, while direct combustion noise excitation appears high at moderate loads. It was shown previously that this engine showed higher combustion noise shares on an absolute sense. If these were to be addressed with further calibration development, care should be taken to ensure a better balance between direct and indirect combustion noise.
Lo
ad
[%
]
0
20
40
60
80
100
Engine Speed [rpm]
1000 2000 3000 4000 5000 6000
20
30
40
50
60
70
80
90
0
20
40
60
80
100
Engine Speed [rpm]
1000 2000 3000 4000 5000 6000
0
5
10
15
20
25
30
35
40
Lo
ad
[%
]
0
20
40
60
80
100
1000 2000 3000 4000 5000 6000
5
10
15
20
25
30
35
40
0
20
40
60
80
100
1000 2000 3000 4000 5000 6000
5
10
15
20
25
30
35
40
Figure 15: CSL Percent Noise Share – Engine B
SUMMARY AND CONCLUSIONS
• Benchmarking can be an invaluable tool in the development of powertrain NVH. Utilizing a single powertrain as a target can present many difficulties, not the least of which is correct selection of the target. Targeting based on a
database of engines has the benefit of identifying where the development powertrain lies within the industry standard for each characteristic tested.
• Based on the analysis presented above, neither of the two benchmark powertrains tested would provide an aggressive NVH target to achieve “best-in-class” NVH.
• Combustion Sound Level analysis provides additional insights into the NVH characteristics of a powertrain. Utilizing the traditional standard weighting functions, CSL analysis provides information about the cylinder pressure combustion excitation. The development of engine specific weighting functions provides additional information about the response of the engine to these excitations.
• Combustion Sound Level (CSL) analysis indicated that Engine A radiated significantly more mechanical and flow noise, while Engine B has higher combustion noise shares.
• Although CSL provides valuable information in benchmarking investigations, its true potential is realized in powertrain development applications. Development of engine specific weighting functions provides information about engine response to the cylinder pressure excitations. Furthermore, when these weighting functions are known, CSL can facilitate radiated noise evaluation without the need of an hemi-anechoic test cell: With measurement of the excitation sources (cylinder pressure and engine speed and mass air flow) the radiated noise levels can be approximated when testing in-vehicle or in a performance and emissions test cell. This leads to the potential for inclusion of an NVH parameter in the calibration process.
Mechanical Flow
Direct Combustion
Indirect Combustion

References:
1. Alt, N.; Lang, O.; Heuer, S.: Acoustic Behavior
of New Combustion Process Concepts for
Gasoline Engines, 33rd
International Congress
and Exposition on Noise Control Engineering,
2004
2. Alt, N.; Sonnag, H.; Heuer, S.; Thiele, R.: Diesel
Engine Cold Start Noise Improvement, SAE
2005-01-2490, 2005
3. Alt, N.; Sonnag, H.; Heuer, S.; Schlitzer, M.:
Power, Clean Yet Silent, ASME International
Combustion Engine Division 2006 Spring
Technical Conference, 2006
4. Föller, D.: Untersuchung der Anregung von
Körperschall in Maschinen und die Möglichkeit
für eine primäre Lärmbekämpfung, Dissertation
TU Darmstadt, 1972