verification of lrfd approach for piles in sand and mixed ... · verification of lrfd approach for...
TRANSCRIPT

H O S T E D B Y The Japanese Geotechnical Society
Soils and Foundations
Soils and Foundations 2015;55(4):678–690
http://d0038-0
nCorE-mPeer
x.doi.org/1806/& 201
respondinail addrereview un
sciencedirect.comwww.elsevier.com/locate/sandf
www.journal homepage:
Verification of LRFD approach for piles in sand and mixed soils
Kam Nga,n, Sri Sritharanb
aDepartment of Civil and Architectural Engineering, University of Wyoming, Laramie, WY, USAbDepartment of Civil, Construction and Environmental Engineering, Iowa State University, Ames, IA USA
Received 6 June 2014; received in revised form 6 February 2015; accepted 9 March 2015Available online 21 July 2015
Abstract
The potential consequences of switching the design and construction of bridge foundations in sand and mixed soil profiles from an interimprocedure based on Allowable Stress Design to the Load and Resistance Factor Design (LRFD) procedure were examined. Independent data of451 production steel H-piles driven in sand and 173 production steel H-piles driven in mixed soil profile were used to evaluate the adequacy ofthe regionally calibrated LRFD procedure and investigate its economic implications. This study concludes that the regional LRFD procedure willincrease the plan pile length by 25% for sand and 12% for mixed soil profile as opposed to 86% and 93%, respectively, if the AmericanAssociation of State Highway and Transportation Officials (AASHTO) procedure had been implemented. Despite the additional cost incurred byswitching to the regional LRFD procedure, it satisfies the target reliability index of 2.33 for a redundant pile group and the 1% probability offailure stipulated in the AASHTO LRFD Specifications. Alternatively, it can be stated that the currently used method has a reliability index of 1.7for sand and 2.00 for mixed soil profile with approximately 30% and 10% more probability of failures, respectively. Although the research andfindings presented in this paper are specific to a local area, these methods could be adopted globally to facilitate the implementation of theregional LRFD procedure in bridge foundations.& 2015 The Japanese Geotechnical Society. Production and hosting by Elsevier B.V. All rights reserved.
Keywords: Resistance factors; WEAP; LRFD (IGC: E4)
1. Introduction
Pile foundations have been designed using Allowable StressDesign (ASD) philosophy for decades. However, this designprocedure cannot ensure a consistent reliability for pile designand construction. To overcome this limitation, the FederalHighway Administration (FHWA) mandated the Load andResistance Factor Design (LRFD) procedure for new bridgesinitiated after October 1, 2007. The focus of LRFD is toachieve a consistent and reliable design by accounting for thevariability of the load (Q) and resistance (R) components via aload factor (γ) and a resistance factor (φ), respectively,
0.1016/j.sandf.2015.06.0025 The Japanese Geotechnical Society. Production and hosting by
g author.ss: [email protected] (K. Ng).der responsibility of The Japanese Geotechnical Society.
described in Eq. (1). The load factor takes the values recom-mended in the superstructure designs, and the resistance factor iscalibrated using reliability analysis methods from available pileload test data. Although the LRFD specifications have beencontinuously revised from second edition (American Associationof State Highway and Transportation Officials (AASHTO),2002) to the sixth edition (American Association of StateHighway and Transportation Officials (AASHTO), 2012), geo-technical resistance factors have not been significantly improvedfrom that developed using multiple pile load test databasescollected throughout the United States, which representedgeneral soil conditions, common design methods, and construc-tion practices.
XγQrφR ð1Þ
Elsevier B.V. All rights reserved.

K. Ng, S. Sritharan / Soils and Foundations 55 (2015) 678–690 679
Despite the implementation of AASHTO recommended LRFDspecifications resulting in noticeable differences with past ASDpractice (Withiam, 2003), many State Departments of Transporta-tion (DOTs) adopt the AASHTO LRFD framework in order tosatisfy the mandate by FHWA. The potential conservatism of theAASHTO LRFD Specifications, which do not reflect either thelocal soil conditions or the design and construction practices, willincrease foundation costs. For example, Park et al. (2012)calibrated site-specific adaptive resistance factors of axially loadeddriven piles in mixed soil layers using Bayesian theory. Theyconcluded that their Bayesian-implemented resistance factors weremuch higher than that recommended by the (AmericanAssociation of State Highway and Transportation Officials(AASHTO), 2012), which could contribute to economicallydesign piles. According to a survey completed by AbdelSalamet al. (2010), only 15 U.S. state DOTs (i.e., 31% of the 50 U.S.states) fully adopted the AASHTO recommended geotechnicalresistance factors recommended, while another 20 state DOTs(i.e., 40% of states) were in a transition stage towards the LRFDby implementing either the fitting to the ASD approach assimilarly illustrated by Eq. (3) or locally calibrated LRFDapproach. To ensure a smooth transition from ASD to LRFD,12 state DOTs, including the Iowa DOT, adopted an interimprocedure, in which the LRFD resistance factors were calibrated tofit the ASD safety factor (SF) until a regional LRFD procedurecould be fully developed and verified. A comprehensive pile loadtest program was completed in 2011, leading to the developmentof regional LRFD procedures (Ng and Sritharan, 2014). Toinvestigate the economic implications associated with these newlydeveloped regional resistance factors, Ng et al. (2012) conducted astudy based on 604 production steel H-piles driven in clay profileswithin the State of Iowa and concluded that the regionallydeveloped LRFD procedure will not significantly increase thepile design and construction costs from the practice using theinterim procedure. The study further highlights the additionaleconomic benefits by incorporating pile setup in cohesive soilsinto the regional LRFD procedure.
To ensure a full implementation of the regional LRFDprocedures for piles driven in all soil profiles, this paper focuseson the verification of the LRFD procedure for piles in theremaining two soil groups: sand and mixed soil profiles. Thesame soil groups used in the AASHTO LRFD Bridge DesignSpecifications (2012) were followed to ensure consistent LRFDrecommendations. However, criteria for defining the soil groupwere not described in (American Association of State Highwayand Transportation Officials (AASHTO), 2012) nor other relevantpublished LRFD literature (e.g., Paikowsky et al., 2004; Allen,2005). To satisfactorily classify the soil profile of a site, a “70%rule” established by AbdelSalam et al. (2011) was used. Accord-ingly, a site is classified as a sand site if the soil along the pileembedded length is more than 70% of sand when classified inaccordance to the Unified Soil Classification System (USCS). If asite contains less than 70% sand and 70% clay, then it is identifiedas a mixed soil site.
The application of the 70% rule was verified by AbdelSalamet al. (2011) as an appropriate means to define the subsurfaceprofile at the site while maintaining simplicity in the design
approach and providing comparable LRFD resistance factors ifthey would be determined using a more refined categorizationapproach based on the actual percentage of various soil typesalong a pile length.Using the field data obtained from 451 production piles in
sand and 173 production piles in mixed soil profile, whichwere installed in 2009 and 2010 at various bridge projects inIowa, the design verification and the potential impact to thefoundation costs, due to changing the design practice from theinterim procedure to the regional LRFD procedure as well asAASHTO LRFD recommendations, are evaluated. Despite thefocus on one state, this outcome should be adopted by manyother transportation agencies if a comparable LRFD approachis developed.
2. Interim procedure
An interim procedure was used by the Iowa DOT until 2012 asa short-term adaptation to LRFD. The design procedure involvedfitting ASD to LRFD while keeping the construction controlprocedures at ASD in order to avoid overdriving piles untilcontractors were informed of the change to LRFD. For design, thisprocedure was developed assuming foundation loads as per theAASHTO Strength I load combination (American Association ofState Highway and Transportation Officials (AASHTO), 2012),where dead (QD) and live (QL) loads are multiplied by load factors(γ) of 1.25 and 1.75, respectively. A dead load to live load ratioQD=QL
� �of 1.5 was adopted for typical bridge span lengths,
resulting an equivalent load factor of 1.45 applied to the dead andlive loads (i.e., 1.45(QDþQL)). Pile resistance was estimatedusing the local calibrated design method (LCDM), which utilizes adesign chart of unit resistances developed by Dirks and Kam(1994) and summarized in Green et al. (2012). The design chart ofunit resistances was established based on a combination of the α-method by Tomlinson (1971) for cohesive materials and theMeyerhof (1976) semi-empirical method for cohesionless materi-als given by Eq. (2)
qs ¼ αSu; qt ¼ Nnc Su Tomlinson 1971ð Þ
qs ¼ N0; qt ¼
40N0
bDb
br400N
0
b Meyerhof 1976ð Þ ð2Þ
where qs and qt are the unit side friction and unit end bearing,respectively, α is the adhesion factor, Su is the undrained shearstrength in soil adjacent to the pile, Nn
c is the bearing capacityfactor, N
0is the average corrected SPT blow counts along the pile,
Db is the pile embedment depth in the bearing stratum, and b is thepile diameter/width. In other words, the resistance of a pileembedded in a mixed soil is estimated using the α-method forcohesive soil and the semi-empirical method for cohesionless soil.A geotechnical resistance factor (φ) of 0.725 was used for theLCDM method, determined by fitting to an ASD safety factor(SF) of 2.0 for all soils types, as illustrated in
φ¼γD
QDQL
� �þγL
1þ QDQL
� �SF
¼ 1:25 1:5ð Þþ1:751þ1:5ð Þ2:0 ¼ 0:725 ð3Þ

Fig. 1. Flow chart of design and construction practices of the interim and regional LRFD procedures.
K. Ng, S. Sritharan / Soils and Foundations 55 (2015) 678–690680
Although a range of SF from 2 to 4 has been reported by Allen(2005), the safety factor was developed on the basis of historicalpile load tests in the late 1980s when the AASHTO StandardSpecifications had no guidelines for SF. Knowing the appliedfactored load (γQ) for all appropriate strength load combinationsand soil information, such as a Standard Penetration Test (SPT) N-value and using the resistance factor of 0.725, the number of pilesand contract pile length were determined (see Fig. 1).
Unlike the static analysis method, the ASD approach wasimplemented in the construction control. Every pile was driven tothe contract length unless either early refusal (i.e., 160 blows per footof pile penetration) was encountered or measured driving stressesexceeded 90% of the yield strength (Fy) (i.e., 45 ksi for Grade 50steel). At the end of driving (EOD), pile resistance was ensured forservice load (i.e.,QDþQL) using a bearing graph (i.e., a plot of drivenpile capacities versus hammer blow counts) generated using WaveEquation Analysis Program (WEAP), with a safety factor of 2.2.WEAP is a one-dimensional analysis of hammer-pile-soil model,which simulates the pile motion and the force generated by thehammer to drive the pile and establishes a pile driving bearing graph(Rausche et al., 1985). The pile performance was accepted if themeasured driving resistance, which was determined from the bearinggraph corresponding to the measured hammer blow count at EOD,exceeded or equalled the plan design bearing in terms of total serviceloads (i.e., ðRWEAP=2:2ÞZQDþQL). In contrast, piles that did notsatisfy the plan design bearing usually would be re-struck, for amaximum 12 hammer blows, approximately 24 h after EOD, and theperformance criterion was re-evaluated if the pile resistance obtainedfrom the restrike test exceeded the plan design bearing. Piles that failedto satisfy the performance criterion at the beginning of re-strike (BOR)would be extended in length and driven further into the ground untilthe target design bearing was achieved (see Fig. 1).
3. Regional LRFD procedure
3.1. Development
A regional LRFD procedure for driven piles was developedthrough a comprehensive research program (http://srg.cce.
iastate.edu/lrfd/) funded by the Iowa Highway Research Board(IHRB). The regional LRFD procedure was developed byutilizing a PIle LOad Test (PILOT) database containinghistorical load test data (Roling et al., 2010) and data fromten recently completed, extensively instrumented, full-scalepile load tests (Ng et al., 2011). Of the tests in PILOT, 34 datasets on steel H-piles driven in sand summarized in Table 1 and26 data sets in mixed soils summarized in Table 2 havesufficient soil and pile information for geotechnical resistancecalculations using the LCDM method (AbdelSalam et al.,2012). Static load test was performed on each steel H-pilewhile Pile Dynamic Analyzer (PDA) tests as well as restrikeswere not performed. PDA is data acquisition system thatrecords pile strains and accelerations when a pile is driven witha hammer. Most of the test piles were driven using a singleacting diesel hammer. Of the data sets on steel H-piles given inTables 1 and 2, 11 data sets in sand and 9 data sets in mixedsoils contained the necessary hammer information and drivingrecords for WEAP analysis.The 10 recent full-scale field tests were performed on steel H-
piles (one HP 250� 85 and nine HP 250� 63) at bridgeconstruction sites throughout Iowa, with two test piles in sand(ISU9 and ISU10) and two test piles in mixed soil (ISU7 andISU8) classified using the 70% rule as summarized in Table 3.The field tests involved detailed site characterization, instrumenta-tion of the test piles with strain gauges along the length, dynamicload tests using PDA with subsequent CAse Pile Wave AnalysisProgram (CAPWAP) analyses, pile re-strikes, and static load tests(SLT) in accordance with the American Society for Testing andMaterials (ASTM) D1143 (2007): Quick Test Procedure. CAP-WAP matches PDA measured pile force and velocity with thatestimated using a one-dimensional pile-soil model (Pile Dynamics,Inc., 2000). Fig. 2 shows the estimated pile resistances fromCAPWAP (open markers) and measured pile resistances fromSLT (solid markers) as a function of time after the end of driving(EOD). Fig. 2(a) reveals that test piles embedded in mixed soilexhibited pile setup, at which the total pile resistances increasedlogarithmically with time. Due to limited test data and thecomplexity of a mixed profile in contributing to pile setup coupled
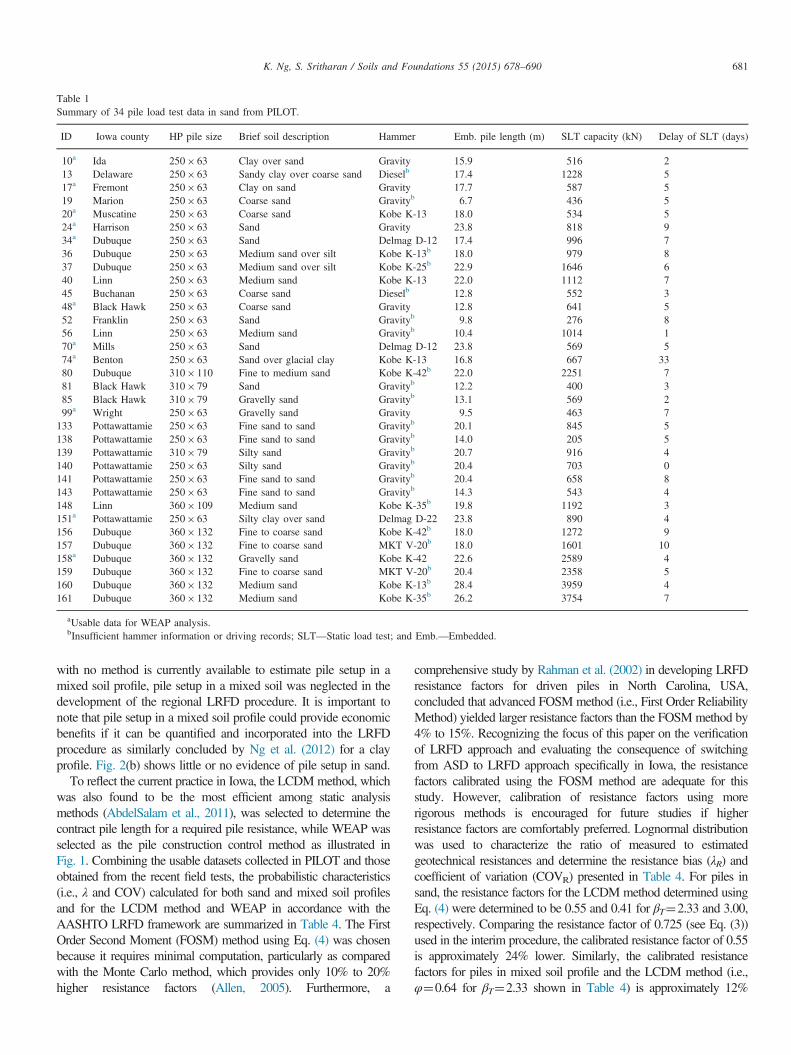
Table 1Summary of 34 pile load test data in sand from PILOT.
ID Iowa county HP pile size Brief soil description Hammer Emb. pile length (m) SLT capacity (kN) Delay of SLT (days)
10a Ida 250� 63 Clay over sand Gravity 15.9 516 213 Delaware 250� 63 Sandy clay over coarse sand Dieselb 17.4 1228 517a Fremont 250� 63 Clay on sand Gravity 17.7 587 519 Marion 250� 63 Coarse sand Gravityb 6.7 436 520a Muscatine 250� 63 Coarse sand Kobe K-13 18.0 534 524a Harrison 250� 63 Sand Gravity 23.8 818 934a Dubuque 250� 63 Sand Delmag D-12 17.4 996 736 Dubuque 250� 63 Medium sand over silt Kobe K-13b 18.0 979 837 Dubuque 250� 63 Medium sand over silt Kobe K-25b 22.9 1646 640 Linn 250� 63 Medium sand Kobe K-13 22.0 1112 745 Buchanan 250� 63 Coarse sand Dieselb 12.8 552 348a Black Hawk 250� 63 Coarse sand Gravity 12.8 641 552 Franklin 250� 63 Sand Gravityb 9.8 276 856 Linn 250� 63 Medium sand Gravityb 10.4 1014 170a Mills 250� 63 Sand Delmag D-12 23.8 569 574a Benton 250� 63 Sand over glacial clay Kobe K-13 16.8 667 3380 Dubuque 310� 110 Fine to medium sand Kobe K-42b 22.0 2251 781 Black Hawk 310� 79 Sand Gravityb 12.2 400 385 Black Hawk 310� 79 Gravelly sand Gravityb 13.1 569 299a Wright 250� 63 Gravelly sand Gravity 9.5 463 7133 Pottawattamie 250� 63 Fine sand to sand Gravityb 20.1 845 5138 Pottawattamie 250� 63 Fine sand to sand Gravityb 14.0 205 5139 Pottawattamie 310� 79 Silty sand Gravityb 20.7 916 4140 Pottawattamie 250� 63 Silty sand Gravityb 20.4 703 0141 Pottawattamie 250� 63 Fine sand to sand Gravityb 20.4 658 8143 Pottawattamie 250� 63 Fine sand to sand Gravityb 14.3 543 4148 Linn 360� 109 Medium sand Kobe K-35b 19.8 1192 3151a Pottawattamie 250� 63 Silty clay over sand Delmag D-22 23.8 890 4156 Dubuque 360� 132 Fine to coarse sand Kobe K-42b 18.0 1272 9157 Dubuque 360� 132 Fine to coarse sand MKT V-20b 18.0 1601 10158a Dubuque 360� 132 Gravelly sand Kobe K-42 22.6 2589 4159 Dubuque 360� 132 Fine to coarse sand MKT V-20b 20.4 2358 5160 Dubuque 360� 132 Medium sand Kobe K-13b 28.4 3959 4161 Dubuque 360� 132 Medium sand Kobe K-35b 26.2 3754 7
aUsable data for WEAP analysis.bInsufficient hammer information or driving records; SLT—Static load test; and Emb.—Embedded.
K. Ng, S. Sritharan / Soils and Foundations 55 (2015) 678–690 681
with no method is currently available to estimate pile setup in amixed soil profile, pile setup in a mixed soil was neglected in thedevelopment of the regional LRFD procedure. It is important tonote that pile setup in a mixed soil profile could provide economicbenefits if it can be quantified and incorporated into the LRFDprocedure as similarly concluded by Ng et al. (2012) for a clayprofile. Fig. 2(b) shows little or no evidence of pile setup in sand.
To reflect the current practice in Iowa, the LCDMmethod, whichwas also found to be the most efficient among static analysismethods (AbdelSalam et al., 2011), was selected to determine thecontract pile length for a required pile resistance, while WEAP wasselected as the pile construction control method as illustrated inFig. 1. Combining the usable datasets collected in PILOT and thoseobtained from the recent field tests, the probabilistic characteristics(i.e., λ and COV) calculated for both sand and mixed soil profilesand for the LCDM method and WEAP in accordance with theAASHTO LRFD framework are summarized in Table 4. The FirstOrder Second Moment (FOSM) method using Eq. (4) was chosenbecause it requires minimal computation, particularly as comparedwith the Monte Carlo method, which provides only 10% to 20%higher resistance factors (Allen, 2005). Furthermore, a
comprehensive study by Rahman et al. (2002) in developing LRFDresistance factors for driven piles in North Carolina, USA,concluded that advanced FOSMmethod (i.e., First Order ReliabilityMethod) yielded larger resistance factors than the FOSMmethod by4% to 15%. Recognizing the focus of this paper on the verificationof LRFD approach and evaluating the consequence of switchingfrom ASD to LRFD approach specifically in Iowa, the resistancefactors calibrated using the FOSM method are adequate for thisstudy. However, calibration of resistance factors using morerigorous methods is encouraged for future studies if higherresistance factors are comfortably preferred. Lognormal distributionwas used to characterize the ratio of measured to estimatedgeotechnical resistances and determine the resistance bias (λR) andcoefficient of variation (COVR) presented in Table 4. For piles insand, the resistance factors for the LCDM method determined usingEq. (4) were determined to be 0.55 and 0.41 for βT¼2.33 and 3.00,respectively. Comparing the resistance factor of 0.725 (see Eq. (3))used in the interim procedure, the calibrated resistance factor of 0.55is approximately 24% lower. Similarly, the calibrated resistancefactors for piles in mixed soil profile and the LCDM method (i.e.,φ¼0.64 for βT¼2.33 shown in Table 4) is approximately 12%

Table 2Summary of 26 pile load test data in mixed soil from PILOT.
ID Iowa county HP pile size Brief soil description Hammer Emb. pile length (m) SLT capacity (kN) Delay of SLT (days)
3 Fremont 250� 63 Silty clay over sand Gravityb 14.3 418 24 Jones 250� 63 Silty clay over sand Gravityb 15.5 347 27a Cherokee 250� 63 Sand over glacial clay Gravity 11.9 783 68a Linn 250� 63 Clay over sand Kobe K-13 16.5 756 814 Audubon 250� 63 Sand over glacial clay Delmag D-15b 9.1 498 625a Harrison 250� 63 Sand over clay Delmag D-12 17.7 996 438 Iowa 250� 63 Silty clay over medium sand Delmag D-12b 13.1 436 239 Iowa 250� 63 Silty clay over medium sand Delmag D-12b 16.8 721 443a Linn 250� 63 Sand over clay Delmag D-22 11.0 632 546a Iowa 250� 63 Clay over sand Gravity 14.6 730 458 Dallas 250� 63 Sand over glacial clay Gravityb 10.7 498 759 Monona 250� 63 Sandy clay over sand Delmag D-12b 11.6 302 666a Black Hawk 250� 63 Sand over glacial clay Mit M14S 13.1 801 573a Johnson 250� 63 Sand over glacial clay Kobe K-13 14.3 1032 690a Black Hawk 310� 79 Sand over glacial clay Gravity 19.8 845 491 Black Hawk 310� 79 Gravelly sand over silty clay Gravityb 20.7 649 296 Story 250� 63 Clayey sand over glacial clay Dieselb 14.6 765 7103 Page 250� 63 Fine to coarse sand over glacial clay Delmag D-12b 10.4 810 7106a Pottawattamie 250� 63 Sand over glacial clay Gravity 11.0 658 6128 Ringgold 250� 63 Silt over coarse sand Gravityb 15.9 1157 2134 Pottawattamie 250� 63 Silty clay over silty sand Gravityb 4.9 80 4135 Pottawattamie 310� 79 Silty clay over sand Gravityb 16.2 730 4136 Pottawattamie 250� 63 Silty clay over sand Gravityb 14.9 507 5137 Pottawattamie 250� 63 Silty clay over sand Gravityb 7.6 302 6146 Shelby 250� 63 Silty clay over sand Delmag D-12b 14.6 596 2155 Boone 310� 79 Coarse sand over glacial clay Dieselb 14.0 276 9
aUsable data for WEAP analysis.bInsufficient hammer information or driving records; SLT—Static load test; and Emb.—Embedded.
Table 3Summary of recently completed field pile load tests for WEAP analysis.
Soil profile ID Iowa county HP pile size Brief soil description Hammer Emb. pile length (m) SLT capacity (kN) Delay of SLT (days)
Sand ISU9 Des Moines 250� 63 12 ft thick clay over sand APE D19-42 14.3 703 25ISU10 Cedar 250� 63 Sandy silt to sand APE D19-42 14.1 565 6
Mixed soil ISU7 Buchanan 250� 63 Sand over silty clay to clay Delmag D19-42 5.8 236 13ISU8 Poweshiek 250� 63 Sand over glacial clay Delmag D19-42 16.8 721 15
Emb.—Embedded.
0
50
100
150
200
250
0.0001 0.01 1 100
Tot
al P
ile R
esis
tanc
e, Rt(
kip)
Time After End of Driving, t (Day)
ISU7 (CAPWAP)ISU8 (CAPWAP)ISU7 (SLT)
0
50
100
150
200
250
0.0001 0.01 1 100
Tot
al P
ile R
esis
tanc
e, R
t (ki
p)
Time After End of Driving, t (Day)
ISU9 (CAPWAP)ISU10 (CAPWAP)ISU9 (SLT)
Fig. 2. Total pile resistance as a function of time (a) Test piles in mixed soil. (b) Test piles in sand.
K. Ng, S. Sritharan / Soils and Foundations 55 (2015) 678–690682

K. Ng, S. Sritharan / Soils and Foundations 55 (2015) 678–690 683
lower. Although a higher resistance factor of 0.725 was being usedin the interim procedure, Fig. 3 shows that it corresponds to lower βvalues of 1.7 for sand and 2.00 for mixed soil profile. These lower βvalues represent probability of failures (i.e., 30% and 10%) higherthan the 1% stipulated in the American Association of StateHighway and Transportation Officials (AASHTO) (2012).
φ¼λR
γDQDQL
þγL
� � ffiffiffiffiffiffiffiffiffiffiffiffiffiffiffiffiffiffiffiffiffiffiffiffiffiffiffiffiffiffiffiffiffiffiffi1þCOV2
DþCOV2Lð Þ
1þCOV2Rð Þ
� �s
λDQDQL
þλL� �
e βT
ffiffiffiffiffiffiffiffiffiffiffiffiffiffiffiffiffiffiffiffiffiffiffiffiffiffiffiffiffiffiffiffiffiffiffiffiffiffiffiffiffiffiffiffiffiffiffiffiffiffiffiln 1þCOV2
Rð Þ 1þCOV2D þCOV2
Lð Þ½ �p ð4Þ
where λR is the resistance bias factor of the ratio of SLT measuredresistance to estimated resistance; COVR is the coefficient ofvariation of the ratio of SLT measured resistance to estimatedresistance; γD and γL are the dead load factor (1.25) and live loadfactor (1.75), respectively; λD and λL are the dead load bias (1.05)
Table 4Calibrated LRFD resistance factors for driven piles in sand and mixed soils.
Data source Soil profile Stage Method N
Iowa Sand Design LCDM 36Construction WEAP 13
Mixed Design LCDM 29Construction WEAP 11
Table 5Recommended LRFD resistance factors for driven piles in sand and mixed soils.
Source Soil Stage Method
Iowa Sand Design LCDMConstruction WEAP
Mixed Design LCDMConstruction WEAP
AASHTO Sand Design SPT-MeyerhofConstruction WEAP
Mixed Design α-methodConstruction WEAP
aResistance factor was reduced to minimizing the effect of pile setup as the perbRatio of AASHTO recommended resistance factor to resistance bias determine
2.330.0
0.2
0.4
0.6
0.8
1.0
1.0 1.5 2.0 2.5
Res
ista
nce
Fact
or (ϕ
)
Reliabilit
0.7250.6400.550
Fig. 3. Resistance factors for LCD
and live load bias (1.15), respectively; COVD and COVL are thecoefficient of variation for dead load (0.1) and coefficient ofvariation for live load (0.2), respectively; ðQD=QLÞ is the dead tolive load ratio (2.0); and βT is the target reliability indices (2.33corresponding to 1% probability of failure, and 3.00 correspond-ing to 0.1% probability of failure, as recommended by Paikowskyet al. (2004) for representing redundant and non-redundant pilegroups, respectively).Higher resistance factors for the mixed soil profile are attributed
to the effect of the pile setup observed in Fig. 2 due to thepresence of cohesive soil in the soil profile. Compared with themeasured pile resistances obtained from SLT that were performedseveral days after the EOD, pile resistances were generallyunderestimated by the LCDM and WEAP. Thus, higher resistancebiases (λR¼1.20 and 1.52) were determined, resulting in relativelyhigh resistance factors in Table 4 (i.e., 0.60 and 0.80).
λR COVR βT¼2.33 βT¼3.00
φ φ/λ φ φ/λ
1.16 0.37 0.55 0.47 0.41 0.361.05 0.33 0.54 0.52 0.42 0.401.20 0.34 0.64 0.53 0.50 0.421.52 0.31 0.80 0.53 0.62 0.41
φ φ/λ
βT¼2.33 βT¼3.00 βT¼2.33 βT¼3.00
0.55 0.40 0.47 0.360.55 0.40 0.52 0.400.60 0.50 0.54 0.420.65a 0.50a 0.42 0.320.30 0.25 0.37b 0.31b
0.50 0.40 0.30b 0.24b
0.35 0.30 0.44b 0.38b
0.50 0.40 0.30b 0.24b
centage of cohesive soil can vary significantly between sites.d by Paikowsky et al. (2004).
3.0 3.5 4.0 4.5y Index (β)
SandMixed
M as a function of β values.

Table 6Summary of independent data on completed production steel H-piles in sand.
Iowa county-ID
Pier/abutment
HP pilesize
Brief soildescription
Rock below ground(m)
Hammer type Average blow count per 0.3 m(EOD)
Ave. N-value
Plan pile length(m)
Fremont-67 Pier 1 360� 109 F. SA over C. SA – APE D19-42 39 18 32Pier 2 360� 109 F. SA over C. SA – APE D19-42 36 20 32
Pottawattamie-70
Pier 1 310� 79 Sandy CL. over F.SA
– DelmagD19-42
138 7 37
Pier 2 310� 79 Silty CL. over F.SA
– DelmagD19-42
156 7 37
N. Abut. 250� 63 Medium SA 32 DelmagD19-42
137 18 37
S. Abut. 250� 63 Stiff Silt to M. SA 31.4 DelmagD19-42
130 19 37
Cedar-244 Pier 1 250� 85 SA and GR 11 APE D19-42 160 16 17Pier 2 250� 85 C. SA 14 APE D19-42 160 23 18.5Pier 3 250� 85 C. SA 14 APE D19-42 160 23 18.5Pier 5 250� 85 SA and GR 10.4 APE D19-42 160 16 12.5Pier 6 310� 79 SA and GR 6.1 APE D19-42 160 11 9.5W. Abut. 250� 85 Silty CL over M.
SA22 APE D19-42 160 29 27.5
E. Abut. 250� 85 M. SA 5.5 APE D19-42 160 28 9.5Plymouth-75 W. Abut. 250� 63 Sandy Silt over C.
SA22 Delmag
D19-4275 32 30.5
BH-22 E. Abut. 250� 63 M. SA 11.3 DelmagD19-42
170 28 14
Lee-146 N. Abut. 250� 85 M. SA – DelmagD19-32
30 23 26
SBL S.Abut.
250� 85 M. SA – Kobe K-25 151 19 24.5
NBL S.Abut.
250� 85 M. SA – DelmagD19-32
40 24 27.5
Butler-25 S. Abut. 250� 85 Sandy CL. overSA
7 DelmagD19-42
150 42 14
Greene-31 Pier 3 360� 109 SA 10.1 DelmagD16-32
65 39 14
Iowa-20 Pier 1 360� 109 SA 5.5 DelmagD19-42
160 18 14
Pier 2 360� 109 SA 5.5 DelmagD19-42
153 18 14
N.—North; S.—South; E.—East; W.—West; Abut.—Abutment; NBL—North Bound Lane; SBL—South Bound Lane; CL.—Clay; SA—Sand; GR—Gravel;F.—Fine; C.—Coarse; M.—Medium; BH—Black Hawk; and Ave.—Weighted Average.
K. Ng, S. Sritharan / Soils and Foundations 55 (2015) 678–690684
3.2. Recommendations
The calibrated resistance factors shown in Table 4 wererounded to the nearest 0.05 and recommended in Table 5. Toeliminate the uncertainty of pile setup in a mixed soil profile,the unrealistically high resistance factor of 0.80 for WEAP wasreduced to 0.65, which was to match the resistance factorrecommended for piles embedded in a clay soil profile and pileresistances estimated using WEAP at the EOD (Ng et al.,2012). Since the LCDM method is a combination of the α-method for cohesive materials and the Meyerhof (1976) semi-empirical method for cohesionless materials (Dirks and Kam,1994), the resistance factors of the α-method for mixed soiland SPT-Meyerhof for sand obtained from the AmericanAssociation of State Highway and Transportation Officials(AASHTO) (2012) were included for comparison. It isimportant to note that the resistance factors alone cannot be
used to measure the efficiency of various methods, because theefficiency of each method is highly influenced by therespective λR (Paikowsky et al., 2004). To normalize theinfluence of λ on φ, the efficiency of different methods wasevaluated using an efficiency factor (φ/λ), which is defined asthe ratio of the resistance factor to its respective resistance bias.A higher φ/λ value correlates to a better efficient pile designmethod. Table 5 shows that the regional LRFD calibrationproduces higher resistance factors and efficiency factors forboth soil profiles.
4. Summary of field data
Recognizing that the aforementioned regional LRFD proce-dure was developed based on test piles, it is desirable to verifyits application on recently designed and installed productionpiles. It is important to highlight that the average embedded
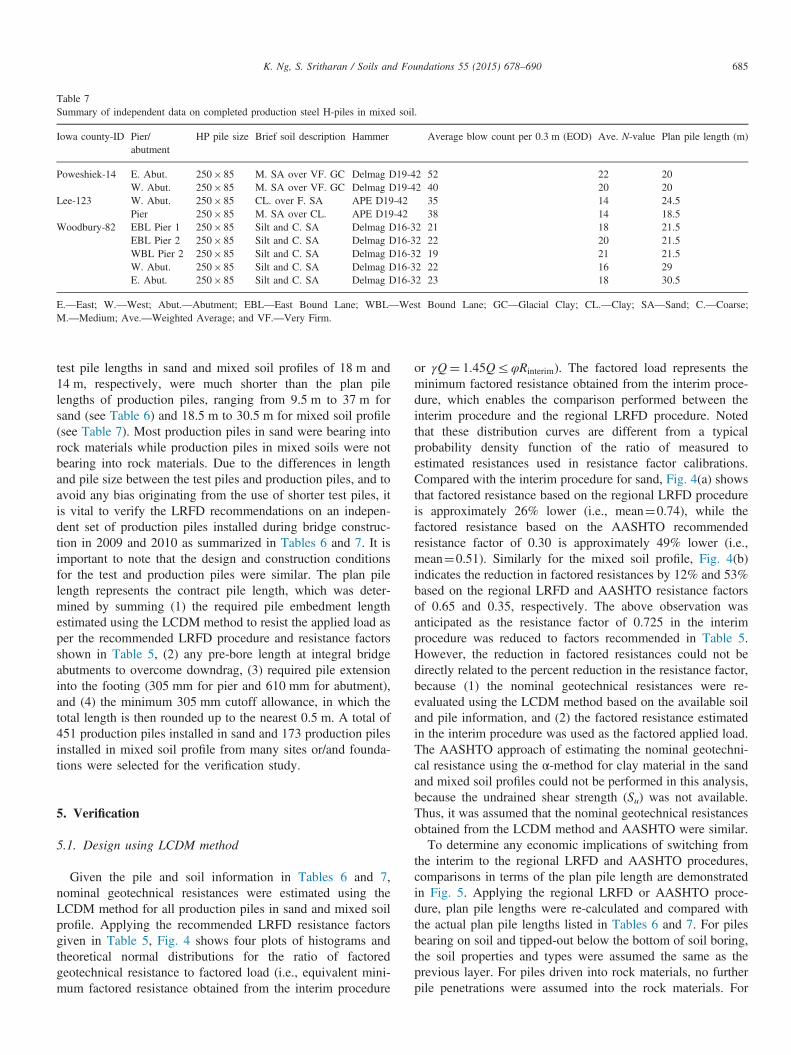
Table 7Summary of independent data on completed production steel H-piles in mixed soil.
Iowa county-ID Pier/abutment
HP pile size Brief soil description Hammer Average blow count per 0.3 m (EOD) Ave. N-value Plan pile length (m)
Poweshiek-14 E. Abut. 250� 85 M. SA over VF. GC Delmag D19-42 52 22 20W. Abut. 250� 85 M. SA over VF. GC Delmag D19-42 40 20 20
Lee-123 W. Abut. 250� 85 CL. over F. SA APE D19-42 35 14 24.5Pier 250� 85 M. SA over CL. APE D19-42 38 14 18.5
Woodbury-82 EBL Pier 1 250� 85 Silt and C. SA Delmag D16-32 21 18 21.5EBL Pier 2 250� 85 Silt and C. SA Delmag D16-32 22 20 21.5WBL Pier 2 250� 85 Silt and C. SA Delmag D16-32 19 21 21.5W. Abut. 250� 85 Silt and C. SA Delmag D16-32 22 16 29E. Abut. 250� 85 Silt and C. SA Delmag D16-32 23 18 30.5
E.—East; W.—West; Abut.—Abutment; EBL—East Bound Lane; WBL—West Bound Lane; GC—Glacial Clay; CL.—Clay; SA—Sand; C.—Coarse;M.—Medium; Ave.—Weighted Average; and VF.—Very Firm.
K. Ng, S. Sritharan / Soils and Foundations 55 (2015) 678–690 685
test pile lengths in sand and mixed soil profiles of 18 m and14 m, respectively, were much shorter than the plan pilelengths of production piles, ranging from 9.5 m to 37 m forsand (see Table 6) and 18.5 m to 30.5 m for mixed soil profile(see Table 7). Most production piles in sand were bearing intorock materials while production piles in mixed soils were notbearing into rock materials. Due to the differences in lengthand pile size between the test piles and production piles, and toavoid any bias originating from the use of shorter test piles, itis vital to verify the LRFD recommendations on an indepen-dent set of production piles installed during bridge construc-tion in 2009 and 2010 as summarized in Tables 6 and 7. It isimportant to note that the design and construction conditionsfor the test and production piles were similar. The plan pilelength represents the contract pile length, which was deter-mined by summing (1) the required pile embedment lengthestimated using the LCDM method to resist the applied load asper the recommended LRFD procedure and resistance factorsshown in Table 5, (2) any pre-bore length at integral bridgeabutments to overcome downdrag, (3) required pile extensioninto the footing (305 mm for pier and 610 mm for abutment),and (4) the minimum 305 mm cutoff allowance, in which thetotal length is then rounded up to the nearest 0.5 m. A total of451 production piles installed in sand and 173 production pilesinstalled in mixed soil profile from many sites or/and founda-tions were selected for the verification study.
5. Verification
5.1. Design using LCDM method
Given the pile and soil information in Tables 6 and 7,nominal geotechnical resistances were estimated using theLCDM method for all production piles in sand and mixed soilprofile. Applying the recommended LRFD resistance factorsgiven in Table 5, Fig. 4 shows four plots of histograms andtheoretical normal distributions for the ratio of factoredgeotechnical resistance to factored load (i.e., equivalent mini-mum factored resistance obtained from the interim procedure
or γQ¼ 1:45QrφRinterim). The factored load represents theminimum factored resistance obtained from the interim proce-dure, which enables the comparison performed between theinterim procedure and the regional LRFD procedure. Notedthat these distribution curves are different from a typicalprobability density function of the ratio of measured toestimated resistances used in resistance factor calibrations.Compared with the interim procedure for sand, Fig. 4(a) showsthat factored resistance based on the regional LRFD procedureis approximately 26% lower (i.e., mean¼0.74), while thefactored resistance based on the AASHTO recommendedresistance factor of 0.30 is approximately 49% lower (i.e.,mean¼0.51). Similarly for the mixed soil profile, Fig. 4(b)indicates the reduction in factored resistances by 12% and 53%based on the regional LRFD and AASHTO resistance factorsof 0.65 and 0.35, respectively. The above observation wasanticipated as the resistance factor of 0.725 in the interimprocedure was reduced to factors recommended in Table 5.However, the reduction in factored resistances could not bedirectly related to the percent reduction in the resistance factor,because (1) the nominal geotechnical resistances were re-evaluated using the LCDM method based on the available soiland pile information, and (2) the factored resistance estimatedin the interim procedure was used as the factored applied load.The AASHTO approach of estimating the nominal geotechni-cal resistance using the α-method for clay material in the sandand mixed soil profiles could not be performed in this analysis,because the undrained shear strength (Su) was not available.Thus, it was assumed that the nominal geotechnical resistancesobtained from the LCDM method and AASHTO were similar.To determine any economic implications of switching from
the interim to the regional LRFD and AASHTO procedures,comparisons in terms of the plan pile length are demonstratedin Fig. 5. Applying the regional LRFD or AASHTO proce-dure, plan pile lengths were re-calculated and compared withthe actual plan pile lengths listed in Tables 6 and 7. For pilesbearing on soil and tipped-out below the bottom of soil boring,the soil properties and types were assumed the same as theprevious layer. For piles driven into rock materials, no furtherpile penetrations were assumed into the rock materials. For

1.21.00.80.60.40.2
140
120
100
80
60
40
20
0
1.21.00.80.60.40.2
Regional LRFD
Ratio of Factored Resistance to Factored Load
Freq
uenc
y
1
AASHTO
1
Mean 0.7391StDev 0.2403N 451
Regional LRFD
Mean 0.5140StDev 0.1687N 451
AASHTO
1.00.90.80.70.60.50.4
120
100
80
60
40
20
0
1.00.90.80.70.60.50.4
Regional LRFD
Ratio of Factored Resistance to Factored Load
Fre
quen
cy
1
AASHTO
1
Mean 0.8773StDev 0.05995N 173
Regional LRFD
Mean 0.4724StDev 0.03228N 173
AASHTO
Sand
Mixed
Fig. 4. Histogram and theoretical normal distribution of the ratio of factored geotechnical resistance estimated using LCDM to factored applied load.
K. Ng, S. Sritharan / Soils and Foundations 55 (2015) 678–690686
Cedar-244: Pier 5, Pier 6 and East Abutment and Greence-31:Pier 3, where the applied load exceeded the total sideresistance and the end bearing on rock, the increase in planpile lengths were assumed at their upper bounds near theground surface. In this verification study, the increase in planpile length did not change the originally determined soilprofile. Fig. 5(a) shows that if the regional LRFD procedurefor sand would have been implemented, the plan pile length,on average, would have been approximately 25% longer,which is significantly lower than the 86% for AASHTOprocedure. For the mixed soil profile shown in Fig. 5(b), theplan pile length based on the regional LRFD procedure, onaverage, would have increased approximately by 12%, whichis again significantly lower than the 93% for the AASHTOprocedure. If more rigorous methods, such as the Bayesiantheory (Park et al., 2012), had been used in calibrating theresistance factors, the expected increase in pile lengths would
be smaller than the 25% for sand profile and 12% for themixed soil profile, which could further contribute the economicbenefits of using the regional LRFD procedure.
5.2. Construction control using WEAP
The adequate resistance of the production piles was verifiedusing WEAP during construction. The construction controlprocedure practiced in the interim is also used in the regionalLRFD method. Accordingly, piles that do not achieve thetarget resistance at EOD are retapped approximately 24 h later,and the performance criterion is re-evaluated. Piles that fail tosatisfy the performance criterion at the end of retap areextended in length and driven further into the ground untilthe target resistance is achieved. Using the pile data sets givenin Tables 6 and 7 as well as the field data in terms of hammerblow counts, comparisons were made in terms of number of

3.63.02.41.81.20.6
250
200
150
100
50
0
3.63.02.41.81.20.6
Regional LRFD
Ratio of Plan Pile Length (Regional LRFD or AASHTO to Interim)
Freq
uenc
y
1
AASHTO
1
Mean 1.254StDev 0.4455N 451
Regional LRFD
Mean 1.857StDev 0.7603N 451
AASHTO
Sand
2.01.81.61.41.21.00.8
140
120
100
80
60
40
20
0
2.01.81.61.41.21.00.8
Regional LRFD
Ratio of Plan Pile Length (Regional LRFD or AASHTO to Interim)
Freq
uenc
y
1
AASHTO
1
Mean 1.124StDev 0.05299N 173
Regional LRFD
Mean 1.933StDev 0.1530N 173
AASHTO
Mixed
Fig. 5. Comparison of plan pile lengths estimated using the regional LRFD or AASHTO and the interim procedure for piles in (a) sand and (b) mixed soil profile.
K. Ng, S. Sritharan / Soils and Foundations 55 (2015) 678–690 687
piles requiring retap and possibly extension. It is important tohighlight that this study was conducted based on the actualplan pile lengths summarized in Tables 6 and 7. Theanticipated increase in pile lengths based on the regionalLRFD procedure using the LCDM method presented in Fig. 5was not considered in this study while this study was based onthe construction control method, WEAP. The study outcomesare summarized in Table 8 for sand and Table 9 for mixed soilprofile. The actual driving records of production piles based onthe interim procedure indicate that 11 production piles in sandwere retapped and no piles were extended. Switching from theinterim to the regional LRFD procedure for sand will increasethe number of piles requiring retap to 66 (15%) and at leasttwo piles will require extension. Since the resistance factor forthe AASHTO is slightly lower than that of the regional LRFD(see Table 5), a slightly higher driving requirement is observed
for the AASHTO recommendation (i.e., 69 piles required retapand at least five piles required extension).The actual driving records of production piles in mixed soils
based on the interim procedure as shown in Table 9 indicatethat 78 (45%) of production piles were retapped and no pilewas extended. If the regional LRFD procedure for the mixedsoil profile would have been implemented during constructionwhile keeping the same actual plan pile length, 82 (47%)production piles would have required retap and at least 19(11%) piles would require extension of length to achieve thetarget resistance. If the AASHTO procedure would have beenadopted for implementation, 139 (80%) production piles wouldhave required retap and at least 76 (44%) piles would requireextension. It is important to note that pile setup in the mixedsoil profile was not considered in this study. Thus, theeconomic benefits contributed from pile setup in the clay

Table 8Comparison between interim, regional LRFD and AASHTO procedures for piles in sand.
Iowa county-IDnumber
Pier/abutment
Total ofpiles
Interim Regional LRFD AASHTO
of Piles wereretapped
of Piles wereextended
of Piles requireretap
of Piles requireextension
of Piles requireretap
of Piles requireextension
Fremont-67 Pier 1 14 6 0 6 0 7 0Pier 2 11 5 0 8 2 9 5
Pottawattamie-70 Pier 1 9 0 0 0 0 0 0Pier 2 9 0 0 0 0 0 0N. Abut. 7 0 0 1 n/a 1 n/aS. Abut. 7 0 0 0 0 0 0
Cedar-244 Pier 1 55 0 0 0 0 0 0Pier 2 46 0 0 0 0 0 0Pier 3 40 0 0 0 0 0 0Pier 5 50 0 0 0 0 0 0Pier 6 40 0 0 0 0 0 0W. Abut. 19 0 0 0 0 0 0E. Abut. 17 0 0 0 0 0 0
Plymouth-75 W. Abut. 22 0 0 0 0 0 0Black Hawk-22 E. Abut. 7 0 0 0 0 0 0Lee-146 N. Abut. 20 0 0 20 n/a 20 n/a
SBL S.Abut.
13 0 0 0 0 0 0
NBL S.Abut.
20 0 0 20 n/a 20 n/a
Butler-25 S. Abut. 9 0 0 0 0 0 0Greene-31 Pier 3 12 0 0 11 n/a 12 n/aIowa-20 Pier 1 12 0 0 0 0 0 0
Pier 2 12 0 0 0 0 0 0
Total (Percent of total piles) 451 11 (2%) 0 66 (15%) Z2 (0.4%) 69 (15%) Z5 (1%)
N.—North; S.—South; E.—East; W.—West; Abut.—Abutment; NBL—North Bound Lane; SBL—South Bound Lane; and n/a—no restrike information forevaluation.
Table 9Comparison between interim, regional LRFD and AASHTO procedures for piles in mixed soil.
Iowa county-IDNumber
Pier/abutment
Total ofpiles
Interim Regional LRFD AASHTO
of Piles wereretapped
of Piles wereextended
of Piles requireretap
of Piles requireextension
of Piles requireretap
of Piles requireextension
Poweshiek-14 E. Abut. 8 0 0 0 0 7 n/aW. Abut. 8 0 0 3 n/a 8 n/a
Lee-123 W. Abut. 17 0 0 0 n/a 17 n/aPier 60 0 0 5 n/a 27 n/a
Woodbury-82 EBL Pier1
21 19 0 19 2 21 21
EBL Pier2
22 22 0 18 5 22 18
WBL Pier2
22 22 0 22 4 22 22
W. Abut. 7 7 0 7 2 7 7E. Abut. 8 8 0 8 6 8 8
Total (percent of total piles) 173 78 (45%) 0 82 (47%) Z19 (11%) 139 (80%) Z76 (44%)
E.—East; W.—West; Abut.—Abutment; EBL—East Bound Lane; WBL—West Bound Lane; and n/a—no restrike information for evaluation.
K. Ng, S. Sritharan / Soils and Foundations 55 (2015) 678–690688
profile described by Ng et al. (2012) cannot be similarlyrealized in the mixed soil profile.
If the plan pile length had increased during the design stagebased on the regional LRFD procedure as described in Fig. 5,
the results presented in Table 8 for sand and Table 9 for mixedprofile would be different. The increase in plan pile lengthduring the design stage would have reduced pile retap andextension in sand. Lesser retapping and extension would be

Table 10Cost comparison.
Soil profile Description Unit Unit costa (US$) Additional cost (percent increase) Times of cost saving
Regional LRFD procedure AASHTO procedure
Sand Increase in plan pile length m $131.20 $291,300 (25%) $1002,072 (86%) 2.44Mixed Increase in plan pile length m $131.20 $57,672 (12%) $446,958 (93%) 6.75
aUnit construction and material cost of a steel H-pile.
K. Ng, S. Sritharan / Soils and Foundations 55 (2015) 678–690 689
realized in the mixed soil profile due to the unaccountablesetup. If larger resistance factors had been calibrated using themore rigorous methods, the driving requirements for both sandand mixed soil profiles could be lower than that based on theresistance factors by the FOSM method.
5.3. Cost analysis
The verification study suggests potential increase in directcost to the bridge pile foundation when the regional LRFD orAASHTO procedure is implemented over the interim proce-dure. Additional cost incurred by switching from interim toLRFD procedure and cost saving by implementing the regionalLRFD procedure over the AASHTO procedure for both sandand mixed soil profiles are summarized in Table 10. The unitconstruction and material cost of US$131.20 per meter of steelH-piles was assumed in this study. Major cost increase isrealized when additional plan pile lengths as a result of LRFDimplementation are required. It was assumed that the pileretapping and extension would not incur additional cost due tothe increase in plan pile length; instead this will provide somecost saving which is not availably accounted for here. For the451 production piles in sand profile presented in Fig. 5(a) witha total pile length of about 8881.1 m, a 25% increase in pilelength as a result of switching from interim to the regionalLRFD procedure as concluded in Fig. 5(a) will result anincrease in pile length by about 2220.27 m. Multiplying theunit cost of $131.20 to this additional pile length will yield anadditional cost of US$291,300 or 25% increase in cost.However, this cost increase is much lower than $1002,072determined for the AASHTO procedure based on an antici-pated 86% increase in pile length concluded in Fig. 5(a). Acost saving by a factor of 2.44 (i.e., a saving of $710,772 withrespect to $291,300) will be realized when the regional LRFDprocedure is implemented over the AASHTO procedure.Likewise, for the 173 production piles in mixed soil profilewith a total pile length of about 3663.11 m, a 12% increase inpile length as a result of switching from interim to the regionalLRFD procedure as concluded in Fig. 5(b) will result anincrease in pile length by about 439.57 m. Multiplying the unitcost of $131.20 to this additional pile length will yield anadditional cost of US$57,672. However, this cost increase ismuch lower than $446,958 determined for the AASHTOprocedure based on an anticipated 93% increase in pile lengthconcluded in Fig. 5(b). A cost saving by a factor of 6.75 (i.e., asaving of $389,286 with respect to $57,672) will be realizedwhen the regional LRFD procedure is implemented over the
AASHTO procedure. The additional incurred cost is higher insand than that in the mixed soil profile, aligning with theresistance factors recommended in Table 5.
6. Conclusions
This paper demonstrates the potential consequences ofswitching the design and construction of bridge foundationsin sand and mixed soil profiles from an ASD based procedureto the regionally calibrated LRFD procedure. The local LRFDcalibration using the PILOT database and recently completedfield tests yielded lower resistance factors than 0.725 used inthe interim procedure but higher than those recommended inthe AASHTO LRFD Specifications. However, it is importantto highlight that the high resistance factor of 0.725 correspondsto lower reliability indices, which also represent higherprobability of failure than 1% stipulated in the AASHTO.The recommended LRFD and construction of piles wereverified using 451 production piles in sand and 173 productionpiles in mixed soil, which were installed in 2009 and 2010 atvarious bridge projects in Iowa. The following conclusionshave been drawn from this study:
1.
For piles in sand, the regional LRFD procedure will, onaverage, yield 26% lower factored geotechnical resistanceand 25% longer plan pile length than that based on the ASDbased procedure. If the actual plan pile lengths determinedbased on the ASD based procedure are used in theconstruction control analysis, the number of piles requiringretap will increase from 2% to 15%, and at least two pileswill require extension. On the other hand, the AASHTOprocedure will produce 48% lower factored resistance and86% longer pile length. Compared with the regional LRFDprocedure, a slightly higher number of pile retaps andextensions will be anticipated for the AASHTO procedure.2.
For piles in mixed soil profile, the regional LRFD procedurewill, on average, yield 12% lower factored geotechnicalresistance and 12% longer plan pile length than that basedon the ASD based procedure. Using the actual plan pilelength, the number of piles requiring retap will increaseonly 2% (i.e., from 45% to 47%), and at least 19 piles willrequire extension. On the other hand, the AASHTOprocedure will produce 53% lower factored resistance and93% longer pile length. About 80% piles will require retapand at least 44% pile extensions will be needed.3.
Due to limited test data and the complexity of a mixed profilein contributing to pile setup coupled with no method is
K. Ng, S. Sritharan / Soils and Foundations 55 (2015) 678–690690
currently available to estimate pile setup in a mixed soil profile,pile setup in a mixed soil was neglected in the development ofthe regional LRFD procedure. However, future research onquantifying pile setup in mixed soils will bring economicbenefits as similarly realized in the cohesive soil.
4.
Switching from the ASD based procedure to the regionalLRFD procedure will require much longer plan pile lengthin the sand profile than that in the mixed soil profile. Forconstruction control using WEAP, a higher driving require-ment will be expected for piles in the sand profile. For pilesin the mixed soil profile, the driving requirement will beabout the same as for the ASD based procedure.5.
The cost analysis indicates that major cost increase incurswhen additional plan pile lengths are required. Costincreases of 25% and 12% will be anticipated due to theincrease in plan pile lengths for sand and mixed soilprofiles, respectively. By implementing the regional LRFDprocedure rather than the AASHTO procedure, the founda-tion cost will be reduced by a factor of 2.44 for sand and6.75 for a mixed soil profile.6.
This study clearly demonstrates the tremendous benefit ofthe use of regionally calibrated resistance factor in LRFDbased on the First Order Second Moment method. How-ever, additional benefits ranging between 4% and 20%could be realized if more rigorous calibration methods areused to develop relatively higher resistance factors that arecomfortably preferred for implementation.Acknowledgements
The authors would like to thank Ken Dunker of Iowa DOTfor providing the field data and reviewing the paper. Specialthanks are due to Erica Velasco of Iowa State University andDanielle DeBoer of Dordt College for their assistances withcompiling large data sets.
References
AbdelSalam, S.S., Sritharan, S., Suleiman, M.T., 2010. Current design andconstruction practices of bridge pile foundations with emphasis onimplementation of LRFD. J. Bridge Eng., ASCE 15 (6), 749–758.
AbdelSalam, S.S., Sritharan, S., Suleiman, M.T., 2011. LRFD resistancefactors for design of driven H-piles in layered soils. J. Bridge Eng., ASCE16 (6), 739–748.
AbdelSalam, S.S., Ng, K.W., Sritharan, S., Suleiman, M.T., Roling, M. (2012):Development of LRFD Design Procedures for Bridge Piles in Iowa—Recommended Resistance Factors with Consideration to ConstructionControl and Setup. Final Report Vol. III. IHRB Project No. TR-584.Institute for Transportation, Iowa State Univeristy, Ames, IA.. , .
Allen, T.M., 2005. Development of Geotechnical Resistance Factors andDowndrag Load Factors for LRFD Foundation Strength Limit State
Design, FHWA-NHI-05-052. Federal Highway Administration, U.S.Department of Transportation, Washington, DC..
American Association of State Highway and Transportation Officials(AASHTO). (2002): AASHTO LRFD Highway Bridge Design Specifica-tions, second ed., Washington, DC.
American Association of State Highway and Transportation Officials(AASHTO). (2012): AASHTO LRFD Bridge Design Specifications, sixthed., with 2013 Interim Revisions, Washington, DC.
American Society for Testing and Materials (ASTM) D1143, 2007. StandardTest Methods for Deep Foundations under Static Axial Compressive Load.ASTM International.
Dirks, K.L., Kam, P., 1994. Foundation Soils Information Chart: PileFoundation. Iowa Department of Transportation, Highway Division-SoilsSurvey Section, Ames, IA.
Green, D., Ng, K.W., Dunker, K., Sritharan, S., Nop, M. (2012): Developmentof LRFD Design Procedures for Bridge Piles in Iowa–Design Guide andTrack Examples. Final Report Volume IV, Institute for Transportation,Iowa State Univeristy, Ames, IA..
Meyerhof, G., 1976. Bearing capacity and settlement of pile foundations. J.Geotech. Eng. Div., ASCE 102 (GT3), 195–228 Proc. Paper 11962.
Ng, K.W., Suleiman, M.T., Sritharan, S., Roling, M., AbdelSalam, S.S. (2011):Development of LRFD Design Procedures for Bridge Pile Foundations inIowa—Field Testing of Steel Piles in Clay, Sand and Mixed Soils and DataAnalysis. Vol. II. IHRB Project No. TR-583. Institute for Transportation,Iowa State University, Ames, IA.. .
Ng, K.W., Sritharan, S., Dunker, K.F., Danielle, D., 2012. Verification ofrecommended load and resistance factor design approach to pile design andconstruction in cohesive soils. J. Transp. Res. Rec. 2310,49–58 Transportation Research Board, Washington, D.C.
Ng, K.W., Sritharan, S., 2014. Integration of construction control and pilesetup into load and resistance factor design of piles. Soils Found. 54 (2),197–208.
Paikowsky, S.G., with contributions fromBirgisson, B., McVay, M., Nguyen,T., Kuo, C., Baecher, G., Ayyab, B., Stenersen, K., O’Malley, K.,Chernauskas, L., O’Neill, M, 2004. Load and Resistance Factor Design(LRFD) for Deep Foundations NCHRP Report 507. TransportationResearch Board, Washington, DC..
Park, J.H, Kim, D., Kwak, K., Chung, M. (2012): Site-specific adaptiveresistance factor calibrations of axially loaded driven piles. In: The Twenty-second International Offshore and Polar Engineering Conference. Interna-tional Society of Offshore and Polar Engineers. , pp. 718–723.
Pile Dynamics, Inc. (2000): CAPWAP for Windows manual. Cleveland, OH.Rahman, M.S., Gabr, M.A., Sarica, R.Z., Hossain, M.S., 2002. Load and
Resistance Factor Design (LRFD) for Analysis/Design of Piles AxialCapacity. North Carolina State University, Raleigh, NC.
Rausche, F., Goble, G.G., Likins, G.E., 1985. Dynamic determination of pilecapacity. J. Geotech. Eng., ASCE 3 (3), 367–383.
Roling, M., Sritharan, S., Suleiman, M.T. (2010): Development of LRFDDesign Procedures for Bridge Piles in Iowa—Electronic Database. FinalReport Vol. I. IHRB Project No. TR-573. Institute for Transportation, IowaState University, Ames, IA.
Tomlinson, M.J. (1971): Some effects of pile driving on skin friction. In:Proceeding Conference on Behavior of Piles, , Institute of Civil Engineers,London, pp. 107–114.
Withiam, J.L. (2003): Implementation of the AASHTO LRFD bridge designspecifications for substructure design. In: International Workshop on LimitState Design in Geotechnical Engineering Practice. , World ScientificPublishing Company, 18 p.