lrfd resistance factors forauger cast in-place (acip) piles · 3 tasks: auger cast in place (acip)...
TRANSCRIPT
Principal Investigator: Project Manager:
Michael McVay, Ph.D. Rodrigo Herrera, PE
Juan Castellanos, PE
Co-Principal Investigator:
Scott Wasman, Ph.D.
Primary Researchers:
Stephen Crawford
Lin Huang
LRFD Resistance Factors for Auger CastIn-Place (ACIP) Piles
FDOT BDV31-977-12

2
Background: Auger Cast in Place (ACIP) Piles
• Current FDOT use - Sound Walls
• Used in Commercial Sector for High Rises,Condos, etc.
• Other DOTs (e.g. Texas), FHWA (GEC No.8)Recommend for Bridge Foundations
Benefits:o Minimal Vibrations vs. Pile Driving for Urban Settingso Much Higher Capacities in Limestone (e.g. South Florida) vs. driven pileso Cost savings vs. driven piles or drilled shafts
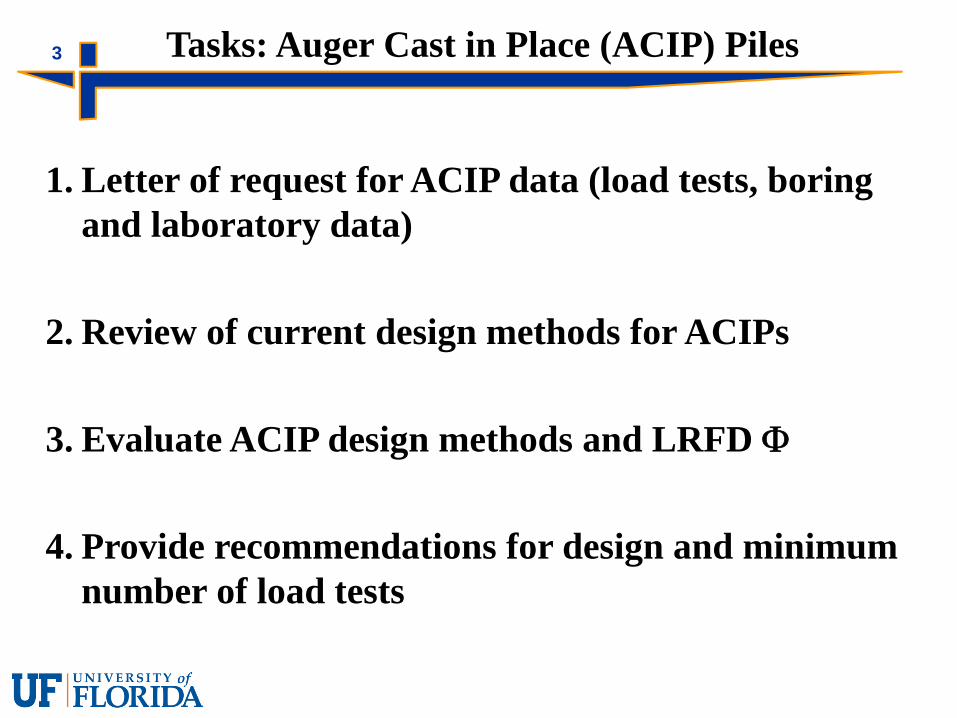
3 Tasks: Auger Cast in Place (ACIP) Piles
1. Letter of request for ACIP data (load tests, boringand laboratory data)
2. Review of current design methods for ACIPs
3. Evaluate ACIP design methods and LRFD F
4. Provide recommendations for design and minimumnumber of load tests

Location Project Name Soil TypeDiameter
(in)
Embedded
Length (ft)Test Type
Number
of Load
Test
Water Table
Depth (ft)Instrumentation
Peak
Displacement
Load Test (in)
Data Provider
Alachua-1 TP-2 Clay & IGM 16 64 Static 29 Load-Deflection 0.085
Alachua-1 TP-3 Clay & IGM 16 64 Static 31 Load-Deflection 0.125
Alachua-1 TP-4 Clay & IGM 16 64 Static 26 Load-Deflection 0.183
Alachua-1 TP-5 Clay & IGM 16 64 Static 28 Load-Deflection 0.219
Alachua-2 TP-1 Clay 14 42 Static 4.5 Load-Deflection 0.288
Alachua-2 TP-2 Clay 14 42 Static 5 Load-Deflection 0.325
Alachua-2 TP-3 Clay 14 42 Static 6.5 Load-Deflection 0.295
Alachua-2 TP-5 Clay 14 42 Static 5 T-Z & Load-Defl. 0.341
Alachua-2 TP-XX-1 No Boring 14 42 Static None Load-Deflection 0.777
Alachua-2 TP-XX-2 No Boring 14 42 Static None Load-Deflection 0.460
Alachua-3 TP-1 Clay, Sand & IGM 14 15 Static 12 Load-Deflection 0.549
Alachua-5 TP-1 Sand & Clay 14 65 Static 6 T-Z & Load-Defl. 0.600
Alachua-5 TP-2 Sand & Clay 14 65 Static 6 T-Z & Load-Defl. 1.000
Alachua-5 TP-3 Sand & Clay 14 65 Tension 6 T-Z & Load-Defl. 0.088
Broward-1 TP-1 Sand & IGM 18 102 Static 5.7 T-Z & Load-Defl. 0.344
Broward-1 TP-2 Sand & IGM 18 102 Tension 5.7 T-Z & Load-Defl. 0.009
Broward-1 TP-5 Sand & IGM 30 140 Osterberg 1 O-Cell 0.400
Broward-2 TP-1 Sand & IGM 14 40 Static None Load-Deflection 0.350Universal Sciences
Engineering, Inc.
Duval-1 TP 1-2 Sand, Marl & Clay 16 55 Static 4.5 Load-Deflection 0.289
Duval-1 TP 2-2 Sand, Marl & Clay 16 54 Static 4.5 Load-Deflection 0.397
Duval-1 TP 3-2 Sand, Marl & Clay 18 54 Tension 4.5 Load-Deflection 0.192
Duval-1 TP 3-3 Sand, Marl & Clay 16 54 Static 4.5 Load-Deflection 0.267
Hollywood-1 TP-1 No Boring 14 50 Static No Boring Load-Deflection 0.340
Hollywood-2 TP-1 No Boring 14 48 Static No Boring T-Z & Load-Defl. 0.200
Hollywood-2 TP-2 No Boring 14 48 Tension No Boring T-Z & Load-Defl. 0.032
Hillsborough-2 TP-1 No Boring 14 40 Static None Load-Deflection 0.079
Hillsborough-3 TP-1 Sand and Clay 16 60 Static 5.2 T-Z & Load-Defl. 0.548
Hillsborough-3 TP-2 Sand and Clay 16 60 Statnamic 5.2 T-Z & Load-Defl. 0.939
Hillsborough-3 TP-3 Sand and Clay 16 60 Statnamic 5 T-Z & Load-Defl. 1.176
Hillsborough-3 TP-4 Sand and Clay 16 60 Statnamic 5 T-Z & Load-Defl. 0.760
Hillsborough-3 TP-5 Sand and Clay 16 67.4 Statnamic 4 T-Z & Load-Defl. 0.653
Nassau-1 TP14 Sand 14 60 Static 3.8 T-Z & Load-Defl. 0.385
Nassau-2 TP-1 Sand 16 39 Static 3 Load-Deflection 0.300
Nassua-3 TP-1 Sand 14 65 Static 5 T-Z & Load-Defl. 0.200
Palm Beach-1 TP-9 No Boring 16 61 Static None T-Z & Load-Defl. 0.113
Palm Beach-2 TP-8 No Boring 16 61 Static None T-Z & Load-Defl. 0.188
Polk Polk-1 Clay, Silt & Sand 18 65 Static 1 8.5 Load-Deflection 0.360 Ardaman & Associates, Inc
Santa Rosa Santa Rosa-1 TP-1 Sand, Cayey Sand 24 47 Static 1 2.5 T-Z & Load-Defl. 0.465
West Palm-1 T2B Sand 14 40 Tension 9 Load-Deflection 0.250
West Palm-1 T8 Sand 14 40 Tension 9 Load-Deflection 0.250
West Palm-1 T9B Sand 14 40 Static 9 Load-Deflection 0.536
Alachua
14
Broward
4
Duval
4
Hollywood
3
Hillsborough
6
Universal Sciences
Engineering, Inc.
Langan Engineering &
Environmental Services
DunkelBerger Engineering &
Testing
Applied Foundation Test, Inc.
Nodarse, A Terracon Company
Amec Foster Wheeler
Enviroment & Infrastructure
DunkelBerger Engineering &
Testing
Universal Sciences
Engineering, Inc.
Nassau
3
Palm Beach2
West Palm
3

5Location Project Name Soil Type
Diameter
(in)
Embedded
Length (ft)Test Type
Number
of Load
Test
Water Table
Depth (ft)Instrumentation
Peak
Displacement
Load Test (in)
Data Provider
Miami Dade-1 TP-1 Sand & Limestone 16 43 Static 5 Load-Deflection 0.343
Miami Dade-1 TP-2 Sand & Limestone 16 43 Tension 5 Load-Deflection 0.208
Miami Dade-5 TP-1 Sand & Limestone 14 30 Static (+) 2.5 Load-Deflection 0.148
Miami Dade-5 TP-2 Sand & Limestone 14 30 Tension (+) 2.5 Load-Deflection 0.270
Miami Dade-6 TP-1 Sand & Limestone 14 25 Static Not measured Load-Deflection 0.183
Miami Dade-6 TP-2 Sand & Limestone 14 40 Static 8 Load-Deflection 0.182
Miami Dade-6 TP-3 Sand & Limestone 14 40 Static 8 Load-Deflection 0.303
Miami Dade-6 TP-5 Sand & Limestone 14 40 Static 8 Load-Deflection 0.090
Miami Dade-6 TP-6 Sand & Limestone 14 40 Static 4 Load-Deflection 0.206
Miami Dade-6 TP-7 Sand & Limestone 14 40 Static Not measured Load-Deflection 0.060
Miami Dade-6 TP-8 Sand & Limestone 14 40 Static Not measured Load-Deflection 0.093
Miami Dade-6 TP-9 Sand & Limestone 14 40 Static Not measured Load-Deflection 0.142
Miami Dade-6 TP-10 Sand & Limestone 14 40 Static Not measured Load-Deflection 0.572
Miami Dade-6 TP-11 Sand & Limestone 14 23 Static 5.5 Load-Deflection 0.073
Miami Dade-6 TP-12 Sand & Limestone 14 23 Static 5.5 Load-Deflection 0.346
Miami Dade-6 TP-13 Sand & Limestone 14 50 Static Not measured Load-Deflection 0.072
Miami Dade-6 TP-14 Sand & Limestone 14 58 Static 8 Load-Deflection 0.182
Miami Dade-6 TP-15 Sand & Limestone 14 45 Static 7.5 Load-Deflection 0.119
Miami Dade-6 TP-16 Sand & Limestone 14 25 Static 5.5 Load-Deflection 0.115
Miami Dade-6 TP-17 Sand & Limestone 14 25 Static 5.5 Load-Deflection 0.135
Miami Dade-6 TP-18 Sand & Limestone 14 20 Static 4 Load-Deflection 0.115
Miami Dade-6 TP-19 Sand & Limestone 14 55 Static 8 Load-Deflection 0.192
Miami Dade-6 TP-20 Sand & Limestone 14 30 Static 9 Load-Deflection 0.091
Miami Dade-6 TP-21 Sand & Limestone 14 46 Static 12 Load-Deflection 0.110
Miami Dade-6 TP-22 Sand & Limestone 14 41 Static 12 Load-Deflection 0.058
Miami Dade-6 TP-23 Sand & Limestone 14 58.5 Static 10.5 Load-Deflection 0.560
Miami Dade-6 TP-24 Sand & Limestone 14 47 Static 4 Load-Deflection 0.182
Miami Dade-6 TP-25 Sand & Limestone 14 56 Static 10 Load-Deflection 0.095
Miami Dade-6 TP-26 Sand & Limestone 14 57 Static 10 Load-Deflection 0.296
Miami Dade-6 TP-27 Sand & Limestone 14 47 Static 11 Load-Deflection 0.053
Miami Dade-6 TP-28 Sand & Limestone 14 65 Static 8 Load-Deflection 0.408
Miami Dade-6 TP-29 Sand 14 56 Static 9 Load-Deflection 0.107
Miami Dade-6 TP-30 Sand & Limestone 14 56 Static 9 Load-Deflection 0.107
Miami Dade-6 TP-31 No Boring 14 44 Static None Load-Deflection 0.432
Miami Dade-7 TP-1 Sand & Limestone 18 41 Static 4 Load-Deflection 0.064
Miami Dade-7 TP-2 Sand & Limestone 18 41 Static 4 Load-Deflection 0.069Miami Dade-8 TP-1 Sand, Silt & Limestone 14 52 Static 1 Load-Deflection 0.300
Total # of Test Piles 78 Total T-Z Curve 16
Miami Dade 37
Amec Foster Wheeler
Environment &
Infrastructure

6
What’s known:Ptop; Ztop
What’s unknown:fs; layers, ftip
Assumption:
Ptop
Ztop
Pbot
Zbot
1
Sand:
Clay:Minimize � = ∑ �� − �
�
�
Subject to � ∈ [��,��]
Pile-Soil Transfer
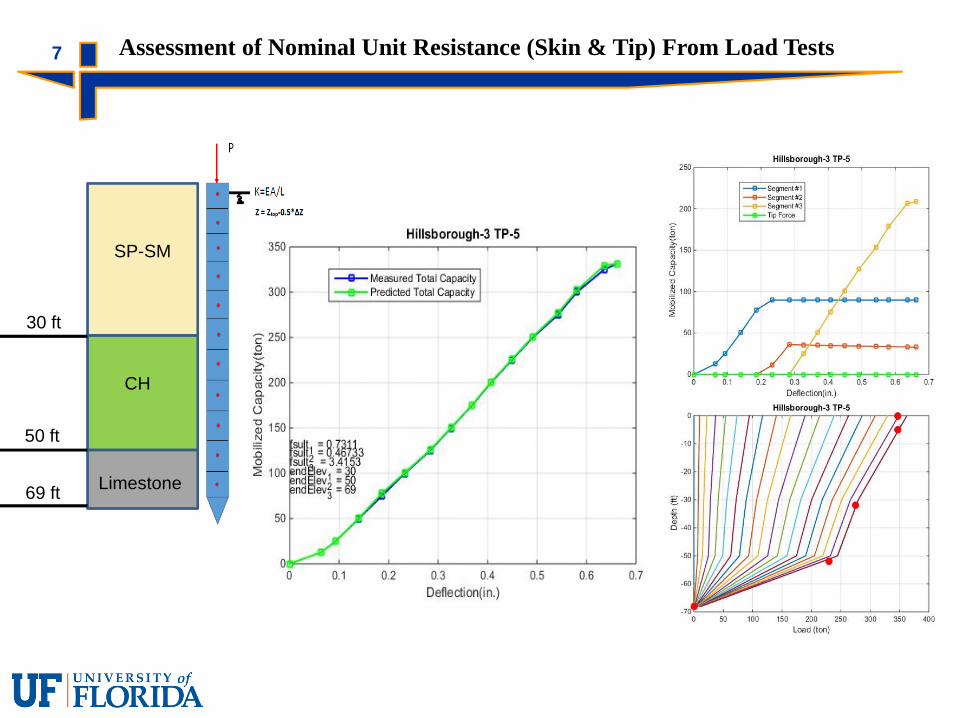
7 Assessment of Nominal Unit Resistance (Skin & Tip) From Load Tests
CH
SP-SM
Limestone69 ft
50 ft
30 ft
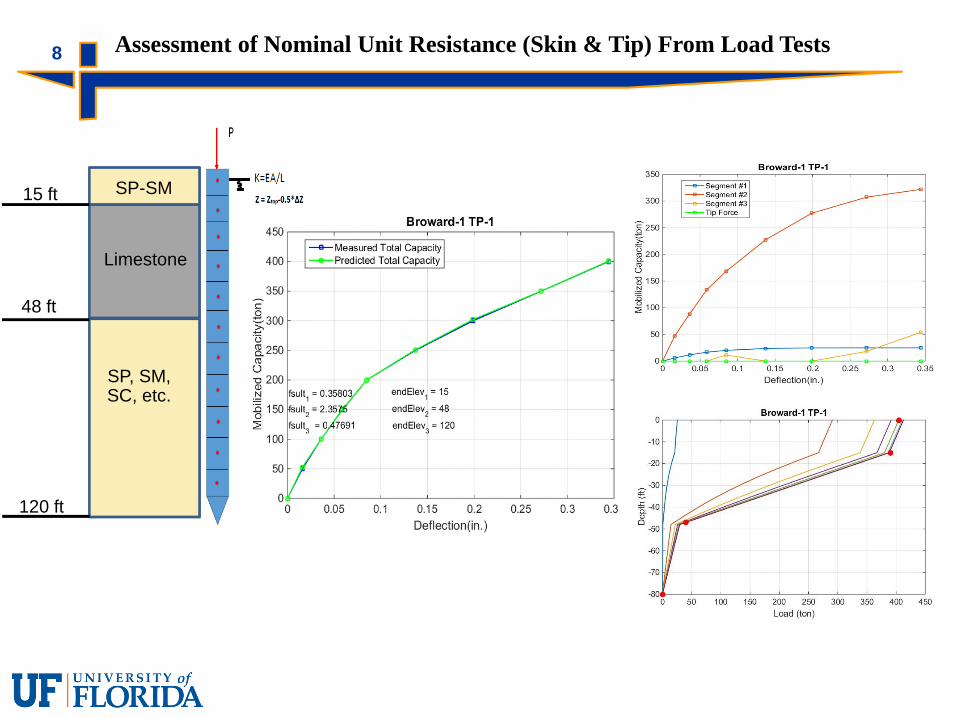
8 Assessment of Nominal Unit Resistance (Skin & Tip) From Load Tests
15 ft SP-SM
Limestone
48 ft
120 ft
SP, SM,SC, etc.
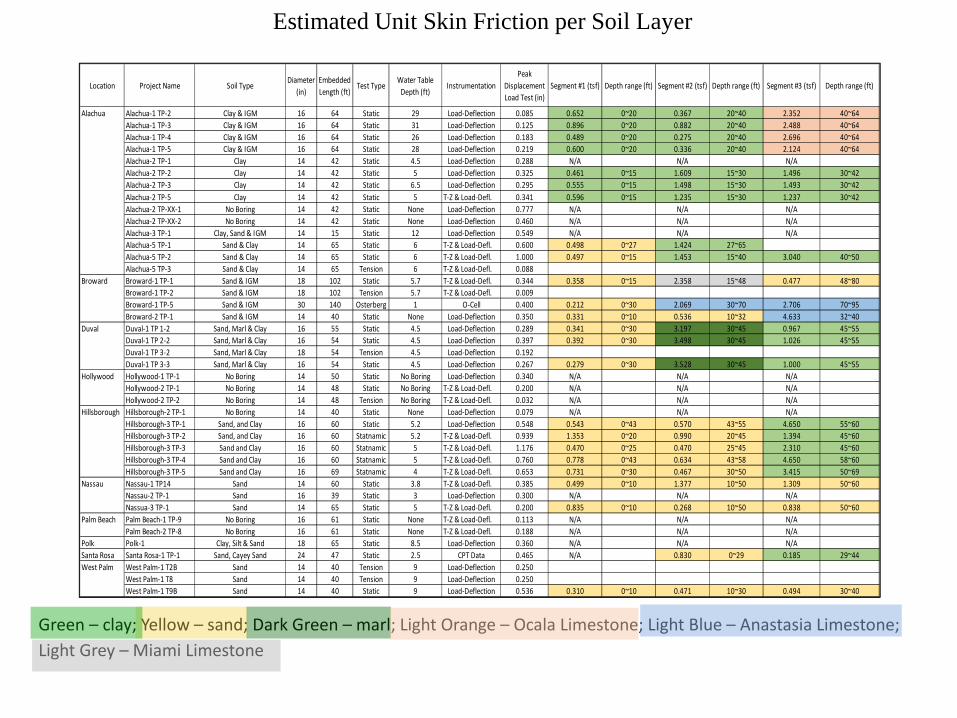
Estimated Unit Skin Friction per Soil Layer
Location Project Name Soil TypeDiameter
(in)
Embedded
Length (ft)Test Type
Water Table
Depth (ft)Instrumentation
Peak
Displacement
Load Test (in)
Segment #1 (tsf) Depth range (ft) Segment #2 (tsf) Depth range (ft) Segment #3 (tsf) Depth range (ft)
Alachua-1 TP-2 Clay & IGM 16 64 Static 29 Load-Deflection 0.085 0.652 0~20 0.367 20~40 2.352 40~64
Alachua-1 TP-3 Clay & IGM 16 64 Static 31 Load-Deflection 0.125 0.896 0~20 0.882 20~40 2.488 40~64
Alachua-1 TP-4 Clay & IGM 16 64 Static 26 Load-Deflection 0.183 0.489 0~20 0.275 20~40 2.696 40~64
Alachua-1 TP-5 Clay & IGM 16 64 Static 28 Load-Deflection 0.219 0.600 0~20 0.336 20~40 2.124 40~64
Alachua-2 TP-1 Clay 14 42 Static 4.5 Load-Deflection 0.288 N/A N/A N/A
Alachua-2 TP-2 Clay 14 42 Static 5 Load-Deflection 0.325 0.461 0~15 1.609 15~30 1.496 30~42
Alachua-2 TP-3 Clay 14 42 Static 6.5 Load-Deflection 0.295 0.555 0~15 1.498 15~30 1.493 30~42
Alachua-2 TP-5 Clay 14 42 Static 5 T-Z & Load-Defl. 0.341 0.596 0~15 1.235 15~30 1.237 30~42
Alachua-2 TP-XX-1 No Boring 14 42 Static None Load-Deflection 0.777 N/A N/A N/A
Alachua-2 TP-XX-2 No Boring 14 42 Static None Load-Deflection 0.460 N/A N/A N/A
Alachua-3 TP-1 Clay, Sand & IGM 14 15 Static 12 Load-Deflection 0.549 N/A N/A N/A
Alachua-5 TP-1 Sand & Clay 14 65 Static 6 T-Z & Load-Defl. 0.600 0.498 0~27 1.424 27~65
Alachua-5 TP-2 Sand & Clay 14 65 Static 6 T-Z & Load-Defl. 1.000 0.497 0~15 1.453 15~40 3.040 40~50
Alachua-5 TP-3 Sand & Clay 14 65 Tension 6 T-Z & Load-Defl. 0.088
Broward-1 TP-1 Sand & IGM 18 102 Static 5.7 T-Z & Load-Defl. 0.344 0.358 0~15 2.358 15~48 0.477 48~80
Broward-1 TP-2 Sand & IGM 18 102 Tension 5.7 T-Z & Load-Defl. 0.009
Broward-1 TP-5 Sand & IGM 30 140 Osterberg 1 O-Cell 0.400 0.212 0~30 2.069 30~70 2.706 70~95
Broward-2 TP-1 Sand & IGM 14 40 Static None Load-Deflection 0.350 0.331 0~10 0.536 10~32 4.633 32~40
Duval-1 TP 1-2 Sand, Marl & Clay 16 55 Static 4.5 Load-Deflection 0.289 0.341 0~30 3.197 30~45 0.967 45~55
Duval-1 TP 2-2 Sand, Marl & Clay 16 54 Static 4.5 Load-Deflection 0.397 0.392 0~30 3.498 30~45 1.026 45~55
Duval-1 TP 3-2 Sand, Marl & Clay 18 54 Tension 4.5 Load-Deflection 0.192
Duval-1 TP 3-3 Sand, Marl & Clay 16 54 Static 4.5 Load-Deflection 0.267 0.279 0~30 3.528 30~45 1.000 45~55
Hollywood-1 TP-1 No Boring 14 50 Static No Boring Load-Deflection 0.340 N/A N/A N/A
Hollywood-2 TP-1 No Boring 14 48 Static No Boring T-Z & Load-Defl. 0.200 N/A N/A N/A
Hollywood-2 TP-2 No Boring 14 48 Tension No Boring T-Z & Load-Defl. 0.032 N/A N/A N/A
Hillsborough-2 TP-1 No Boring 14 40 Static None Load-Deflection 0.079 N/A N/A N/A
Hillsborough-3 TP-1 Sand, and Clay 16 60 Static 5.2 Load-Deflection 0.548 0.543 0~43 0.570 43~55 4.650 55~60
Hillsborough-3 TP-2 Sand, and Clay 16 60 Statnamic 5.2 T-Z & Load-Defl. 0.939 1.353 0~20 0.990 20~45 1.394 45~60
Hillsborough-3 TP-3 Sand and Clay 16 60 Statnamic 5 T-Z & Load-Defl. 1.176 0.470 0~25 0.470 25~45 2.310 45~60
Hillsborough-3 TP-4 Sand and Clay 16 60 Statnamic 5 T-Z & Load-Defl. 0.760 0.778 0~43 0.634 43~58 4.650 58~60
Hillsborough-3 TP-5 Sand and Clay 16 69 Statnamic 4 T-Z & Load-Defl. 0.653 0.731 0~30 0.467 30~50 3.415 50~69
Nassau-1 TP14 Sand 14 60 Static 3.8 T-Z & Load-Defl. 0.385 0.499 0~10 1.377 10~50 1.309 50~60
Nassau-2 TP-1 Sand 16 39 Static 3 Load-Deflection 0.300 N/A N/A N/A
Nassua-3 TP-1 Sand 14 65 Static 5 T-Z & Load-Defl. 0.200 0.835 0~10 0.268 10~50 0.838 50~60
Palm Beach-1 TP-9 No Boring 16 61 Static None T-Z & Load-Defl. 0.113 N/A N/A N/A
Palm Beach-2 TP-8 No Boring 16 61 Static None T-Z & Load-Defl. 0.188 N/A N/A N/A
Polk Polk-1 Clay, Silt & Sand 18 65 Static 8.5 Load-Deflection 0.360 N/A N/A N/A
Santa Rosa Santa Rosa-1 TP-1 Sand, Cayey Sand 24 47 Static 2.5 CPT Data 0.465 N/A 0.830 0~29 0.185 29~44
West Palm-1 T2B Sand 14 40 Tension 9 Load-Deflection 0.250
West Palm-1 T8 Sand 14 40 Tension 9 Load-Deflection 0.250
West Palm-1 T9B Sand 14 40 Static 9 Load-Deflection 0.536 0.310 0~10 0.471 10~30 0.494 30~40
Alachua
Broward
Duval
Hollywood
Hillsborough
Nassau
Palm Beach
West Palm
Green – clay; Yellow – sand; Dark Green – marl; Light Orange – Ocala Limestone; Light Blue – Anastasia Limestone;
Light Grey – Miami Limestone

Estimated Unit Skin Friction per Layer
Yellow – sand; light grey – Miami Limestone or North Florida IGM; dark grey – Fort Thompson Limestone
Location Project Name Soil TypeDiameter
(in)
Embedded
Length (ft)Test Type
Water Table
Depth (ft)Instrumentation
Peak
Displacement
Load Test (in)
Segment #1 Depth range (ft) Segment #2 Depth range (ft) Segment #3 Depth range (ft)
Miami Dade-1 TP-1 IGM, Sand & FT Limestone 16 43 Static 5 Load-Deflection 0.343 2.100 0~18 0.441 18~35 3.910 35~43
Miami Dade-1 TP-2 Sand & IGM 16 43 Tension 5 Load-Deflection 0.208
Miami Dade-5 TP-1 Sand & IGM 14 30 Static (+) 2.5 Load-Deflection 0.148 N/A N/A N/A
Miami Dade-5 TP-2 Sand & IGM 14 30 Tension (+) 2.5 Load-Deflection 0.270
Miami Dade-6 TP-1 IGM & Sand 14 25 Static Not measured Load-Deflection 0.183 6.425 5~14 1.500 14~25 N/A
Miami Dade-6 TP-2 IGM & Sand 14 40 Static 8 Load-Deflection 0.182 3.153 0~20 0.994 20~40 N/A
Miami Dade-6 TP-3 IGM & Sand 14 40 Static 8 Load-Deflection 0.303 N/A
Miami Dade-6 TP-5 IGM & Sand 14 40 Static 8 Load-Deflection 0.090 5.380 2~16 0.588 16~40 N/A
Miami Dade-6 TP-6 IGM, Sand & FT Limestone 14 40 Static 4 Load-Deflection 0.206 1.737 2~24 0.100 24~35 4.024 35~40
Miami Dade-6 TP-7 IGM & Sand 14 40 Static Not measured Load-Deflection 0.060 N/A N/A N/A
Miami Dade-6 TP-8 IGM & Sand 14 40 Static Not measured Load-Deflection 0.093 N/A N/A N/A
Miami Dade-6 TP-9 IGM & Sand 14 40 Static Not measured Load-Deflection 0.142 3.005 1~24 0.478 24~40 N/A
Miami Dade-6 TP-10 IGM & Sand 14 40 Static Not measured Load-Deflection 0.572 3.431 5~22 0.404 22~40 N/A
Miami Dade-6 TP-11 IGM & Sand 14 23 Static 5.5 Load-Deflection 0.073 3.759 1~8 0.907 8~23 N/A
Miami Dade-6 TP-12 IGM & Sand 14 23 Static 5.5 Load-Deflection 0.346 N/A N/A N/A
Miami Dade-6 TP-13 IGM, Sand & FT Limestone 14 50 Static Not measured Load-Deflection 0.072 1.899 1~25 0.504 25~40 4.318 40~50
Miami Dade-6 TP-14 IGM & Sand 14 58 Static 8 Load-Deflection 0.182 3.009 5~16 0.392 16~58 N/A
Miami Dade-6 TP-15 IGM & Sand 14 45 Static 7.5 Load-Deflection 0.119 3.199 3~11 0.616 11~45 N/A
Miami Dade-6 TP-16 IGM & Sand 14 25 Static 5.5 Load-Deflection 0.115 3.658 5~14 0.853 14~25 N/A
Miami Dade-6 TP-17 IGM & Sand 14 25 Static 5.5 Load-Deflection 0.135 3.315 4~21 0.159 21~25 N/A
Miami Dade-6 TP-18 Sand & IGM 14 20 Static 4 Load-Deflection 0.115 1.474 1~8 5.782 8~19 N/A
Miami Dade-6 TP-19 IGM, Sand & FT Limestone 14 55 Static 8 Load-Deflection 0.192 3.420 1~9 0.777 9~40 6.176 40~50
Miami Dade-6 TP-20 IGM & Sand 14 30 Static 9 Load-Deflection 0.091 3.860 1~26 0.583 26~30 N/A
Miami Dade-6 TP-21 IGM & Sand 14 46 Static 12 Load-Deflection 0.110 3.008 4~17 0.612 17~46 N/A
Miami Dade-6 TP-22 IGM & Sand 14 41 Static 12 Load-Deflection 0.058 N/A N/A N/A
Miami Dade-6 TP-23 Sand 14 58.5 Static 10.5 Load-Deflection 0.560 0.275 0~58.5 N/A N/A
Miami Dade-6 TP-24 IGM & Sand 14 47 Static 4 Load-Deflection 0.182 3.044 1~20 0.651 20~47 N/A
Miami Dade-6 TP-25 IGM & Sand 14 56 Static 10 Load-Deflection 0.095 N/A N/A N/A
Miami Dade-6 TP-26 IGM, Sand & FT Limestone 14 57 Static 10 Load-Deflection 0.296 2.755 20~32 4.634 32~57
Miami Dade-6 TP-27 IGM, Sand & FT Limestone 14 47 Static 11 Load-Deflection 0.053 2.072 1~10 0.152 10~22 4.423 22~47
Miami Dade-6 TP-28 IGM, Sand & FT Limestone 14 65 Static 8 Load-Deflection 0.408 1.564 1~9 7.230 60~65
Miami Dade-6 TP-29 IGM, Sand & FT Limestone 14 56 Static 9 Load-Deflection 0.107 2.930 0~18 0.916 24~46 4.872 46~56
Miami Dade-6 TP-30 IGM, Sand & FT Limestone 14 56 Static 9 Load-Deflection 0.107 3.490 1~15 0.659 15~45 4.248 45~56
Miami Dade-6 TP-31 IGM, Sand & FT Limestone 14 44 Static Not measured Load-Deflection 0.432 2.026 1~12 0.137 12~30 4.332 30~40
Miami Dade-7 TP-1 Sand & IGM 18 41 Static 4 Load-Deflection 0.064 N/A N/A N/A
Miami Dade-7 TP-2 Sand & IGM 18 41 Static 4 Load-Deflection 0.069 N/A N/A N/A
Miami Dade-8 TP-1 Sand & IGM 14 52 Static 1 Load-Deflection 0.300 N/A N/A N/A
16
Miami Dade
78 Total T-Z CurveTotal # of Test Piles
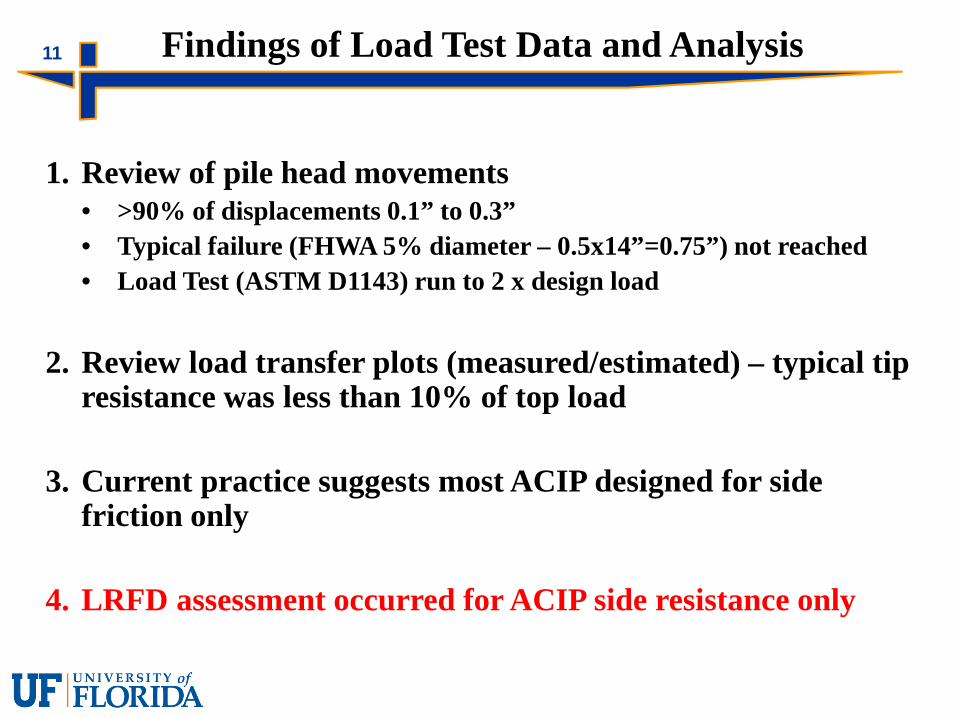
11 Findings of Load Test Data and Analysis
1. Review of pile head movements• >90% of displacements 0.1” to 0.3”
• Typical failure (FHWA 5% diameter – 0.5x14”=0.75”) not reached
• Load Test (ASTM D1143) run to 2 x design load
2. Review load transfer plots (measured/estimated) – typical tipresistance was less than 10% of top load
3. Current practice suggests most ACIP designed for sidefriction only
4. LRFD assessment occurred for ACIP side resistance only
12
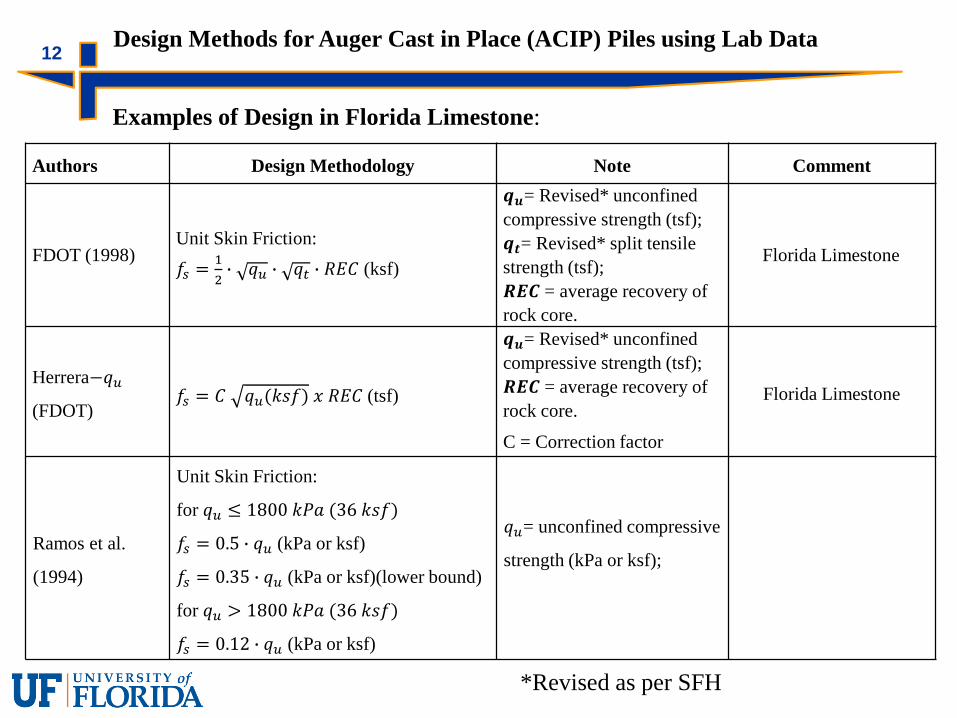
Authors Design Methodology Note Comment
FDOT (1998)Unit Skin Friction:
�� =�
�� �� � �� � ��� (ksf)
��= Revised* unconfined
compressive strength (tsf);
��= Revised* split tensile
strength (tsf);
��� = average recovery of
rock core.
Florida Limestone
Herrera−��
(FDOT)�� = � ��(���)���� (tsf)
��= Revised* unconfined
compressive strength (tsf);
��� = average recovery of
rock core.
C = Correction factor
Florida Limestone
Ramos et al.
(1994)
Unit Skin Friction:
for �� ≤ 1800���(36���)
�� = 0.5 � �� (kPa or ksf)
�� = 0.35 � �� (kPa or ksf)(lower bound)
for �� > 1800���(36���)
�� = 0.12 � �� (kPa or ksf)
��= unconfined compressive
strength (kPa or ksf);
Design Methods for Auger Cast in Place (ACIP) Piles using Lab Data
Examples of Design in Florida Limestone:
*Revised as per SFH

13Design Methods for Auger Cast in Place (ACIP) Piles using Lab Data
Examples of Design in Florida Limestone:
Authors Design Methodology Note Comment
Horvath and
Kenney (1979)
Unit Skin Friction:
�� = 0.67 � �� (tsf)
��= unconfined compressive
strength (tsf).
Williams et al.
(1980)
Unit Skin Friction:
�� = 1.842 � ���.��� (tsf)
��= unconfined compressive
strength (tsf).
Reynolds and
Kaderabek
(1980)
Unit Skin Friction:
�� = 0.3 � �� (tsf)
��= unconfined compressive
strength (tsf).Miami Limestone
Gupton and
Logan (1984)
Unit Skin Friction:
�� = 0.2 � �� (tsf)
��= unconfined compressive
strength (tsf).
Key Largo,
Anastasia, Fort
Thompson and
Miami limestone
formations

14Design Methods for Auger Cast in Place (ACIP) Piles using SPT in Limestone
Examples of Design in Florida Limestone:
Authors Design Methodology Note Comment
Frizzi & Meyer
(2000)
Unit Skin Friction:
�� = 0.35 � ��� − 1.5 (tsf) (1)
�� = 0.14 � ��� + 1 (tsf) (2)
N60 = SPT-N value at 60% of hammer
efficiency (blows/ foot).
(1) Miami limestone
formation;
(2) Ft. Thompson
limestone formation.
Crapps (IGM)
Unit Skin Friction:
�� = ��, � ��.���� ����.� (ksf)
��, = vertical effective stress (ksf)
�= blow count (blows/ft).
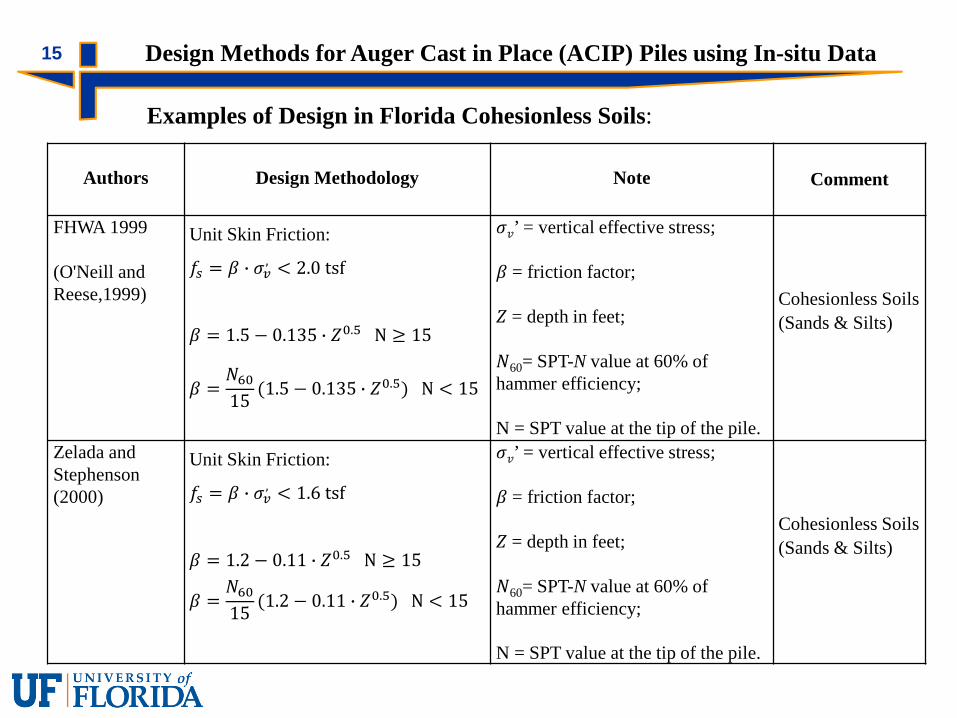
15 Design Methods for Auger Cast in Place (ACIP) Piles using In-situ Data
Examples of Design in Florida Cohesionless Soils:
Authors Design Methodology Note Comment
FHWA 1999
(O'Neill andReese,1999)
Unit Skin Friction:
�� = � � ��, < 2.0 tsf
� = 1.5 − 0.135 � ��.� N ≥ 15
� =���15
(1.5 − 0.135 � ��.�) N < 15
��’ = vertical effective stress;
� = friction factor;
� = depth in feet;
�60= SPT-N value at 60% ofhammer efficiency;
N = SPT value at the tip of the pile.
Cohesionless Soils
(Sands & Silts)
Zelada andStephenson(2000)
Unit Skin Friction:
�� = � � ��, < 1.6 tsf
� = 1.2 − 0.11 � ��.� N ≥ 15
� =���15
(1.2 − 0.11 � ��.�) N < 15
��’ = vertical effective stress;
� = friction factor;
� = depth in feet;
�60= SPT-N value at 60% ofhammer efficiency;
N = SPT value at the tip of the pile.
Cohesionless Soils
(Sands & Silts)

16 Design Methods for Auger Cast in Place (ACIP) Piles using In-situ Data
Examples of Design in Florida Cohesionless Soils:
Authors Design Methodology Note Comment
GEC 10
(Brown, 2010)
Unit Skin Friction:
�� = � � ��,
� = �����d
Ko = (1 – sin φ') OCRsin φ' < Kp
OCR =���
���
Kp = tan2 45° +φ′�
�′���
» 0.47 ����
��’ = vertical effective stress;�p’ = vertical effective stresspreconsolidation stress;� = friction factor;δ = effective stress angle of friction for the soil-shaft interface;φ' = effective internal angle of friction;Ko = At rest coefficient ofhorizontal soil stress;Kp = coefficient of passive earthpressure;OCR = overconsolidation ratio;N60 = SPT-N value at 60% ofhammer efficiency (blows/ foot);Pa = atmospheric pressure;m = 0.6 for clean quarzitic sand andm = 0.8 for silty sands to sandy silts
Cohesionless Soils
(Sands & Silts)
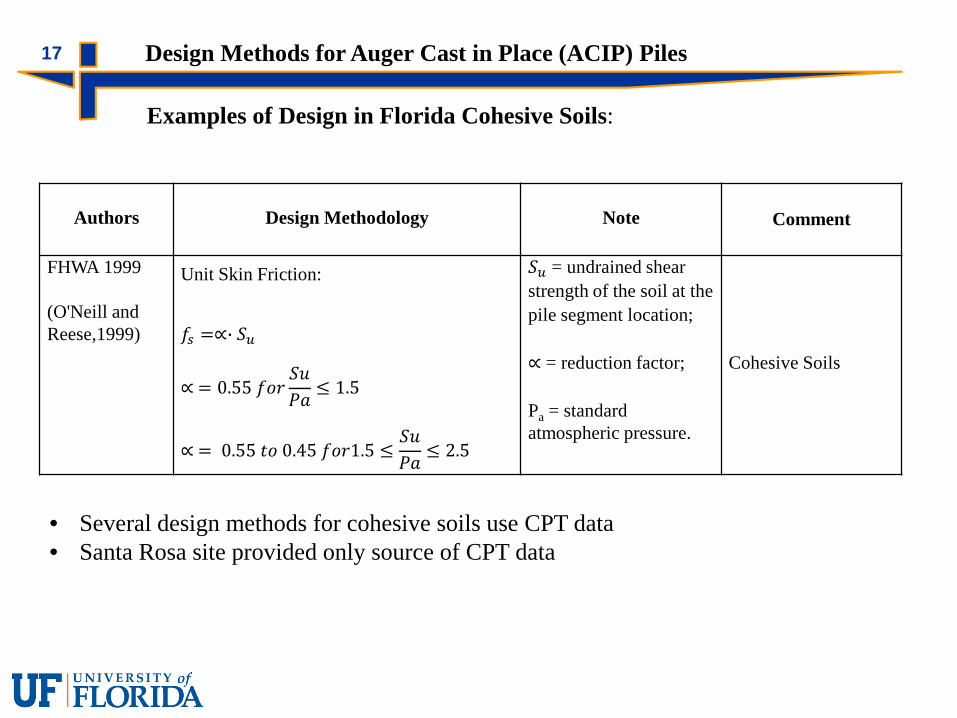
17 Design Methods for Auger Cast in Place (ACIP) Piles
Examples of Design in Florida Cohesive Soils:
Authors Design Methodology Note Comment
FHWA 1999
(O'Neill andReese,1999)
Unit Skin Friction:
�� =∝� ��
∝ = 0.55�����
��≤ 1.5
∝ = 0.55��0.45���1.5 ≤��
��≤ 2.5
�� = undrained shear
strength of the soil at the
pile segment location;
∝ = reduction factor;
Pa = standardatmospheric pressure.
Cohesive Soils
• Several design methods for cohesive soils use CPT data• Santa Rosa site provided only source of CPT data

18 Review of Site Boring and Laboratory Data
1. Typical site data consisted of SPT, UnifiedClassification (USCS) and rock strength data
2. Most boring data > 50 ft from load test
3. Insufficient laboratory strength data in one boringto predict a shaft – used site mean data
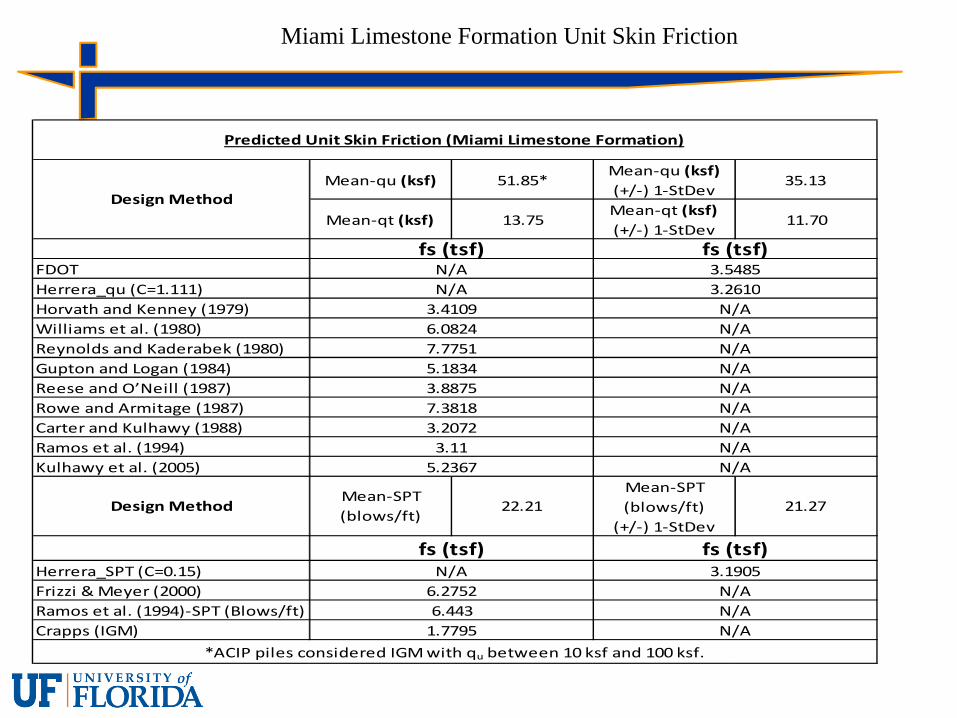
Miami Limestone Formation Unit Skin Friction
Mean-qu (ksf) 51.85*Mean-qu (ksf)
(+/-) 1-StDev35.13
Mean-qt (ksf) 13.75Mean-qt (ksf)
(+/-) 1-StDev11.70
FDOT
Herrera_qu (C=1.111)
Horvath and Kenney (1979)
Williams et al. (1980)
Reynolds and Kaderabek (1980)
Gupton and Logan (1984)
Reese and O’Neill (1987)
Rowe and Armitage (1987)
Carter and Kulhawy (1988)
Ramos et al. (1994)
Kulhawy et al. (2005)
Herrera_SPT (C=0.15)
Frizzi & Meyer (2000)
Ramos et al. (1994)-SPT (Blows/ft)
Crapps (IGM)
N/A
N/A
N/A
N/A
N/A
N/A
N/A
N/A
N/A
N/A
N/A
Mean-SPT
(blows/ft)
(+/-) 1-StDev
21.27
3.8875
7.3818
3.4109
*ACIP piles considered IGM with qu between 10 ksf and 100 ksf.
6.2752
6.443
1.7795
N/A
N/A
6.0824
7.7751
5.1834
3.1905
Design MethodMean-SPT
(blows/ft)22.21
Predicted Unit Skin Friction (Miami Limestone Formation)
Design Method
fs (tsf)
fs (tsf) fs (tsf)
3.2072
3.11
5.2367
N/A
fs (tsf)3.5485
N/A
3.2610

20Fort Thompson Formation Unit Skin Friction
Mean-qu (ksf) 129.91*Mean-qu (ksf)
(+/-) 1-StDev114.77*
Mean-qt (ksf) 32.01Mean-qt (ksf)
(+/-) 1-StDev31.65
FDOT
Herrera_qu (C=1.643)
Horvath and Kenney (1979)
Williams et al. (1980)
Reynolds and Kaderabek (1980)
Gupton and Logan (1984)
Reese and O’Neill (1987)
Rowe and Armitage (1987)
Carter and Kulhawy (1988)
Ramos et al. (1994)
Kulhawy et al. (2005)
Herrera_SPT (C=0.15)
Frizzi & Meyer (2000)
Ramos et al. (1994)-SPT (Blows/ft)
Crapps (IGM)
8.2903
N/A
N/A
N/A
N/A
Predicted Unit Skin Friction (Fort Thomspon Limestone Formation)
Design Method
fs (tsf)N/A
fs (tsf)6.0275
Design MethodMean-SPT
(blows/ft)51.95
Mean-SPT
(blows/ft)
(+/-) 1-StDev
35.54
*Note outside IGM design values (qu between 10 ksf and 100 ksf).
8.2729
12.3898
19.8296
N/A
N/A
N/A
4.9795
5.3310
9.7430
11.6861
7.7944
5.0774
fs (tsf) fs (tsf)
N/A
N/A
N/A
8.5215
19.4861
12.9907
N/A5.3998
N/A
N/A
N/A

21
Bias = l =��������
���������

22 Summary Statistics:
Statistic FDOT Herrera Horvath Williams Reynolds Gupton Reese Rowe Carter Ramos Kulhawy
Mean 1.05 0.851 0.988 0.554 0.564 0.846 1.13 0.456 1.05 1.08 0.648
StDev 0.453 0.282 0.449 0.207 0.267 0.401 0.534 0.208 0.478 0.410 0.295
CV 0.434 0.331 0.454 0.373 0.474 0.474 0.474 0.455 0.455 0.379 0.455
Bias & CV for prediction methods using rock strengths for Miami Limestone
Statistic FDOT Herrera Horvath Williams Reynolds Gupton Reese Rowe Carter Ramos Kulhawy
Mean 0.841 1.01 0.937 0.594 0.557 0.836 1.11 0.433 0.997 0.649 0.615
StDev 0.27 0.35 0.378 0.16 0.278 0.417 0.556 0.15 0.346 0.37 0.213
CV 0.321 0.351 0.403 0.271 0.50 0.50 0.50 0.346 0.347 0.571 0.347
Bias & CV for prediction methods using rock strengths for Fort Thompson Limestone
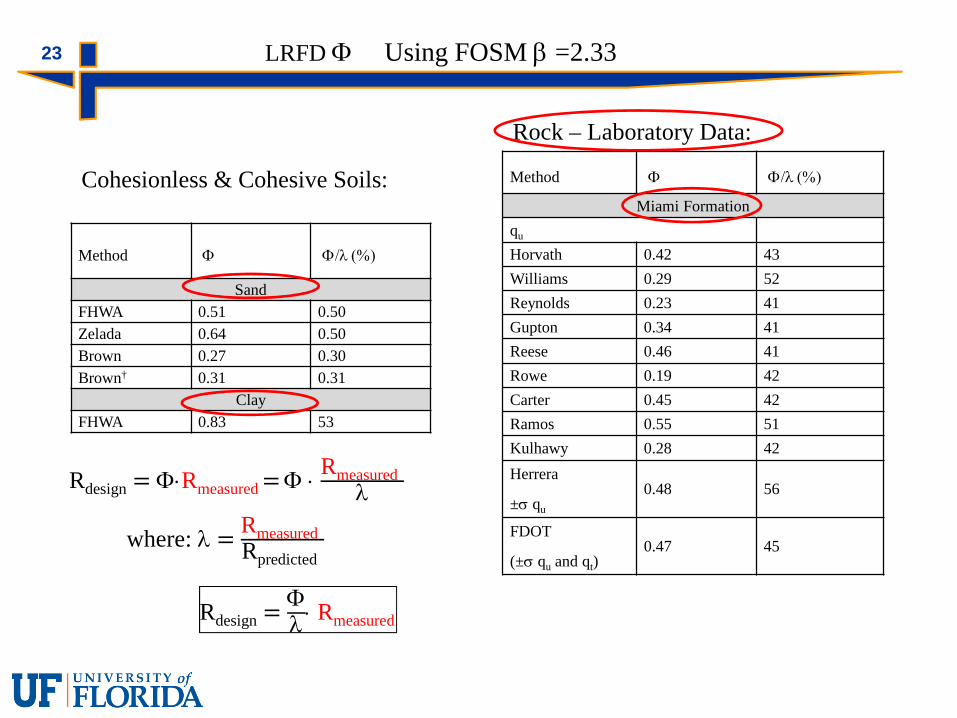
23 LRFD F Using FOSM β =2.33
Method F F/l (%)
Sand
FHWA 0.51 0.50
Zelada 0.64 0.50
Brown 0.27 0.30
Brown† 0.31 0.31
Clay
FHWA 0.83 53
Method F F/l (%)
Miami Formation
qu
Horvath 0.42 43
Williams 0.29 52
Reynolds 0.23 41
Gupton 0.34 41
Reese 0.46 41
Rowe 0.19 42
Carter 0.45 42
Ramos 0.55 51
Kulhawy 0.28 42
Herrera
±s qu
0.48 56
FDOT
(±s qu and qt)0.47 45
Cohesionless & Cohesive Soils:
Rock – Laboratory Data:
where: lRmeasured
Rpredicted
Rdesign F⋅Rmeasured F ⋅Rmeasured
l
RdesignFl⋅ Rmeasured
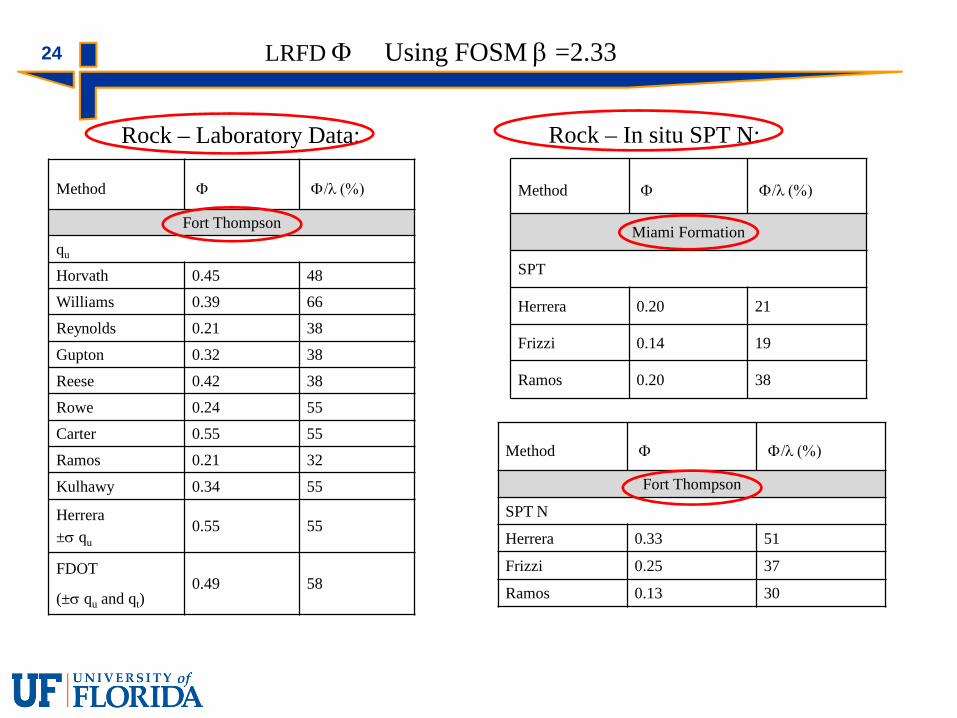
24 LRFD F Using FOSM β =2.33
Method F F/l (%)
Fort Thompson
qu
Horvath 0.45 48
Williams 0.39 66
Reynolds 0.21 38
Gupton 0.32 38
Reese 0.42 38
Rowe 0.24 55
Carter 0.55 55
Ramos 0.21 32
Kulhawy 0.34 55
Herrera
±s qu
0.55 55
FDOT
(±s qu and qt)0.49 58
Method F F/l (%)
Miami Formation
SPT
Herrera 0.20 21
Frizzi 0.14 19
Ramos 0.20 38
Method F F/l (%)
Fort Thompson
SPT N
Herrera 0.33 51
Frizzi 0.25 37
Ramos 0.13 30
Rock – Laboratory Data: Rock – In situ SPT N:
25Design Recommendations
• Cohesionless Soils• Recommend FHWA (beta, 1991) & Zelada (2000) over Brown (2010)
• Cohesive Soils• Recommend FHWA (alpha, 1999) - method is conservative, but good F/l (%)
• Limestone• Recommend methods based on laboratory strength data vs. SPT N• Miami Formation – recommend Ramos, Herrera, FDOT, Carter and Reese• Fort Thompson Formation – recommend Carter, FDOT, Herrera, Horvath, and
Reese.

26 Recommendation: Need For More Load Testing
• Only 2 rock formations with sufficient data for LRFD (Miami and Fort Thompson• Other formations needed (Anastasia, Ocala, etc)
• Limited marl or cemented soil tested• More data needed from north and south Florida
• Most borings were > 50 ft from load tests and had limited data within any boring
• Only 16 test piles had instrumentation to assess unit side resistance that could be usedto validate the Segmental Loading Approach with top movements between 0.1” and0.6”

27 Recommendation for Load Testing
• Number: 1 (CV < 0.25) to 3 (CV < 0.5) or more load tests (CV > 0.5) per sitedepending on length of project and variability.
• Instrument every test pile over multiple segments – obtain skin friction from multiplesoil and rock layers for each load test.
• Load each pile to failure or nominal capacity (e.g. Davisson), not 2 x design load –ensures mobilization of ultimate skin friction for soil and rock.
• Ensure that soil boring and rock strength data is available for all load tests within 50 ftand of sufficient quantity to estimate capacity.

Thank You
28