veeva systems inc.our customers on a subscription basis. we currently provide three major releases...
TRANSCRIPT

VEEVA SYSTEMS INC.
Fiscal Year 201 Annual Report6

UNITED STATESSECURITIES AND EXCHANGE COMMISSION
Washington, D.C. 20549
Form 10-K(Mark One)È ANNUAL REPORT PURSUANT TO SECTION 13 OR 15(d) OF THE SECURITIES
EXCHANGE ACT OF 1934For the fiscal year ended January 31, 2016
OR
‘ TRANSITION REPORT PURSUANT TO SECTION 13 OR 15(d) OF THE SECURITIESEXCHANGE ACT OF 1934
For transition period from toCommission File Number 001-36121
Veeva Systems Inc.(Exact name of Registrant as specified in its charter)
Delaware 20-8235463(State or other jurisdiction of
incorporation or organization)(I.R.S. Employer
Identification No.)4280 Hacienda Drive
Pleasanton, California 94588(Address of principal executive offices)
(925) 452-6500(Registrant’s telephone number, including area code)
Securities registered pursuant to Section 12(b) of the Act:Title of each class Name of each exchange on which registered
Class A Common Stock, par value $0.00001 New York Stock ExchangeSecurities registered pursuant to section 12(g) of the Act:
None
Indicate by a check mark if the Registrant is a well-known seasoned issuer, as defined in Rule 405 of the Securities Act. Yes È No ‘
Indicate by check mark if the Registrant is not required to file reports pursuant to Section 13 or Section 15(d) of the Act. Yes ‘ No È
Indicate by check mark whether the Registrant (1) has filed all reports required to be filed by Section 13 or 15(d) of the Securities Exchange Act of1934 during the preceding 12 months (or for such shorter period that the Registrant was required to file such reports), and (2) has been subject to such filingrequirements for the past 90 days. Yes È No ‘
Indicate by check mark whether the Registrant has submitted electronically and posted on its corporate Web site, if any, every Interactive Data Filerequired to be submitted and posted pursuant to Rule 405 of Regulation S-T (§232.405 of this chapter) during the preceding 12 months (or for such shorterperiod that the Registrant was required to submit and post such files). Yes È No ‘
Indicate by check mark if disclosure of delinquent filers pursuant to Item 405 of Regulation S-K (§229.405 of this chapter) is not contained herein, andwill not be contained, to the best of Registrant’s knowledge, in definitive proxy or information statements incorporated by reference in Part III of this Form10-K or any amendment to this Form 10-K. ‘
Indicate by check mark whether the Registrant is a large accelerated filer, an accelerated filer, a non-accelerated filer, or a smaller reporting company.See the definitions of “large accelerated filer,” “accelerated filer” and “smaller reporting company” in Rule 12b-2 of the Exchange Act.
Large accelerated filer È Accelerated filer ‘
Non-accelerated filer ‘ (Do not check if a smaller reporting company) Smaller reporting company ‘
Indicate by check mark whether the Registrant is a shell company (as defined in Rule 12b-2 of the Exchange Act). Yes ‘ No È
The aggregate market value of voting stock held by non-affiliates of the Registrant on the last business day of the Registrant’s most recently completedsecond fiscal quarter, which was July 31, 2015, based on the closing price of $26.92 for shares of the Registrant’s Class A common stock as reported by theNew York Stock Exchange, was approximately $2.4 billion. Shares of Class A common stock or Class B common stock held by each executive officer,director, and their affiliated holders have been excluded in that such persons may be deemed to be affiliates. This determination of affiliate status is notnecessarily a conclusive determination for other purposes.
As of March 18, 2016, there were 90,861,158 shares of the Registrant’s Class A common stock outstanding and 43,291,733 shares of the Registrant’sClass B common stock outstanding.
DOCUMENTS INCORPORATED BY REFERENCE
Portions of the Registrant’s Proxy Statement for the 2016 Annual Meeting of Stockholders are incorporated herein by reference in Part III of thisAnnual Report on Form 10-K to the extent stated herein. The proxy statement will be filed by the Registrant with the Securities and Exchange Commissionwithin 120 days after the end of the Registrant’s fiscal year ended January 31, 2016.

TABLE OF CONTENTS
Special Note Regarding Forward-Looking Statements . . . . . . . . . . . . . . . . . . . . . . . . . . . . . . . . . . . . . . . . . . 3PART I
Item 1. Business . . . . . . . . . . . . . . . . . . . . . . . . . . . . . . . . . . . . . . . . . . . . . . . . . . . . . . . . . . . . . . . . . . . . . . 4Item 1A. Risk Factors . . . . . . . . . . . . . . . . . . . . . . . . . . . . . . . . . . . . . . . . . . . . . . . . . . . . . . . . . . . . . . . . . . . 16Item 1B. Unresolved Staff Comments . . . . . . . . . . . . . . . . . . . . . . . . . . . . . . . . . . . . . . . . . . . . . . . . . . . . . . . 40Item 2. Properties . . . . . . . . . . . . . . . . . . . . . . . . . . . . . . . . . . . . . . . . . . . . . . . . . . . . . . . . . . . . . . . . . . . . . 40Item 3. Legal Proceedings . . . . . . . . . . . . . . . . . . . . . . . . . . . . . . . . . . . . . . . . . . . . . . . . . . . . . . . . . . . . . . . 40Item 4. Mine Safety Disclosures . . . . . . . . . . . . . . . . . . . . . . . . . . . . . . . . . . . . . . . . . . . . . . . . . . . . . . . . . . 41
PART IIItem 5. Market for Registrant’s Common Equity, Related Stockholder Matters, and Issuer Purchases of
Equity Securities . . . . . . . . . . . . . . . . . . . . . . . . . . . . . . . . . . . . . . . . . . . . . . . . . . . . . . . . . . . . . . . . 42Item 6. Selected Consolidated Financial Data . . . . . . . . . . . . . . . . . . . . . . . . . . . . . . . . . . . . . . . . . . . . . . . 44Item 7. Management’s Discussion and Analysis of Financial Condition and Results of Operations . . . . . 46Item 7A. Quantitative and Qualitative Disclosures About Market Risk . . . . . . . . . . . . . . . . . . . . . . . . . . . . . 65Item 8. Consolidated Financial Statements and Supplementary Data . . . . . . . . . . . . . . . . . . . . . . . . . . . . . 66Item 9. Change in and Disagreements With Accountants on Accounting and Financial Disclosure . . . . . . 103Item 9A. Controls and Procedures . . . . . . . . . . . . . . . . . . . . . . . . . . . . . . . . . . . . . . . . . . . . . . . . . . . . . . . . . . 103Item 9B. Other Information . . . . . . . . . . . . . . . . . . . . . . . . . . . . . . . . . . . . . . . . . . . . . . . . . . . . . . . . . . . . . . . 105
PART IIIItem 10. Directors, Executive Officers and Corporate Governance . . . . . . . . . . . . . . . . . . . . . . . . . . . . . . . . 106Item 11. Executive Compensation . . . . . . . . . . . . . . . . . . . . . . . . . . . . . . . . . . . . . . . . . . . . . . . . . . . . . . . . . 106Item 12. Security Ownership of Certain Beneficial Owners and Management and Related Stockholder
Matters . . . . . . . . . . . . . . . . . . . . . . . . . . . . . . . . . . . . . . . . . . . . . . . . . . . . . . . . . . . . . . . . . . . . . . . 106Item 13. Certain Relationships and Related Transactions, and Director Independence . . . . . . . . . . . . . . . . . 106Item 14. Principal Accounting Fees and Services . . . . . . . . . . . . . . . . . . . . . . . . . . . . . . . . . . . . . . . . . . . . . 106
PART IVItem 15. Exhibits, Financial Statement Schedules . . . . . . . . . . . . . . . . . . . . . . . . . . . . . . . . . . . . . . . . . . . . . 107
Signatures . . . . . . . . . . . . . . . . . . . . . . . . . . . . . . . . . . . . . . . . . . . . . . . . . . . . . . . . . . . . . . . . . . . . . 108
2

SPECIAL NOTE REGARDING FORWARD-LOOKING STATEMENTS
This annual report on Form 10-K contains forward-looking statements that are based on our beliefs andassumptions and on information currently available to us. Forward-looking statements include informationconcerning our possible or assumed future results of operations and expenses, business strategies and plans,trends, market sizing, competitive position, industry environment, potential growth opportunities and productcapabilities, among other things. Forward-looking statements include all statements that are not historical factsand, in some cases, can be identified by terms such as “anticipates,” “believes,” “could,” “estimates,” “expects,”“intends,” “may,” “plans,” “potential,” “predicts,” “projects,” “seeks,” “should,” “will,” “would” or similarexpressions and the negatives of those terms.
Forward-looking statements involve known and unknown risks, uncertainties and other factors that maycause our actual results, performance or achievements to be materially different from any future results,performance or achievements expressed or implied by the forward-looking statements, including those describedin “Risk Factors,” “Management’s Discussion and Analysis of Financial Condition and Results of Operations”and elsewhere in this annual report on Form 10-K. Given these uncertainties, you should not place undue relianceon these forward-looking statements.
Any forward-looking statement made by us in this annual report on Form 10-K speaks only as of the date onwhich it is made. Except as required by law, we disclaim any obligation to update these forward-lookingstatements publicly, or to update the reasons actual results could differ materially from those anticipated in theseforward-looking statements, even if new information becomes available in the future.
As used in this annual report on Form 10-K, the terms “Veeva,” “Registrant,” “we,” “us,” and “our” meanVeeva Systems Inc. and its subsidiaries unless the context indicates otherwise.
3

ITEM 1. BUSINESS
Overview
Veeva is a leading provider of industry cloud software and data solutions for the global life sciencesindustry. We were founded in 2007 on the premise that industry-specific cloud solutions could best address theoperating challenges and regulatory requirements of the life sciences industry. Our products are designed to meetthe unique needs of life sciences companies, regardless of size. Targeted to address our customers’ most strategicbusiness functions—from research and development to commercialization—our solutions are designed to helpthe industry bring products to market faster and more efficiently, market and sell more effectively and maintaincompliance with government regulations.
Our purpose-built solutions address a broad range of requirements within life sciences companies, includingmultichannel customer relationship management, regulated content and information management, master datamanagement and customer data. Our solutions for the commercial function of life sciences companies—whichwe refer to as Veeva Commercial Cloud—bring together the customer data, content management andmultichannel customer relationship management capabilities needed to achieve better customer engagement. Oursolutions for key R&D functions—including clinical, quality and regulatory—help companies attain greatertransparency, compliance and faster time to market.
All of our software solutions are delivered in the cloud or via intuitive mobile applications and are offered toour customers on a subscription basis. We currently provide three major releases of our software solutions peryear that are included in our subscription and not subject to an additional fee. We implement new releases in ourcloud computing environment such that when a new release is put into production, the prior version is fullyreplaced. Our cloud-based, multitenant architecture substantially reduces the need for our customers to buy,maintain and support IT infrastructure, and significantly reduces the cost and complexity relative to theimplementation, maintenance and upgrade processes required for on-premise software or the customizationrequired with generic cloud solutions that are not industry specific.
Because of our industry focus, we gain a unique, in-depth perspective into the needs and best practices oflife sciences companies, which allows us to develop targeted new solutions and incorporate highly relevantenhancements into our existing solutions. Our industry cloud approach and multitenant architecture also allow usto adapt more quickly to the market and regulatory changes that are most significant to our customers. Our paceof innovation and customer success focus have allowed us to significantly expand our relationships withcustomers large and small. We believe we are fast becoming a highly strategic provider to the industry, markedby a growing customer base that utilizes an increasing number of our solutions.
Our Industry Cloud Solutions
Our solutions span four key areas: (i) the Veeva CRM family of applications for multichannel customerrelationship management to enable coordinated and personalized customer engagement through multiple touchpoints, (ii) Veeva Vault for regulated content management and information management solutions to enable themanagement of complex, content-centric processes, (iii) the Veeva Network master data management solutionsfor the effective management of customer master and product master data, and (iv) Veeva’s data and dataservices offerings, including Veeva OpenData for customer reference data and Veeva KOL Data for key opinionleader data. Each product line is described in further detail below.
Multichannel Customer Relationship Management
Our multichannel customer relationship management applications allow pharmaceutical and biotechnologycompanies to market and sell more efficiently, effectively and compliantly to physicians, other healthcareprofessionals and healthcare organizations across multiple touch points including in-person, email and online.
4

To support the life sciences industry’s unique commercial business processes and regulatory compliancerequirements, our multichannel customer relationship management applications provide highly specializedfunctionality such as prescription drug sample management with electronic signature capture, the management ofcomplex affiliations between physicians and the organizations where they work, compliant email, and the captureof medical inquiries from physicians. In order to deliver the best possible functionality and user experience, wehave designed and built a specific application for each mobile device platform we support, including AppleiPads, Windows 8 and 10 mobile devices, Windows-based laptops and tablet PCs.
Our multichannel customer relationship management applications include:
• Veeva CRM and Veeva Medical CRM enables physician-facing employees, such as pharmaceuticalsales representatives, key account managers and scientific liaisons to manage, track and optimizeinteractions with healthcare professionals utilizing a single, integrated solution.
• Veeva CLM provides closed-loop marketing capabilities for use in in-person interactions withphysicians. Veeva CLM allows customers to replace paper-based materials with interactive electronicmarketing presentations while controlling the storage, distribution, presentation and tracking ofpromotional materials. In addition, through native integration with Veeva Vault, Veeva CLM helpscustomers ensure that only the latest approved presentations are delivered to physicians, helping tomaintain regulatory compliance.
• Veeva CRM Mobile, our proprietary mobile application that runs on the Apple iPad and the Windows 8and 10 platforms, combines the key functionality of Veeva CRM and Veeva CLM to provide userswith functionality that helps maximize productivity in the field. Veeva CRM Mobile was designed toprovide the functionality needed for pharmaceutical field sales representatives and other users toaccomplish mission critical tasks in locations, such as hospitals and physicians’ offices, whether or notan internet connection is available. Veeva CRM Mobile synchronizes to Veeva CRM when connectedto the internet. When synchronizing, Veeva CRM Mobile uploads to Veeva CRM data captured whileoperating off-line, such as data regarding drug samples provided to physicians, and downloads dataupdates from Veeva CRM, such as new physician contact information.
• Veeva CRM Approved Email provides for the management, delivery and tracking of regulatorycompliant email communication between sales representatives and physicians. Veeva CRM ApprovedEmail includes capabilities to ensure compliant communications, such as managing physician emailopt-in and opt-out. In addition, through native integration with Veeva Vault, Veeva CRM ApprovedEmail helps customers ensure that only the latest approved email templates and documents can bedelivered to physicians, helping to ensure regulatory compliance.
• Veeva CRM Engage provides closed-loop marketing capabilities for self-directed physicianinteractions via the web. Through native integration with Veeva Vault, Veeva CRM Engage ensuresonly the latest, approved materials are delivered to physicians, helping to improve regulatorycompliance.
• Veeva CRM CoBrowse provides closed-loop marketing capabilities for web-based presentations tophysicians led by the sales and marketing staff of life sciences companies. Through native integrationwith Veeva Vault, Veeva CRM CoBrowse helps customers ensure that only current content is deliveredto physicians, helping to improve regulatory compliance.
• Veeva CRM Events Management enables the planning, management and execution of group meetingswith healthcare professionals, and helps life sciences companies track and manage spending in order tomeet transparency reporting requirements.
• Veeva Align enables life sciences companies to manage the allocation and alignment of sales andmarketing resources to customers across all communication channels and define multichannel plans ofaction. Through native integration with Veeva CRM, Veeva Align allows the storage of historical andfuture alignments for incentive compensation calculations and automatically updates the activealignment of the field in Veeva CRM.
5

Regulated Content and Information Management
Veeva Vault, our cloud-based content and information management solution, is used by our customersacross commercial functions, including medical, sales and marketing, and key R&D functions, including clinical,regulatory and quality. Veeva Vault consists of nine business applications and our proprietary Veeva VaultPlatform. Veeva Vault applications each include a unique data model, deep functionality, and pre-definedworkflows required to support very specific industry processes. Veeva Vault can be deployed as an integratedsolution across multiple applications, enabling our customers to manage all their important documents andrelated data in a single, global system.
The Veeva Vault Platform was built with the rigorous content and information management requirements ofthe life sciences industry in mind, including comprehensive audit trail capabilities that record actions and updatesenabling customers to manage their highly regulated content and data in a compliant manner. In addition, theVeeva Vault Platform offers key functionality across all the Veeva Vault applications, such as searching, contentviewing and annotation, comprehensive workflow and approvals, electronic signatures, reporting and openapplication programming interfaces to allow for integration with other systems. The Veeva Vault Platform alsoincludes a configuration toolset that allows customers to create their own Veeva Vault applications.
The Veeva Vault applications primarily used by R&D departments of life sciences companies include:
• Veeva Vault eTMF is an electronic trial master file application that manages the repository ofimportant documents for active and archived clinical trials for improved inspection readiness, visibilityand control. Vault eTMF enables collaboration between the life sciences company sponsoring the trialand outsourced partners, such as contract research organizations. All clinical trial documents areorganized in Vault eTMF according to industry accepted guidelines in order to speed the transitionfrom clinical trials to submission for regulatory approval.
• Veeva Vault Study Startup enables life sciences companies to more efficiently manage the process ofactivating investigator sites for clinical trials, accelerating time to first patient enrollment andautomating complicated processes while helping to maintain compliance with regulatory requirementsand connectivity with Vault eTMF. Veeva Vault Study Startup allows sites, sponsors and contractresearch organizations to access the same critical operational information, simplifying collaborationand increasing efficiency.
• Veeva Vault Investigator Portal manages the collection of documentation and collaboration amongtrial sponsors, trial sites and the researchers conducting the trials, known as investigators. Rather thanfaxing documentation or buying a separate secure file exchange, our customers can deploy the VaultInvestigator Portal with Vault eTMF to streamline document collection and organization whilecomplying with strict industry regulations relating to electronic record keeping systems.
• Veeva Vault QualityDocs enables the creation, review, approval, distribution and management ofcontrolled documents, such as standard operating procedures, or SOPs, manufacturing recipes andspecifications. All life sciences companies that are developing or selling regulated products must havea quality management system in place. Vault QualityDocs provides the document control andmanagement system needed to manage these processes and enable greater compliance, quality andoperational efficiency.
• Veeva Vault Submissions helps life sciences companies gather and organize all the documents andother content that should be included in a regulatory submission to a healthcare authority, such as theFDA. Vault Submissions organizes all content according to industry accepted guidelines, which helpsto speed the time to regulatory submission by providing a single place for all researchers, contractresearch organizations and other collaboration partners to prepare and manage the entire content lifecycle.
• Veeva Vault Registrations enables life sciences companies to manage, track and report product andregistration information worldwide, including registration status, variations, health authority questions
6

and commitments and certification requests. With a single, global solution companies can streamlineregistration management and increase the speed of responses to health authorities.
• Veeva Vault SubmissionsArchive is an authoritative source for submissions and correspondence thatstores published submissions in a secure, globally accessible repository. Easy access and full visibilityto submissions and correspondence, worldwide helps to enable faster, more accurate responses tohealth authorities.
Veeva Vault Submissions, Veeva Vault Registrations, and Veeva Vault SubmissionsArchive may bepurchased separately or as a unified suite of applications called Veeva Vault RIM that improves regulatorybusiness operations and compliance by providing a single authoritative source for submission documents,published dossiers, health authority interactions and product registrations.
The Veeva Vault applications primarily used by the commercial and medical departments of life sciencescompanies include:
• Veeva Vault PromoMats enables life sciences companies to manage the end-to-end process forcreation, approval, distribution, expiration and withdrawal of commercial content across the full digitalsupply chain. Powerful capabilities such as review and approval, claims tracking, multichannel contentdistribution and withdrawal and an integrated digital asset library help to enable compliance, speed tomarket and greater content reuse.
• Veeva Vault MedComms provides life sciences companies with a single, validated source of medicalcontent across multiple channels and geographies. Medical content is used by life sciences companiesfor verbal and written communications with healthcare professionals and patients, including approvedanswers to questions received through a call center or company website. Vault MedComms helps speedthe creation, approval and delivery of medical content for more accurate scientific communications,better visibility and traceability of medical content and faster response time to medical inquiries.
Master Data Management
Veeva Network Customer Master, our cloud-based customer master data management solution, is designedto help life sciences companies create and maintain complete and accurate master records for individualhealthcare professionals and healthcare organizations. Veeva Network Customer Master is an industry-specific,cloud-based customer master software solution that deduplicates, standardizes and cleanses healthcareprofessional and organization data from multiple systems and data sources to arrive at a single, consolidatedcustomer master record. Veeva Network Customer Master comes pre-configured with a data model that isspecific to life sciences and supports global harmonization as well as country, market and regional dataspecifications within a single system. Veeva Network Customer Master also includes an intuitive user interface,powerful free text search and filtering capabilities and the ability to track and measure data quality and operatingefficiency through key performance indicators.
Veeva Network Customer Master can be used seamlessly with Veeva OpenData to simplify the process ofdata delivery to customers and provide bi-directional integration of requests for data enrichment. Additionally,Veeva Network Customer Master can be operated in what we refer to as private mode when proprietary datafrom third party data providers is uploaded to the Veeva Network Customer Master solution. In private mode, thebi-directional integration between Veeva Network Customer Master and Veeva OpenData is disabled. VeevaNetwork Customer Master is also fully integrated with Veeva CRM in order to make the most up-to-datehealthcare professional and healthcare organization data available to sales and marketing users.
Veeva Network Product Master, planned for general release in 2016, is our cloud-based product master datamanagement offering to help life sciences companies create complete and accurate product master records. Itdeduplicates, standardizes and cleanses life sciences product data from multiple systems and data sources toarrive at a single, consolidated product master record for enterprise use. With Veeva Network Product Master,
7

brand management teams can easily create product definitions, groupings and hierarchies, helping them to ensurean accurate representation of the parent brand, local trade names, and approved indications in every market.
Data and Data Services
Veeva OpenData Customer Data provides healthcare professional and healthcare organization data thatincludes demographic and license information, affiliations, and other key data such as digital profiles crucial tocustomer engagement and compliance. Veeva OpenData replaces the need for a number of disparate externaldata feeds, and is continuously updated from government and other authoritative industry sources. We maintaindata quality and completeness through rigorous, automated, and steward-led validation. As of March 2016,Veeva OpenData customer data is available in 35 countries, and we plan to make it available in additionalcountries in the future.
Veeva OpenData Compliance Data identifies and assigns healthcare professional specialty information andlicense status, including expiration dates, which are essential to the compliance processes with respect to certainlife sciences activities, such as confirming drug sample eligibility and assigning sales territories.
Veeva OpenData Data Services further reduce the cost and complexity of managing healthcare professionaland healthcare organization data by providing fast, responsive maintenance services. Instead of maintainingdedicated in-house data stewards to verify internal updates to data, Veeva Data Services manages these processeson behalf of our customers, including data quality consulting and enhancements and ongoing maintenanceservices.
Veeva OpenData Email Services provides email data and email rental services to help improve outreach tohealthcare professionals through digital channels. Veeva OpenData Email Services delivers a single source ofhealthcare professional email addresses that are continuously updated with data from trusted industry sources andverified by data stewards.
Veeva KOL Data and Services provide deep profile information for important healthcare professionals andother stakeholders, gleaned from their conference presentations, published research, clinical trials, grants, articlesand social activity. It also maps their affiliations as well as social and relationship networks.
Professional Services and Support
In addition to cloud-based solutions that meet the specific needs of our life sciences customers, we also offerprofessional services to help customers maximize the value they get from those solutions. The people on theseteams have a combination of life sciences industry expertise, project management skills and deep technicalacumen that we believe our customers highly value. Our professional services are offered directly to customersor through our systems integrator partners. Our professional services teams also often work together with oursystems integrator partners to deliver projects. We offer professional services in the following areas:
• implementation and deployment planning and project management;
• requirements analysis, solution design and configuration;
• systems environment management and deployment services;
• services focused on advancing or transforming business and operating processes related to Veevasolutions;
• technical consulting services related to data migration and systems integrations;
• training on our solutions; and
• ongoing managed services, such as outsourced systems administration.
8
Our professional services teams are organized based on separate R&D and commercial competencies so thatmembers of our professional services team can also provide knowledge and best practices advice for the R&Dand commercial departments of our customers.
Our global systems integrator partners, including Accenture, Cognizant Technology Solutions, DeloitteConsulting and other life sciences specialty firms, also deliver implementation and selected support services tothose of our customers who wish to utilize them.
Our Customers
As of January 31, 2016, we served 400 life sciences customers. For an explanation of how we define currentcustomers, see “Management’s Discussion and Analysis of Financial Condition and Results of Operations—Components of Results of Operations.” We deliver solutions to companies throughout the life sciences industry,including pharmaceuticals, biotechnology, medical products, contract sales organizations, or CSOs, and contractresearch organizations. Our customers range from the largest global pharmaceutical companies such as BayerAG, Boehringer Ingelheim GmbH, Eli Lilly and Company, Gilead Sciences, Inc., Merck & Co., Inc., andNovartis International AG, to smaller pharmaceutical and biotechnology companies including Alkermes plc,Grupo Ferrer Internacional S.A., Ironwood Pharmaceuticals, Inc. and LEO Pharma A/S. For our fiscal yearsended January 31, 2014, 2015, and 2016, we did not have any single customer that represented more than 10% ofour total revenues. For a summary of our financial information by geographic location, see note 15 of the notes toour consolidated financial statements.
Our Culture and Employees
We have built our company culture on making customers successful and responding to our customers’ needswith speed. It is our aim to be among the few most trusted information technology partners the industry worksclosely with on its most important data and information technology needs. The deep partnerships we forge withour customers help us shape our offerings to best meet industry needs and allow us extend those relationships byproviding additional solutions across a broader range of business areas. With a track record of ongoing, industryleading innovation and a steadfast commitment to our customers’ success we believe we are well positioned tocontinue to help the industry address a broader range of challenges and opportunities. We also believe ourcustomer success focus provides a strategic advantage in our business development and sales efforts, ascustomers are strong advocates and refer others to our solutions.
We have carefully built our culture by recruiting, selecting and developing employees who are highlyfocused on delivering success for customers. This is a crucial element of our hiring and evaluation processesthroughout all departments. We believe this approach produces high levels of customer success and employeesuccess.
We also believe we provide employees a unique opportunity to develop and sell world-class, cloud-basedapplications and platforms within a specific industry. Historically, software developers had to choose betweendeveloping platforms for a broad, but generic set of customers, and building industry-specific solutions withlimited further applicability. Our industry cloud approach empowers developers to build important applicationsand platforms that can become the standard in our industry while enabling sales personnel to sell a growingportfolio of solutions to a focused, deep set of life sciences companies. We believe that this unique opportunitywill allow us to continue to attract top talent for our product development and sales efforts.
As of January 31, 2016, we employed 1,474 people. We also engage temporary employees and consultants.None of our employees is represented by a labor union. We have not experienced any work stoppages, and weconsider our relations with our employees to be very good.
9

Technology Infrastructure and Operations
Our solutions utilize a pod-based architecture in multiple data centers that allow for scalability, operationalsimplicity and security. Our solutions are hosted in data centers located in the United States, the European Unionand Japan. We utilize third-parties to provide our data center infrastructure and manage the infrastructure onwhich our solutions operate. We utilize industry standard hardware in redundant configurations to minimizeservice interruptions. We also utilize multiple domain name service providers to lessen the potential for network-related disruptions.
Our technology is based on multitenant architectures that apply common, consistent management practicesfor all customers using our solutions. We enable multiple customers to share the same version of our solutionswhile securely partitioning their respective data. Portions of our multichannel customer relationship managementapplications are built on the Salesforce1 Platform. Our Veeva Vault and Veeva Network solutions are built uponour own proprietary platforms. We built the proprietary portions of our technology stack using recognized opensource components. In addition, we use Amazon Web Services, which provides a scalable, distributed computingand storage infrastructure platform, for certain computing and data intensive functions of our solutions, such asanalytic reporting, large data set manipulation and redundant storage.
We continually monitor our infrastructure for any sign of failure or pending failure, and we take preemptiveaction to attempt to minimize or prevent downtime. Our data centers employ advanced measures to ensure physicalintegrity and security, including redundant power and cooling systems, fire and flood prevention mechanisms,continual security coverage, biometric readers at entry points and anonymous exteriors. We also implement variousdisaster recovery measures, including full replication of hardware and data in our geographically distinct datacenters, such that data loss would be minimized in the event of a single data center disaster.
All users are authenticated, authorized and validated before they can access our solutions. Users must have avalid user ID and associated password to log on to our solutions. Our configurable security model allowsdifferent groups of users to have different levels of access to our solutions. Our solutions’ vulnerability is testedusing internal tools prior to release, and we employ a third party to perform penetration and vulnerability tests onour solutions on at least an annual basis.
We also obtain independent third-party audit opinions related to security and availability annually, such as aService Organization Controls, or SOC 2, Type II report.
Sales and Marketing
We sell our solutions through our direct sales organization.
At a high level, life sciences companies are typically organized by the major functions of research anddevelopment for the creation and development of new solutions, and commercial, for the sales and marketing ofthose solutions once they are approved for use. In large life sciences companies, research and development andcommercial business lines may also have separate technology and business decision makers. Accordingly, wemarket and sell our solutions to align with the distinct characteristics of the research and development buyer andthe commercial buyer. In our largest regions, we have distinct research and development and commercial salesteams. Each of these teams is further divided to sell to the largest global pharmaceutical companies and tosmaller life sciences companies.
We believe the combination of our industry-focus and commitment to customer success provides strategicadvantage and allows us to more efficiently market and sell our solutions as compared to horizontal cloud-basedcompanies. Our awareness, demand generation and sales cultivation programs are highly targeted to only lifesciences industry buyers. We believe that we further benefit from word-of-mouth marketing as customersendorse our solutions to their industry peers. This allows us to focus our sales and marketing efforts without theneed for a larger number of sales executives.
10

Our Relationship with salesforce.com
Veeva CRM and certain of our related multichannel customer relationship management applications aredeveloped on or utilize the Salesforce1 Platform of salesforce.com, inc. We are salesforce.com’s preferred andrecommended Salesforce1 Platform application provider of sales automation solutions for drug makers in thepharmaceutical and biotechnology industry, or the pharma/biotech industry. Our agreement provides that, subjectto certain exceptions and specified remedies for breach, salesforce.com will not position, develop, promote,invest in or acquire applications directly competitive to the Veeva CRM application for sales automation thatdirectly target the pharma/biotech industry. Our agreement with salesforce.com does not restrict a salesforce.comcustomer’s ability (or the ability of salesforce.com on behalf of a specific salesforce.com customer) to customizeor configure the Salesforce1 Platform. However, our agreement restricts salesforce.com from competing with uswith respect to sales opportunities for sales automation solutions for the pharma/biotech industry unless suchcompetition has been pre-approved by salesforce.com’s senior management based on certain criteria specified inthe agreement. Our agreement also imposes certain limits on salesforce.com entering into arrangements similar toours with other parties with respect to sales automation applications for the pharma/biotech industry. Ouragreement allows us to provide our customers with rights to the Salesforce1 Platform Unlimited Edition for useas combined with the proprietary aspects of certain of our multichannel customer relationship managementapplications, and subject to salesforce.com’s standard prior review and approval processes, to build additionalapplications on the Salesforce1 Platform.
Under our agreement, salesforce.com provides the hosting infrastructure and data center for portions of ourmultichannel customer relationship management applications, as well as the system administration,configuration, reporting and other platform level functionality. In exchange, we pay salesforce.com a fee. Ourcurrent agreement with salesforce.com expires on September 1, 2025 and is renewable for five-year periods uponmutual agreement. We are obligated to meet minimum order commitments of $500 million over the term of theagreement, including “true-up” payments if the orders we place with salesforce.com have not equaled orexceeded the following aggregate amounts within the timeframes indicated: (i) $250 million from March 1, 2014to September 1, 2020 and (ii) the full amount of $500 million by September 1, 2025. If either party elects not torenew the agreement or if the agreement is terminated by us as a result of salesforce.com’s breach, the agreementprovides for a five-year wind-down period in which we would be able to continue providing the Salesforce1Platform as combined with the proprietary aspects of our solutions to our existing customers but would belimited with respect to the number of additional subscriptions we could sell to our existing customers. We believethat we have a mutually beneficial strategic relationship with salesforce.com.
Quality and Compliance
Our customers use our solutions for business activities that are subject to a complex regime of country andregion specific healthcare laws and regulations across the globe. In order to best serve our customers, we mustensure that the data processed by our systems are accurate and secure and that they retain the level ofconfidentiality and privacy commensurate with the type of information managed. To comply with IT healthcareregulations, industry-specific capabilities must be designed for and embedded in all of our solutions. Thesecapabilities include: robust audit trail tracking, compliant electronic signature capture, data encryption and secure
11

access controls. In addition to design requirements, our solutions must be thoroughly tested to comply with theregulations that apply to electronic record keeping systems for the life sciences industry, which include:
Regulation Regulation Description
21 CFR 820.75 U.S. FDA device regulation on system validation
21 CFR 211.68 U.S. FDA pharma GMP regulation on system validation
21 CFR 11 U.S. FDA requirement for maintenance of electronic records
EU Annex 11 EU GMP requirement for maintenance of electronic records
21 CFR 203 Drug sample tracking as required by the Prescription Drug Marketing Act
PFSB Notification,No. 0401022 (Japan)
Use of Electromagnetic Records and Electronic Signatures for Approval of,or License for, Drugs
Each version of our solutions undergoes validation testing against these and other relevant standards. Veevaperforms IQ and OQ, develops a validation plan and executes the protocols. The results of each independentvalidation are then reviewed and confirmed in a summary report by our quality and compliance team. As such,we maintain a dedicated team of quality and compliance experts that manages our processes for meeting therequirements of the FDA and other global life sciences regulatory agencies. The functions of this quality andcompliance team include three separate domains, each managed by a responsible area head:
• quality systems oversees resource management, document management, computer validation andquality oversight;
• compliance oversees audit management, supplier management and regulatory intelligence; and
• the security office oversees information security and data privacy, security awareness training andsecurity incident management.
Veeva has designed and implemented a Quality Management System (QMS) that is aligned with ourcustomers’ regulatory standards for IT compliance. Our QMS is maintained in our own Veeva Vault QualityDocsapplication. A compliant QMS in the healthcare regulated environment entails:
• a comprehensive set of quality policies and procedures;
• an independent quality assurance function that oversees development and maintenance of our software;
• audit support of our customers’ regulatory obligation to perform due diligence on their suppliers;
• computer systems validation aligned with healthcare industry best practices as outlined in publishedregulatory standards;
• a resource management program to ensure employees have the requisite demonstrable level ofexperience and training;
• a risk management program to identify product realization and other business risks; and
• an information security program to ensure IT controls conform to established standards.
With respect to data protection, Veeva is a registered Data Controller and Data Processor under EU DataProtection Directive 95/46/EC. We routinely execute the EU Standard Contractual Clauses, often also referred toas Model Clauses, to ensure that our European customers have adequate assurance of our technical andorganization controls regarding data privacy.
Our quality and compliance team also manages the process of customer audits, which is often a required duediligence step in customer purchase decisions. We believe our approach to quality and compliance is a reflectionof our focus on customer success and is a competitive differentiator.
12

Research and Development
Our ability to compete depends in large part on our continuous commitment to research and developmentand our ability to rapidly introduce new applications, technologies, features and functionality. Our research anddevelopment organization is responsible for the design, development and testing of our solutions andapplications. Based on customer feedback and needs, we focus our efforts on developing new solutionsfunctionality, applications and core technologies and further enhancing the usability, functionality, reliability,performance and flexibility of existing solutions and applications.
Research and development expenses were $26.3 million, $41.2 million and $66.0 million for our fiscal yearsended January 31, 2014, 2015 and 2016, respectively.
Competition
The overall market for life sciences software is global, rapidly evolving, highly competitive and subject tochanging regulations, advancing technology and shifting customer needs. The solutions and applications offeredby our competitors vary in size, breadth and scope.
Our multichannel customer relationship applications compete with offerings from large global enterprisesoftware vendors, such as Oracle Corporation, and also compete with life sciences-specific vendors, such as IMSHealth Holding, Inc. We also compete with a number of vendors of cloud-based and on-premise customerrelationship management applications that address only a portion of one of our customer relationshipmanagement solutions. Veeva Vault, our regulated content and information management solutions, competeswith offerings from large global content management platform vendors such as EMC Corporation, MicrosoftCorporation and OpenText Corporation. We also compete with professional services companies that providesolutions on these platforms, such as Computer Sciences Corporation, and with other life sciences specificproviders. In the future, providers of horizontal cloud-based storage products may seek to compete with ourregulated content and information management solutions. Our Veeva Network master data management solutionscompete with master data software offerings from vendors such as Informatica Corporation, IMS and othersmaller providers. Our data and data services offerings compete with IMS and many other data providers.
We may also face competition from custom-built software developed by third-party vendors or developedin-house by our potential customers, or from applications built by our customers or by third parties on behalf ofour customers using commercially available software platforms that are provided by third parties. We may alsoface competition from companies that provide cloud-based solutions in different target or horizontal markets thatmay develop applications or work with companies that operate in our target markets. With the introduction ofnew technologies and market entrants, we expect competition to intensify in the future.
In some cases, our competitors are well-established providers of competitive solutions and have long-standing relationships with many of our current and potential customers, including large pharmaceutical andemerging biopharmaceutical companies. Oracle, EMC and IMS, for example, each have greater namerecognition, a much longer operating history, larger marketing budgets and significantly greater resources thanwe do.
Many of our competitors may be able to devote greater resources to the development, promotion and sale oftheir products and services than we are able. Such competitors may be able to initiate or withstand substantialprice competition, and may offer solutions competitive to certain of our solutions on a standalone basis at a lowerprice or bundled as part of a larger product sale, including the bundling of software solutions and data. Inaddition, many of our competitors have established marketing relationships, access to larger customer bases anddistribution agreements with consultants, system integrators and resellers that we do not have. Our competitorsmay also establish cooperative relationships among themselves or with third parties that may further enhancetheir product offerings or resources.
13

In addition, in order to take advantage of customer demand for cloud-based solutions, such competitors mayexpand their cloud-based solutions through acquisitions and organic development or may seek to partner withother leading cloud providers. For instance, in April 2015, IMS acquired the information solutions and CRMbusinesses of Cegedim SA. The combined entity is likely to intensely compete with us in a number of productareas, including software solutions, data and data services, and such competition may negatively impact ourbusiness.
We believe the principal competitive factors in our market include the following:
• level of customer satisfaction;
• regulatory compliance verification and functionality;
• domain expertise with respect to life sciences;
• ease of deployment and use of solutions and applications;
• breadth and depth of solution and application functionality;
• brand awareness and reputation;
• modern and adaptive technology platform;
• capability for customization, configurability, integration, security, scalability and reliability ofapplications;
• total cost of ownership;
• ability to innovate and respond to customer needs rapidly;
• size of customer base and level of user adoption; and
• ability to integrate with legacy enterprise infrastructures and third-party applications.
We believe that we compete favorably on the basis of these factors and that the domain expertise requiredfor developing and deploying successful solutions in the life sciences industry may hinder new entrants that areunable to invest the necessary capital to develop solutions that can address the functionality, requirements andregulatory compliance capabilities needed for the life sciences industry. Our ability to remain competitive willlargely depend on our ongoing performance in the areas of solution and application development and customersupport.
Intellectual Property
We rely on a combination of patents, trade secrets, copyrights and trademarks, as well as contractualprotections, to establish and protect our intellectual property rights. We have recently instituted a process forseeking patent protection for our technology innovations and to date we have secured 3 patents and have 21pending U.S. and international patent applications. We plan to continue expanding our patent portfolio. Werequire our employees, consultants and other third parties to enter into confidentiality and proprietary rightsagreements and control access to software, documentation and other proprietary information. Although we relyon our intellectual property rights, as well as contractual protections to establish and protect our proprietaryrights, we believe that factors such as the technological and creative skills of our personnel, creation of newfeatures and functionality and frequent enhancements to our applications are essential to establishing andmaintaining our technology leadership position as provider of software solutions and applications to the lifesciences industry.
Despite our efforts to protect our proprietary technology and our intellectual property rights, unauthorizedparties may attempt to copy or obtain and use our technology to develop applications with the same functionalityas our application. Policing unauthorized use of our technology and intellectual property rights is difficult, andprotection of our rights through civil enforcement mechanisms may be expensive and time consuming.
14
Companies in our industry often own a number of patents, copyrights, trademarks and trade secrets andfrequently enter into litigation based on allegations of infringement, misappropriation or other violations ofintellectual property or other rights. We have in the past settled a lawsuit from a competitor asserting patentinfringement and a lawsuit from a competitor asserting trademark infringement, and we may face new allegationsin the future that we have infringed the patents, trademarks, copyrights, trade secrets and other intellectualproperty rights of other competitors or non-practicing entities. We expect that we and others in our industry willcontinue to be subject to third-party infringement claims by competitors as the functionality of applications indifferent industry segments overlaps, and by non-practicing entities. Any of these third parties might make aclaim of infringement against us at any time.
Business Combinations
Most of our solutions were developed by our in-house research and development teams, but there areinstances in which we acquire relevant outside expertise or product capabilities to help our customers succeed.
On September 29, 2015, we completed our acquisition of Mineral Newco Ltd., the ultimate parent companyof Zinc Ahead Ltd. and other affiliates (collectively, “Zinc Ahead”) in an all-cash transaction. The total closingconsideration for the purchase was approximately $119.9 million in cash. In addition, the agreement calls for$10.0 million payable at a rate of one-third per year to employee shareholders and option holders of Zinc Aheadwho remain employed with us. These payments have been accounted for as deferred compensation and will berecognized over the service period. Zinc Ahead was a provider of commercial content management solutions. Weexpect this acquisition to support the continued growth of our commercial content management solutions. Overtime, we will seek to convert the users of the Zinc Ahead solutions to our Veeva Vault PromoMats application.
Corporate Information
We were incorporated in the state of Delaware in January 2007 and changed our name to Veeva SystemsInc. from Verticals onDemand, Inc. in April 2009. Our principal executive offices are located at 4280 HaciendaDrive, Pleasanton, California 94588. Our telephone number is (925) 452-6500. Our website address is http://www.veeva.com. Information contained on our website is not incorporated by reference into this annual reporton Form 10-K, and you should not consider information contained on our website to be part of this annual reporton Form 10-K or in deciding whether to purchase shares of our Class A common stock. Our annual reports onForm 10-K, quarterly reports on Form 10-Q, current reports on Form 8-K and amendments to reports filed orfurnished pursuant to Sections 13(a) and 15(d) of the Securities Exchange Act of 1934, as amended, are availablefree of charge on the Investors portion of our website at http://ir.veeva.com as soon as reasonably practicableafter we electronically file such material with, or furnish it to, the SEC.
15

ITEM 1A.RISK FACTORS
Investing in our Class A common stock involves a high degree of risk. You should consider carefully therisks and uncertainties described below and in “Management’s Discussion and Analysis of Financial Conditionand Results of Operations”, together with all of the other information in this annual report on Form 10-K,including our consolidated financial statements and related notes, before investing in our Class A common stock.The risks and uncertainties described below are not the only ones we face. If any of the following risks actuallyoccurs, our business, financial condition, results of operations and prospects could be materially and adverselyaffected. In that event, the price of our Class A common stock could decline and you could lose part or all of yourinvestment.
Risks Related to Our Business and Industry
Our quarterly results may fluctuate significantly, which make it difficult to predict our future operating resultsand could prevent us from meeting investor expectations, or our own guidance, and which would adverselyimpact the value of our Class A common stock.
Our quarterly results of operations, including our revenues, gross margin, operating margin, profitability,cash flows and deferred revenue, may vary significantly in the future for a variety of reasons, including thoselisted elsewhere in this “Risk Factors” section, and period-to-period comparisons of our operating results may notbe meaningful. Accordingly, our quarterly results should not be relied upon as an indication of futureperformance. Additionally, we issue guidance quarterly regarding our expectations for certain future financialresults. Our ability to forecast our future operating results, including revenues, gross margin, operating margin,profitability, cash flows and deferred revenue, is limited, including by our relatively limited operating history,and subject to a number of uncertainties, including incomplete information and our expectations as to certainfuture events that we do not control. Our guidance may prove to be incorrect and actual results may differmaterially from our guidance. Fluctuations in our results or failure to achieve our forecasts and guidance mayadversely impact the value of our Class A common stock.
We expect the future growth rate of our revenues to decline.
In our fiscal years ended January 31, 2014, 2015 and 2016, our total revenues grew by 62%, 49% and 31%,respectively, as compared to total revenues from the prior fiscal years. We expect the growth rate of our revenuesto decline in future periods which may adversely impact the value of our Class A common stock.
As our costs increase, we may not be able to sustain the level of profitability we have achieved in the past.
We expect our future expenses to increase as we continue to invest in our business. We expect to incursignificant future expenditures related to:
• developing new solutions, enhancing our existing solutions and improving the technologyinfrastructure, scalability, availability, security and support for our solutions;
• expanding and deepening our relationships with our existing customer base, including expendituresrelated to increasing the adoption of our solutions by the research and development departments of lifesciences companies;
• sales and marketing, including expansion of our direct sales organization and global marketingprograms;
• expansion of our professional services organization;
• international expansion;
• integrating the business and headcount of Zinc Ahead;
• employee compensation, including stock based compensation;
16

• further build out of our new corporate headquarters located in Pleasanton, California; and
• general operations, IT systems and administration, including legal and accounting expenses related tobeing a public company.
If our efforts to increase revenues and manage our expenses are not successful, or if we incur costs,damages, fines, settlements or judgments as a result of other risks and uncertainties described in this report, wemay not be able to increase or sustain our historical levels of profitability.
If our security measures are breached or unauthorized access to customer data is otherwise obtained, oursolutions may be perceived as not being secure, customers may reduce the use of or stop using our solutionsand we may incur significant liabilities.
Our solutions involve the storage and transmission of our customers’ proprietary information, includingpersonal or identifying information regarding their employees and the medical professionals whom their salespersonnel contact, sensitive proprietary data related to the regulatory submission process for new medicaltreatments, and other sensitive information. As a result, unauthorized access or security breaches as a result ofthird-party action, employee error, malfeasance or otherwise could result in the loss of information, litigation,indemnity obligations, damage to our reputation and other liability. Because the techniques used to obtainunauthorized access or sabotage systems change frequently and generally are not identified until they arelaunched against a target, we may be unable to anticipate these techniques or to implement adequate preventativemeasures. Any or all of these issues could adversely affect our ability to attract new customers, cause existingcustomers to elect to not renew their subscriptions, result in reputational damage or subject us to third-partylawsuits, regulatory fines or other action or liability, which could adversely affect our operating results. Ourinsurance may not be adequate to cover losses associated with such events, and in any case, such insurance maynot cover all of the types of costs, expenses and losses we could incur to respond to and remediate a securitybreach. A security breach of another significant provider of cloud-based solutions may also negatively impact thedemand for our solutions.
The markets in which we participate are highly competitive, and if we do not compete effectively, our businessand operating results could be adversely affected.
The markets for our solutions are highly competitive. Our multichannel customer relationship managementapplications compete with offerings from large global enterprise software vendors, such as Oracle Corporation,and also compete with life sciences-specific customer relationship management providers, such as IMS HealthHolding, Inc. We also compete with a number of vendors of cloud-based and on-premise customer relationshipmanagement applications that address only a portion of one of our customer relationship management solutions.Veeva Vault, our regulated content and information management solutions, competes with offerings from largeglobal content management platform vendors such as EMC Corporation, Microsoft Corporation and OpenTextCorporation. We also compete with professional services companies that provide solutions on these platforms,such as Computer Sciences Corporation, and with other life sciences specific providers. In the future, providersof horizontal cloud-based storage products may seek to compete with our regulated content and informationmanagement solutions. Our master data management solutions compete with master data software offerings fromvendors such as Informatica Corporation, IMS and other smaller providers. Our data and data services offeringscompete with IMS and many other data providers. We may also face competition from custom-built softwaredeveloped by third-party vendors or developed in-house by our potential customers, or from applications built byour customers or by third parties on behalf of our customers using commercially available software platformsthat are provided by third parties. We may also face competition from companies that provide cloud-basedsolutions in different target or horizontal markets that may develop applications or work with companies thatoperate in our target markets. With the introduction of new technologies and market entrants, we expectcompetition to intensify in the future.
17

In some cases, our competitors are well-established providers of competitive solutions and have long-standing relationships with many of our current and potential customers, including large pharmaceutical andemerging biopharmaceutical companies. Oracle, EMC and IMS, for example, each have name recognition, amuch longer operating history, larger marketing budgets and significantly greater resources than we do.
Many of our competitors may be able to devote greater resources to the development, promotion and sale oftheir products and services than we are able. Such competitors may be able to initiate or withstand substantialprice competition, and may offer solutions competitive to certain of our solutions on a stand-alone basis at alower price or bundled as part of a larger product sale, including the bundling of software solutions and data. Inaddition, many of our competitors have established marketing relationships, access to larger customer bases anddistribution agreements with consultants, system integrators and resellers that we do not have. Our competitorsmay also establish cooperative relationships among themselves or with third parties that may further enhancetheir product offerings or resources. In addition, in order to take advantage of customer demand for cloud-basedsolutions, such competitors may expand their cloud-based solutions through acquisitions and organicdevelopment or may seek to partner with other leading cloud providers. For instance, on April 1, 2015, IMSannounced that its acquisition of the information solutions and CRM businesses of Cegedim SA had closed. Thecombined entity is likely to intensely compete with us in a number of product areas, including software solutions,data and data services, and such competition may negatively impact our business.
If our competitors’ products, services or technologies become more accepted than our solutions, if they aresuccessful in bringing their products or services to market earlier than ours, if their products or services are moretechnologically capable than ours, or if customers replace our solutions with custom-built software, then ourrevenues could be adversely affected. Pricing pressures and increased competition could result in reduced sales,reduced margins, losses or a failure to maintain or improve our competitive market position, any of which couldadversely affect our business.
In our fiscal year ended January 31, 2016, we derived approximately 79% of our subscription servicesrevenues and 74% of our total revenues from our multichannel customer relationship managementapplications. Within multichannel customer relationship management, our core Veeva CRM application hasachieved substantial penetration within the sales teams of pharmaceutical and biotechnology companies. Ifour efforts to sustain or further increase the use and adoption of our customer relationship managementapplications do not succeed, the growth rate of our revenues may decline.
In our fiscal year ended January 31, 2016, we derived approximately 79% of our subscription servicesrevenues and 74% of our total revenues from our core sales automation solution, Veeva CRM, and the othermultichannel customer relationship management applications that are complementary to Veeva CRM. We haverealized substantial sales penetration of the available market for our core Veeva CRM application amongpharmaceutical and biotechnology companies. A critical factor for our continued growth is our ability to selladditional user subscriptions for Veeva CRM and the other multichannel customer relationship managementapplications that are complementary to Veeva CRM to our existing and new customers. Any factor adverselyaffecting sales of these applications—including substantial penetration of the available market for our core VeevaCRM application, reductions in user subscriptions due to acquisitions of or business combinations between ourcustomers or increased purchasing scrutiny which may result in reductions in user subscription or increasedpricing pressure—could adversely affect the growth rate of our sales, revenues, operating results and business.
If our newer solutions, including Veeva Vault, Veeva Network Customer Master, Veeva Network ProductMaster, Veeva’s data offerings and our newer multichannel customer relationship management applicationsthat complement Veeva CRM, are not successfully adopted by new and existing customers, the growth rate ofour revenues and operating results will be adversely affected.
Our continued growth and profitability will depend on our ability to successfully develop and sell newsolutions, including Veeva Vault, Veeva Network Customer Master, Veeva Network Product Master, Veeva’s
18

data offerings and our newer multichannel customer relationship management applications that complementVeeva CRM. These solutions were introduced relatively recently. Although combined revenues related to thesesolutions made up approximately 21% and 26% of our subscription services revenues and total revenues,respectively, in the year ended January 31, 2016 and the Veeva Vault solution, in particular, has begun to achievemarket acceptance, it is uncertain whether these solutions will continue to grow as a percentage of revenues at apace significant enough to support our expected growth. It may take us significant time, and we may incursignificant expense to effectively market and sell these solutions or to develop other new solutions and makeenhancements to our existing solutions. If our newer solutions do not continue to gain traction in the market, orother solutions that we may develop and introduce in the future do not achieve market acceptance in a timelymanner, the growth rate of our revenues and operating results may be adversely affected.
Our revenue from professional services fees is volatile and may not increase from quarter to quarter or at all.
We derive a significant portion of our revenue from professional services fees. Our professional servicesrevenues fluctuate from quarter to quarter as a result of the achievement of milestones in our professional servicesarrangements, and the requirements, complexity and timing of our customers’ implementation projects. Generally, acustomer’s ongoing need for professional services with respect to one or more of our solutions decreases as theimplementation and full deployment of such solutions is completed. In addition, we believe that the implementationprojects for some of our newer software solutions will require a lower level of professional services as compared tothe implementation projects for our Veeva CRM application. Our customers may also choose to use third partiesrather than us for certain professional services related to our solutions. As a result of these and other factors, ourprofessional services revenues may not increase on a quarterly basis in the future or at all.
Our subscription agreements with our customers are generally for a term of one year. If our existingcustomers do not renew their subscriptions annually, or do not buy additional solutions and user subscriptionsfrom us, or renew at lower fee levels, our business and operating results will suffer.
We derive a significant portion of our revenues from the renewal of existing subscription orders. The orderswe enter into with our customers for subscription services typically have a one-year term. Our customers have noobligation to renew their subscriptions for our solutions after their orders expire. Thus, securing the renewal ofour subscription orders and selling additional solutions and user subscriptions is critical to our future operatingresults. Factors that may affect the renewal rate for our solutions and our ability to sell additional solutions anduser subscriptions include:
• the price, performance and functionality of our solutions;
• the availability, price, performance and functionality of competing solutions and services;
• the effectiveness of our professional services;
• our ability to develop complementary solutions, applications and services;
• the stability, performance and security of our hosting infrastructure and hosting services; and
• the business environment of our customers and, in particular, acquisitions of or business combinationsbetween our customers or other business developments may result in reductions in user subscriptions.
In addition, our customers may negotiate terms less advantageous to us upon renewal, which may reduce ourrevenues from these customers. As a customer’s total spend on Veeva solutions increases, we expect purchasingscrutiny at renewal to increase as well, which may result in reductions in user subscriptions or increased pricingpressure. Other factors that are not within our control may contribute to a reduction in our subscription servicesrevenues. For instance, our customers may reduce their number of sales representatives, which would result in acorresponding reduction in the number of user subscriptions needed for some of our solutions and thus a loweraggregate renewal fee. If our customers fail to renew their subscription orders, renew their subscription orders uponless favorable terms or at lower fee levels, or fail to purchase new solutions, applications and professional servicesfrom us, our revenues may decline or our future revenues may be constrained.
19

The loss of one or more of our key customers, or their failure to renew or expand user subscriptions, couldslow the growth rate of our revenues or cause our revenues to decline.
In our fiscal years ended January 31, 2014, 2015 and 2016, our top 10 customers accounted for 56%, 54%and 50% of our total revenues, respectively. We rely on our reputation and recommendations from key customersin order to promote our solutions to potential customers. The loss of any of our key customers, or a failure of oneor more of them to renew or expand user subscriptions, could have a significant impact on the growth rate of ourrevenues, reputation and our ability to obtain new customers. In the event of an acquisition of one of our largestcustomers or a business combination between two of our largest customers, we may suffer reductions in usersubscriptions or non-renewal of our agreements. We are also likely to face increasing purchasing scrutiny atrenewal of these large customer contracts, which may result in reductions in user subscription or increasedpricing pressure. The business impact of any of these negative events is particularly pronounced as to our largestcustomers.
An inability to attract and retain highly skilled employees could adversely affect our business.
To execute our growth plan, we must attract and retain highly qualified personnel. Competition for thesepersonnel is intense, especially for engineers with high levels of experience in designing and developing softwareand internet-related services and senior sales executives. We have, from time to time, experienced, and we expectto continue to experience, difficulty in hiring and retaining employees with appropriate qualifications. Many ofthe companies with which we compete for experienced personnel have greater resources than we have. If we hireemployees from competitors or other companies, their former employers may attempt to assert that theseemployees or we have breached their legal obligations, resulting in a diversion of our time and resources. Inaddition, job candidates and existing employees often consider the value of the stock awards they receive inconnection with their employment. If the perceived value of our stock awards declines, it may adversely affectour ability to recruit and retain highly skilled employees. If we fail to attract new personnel or fail to retain andmotivate our current personnel, our business and future growth prospects could be adversely affected.
We may acquire other companies or technologies, which could divert our management’s attention, result inadditional dilution to our stockholders and otherwise disrupt our operations and adversely affect ouroperating results.
We have in the past acquired and may in the future seek to acquire or invest in businesses, solutions ortechnologies that we believe could complement or expand our solutions, enhance our technical capabilities orotherwise offer growth opportunities. For instance, we recently acquired the key opinion leader business andproducts of Qforma, Inc., Mederi AG and other affiliated entities through a combination of stock and assetpurchases. Further, on September 29, 2015, we completed our acquisition of Zinc Ahead, for a total closingconsideration of approximately $119.9 million in cash. In addition, the agreement calls for $10.0 million payableat a rate of one-third per year to employee shareholders and option holders of Zinc Ahead who remain employedwith us.
We have limited experience in acquiring other businesses. We may not be able to successfully integrate theacquired personnel, operations and technologies, or effectively manage the combined business following theacquisition. We also may not achieve the anticipated benefits from the acquired business due to a number offactors, including:
• inability to integrate or benefit from acquired technologies or services in a profitable manner;
• unanticipated costs or liabilities associated with the acquisition;
• incurrence of acquisition-related costs;
• difficulty integrating the accounting systems, operations and personnel of the acquired business;
• problems arising from differences in applicable accounting standards or practices of the acquiredbusiness (for instance, non-U.S. businesses, like the Zinc Ahead business, may not be accustomed to
20

preparing their financial statements in accordance with GAAP) or difficulty identifying and correctingdeficiencies in the internal controls over financial reporting of the acquired business;
• difficulties and additional expenses associated with supporting legacy products and hostinginfrastructure of the acquired business;
• difficulty converting the customers of the acquired business onto our solutions and contract terms,including disparities in the revenues, licensing, support or professional services model of the acquiredcompany;
• diversion of management’s attention from other business concerns;
• adverse effects to our existing business relationships with business partners and customers as a result ofthe acquisition;
• difficulty in retaining key personnel of the acquired business;
• the possibility of investigation by, or the failure to obtain required approvals from, governmentalauthorities on a timely basis, if at all, under various regulatory schemes, including competition laws,which could, among other things, delay or prevent us from completing a transaction, subject thetransaction to divestiture after a transaction, or otherwise restrict our ability to realize the expectedfinancial or strategic goals of the acquisition;
• use of resources that are needed in other parts of our business; and
• use of substantial portions of our available cash to consummate the acquisition.
In addition, a significant portion of the purchase price of companies we acquire may be allocated to acquiredgoodwill and other intangible assets, which must be assessed for impairment at least annually. In the future, ifour acquisitions do not yield expected returns, we may be required to take charges to our operating results basedon this impairment assessment process, which could adversely affect our results of operations. Acquisitions mayalso result in purchase accounting adjustments, write-offs and restructuring charges which may negatively affectour results.
Acquisitions could also result in dilutive issuances of equity securities or the incurrence of debt, whichcould adversely affect our operating results. In addition, if an acquired business fails to meet our expectations,our operating results, business and financial position may suffer.
Additionally, the pursuit of potential acquisitions may divert the attention of management and cause us toincur various expenses in identifying, investigating and pursuing suitable acquisitions, whether or not they areconsummated.
We have experienced rapid growth in recent periods, and if we fail to manage our growth effectively, we maybe unable to execute our business plan.
Since we were founded, we have experienced rapid growth and expansion of our operations. Our revenues,customer count, product and service offerings, employees, countries of operation, facilities and computinginfrastructure needs have all increased significantly and we expect them to increase in the future. Our rapidgrowth has placed, and will continue to place, a significant strain on our management capabilities, administrativeand operational infrastructure, facilities and other resources. If we are unable to anticipate the demands of ourgrowth or effectively manage our growth, our operating and financial results likely would be harmed.
Our agreement with salesforce.com imposes significant financial commitments on us which we may not beable to meet and which could negatively impact our financial results and liquidity in the future.
Our Veeva CRM application, and certain portions of the multichannel customer relationship managementapplications that complement our Veeva CRM application, are developed on and/or utilize the Salesforce1
21

Platform of salesforce.com, inc. Under our agreement, salesforce.com provides the hosting infrastructure anddata center for portions of our multichannel customer relationship management applications, as well as thesystem administration, configuration, reporting and other platform level functionality. In exchange, we paysalesforce.com a fee. Our agreement with salesforce.com requires that we meet minimum order commitments of$500 million over the term of the agreement, which ends on September 1, 2025, including “true-up” payments ifthe orders we place with salesforce.com have not equaled or exceeded the following aggregate amounts withinthe timeframes indicated: (i) $250 million from March 1, 2014 to September 1, 2020 and (ii) the full amount of$500 million by September 1, 2025. If we are not able to meet the minimum order commitments, the requiredtrue-up payments will negatively impact our margins, cash flows, cash balance and financial condition, and ourstock price may decline.
Substantially all of our revenues are generated by sales to customers in the life sciences industry, and factorsthat adversely affect this industry, including mergers within the life sciences industry, could also adverselyaffect us.
Substantially all of our sales are to customers in the life sciences industry. Demand for our solutions couldbe affected by factors that adversely affect the life sciences industry, including:
• The consolidation of companies or bankruptcies within the life sciences industry—Consolidationwithin the life sciences industry has accelerated in recent years, and this trend could continue. We maylose customers due to industry consolidation, and we may not be able to expand sales of our solutionsand services to new customers to replace lost customers. In addition, new companies that result fromsuch consolidation may decide that our solutions are no longer needed because of their own internalprocesses or the use of alternative solutions. As these entities consolidate, competition to providesolutions and services to industry participants will become more intense and the importance ofestablishing relationships with large industry participants will become greater. These industryparticipants may try to use their market power to negotiate price reductions for our solutions. Also, ifconsolidation of larger current customers occurs, the combined company may represent a largerpercentage of business for us and, as a result, we are likely to rely more significantly on the combinedcompany’s revenues to continue to achieve growth. Mergers of large life sciences companies have alsobeen discussed which, if consummated, would have the potential to reduce per unit pricing for oursolutions for the merged companies, or to reduce demand for one or more of our solutions as a result ofpotential personnel reductions over time. Additionally, our customers with potential treatments inclinical trials may be unsuccessful and may subsequently declare bankruptcy.
• The changing regulatory environment of the life sciences industry—Changes in regulations couldrequire us to expend significant resources in order to ensure that our solutions continue to meet thecompliance needs of our customers or could prevent our customers from using certain of our solutionsor certain functionality of our solutions.
• Changes in market conditions and practices within the life sciences industry—The expiration of keypatents, changes in the practices of prescribing healthcare professionals, changes with respect to payerrelationships, the policies and preferences of healthcare professionals and healthcare organizations withrespect to the sales and marketing efforts of life sciences companies, changes in the regulation of thesales and marketing efforts and pricing practices of life sciences companies, and other factors couldlead to a significant reduction in pharmaceutical sales representatives that use our solutions orotherwise change the demand for our solutions. Changes in public perception regarding the practices ofthe life sciences industry may result in political pressure to increase the regulation of life sciencescompanies in one or more of the areas described above, which may negatively impact demand for oursolutions.
• Changes in global economic conditions and changes in the global availability of healthcare treatmentsprovided by the life sciences companies to which we sell—Our business depends on the overalleconomic health of our existing and prospective customers. The purchase of our solutions may involve
22

a significant commitment of capital and other resources. If economic conditions, including the abilityto market life sciences products in key markets or the demand for life sciences products globallydeteriorates, many of our customers may delay or reduce their IT spending. This could result inreductions in sales of our solutions, longer sales cycles, reductions in subscription duration and value,slower adoption of new technologies and increased price competition.
Accordingly, our operating results and our ability to efficiently provide our solutions to life sciencescompanies and to grow or maintain our customer base could be adversely affected as a result of factors that affectthe life sciences industry generally.
If the third-party providers of healthcare reference data and prescription drug sales data do not allow ourcustomers to upload and use such data in our solutions, our business may be negatively impacted.
Many of our customers license healthcare professional and healthcare organization data and data regardingthe sales of prescription drugs from third parties such as IMS. In order for our customers to upload such data tothe Veeva CRM and Veeva Network Customer Master solutions, such third-party data providers typically mustconsent to such uploads and often require that we enter into agreements regarding our obligations with respect tosuch data, which include confidentiality obligations and intellectual property rights with respect to such third-party data. We have experienced delays and difficulties in our negotiations with such third-party data providersin the past and we expect to experience difficulties in the future. For instance, IMS currently will not consent toits healthcare professional or healthcare organization data being uploaded to Veeva Network Customer Master. Ifsuch third-party data providers do not consent to the uploading and use of their data in our solutions, delayconsent or fail to offer reasonable conditions for the upload and use of such data in our solutions, our salesefforts, solution implementations and productive use of our solutions by customers may be harmed, and, in turn,our business may be negatively impacted.
Our solutions address heavily regulated functions within the life sciences industry, and failure to comply withapplicable laws and regulations could lessen the demand for our solutions or subject us to significant claimsand losses.
Our customers use our solutions for business activities that are subject to a complex regime of global lawsand regulations, including requirements for maintenance of electronic records and electronic signatures (as setforth in 21 CFR Part 11, EU GMP Annex 11, and Japan PFSB 0401022), requirements regarding drug sampletracking and distribution (as set forth in 21 CFR Part 203, EU Directive 201/83/EC Article 96), and other lawsand regulations. Our solutions are expected to be capable of use by our customers in compliance with such lawsand regulations. Our efforts to provide solutions that comply with such laws and regulations are time-consumingand costly, and include validation procedures that may delay the release of new versions of our solutions. Asthese laws and regulations change over time, we may find it difficult to adjust our solutions to comply with suchchanges. In addition, as we increase the number of products we offer, the complexity of adjusting our solutions tocomply with legal and regulatory changes will increase. If we are unable to effectively manage this increase or ifwe are not able to provide solutions that can be used in compliance with applicable laws and regulations,customers may be unwilling to use our solutions and any such non-compliance could result in the termination ofour customer agreements or claims arising from such agreements with our customers.
Additionally, any failure of our customers to comply with laws and regulations applicable to the functionsfor which our solutions are used could result in fines, penalties or claims for substantial damages against ourcustomers that may harm our business or reputation. If such failure were allegedly caused by our solutions orservices, our customers may make a claim for damages against us, regardless of our responsibility for the failure.We may be subject to lawsuits that, even if unsuccessful, could divert our resources and our management’sattention and adversely affect our business, and our insurance coverage may not be sufficient to cover suchclaims against us.
23

Our sales cycles can be long and unpredictable, and our sales efforts require considerable investment of timeand expense. If our sales cycle lengthens or we invest substantial resources pursuing unsuccessful salesopportunities, our operating results and growth would be harmed.
Our sales process entails planning discussions with prospective customers, analyzing their existing solutionsand identifying how these potential customers can use and benefit from our solutions. The sales cycle for a newcustomer, from the time of prospect qualification to the completion of the first sale, may span over 12 months orlonger. In particular, we have limited history selling to the research and development departments of life sciencescompanies, yet many of our newer solutions, including certain Veeva Vault applications, were developed totarget the research and development function. As a result, our sales cycle for these solutions may be lengthy anddifficult to predict. We spend substantial time, effort and money in our sales efforts without any assurance thatour efforts will result in the sale of our solutions. In addition, our sales cycle can vary substantially fromcustomer to customer because of various factors, including the discretionary nature of potential customers’purchasing and budget decisions, the announcement or planned introduction of new solutions by us or ourcompetitors and the purchasing approval processes of potential customers. If our sales cycle lengthens or weinvest substantial resources pursuing unsuccessful sales opportunities, our operating results and growth would beharmed.
Defects or disruptions in our solutions could result in diminishing demand for our solutions, a reduction inour revenues and subject us to substantial liability.
We generally release updates to our solutions three times per year. These updates may contain undetectederrors when first introduced or released. We have from time to time found defects in our solutions, and newerrors in our existing solutions may be detected in the future. Since our customers use our solutions for importantaspects of their business, any errors, defects, disruptions or other performance problems with our solutions couldhurt our reputation and may damage our customers’ businesses. If that occurs, our customers may delay orwithhold payment to us, cancel their agreements with us, elect not to renew, make service credit claims, warrantyclaims or other claims against us, and we could lose future sales. The occurrence of any of these events couldresult in diminishing demand for our solutions, a reduction of our revenues, an increase in our bad debt expense,an increase in collection cycles for accounts receivable, require us to increase our warranty provisions, or incurthe expense of litigation or substantial liability.
We depend on data centers and computing infrastructure operated by third parties for our cloud solutions, andany disruption in these operations could adversely affect our business and subject us to liability.
Our commercial solutions are hosted from data centers operated by third parties, including salesforce.comwith respect to our solutions related to Veeva CRM. We do not control the operation of these facilities. Theowners of our non-salesforce.com data centers have no obligation to renew their agreements with us oncommercially reasonable terms, or at all. If we are unable to renew these agreements on commercially reasonableterms, or if one of our data center operators is acquired, we may be required to transfer our servers and otherinfrastructure to new data center facilities, and we may incur significant costs and possible service interruption inconnection with doing so.
In addition, we use Amazon Web Services, which provides a scalable, distributed computing and storageinfrastructure platform for certain computing and data intensive functions of our solutions, such as analyticreporting, large data set manipulation and redundant storage. Given this, along with the fact that we cannot easilyswitch our Amazon Web Services operations to another cloud provider, any disruption of or interference with ouruse of Amazon Web Services would impact our operations and our business could be adversely impacted.
Problems faced by our third-party data center locations, including those operated by salesforce.com,Amazon Web Services or other providers could adversely affect the experience of our customers. The operatorsof the data centers could decide to close their facilities without adequate notice. In addition, any financialdifficulties, such as bankruptcy, faced by the operators of the data centers or any of the service providers with
24

whom we or they contract may have negative effects on our business, the nature and extent of which are difficultto predict. Additionally, if our data centers, Amazon Web Services or other providers are unable to keep up withour growing needs for capacity, this could have an adverse effect on our business. For example, a rapidexpansion of our business could affect the service levels at our data centers or cause such data centers andsystems to fail. Any changes in third-party service levels at our data centers, Amazon Web Services or otherproviders or any disruptions or other performance problems with our solutions could adversely affect ourreputation and may damage our customers’ stored files or result in lengthy interruptions in our services orpotential losses of customer data. Interruptions in our services might reduce our revenues, cause us to issuerefunds to customers for prepaid and unused subscriptions, subject us to potential liability or adversely affect ourrenewal rates.
If we fail to effectively manage our technical operations infrastructure, our existing customers mayexperience service outages and our new customers may experience delays in the deployment of our solutions.
We have experienced significant growth in the number of users, transactions and data that our operationsinfrastructure supports. We seek to maintain sufficient excess capacity in our operations infrastructure to meetthe needs of all of our customers. We also seek to maintain excess capacity to facilitate the rapid provision ofnew customer deployments and the expansion of existing customer deployments. In addition, we need to properlymanage our technological operations infrastructure in order to support version control, changes in hardware andsoftware parameters and the evolution of our solutions. However, the provision of new hosting infrastructurerequires adequate lead-time. We have experienced, and may in the future experience, website disruptions,outages and other performance problems. These types of problems may be caused by a variety of factors,including infrastructure changes, human or software errors, viruses, security attacks, fraud, spikes in customerusage, problems associated with our third-party data center and network providers and denial of service issues. Insome instances, we may not be able to identify the cause or causes of these performance problems within anacceptable period of time. It is also possible that such problems could result in losses of customer data. If we donot accurately predict our infrastructure requirements, our existing customers may experience delays in thedeployment of our solutions or service outages that may subject us to financial penalties, financial liabilities andcustomer losses. For instance, our customer agreements typically provide service level commitments on aquarterly basis. If we are unable to meet the stated service level commitments or suffer extended periods ofunavailability for our solutions, we may be contractually obligated to provide these customers with servicecredits or our customers may terminate their agreements. Any extended service outages could adversely affectour reputation, revenues and operating results.
Catastrophic events could disrupt our business and adversely affect our operating results.
Our corporate headquarters are located in Pleasanton, California and our third-party hosted data centers arelocated in the United States, the European Union and Japan. The west coast of the United States and Japan eachcontains active earthquake zones. Additionally, we rely on our network and third-party infrastructure andenterprise applications, internal technology systems and our website for our development, marketing, operationalsupport, hosted services and sales activities. In the event of a major earthquake, hurricane or catastrophic eventsuch as fire, power loss, telecommunications failure, cyber-attack, war or terrorist attack, we may be unable tocontinue our operations and may endure system interruptions, reputational harm, delays in our solutiondevelopment, lengthy interruptions in our services, breaches of data security and loss of critical data, all of whichcould have an adverse effect on our future operating results.
Because key and substantial portions of our multichannel customer relationship management applications arebuilt on salesforce.com’s Salesforce1 Platform, we are dependent upon our agreement with salesforce.com toprovide these solutions to our customers.
Our Veeva CRM application and certain portions of the multichannel customer relationship managementapplications that complement our Veeva CRM application are developed on or utilize the Salesforce1 Platform of
25

salesforce.com, inc., and we rely on our agreement with salesforce.com to continue to use the Salesforce1Platform as combined with the proprietary aspects of our multichannel customer relationship managementapplications.
Our agreement with salesforce.com expires on September 1, 2025. However, salesforce.com has the right toterminate the agreement in certain circumstances, including in the event of a material breach of the agreement byus, or that salesforce.com is subjected to third-party intellectual property infringement claims based on oursolutions (except to the extent based on the Salesforce1 Platform) or our trademarks and we do not remedy suchinfringement in accordance with the agreement. Also, if we are acquired by specified companies, salesforce.commay terminate the agreement upon notice of not less than 12 months. If salesforce.com terminates our agreementunder these circumstances, our customers will be unable to access Veeva CRM and certain other of ourmultichannel customer relationship management applications. A termination of the agreement would cause us toincur significant time and expense to acquire rights to, or develop, a replacement customer relationshipmanagement platform and we may not be successful in these efforts. Even if we were to successfully acquire ordevelop a replacement customer relationship management platform, some customers may decide not to adopt thereplacement platform and may decide to use a different customer relationship management solution. If we wereunsuccessful in acquiring or developing a replacement customer relationship management platform or acquiredor developed a replacement customer relationship management platform that our customers do not adopt, ourbusiness, operating results and brand may be adversely affected.
Also, if either party elects not to renew the agreement at the end of its September 1, 2025 term or if theagreement is terminated by us as a result of salesforce.com’s breach, the agreement provides for a five-yearwind-down period in which we would be able to continue providing the Salesforce1 Platform as combined withthe proprietary aspects of our solutions to our existing customers but would be limited with respect to the numberof additional subscriptions we could sell to our existing customers. After the wind-down period, we would nolonger be able to use the Salesforce1 Platform.
Our agreement with salesforce.com provides that we can use the Salesforce1 Platform as combined with ourproprietary Veeva CRM application to sell sales automation solutions only to drug makers in the pharmaceuticaland biotechnology industries for human and animal treatments, which does not include the medical devicesindustry or products for non-drug departments of pharmaceutical and biotechnology companies. Sales of theSalesforce1 Platform in combination with our Veeva CRM application to additional industries would require thereview and approval of salesforce.com. Our inability to freely sell our Veeva CRM application outside of drugmakers in the pharmaceutical and biotechnology industries may adversely impact our growth.
While our agreement with salesforce.com, subject to certain exceptions, provides that salesforce.com willnot position, develop, promote, invest in or acquire applications directly competitive to the Veeva CRMapplication for sales automation that directly target drug makers in the pharmaceutical and biotechnologyindustry, or the pharma/biotech industry, our remedy for a breach of this commitment by salesforce.com wouldbe to terminate the agreement, or continue the agreement but be released from our minimum order commitmentsfrom the date of salesforce.com’s breach forward. While our agreement with salesforce.com also restrictssalesforce.com from competing with us with respect to sales opportunities for sales automation solutions for thepharma/biotech industry unless such competition has been pre-approved by salesforce.com’s senior managementbased on certain criteria specified in the agreement, and imposes certain limits on salesforce.com from enteringinto arrangements similar to ours with other parties with respect to sales automation applications for the pharma/biotech industry, it does not restrict a salesforce.com customer’s ability (or the ability of salesforce.com onbehalf of a specific salesforce.com customer) to customize or configure the Salesforce1 Platform. Some currentor potential customers of ours may choose to build custom solutions using the Salesforce1 Platform rather thanbuying our solutions.
26

We employ third-party licensed software and software components for use in or with our solutions, and theinability to maintain these licenses or the presence of errors in the software we license could limit thefunctionality of our products and result in increased costs or reduced service levels, which would adverselyaffect our business.
In addition to our employment of the Salesforce1 Platform through our agreement with salesforce.com, oursolutions incorporate or utilize certain third-party software and software components obtained under licensesfrom other companies. We anticipate that we will continue to rely on such third-party software and developmenttools from third parties in the future. Although we believe that there are commercially reasonable alternatives tothe third-party software we currently license, this may not always be the case, or it may be difficult or costly toreplace. Our use of additional or alternative third-party software would require us to enter into licenseagreements with third parties. In addition, if the third-party software we utilize has errors or otherwisemalfunctions, the functionality of our solutions may be negatively impacted and our business may suffer.
Our growth depends in part on the success of our relationships with third parties.
In order to grow our business, we anticipate that we will continue to depend on relationships with thirdparties, such as deployment partners, and technology and content providers. Identifying partners, and negotiatingand documenting relationships with them, requires significant time and resources. Our competitors may beeffective in providing incentives to third parties to favor their products or services or to prevent or reducesubscriptions to our services. In addition, acquisitions of our partners by our competitors could result in adecrease in the number of our current and potential customers, as our partners may no longer facilitate theadoption of our solutions by potential customers. If we are unsuccessful in establishing or maintaining ourrelationships with third parties, our ability to compete in the marketplace or to grow our revenues could beimpaired and our operating results may suffer. Even if we are successful, we cannot assure you that theserelationships will result in increased customer usage of our solutions or increased revenues.
Increasingly complex data protection and privacy regulations are burdensome, may reduce demand for oursolutions, and non-compliance may impose significant liabilities
Our customers can use our solutions to collect, use, process and store personal data or identifyinginformation regarding their employees and the medical professionals with whom our customers have contact,and, potentially, personal data (including potentially sensitive data such as health information) regarding patientsmaintained by our customers pursuant to clinical, operational or compliance processes. In this capacity, we act asthe data processor. We also collect and sell a database, via our OpenData and KOL Data product lines, for whichwe are the data controller. In many countries, national and local governmental bodies have adopted, areconsidering adopting, or may adopt laws and regulations regarding the collection, use, processing, storage anddisclosure of personal information obtained from individuals, making compliance a complex task.
In the United States, for instance, the U.S. Department of Health and Human Services promulgated patientprivacy rules under the Health Insurance Portability and Accountability Act (HIPAA) of 1996, that protectmedical records and other personal health information by limiting their use and disclosure, giving individuals theright to access, amend, and seek accounting of their own health information and limiting most use anddisclosures of health information to the minimum amount reasonably necessary to accomplish the intendedpurposes. Operating under one of the world’s strictest data privacy regimes, Veeva is a registered Data Controllerand Data Processor under EU Data Protection Directive 95/46/EC and is in the process of preparing its readinessunder the General Data Protection Regulation (GDPR) reform expected to enter into force in 2018. While wewere previously self-certified on an annual basis under the now invalid EU-U.S. and Swiss-U.S. Safe Harborframeworks, we routinely utilize the EU Standard Contractual Clauses, often also referred to as Model Clauses,to ensure that our European customers have adequate assurance of our technical and organization controls onprivacy and monitor developments of the EU-U.S. Privacy Shield in order to legally facilitate international datatransfers. There is also a trend toward countries enacting data localization requirements which are not particularly
27
compatible with the cloud computing model. For example, Russia’s localization law (Federal Law No. 242-FZ)requires that the source of data for Russian nationals collected on Russian territory must be stored in Russia.
Customers expect that our solutions can be used in compliance with such laws and regulations. Thefunctional and operational requirements and costs of compliance with such laws and regulations may adverselyimpact our business, and failure to enable our solutions to comply with such laws and regulations could lead tosignificant fines and penalties imposed by regulators, as well as claims by our customers or third parties.Additionally, all of these domestic and international legislative and regulatory initiatives could adversely affectour customers’ ability or desire to collect, use, process and store personal or health-related information using oursolutions or to license data products from us, which could reduce demand for our solutions.
The software industry changes rapidly as a result of technological and product developments, which mayrender our solutions less desirable. If we are unable or unsuccessful in enhancing our solutions in response totechnological developments, our revenues and operating results could be adversely affected.
The software industry is subject to rapid technological change. The introduction of new technologies in thesoftware industry, including mobile technologies, will continue to have a significant effect on competitiveconditions in the life sciences industry. We may not be able to develop and introduce new solutions andenhancements to our existing solutions that respond to technological changes on a timely basis. If we are unableto develop and sell new solutions that provide utility to our customers and provide enhancements and newfeatures for our existing solutions that keep pace with rapid technological and regulatory change, our revenuesand operating results could be adversely affected.
Deferred revenue and change in deferred revenue may not be an accurate indicator of our future financialresults.
Our subscription orders are generally billed beginning at the subscription commencement date in annual orquarterly increments. Many of our customers, including many of our large customers, are billed on a quarterlybasis and therefore a substantial portion of the value of contracts billed on a quarterly basis will not be reflectedin our deferred revenue at the end of any given quarter. Also, because the terms of orders for additional users orsolutions are typically co-terminus with the related subscription agreements, the terms of these agreements foradditional users or solutions can be for relatively short periods of time and less than one year and payment termsmay also be quarterly. Therefore, the annualized value of such orders that we enter into with our customers willnot be completely reflected in deferred revenue at any single point in time. We have also agreed from time totime and may agree in the future to allow customers to change the renewal dates of their orders to, for example,align more closely with a customer’s annual budget process or to align with the renewal dates of other ordersplaced by other entities within the same corporate control group. Such changes typically result in an order of lessthan one year as necessary to align all orders to the desired renewal date and, thus, may result in a lesser increaseto deferred revenue than if the renewal date adjustment had not occurred. Accordingly, we do not believe thatchange in deferred revenue or calculated billings, a metric commonly cited by financial analysts that is the sumof the change in deferred revenue plus revenue, are accurate indicators of future revenues for any given period oftime. However, many companies that provide cloud-based software report changes in deferred revenue orcalculated billings as key operating or financial metrics, and it is possible that analysts or investors may viewthese metric as important. Thus, any changes in our deferred revenue balances or deferred revenue trends couldadversely affect the market price of our Class A common stock.
Because we recognize subscription services revenues over the term of the agreements for our subscriptions, asignificant downturn in our business may not be reflected immediately in our operating results, whichincreases the difficulty of evaluating our future financial performance.
We generally recognize revenues ratably over the terms of orders under our subscription agreements, whichare typically one year. As a result, a substantial majority of our quarterly subscription services revenues are
28
generated from subscription agreements entered into during prior periods. Consequently, a decline in newsubscriptions in any quarter may not affect our results of operations in that quarter, but could reduce our revenuesin future quarters. Additionally, the timing of renewals or non-renewals of a subscription agreement during anyquarter may only affect our financial performance in future quarters. For example, the non-renewal of asubscription agreement late in a quarter will have minimal impact on revenues for that quarter but will reduce ourrevenues in future quarters. Accordingly, the effect of significant declines in sales and customer acceptance ofour solutions may not be reflected in our short-term results of operations, which would make these reportedresults less indicative of our future financial results. By contrast, a non-renewal occurring early in a quarter mayhave a significant negative impact on revenues for that quarter and we may not be able to offset a decline inrevenues due to non-renewal with revenues from new subscription agreements entered into in the same quarter.In addition, we may be unable to adjust our costs in response to reduced revenues.
Sales to customers outside the United States or with international operations expose us to risks inherent ininternational sales.
In our fiscal year ended January 31, 2016, sales to customers outside North America, as measured by theestimated location of the end users for subscription services revenues and the estimated location of the users forwhich the services were performed for professional services revenues, accounted for approximately 45% of our totalrevenues. A key element of our growth strategy is to further expand our international operations and worldwidecustomer base. Operating in international markets requires significant resources and management attention andsubjects us to regulatory, economic and political risks that are different from those in the United States. We havelimited operating experience in some international markets, and we cannot assure you that our expansion efforts intoother international markets will be successful. Our experience in the United States and other international markets inwhich we already have a presence may not be relevant to our ability to expand in other emerging markets. Ourinternational expansion efforts may not be successful in creating further demand for our solutions outside of theUnited States or in effectively selling our solutions in the international markets we enter. In addition, we face risksin doing business internationally that could adversely affect our business, including:
• the need and expense to localize and adapt our solutions for specific countries, including translationinto foreign languages, and ensuring that our solutions enable our customers to comply with local lifesciences industry laws and regulations;
• data privacy laws which require that customer data be stored and processed in a designated territory;
• difficulties in staffing and managing foreign operations, including employee laws and regulations;
• different pricing environments, longer sales cycles and longer accounts receivable payment cycles andcollections issues;
• new and different sources of competition;
• weaker protection for intellectual property and other legal rights than in the United States and practicaldifficulties in enforcing intellectual property and other rights outside of the United States;
• laws and business practices favoring local competitors;
• compliance challenges related to the complexity of multiple, conflicting and changing governmentallaws and regulations, including employment, tax, privacy and data protection, and anti-bribery lawsand regulations;
• increased financial accounting and reporting burdens and complexities;
• restrictions on the transfer of funds;
• our ability to repatriate funds from abroad without adverse tax consequences;
• adverse tax consequences, including the potential for required withholding taxes; and
• unstable regional and economic political conditions.
29

Some of our business partners also have international operations and are subject to the risks describedabove. Even if we are able to successfully manage the risks of international operations, our business may beadversely affected if our business partners are not able to successfully manage these risks, which could adverselyaffect our business.
We are subject to governmental export and import controls that could impair our ability to compete ininternational markets or subject us to liability if we violate the controls.
Our products are subject to U.S. export controls, including the U.S. economic sanctions laws and regulationsthat prohibit the shipment of certain products and services without the required export authorizations or export tocountries, governments, and persons targeted by U.S. sanctions. While we take precautions to prevent ourproducts and services from being exported in violation of these laws, we cannot guarantee that the precautionswe take will prevent violations of export control and sanctions laws. Violations of U.S. sanctions or exportcontrol laws can result in fines or penalties. In the event of criminal knowing and willful violations of these laws,fines and possible incarceration for responsible employees and managers could be imposed.
Currency exchange fluctuations may negatively impact our financial results.
Some of our international agreements provide for payment denominated in local currencies, and themajority of our local costs are denominated in local currencies. As we continue to expand our operations incountries outside the United States, an increasing proportion of our revenues and expenditures in the future maybe denominated in foreign currencies. Fluctuations in the value of the U.S. dollar and foreign currencies mayimpact our operating results when translated into U.S. dollars. Thus, our results of operations and cash flows aresubject to fluctuations due to changes in foreign currency exchange rates, particularly changes in the Euro,British Pound Sterling, Japanese Yen and Chinese Yuan. Changes in exchange rates may negatively affect ourrevenues and other operating results as expressed in U.S. dollars in the future. Further, we have experienced andwill continue to experience fluctuations in our net income as a result of transaction gains or losses related torevaluing certain current asset and current liability balances that are denominated in currencies other than thefunctional currency of the entities in which they are recorded.
While we have not engaged in the hedging of our foreign currency transactions to date, we are currentlyevaluating the costs and benefits of initiating such a program and may, in the future, hedge selected significanttransactions or net monetary exposure positions denominated in currencies other than the U.S. dollar.
If we lose the services of our founder and Chief Executive Officer or other members of our seniormanagement team, we may not be able to execute our business strategy.
Our success depends in a large part upon the continued service of our senior management team. Inparticular, our founder and Chief Executive Officer, Peter P. Gassner, is critical to our vision, strategic direction,culture, products and technology. We do not maintain key-man insurance for Mr. Gassner or any other memberof our senior management team. We do not have employment agreements with members of our seniormanagement team or other key personnel that require them to continue to work for us for any specified periodand, therefore, they could terminate their employment with us at any time. The loss of our founder and ChiefExecutive Officer or one or more other members of our senior management team could have an adverse effect onour business.
Failure to adequately expand our sales and marketing teams and capabilities will impede our growth.
We will need to continue to expand and optimize our sales and marketing infrastructure in order to grow ourcustomer base and our business. We plan to continue to expand our sales and marketing teams, both domesticallyand internationally. Identifying and recruiting qualified personnel and training them in the use of our softwarerequires significant time, expense and attention. It can take six to nine months or longer before our sales
30

representatives are fully trained and productive. Our business may be adversely affected if our efforts to expandand train our sales and marketing teams do not generate a corresponding increase in revenues. In particular, if weare unable to hire, develop and retain talented sales or marketing personnel or if new direct sales personnel areunable to achieve desired productivity levels in a reasonable period of time, we may not be able to realize theexpected benefits of this investment or increase our revenues.
Our business could be adversely affected if our customers are not satisfied with the professional servicesprovided by us or our partners, or with our technical support services.
Our business depends on our ability to satisfy our customers, both with respect to our solutions and theprofessional services that are performed in connection with the implementation of our solutions. Professionalservices may be performed by us, by a third party, or by a combination of the two. If a customer is not satisfiedwith the quality of work performed by us or a third party or with the solutions delivered or professional servicesrendered, then we could incur additional costs to address the situation, we may be required to issue credits orrefunds for pre-paid amounts related to unused services, the profitability of that work might be impaired and thecustomer’s dissatisfaction with our services could damage our ability to expand the number of solutionssubscribed to by that customer. Moreover, negative publicity related to our customer relationships, regardless ofits accuracy, may further damage our business by affecting our ability to compete for new business with currentand prospective customers.
Once our solutions are deployed, our customers depend on our support organization to resolve technicalissues relating to our solutions. We may be unable to respond quickly enough to accommodate short-termincreases in customer demand for technical support services. Increased customer demand for our services,without corresponding revenues, could increase costs and adversely affect our operating results. In addition, oursales process is highly dependent on the reputation of our solutions and business and on positiverecommendations from our existing customers. Any failure to maintain high-quality technical support, or amarket perception that we do not maintain high-quality support, could adversely affect our reputation, our abilityto sell our solutions to existing and prospective customers and our business and operating results.
Any failure to protect our intellectual property rights could impair our ability to protect our proprietarytechnology and our brand.
Our success and ability to compete depend in part upon our intellectual property. We have filed applicationsfor a number of patents, but, to date, we have only three issued patents. We currently rely primarily on copyright,trade secret and trademark laws, trade secret protection and confidentiality or license agreements with ouremployees, customers, partners and others to protect our intellectual property rights. However, the steps we taketo protect our intellectual property rights may be inadequate.
In order to protect our intellectual property rights, we may be required to spend significant resources tomonitor and protect these rights. Litigation brought to protect and enforce our intellectual property rights couldbe costly, time-consuming and distracting to management and could result in the impairment or loss of portionsof our intellectual property. Furthermore, our efforts to enforce our intellectual property rights may be met withdefenses, counterclaims and countersuits attacking the validity and enforceability of our intellectual propertyrights. Negative publicity related to a decision by us to initiate such enforcement actions against a customer orformer customer, regardless of its accuracy, may adversely impact our other customer relationships orprospective customer relationships, harm our brand and business and could cause the market price of our Class Acommon stock to decline. Our failure to secure, protect and enforce our intellectual property rights couldadversely affect our brand and our business.
We may be sued by third parties for alleged infringement of their proprietary rights.
There is considerable patent and other intellectual property development activity in our industry. Ourcompetitors, as well as a number of other entities and individuals, including so-called non-practicing entities, or
31

NPEs, may own or claim to own intellectual property relating to our solutions. From time to time, third partiesmay claim that we are infringing upon their intellectual property rights, and we may be found to be infringingupon such rights. For example, from August 2013 to November 2014, we were a defendant in a lawsuit filed byProlifiq Software, Inc. (Prolifiq) in which Prolifiq alleged patent infringement and trade secretmisappropriation. The Prolifiq lawsuit was settled in November 2014, and involved a payment to Prolifiq by usin exchange for a license to certain asserted patents. We are also currently responding to a letter from an NPEasserting patent infringement. In the future, we expect others to claim that our solutions and underlyingtechnology infringe or violate their intellectual property rights. We may be unaware of the intellectual propertyrights that others may claim cover some or all of our technology or services. Any claims or litigation could causeus to incur significant expenses and, if successfully asserted against us, could require that we pay substantialdamages or ongoing royalty payments, prevent us from offering our services, or require that we comply withother unfavorable terms. We may also be obligated to indemnify our customers or business partners or paysubstantial settlement costs, including royalty payments, in connection with any such claim or litigation and toobtain licenses, modify applications or refund fees, which could be costly. Even if we were to prevail in such adispute, any litigation regarding our intellectual property could be costly and time-consuming and divert theattention of our management and key personnel from our business operations.
If we fail to develop widespread brand awareness cost-effectively, our business may suffer.
We believe that developing and maintaining widespread awareness of our brand in a cost-effective manneris critical to achieving widespread acceptance of our solutions, attracting new customers, and generating andmaintaining profitability. Brand promotion activities may not generate customer awareness or increase revenues,and even if they do, any increase in revenues may not offset the expenses we incur in building our brand. If wefail to successfully promote and maintain our brand, or incur substantial expenses, we may fail to attract or retaincustomers necessary to realize a sufficient return on our brand-building efforts, or to achieve the widespreadbrand awareness that is critical for broad customer adoption of our solutions.
Our solutions utilize open source software, and any failure to comply with the terms of one or more of theseopen source licenses could adversely affect our business.
Our solutions include software covered by open source licenses. The terms of various open source licenseshave not been interpreted by U.S. courts, and there is a risk that such licenses could be construed in a manner thatimposes unanticipated conditions or restrictions on our ability to market our solutions. By the terms of certain opensource licenses, we could be required to release the source code of our proprietary software, and to make ourproprietary software available under open source licenses, if we combine our proprietary software with open sourcesoftware in a certain manner. In the event that portions of our proprietary software are determined to be subject to anopen source license, we could be required to publicly release the affected portions of our source code, re-engineerall or a portion of our solutions, or otherwise be limited in the licensing of our solutions, each of which could reduceor eliminate the value of our solutions and services. In addition to risks related to license requirements, usage ofopen source software can lead to greater risks than use of third-party commercial software, as open source licensorsgenerally do not provide warranties or controls on the origin of the software. Many of the risks associated withusage of open source software cannot be eliminated and could adversely affect our business.
Our estimate of the market size for our solutions we have provided publicly may prove to be inaccurate, andeven if the market size is accurate, we cannot assure you our business will serve a significant portion of themarket.
Our estimate of the market size for our solutions we have provided publicly, sometimes referred to as totaladdressable market or TAM, is subject to significant uncertainty and is based on assumptions and estimates,including our internal analysis and industry experience, which may not prove to be accurate. These estimates are,in part, based upon the size of the general application areas in which our solutions are targeted. Our ability toserve a significant portion of this estimated market is subject to many factors, including our success in
32

implementing our business strategy, which is subject to many risks and uncertainties. For example, in order toaddress the entire TAM we have identified, we must continue to enhance and add functionality to our existingsolutions and introduce new solutions. Accordingly, even if our estimate of the market size is accurate, we cannotassure you that our business will serve a significant portion of this estimated market for our solutions.
If we are unable to implement and maintain effective internal controls over financial reporting, investors maylose confidence in the accuracy and completeness of our financial reports and the market price of our Class Acommon stock could be adversely affected.
As a public company, we are required to maintain internal controls over financial reporting and to report anymaterial weaknesses in such internal controls. Section 404 of the Sarbanes-Oxley Act of 2002 (Sarbanes-OxleyAct) requires that we evaluate and determine the effectiveness of our internal controls over financial reportingand provide a management report on internal controls over financial reporting. The Sarbanes-Oxley Act alsorequires that our management report on internal controls over financial reporting be attested to by ourindependent registered public accounting firm.
During our assessment of internal control over financial reporting as of January 31, 2016, we identified amaterial weakness in the internal controls related to our review of the inputs to the valuation of acquiredintangible assets. We are working to remediate the material weakness. For more information about the materialweakness and our remediation efforts, see Item 9A. “Controls and Procedures.” Although we plan to completethis remediation process as quickly as possible, we cannot at this time estimate how long it will take, and ourefforts may not be successful in remediating the material weakness. As part of the remediation process, we mayincur additional costs in improving our internal control over financial reporting.
Many of the internal controls we have implemented pursuant to the Sarbanes-Oxley Act are process controlswith respect to which a material weakness may be found whether or not any error has been identified in ourreported financial statements. This may be confusing to investors and result in damage to our reputation, whichmay harm our business. Additionally, the proper design and assessment of internal controls over financialreporting are subject to varying interpretations, and, as a result, application in practice may evolve over time asnew guidance is provided by regulatory and governing bodies and as common practices evolve. This could resultin continuing uncertainty regarding the proper design and assessment of internal controls over financial reportingand higher costs necessitated by ongoing revisions to internal controls.
We must continue to monitor and assess our internal control over financial reporting. If we are unable tosuccessfully remediate the material weakness previously identified and we undertake another future materialacquisition, we may not detect errors on a timely basis and our financial statements may be materially misstated.If in the future we have additional material weaknesses, we may not detect errors on a timely basis and ourfinancial statements may be materially misstated. If we are unable to successfully remediate the materialweakness previously identified or if in the future we identify additional material weaknesses in our internalcontrols over financial reporting, are unable to comply with the requirements of Section 404 of the Sarbanes-Oxley Act in a timely manner, are unable to assert that our internal controls over financial reporting are effective,or if our independent registered public accounting firm is unable to express an opinion as to the effectiveness ofour internal controls over financial reporting, investors may lose confidence in the accuracy and completeness ofour financial reports and the market price of our Class A common stock could be adversely affected, and wecould become subject to investigations by the stock exchange on which our securities are listed, the Securitiesand Exchange Commission (SEC), or other regulatory authorities, which could require additional financial andmanagement resources.
We have incurred and will continue to incur significantly increased costs and devote substantial managementtime as a result of operating as a public company.
As a public company, we have incurred and will continue to incur significant legal, accounting and otherexpenses that we did not incur as a private company. For example, we are subject to the reporting requirements
33

of the Securities Exchange Act of 1934, as amended (Exchange Act), and are required to comply with theapplicable requirements of the Sarbanes-Oxley Act and the Dodd-Frank Wall Street Reform and ConsumerProtection Act, as well as rules and regulations subsequently implemented by the SEC and the New York StockExchange, including the establishment and maintenance of effective disclosure and financial controls andchanges in corporate governance practices. Compliance with these requirements has increased our legal andfinancial compliance costs and has made some activities more time consuming and costly. Our management andother personnel have little experience managing a public company and preparing public filings. In addition,changing laws, regulations and standards relating to corporate governance and public disclosure are creatinguncertainty for public companies, increasing legal and financial compliance costs and making some activitiesmore time consuming. These laws, regulations and standards are subject to varying interpretations, in many casesdue to their lack of specificity, and, as a result, their application in practice may evolve over time as newguidance is provided by regulatory and governing bodies. This could result in continuing uncertainty regardingcompliance matters and higher costs necessitated by ongoing revisions to disclosure and governance practices.Our management and other personnel may need to divert attention from operational and other business matters todevote substantial time to these public company requirements. In particular, we are incurring and expect to incursignificant expenses and devote substantial management effort toward ensuring compliance with therequirements of Section 404 of the Sarbanes-Oxley Act, including remediating the material weakness describedin Item 9A. “Controls and Procedures.” Although we have hired additional employees to comply with theserequirements, we may need to hire more accounting, legal and financial staff in the future with appropriate publiccompany experience and technical accounting knowledge to meet these requirements. We cannot accuratelypredict or estimate the amount or timing of additional costs we may incur as a result of becoming a publiccompany. Further, if our efforts to comply with new laws, regulations and standards differ from the activitiesintended by regulatory or governing bodies due to ambiguities related to practice, regulatory authorities mayinitiate legal proceedings against us and our business may be harmed.
Additional compensation costs and potential future equity awards may be required to properly compensateour executives and directors as a result of the personal liability that goes with public company status. Any suchcosts or awards will increase our compensation expenses, which would increase our general and administrativeexpense and could adversely affect our profitability. We also expect that operating as a public company willmake it more difficult and more expensive for us to obtain director and officer liability insurance on reasonableterms. As a result, it may be more difficult for us to attract and retain qualified people to serve on our board ofdirectors, our board committees or as executive officers.
Our international operations subject us to potentially adverse tax consequences.
We report our taxable income in various jurisdictions worldwide based upon our business operations inthose jurisdictions. These jurisdictions include Australia, Brazil, Canada, China, France, Germany, Hungary,India, Israel, Italy, Japan, Korea, Singapore, Spain, Switzerland, Thailand, Ukraine and the United Kingdom. Theinternational nature and organization of our business activities are subject to complex transfer pricing regulationsadministered by taxing authorities in various jurisdictions. The relevant taxing authorities may disagree with ourdeterminations as to the income and expenses attributable to specific jurisdictions. If such a disagreement were tooccur, and our position were not sustained, we could be required to pay additional taxes, interest and penalties,which could result in one-time tax charges, higher effective tax rates, reduced cash flows and lower overallprofitability of our operations. We believe that our financial statements reflect adequate reserves to cover such acontingency, but there can be no assurances in that regard.
Taxing authorities may successfully assert that we should have collected or in the future should collect salesand use, value added or similar taxes, and we could be subject to liability with respect to past or future sales,which could adversely affect our results of operations.
We do not collect sales and use, value added and similar taxes in all jurisdictions in which we have sales,based on our belief that such taxes are not applicable or that we are not required to collect such taxes with respect
34

to the jurisdiction. Sales and use, value added and similar tax laws and rates vary greatly by jurisdiction. Certainjurisdictions in which we do not collect such taxes may assert that such taxes are applicable, which could resultin tax assessments, penalties and interest, and we may be required to collect such taxes in the future. Such taxassessments, penalties and interest or future requirements may adversely affect our results of operations. Webelieve that our financial statements reflect adequate reserves to cover such a contingency, but there can be noassurances in that regard.
Unanticipated changes in our effective tax rate could harm our future results.
We are subject to income taxes in the United States and various foreign jurisdictions, and our domestic andinternational tax liabilities are subject to the allocation of expenses in differing jurisdictions. Forecasting ourestimated annual effective tax rate is complex and subject to uncertainty, and there may be material differencesbetween our forecasted and actual tax rates. Our effective tax rate could be adversely affected by changes in themix of earnings and losses in countries with differing statutory tax rates, certain non-deductible expenses as aresult of acquisitions, the valuation of deferred tax assets and liabilities, adjustments to income taxes uponfinalization of tax returns, changes in available tax credits, decision to repatriate non-U.S. earnings for which wehave not previously provided for U.S. taxes, and changes in federal, state or international tax laws and accountingprinciples. In addition, because substantially all of our intellectual property resides in the United States and islicensed through our parent U.S. entity, our effective tax rate may be higher than other companies that maintainand license intellectual property from outside the United States. Increases in our effective tax rate would reduceour profitability or in some cases increase our losses.
In addition, we may be subject to income tax audits by many tax jurisdictions throughout the world.Although we believe our income tax liabilities are reasonably estimated and accounted for in accordance withapplicable laws and principles, an adverse resolution of one or more uncertain tax positions in any period couldhave a material impact on the results of operations for that period.
If the market for cloud-based solutions develops more slowly than we expect or declines, our revenues coulddecrease and our business could be adversely affected.
The market for cloud-based solutions is not as mature as the market for on-premise enterprise software inthe life sciences industry, and it is uncertain whether cloud-based solutions will achieve and sustain high levels ofcustomer demand and market acceptance in the life sciences industry. Our success will depend to a substantialextent on the widespread adoption of cloud-based solutions in the life sciences industry, and of Veeva CRM andthe multichannel customer relationship management applications that complement Veeva CRM, Veeva Vault andVeeva Network in particular. Many enterprises, and in particular in the life sciences industry, have investedsubstantial personnel and financial resources to integrate traditional enterprise software into their businesses, andtherefore may be reluctant or unwilling to migrate to cloud-based solutions. It is difficult to predict customeradoption rates and demand for our solutions, the future growth rate and size of the cloud computing market or theentry of competitive solutions. The expansion of cloud-based solutions, particularly in the life sciences industry,depends on a number of factors, including the cost, performance and perceived value associated with cloud-basedsolutions, as well as the ability of providers of cloud-based solutions to address security, privacy and uniqueregulatory requirements or concerns. If we or other cloud-based solution providers experience security incidents,loss of customer data, disruptions in delivery or other problems, the market for cloud-based solutions in the lifesciences industry, including our solutions, may be adversely affected. If cloud-based solutions do not achievewidespread adoption in the life sciences industry, or there is a reduction in demand for cloud-based solutionscaused by a lack of customer acceptance, technological challenges, weakening economic conditions, security orprivacy concerns, competing technologies and products, decreases in corporate spending or otherwise, ourrevenues could decrease and our business could be adversely affected.
35

Risks Related to Ownership of Our Class A Common Stock
Our Class A common stock price has been and will likely continue to be volatile.
The trading price of our Class A common stock has been and will likely continue to be volatile for theforeseeable future. Since shares of our Class A common stock were sold in our initial public offering in October2013 at a price of $20.00 per share, our stock price has ranged from $17.11 to $49.00 through March 18, 2016. Inaddition, the trading prices of the securities of technology companies in general have been highly volatile.Accordingly, the market price of our Class A common stock is likely to be subject to wide fluctuations inresponse to numerous factors, many of which are beyond our control, such as those in this “Risk Factors” sectionand others including:
• fluctuations in the valuation of companies perceived by investors to be comparable to us or in valuationmetrics, such as our price to revenues ratio or price to earnings ratio;
• overall performance of the equity markets;
• variations in our operating results, including revenues, earnings per share, cash flows from operatingactivities and other financial metrics and non-financial metrics, and how those results compare toanalyst expectations, including whether those results fail to meet, exceed or significantly exceedanalyst expectations;
• forward-looking statements related to our projections of future operating results, including theguidance we give in our regular earnings releases, changes in our projections of our future operatingresults or our failure to meet, exceed or significantly exceed these projections;
• the net increases in the number of customers, either independently or as compared with publishedexpectations of industry, financial or other analysts that cover us;
• changes in our other financial, operational or other metrics, regardless of whether we regard those asmetrics that reflect the current state of or longer-term prospects of our business;
• changes in the estimates of our operating results or changes in recommendations by securities analyststhat elect to follow our Class A common stock;
• announcements of technological innovations, new solutions or enhancements to services, strategicalliances or significant agreements by us or by our competitors;
• announcements by us or by our competitors of mergers or other strategic acquisitions or rumors of suchtransactions involving us or our competitors;
• announcements of customer additions and customer cancellations or delays in customer purchases;
• recruitment or departure of key personnel;
• disruptions in our solutions due to computer hardware, software or network problems, securitybreaches or other man-made or natural disasters;
• the economy as a whole, market conditions in our industry and the industries of our customers;
• trading activity by a limited number of stockholders who together beneficially own a majority of ouroutstanding Class A common stock;
• the operating performance and market value of other similar companies;
• changes in legislation relating to our existing or future solutions;
• litigation or other claims against us;
• the size of our market float; and
• any other factors discussed herein.
36

In addition, if the market for technology stocks or the stock market in general experiences uneven investorconfidence, the market price of our Class A common stock could decline for reasons unrelated to our business,operating results or financial condition. The market price of our Class A common stock might also decline inreaction to events that affect other companies within, or outside, our industry even if these events do not directlyaffect us. Some companies that have experienced volatility in the trading price of their stock have been thesubject of securities class action litigation. If we are the subject of such litigation, it could result in substantialcosts and a diversion of our management’s attention and resources.
The dual class structure of our common stock has the effect of concentrating voting control with our executiveofficers (including our Chief Executive Officer) and directors and their affiliates; this will limit or precludethe ability of our investors to influence corporate matters.
Our Class B common stock has ten votes per share, and our Class A common stock has one vote per share.As of January 31, 2016, stockholders who hold shares of Class B common stock, including our executive officersand directors and their affiliates, together hold approximately 84.1% of the voting power of our outstandingcapital stock. Because of the ten-to-one voting ratio between our Class B common stock and Class A commonstock, the holders of our Class B common stock collectively control a substantial majority of the combinedvoting power of our common stock and, assuming no material sales of such shares, will be able to control allmatters submitted to our stockholders for approval until October 15, 2023, including the election of directors,amendments of our organizational documents and any merger, consolidation, sale of all or substantially all of ourassets or other major corporate transaction. This concentrated control will limit or preclude our investors’ abilityto influence corporate matters for the foreseeable future. In addition, this may prevent or discourage unsolicitedacquisition proposals or offers for our capital stock or may adversely affect the market price of our Class Acommon stock.
Future transfers by holders of Class B common stock will generally result in those shares converting toClass A common stock, subject to limited exceptions, such as certain transfers effected for estate planningpurposes. The conversion of Class B common stock to Class A common stock will have the effect, over time, ofincreasing the relative voting power of those holders of Class B common stock who retain their shares in the longterm. If, for example, our executive officers (including our Chief Executive Officer), employees, directors andtheir affiliates retain a significant portion of their holdings of Class B common stock for an extended period oftime, they could, in the future, continue to control a majority of the combined voting power of our Class Acommon stock and Class B common stock.
We have broad discretion in the use of our cash balances and may not use them effectively.
We have broad discretion in the use of our cash balances and may not use them effectively. The failure byour management to apply these funds effectively could adversely affect our business and financial condition.Pending their use, we may invest the net proceeds from any future securities offerings in a manner that does notproduce income or that loses value. Our investments may not yield a favorable return to our investors and maynegatively impact the price of our Class A common stock.
We do not intend to pay dividends on our capital stock for the foreseeable future, so any returns will be limitedto changes in the value of our Class A common stock.
We have never declared or paid any cash dividends on our capital stock. We currently anticipate that we willretain future earnings for the development, operation and expansion of our business and do not anticipatedeclaring or paying any cash dividends for the foreseeable future. In addition, our ability to pay cash dividendson our capital stock may be prohibited or limited by the terms of any future debt financing arrangement. Anyreturn to stockholders will therefore be limited to the increase, if any, of the price of our Class A common stock.
37

Future sales and issuances of our common stock or rights to purchase common stock, including pursuant toour equity incentive plans, could result in additional dilution of the percentage ownership of our stockholdersand could cause the stock price of our Class A common stock to decline.
In the future, we may sell common stock, convertible securities or other equity securities in one or moretransactions at prices and in a manner we determine from time to time. We expect to issue securities toemployees and directors pursuant to our equity incentive plans. If we sell common stock, convertible securities orother equity securities in subsequent transactions, or common stock is issued pursuant to equity incentive plans,our investors may be materially diluted. New investors in such subsequent transactions could gain rights,preferences and privileges senior to those of holders of our common stock, including our Class A common.
Sales of a substantial number of shares of our common stock in the public market, or the perception that theymight occur, could cause the price of our Class A common stock to decline.
Sales of a substantial number of shares of our Class A common stock in the public market, or the perceptionthat these sales might occur, could cause the market price of our Class A common stock to decline or make itmore difficult for you to sell your common stock at a time and price that you deem appropriate and could impairour ability to raise capital through the sale of additional equity securities. We are unable to predict the effect thatsales, or the perception that our shares may be available for sale, will have on the prevailing market price of ourClass A common stock.
In addition, as of January 31, 2016, we had options outstanding that, if fully exercised, would result in theissuance of additional shares of Class A and Class B common stock. Our Class B common stock converts intoClass A common stock on a one-for-one basis. As of January 31, 2016, we had restricted stock units outstandingwhich may vest in the future and result in the issuance of additional shares of Class A common stock. Ourunexercised stock options and unvested restricted stock units, as of January 31, 2016, are described in note 11 ofthe notes to our condensed consolidated financial statements. All of the shares of Class A common stock issuableupon the exercise of options (or upon conversion of shares of Class B common stock issued upon the exercise ofoptions) or upon the vesting of restricted stock units have been registered for public resale under the SecuritiesAct of 1933, as amended, or the Securities Act. Accordingly, these shares will be able to be freely sold in thepublic market upon issuance as permitted by any applicable vesting requirements.
Certain holders of our Class A and Class B common stock have rights, subject to certain conditions, torequire us to file registration statements for the public resale of such shares (in the case of Class B commonstock, the Class A common stock issuable upon conversion of such shares) or to include such shares inregistration statements that we may file for us or other stockholders. Any sales of securities by these stockholderscould have a material adverse effect on the market price of our Class A common stock.
If securities or industry analysts do not continue to publish research or if they publish inaccurate orunfavorable research about our business, our stock price and trading volume could decline.
The trading market for our Class A common stock will depend in part on the research and reports thatsecurities or industry analysts publish about us or our business. If industry analysts cease coverage of us oradditional industry analysts do not initiate coverage of us, the trading price for our Class A common stock maybe adversely affected. In addition, the stock prices of many companies in the high technology industry havedeclined significantly after those companies have failed to meet, or often times significantly exceed, the financialguidance publicly announced by the companies or the expectations of analysts. If our financial results fail to meet(or possibly significantly exceed) our announced guidance or the expectations of analysts or public investors,analysts could downgrade our common stock or publish unfavorable research about us. If one or more of theanalysts who cover us downgrade our Class A common stock or publish inaccurate or unfavorable research aboutour business, our Class A common stock price would likely decline. If one or more of these analysts ceasecoverage of us or fail to publish reports on us regularly, demand for our Class A common stock could decrease,which might cause our Class A common stock price and trading volume to decline.
38

Provisions in our restated certificate of incorporation and amended and restated bylaws and Delaware lawmight discourage, delay or prevent a change in control of our company or changes in our management and,therefore, depress the market price of our Class A common stock.
Our restated certificate of incorporation and amended and restated bylaws contain provisions that coulddepress the market price of our Class A common stock by acting to discourage, delay or prevent a change incontrol of our company or changes in our management that the stockholders of our company may deemadvantageous. These provisions among other things:
• establish a classified board of directors so that not all members of our board are elected at one time;
• provide for a dual class common stock structure, which gives our Chief Executive Officer, directors,executive officers, greater than 5% stockholders and their respective affiliates the ability to control theoutcome of all matters requiring stockholder approval, even if they own significantly less than amajority of the shares of our outstanding Class A and Class B common stock;
• permit the board of directors to establish the number of directors;
• provide that directors may only be removed “for cause” and only with the approval of 66 2/3% of ourstockholders;
• require super-majority voting to amend some provisions in our restated certificate of incorporation andamended and restated bylaws;
• authorize the issuance of “blank check” preferred stock that our board of directors could use toimplement a stockholder rights plan;
• eliminate the ability of our stockholders to call special meetings of stockholders;
• prohibit stockholder action by written consent, which requires all stockholder actions to be taken at ameeting of our stockholders;
• provide that the board of directors is expressly authorized to make, alter or repeal our amended andrestated bylaws; and
• establish advance notice requirements for nominations for election to our board of directors or forproposing matters that can be acted upon by stockholders at annual stockholder meetings.
In addition, Section 203 of the Delaware General Corporation Law may discourage, delay or prevent achange in control of our company. Section 203 imposes certain restrictions on merger, business combinationsand other transactions between us and holders of 15% or more of our common stock.
Our amended and restated certificate of incorporation provides that the Court of Chancery of the State ofDelaware is the exclusive forum for substantially all disputes between us and our stockholders, which couldlimit our stockholders’ ability to obtain a favorable judicial forum for disputes with us or our directors,officers or employees.
Our amended and restated certificate of incorporation provides that the Court of Chancery of the State ofDelaware is the exclusive forum for any derivative action or proceeding brought on our behalf, any actionasserting a breach of fiduciary duty, any action asserting a claim against us arising pursuant to the DelawareGeneral Corporation Law or any action asserting a claim against us that is governed by the internal affairsdoctrine. This choice of forum provision may limit a stockholder’s ability to bring a claim in a judicial forum thatit finds favorable for disputes with us or our directors, officers or other employees and may discourage thesetypes of lawsuits. Alternatively, if a court were to find the choice of forum provision contained in our certificateof incorporation to be inapplicable or unenforceable in an action, we may incur additional costs associated withresolving such action in other jurisdictions, which could harm our business, operating results, and financialcondition.
39

ITEM 1B. UNRESOLVED STAFF COMMENTS
None.
ITEM 2. PROPERTIES
We own our Pleasanton, California corporate headquarters, which currently accommodates our principalexecutive, development, engineering, marketing, business development, employee success, finance, legal,information technology and administrative activities. We expect that our corporate headquarters will support theoverall growth of our business for the next few years.
We also lease offices in San Francisco and San Carlos, California; Princeton, New Jersey; New York, NewYork; Hilliard, Ohio; Fort Washington and Radnor, Pennsylvania; Australia; Brazil; Canada; China; France;Germany; Hungary; Japan; Korea; Singapore; Spain; Thailand and the United Kingdom. We expect to expandour facilities capacity in certain field locations during our fiscal year ending January 31, 2017. We may furtherexpand our facilities capacity after January 31, 2017 as our employee base grows. We believe that we will beable to obtain additional space on commercially reasonable terms.
ITEM 3. LEGAL PROCEEDINGS
Criterion Capital Section 16(b) Matter Seeking Disgorgement Short-swing Profits on Behalf of Veeva.
On June 24, 2015, a purported stockholder filed a complaint pursuant to Section 16(b) of the SecuritiesExchange Act of 1934 (the “Exchange Act”) in the U.S. District Court for the Southern District of New Yorkagainst Criterion Capital Management, LLC, Criterion Capital Partners Master Fund, L.P., Criterion CapitalPartners Master Fund GP, Ltd., Criterion Horizons Master Fund, L.P., Criterion Horizons Master Fund GP, Ltd.,Criterion Vista Master Fund GP, L.P., Christopher H. Lord, David Riley, Tomoko Fortune (the “CriterionDefendants”), and Veeva Systems Inc. as nominal defendant (Greenfield v. Criterion Capital Mgmt., LLC et al.(15-CV-4937)). Thereafter, on August 3, 2015, the case was transferred to the U.S. District Court for theNorthern District of California (15-CV-3583).
The action is purportedly brought on behalf of us and alleges that between March and December 2014 andin 2015, the Criterion Defendants purchased and sold our securities which resulted in illicit profits that areallegedly subject to disgorgement under the short-swing trading proscriptions in Section 16(b) of the ExchangeAct. Due to the alleged failure by the Criterion Defendants to comply with their reporting obligations under theExchange Act, the complaint does not specify the precise amount of alleged trades subject to disgorgement, otherthan estimating that the amount of profits in 2014 subject to disgorgement is in the “millions,” and the amount ofprofits in 2015 “total at least $500,000.” The complaint seeks disgorgement of any and all short-swing profits onbehalf of us, plus attorneys’ fees and expenses. The complaint does not seek damages of any kind from us.
On November 19, 2015, the Criterion Defendants moved to dismiss the complaint. A hearing on theCriterion Defendants’ motion to dismiss is currently scheduled for May 18, 2016. We did not join the CriterionDefendants in filing a motion to dismiss, and, pursuant to Court order, are not required to answer the complaintuntil after the Court has ruled on the Criterion Defendants’ motion to dismiss.
We have engaged counsel to conduct our own investigation into whether the claims against the CriterionDefendants have merit. Our investigation is currently underway.
From time to time, we may be involved in other legal proceedings and subject to claims incident to theordinary course of business. Although the results of such legal proceedings and claims cannot be predicted withcertainty, we believe we are not currently a party to any legal proceedings, the outcome of which, if determinedadversely to us, would individually or taken together have a material adverse effect on our business, operatingresults, cash flows or financial condition. Regardless of the outcome, such proceedings can have an adverse
40

impact on us because of defense and settlement costs, diversion of resources and other factors, and there can beno assurances that favorable outcomes will be obtained.
ITEM 4. MINE SAFETY DISCLOSURES
Not applicable.
41

PART II.
ITEM 5. MARKET FOR REGISTRANT’S COMMON EQUITY, RELATED STOCKHOLDERMATTERS AND ISSUER PURCHASES OF EQUITY SECURITIES
Market Price of Class A Common Stock
Our Class A common stock has been listed on the New York Stock Exchange under the symbol “VEEV”since October 16, 2013, the date of our initial public offering (IPO). Prior to that date, there was no public tradingmarket for our Class A common stock.
The following table sets forth for the indicated periods the high and low closing sales prices of our Class Acommon stock as reported by the New York Stock Exchange.
High Low
Fiscal year ended January 31, 2016First quarter . . . . . . . . . . . . . . . . . . . . . . . . . . . . . . . . . . . . . . . . . . . . . . . . $32.69 $24.26Second quarter . . . . . . . . . . . . . . . . . . . . . . . . . . . . . . . . . . . . . . . . . . . . . . $29.00 $26.31Third quarter . . . . . . . . . . . . . . . . . . . . . . . . . . . . . . . . . . . . . . . . . . . . . . . $26.53 $22.83Fourth quarter . . . . . . . . . . . . . . . . . . . . . . . . . . . . . . . . . . . . . . . . . . . . . . $28.99 $23.06
Fiscal year ended January 31, 2015First quarter . . . . . . . . . . . . . . . . . . . . . . . . . . . . . . . . . . . . . . . . . . . . . . . . $37.80 $18.70Second quarter . . . . . . . . . . . . . . . . . . . . . . . . . . . . . . . . . . . . . . . . . . . . . . $26.21 $17.87Third quarter . . . . . . . . . . . . . . . . . . . . . . . . . . . . . . . . . . . . . . . . . . . . . . . $31.56 $21.92Fourth quarter . . . . . . . . . . . . . . . . . . . . . . . . . . . . . . . . . . . . . . . . . . . . . . $32.85 $26.14
There is no public trading market for our Class B common stock.
Dividend Policy
We have never declared or paid cash dividends on our capital stock. We currently intend to retain allavailable funds and any future earnings for use in the operation of our business and do not anticipate paying anycash dividends in the foreseeable future. Any future determination to declare cash dividends will be made at thediscretion of our board of directors, subject to applicable laws, and will depend on our financial condition, resultsof operations, capital requirements, general business conditions and other factors that our board of directors maydeem relevant.
Stockholders
As of January 31, 2016, we had 17 holders of record of our Class A common stock and 122 holders ofrecord of our Class B common stock. The actual number of stockholders is greater than this number of recordholders and includes stockholders who are beneficial owners but whose shares are held in street name by brokersand other nominees. This number of holders of record also does not include stockholders whose shares may beheld in trust by other entities.
Purchases of Equity Securities by the Issuer and Affiliated Purchasers
None.
Recent Sales of Unregistered Securities
None.
42

Stock Performance Graph
This performance graph shall not be deemed “filed” for purposes of Section 18 of the Securities ExchangeAct of 1934, as amended (Exchange Act), or incorporated by reference into any of our other filings under theExchange Act or the Securities Act except to the extent we specifically incorporate it by reference into suchfiling.
This chart compares the cumulative total return on our common stock with that of the S&P 500 Index andthe S&P 1500 Application Software Index. The chart assumes $100 was invested at the close of market onOctober 16, 2013, which was our initial trading day, in the Class A common stock of Veeva Systems Inc., theS&P 500 Index and the S&P 1500 Application Software Index, and assumes the reinvestment of any dividends.Our offering price of our Class A common stock in our IPO, which had a closing stock price of $37.16 onOctober 16, 2013, was $20.00 per share. The stock price performance on the following graph is not necessarilyindicative of future stock price performance.
COMPARISON OF CUMULATIVE TOTAL RETURN
$0
$40$20
$60$80
$100$120
$160$140
10/16/13 10/31/13 1/31/14 4/30/14 7/31/14 10/31/14 1/31/15 4/30/15 7/31/15 10/31/15 1/31/16
Veeva Systems Inc. S&P 500 S&P 1500 Application Software Index
10/16/2013 10/31/2013 1/31/2014 4/30/2014 7/31/2014 10/31/2014 1/31/2015 4/30/2015 7/31/2015 10/31/2015 1/31/2016
Veeva Systems Inc. . . . . . 100.00 104.71 85.55 51.70 64.05 80.14 77.40 71.45 72.44 68.27 64.85S&P 500 . . . . . . . . . . . . . 100.00 104.60 106.69 113.34 116.77 122.66 121.87 128.05 129.85 129.04 121.06S&P 1500 Application
Software Index . . . . . . 100.00 100.78 109.11 104.99 112.51 121.10 118.18 134.51 140.06 146.45 134.38
43
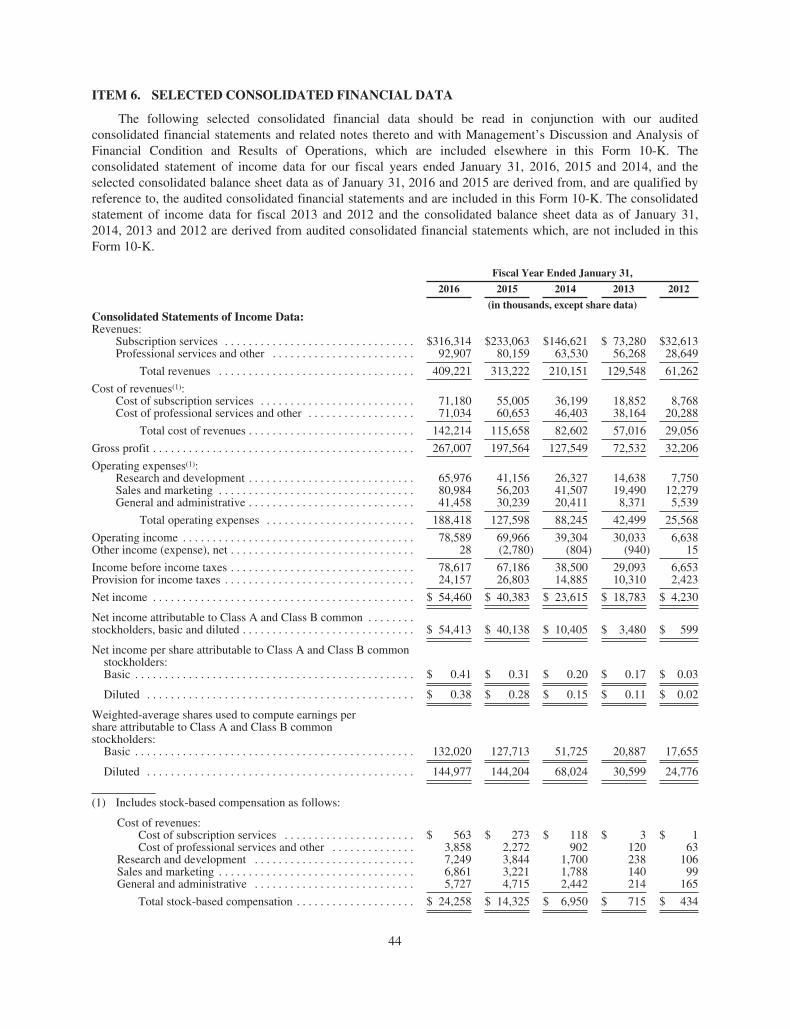
ITEM 6. SELECTED CONSOLIDATED FINANCIAL DATA
The following selected consolidated financial data should be read in conjunction with our auditedconsolidated financial statements and related notes thereto and with Management’s Discussion and Analysis ofFinancial Condition and Results of Operations, which are included elsewhere in this Form 10-K. Theconsolidated statement of income data for our fiscal years ended January 31, 2016, 2015 and 2014, and theselected consolidated balance sheet data as of January 31, 2016 and 2015 are derived from, and are qualified byreference to, the audited consolidated financial statements and are included in this Form 10-K. The consolidatedstatement of income data for fiscal 2013 and 2012 and the consolidated balance sheet data as of January 31,2014, 2013 and 2012 are derived from audited consolidated financial statements which, are not included in thisForm 10-K.
Fiscal Year Ended January 31,
2016 2015 2014 2013 2012
(in thousands, except share data)Consolidated Statements of Income Data:Revenues:
Subscription services . . . . . . . . . . . . . . . . . . . . . . . . . . . . . . . . $316,314 $233,063 $146,621 $ 73,280 $32,613Professional services and other . . . . . . . . . . . . . . . . . . . . . . . . 92,907 80,159 63,530 56,268 28,649
Total revenues . . . . . . . . . . . . . . . . . . . . . . . . . . . . . . . . . 409,221 313,222 210,151 129,548 61,262
Cost of revenues(1):Cost of subscription services . . . . . . . . . . . . . . . . . . . . . . . . . . 71,180 55,005 36,199 18,852 8,768Cost of professional services and other . . . . . . . . . . . . . . . . . . 71,034 60,653 46,403 38,164 20,288
Total cost of revenues . . . . . . . . . . . . . . . . . . . . . . . . . . . . 142,214 115,658 82,602 57,016 29,056
Gross profit . . . . . . . . . . . . . . . . . . . . . . . . . . . . . . . . . . . . . . . . . . . . 267,007 197,564 127,549 72,532 32,206
Operating expenses(1):Research and development . . . . . . . . . . . . . . . . . . . . . . . . . . . . 65,976 41,156 26,327 14,638 7,750Sales and marketing . . . . . . . . . . . . . . . . . . . . . . . . . . . . . . . . . 80,984 56,203 41,507 19,490 12,279General and administrative . . . . . . . . . . . . . . . . . . . . . . . . . . . . 41,458 30,239 20,411 8,371 5,539
Total operating expenses . . . . . . . . . . . . . . . . . . . . . . . . . 188,418 127,598 88,245 42,499 25,568
Operating income . . . . . . . . . . . . . . . . . . . . . . . . . . . . . . . . . . . . . . . 78,589 69,966 39,304 30,033 6,638Other income (expense), net . . . . . . . . . . . . . . . . . . . . . . . . . . . . . . . 28 (2,780) (804) (940) 15
Income before income taxes . . . . . . . . . . . . . . . . . . . . . . . . . . . . . . . 78,617 67,186 38,500 29,093 6,653Provision for income taxes . . . . . . . . . . . . . . . . . . . . . . . . . . . . . . . . 24,157 26,803 14,885 10,310 2,423
Net income . . . . . . . . . . . . . . . . . . . . . . . . . . . . . . . . . . . . . . . . . . . . $ 54,460 $ 40,383 $ 23,615 $ 18,783 $ 4,230
Net income attributable to Class A and Class B common . . . . . . . .stockholders, basic and diluted . . . . . . . . . . . . . . . . . . . . . . . . . . . . . $ 54,413 $ 40,138 $ 10,405 $ 3,480 $ 599
Net income per share attributable to Class A and Class B commonstockholders:Basic . . . . . . . . . . . . . . . . . . . . . . . . . . . . . . . . . . . . . . . . . . . . . . . $ 0.41 $ 0.31 $ 0.20 $ 0.17 $ 0.03
Diluted . . . . . . . . . . . . . . . . . . . . . . . . . . . . . . . . . . . . . . . . . . . . . $ 0.38 $ 0.28 $ 0.15 $ 0.11 $ 0.02
Weighted-average shares used to compute earnings pershare attributable to Class A and Class B commonstockholders:
Basic . . . . . . . . . . . . . . . . . . . . . . . . . . . . . . . . . . . . . . . . . . . . . . . 132,020 127,713 51,725 20,887 17,655
Diluted . . . . . . . . . . . . . . . . . . . . . . . . . . . . . . . . . . . . . . . . . . . . . 144,977 144,204 68,024 30,599 24,776
(1) Includes stock-based compensation as follows:
Cost of revenues:Cost of subscription services . . . . . . . . . . . . . . . . . . . . . . $ 563 $ 273 $ 118 $ 3 $ 1Cost of professional services and other . . . . . . . . . . . . . . 3,858 2,272 902 120 63
Research and development . . . . . . . . . . . . . . . . . . . . . . . . . . . 7,249 3,844 1,700 238 106Sales and marketing . . . . . . . . . . . . . . . . . . . . . . . . . . . . . . . . . 6,861 3,221 1,788 140 99General and administrative . . . . . . . . . . . . . . . . . . . . . . . . . . . 5,727 4,715 2,442 214 165
Total stock-based compensation . . . . . . . . . . . . . . . . . . . . $ 24,258 $ 14,325 $ 6,950 $ 715 $ 434
44
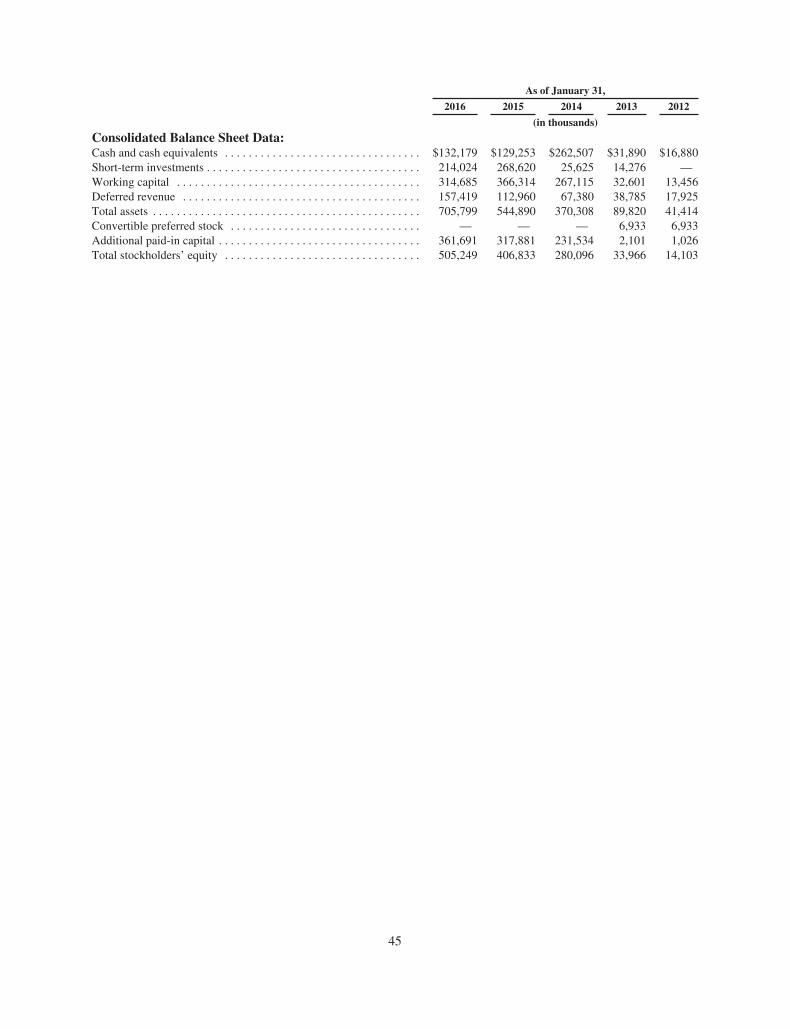
As of January 31,
2016 2015 2014 2013 2012
(in thousands)
Consolidated Balance Sheet Data:Cash and cash equivalents . . . . . . . . . . . . . . . . . . . . . . . . . . . . . . . . . $132,179 $129,253 $262,507 $31,890 $16,880Short-term investments . . . . . . . . . . . . . . . . . . . . . . . . . . . . . . . . . . . . 214,024 268,620 25,625 14,276 —Working capital . . . . . . . . . . . . . . . . . . . . . . . . . . . . . . . . . . . . . . . . . 314,685 366,314 267,115 32,601 13,456Deferred revenue . . . . . . . . . . . . . . . . . . . . . . . . . . . . . . . . . . . . . . . . 157,419 112,960 67,380 38,785 17,925Total assets . . . . . . . . . . . . . . . . . . . . . . . . . . . . . . . . . . . . . . . . . . . . . 705,799 544,890 370,308 89,820 41,414Convertible preferred stock . . . . . . . . . . . . . . . . . . . . . . . . . . . . . . . . — — — 6,933 6,933Additional paid-in capital . . . . . . . . . . . . . . . . . . . . . . . . . . . . . . . . . . 361,691 317,881 231,534 2,101 1,026Total stockholders’ equity . . . . . . . . . . . . . . . . . . . . . . . . . . . . . . . . . 505,249 406,833 280,096 33,966 14,103
45

ITEM 7. MANAGEMENT’S DISCUSSION AND ANALYSIS OF FINANCIAL CONDITION ANDRESULTS OF OPERATIONS
You should read the following discussion and analysis of our financial condition and results of operations inconjunction with our “Selected Consolidated Financial Data” and our consolidated financial statements andnotes thereto appearing elsewhere in this annual report on Form 10-K. In addition to historical consolidatedfinancial information, the following discussion and analysis contains forward-looking statements that involverisks, uncertainties and assumptions. Our actual results could differ materially from those anticipated by theseforward-looking statements as a result of many factors. We discuss factors that we believe could cause orcontribute to these differences below and elsewhere in this annual report on Form 10-K, including those set forthunder “Risk Factors” and “Special Note Regarding Forward-Looking Statements.”
Overview
Veeva is a leading provider of industry cloud software and data solutions for the global life sciencesindustry. We were founded in 2007 on the premise that industry-specific cloud solutions could best address theoperating challenges and regulatory requirements of the life sciences industry. Our products are designed to meetthe unique needs of life sciences companies, regardless of size. Targeted to address our customers’ most strategicbusiness functions—from research and development to commercialization—our solutions are designed to helpthe industry bring products to market faster and more efficiently, market and sell more effectively and maintaincompliance with government regulations.
Veeva CRM was our first commercially available solution and has made up the vast majority of our revenuehistorically. In our fiscal year ended January 31, 2016, we derived approximately 79% of our subscriptionservices revenues and 74% of our total revenues from our core sales automation solution, Veeva CRM, and ournewer multichannel customer relationship management applications that complement Veeva CRM. Thecontribution of subscription services revenues and total revenues associated with Veeva Vault, Veeva NetworkCustomer Master and Veeva’s data offerings is expected to increase as a percentage of subscription servicesrevenues and total revenue going forward. However, we have less experience selling Veeva Vault, VeevaNetwork Customer Master, Veeva’s data offerings and our newer multichannel customer relationshipmanagement applications that complement Veeva CRM. Although the Veeva Vault solution, in particular, hasbegun to achieve market acceptance, to the extent that these more recently introduced solutions do not continueto achieve significant market acceptance, our business and results of operations may be adversely affected.
Additionally, on September 29, 2015, we completed our acquisition of the companies referred to as“Zinc Ahead,” which is a provider of commercial content management solutions, in an all-cash transaction. Theacquired Zinc Ahead business was our largest acquisition to date. We plan to incorporate functionality from theZinc Ahead products into our Veeva Vault PromoMats application and to migrate the Zinc Ahead customers tothe Vault PromoMats application over time. Because we are currently integrating the Zinc Ahead business, weview that legacy business as a component of our broader commercial content management business. We do notcurrently plan to separately break out results from the legacy Zinc Ahead business for any periods after our fiscalyear ended January 31, 2016. While we expect this acquisition to support the continued growth of ourcommercial content management solutions, we may encounter difficulties integrating the Zinc Ahead businessand we may not retain existing Zinc Ahead customers and key Zinc Ahead employees to the extent we expect,which could adversely affect our business.
For our fiscal years ended January 31, 2016, 2015 and 2014, our total revenues were $409.2 million,$313.2 million and $210.2 million, respectively, representing year-over-year growth in total revenues of 31% and49% for our two most recent fiscal years. For our fiscal years ended January 31, 2016, 2015 and 2014, oursubscription services revenues were $316.3 million, $233.1 million and $146.6 million, respectively, representingyear-over-year growth in subscription services revenues of 36% and 59% for our two most recent fiscal years.We expect the growth rate of our total revenues and subscription services revenues to slightly decline in future
46

periods. We generated net income of $54.5 million, $40.4 million and $23.6 million for our fiscal years endedJanuary 31, 2016, 2015 and 2014, respectively. As of January 31, 2016, 2015 and 2014, we served 400, 276 and198 customers, respectively. With respect to our major product lines, our customer totals for each product line asof January 31, 2016, were 212 for Veeva CRM, 219 for Veeva Vault, 35 for Veeva Network Customer Master,and 62 for Veeva OpenData data and data services. A single customer may be counted in more than one productline if the customer has purchased multiple major product lines. Many of our Veeva Vault applications are usedby smaller, earlier stage pre-commercial companies. Thus, the potential number of Veeva Vault customers issignificantly higher than the potential number of customers that use our commercial solutions.
For a further description of our business and products, see “Business” above.
Key Factors Affecting Our Performance
Investment in Growth. We have invested and intend to continue to invest aggressively in expanding thebreadth and depth of our Industry Cloud for life sciences. We expect to continue to invest in research anddevelopment to expand existing and build new solutions, sales and marketing to promote our solutions to newand existing customers and in existing and expanded geographies, professional services to ensure the success ofour customers’ implementations of our solutions, and other operational and administrative functions to supportour expected growth. We anticipate that our headcount will increase as a result of these investments. We expectour total operating expenses will continue to increase over time, and, in some cases, have short-term negativeimpacts on our operating margin.
Adoption of Our Solutions by Existing and New Customers. Most of our customers initially deploy oursolutions to a limited number of users within a division or geography and may only initially deploy a limited setof our available solutions. Our future growth is dependent upon our existing customers’ continued success andrenewals of subscriptions to our solutions, expanded deployment of our solutions within their organizations, andthe purchase of subscriptions to additional solutions. Our growth is also dependent on the adoption of oursolutions by new customers.
Subscription Services Revenue Retention Rate. A key factor to our success is the renewal and expansion ofour existing subscription agreements with our customers. We calculate our annual subscription services revenueretention rate for a particular fiscal year by dividing (i) annualized subscription revenue as of the last day of thatfiscal year from those customers that were also customers as of the last day of the prior fiscal year by (ii) theannualized subscription revenue from all customers as of the last day of the prior fiscal year. Annualizedsubscription revenue is calculated by multiplying the daily subscription revenue recognized on the last day of thefiscal year by 365. This calculation includes the impact on our revenues from customer non-renewals, expandeddeployment of our solutions within their organizations, deployments of additional solutions or discontinued useof solutions by our customers, and price changes for our solutions. Historically, the impact of price changes onour subscription services revenue retention rate has been minimal. For our fiscal years ended January 31, 2016,2015 and 2014, our subscription services revenue retention rate was 125%, 138% and 166%, respectively.
Mix of Subscription and Professional Services Revenues. We believe our investments in professionalservices have driven customer success and facilitated the further adoption of our solutions by our customers.During the initial period of deployment by a customer, we generally provide a greater amount of configuration,implementation and training than later in the deployment. At the same time, many of our customers havehistorically purchased subscriptions for only a limited set of their total potential users or less than full adoptionduring their initial deployments. As a result of these factors, the proportion of total revenues for a customerassociated with professional services is relatively high during the initial deployment period. Over time, as theneed for professional services associated with user deployments decreases and the number of users oftenincreases, we have observed and continue to expect the mix of total revenues to shift more toward subscriptionservices revenues. As a result, we expect the proportion of our total revenues from subscription services toincrease over time.
47

Components of Results of Operations
Revenues
We derive our revenues primarily from subscription services fees and professional services fees.Subscription services revenues consist of fees from customers accessing our cloud-based software solutions andsubscription or license fees for our data solutions. Additionally, Zinc Ahead had entered into a limited number ofperpetual license agreements prior to the acquisition that had accompanying maintenance and hosting fees. Wehave included such maintenance and hosting fees in our subscription services revenues. Professional servicesrevenues consist primarily of fees from implementation services, configuration, data services, training andmanaged services related to our solutions. For our fiscal year ended January 31, 2016, subscription servicesrevenues constituted 77% of total revenues and professional services and other revenues constituted 23% of totalrevenues.
We enter into master subscription agreements with our customers and count each distinct mastersubscription agreement that has not terminated or expired as a distinct customer for purposes of determining ourtotal number of current customers. We generally enter into a single master subscription agreement with eachcustomer, although in some instances, affiliated legal entities within the same corporate family may enter into aseparate master subscription agreement. Divisions, subsidiaries and operating units of our customers often placedistinct orders for our subscription services under the same master subscription agreement, and we do not countsuch distinct orders as new customers for purposes of determining our total customer count. With respect to dataservices customers that have not purchased one of our software solutions, we count as a distinct customer theparty to each agreement that has a known and recurring payment obligation. For purposes of determining ourtotal customer count, we count each entity that uses a legacy Zinc Ahead product as a distinct customer if suchentity is not otherwise a customer of ours.
New subscription orders typically have a one-year term and automatically renew unless notice ofcancellation is provided in advance. If a customer adds users or solutions to an existing order, such additionalorders will generally be coterminous with the initial order, and as a result, orders for additional users or solutionswill commonly have an initial term of less than one year. Subscription orders are generally billed just prior to thesubscription commencement date in annual or quarterly increments. Because the term of orders for additionalusers or solutions is commonly less than one year and payment terms may be quarterly, the annualized value ofthe orders we enter into with our customers will not be completely reflected in deferred revenue at any singlepoint in time. We have also agreed from time to time and may agree in the future to allow customers to changethe renewal dates of their orders to, for example, align more closely with a customer’s annual budget process orto align with the renewal dates of other orders placed by other entities within the same corporate control group,or to change payment terms from annual to quarterly, or vice versa. Such changes may result in a lesser increaseto deferred revenue than if the adjustment had not occurred. Accordingly, we do not believe that change indeferred revenue or calculated billings, a metric commonly cited by financial analysts that is the sum of thechange in deferred revenue plus revenue, are accurate indicators of future revenues for any given period of time.
Subscription services revenues are recognized ratably over the order term beginning when the solution hasbeen provisioned to the customer. Our subscription services agreements are generally non-cancelable during theterm, although customers typically have the right to terminate their agreements for cause in the event of materialbreach. Subscription services revenues are affected primarily by the number of customers, the number of users(or other subscription usage metric) at each customer that uses our solutions and the number of solutionssubscribed to by each customer.
We utilize our own professional services personnel and, in certain cases, third-party subcontractors toperform our professional services engagements with customers. Our professional services engagements areprimarily billed on a time and materials basis and revenues are typically recognized as the services are rendered.Certain professional services revenues are based on fixed fee arrangements and revenues are recognized based onthe proportional performance method. In some cases, the terms of our time and materials and fixed fee
48

arrangements may require that we defer the recognition of revenue until contractual conditions are met. In thosecircumstances, revenue recognition may be sporadic, based upon the achievement of such contractual conditions.Professional services revenues are affected primarily by our customers’ demands for implementation services,configuration, data services, training and managed services in connection with our solutions.
With respect to our recently acquired Zinc Ahead business, we have not established stand-alone value forprofessional services and, therefore, we account for multiple element arrangements as a combined unit ofaccounting. As a result, professional services revenues for our Zinc Ahead business, when delivered as part of amultiple-element arrangement, are generally recognized ratably over the term of the associated subscriptionservices.
Cost of Revenues
Cost of subscription services revenues for all of our solutions consists of expenses related to third-party datacenters, personnel related costs associated with hosting our subscription services and providing support,including our data stewards, operating lease expense associated with computer equipment and software andallocated overhead, amortization expense associated with capitalized internal-use software related to oursubscription services and amortization expense associated with purchased intangibles related to our subscriptionservices. Cost of subscription services revenues for Veeva CRM and certain of our multichannel customerrelationship management applications also include fees paid to salesforce.com, inc. for our use of the Salesforce1Platform and the associated hosting infrastructure and data center operations that are provided by salesforce.com.We intend to continue to invest additional resources in our subscription services to enhance our product offeringsand increase our delivery capacity. For example, we may add or expand third-party data center capacity in thefuture and continue to make investments in the availability and security of our solutions. The timing of when weincur these additional expenses will affect our cost of revenues in absolute dollars in the affected periods.
Cost of professional services and other revenues consists primarily of employee-related expenses associatedwith providing these services, including salaries, benefits and stock-based compensation expense, the cost ofthird-party subcontractors, travel costs and allocated overhead. The cost of providing professional services issignificantly higher as a percentage of the related revenues than for our subscription services due to the directlabor costs and costs of third-party subcontractors.
Operating Expenses
We accumulate certain costs such as office rent, utilities and other facilities costs and allocate them acrossthe various departments based on headcount. We refer to these costs as “allocated overhead.”
Research and Development. Research and development expenses consist primarily of employee-relatedexpenses, third-party consulting fees and allocated overhead, offset by any internal-use software developmentcosts capitalized during the same period. We continue to focus our research and development efforts on addingnew features and applications, increasing the functionality and enhancing the ease of use of our cloud-basedapplications.
Sales and Marketing. Sales and marketing expenses consist primarily of employee-related expenses, salescommissions, marketing program costs, amortization expense associated with purchased intangibles related toour customer contracts, customer relationships and brand, travel-related expenses and allocated overhead. Salescommissions and other program spend costs are expensed as incurred. Consequently, the recognition of thisexpense on our income statement generally precedes the recognition of the related revenue.
General and Administrative. General and administrative expenses consist of employee-related expenses forour executive, finance and accounting, legal, employee success, management information systems personnel andother administrative employees. In addition, general and administrative expenses include third-party professionalservices costs, including legal costs and professional fees, acquisition-related transaction costs, other corporateexpenses and allocated overhead.
49

Other Income (Expense), Net
Other income (expense), net consists primarily of transaction gains or losses on foreign currency, net ofinterest income and amortization of investments.
Provision for Income Taxes
Provision for income taxes consists of federal and state income taxes in the United States and income taxesin certain foreign jurisdictions. See note 10 of the notes to our consolidated financial statements.
Results of Operations
The following tables set forth selected consolidated statements of operations data and such data as apercentage of total revenues for each of the periods indicated:
Fiscal Year Ended January 31,
2016 2015 2014
(in thousands)
Consolidated Statements of Income Data:Revenues:
Subscription services . . . . . . . . . . . . . . . . . . . . . . . . . . . . . . . . . . . . . . . . . $316,314 $233,063 $146,621Professional services and other . . . . . . . . . . . . . . . . . . . . . . . . . . . . . . . . . 92,907 80,159 63,530
Total revenues . . . . . . . . . . . . . . . . . . . . . . . . . . . . . . . . . . . . . . . . . . 409,221 313,222 210,151
Cost of revenues(1):Cost of subscription services . . . . . . . . . . . . . . . . . . . . . . . . . . . . . . . . . . . 71,180 55,005 36,199Cost of professional services and other . . . . . . . . . . . . . . . . . . . . . . . . . . . 71,034 60,653 46,403
Total cost of revenues . . . . . . . . . . . . . . . . . . . . . . . . . . . . . . . . . . . . 142,214 115,658 82,602
Gross profit . . . . . . . . . . . . . . . . . . . . . . . . . . . . . . . . . . . . . . . . . . . . . . . . . . . . . 267,007 197,564 127,549
Operating expenses(1):Research and development . . . . . . . . . . . . . . . . . . . . . . . . . . . . . . . . . . . . . 65,976 41,156 26,327Sales and marketing . . . . . . . . . . . . . . . . . . . . . . . . . . . . . . . . . . . . . . . . . . 80,984 56,203 41,507General and administrative . . . . . . . . . . . . . . . . . . . . . . . . . . . . . . . . . . . . 41,458 30,239 20,411
Total operating expenses . . . . . . . . . . . . . . . . . . . . . . . . . . . . . . . . . . 188,418 127,598 88,245
Operating income . . . . . . . . . . . . . . . . . . . . . . . . . . . . . . . . . . . . . . . . . . . . . . . . 78,589 69,966 39,304Other income (expense), net . . . . . . . . . . . . . . . . . . . . . . . . . . . . . . . . . . . . . . . . 28 (2,780) (804)
Income before income taxes . . . . . . . . . . . . . . . . . . . . . . . . . . . . . . . . . . . . . . . . 78,617 67,186 38,500Provision for income taxes . . . . . . . . . . . . . . . . . . . . . . . . . . . . . . . . . . . . . . . . . 24,157 26,803 14,885
Net income . . . . . . . . . . . . . . . . . . . . . . . . . . . . . . . . . . . . . . . . . . . . . . . . . . . . . $ 54,460 $ 40,383 $ 23,615
(1) Includes stock-based compensation as follows:
Cost of revenues:Cost of subscription services . . . . . . . . . . . . . . . . . . . . . . . . . . . . . . . . . . . . . . . . . . $ 563 $ 273 $ 118Cost of professional services and other . . . . . . . . . . . . . . . . . . . . . . . . . . . . . . . . . . 3,858 2,272 902
Research and development . . . . . . . . . . . . . . . . . . . . . . . . . . . . . . . . . . . . . . . . . . . . . . . . 7,249 3,844 1,700Sales and marketing . . . . . . . . . . . . . . . . . . . . . . . . . . . . . . . . . . . . . . . . . . . . . . . . . . . . . 6,861 3,221 1,788General and administrative . . . . . . . . . . . . . . . . . . . . . . . . . . . . . . . . . . . . . . . . . . . . . . . . 5,727 4,715 2,442
Total stock-based compensation . . . . . . . . . . . . . . . . . . . . . . . . . . . . . . . . . . . . . . . $ 24,258 $ 14,325 $ 6,950
50
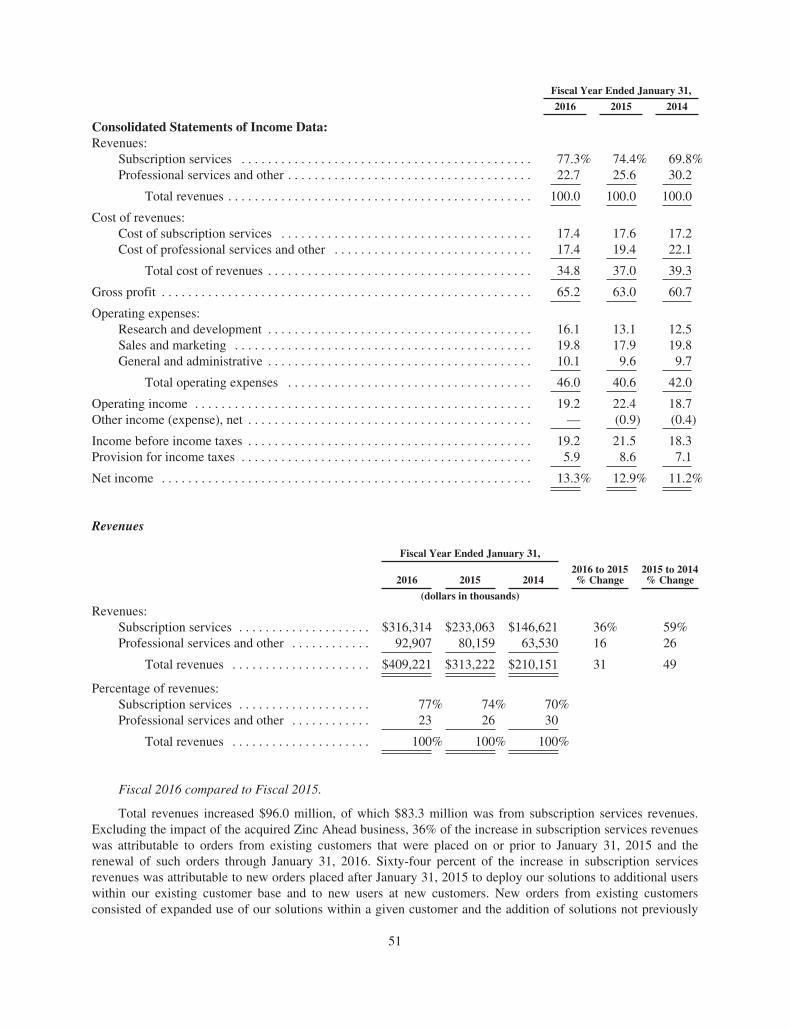
Fiscal Year Ended January 31,
2016 2015 2014
Consolidated Statements of Income Data:Revenues:
Subscription services . . . . . . . . . . . . . . . . . . . . . . . . . . . . . . . . . . . . . . . . . . . . 77.3% 74.4% 69.8%Professional services and other . . . . . . . . . . . . . . . . . . . . . . . . . . . . . . . . . . . . . 22.7 25.6 30.2
Total revenues . . . . . . . . . . . . . . . . . . . . . . . . . . . . . . . . . . . . . . . . . . . . . . 100.0 100.0 100.0
Cost of revenues:Cost of subscription services . . . . . . . . . . . . . . . . . . . . . . . . . . . . . . . . . . . . . . 17.4 17.6 17.2Cost of professional services and other . . . . . . . . . . . . . . . . . . . . . . . . . . . . . . 17.4 19.4 22.1
Total cost of revenues . . . . . . . . . . . . . . . . . . . . . . . . . . . . . . . . . . . . . . . . 34.8 37.0 39.3
Gross profit . . . . . . . . . . . . . . . . . . . . . . . . . . . . . . . . . . . . . . . . . . . . . . . . . . . . . . . . 65.2 63.0 60.7
Operating expenses:Research and development . . . . . . . . . . . . . . . . . . . . . . . . . . . . . . . . . . . . . . . . 16.1 13.1 12.5Sales and marketing . . . . . . . . . . . . . . . . . . . . . . . . . . . . . . . . . . . . . . . . . . . . . 19.8 17.9 19.8General and administrative . . . . . . . . . . . . . . . . . . . . . . . . . . . . . . . . . . . . . . . . 10.1 9.6 9.7
Total operating expenses . . . . . . . . . . . . . . . . . . . . . . . . . . . . . . . . . . . . . 46.0 40.6 42.0
Operating income . . . . . . . . . . . . . . . . . . . . . . . . . . . . . . . . . . . . . . . . . . . . . . . . . . . 19.2 22.4 18.7Other income (expense), net . . . . . . . . . . . . . . . . . . . . . . . . . . . . . . . . . . . . . . . . . . . — (0.9) (0.4)
Income before income taxes . . . . . . . . . . . . . . . . . . . . . . . . . . . . . . . . . . . . . . . . . . . 19.2 21.5 18.3Provision for income taxes . . . . . . . . . . . . . . . . . . . . . . . . . . . . . . . . . . . . . . . . . . . . 5.9 8.6 7.1
Net income . . . . . . . . . . . . . . . . . . . . . . . . . . . . . . . . . . . . . . . . . . . . . . . . . . . . . . . . 13.3% 12.9% 11.2%
Revenues
Fiscal Year Ended January 31,
2016 2015 20142016 to 2015% Change
2015 to 2014% Change
(dollars in thousands)
Revenues:Subscription services . . . . . . . . . . . . . . . . . . . . $316,314 $233,063 $146,621 36% 59%Professional services and other . . . . . . . . . . . . 92,907 80,159 63,530 16 26
Total revenues . . . . . . . . . . . . . . . . . . . . . $409,221 $313,222 $210,151 31 49
Percentage of revenues:Subscription services . . . . . . . . . . . . . . . . . . . . 77% 74% 70%Professional services and other . . . . . . . . . . . . 23 26 30
Total revenues . . . . . . . . . . . . . . . . . . . . . 100% 100% 100%
Fiscal 2016 compared to Fiscal 2015.
Total revenues increased $96.0 million, of which $83.3 million was from subscription services revenues.Excluding the impact of the acquired Zinc Ahead business, 36% of the increase in subscription services revenueswas attributable to orders from existing customers that were placed on or prior to January 31, 2015 and therenewal of such orders through January 31, 2016. Sixty-four percent of the increase in subscription servicesrevenues was attributable to new orders placed after January 31, 2015 to deploy our solutions to additional userswithin our existing customer base and to new users at new customers. New orders from existing customersconsisted of expanded use of our solutions within a given customer and the addition of solutions not previously
51

utilized by a given customer. The acquired Zinc Ahead business contributed $6.0 million in subscription servicesrevenue from September 29, 2015, the date of acquisition, through January 31, 2016. The geographic mix ofsubscription services revenues, as measured by the estimated location of the end users for subscription services,were 53% from North America, 28% from Europe and other and 19% from Asia in fiscal 2016 as compared tosubscription services revenues of 54% from North America, 26% from Europe and other and 20% from Asia infiscal 2015.
Professional services and other revenues increased $12.7 million. The increase in professional servicesrevenues was due primarily to new customers requesting implementation and deployment related professionalservices and existing customers requesting professional services related to expanding deployments or thedeployment of newly purchased solutions. The acquired Zinc Ahead business contributed $0.7 million inprofessional services and other revenue from September 29, 2015, the date of acquisition, through January 31,2016. Professional services revenues from North America, as measured by the estimated location of the user forwhich the services were performed, made up 62% of professional services revenues in fiscal 2016 and 59% ofprofessional services revenues in fiscal 2015. This shift in geographic revenue mix was primarily due to the morerapid rate of revenue growth from deployments in North America as compared to the combined rate of revenuegrowth from deployments in Europe and Asia.
Subscription services revenues were 77% of total revenues for fiscal 2016, compared to 74% of totalrevenues for fiscal 2015, reflecting the faster growth rate of our subscription services revenues as compared tothe growth rate of our professional services and other revenues as our customers expanded their use of oursolutions across new divisions, new geographies, and new products.
Fiscal 2015 compared to Fiscal 2014. Total revenues increased $103.1 million, of which $86.4 million wasfrom subscription services revenues. Thirty-four percent of the increase in subscription services revenues wasattributable to orders from existing customers that were placed on or prior to January 31, 2014 and the renewal ofsuch orders through January 31, 2015. Sixty-six percent of the increase in subscription services revenues wasattributable to new orders placed after January 31, 2014 to deploy our solutions to additional users within ourexisting customer base and to new users at new customers. New orders from existing customers consisted ofexpanded use of our solutions within a given customer and the addition of solutions not previously utilized by agiven customer. Subscription services revenues from North America, as measured by the estimated location ofthe end users for subscription services, made up 54% of subscription services revenues in fiscal 2015 and 61% ofsubscription services revenues in fiscal 2014. This shift in geographic revenue mix was primarily due to the morerapid rate of revenue growth from deployments in both Europe and Asia as compared to North America.
Professional services and other revenues increased $16.6 million. The increase in professional servicesrevenues was due primarily to new customers requesting implementation and deployment related professionalservices, and existing customers requesting professional services related to expanding deployments or thedeployment of newly purchased solutions. Professional services revenues from North America, as measured bythe estimated location of the user for which the services were performed, made up 59% of professional servicesrevenues in fiscal 2015 and 56% of professional services revenues in fiscal 2014.
Subscription services revenues were 74% of total revenues for fiscal 2015, compared to 70% of totalrevenues for fiscal 2014, reflecting the growth in our subscription services revenues as our customers expandedtheir use of our solutions across new divisions, new geographies, and new products.
52
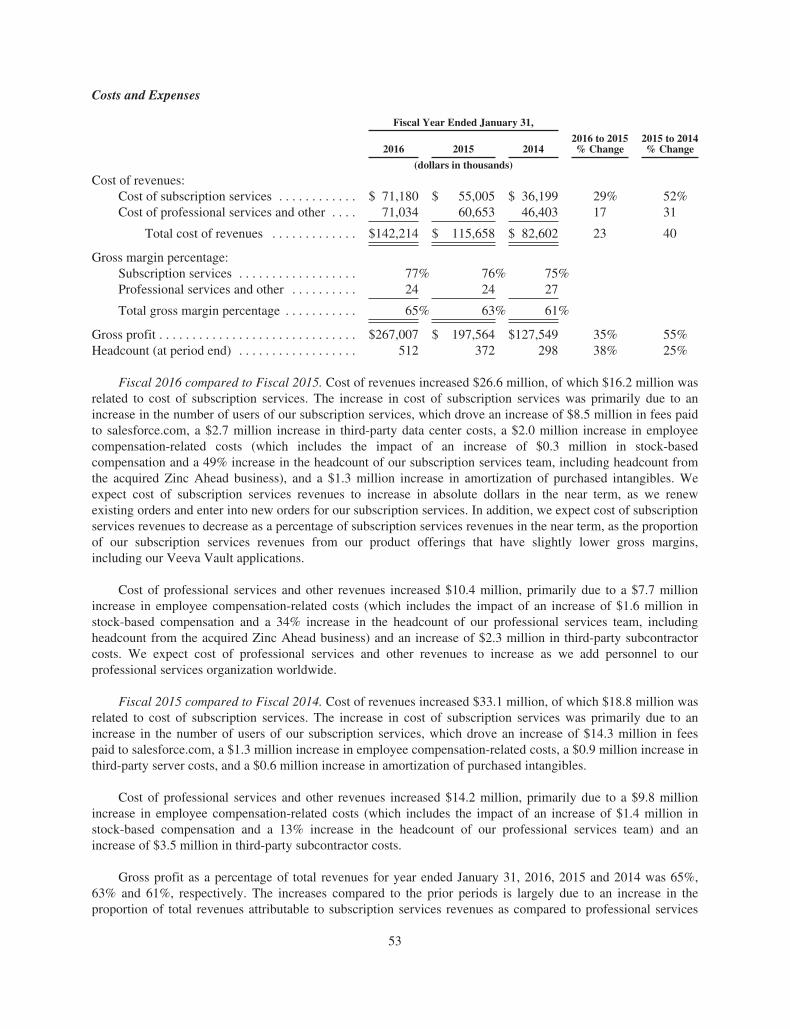
Costs and Expenses
Fiscal Year Ended January 31,
2016 2015 20142016 to 2015% Change
2015 to 2014% Change
(dollars in thousands)
Cost of revenues:Cost of subscription services . . . . . . . . . . . . $ 71,180 $ 55,005 $ 36,199 29% 52%Cost of professional services and other . . . . 71,034 60,653 46,403 17 31
Total cost of revenues . . . . . . . . . . . . . $142,214 $ 115,658 $ 82,602 23 40
Gross margin percentage:Subscription services . . . . . . . . . . . . . . . . . . 77% 76% 75%Professional services and other . . . . . . . . . . 24 24 27
Total gross margin percentage . . . . . . . . . . . 65% 63% 61%
Gross profit . . . . . . . . . . . . . . . . . . . . . . . . . . . . . . $267,007 $ 197,564 $127,549 35% 55%Headcount (at period end) . . . . . . . . . . . . . . . . . . 512 372 298 38% 25%
Fiscal 2016 compared to Fiscal 2015. Cost of revenues increased $26.6 million, of which $16.2 million wasrelated to cost of subscription services. The increase in cost of subscription services was primarily due to anincrease in the number of users of our subscription services, which drove an increase of $8.5 million in fees paidto salesforce.com, a $2.7 million increase in third-party data center costs, a $2.0 million increase in employeecompensation-related costs (which includes the impact of an increase of $0.3 million in stock-basedcompensation and a 49% increase in the headcount of our subscription services team, including headcount fromthe acquired Zinc Ahead business), and a $1.3 million increase in amortization of purchased intangibles. Weexpect cost of subscription services revenues to increase in absolute dollars in the near term, as we renewexisting orders and enter into new orders for our subscription services. In addition, we expect cost of subscriptionservices revenues to decrease as a percentage of subscription services revenues in the near term, as the proportionof our subscription services revenues from our product offerings that have slightly lower gross margins,including our Veeva Vault applications.
Cost of professional services and other revenues increased $10.4 million, primarily due to a $7.7 millionincrease in employee compensation-related costs (which includes the impact of an increase of $1.6 million instock-based compensation and a 34% increase in the headcount of our professional services team, includingheadcount from the acquired Zinc Ahead business) and an increase of $2.3 million in third-party subcontractorcosts. We expect cost of professional services and other revenues to increase as we add personnel to ourprofessional services organization worldwide.
Fiscal 2015 compared to Fiscal 2014. Cost of revenues increased $33.1 million, of which $18.8 million wasrelated to cost of subscription services. The increase in cost of subscription services was primarily due to anincrease in the number of users of our subscription services, which drove an increase of $14.3 million in feespaid to salesforce.com, a $1.3 million increase in employee compensation-related costs, a $0.9 million increase inthird-party server costs, and a $0.6 million increase in amortization of purchased intangibles.
Cost of professional services and other revenues increased $14.2 million, primarily due to a $9.8 millionincrease in employee compensation-related costs (which includes the impact of an increase of $1.4 million instock-based compensation and a 13% increase in the headcount of our professional services team) and anincrease of $3.5 million in third-party subcontractor costs.
Gross profit as a percentage of total revenues for year ended January 31, 2016, 2015 and 2014 was 65%,63% and 61%, respectively. The increases compared to the prior periods is largely due to an increase in theproportion of total revenues attributable to subscription services revenues as compared to professional services
53

and other revenues, which have higher gross margins, and the continued growth of our Veeva Vault, VeevaNetwork Customer Master, and our newer multichannel customer relationship management applications thatcompliment Veeva CRM, all of which have slightly higher gross margins than our core Veeva CRM application.
Operating Expenses and Operating Margin
Operating expenses include research and development, sales and marketing and general and administrativeexpenses. As we continue to invest in our growth through hiring, and as we realize the full impact of theadditional headcount and operating expenses associated with the Zinc Ahead business, we expect operatingexpenses to increase in absolute dollars and as a percentage of revenue in the near term which may result in aslight decrease in our operating margin.
Research and Development
Fiscal Year Ended January 31,
2016 2015 20142016 to 2015% Change
2015 to 2014% Change
(dollars in thousands)
Research and development . . . . . . . . . . . . . . . . . . . . . . . $65,976 $41,156 $26,327 60% 56%Percentage of total revenues . . . . . . . . . . . . . . . . . . . . . 16% 13% 13%Headcount (at period end) . . . . . . . . . . . . . . . . . . . . . . . 480 286 200 68% 43%
Fiscal 2016 compared to Fiscal 2015. Research and development expenses increased $24.8 million,primarily due to an increase of $19.5 million in employee compensation-related costs (which includes the impactof an increase of $3.4 million in stock-based compensation) resulting from a 68% increase in headcount duringthe period, including headcount from the acquired Zinc Ahead business. The expansion of our headcount in thisarea is to support the increasing number of products that are under development across our solution offerings,and to a lesser extent headcount from the acquired Zinc Ahead business. We also had an increase in facilityrelated expenses of $1.2 million primarily resulting from the move into our new corporate headquarters and anincrease of $0.9 million in third-party consulting services related to the development of our solution offerings.
Fiscal 2015 compared to Fiscal 2014. Research and development expenses increased $14.8 million,primarily due to an increase of $12.2 million in employee compensation-related costs (which includes the impactof an increase of $2.1 million in stock-based compensation and a 43% increase in headcount) and a $0.7 milliondecrease in internal-use software capitalized in fiscal year 2015 as compared to fiscal year 2014. The expansionof our headcount in this area was required to support the increasing number of products that are underdevelopment across our solution offerings.
We expect research and development expenses to increase in absolute dollars in the near term, primarily dueto higher headcount as we continue to add research and development personnel and invest in our solutions and aswe experience the full impact of the additional research and development headcount and expenses associatedwith the acquired Zinc Ahead business.
Sales and Marketing
Fiscal Year Ended January 31,
2016 2015 20142016 to 2015% Change
2015 to 2014% Change
(dollars in thousands)
Sales and marketing . . . . . . . . . . . . . . . . . . . . . . . . . . . . $80,984 $56,203 $41,507 44% 35%Percentage of total revenues . . . . . . . . . . . . . . . . . . . . . 20% 18% 20%Headcount (at period end) . . . . . . . . . . . . . . . . . . . . . . . 338 200 158 69% 27%
54

Fiscal 2016 compared to Fiscal 2015. Sales and marketing expenses increased $24.8 million, primarily dueto an increase of $17.6 million in employee compensation-related costs (which includes the impact of an increaseof $3.6 million in stock-based compensation, an increase of $3.3 million in sales commissions and a 69%increase in headcount, including headcount from the acquired Zinc Ahead business), an increase of $2.0 millionin marketing program costs, a $1.6 million increase in travel-related costs, and a $1.4 million increase inamortization expense associated with purchased intangibles related to our to customer contracts, customerrelationships and brand.
Fiscal 2015 compared to Fiscal 2014. Sales and marketing expenses increased $14.7 million, primarily dueto an increase of $11.7 million in employee compensation-related costs (which includes the impact of an increaseof $1.4 million in stock-based compensation, an increase of $1.3 million in sales commissions and a 27%increase in headcount), an increase of $1.4 million in marketing program costs, and a $0.8 million increase intravel-related costs.
We expect sales and marketing expenses to continue to grow in absolute dollars in the near term, primarilydue to employee-related expenses as we increase our headcount to support our sales and marketing effortsassociated with our newer solutions and our continued expansion of our international sales capacity across all oursolutions, and as we experience the full impact of the additional sales and marketing headcount and expensesassociated with the acquired Zinc Ahead business.
General and Administrative
Fiscal Year Ended January 31,
2016 2015 20142016 to 2015% Change
2015 to 2014% Change
(dollars in thousands)
General and administrative . . . . . . . . . . . . . . . . . . . . . . $41,458 $30,239 $20,411 37% 48%Percentage of total revenues . . . . . . . . . . . . . . . . . . . . . 10% 10% 10%Headcount (at period end) . . . . . . . . . . . . . . . . . . . . . . . 144 93 69 55% 35%
Fiscal 2016 compared to Fiscal 2015. General and administrative expenses increased $11.2 million,primarily due to increases of $4.8 million in employee compensation-related costs (which includes the impact ofan increase of $1.0 million in stock-based compensation and a 55% increase in headcount, including headcountfrom the acquired Zinc Ahead business), $2.3 million in one-time transaction costs for the acquired Zinc Aheadbusiness, $1.2 million in deferred compensation associated with the acquired Zinc Ahead business, an increase of$1.0 million in expense for software subscriptions for internal use, $0.9 million related to the early termination ofthe lease for our former headquarters building, and an increase of $0.7 million in taxes and licenses, off-set by adecrease of $1.4 million in third-party professional services costs.
Fiscal 2015 compared to Fiscal 2014. General and administrative expenses increased $9.8 million,primarily due to increases of $5.1 million in employee compensation-related costs (which includes the impact ofan increase of $2.3 million in stock-based compensation and a 35% increase in headcount), and an increase of$3.1 million in third-party professional services costs. Much of this increased spending was incurred to addresspublic company requirements, litigation related costs, and to provide increased administrative support to ourforeign operations.
We expect general and administrative expenses to slightly increase in absolute dollars in the near term,primarily due to higher headcount, additional expenses, such as professional services from third-party providers,increased administrative support to our expanding foreign operations and as we experience the full impact of theadditional general and administrative headcount and expenses associated with the acquired Zinc Ahead business.
55

Other Income (Expense), Net
Fiscal Year Ended January 31,
2016 2015 20142016 to 2015% Change
2015 to 2014% Change
(dollars in thousands)
Other income (expense), net . . . . . . . . . . . . . . . . . . . . . . $28 $(2,780) $(804) -101% 246%
Fiscal 2016 compared to Fiscal 2015. Other income increased $2.8 million, primarily due to a decrease of$2.1 million in foreign currency losses and an increase of $1.1 million in interest income, offset by an increase of$0.4 million in investment amortization. The higher interest income and investment amortization compared to theprior year period was primarily attributable to our higher cash equivalent and investment balances during the yearleading up to Zinc Ahead acquisition. We continue to experience foreign currency losses primarily due to theincrease in the value of the U.S. Dollar against the Euro and the impact resulting from the periodic re-measurement of our foreign currency balances that are denominated in currencies other than the functionalcurrency of the entities in which they are recorded. Our results of operations are subject to fluctuations due tochanges in foreign currency exchange rates, particularly changes in the Euro, British Pound Sterling, JapaneseYen and Chinese Yuan. We may continue to experience adverse foreign currency impacts due to any additionalvolatility in these currencies.
Fiscal 2015 compared to Fiscal 2014. Other expenses increased $2.0 million, primarily due to an increaseof $2.9 million in foreign currency loss and an increase of $2.1 million in investment amortization, offset by anincrease of $3.0 million in interest income. The higher interest income and investment amortization compared tothe prior year period was primarily attributable to our higher cash equivalent and investment balances. Theforeign currency loss was driven by the decline in the value of the Euro to the U.S. Dollar and resulting primarilyfrom the periodic re-measurement of our foreign currency balances that are denominated in currencies other thanthe functional currency of the entities in which they are recorded.
Provision for Income Taxes
Fiscal Year Ended January 31,
2016 2015 20142016 to 2015% Change
2015 to 2014% Change
(dollars in thousands)
Income before income taxes . . . . . . . . . . . . . . . . . . . . . $78,617 $67,186 $38,500 17% 75%Provision for income taxes . . . . . . . . . . . . . . . . . . . . . . . 24,157 26,803 14,885 (10) 80Effective tax rate . . . . . . . . . . . . . . . . . . . . . . . . . . . . . . 30.7% 39.9% 38.7%
Our effective tax rate was 31%, 40% and 39% for the years ended January 31, 2016, 2015 and 2014,respectively. Our effective tax rate in all periods is the result of the mix of income earned in various taxjurisdictions that apply a broad range of income tax rates. The provision for income taxes differs from the taxcomputed at the U.S. federal statutory income tax rate due primarily to foreign earnings considered asindefinitely reinvested in foreign operations, state taxes, the permanent reenactment of the U.S. research anddevelopment tax credit, equity compensation, the U.S. domestic production activity deduction, and benefitsassociated with our tax election resulting from the Zinc Ahead acquisition. Future effective tax rates could beadversely affected if earnings are lower than anticipated in countries where we have lower statutory tax rates, byunfavorable changes in tax laws and regulations or by adverse rulings in tax related litigation. Differing tax ratesin various jurisdictions could harm our results of operations and financial condition by increasing our overall taxrate.
Fiscal 2016 compared to Fiscal 2015. Our effective tax rate decreased 920 basis points, primarily due to a960 basis point decrease from a one-time deferred tax asset benefit in the U.S. related to the Zinc Aheadacquisition, a 250 basis point decrease from the U.S. research and development credit, a 150 basis point decrease
56

in U.S. domestic production activity deduction , offset by 200 basis point increase of the valuation allowance anda 150 basis point increase associated with the mix of jurisdictional rates from our foreign operations.
In December 2015, the Protecting Americans from Tax Hikes (PATH) Act of 2015 was signed into law,which made permanent several business-related provisions such as the research tax credit for qualifying amountspaid or incurred after December 31, 2014. As a result of the retroactive extension, we recognized a tax benefit of$2.3 million in the fourth quarter of fiscal 2016 for qualifying amounts incurred in the calendar year 2015.
Fiscal 2015 compared to Fiscal 2014. Provision for income taxes increased $11.9 million, primarily due toan increase in income before taxes for the year, and an increase of 1% in our effective tax rate.
In December 2014, the Tax Increase Prevention Act of 2014 (the “2014 Act”) was signed into law, whichextended the research credit for one year to December 31, 2014. The extension of the research credit wasretroactive and includes amounts paid or incurred after December 31, 2013. As a result of the retroactiveextension, we recognized a tax benefit of $1.4 million in the fourth quarter of fiscal 2015 for qualifying amountsincurred in the calendar year 2014.
Non-GAAP Financial Measures
Regulation S-K Item 10(e), “Use of Non-GAAP Financial Measures in Commission Filings,” defines andprescribes the conditions for use of non-GAAP financial information. Our measures of non-GAAP operatingincome, non-GAAP net income and non-GAAP net income per share each meet the definition of a non-GAAPfinancial measure. In addition to our GAAP measures, we use these non-GAAP financial measures internally forbudgeting and resource allocation purposes and in analyzing our financial results. We believe these measures areuseful to investors, as a supplement to GAAP measures, as a means to evaluate period-to-period comparisons, inevaluating our ongoing operating results and trends and in comparing our financial measures with othercompanies in our industry, many of which present similar non-GAAP financial measures to investors. These non-GAAP measures are adjusted for the impact of expenses associated with stock-based compensation, amortizationof purchased intangibles, capitalization of expenses associated with development of internal-use software and thesubsequent amortization of the capitalized expenses, deferred compensation associated with the acquiredZinc Ahead business, and the tax effect of all of these non-GAAP adjustments. These items are excluded becausethe decisions which gave rise to them are not made to increase revenue in a particular period, but are made forour long-term benefit over multiple periods and we are not able to change or affect these items in any particularperiod.
Non-GAAP operating income and non-GAAP net income
We define non-GAAP net income as our total net income excluding the following components, which webelieve are not reflective of our ongoing operational expenses. In each case, for the reasons set forth below, webelieve that excluding the component provides useful information to investors and others in understanding andevaluating the impact of certain items to our operating results and future prospects in the same manner as it doesfor us, in comparing financial results across accounting periods and to those of peer companies and to betterunderstand the impact of these non-cash items on our gross margin and operating performance. Additionally, assignificant, unusual or discrete events occur, the income statement impact thereof may be excluded in the periodin which the events occur.
• Stock-based compensation expenses. We excluded stock-based compensation expenses from our non-GAAP measures primarily because they are non-cash expenses that we exclude from our internalmanagement reporting processes. We also find it useful to exclude certain non-cash charges to assessthe appropriate level of various operating expenses to assist in our budgeting, planning and forecastingof future periods. Moreover, because of varying available valuation methodologies, subjectiveassumptions and the variety of award types that companies can use under FASB ASC Topic 718, we
57

believe excluding stock-based compensation expenses allows investors to make meaningfulcomparisons between our recurring core business operating results and those of other companies.
• Amortization of purchased intangibles. We incur amortization expense for purchased intangible assetsin connection with acquisitions of certain businesses and technologies. Amortization of intangibleassets is a non-cash expense and is significantly inconsistent in amount and frequency affected by thetiming and size of new acquisitions. Because these costs have already been incurred and cannot berecovered, and are non-cash expenses, we exclude these expenses for internal management reportingpurposes. We also find it useful to exclude these fixed charges when assessing the appropriate level ofvarious operating expenses to assist in our budgeting, planning and forecasting of future periods.Investors should note that the use of intangible assets contributed to our revenues earned during theperiods presented and will contribute to our future period revenues as well. Amortization of purchasedintangible assets will recur in future periods.
• Capitalization of internal-use software development expenses and the subsequent amortization of thecapitalized expenses. We capitalize certain costs incurred for the development of computer software forinternal use and then amortize those costs over the estimated useful life. Capitalization andamortization of software development costs can vary significantly depending on the timing of productsreaching technological feasibility and being made generally available. Our internal managementreporting processes exclude both the capitalization of software (which would otherwise result in areduction in net research and development operating expenses) and the amortization of capitalizedsoftware (which would otherwise result in an increase in cost of subscription revenues) when preparingbudgets, plans and reviewing internal performance. Moreover, because of the variety of approachestaken and the subjective assumptions made by other companies in this area, we believe that excludingthe effects of capitalized software costs allows investors to make more meaningful comparisonsbetween our operating results and those of other companies.
• Deferred compensation associated with the acquired Zinc Ahead business. The Zinc Ahead sharepurchase agreement called for $10.0 million in share purchase consideration to be deferred and paid tocertain former Zinc Ahead employees at a rate of one-third of the deferred compensation amount peryear only in the event such former Zinc Ahead employees remain employed by Veeva on each deferredcompensation payment date. Pursuant to GAAP, these payments are being accounted for as deferredcompensation and the expense is recognized over the requisite service period. We believe excludingthese deferred compensation expenses from our non-GAAP measures may allow investors to makemore meaningful comparisons between our recurring business operating results and those of othercompanies.
• Income tax effects on the difference between GAAP and non-GAAP costs and expenses. The incometax effects that are excluded from the non-GAAP measures relate to the tax impact on the differencebetween GAAP and non-GAAP costs and expenses due to stock-based compensation, purchasedintangibles, capitalized internal-use software, and deferred compensation associated with the acquiredZinc Ahead business for GAAP and non-GAAP measures. Also included are certain tax items notdirectly related to the current fiscal year’s ordinary operating results. Examples of such tax itemsincludes, but are not limited to, changes in the valuation allowance related to deferred tax assets,certain acquisition-related costs and unusual or infrequently occurring items.
We define non-GAAP operating income as our operating income, as reported on our consolidated statementof comprehensive income, excluding stock-based compensation, amortization of purchased intangibles,capitalization of expenses associated with development of internal-use software and the subsequent amortizationof the capitalized expenses, and deferred compensation associated with the acquired Zinc Ahead business that areincluded in operating expenses.
58

Non-GAAP net income per share
Management uses the non-GAAP net income per share to provide an additional view of performance byexcluding items that are not directly related to performance in any particular period in the earnings per sharecalculation.
We define non-GAAP net income per share as our non-GAAP net income, which excludes the abovecomponents, which we believe are not reflective of our ongoing operational expenses, divided by diluted sharesoutstanding. Diluted shares outstanding are diluted shares, as reported on our consolidated statement ofcomprehensive income, adjusted for the 85,000,000 shares of convertible preferred stock that was issued andoutstanding for the year, or the proportionate part of, prior to our initial public offering which were assumed tobe converted to common shares.
Limitations on the use of Non-GAAP financial measures
A limitation of our non-GAAP financial measures of non-GAAP operating income, non-GAAP net incomeand non-GAAP net income per share is that they are not prepared in accordance with GAAP, may be differentfrom non-GAAP financial measures used by other companies, and do not have uniform definitions. Ourdefinitions will likely differ from the definitions used by other companies, including peer companies, andtherefore comparability may be limited.
The non-GAAP financial measures are limited in value because they exclude certain items that may have amaterial impact upon our reported financial results. In addition, they are subject to inherent limitations as theyreflect the exercise of judgments by management about which items are adjusted to calculate our non-GAAPfinancial measures. Thus, our non-GAAP measures of non-GAAP operating income, non-GAAP net income andnon-GAAP net income per share should be considered in addition to, not as a substitute for, or in isolation from,measures prepared in accordance with GAAP. Additionally, in the case of stock-based expense, if we did not paya portion of compensation in the form of stock-based expense, the cash salary expense included in costs ofrevenues and operating expenses would be higher, which would affect our cash position and our non-GAAPprofitability. Veeva compensates for these limitations by analyzing current and future results on a GAAP basis aswell as a non-GAAP basis and also by providing GAAP measures in our public disclosures.
Non-GAAP financial measures should not be considered in isolation from, or as a substitute for, financialinformation prepared in accordance with GAAP. Investors are encouraged to review the reconciliation of thesenon-GAAP measures to their most directly comparable GAAP financial measure and not to rely on any singlefinancial measure to evaluate our business. A reconciliation of GAAP to the non-GAAP financial measures hasbeen provided in the tables below.
We compensate for these limitations by reconciling non-GAAP gross profit, non-GAAP operating profit,non-GAAP net income and non-GAAP earnings per share to the most comparable GAAP financial measure. Weencourage investors and others to review our financial information in its entirety, not to rely on any singlefinancial measure and to view our non-GAAP financial measures in conjunction with the most comparableGAAP financial measures.
59
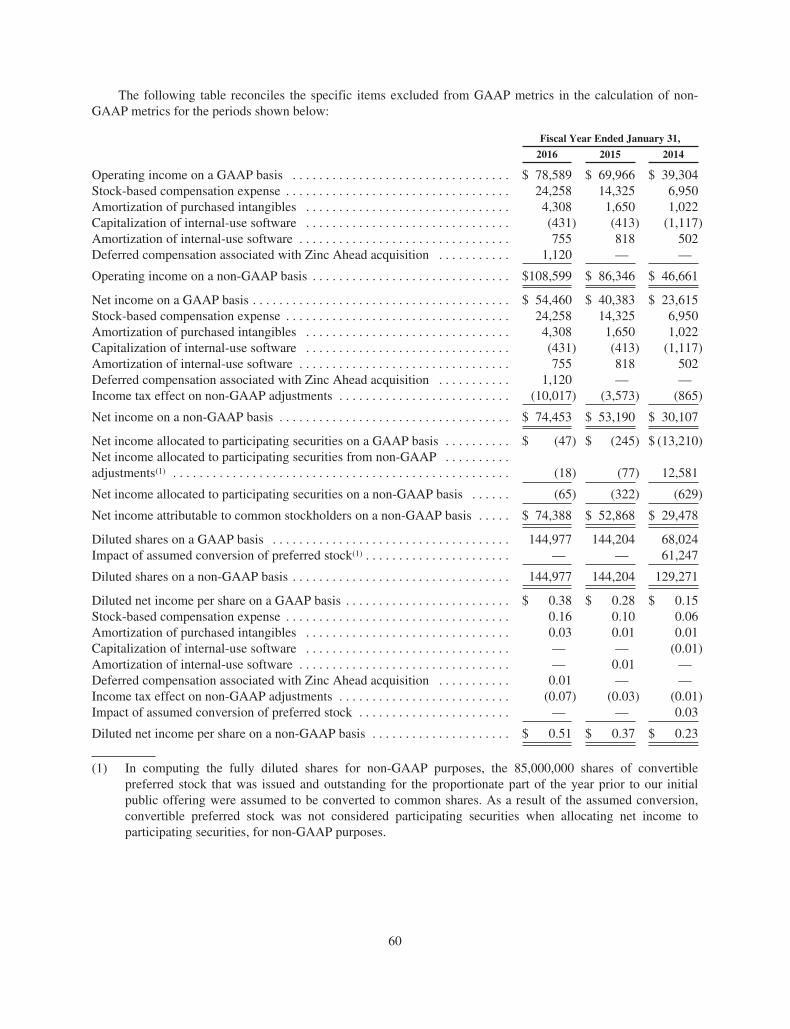
The following table reconciles the specific items excluded from GAAP metrics in the calculation of non-GAAP metrics for the periods shown below:
Fiscal Year Ended January 31,
2016 2015 2014
Operating income on a GAAP basis . . . . . . . . . . . . . . . . . . . . . . . . . . . . . . . . . $ 78,589 $ 69,966 $ 39,304Stock-based compensation expense . . . . . . . . . . . . . . . . . . . . . . . . . . . . . . . . . . 24,258 14,325 6,950Amortization of purchased intangibles . . . . . . . . . . . . . . . . . . . . . . . . . . . . . . . 4,308 1,650 1,022Capitalization of internal-use software . . . . . . . . . . . . . . . . . . . . . . . . . . . . . . . (431) (413) (1,117)Amortization of internal-use software . . . . . . . . . . . . . . . . . . . . . . . . . . . . . . . . 755 818 502Deferred compensation associated with Zinc Ahead acquisition . . . . . . . . . . . 1,120 — —
Operating income on a non-GAAP basis . . . . . . . . . . . . . . . . . . . . . . . . . . . . . . $108,599 $ 86,346 $ 46,661
Net income on a GAAP basis . . . . . . . . . . . . . . . . . . . . . . . . . . . . . . . . . . . . . . . $ 54,460 $ 40,383 $ 23,615Stock-based compensation expense . . . . . . . . . . . . . . . . . . . . . . . . . . . . . . . . . . 24,258 14,325 6,950Amortization of purchased intangibles . . . . . . . . . . . . . . . . . . . . . . . . . . . . . . . 4,308 1,650 1,022Capitalization of internal-use software . . . . . . . . . . . . . . . . . . . . . . . . . . . . . . . (431) (413) (1,117)Amortization of internal-use software . . . . . . . . . . . . . . . . . . . . . . . . . . . . . . . . 755 818 502Deferred compensation associated with Zinc Ahead acquisition . . . . . . . . . . . 1,120 — —Income tax effect on non-GAAP adjustments . . . . . . . . . . . . . . . . . . . . . . . . . . (10,017) (3,573) (865)
Net income on a non-GAAP basis . . . . . . . . . . . . . . . . . . . . . . . . . . . . . . . . . . . $ 74,453 $ 53,190 $ 30,107
Net income allocated to participating securities on a GAAP basis . . . . . . . . . . $ (47) $ (245) $ (13,210)Net income allocated to participating securities from non-GAAP . . . . . . . . . .adjustments(1) . . . . . . . . . . . . . . . . . . . . . . . . . . . . . . . . . . . . . . . . . . . . . . . . . . . (18) (77) 12,581
Net income allocated to participating securities on a non-GAAP basis . . . . . . (65) (322) (629)
Net income attributable to common stockholders on a non-GAAP basis . . . . . $ 74,388 $ 52,868 $ 29,478
Diluted shares on a GAAP basis . . . . . . . . . . . . . . . . . . . . . . . . . . . . . . . . . . . . 144,977 144,204 68,024Impact of assumed conversion of preferred stock(1) . . . . . . . . . . . . . . . . . . . . . . — — 61,247
Diluted shares on a non-GAAP basis . . . . . . . . . . . . . . . . . . . . . . . . . . . . . . . . . 144,977 144,204 129,271
Diluted net income per share on a GAAP basis . . . . . . . . . . . . . . . . . . . . . . . . . $ 0.38 $ 0.28 $ 0.15Stock-based compensation expense . . . . . . . . . . . . . . . . . . . . . . . . . . . . . . . . . . 0.16 0.10 0.06Amortization of purchased intangibles . . . . . . . . . . . . . . . . . . . . . . . . . . . . . . . 0.03 0.01 0.01Capitalization of internal-use software . . . . . . . . . . . . . . . . . . . . . . . . . . . . . . . — — (0.01)Amortization of internal-use software . . . . . . . . . . . . . . . . . . . . . . . . . . . . . . . . — 0.01 —Deferred compensation associated with Zinc Ahead acquisition . . . . . . . . . . . 0.01 — —Income tax effect on non-GAAP adjustments . . . . . . . . . . . . . . . . . . . . . . . . . . (0.07) (0.03) (0.01)Impact of assumed conversion of preferred stock . . . . . . . . . . . . . . . . . . . . . . . — — 0.03
Diluted net income per share on a non-GAAP basis . . . . . . . . . . . . . . . . . . . . . $ 0.51 $ 0.37 $ 0.23
(1) In computing the fully diluted shares for non-GAAP purposes, the 85,000,000 shares of convertiblepreferred stock that was issued and outstanding for the proportionate part of the year prior to our initialpublic offering were assumed to be converted to common shares. As a result of the assumed conversion,convertible preferred stock was not considered participating securities when allocating net income toparticipating securities, for non-GAAP purposes.
60
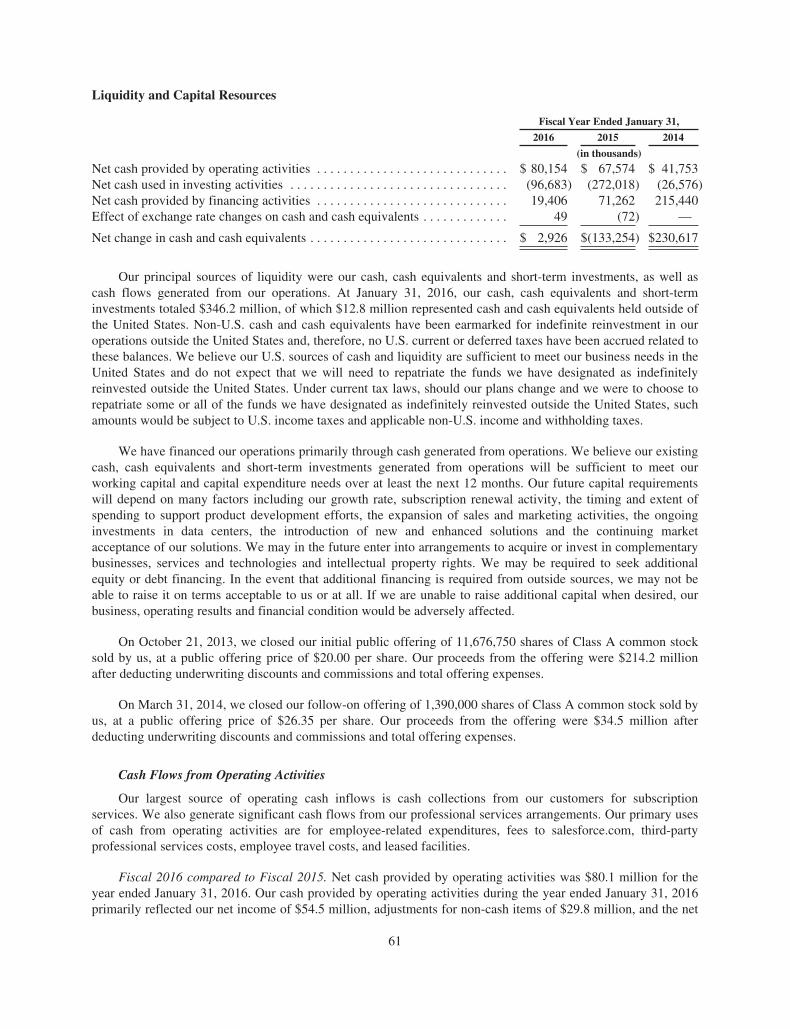
Liquidity and Capital Resources
Fiscal Year Ended January 31,
2016 2015 2014
(in thousands)
Net cash provided by operating activities . . . . . . . . . . . . . . . . . . . . . . . . . . . . . $ 80,154 $ 67,574 $ 41,753Net cash used in investing activities . . . . . . . . . . . . . . . . . . . . . . . . . . . . . . . . . (96,683) (272,018) (26,576)Net cash provided by financing activities . . . . . . . . . . . . . . . . . . . . . . . . . . . . . 19,406 71,262 215,440Effect of exchange rate changes on cash and cash equivalents . . . . . . . . . . . . . 49 (72) —
Net change in cash and cash equivalents . . . . . . . . . . . . . . . . . . . . . . . . . . . . . . $ 2,926 $(133,254) $230,617
Our principal sources of liquidity were our cash, cash equivalents and short-term investments, as well ascash flows generated from our operations. At January 31, 2016, our cash, cash equivalents and short-terminvestments totaled $346.2 million, of which $12.8 million represented cash and cash equivalents held outside ofthe United States. Non-U.S. cash and cash equivalents have been earmarked for indefinite reinvestment in ouroperations outside the United States and, therefore, no U.S. current or deferred taxes have been accrued related tothese balances. We believe our U.S. sources of cash and liquidity are sufficient to meet our business needs in theUnited States and do not expect that we will need to repatriate the funds we have designated as indefinitelyreinvested outside the United States. Under current tax laws, should our plans change and we were to choose torepatriate some or all of the funds we have designated as indefinitely reinvested outside the United States, suchamounts would be subject to U.S. income taxes and applicable non-U.S. income and withholding taxes.
We have financed our operations primarily through cash generated from operations. We believe our existingcash, cash equivalents and short-term investments generated from operations will be sufficient to meet ourworking capital and capital expenditure needs over at least the next 12 months. Our future capital requirementswill depend on many factors including our growth rate, subscription renewal activity, the timing and extent ofspending to support product development efforts, the expansion of sales and marketing activities, the ongoinginvestments in data centers, the introduction of new and enhanced solutions and the continuing marketacceptance of our solutions. We may in the future enter into arrangements to acquire or invest in complementarybusinesses, services and technologies and intellectual property rights. We may be required to seek additionalequity or debt financing. In the event that additional financing is required from outside sources, we may not beable to raise it on terms acceptable to us or at all. If we are unable to raise additional capital when desired, ourbusiness, operating results and financial condition would be adversely affected.
On October 21, 2013, we closed our initial public offering of 11,676,750 shares of Class A common stocksold by us, at a public offering price of $20.00 per share. Our proceeds from the offering were $214.2 millionafter deducting underwriting discounts and commissions and total offering expenses.
On March 31, 2014, we closed our follow-on offering of 1,390,000 shares of Class A common stock sold byus, at a public offering price of $26.35 per share. Our proceeds from the offering were $34.5 million afterdeducting underwriting discounts and commissions and total offering expenses.
Cash Flows from Operating Activities
Our largest source of operating cash inflows is cash collections from our customers for subscriptionservices. We also generate significant cash flows from our professional services arrangements. Our primary usesof cash from operating activities are for employee-related expenditures, fees to salesforce.com, third-partyprofessional services costs, employee travel costs, and leased facilities.
Fiscal 2016 compared to Fiscal 2015. Net cash provided by operating activities was $80.1 million for theyear ended January 31, 2016. Our cash provided by operating activities during the year ended January 31, 2016primarily reflected our net income of $54.5 million, adjustments for non-cash items of $29.8 million, and the net
61

decrease in our operating assets and liabilities of $4.2 million. Non-cash charges included $24.3 million of stock-based compensation expense, $8.5 million of depreciation and amortization expense and $2.8 million ofamortization of premiums on short-term investments. The net changes in operating assets and liabilities includeda $39.4 million increase in deferred revenue resulting primarily from increased orders from new and existingcustomers and a $5.0 million increase in accrued expenses and other current liabilities. These sources of cashwere partially offset by a $46.7 million increase in accounts receivable related to the timing of billings andcollections, a $5.9 million increase in our net deferred income taxes, and a $3.4 million increase in our netincome tax obligations related to the timing of tax payments.
Fiscal 2015 compared to Fiscal 2014. Net cash provided by operating activities was $67.6 million for theyear ended January 31, 2015. Our cash provided by operating activities during the year ended January 31, 2015primarily reflected our net income of $40.4 million, adjustments for non-cash items of $14.3 million of stock-based compensation expense and $3.9 million of depreciation and amortization expense. Additional sources ofcash inflows were from changes in our working capital, which included a $45.6 million increase in deferredrevenue resulting primarily from increased orders from new and existing customers and a $3.3 million increase inour net income tax obligations related to the timing of tax payments. These sources of cash were partially offsetby a $34.5 million increase in accounts receivable related to the timing of billings and collections, a $4.7 millionincrease in other current and long-term assets and a $4.3 million increase in our net deferred income taxes assets.
Cash Flows from Investing Activities
The cash flows from investing activities primarily relate to cash used for acquisition of businesses and thepurchase of marketable securities, net of maturities. We also use cash to invest in capital assets to support ourgrowth, including the build-out of our new corporate headquarters located in Pleasanton, California.
Fiscal 2016 compared to Fiscal 2015. Net cash used in investing activities was $96.7 million for the yearended January 31, 2016 resulting primarily from $126.2 million used in the acquisition of two businesses(comprised of $116.5 million in cash used to complete the acquisition of Zinc Ahead and $9.7 million in cashused to complete the acquisition of Qforma CrowdLink) and $21.2 million in cash used for purchases of propertyand equipment primarily for the build-out of our new corporate headquarters. The cash outflows were offset by$51.6 million provided from net maturities of marketable securities.
Fiscal 2015 compared to Fiscal 2014. Net cash used in investing activities was $272.0 million for the yearended January 31, 2015 resulting primarily from $245.1 million in net purchases of marketable securities and$26.5 million in cash used for purchases of property and equipment, which primarily includes the July 2014purchase of our new corporate headquarters located in Pleasanton, California for $24.0 million.
Cash Flows from Financing Activities
The cash flows from financing activities relate to proceeds from our public offerings of Class A commonstock, stock option exercises and excess tax benefits from our stock plans.
Fiscal 2016 compared to Fiscal 2015. Net cash provided by financing activities was $19.5 million for theyear ended January 31, 2016 resulting from $13.5 million in excess tax benefits from our employee stock plansand $5.9 million in proceeds from employee stock option exercises.
Fiscal 2015 compared to Fiscal 2014. Net cash provided by financing activities was $71.3 million for theyear ended January 31, 2015 resulting from $34.2 million net proceeds from our follow-on public offering,$25.3 million in excess tax benefits from our employee stock plans, and $11.8 million from employeesparticipating in the employee stock plans.
62

Commitments
Our principal commitments primarily consist of obligations for minimum payment commitments tosalesforce.com and leases for office space. On March 3, 2014, we amended our agreement withsalesforce.com. The agreement, as amended, requires that we meet minimum order commitments of $500 millionover the term of the agreement, which ends on September 1, 2025, including “true-up” payments if the orders weplace with salesforce.com have not equaled or exceeded the following aggregate amounts within the timeframesindicated: (i) $250 million for the period from March 1, 2014 to September 1, 2020 and (ii) the full amount of$500 million by September 1, 2025. Additionally, Zinc Ahead, a recently acquired business, has an authorizedOEM agreement with VYRE Limited for use and resale of certain proprietary products used for digital assetmanagement in combination with the Zinc Ahead product offerings.
As of January 31, 2016, the future non-cancelable minimum payments under these commitments were asfollows:
Payments Due by Period
TotalLess than
1 Year1-3
Years3-5
YearsMore than
5 Years
(in thousands)
Purchase commitments . . . . . . . . . . . . . . . . . . . . . . . . . . . . $411,581 $4,902 $ 400 $156,280 $250,000Operating lease obligations . . . . . . . . . . . . . . . . . . . . . . . . 11,094 3,079 3,966 2,615 1,434
Total . . . . . . . . . . . . . . . . . . . . . . . . . . . . . . . . . . . . . . . . . . $422,675 $7,981 $4,366 $158,895 $251,434
The amounts in the table above are associated with agreements that are enforceable and legally binding,which specify significant terms including payment terms, related services and the approximate timing of thetransaction. Obligations under agreements that we can cancel without a significant penalty are not included in thetable.
We anticipate leasing additional office space in various locations around the world to support our growth. Inaddition, our existing lease agreements often provide us with an option to renew. We expect our future operatinglease obligations will increase as we expand our operations.
Off-Balance Sheet Arrangements
We do not have any relationships with unconsolidated organizations or financial partnerships, such asstructured finance or special purpose entities that would have been established for the purpose of facilitating off-balance sheet arrangements or other contractually narrow or limited purposes.
Critical Accounting Policies and Estimates
Our consolidated financial statements are prepared in accordance with generally accepted accountingprinciples in the United States (GAAP). In the preparation of these consolidated financial statements, we arerequired to make estimates and assumptions that affect the reported amounts of assets, liabilities, revenues, costsand expenses and related disclosures. On an ongoing basis, we evaluate our estimates and assumptions. Ouractual results may differ from these estimates under different assumptions or conditions.
We believe that of our significant accounting policies, which are described in note 1 of the notes to ourconsolidated financial statements, the following accounting policies involve a greater degree of judgment andcomplexity. Accordingly, these are the policies we believe are the most critical to aid in fully understanding andevaluating our consolidated financial condition and results of operations.
63
Revenue Recognition
We consider revenue recognition to be a significant accounting policy. For a description of our applicationof GAAP to our revenue recognition, see note 1 of the notes to our consolidated financial statements.
Stock-Based Compensation
We consider compensation expense related to stock-based transactions, including the assumptions used inthe determination of the fair value of option awards to be a significant accounting policy. For a description of ourassumptions used for our stock-based compensation policy, see note 11 of the notes to our consolidated financialstatements.
In addition to assumptions used in determining the fair value of each option award, we must also estimate aforfeiture rate to calculate the stock-based compensation expense for our option awards. Our forfeiture rate isbased on an analysis of our actual forfeitures. We will continue to evaluate the appropriateness of the forfeiturerate based on actual forfeiture experience, analysis of employee turnover and other factors. Changes in theestimated forfeiture rate can have a significant impact on our stock-based compensation expense as thecumulative effect of adjusting the rate is recognized in the period the forfeiture rate is revised. If a revisedforfeiture rate is higher than the previously estimated forfeiture rate, an adjustment is made that will result in adecrease to the stock-based compensation expense recognized in the consolidated financial statements. If arevised forfeiture rate is lower than the previously estimated forfeiture rate, an adjustment is made that will resultin an increase to the stock-based compensation expense recognized in the consolidated financial statements.
We will continue to use judgment in evaluating the assumptions related to our stock-based compensationexpense on a prospective basis. As we continue to accumulate additional data related to our common stock, wemay have refinements to our estimates, which could materially impact our future stock-based compensationexpense.
Valuation of Goodwill and Intangible Assets
Goodwill and Intangible Assets. When we acquire businesses, we allocate the purchase price to the tangibleassets, liabilities and identifiable intangible assets acquired. Any residual purchase price is recorded as goodwill.The allocation of the purchase price requires management to make significant estimates in determining the fairvalue of acquired assets and assumed liabilities, especially with respect to intangible assets. These estimates arebased on information obtained from management of the acquired companies, market participant data, andhistorical experience. These estimates can include, but are not limited to:
• the time and expenses that would be necessary to recreate the asset;
• the profit margin a market participant would receive;
• cash flows that an asset is expected to generate in the future; and
• discount rates.
These estimates are inherently uncertain and unpredictable. A change in these estimates could impact ourallocation of purchase price to the acquired assets and assumed liabilities. During the measurement period, whichis not to exceed one year from the acquisition date, we may record adjustments to the assets acquired andliabilities assumed, with the corresponding offset to goodwill based on updated estimate information or facts andcircumstances existing as of the acquisition date. Following the earlier of 1) receipt of all necessary informationto determine the fair value of assets acquired and liabilities assumed, or 2) one year from the acquisition date,any subsequent adjustments are recorded to earnings.
64
ITEM 7A. QUANTITATIVE AND QUALITATIVE DISCLOSURES ABOUT MARKET RISK
Foreign currency exchange risk
Our results of operations and cash flows are subject to fluctuations due to changes in foreign currencyexchange rates, particularly changes in the Euro and Japanese Yen. Revenues outside of North America as apercentage of revenues were approximately 45%, 45% and 35% in our fiscal years ended January 31, 2016, 2015and 2014, respectively. Changes in exchange rates may negatively affect our revenues and other operating resultsas expressed in U.S. dollars. For our fiscal years ended January 31, 2016, 2015 and 2014, our foreign currencyloss was $1.8 million, $3.9 million and $0.9 million, respectively.
We have experienced and will continue to experience fluctuations in our net income as a result oftransaction gains or losses related to revaluing certain current asset and current liability balances that aredenominated in currencies other than the functional currency of the entities in which they are recorded. While wehave not engaged in the hedging of our foreign currency transactions to date, we are currently evaluating thecosts and benefits of initiating such a program and may, in the future, hedge selected significant transactions ornet monetary exposure positions denominated in currencies other than the U.S. dollar.
Interest rate sensitivity
We had cash, cash equivalents and short-term investments totaling $346.2 million as of January 31, 2016.This amount was invested primarily in money market funds, asset-based securities, commercial paper, corporatenotes and bonds, U.S. agency obligations, U.S. treasury securities. The cash and cash equivalents are held forworking capital purposes. Our investments are made for capital preservation purposes. We do not enter intoinvestments for trading or speculative purposes.
Our cash equivalents and our portfolio of marketable securities are subject to market risk due to changes ininterest rates, which could affect our results of operations. Fixed rate securities may have their market valueadversely affected due to a rise in interest rates, while floating rate securities may produce less income thanexpected if interest rates fall. Due in part to these factors, our future investment income may fluctuate due tochanges in interest rates or we may suffer losses in principal if we are forced to sell securities that decline inmarket value due to changes in interest rates. However because we classify our marketable securities as“available for sale,” no gains or losses are recognized due to changes in interest rates unless such securities aresold prior to maturity or declines in fair value are determined to be other-than-temporary. Our fixed-incomeportfolio is subject to interest rate risk.
An immediate increase of 100-basis points in interest rates would have resulted in a $1.5 million marketvalue reduction in our investment portfolio as of January 31, 2016. All of our investments earn less than100-basis points and as a result, an immediate decrease of 100-basis points in interest rates would have increasedthe market value by $1.1 million as of January 31, 2016. This estimate is based on a sensitivity model thatmeasures market value changes when changes in interest rates occur. Fluctuations in the value of our investmentsecurities caused by a change in interest rates (gains or losses on the carrying value) are recorded in othercomprehensive income, and are realized only if we sell the underlying securities.
65

ITEM 8. CONSOLIDATED FINANCIAL STATEMENTS AND SUPPLEMENTARY DATA
VEEVA SYSTEMS INC.
INDEX TO CONSOLIDATED FINANCIAL STATEMENTS
Report of Independent Registered Public Accounting Firm . . . . . . . . . . . . . . . . . . . . . . . . . . . . . . . . . . . . . . . . 67Consolidated Balance Sheets . . . . . . . . . . . . . . . . . . . . . . . . . . . . . . . . . . . . . . . . . . . . . . . . . . . . . . . . . . . . . . . 69Consolidated Statements of Comprehensive Income . . . . . . . . . . . . . . . . . . . . . . . . . . . . . . . . . . . . . . . . . . . . . 70Consolidated Statements of Stockholders’ Equity . . . . . . . . . . . . . . . . . . . . . . . . . . . . . . . . . . . . . . . . . . . . . . . 71Consolidated Statements of Cash Flows . . . . . . . . . . . . . . . . . . . . . . . . . . . . . . . . . . . . . . . . . . . . . . . . . . . . . . . 72Notes to Consolidated Financial Statements . . . . . . . . . . . . . . . . . . . . . . . . . . . . . . . . . . . . . . . . . . . . . . . . . . . . 73
66

Report of Independent Registered Public Accounting Firm
The Board of Directors and StockholdersVeeva Systems Inc.:
We have audited the accompanying consolidated balance sheets of Veeva Systems Inc. (the Company) andits subsidiaries as of January 31, 2016 and 2015, and the related consolidated statements of comprehensiveincome, stockholders’ equity and cash flows for each of the years in the three-year period ended January 31,2016. We also have audited the Company’s internal control over financial reporting as of January 31, 2016,based on criteria established in Internal Control – Integrated Framework (2013) issued by the Committee ofSponsoring Organizations of the Treadway Commission (COSO). The Company’s management is responsible forthese consolidated financial statements, for maintaining effective internal control over financial reporting, and forits assessment of the effectiveness of internal control over financial reporting, included in the accompanyingmanagement’s report on internal control over financial reporting appearing under Item 9A(b). Our responsibilityis to express an opinion on these consolidated financial statements and an opinion on the Company’s internalcontrol over financial reporting based on our audits.
We conducted our audits in accordance with the standards of the Public Company Accounting OversightBoard (United States). Those standards require that we plan and perform the audits to obtain reasonableassurance about whether the financial statements are free of material misstatement and whether effective internalcontrol over financial reporting was maintained in all material respects. Our audits of the consolidated financialstatements included examining, on a test basis, evidence supporting the amounts and disclosures in the financialstatements, assessing the accounting principles used and significant estimates made by management, andevaluating the overall financial statement presentation. Our audit of internal control over financial reportingincluded obtaining an understanding of internal control over financial reporting, assessing the risk that a materialweakness exists, and testing and evaluating the design and operating effectiveness of internal control based onthe assessed risk. Our audits also included performing such other procedures as we considered necessary in thecircumstances. We believe that our audits provide a reasonable basis for our opinions.
A company’s internal control over financial reporting is a process designed to provide reasonable assuranceregarding the reliability of financial reporting and the preparation of financial statements for external purposes inaccordance with generally accepted accounting principles. A company’s internal control over financial reportingincludes those policies and procedures that (1) pertain to the maintenance of records that, in reasonable detail,accurately and fairly reflect the transactions and dispositions of the assets of the company; (2) provide reasonableassurance that transactions are recorded as necessary to permit preparation of financial statements in accordancewith generally accepted accounting principles, and that receipts and expenditures of the company are being madeonly in accordance with authorizations of management and directors of the company; and (3) provide reasonableassurance regarding prevention or timely detection of unauthorized acquisition, use, or disposition of thecompany’s assets that could have a material effect on the financial statements.
Because of its inherent limitations, internal control over financial reporting may not prevent or detectmisstatements. Also, projections of any evaluation of effectiveness to future periods are subject to the risk thatcontrols may become inadequate because of changes in conditions, or that the degree of compliance with thepolicies or procedures may deteriorate.
A material weakness is a deficiency, or a combination of deficiencies, in internal control over financialreporting, such that there is a reasonable possibility that a material misstatement of the company’s annual orinterim financial statements will not be prevented or detected on a timely basis. A material weakness related tothe valuation of acquired intangibles assets has been identified and included in management’s assessment inItem 9A(b). This material weakness was considered in determining the nature, timing, and extent of audit testsapplied in our audit of the 2016 consolidated financial statements, and this report does not affect our opinionincluded below on those consolidated financial statements.
67

In our opinion, the consolidated financial statements referred to above present fairly, in all material respects,the financial position of Veeva Systems Inc. and subsidiaries as of January 31, 2016 and 2015, and the results ofits operations and its cash flows for each of the years in the three-year period ended January 31, 2016, inconformity with U.S. generally accepted accounting principles.
Veeva Systems Inc. acquired Zinc Ahead and Qforma CrowdLink during 2016, and management excludedfrom its assessment of the effectiveness of Veeva Systems Inc.’s internal control over financial reporting as ofJanuary 31, 2016, Zinc Ahead and Qforma CrowdLink’s internal control over financial reporting associated withrevenues of 2% and less than 1%, respectively, of consolidated revenues, and with assets of 1% and less than 1%,respectively, of consolidated assets of Veeva Systems Inc. and subsidiaries as of and for the year endedJanuary 31, 2016. Our audit of internal control over financial reporting of Veeva Systems Inc. also excluded anevaluation of the internal control over financial reporting of Zinc Ahead and Qforma CrowdLink.
Also in our opinion, because of the effect of the aforementioned material weakness on the achievement ofthe objectives of the control criteria, Veeva Systems Inc. has not maintained effective internal control overfinancial reporting as of January 31, 2016, based on criteria established in Internal Control—IntegratedFramework (2013) issued by the Committee of Sponsoring Organizations of the Treadway Commission (COSO).
/s/ KPMG LLP
Santa Clara, CaliforniaMarch 31, 2016
68

VEEVA SYSTEMS INC.CONSOLIDATED BALANCE SHEETS
(In thousands, except number of shares and par value)
January 31,
2016 2015
AssetsCurrent assets:Cash and cash equivalents . . . . . . . . . . . . . . . . . . . . . . . . . . . . . . . . . . . . . . . . . . . . . . . $132,179 $129,253Short-term investments . . . . . . . . . . . . . . . . . . . . . . . . . . . . . . . . . . . . . . . . . . . . . . . . . 214,024 268,620Accounts receivable, net of allowance for doubtful accounts of $542 and $413,
respectively . . . . . . . . . . . . . . . . . . . . . . . . . . . . . . . . . . . . . . . . . . . . . . . . . . . . . . . . 144,798 92,661Deferred income taxes . . . . . . . . . . . . . . . . . . . . . . . . . . . . . . . . . . . . . . . . . . . . . . . . . . — 4,815Prepaid expenses and other current assets . . . . . . . . . . . . . . . . . . . . . . . . . . . . . . . . . . 9,963 6,488
Total current assets . . . . . . . . . . . . . . . . . . . . . . . . . . . . . . . . . . . . . . . . . . . . . . . . 500,964 501,837Property and equipment, net . . . . . . . . . . . . . . . . . . . . . . . . . . . . . . . . . . . . . . . . . . . . . . . . . 47,469 28,203Capitalized internal-use software, net . . . . . . . . . . . . . . . . . . . . . . . . . . . . . . . . . . . . . . . . . . 979 1,240Goodwill . . . . . . . . . . . . . . . . . . . . . . . . . . . . . . . . . . . . . . . . . . . . . . . . . . . . . . . . . . . . . . . . 95,804 4,850Intangible assets, net . . . . . . . . . . . . . . . . . . . . . . . . . . . . . . . . . . . . . . . . . . . . . . . . . . . . . . . 47,500 4,904Deferred income taxes, noncurrent . . . . . . . . . . . . . . . . . . . . . . . . . . . . . . . . . . . . . . . . . . . . 9,359 —Other long-term assets . . . . . . . . . . . . . . . . . . . . . . . . . . . . . . . . . . . . . . . . . . . . . . . . . . . . . . 3,724 3,856
Total assets . . . . . . . . . . . . . . . . . . . . . . . . . . . . . . . . . . . . . . . . . . . . . . . . . . . . . . . . . . . . . . $705,799 $544,890
Liabilities and stockholders’ equityCurrent liabilities:
Accounts payable . . . . . . . . . . . . . . . . . . . . . . . . . . . . . . . . . . . . . . . . . . . . . . . . . . . . . $ 4,600 $ 3,886Accrued compensation and benefits . . . . . . . . . . . . . . . . . . . . . . . . . . . . . . . . . . . . . . . 12,451 6,497Accrued expenses and other current liabilities . . . . . . . . . . . . . . . . . . . . . . . . . . . . . . . 11,059 8,939Income tax payable . . . . . . . . . . . . . . . . . . . . . . . . . . . . . . . . . . . . . . . . . . . . . . . . . . . . 750 3,241Deferred revenue . . . . . . . . . . . . . . . . . . . . . . . . . . . . . . . . . . . . . . . . . . . . . . . . . . . . . . 157,419 112,960
Total current liabilities . . . . . . . . . . . . . . . . . . . . . . . . . . . . . . . . . . . . . . . . . . . . . 186,279 135,523Deferred income taxes, noncurrent . . . . . . . . . . . . . . . . . . . . . . . . . . . . . . . . . . . . . . . . . . . . 10,622 170Other long-term liabilities . . . . . . . . . . . . . . . . . . . . . . . . . . . . . . . . . . . . . . . . . . . . . . . . . . . 3,649 2,364
Total liabilities . . . . . . . . . . . . . . . . . . . . . . . . . . . . . . . . . . . . . . . . . . . . . . . . . . . 200,550 138,057
Commitments and contingencies (Note 13)Stockholders’ equity:
Class A common stock, $0.00001 par value; 800,000,000 shares authorized,87,359,026 and 64,729,479 issued and outstanding at January 31, 2016 and 2015,respectively . . . . . . . . . . . . . . . . . . . . . . . . . . . . . . . . . . . . . . . . . . . . . . . . . . . . . . . . 1 —
Class B common stock, $0.00001 par value; 190,000,000 shares authorized,46,186,159 and 66,338,146 issued and outstanding at January 31, 2016 and 2015,respectively . . . . . . . . . . . . . . . . . . . . . . . . . . . . . . . . . . . . . . . . . . . . . . . . . . . . . . . . — 1
Additional paid-in capital . . . . . . . . . . . . . . . . . . . . . . . . . . . . . . . . . . . . . . . . . . . . . . . 361,691 317,881Accumulated other comprehensive income . . . . . . . . . . . . . . . . . . . . . . . . . . . . . . . . . 172 26Retained earnings . . . . . . . . . . . . . . . . . . . . . . . . . . . . . . . . . . . . . . . . . . . . . . . . . . . . . 143,385 88,925
Total stockholders’ equity . . . . . . . . . . . . . . . . . . . . . . . . . . . . . . . . . . . . . . . . . . . 505,249 406,833
Total liabilities and stockholders’ equity . . . . . . . . . . . . . . . . . . . . . . . . . . . . . . . . . . . . . $705,799 $544,890
See Notes to Consolidated Financial Statements.
69
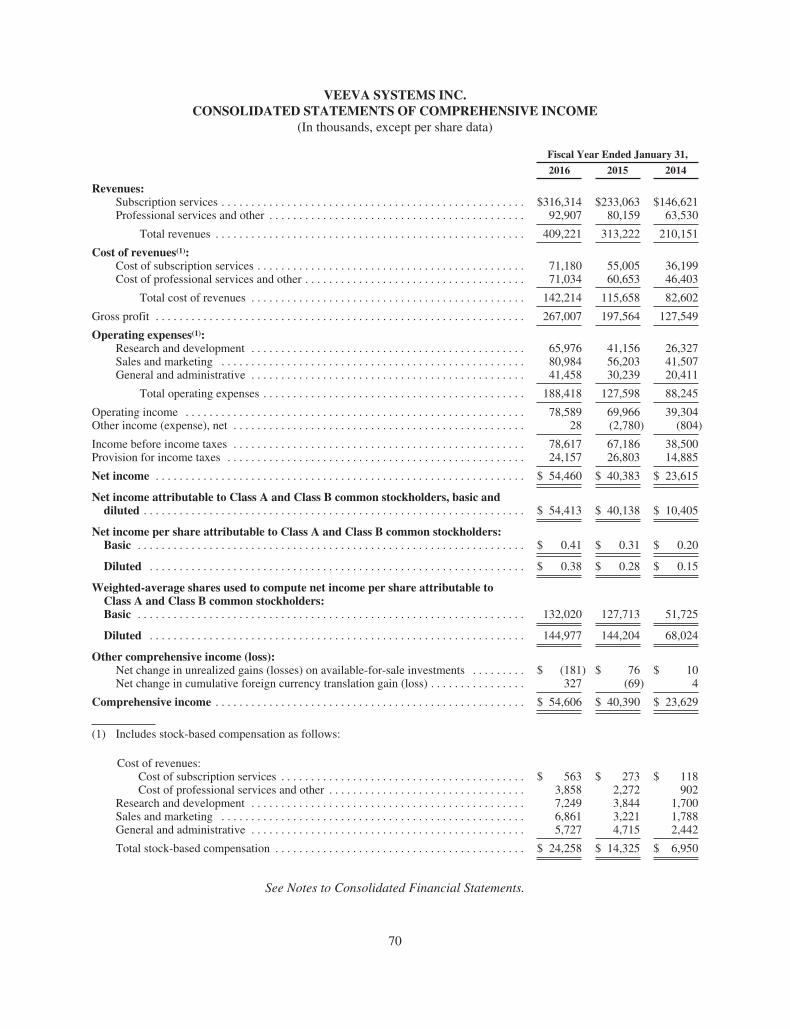
VEEVA SYSTEMS INC.CONSOLIDATED STATEMENTS OF COMPREHENSIVE INCOME
(In thousands, except per share data)
Fiscal Year Ended January 31,
2016 2015 2014
Revenues:Subscription services . . . . . . . . . . . . . . . . . . . . . . . . . . . . . . . . . . . . . . . . . . . . . . . . . . . $316,314 $233,063 $146,621Professional services and other . . . . . . . . . . . . . . . . . . . . . . . . . . . . . . . . . . . . . . . . . . . 92,907 80,159 63,530
Total revenues . . . . . . . . . . . . . . . . . . . . . . . . . . . . . . . . . . . . . . . . . . . . . . . . . . . . 409,221 313,222 210,151
Cost of revenues(1):Cost of subscription services . . . . . . . . . . . . . . . . . . . . . . . . . . . . . . . . . . . . . . . . . . . . . 71,180 55,005 36,199Cost of professional services and other . . . . . . . . . . . . . . . . . . . . . . . . . . . . . . . . . . . . . 71,034 60,653 46,403
Total cost of revenues . . . . . . . . . . . . . . . . . . . . . . . . . . . . . . . . . . . . . . . . . . . . . . 142,214 115,658 82,602
Gross profit . . . . . . . . . . . . . . . . . . . . . . . . . . . . . . . . . . . . . . . . . . . . . . . . . . . . . . . . . . . . . . 267,007 197,564 127,549
Operating expenses(1):Research and development . . . . . . . . . . . . . . . . . . . . . . . . . . . . . . . . . . . . . . . . . . . . . . 65,976 41,156 26,327Sales and marketing . . . . . . . . . . . . . . . . . . . . . . . . . . . . . . . . . . . . . . . . . . . . . . . . . . . 80,984 56,203 41,507General and administrative . . . . . . . . . . . . . . . . . . . . . . . . . . . . . . . . . . . . . . . . . . . . . . 41,458 30,239 20,411
Total operating expenses . . . . . . . . . . . . . . . . . . . . . . . . . . . . . . . . . . . . . . . . . . . . 188,418 127,598 88,245
Operating income . . . . . . . . . . . . . . . . . . . . . . . . . . . . . . . . . . . . . . . . . . . . . . . . . . . . . . . . . 78,589 69,966 39,304Other income (expense), net . . . . . . . . . . . . . . . . . . . . . . . . . . . . . . . . . . . . . . . . . . . . . . . . . 28 (2,780) (804)
Income before income taxes . . . . . . . . . . . . . . . . . . . . . . . . . . . . . . . . . . . . . . . . . . . . . . . . . 78,617 67,186 38,500Provision for income taxes . . . . . . . . . . . . . . . . . . . . . . . . . . . . . . . . . . . . . . . . . . . . . . . . . . 24,157 26,803 14,885
Net income . . . . . . . . . . . . . . . . . . . . . . . . . . . . . . . . . . . . . . . . . . . . . . . . . . . . . . . . . . . . . . $ 54,460 $ 40,383 $ 23,615
Net income attributable to Class A and Class B common stockholders, basic anddiluted . . . . . . . . . . . . . . . . . . . . . . . . . . . . . . . . . . . . . . . . . . . . . . . . . . . . . . . . . . . . . . . . $ 54,413 $ 40,138 $ 10,405
Net income per share attributable to Class A and Class B common stockholders:Basic . . . . . . . . . . . . . . . . . . . . . . . . . . . . . . . . . . . . . . . . . . . . . . . . . . . . . . . . . . . . . . . . . $ 0.41 $ 0.31 $ 0.20
Diluted . . . . . . . . . . . . . . . . . . . . . . . . . . . . . . . . . . . . . . . . . . . . . . . . . . . . . . . . . . . . . . . $ 0.38 $ 0.28 $ 0.15
Weighted-average shares used to compute net income per share attributable toClass A and Class B common stockholders:Basic . . . . . . . . . . . . . . . . . . . . . . . . . . . . . . . . . . . . . . . . . . . . . . . . . . . . . . . . . . . . . . . . . 132,020 127,713 51,725
Diluted . . . . . . . . . . . . . . . . . . . . . . . . . . . . . . . . . . . . . . . . . . . . . . . . . . . . . . . . . . . . . . . 144,977 144,204 68,024
Other comprehensive income (loss):Net change in unrealized gains (losses) on available-for-sale investments . . . . . . . . . $ (181) $ 76 $ 10Net change in cumulative foreign currency translation gain (loss) . . . . . . . . . . . . . . . . 327 (69) 4
Comprehensive income . . . . . . . . . . . . . . . . . . . . . . . . . . . . . . . . . . . . . . . . . . . . . . . . . . . . $ 54,606 $ 40,390 $ 23,629
(1) Includes stock-based compensation as follows:
Cost of revenues:Cost of subscription services . . . . . . . . . . . . . . . . . . . . . . . . . . . . . . . . . . . . . . . . . $ 563 $ 273 $ 118Cost of professional services and other . . . . . . . . . . . . . . . . . . . . . . . . . . . . . . . . . 3,858 2,272 902
Research and development . . . . . . . . . . . . . . . . . . . . . . . . . . . . . . . . . . . . . . . . . . . . . . 7,249 3,844 1,700Sales and marketing . . . . . . . . . . . . . . . . . . . . . . . . . . . . . . . . . . . . . . . . . . . . . . . . . . . 6,861 3,221 1,788General and administrative . . . . . . . . . . . . . . . . . . . . . . . . . . . . . . . . . . . . . . . . . . . . . . 5,727 4,715 2,442
Total stock-based compensation . . . . . . . . . . . . . . . . . . . . . . . . . . . . . . . . . . . . . . . . . . $ 24,258 $ 14,325 $ 6,950
See Notes to Consolidated Financial Statements.
70

VE
EV
ASY
STE
MS
INC
.C
ON
SOL
IDA
TE
DST
AT
EM
EN
TS
STO
CK
HO
LD
ER
S’E
QU
ITY
(In
thou
sand
s,ex
cept
shar
eda
ta)
Seri
esA
and
BC
onve
rtib
leP
refe
rred
Stoc
kC
lass
A&
BC
omm
onst
ock
Add
itio
nal
Pai
d-in
Cap
ital
Ret
aine
dE
arni
ngs
Acc
umul
ated
Oth
erC
ompr
ehen
sive
Inco
me
Tot
alSt
ockh
olde
rs’
Equ
ity
Shar
esA
mou
ntSh
ares
Am
ount
Bal
ance
atJa
nuar
y31
,201
3..
....
....
....
....
....
....
....
....
...
85,0
00,0
006,
933
24,8
43,8
51—
2,10
124
,927
533
,966
Issu
ance
ofco
mm
onst
ock
upon
exer
cise
ofst
ock
optio
ns..
....
...
——
2,91
3,19
4—
514
——
514
Issu
ance
ofco
mm
onst
ock
upon
earl
yex
erci
seof
stoc
kop
tions
....
.—
—35
7,75
0—
——
——
Ves
ting
ofea
rly
exer
cise
dst
ock
optio
ns..
....
....
....
....
....
.—
——
—57
2—
—57
2St
ock-
base
dco
mpe
nsat
ion
expe
nse
....
....
....
....
....
....
...
——
——
7,04
1—
—7,
041
Con
vers
ion
ofpr
efer
red
stoc
kto
com
mon
stoc
k..
....
....
....
...
(85,
000,
000)
(6,9
33)
85,0
00,0
001
6,93
2—
——
Initi
alpu
blic
offe
ring
,net
ofis
suan
ceco
sts
....
....
....
....
....
.—
—11
,676
,750
—21
4,20
0—
—21
4,20
0E
xces
sta
xbe
nefi
tsfr
omem
ploy
eest
ock
plan
s..
....
....
....
....
——
——
174
——
174
Oth
erco
mpr
ehen
sive
inco
me
....
....
....
....
....
....
....
....
——
——
——
1414
Net
inco
me
....
....
....
....
....
....
....
....
....
....
....
..—
——
——
23,6
15—
23,6
15
Bal
ance
atJa
nuar
y31
,201
4..
....
....
....
....
....
....
....
....
...
——
124,
791,
545
123
1,53
448
,542
1928
0,09
6Is
suan
ceof
com
mon
stoc
kup
onex
erci
seof
stoc
kop
tions
....
....
.—
—4,
437,
349
—5,
813
——
5,81
3V
estin
gof
earl
yex
erci
sed
stoc
kop
tions
....
....
....
....
....
...
——
——
377
——
377
Rep
urch
ase
ofun
vest
edea
rly
exer
cise
dst
ock
optio
ns..
....
....
...
——
(16,
667)
——
——
—Is
suan
ceof
com
mon
stoc
kup
onve
stin
gof
rest
rict
edst
ock
units
....
——
115,
339
—(1
5)—
—(1
5)St
ock-
base
dco
mpe
nsat
ion
expe
nse
....
....
....
....
....
....
...
——
——
14,3
85—
—14
,385
Issu
ance
ofco
mm
onsh
ares
unde
rE
mpl
oyee
Stoc
kPu
rcha
sePl
an..
.—
—35
0,05
9—
5,95
1—
—5,
951
Follo
w-o
nof
feri
ng,n
etof
issu
ance
cost
s..
....
....
....
....
....
.—
—1,
390,
000
—34
,495
——
34,4
95E
xces
sta
xbe
nefi
tsfr
omem
ploy
eest
ock
plan
s..
....
....
....
....
——
——
25,3
41—
—25
,341
Oth
erco
mpr
ehen
sive
inco
me
....
....
....
....
....
....
....
....
——
——
——
77
Net
inco
me
....
....
....
....
....
....
....
....
....
....
....
..—
——
——
40,3
83—
40,3
83
Bal
ance
atJa
nuar
y31
,201
5..
....
....
....
....
....
....
....
....
...
——
131,
067,
625
131
7,88
188
,925
2640
6,83
3Is
suan
ceof
com
mon
stoc
kup
onex
erci
seof
stoc
kop
tions
....
....
.—
—2,
012,
497
—5,
898
——
5,89
8Is
suan
ceof
com
mon
stoc
kup
onea
rly
exer
cise
ofst
ock
optio
ns..
...
——
22,0
84—
——
——
Ves
ting
ofea
rly
exer
cise
dst
ock
optio
ns..
....
....
....
....
....
.—
——
—70
——
70R
epur
chas
eof
unve
sted
earl
yex
erci
sed
stoc
kop
tions
....
....
....
.—
—(3
,333
)—
——
——
Issu
ance
ofco
mm
onst
ock
upon
vest
ing
ofre
stri
cted
stoc
kun
its..
..—
—44
6,31
2—
(6)
——
(6)
Stoc
k-ba
sed
com
pens
atio
nex
pens
e..
....
....
....
....
....
....
.—
——
—24
,321
——
24,3
21E
xces
sta
xbe
nefi
tsfr
omem
ploy
eest
ock
plan
s..
....
....
....
....
——
——
13,5
27—
—13
,527
Oth
erco
mpr
ehen
sive
inco
me
....
....
....
....
....
....
....
....
——
——
——
146
146
Net
inco
me
....
....
....
....
....
....
....
....
....
....
....
..—
——
——
54,4
60—
54,4
60
Bal
ance
atJa
nuar
y31
,201
6..
....
....
....
....
....
....
....
....
...
—$
—13
3,54
5,18
5$
1$3
61,6
91$1
43,3
85$1
72$5
05,2
49
See
Not
esto
Con
soli
date
dF
inan
cial
Stat
emen
ts.
71

VEEVA SYSTEMS INC.CONSOLIDATED STATEMENTS OF CASH FLOWS
(In thousands)Fiscal Year Ended January 31,
2016 2015 2014
Cash flows from operating activitiesNet income . . . . . . . . . . . . . . . . . . . . . . . . . . . . . . . . . . . . . . . . . . . . . . . . . . . . . . . . . $ 54,460 $ 40,383 $ 23,615Adjustments to reconcile net income to net cash provided by operating activities:
Depreciation and amortization . . . . . . . . . . . . . . . . . . . . . . . . . . . . . . . . . . . . . . 8,464 3,929 2,410Amortization of premiums on short-term investments . . . . . . . . . . . . . . . . . . . . 2,804 2,176 364Stock-based compensation . . . . . . . . . . . . . . . . . . . . . . . . . . . . . . . . . . . . . . . . . 24,258 14,325 6,950Deferred income taxes . . . . . . . . . . . . . . . . . . . . . . . . . . . . . . . . . . . . . . . . . . . . (6,264) (4,268) (1,781)Bad debt expense . . . . . . . . . . . . . . . . . . . . . . . . . . . . . . . . . . . . . . . . . . . . . . . . 201 227 35Changes in operating assets and liabilities:
Accounts receivable . . . . . . . . . . . . . . . . . . . . . . . . . . . . . . . . . . . . . . . . . . (46,653) (34,455) (19,738)Income taxes . . . . . . . . . . . . . . . . . . . . . . . . . . . . . . . . . . . . . . . . . . . . . . . . (2,994) 3,326 (4,784)Prepaid expenses and other current and long-term assets . . . . . . . . . . . . . 180 (4,652) (2,951)Accounts payable . . . . . . . . . . . . . . . . . . . . . . . . . . . . . . . . . . . . . . . . . . . . (494) 1,290 (1,303)Accrued expenses and other current liabilities . . . . . . . . . . . . . . . . . . . . . . 5,042 (754) 9,690Deferred revenue . . . . . . . . . . . . . . . . . . . . . . . . . . . . . . . . . . . . . . . . . . . . 39,357 45,580 28,473Other long-term liabilities . . . . . . . . . . . . . . . . . . . . . . . . . . . . . . . . . . . . . 1,793 467 773
Net cash provided by operating activities . . . . . . . . . . . . . . . . . . . . . . . . . . . . 80,154 67,574 41,753
Cash flows from investing activitiesPurchases of short-term investments . . . . . . . . . . . . . . . . . . . . . . . . . . . . . . . . . . . . . (313,357) (401,955) (21,403)Maturities and sales of short-term investments . . . . . . . . . . . . . . . . . . . . . . . . . . . . . 364,968 156,860 9,700Purchases of property and equipment . . . . . . . . . . . . . . . . . . . . . . . . . . . . . . . . . . . . . (21,153) (26,531) (1,860)Acquisitions, net of cash acquired . . . . . . . . . . . . . . . . . . . . . . . . . . . . . . . . . . . . . . . (126,183) — (12,149)Purchases of intangible assets . . . . . . . . . . . . . . . . . . . . . . . . . . . . . . . . . . . . . . . . . . . (568) —Capitalized internal-use software development costs . . . . . . . . . . . . . . . . . . . . . . . . . (431) (413) (1,117)Proceeds from note receivable–related party . . . . . . . . . . . . . . . . . . . . . . . . . . . . . . . — — 253Changes in restricted cash and deposits . . . . . . . . . . . . . . . . . . . . . . . . . . . . . . . . . . . 41 21 —
Net cash used in investing activities . . . . . . . . . . . . . . . . . . . . . . . . . . . . . . . . (96,683) (272,018) (26,576)
Cash flows from financing activitiesProceeds from early exercise of common stock options . . . . . . . . . . . . . . . . . . . . . . 10 — 229Proceeds from exercise of common stock options . . . . . . . . . . . . . . . . . . . . . . . . . . . 5,875 5,813 514Net proceeds from offerings . . . . . . . . . . . . . . . . . . . . . . . . . . . . . . . . . . . . . . . . . . . . — 34,172 214,523Proceeds from Employee Stock Purchase Plan . . . . . . . . . . . . . . . . . . . . . . . . . . . . . — 5,951 —Restricted stock units acquired to settle employee tax withholding liability . . . . . . . (6) (15) —Excess tax benefits from employee stock plans . . . . . . . . . . . . . . . . . . . . . . . . . . . . . 13,527 25,341 174
Net cash provided by financing activities . . . . . . . . . . . . . . . . . . . . . . . . . . . . 19,406 71,262 215,440
Effect of exchange rate changes on cash and cash equivalents . . . . . . . . . . . . . . . . . . . . . 49 (72) —Net change in cash and cash equivalents . . . . . . . . . . . . . . . . . . . . . . . . . . . . . . . . . . . . . . 2,926 (133,254) 230,617Cash and cash equivalents at beginning of period . . . . . . . . . . . . . . . . . . . . . . . . . . . . . . . 129,253 262,507 31,890Cash and cash equivalents at end of period . . . . . . . . . . . . . . . . . . . . . . . . . . . . . . . . . . $ 132,179 $ 129,253 $262,507
Supplemental disclosures of other cash flow information:Cash paid for income taxes, net of refunds . . . . . . . . . . . . . . . . . . . . . . . . . . . . . . . . $ 19,968 $ 1,515 $ 20,673
Non-cash investing and financing activities:Changes in accounts payable and accrued liabilities related to property and
equipment purchases . . . . . . . . . . . . . . . . . . . . . . . . . . . . . . . . . . . . . . . . . . . . $ 334 $ 688 $ 18
Vesting of early exercised stock options . . . . . . . . . . . . . . . . . . . . . . . . . . . . . . $ 70 $ 377 $ 572
Offering costs not yet paid . . . . . . . . . . . . . . . . . . . . . . . . . . . . . . . . . . . . . . . . . $ — $ — $ 323
Working capital adjustment, not yet paid . . . . . . . . . . . . . . . . . . . . . . . . . . . . . . $ 339 $ — $ —
See Notes to Consolidated Financial Statements.
72

Note 1. Summary of Business and Significant Accounting Policies
Description of Business
Veeva is a leading provider of industry cloud software and data solutions for the global life sciencesindustry. We were founded in 2007 on the premise that industry-specific cloud solutions could best address theoperating challenges and regulatory requirements of the life sciences industry. Our products are designed to meetthe unique needs of life sciences companies, regardless of size. Targeted to address our customers’ most strategicbusiness functions—from research and development to commercialization—our solutions are designed to helpthe industry bring products to market faster and more efficiently, market and sell more effectively and maintaincompliance with government regulations. We offer solutions for multichannel customer relationshipmanagement, regulated content and information management, master data management and data and dataservices that meet the specialized functional and compliance needs of life sciences companies. Our fiscal yearend is January 31.
Principles of Consolidation and Basis of Presentation
These consolidated financial statements have been prepared in accordance with generally acceptedaccounting principles in the United States (GAAP). The consolidated financial statements include accounts of ourwholly owned subsidiaries after elimination of intercompany accounts and transactions.
Use of Estimates
The preparation of consolidated financial statements in conformity with GAAP requires us to make certainestimates, judgments and assumptions that affect the consolidated financial statements and the notes thereto.These estimates are based on information available as of the date of the consolidated financial statements. On aregular basis, management evaluates these estimates and assumptions. Significant items subject to such estimatesand assumptions include, but are not limited to:
• the best estimate of selling price of the deliverables included in multiple-deliverable revenuearrangements;
• the collectibility of our accounts receivable;
• the fair value of assets acquired and liabilities assumed for business combinations;
• the valuation of short-term investments and the determination of other-than-temporary impairments;
• the valuation of building and land;
• the realizability of deferred income tax assets and liabilities;
• the fair value of our stock-based awards and related forfeiture rates; and
• the capitalization and estimated useful life of internal-use software development costs.
As future events cannot be determined with precision, actual results could differ significantly from thoseestimates.
Segment Information
Operating segments are defined as components of an enterprise about which separate financial informationis evaluated regularly by the chief operating decision maker in deciding how to allocate resources and assessingperformance. We define the term “chief operating decision maker” to be our Chief Executive Officer. Our ChiefExecutive Officer reviews the financial information presented on a consolidated basis for purposes of allocatingresources and evaluating our financial performance. Accordingly, we have determined that we operate in a singlereportable operating segment. Since we operate in one operating segment, all required financial segmentinformation can be found in the consolidated financial statements.
73

Revenue Recognition
We derive our revenues primarily from subscription services fees and professional services fees.Subscription services revenues consist of fees from customers accessing our cloud-based software solutions andsubscription or license fees for our data solutions. Additionally, Zinc Ahead had entered into a limited number ofperpetual license agreements prior to the acquisition that had accompanying maintenance and hosting fees. Wehave included such maintenance and hosting fees in our subscription services revenues. Professional servicesrevenues consist primarily of fees from implementation services, configuration, data services, training andmanaged services related to our solutions. We commence revenue recognition when all of the followingconditions are satisfied:
• there is persuasive evidence of an arrangement;
• the service has been or is being provided to the customer;
• the collection of the fees is reasonably assured; and
• the amount of fees to be paid by the customer is fixed or determinable.
Our subscription services arrangements are generally non-cancelable and do not provide for refunds tocustomers in the event of cancellations. We record revenues net of any sales taxes.
Subscription Services Revenues
Subscription services revenues are recognized ratably over the order term beginning when the solution hasbeen provisioned to the customer. Our subscription arrangements are considered service contracts, and thecustomer does not have the right to take possession of the software.
Professional Services and Other Revenues
The majority of our professional services arrangements are recognized on a time and material basis.Professional services revenues recognized on a time and material basis are measured monthly based on timeincurred and contractually agreed upon rates. Certain professional services revenues are based on fixed feearrangements and revenues are recognized based on the proportional performance method. In some cases, theterms of our time and materials and fixed fee arrangements may require that we defer the recognition of revenueuntil contractual conditions are met. Data services and training revenues are generally recognized as the servicesare performed.
Multiple Element Arrangements
We apply the provisions of Financial Accounting Standards Board (FASB) Accounting Standards Update(ASU) 2009-13, Multiple—Deliverable Revenue Arrangements, to allocate revenues based on relative bestestimated selling price to each unit of accounting in multiple element arrangements, which generally includesubscriptions and professional services. Best estimated selling price of each unit of accounting included in amultiple element arrangement is based upon management’s estimate of the selling price of deliverables whenvendor specific objective evidence or third-party evidence of selling price is not available.
We enter into arrangements with multiple deliverables that generally include our subscription offerings andprofessional services. For these arrangements we must: (i) determine whether each deliverable has stand-alonevalue; (ii) determine the estimated selling price of each element using the selling price hierarchy of vendor-specific objective evidence (VSOE) of fair value, third party evidence (TPE) or best estimated selling price(BESP), as applicable; and (iii) allocate the total price among the various deliverables based on the relativeselling price method.
In determining whether professional services and other revenues have stand-alone value, we consider thefollowing factors for each consulting agreement: availability of the consulting services from other vendors, the
74

nature of the consulting services and whether the professional services are required in order for the customer touse the subscription services. If stand-alone value cannot be established for a delivered item in a multiple-element arrangement, the delivered item is accounted for as a combined unit of accounting with the undelivereditem(s).
We have established stand-alone value with respect to all of our offerings except professional services forthe recently acquired Zinc Ahead business. As a result, we account for multiple element arrangements thatinclude Zinc Ahead professional services as a combined unit of accounting and recognize the revenues from suchprofessional services ratably over the term of the associated subscription services.
We have determined that we are not able to establish VSOE of fair value or TPE of selling price for any ofour deliverables, and accordingly we use BESP for each deliverable in the arrangement. The objective of BESP isto estimate the price at which we would transact a sale of the service deliverables if the services were sold on astand-alone basis. Revenue allocated to each deliverable is recognized when the basic revenue recognitioncriteria are met for each deliverable.
We determine BESP for our subscription services included in a multiple-element arrangement byconsidering multiple factors including, but not limited to, stated subscription renewal rates offered to thecustomer to renew the service and other major groupings such as customer type and geography.
BESP for professional services considers the discount of actual professional services sold compared to listprice, the experience level of the individual performing the service and geography.
We allocate consideration proportionately based on established BESP and then recognize the allocatedrevenue over the respective delivery periods for each element.
Deferred Revenue
Deferred revenue includes amounts billed to customers for which the revenue recognition criteria have notbeen met. Deferred revenue primarily consists of billings or payments received in advance of revenue recognitionfrom our subscription services, and to a lesser extent, professional services and other revenues described above,and is recognized as the revenue recognition criteria are met. We generally invoice our customers in annual,quarterly or monthly installments for the subscription services, which are typically contracted for a term of oneyear or less. Accordingly, the deferred revenue balance does not generally represent the total contract value of asubscription arrangement. Deferred revenue that will be recognized during the succeeding 12-month period isrecorded as current deferred revenue and the remaining portion is recorded as noncurrent, which is in the otherlong-term liabilities on the consolidated balance sheet.
Certain Risks and Concentrations of Credit Risk
Our revenues are derived from subscription services, professional services and other services deliveredprimarily to the pharmaceutical and life sciences industry. We operate in markets that are highly competitive andrapidly changing. Significant technological changes, shifting customer needs, the emergence of competitiveproducts or services with new capabilities and other factors could negatively impact our operating results.
Our financial instruments that potentially subject us to concentration of credit risk consist primarily of cashand cash equivalents, short-term investments and trade accounts receivable. Our cash equivalents and short-terminvestments are held in safekeeping by large, credit-worthy financial institutions. We have established guidelinesrelative to credit ratings, diversification and maturities that seek to maintain safety and liquidity. Deposits inthese financial institutions may exceed federally insured limits.
We do not require collateral from our customers and generally require payment within 30 to 60 days ofbilling. We periodically evaluate the collectibility of our accounts receivable and provide an allowance fordoubtful accounts as necessary, based on historical experience. Historically, such losses have not been material.
75

The following customers individually exceeded 10% of total accounts receivable as of the dates shown:
January 31,
2016 2015
Customer 1 . . . . . . . . . . . . . . . . . . . . . . . . . . . . . . . . . . . . . . . . . . . . . . . . . . . . . . . . . . . . . . . . . 16% 11%Customer 2 . . . . . . . . . . . . . . . . . . . . . . . . . . . . . . . . . . . . . . . . . . . . . . . . . . . . . . . . . . . . . . . . . 15 *Customer 3 . . . . . . . . . . . . . . . . . . . . . . . . . . . . . . . . . . . . . . . . . . . . . . . . . . . . . . . . . . . . . . . . . * 16
* Does not exceed 10%.
In our fiscal years ended January 31, 2016, 2015 and 2014, our top 10 customers accounted for 50%, 54%and 56% of our total revenues, respectively. No single customer accounted for more than 10% of our totalrevenues for the fiscal years ended January 31, 2016, 2015 or 2014.
Cash Equivalents
We consider all highly liquid investments with a maturity of three months or less when purchased to be cashequivalents. We classify certain restricted cash balances within other long-term assets on the accompanyingbalance sheets based upon the term of the remaining restrictions.
Short-term Investments
We classify short-term investments as available-for-sale at the time of purchase and reevaluate suchclassification as of each balance sheet date. All short-term investments are recorded at estimated fair value.Unrealized gains and losses for available-for-sale securities are included in accumulated other comprehensiveincome, a component of stockholders’ equity. We evaluate our investments to assess whether those withunrealized loss positions are other than temporarily impaired. We consider impairments to be other thantemporary if they are related to deterioration in credit risk or if it is likely we will sell the securities before therecovery of their cost basis. Realized gains and losses and declines in value judged to be other than temporary aredetermined based on the specific identification method and are reported in other income (expense), net, in theconsolidated statements of comprehensive income. Interest, amortization of premiums, and accretion of discounton all short-term investments classified as available for sale are also included as a component of other income(expense), net, in the condensed consolidated statements of comprehensive income.
We may sell our short-term investments at any time, without significant penalty, for use in currentoperations or for other purposes, even if they have not yet reached maturity. As a result, we classify ourinvestments, including securities with maturities beyond 12 months as current assets in the accompanyingconsolidated balance sheets.
Accounts Receivable and Allowance for Doubtful Accounts
Accounts receivable are recorded at the invoiced amount and do not bear interest. We establish an allowancefor doubtful accounts for estimated losses expected in our accounts receivable portfolio. In establishing therequired allowance, we use the specific-identification method, and management considers historical lossesadjusted to take into account current market conditions and the customers’ financial condition, the amount ofreceivables in dispute, and the current receivables aging and current payment patterns. We review our allowancefor doubtful accounts periodically. Account balances are charged off against the allowance after all means of
76

collection have been exhausted and the potential for recovery is considered remote. Activity related to ourallowance for doubtful accounts was as follows (in thousands):
Fiscal Year Ended January 31,
2016 2015 2014
Balance at beginning of period . . . . . . . . . . . . . . . . . . . . . . . . . . . . . . . . . . . . . . . . . $413 $ 305 $305Add: charges (credits) to costs and expenses . . . . . . . . . . . . . . . . . . . . . . . . . . . . . . 201 227 (35)Less: recoveries (write-offs) . . . . . . . . . . . . . . . . . . . . . . . . . . . . . . . . . . . . . . . . . . . (72) (119) 35
Balance at end of period . . . . . . . . . . . . . . . . . . . . . . . . . . . . . . . . . . . . . . . . . . . . . . $542 $ 413 $305
Property and Equipment
Property and equipment are stated at cost less accumulated depreciation. Depreciation is calculated on thestraight-line method over the estimated useful lives of the assets and commences once the asset is placed inservice or ready for its intended use. Construction in progress is related to the construction or development ofproperty (including land) and equipment that have not yet been placed in service for our intended use. Theestimated useful lives by asset classification are generally as follows:
Asset Classification Estimated Useful Life
Land Not depreciated
Building 30 years
Land and building improvements Shorter of remaining life of building or estimated useful life
Equipment and computers 3 years
Furniture and fixtures 5 years
Leasehold improvements Shorter of remaining life of the lease term or estimated useful life
Upon sale or retirement of an asset, the cost and related accumulated depreciation are removed from thegeneral ledger and any related gains or losses are reflected in operating expenses. Repairs and maintenance arecharged to our statement of comprehensive income as incurred.
Internal-Use Software
We capitalize certain costs incurred for the development of computer software for internal use. These costsgenerally relate to the development of our customer relationship management, content and informationmanagement and customer master solutions. We capitalize these costs during the development of the project,when it is determined that it is probable that the project will be completed, and the software will be used asintended. Costs related to preliminary project activities, post-implementation activities, training and maintenanceare expensed as incurred. Internal-use software is amortized on a straight-line basis over its estimated useful life,generally three years, and the amortization expense is recorded as a component of cost of subscription services.Management evaluates the useful lives of these assets on an annual basis and tests for impairment wheneverevents or changes in circumstances occur that could impact the recoverability of these assets. We exercisejudgment in determining the point at which various projects may be capitalized, in assessing the ongoing value ofthe capitalized costs and in determining the estimated useful lives over which the costs are amortized. To theextent that we change the manner in which we develop and test new features and functionalities related to oursolutions, assess the ongoing value of capitalized assets or determine the estimated useful lives over which thecosts are amortized, the amount of internal-use software development costs we capitalize and amortize couldchange in future periods.
77

Goodwill and Intangible Assets
Goodwill represents the excess of the purchase price over the fair value of net assets acquired in connectionwith business combinations accounted for using the acquisition method of accounting. Goodwill is not amortized,but instead goodwill is required to be tested for impairment annually and under certain circumstances. Weperform such testing of goodwill in the fourth quarter of each year, or as events occur or circumstances changethat would more likely than not reduce the fair value of a reporting unit below its carrying amount.
If we determine that it is more likely than not that the fair value of a reporting unit is less than its carryingamount, we then conduct a two-step test for impairment of goodwill. The first step of the test for goodwillimpairment compares the fair value of the applicable reporting unit with its carrying value. If the fair value of areporting unit is less than the reporting unit’s carrying value, we will perform the second step of the test forimpairment of goodwill. During the second step of the test for impairment of goodwill, we will compare theimplied fair value of the reporting unit’s goodwill with the carrying value of that goodwill. If the carrying valueof the goodwill exceeds the calculated implied fair value, the excess amount will be recognized as an impairmentloss. We have one reporting unit and evaluate goodwill for impairment at the entity level. We completed ourannual impairment test in our fourth quarter of fiscal 2016, which did not result in any impairment of thegoodwill balance.
All other intangible assets associated with purchased intangibles, consisting of existing technology,databases, customer contracts and relationships, software, and brand are stated at cost less accumulatedamortization and are amortized on a straight-line basis over their estimated remaining economic lives.Amortization expense related to existing technology, databases and software is included in cost of subscriptionservices. Amortization expense related to customer contracts and relationships and brand are included in salesand marketing expense.
Long-Lived Assets
Long-lived assets, such as property and equipment and intangible assets, are reviewed for impairmentwhenever events or changes in circumstances indicate that the carrying amount of an asset may not berecoverable. If circumstances require a long-lived asset or asset group be tested for possible impairment, we firstcompare undiscounted cash flows expected to be generated by that asset or asset group to its carrying value. Ifthe carrying value of the long-lived asset or asset group is not recoverable on an undiscounted cash flow basis, animpairment is recognized to the extent that the carrying value exceeds its fair value. There were no impairmentcharges recognized during fiscal 2016, 2015 and 2014.
Business Combinations
We use our best estimates and assumptions to accurately assign fair value to the tangible and intangible assetsacquired and liabilities assumed at the acquisition date. Our estimates are inherently uncertain and subject torefinement. During the measurement period, which may be up to one year from the acquisition date, we may recordadjustments to the fair value of these tangible and intangible assets acquired and liabilities assumed, with thecorresponding offset to goodwill. In addition, uncertain tax positions and tax-related valuation allowances areinitially established in connection with a business combination as of the acquisition date. We continue to collectinformation and reevaluate these estimates and assumptions quarterly and record any adjustments to our preliminaryestimates to goodwill provided that we are within the measurement period. Upon the conclusion of the measurementperiod or final determination of the fair value of assets acquired or liabilities assumed, whichever comes first, anysubsequent adjustments are recorded to our consolidated statements of comprehensive income.
Stock-based Compensation
We recognize compensation expense for all stock-based awards, including stock options and restricted stockunits (RSUs), based on the estimate of fair value of the award at the grant date. The fair value of each optionaward is estimated on the grant date using the Black-Scholes option-pricing model and a single option award
78

approach. This model requires that at the date of grant we determine the fair value of the underlying commonstock, the expected term of the award, the expected volatility of the price of our common stock, risk-free interestrates, and expected dividend yield of our common stock. The compensation expense recorded is based on awardsultimately expected to vest and therefore is reduced by estimated forfeitures. Forfeitures are estimated at the timeof grant based on an analysis of our actual historical forfeitures, and revised, if necessary, in subsequent periodsif actual forfeitures differ from those estimates. The compensation expense, net of estimated forfeitures, isrecognized using a straight-line basis over the requisite service periods of the awards, which is generally four tonine years. We estimate a forfeiture rate to calculate the stock-based compensation expense for our awards.
The fair value of each stock-based payment award and stock purchase right granted under the 2013Employee Stock Purchase Plan (ESPP) was estimated on the date of grant using the Black-Scholes option pricingmodel. We recognized stock-based compensation expenses related to our ESPP on a straight-line basis over theoffering period, which was seven months.
The determination of the grant date fair value of stock based payment awards using an option-pricing modelare affected by assumptions regarding a number of other complex and subjective variables, which include ourexpected stock price volatility over the expected term of the options, stock option exercise and cancellationbehaviors, risk-free interest rates and expected dividends.
Cost of Revenues
Cost of subscription services and professional services and other revenues are expensed as incurred. Cost ofsubscription services revenues primarily consists of expenses related to third-party data centers, personnel relatedcosts associated with hosting our subscription services and providing support, including our data stewards,operating lease expense associated with computer equipment and software and allocated overhead, amortizationexpense associated with capitalized internal-use software related to our subscription services and amortizationexpense associated with purchased intangibles related to our subscription services. Cost of subscription servicesrevenues for Veeva CRM and certain of our multichannel customer relationship management applications alsoinclude fees paid to salesforce.com, inc. for our use of the Salesforce1 Platform and the associated hostinginfrastructure and data center operations that are provided by salesforce.com.
Cost of professional services and other revenues primarily consists of employee-related expenses associatedwith providing these services, including salaries, benefits and stock-based compensation expense, the cost ofthird-party subcontractor costs, travel costs and allocated overhead.
Sales Commissions
Sales commissions paid for subscriptions are recorded as a component of sales and marketing expenseswhen earned by our sales team. Commissions are typically earned upon booking of a customer contract. Salescommission expense was $16.4 million, $13.2 million and $11.8 million for the fiscal years ended January 31,2016, 2015 and 2014, respectively.
Advertising Expenses
Advertising is expensed as incurred. Advertising expense was $0.2 million, $0.1 million and $0.2 millionfor the fiscal years ended January 31, 2016, 2015 and 2014, respectively.
Income Taxes
Income taxes are accounted for under the asset and liability method. Deferred tax assets and liabilities arerecognized for the future tax consequences attributable to differences between the financial statement carryingamounts of existing assets and liabilities and their respective tax bases and operating loss and tax creditcarryforwards. Deferred tax assets and liabilities are measured using enacted tax rates expected to apply to
79
taxable income in the years in which those temporary differences are expected to be recovered or settled. Theeffect on deferred tax assets and liabilities of a change in tax rates is recognized in income in the period thatincludes the enactment date.
We regularly assess the realizability of our deferred tax assets and establish a valuation allowance if it ismore-likely-than-not that some or all of our deferred tax assets will not be realized. We evaluate and weigh allavailable positive and negative evidence such as historic results, future reversals of existing deferred taxliabilities, projected future taxable income, as well as prudent and feasible tax-planning strategies. Generally,more weight is given to objectively verifiable evidence, such as the cumulative loss in recent years.
We establish liabilities or reduce assets for uncertain tax positions when we believe certain tax positions arenot more likely than not of being sustained if challenged. We recognize liabilities for uncertain tax positionsbased on a two-step process. The first step is to evaluate the tax position for recognition by determining whetherthe weight of available evidence indicates that it is more likely than not that the position will be sustained onaudit, including resolution of related appeals or litigation processes, if any. If we determine that a tax positionwill more likely than not be sustained on audit, the second step requires us to estimate and measure the taxbenefit as the largest amount that is more than 50% likely to be realized upon ultimate settlement with the taxauthority. We consider many factors when evaluating and estimating our tax positions and tax benefits, whichmay require periodic adjustments and may not accurately forecast actual outcomes. Determining whether anuncertain tax position is effectively settled requires judgment. Such a change in status or measurement wouldresult in the recognition of a tax benefit or an additional charge to the tax provision.
We recognize interest accrued and penalties related to unrecognized tax benefits in our income tax expense.
Other Comprehensive Income
Accumulated other comprehensive income is reported as a component of stockholders’ equity and includeunrealized gains and losses on marketable securities that are available-for-sale and foreign currency translationadjustment.
Foreign Currency Exchange
The functional currency for Brazil, China, India, Japan, Korea and the Zinc subsidiaries in the UnitedKingdom is their local currency and for all other foreign subsidiaries their functional currency is the U.S. dollar.Adjustments resulting from translating foreign functional currency financial statements into U.S. dollars for thoseentities that do not have U.S. dollars as their functional currency are recorded as part of a separate component ofthe consolidated statements of comprehensive income. Foreign currency transaction gains and losses are includedin the consolidated statements of operations for the period. All assets and liabilities denominated in a foreigncurrency are translated into U.S. dollars at the exchange rate on the balance sheet date. Revenues and expensesare translated at the average exchange rate during the period. Equity transactions are translated using historicalexchange rates.
Warranties and Indemnification
Our cloud applications are generally warranted to perform materially in accordance with our standardservices description documentation. Additionally, our contracts generally include provisions for indemnifyingcustomers against liabilities if our solutions infringe a third party’s intellectual property rights, and we may alsoincur liabilities if we breach the security and/or confidentiality obligations in our contracts. To date, we have notincurred any material costs, and we have not accrued any liabilities in the accompanying consolidated financialstatements, as a result of these obligations. We also entered into service-level agreements with our customers thatspecify required levels of application uptime and permit customers to receive credits or to terminate theiragreements and receive a refund of prepaid amounts related to unused subscription services in the event that we
80

fail to meet required performance levels. To date, we have not experienced any significant failures to meetdefined levels of performance and, as a result, we have not accrued any liabilities related to these agreements inthe consolidated financial statements.
Recent Accounting Pronouncements
Leases
In February 2016, the Financial Accounting Standards Board (“FASB”) issued ASU 2016-02, “Leases”.ASU 2016-02 requires that lease arrangements longer than twelve months result in an entity recognizing an assetand liability. The updated guidance is effective for interim and annual periods beginning after December 15,2018, and early adoption is permitted. We have not evaluated the impact of the updated guidance on ourconsolidated financial statements.
Financial Instruments
In January 2016, the FASB issued Accounting Standards Update (“ASU”) 2016-1, “Financial Instruments.”This guidance outlines the classification and measurement of financial instruments. The requirement to disclosethe methods and significant assumptions used to estimate fair value is removed. In addition, financial assets andfinancial liabilities are to be presented separately in the notes to the financial statements, grouped bymeasurement category and form of financial asset. This standard will be effective for our fiscal year beginning inFebruary 1, 2017. Early adoption is permitted. We do not expect this standard to have a material impact on ourfinancial statements.
Deferred Taxes
In November 2015, the FASB issued ASU 2015-17, “Balance Sheet Classification of Deferred Taxes.” Thisguidance simplifies the presentation of deferred income taxes, which requires that deferred income tax liabilitiesand assets be presented as a net non-current deferred tax asset or liability by jurisdiction on the balance sheet.The current requirement that deferred tax assets and liabilities of a tax-paying component of an entity be offsetand presented as a single amount is unchanged. The ASU is effective for periods beginning after December 15,2016, however earlier adoption is permitted for all entities for any interim or annual financial statements thathave not been issued. The Company early adopted the standard in the fourth quarter of 2016 on a prospectivebasis and, accordingly, reclassified $4.1 million of current deferred tax assets from “Deferred income taxes” to“Deferred income taxes, noncurrent” in the consolidated balance sheet at January 31, 2016. The prior yearbalances were not retrospectively adjusted.
Business Combinations
In September 2015, the FASB issued ASU 2015-16, “Simplifying the Accounting for Measurement-PeriodAdjustments.” This guidance requires the acquirer to recognize adjustments to provisional amounts identifiedduring the measurement period in the reporting period in which the adjustment amounts are determined. Theeffect on earnings for changes in depreciation or amortization, or other income effects (if any) as a result of thechange to the provisional amounts, calculated as if the accounting had been completed as of the acquisition date,must be recorded in the reporting period in which the adjustment amounts are determined rather thanretrospectively. This standard will be applied prospectively to adjustments to provisional amounts that occur afterthe effective date. This standard will be effective for our fiscal year beginning in February 1, 2016. Earlyadoption is permitted. We do not expect this standard to have a material impact on our financial statements.
Cloud Computing Arrangements
In April 2015, the FASB issued ASU 2015-05, “Customer’s Accounting for Fees Paid in a CloudComputing Arrangement.” This guidance is intended to help entities evaluate the accounting for fees paid by a
81

customer in a cloud computing arrangement, primarily to determine whether the arrangement includes a sale orlicense of software. If a cloud computing arrangement includes a software license, the customer should accountfor the software license element of the arrangement consistent with the acquisition of other software licenses. Ifthe arrangement does not include a software license, the customer should account for a cloud computingarrangement as a service contract. This standard will be adopted on a prospective basis for our fiscal yearbeginning February 1, 2016. Early adoption is permitted. We do not expect this standard to have a materialimpact on our financial statements.
Revenue Recognition
In May 2014, the FASB issued ASU 2014-09, “Revenue from Contracts with Customers.” This guidanceoutlines a single comprehensive model for entities to use in accounting for revenue arising from contracts withcustomers and supersedes most current revenue recognition guidance, including industry-specific guidance. Thecore principle of the revenue model requires revenue to be recognized when promised goods or services aretransferred to customers in an amount that reflects the consideration that is expected to be received for those goodsor services. ASU 2014-09 supersedes the existing revenue recognition guidance in “Revenue Recognition (Topic605)”. This update should be applied retrospectively either to each prior reporting period presented in the financialstatements, or only to the most current reporting period presented in the financial statements with a cumulativeeffect adjustment recorded in the retained earnings. In August 2015, the FASB issued ASU 2015-14, “Revenue fromContracts with Customers (Topic 606): Deferral of the Effective Date.” This Update defers the effective date ofASU 2014-09 for all entities by one year, although companies still have the option to begin applying the newguidance as of the original effective date. In accordance with the deferral, this guidance will be effective for ourfiscal year beginning February 1, 2018. We are evaluating the effect that ASU 2014-09 will have on ourconsolidated financial statements and related disclosures and have not selected a transition method yet.
Note 2. Acquisitions
During the fiscal year ended January 31, 2016, we completed two acquisitions, QForma CrowdLink andZinc Ahead, both of which were accounted for as business combinations. In accordance with authoritativeguidance on business combination accounting, the assets and liabilities of the acquired companies were recordedas of the acquisition date, at their respective fair values, and are included within our consolidated financialstatements. The results of operations related to each company acquired have been included in our consolidatedstatements of operations from the date of acquisitions. All acquisition-related transaction costs are expensed andreflected in general and administrative expenses on our condensed consolidated statements of comprehensiveincome for the periods presented.
Goodwill represents the excess of the purchase price over the fair value of the underlying net tangible andintangible assets and represents the future economic benefits of the customer relationships and data technologycontributions in support of our data-related offerings. Goodwill is not deductible for U.S. tax purposes.
The fair values assigned to assets acquired and liabilities assumed are based on management’s bestestimates and assumptions as of the reporting date and are considered preliminary pending finalization ofvaluation analyses pertaining to intangible assets acquired, liabilities assumed and tax liabilities assumedincluding calculation of deferred tax assets and liabilities. Changes to amounts recorded as assets or liabilitiesmay result in corresponding adjustments to goodwill during the measurement period (up to one year from theacquisition date).
Zinc Ahead
On September 29, 2015, we completed our acquisition of Mineral Newco Ltd., the ultimate parent companyof Zinc Ahead Ltd, a company organized under the laws of the United Kingdom that is the ultimate parentcompany of Zinc Ahead Holdings Ltd, Zinc Ahead Ltd, Zinc Ahead Inc., Zinc Ahead PTY LTD and Zinc Ahead
82
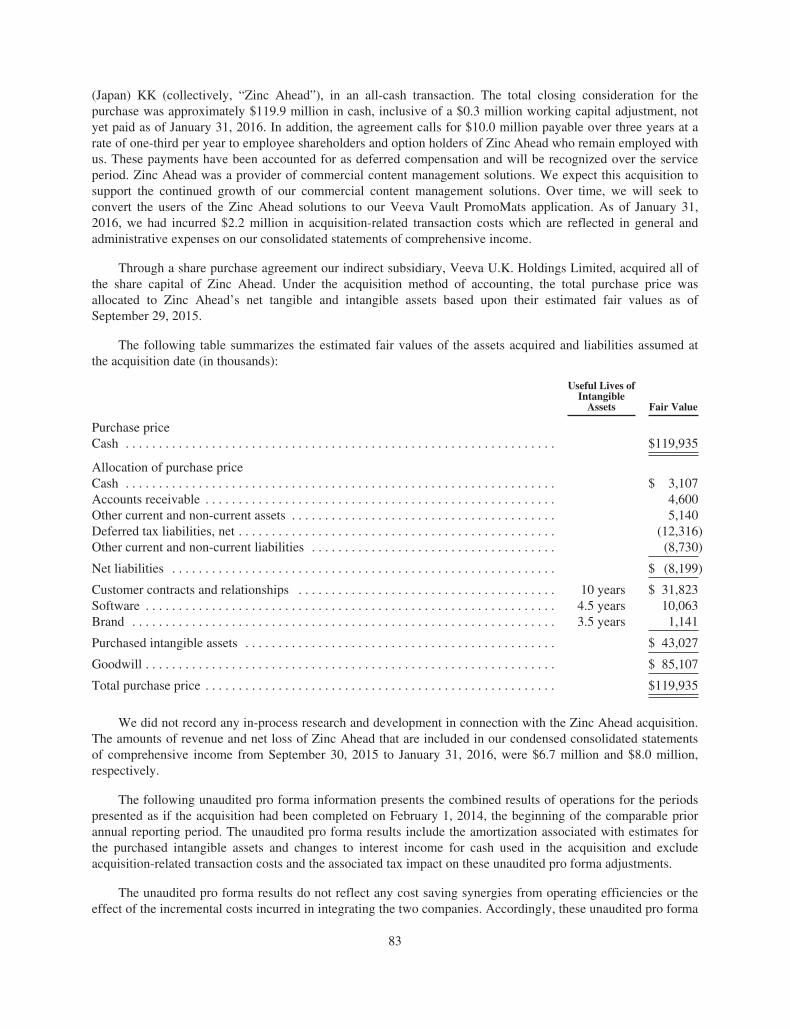
(Japan) KK (collectively, “Zinc Ahead”), in an all-cash transaction. The total closing consideration for thepurchase was approximately $119.9 million in cash, inclusive of a $0.3 million working capital adjustment, notyet paid as of January 31, 2016. In addition, the agreement calls for $10.0 million payable over three years at arate of one-third per year to employee shareholders and option holders of Zinc Ahead who remain employed withus. These payments have been accounted for as deferred compensation and will be recognized over the serviceperiod. Zinc Ahead was a provider of commercial content management solutions. We expect this acquisition tosupport the continued growth of our commercial content management solutions. Over time, we will seek toconvert the users of the Zinc Ahead solutions to our Veeva Vault PromoMats application. As of January 31,2016, we had incurred $2.2 million in acquisition-related transaction costs which are reflected in general andadministrative expenses on our consolidated statements of comprehensive income.
Through a share purchase agreement our indirect subsidiary, Veeva U.K. Holdings Limited, acquired all ofthe share capital of Zinc Ahead. Under the acquisition method of accounting, the total purchase price wasallocated to Zinc Ahead’s net tangible and intangible assets based upon their estimated fair values as ofSeptember 29, 2015.
The following table summarizes the estimated fair values of the assets acquired and liabilities assumed atthe acquisition date (in thousands):
Useful Lives ofIntangible
Assets Fair Value
Purchase priceCash . . . . . . . . . . . . . . . . . . . . . . . . . . . . . . . . . . . . . . . . . . . . . . . . . . . . . . . . . . . . . . . . . $119,935
Allocation of purchase priceCash . . . . . . . . . . . . . . . . . . . . . . . . . . . . . . . . . . . . . . . . . . . . . . . . . . . . . . . . . . . . . . . . . $ 3,107Accounts receivable . . . . . . . . . . . . . . . . . . . . . . . . . . . . . . . . . . . . . . . . . . . . . . . . . . . . . 4,600Other current and non-current assets . . . . . . . . . . . . . . . . . . . . . . . . . . . . . . . . . . . . . . . . 5,140Deferred tax liabilities, net . . . . . . . . . . . . . . . . . . . . . . . . . . . . . . . . . . . . . . . . . . . . . . . . (12,316)Other current and non-current liabilities . . . . . . . . . . . . . . . . . . . . . . . . . . . . . . . . . . . . . (8,730)
Net liabilities . . . . . . . . . . . . . . . . . . . . . . . . . . . . . . . . . . . . . . . . . . . . . . . . . . . . . . . . . . $ (8,199)
Customer contracts and relationships . . . . . . . . . . . . . . . . . . . . . . . . . . . . . . . . . . . . . . . 10 years $ 31,823Software . . . . . . . . . . . . . . . . . . . . . . . . . . . . . . . . . . . . . . . . . . . . . . . . . . . . . . . . . . . . . . 4.5 years 10,063Brand . . . . . . . . . . . . . . . . . . . . . . . . . . . . . . . . . . . . . . . . . . . . . . . . . . . . . . . . . . . . . . . . 3.5 years 1,141
Purchased intangible assets . . . . . . . . . . . . . . . . . . . . . . . . . . . . . . . . . . . . . . . . . . . . . . . $ 43,027
Goodwill . . . . . . . . . . . . . . . . . . . . . . . . . . . . . . . . . . . . . . . . . . . . . . . . . . . . . . . . . . . . . . $ 85,107
Total purchase price . . . . . . . . . . . . . . . . . . . . . . . . . . . . . . . . . . . . . . . . . . . . . . . . . . . . . $119,935
We did not record any in-process research and development in connection with the Zinc Ahead acquisition.The amounts of revenue and net loss of Zinc Ahead that are included in our condensed consolidated statementsof comprehensive income from September 30, 2015 to January 31, 2016, were $6.7 million and $8.0 million,respectively.
The following unaudited pro forma information presents the combined results of operations for the periodspresented as if the acquisition had been completed on February 1, 2014, the beginning of the comparable priorannual reporting period. The unaudited pro forma results include the amortization associated with estimates forthe purchased intangible assets and changes to interest income for cash used in the acquisition and excludeacquisition-related transaction costs and the associated tax impact on these unaudited pro forma adjustments.
The unaudited pro forma results do not reflect any cost saving synergies from operating efficiencies or theeffect of the incremental costs incurred in integrating the two companies. Accordingly, these unaudited pro forma
83
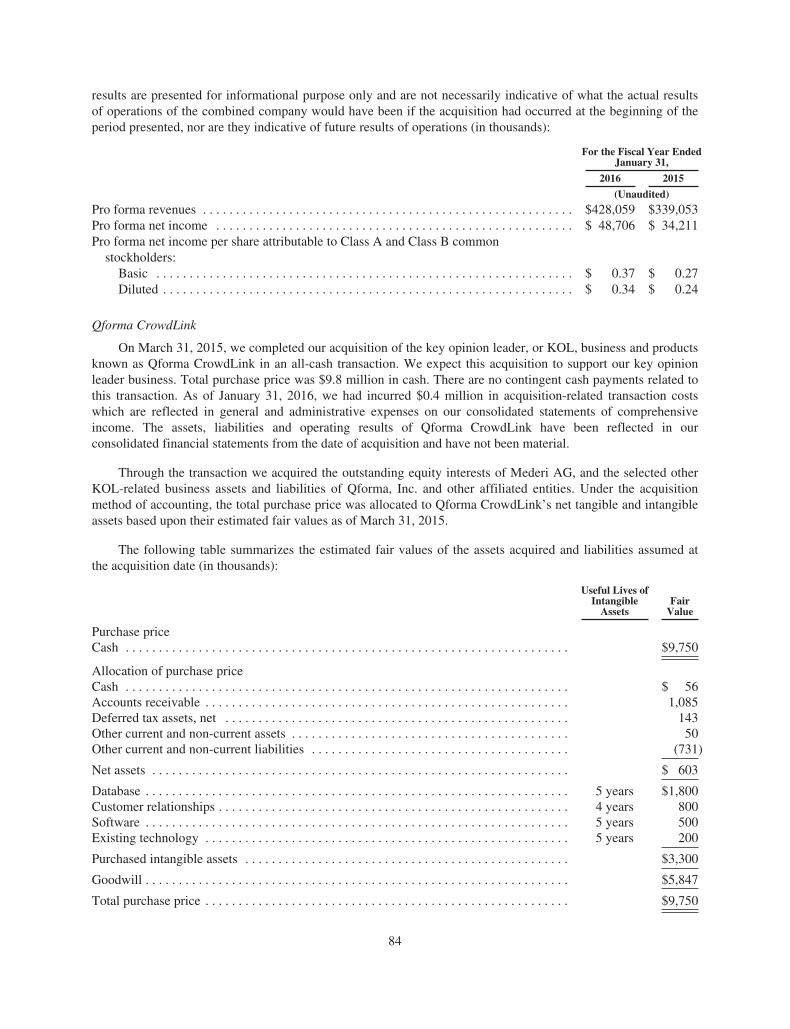
results are presented for informational purpose only and are not necessarily indicative of what the actual resultsof operations of the combined company would have been if the acquisition had occurred at the beginning of theperiod presented, nor are they indicative of future results of operations (in thousands):
For the Fiscal Year EndedJanuary 31,
2016 2015
(Unaudited)
Pro forma revenues . . . . . . . . . . . . . . . . . . . . . . . . . . . . . . . . . . . . . . . . . . . . . . . . . . . . . . . . $428,059 $339,053Pro forma net income . . . . . . . . . . . . . . . . . . . . . . . . . . . . . . . . . . . . . . . . . . . . . . . . . . . . . . $ 48,706 $ 34,211Pro forma net income per share attributable to Class A and Class B common
stockholders:Basic . . . . . . . . . . . . . . . . . . . . . . . . . . . . . . . . . . . . . . . . . . . . . . . . . . . . . . . . . . . . . . . $ 0.37 $ 0.27Diluted . . . . . . . . . . . . . . . . . . . . . . . . . . . . . . . . . . . . . . . . . . . . . . . . . . . . . . . . . . . . . . $ 0.34 $ 0.24
Qforma CrowdLink
On March 31, 2015, we completed our acquisition of the key opinion leader, or KOL, business and productsknown as Qforma CrowdLink in an all-cash transaction. We expect this acquisition to support our key opinionleader business. Total purchase price was $9.8 million in cash. There are no contingent cash payments related tothis transaction. As of January 31, 2016, we had incurred $0.4 million in acquisition-related transaction costswhich are reflected in general and administrative expenses on our consolidated statements of comprehensiveincome. The assets, liabilities and operating results of Qforma CrowdLink have been reflected in ourconsolidated financial statements from the date of acquisition and have not been material.
Through the transaction we acquired the outstanding equity interests of Mederi AG, and the selected otherKOL-related business assets and liabilities of Qforma, Inc. and other affiliated entities. Under the acquisitionmethod of accounting, the total purchase price was allocated to Qforma CrowdLink’s net tangible and intangibleassets based upon their estimated fair values as of March 31, 2015.
The following table summarizes the estimated fair values of the assets acquired and liabilities assumed atthe acquisition date (in thousands):
Useful Lives ofIntangible
AssetsFair
Value
Purchase priceCash . . . . . . . . . . . . . . . . . . . . . . . . . . . . . . . . . . . . . . . . . . . . . . . . . . . . . . . . . . . . . . . . . . . $9,750
Allocation of purchase priceCash . . . . . . . . . . . . . . . . . . . . . . . . . . . . . . . . . . . . . . . . . . . . . . . . . . . . . . . . . . . . . . . . . . . $ 56Accounts receivable . . . . . . . . . . . . . . . . . . . . . . . . . . . . . . . . . . . . . . . . . . . . . . . . . . . . . . . 1,085Deferred tax assets, net . . . . . . . . . . . . . . . . . . . . . . . . . . . . . . . . . . . . . . . . . . . . . . . . . . . . 143Other current and non-current assets . . . . . . . . . . . . . . . . . . . . . . . . . . . . . . . . . . . . . . . . . . 50Other current and non-current liabilities . . . . . . . . . . . . . . . . . . . . . . . . . . . . . . . . . . . . . . . (731)
Net assets . . . . . . . . . . . . . . . . . . . . . . . . . . . . . . . . . . . . . . . . . . . . . . . . . . . . . . . . . . . . . . . $ 603
Database . . . . . . . . . . . . . . . . . . . . . . . . . . . . . . . . . . . . . . . . . . . . . . . . . . . . . . . . . . . . . . . . 5 years $1,800Customer relationships . . . . . . . . . . . . . . . . . . . . . . . . . . . . . . . . . . . . . . . . . . . . . . . . . . . . . 4 years 800Software . . . . . . . . . . . . . . . . . . . . . . . . . . . . . . . . . . . . . . . . . . . . . . . . . . . . . . . . . . . . . . . . 5 years 500Existing technology . . . . . . . . . . . . . . . . . . . . . . . . . . . . . . . . . . . . . . . . . . . . . . . . . . . . . . . 5 years 200
Purchased intangible assets . . . . . . . . . . . . . . . . . . . . . . . . . . . . . . . . . . . . . . . . . . . . . . . . . $3,300
Goodwill . . . . . . . . . . . . . . . . . . . . . . . . . . . . . . . . . . . . . . . . . . . . . . . . . . . . . . . . . . . . . . . . $5,847
Total purchase price . . . . . . . . . . . . . . . . . . . . . . . . . . . . . . . . . . . . . . . . . . . . . . . . . . . . . . . $9,750
84

We did not record any in-process research and development in connection with the Qforma CrowdLinkacquisition. Pro forma results of operations have not been presented because the effect of this acquisition was notmaterial to the consolidated financial statements.
Note 3. Short-Term Investments
At January 31, 2016, short-term investments consisted of the following (in thousands):
AmortizedCost
GrossUnrealized
Gains
GrossUnrealized
LossesEstimatedFair Value
Available-for-sale securities:Asset-backed securities . . . . . . . . . . . . . . . . . . . . . . . . . . . . . . $ 5,456 $— $ (2) $ 5,454Commercial paper . . . . . . . . . . . . . . . . . . . . . . . . . . . . . . . . . . 5,970 — — 5,970Corporate notes and bonds . . . . . . . . . . . . . . . . . . . . . . . . . . . 38,341 26 (40) 38,327U.S. agency obligations . . . . . . . . . . . . . . . . . . . . . . . . . . . . . . 124,626 14 (54) 124,586U.S. treasury securities . . . . . . . . . . . . . . . . . . . . . . . . . . . . . . 39,720 4 (37) 39,687
Total available-for-sale securities . . . . . . . . . . . . . . . . . . . . . . $214,113 $ 44 $(133) $214,024
At January 31, 2015, short-term investments consisted of the following (in thousands):
AmortizedCost
GrossUnrealized
Gains
GrossUnrealized
LossesEstimatedFair Value
Available-for-sale securities:Asset-backed securities . . . . . . . . . . . . . . . . . . . . . . . . . . . . . . $ 9,323 $— $ (4) $ 9,319Commercial paper . . . . . . . . . . . . . . . . . . . . . . . . . . . . . . . . . . 3,394 — — 3,394Corporate notes and bonds . . . . . . . . . . . . . . . . . . . . . . . . . . . 45,990 18 (19) 45,989U.S. agency obligations . . . . . . . . . . . . . . . . . . . . . . . . . . . . . . 199,822 92 (3) 199,911U.S. treasury securities . . . . . . . . . . . . . . . . . . . . . . . . . . . . . . 9,999 8 — 10,007
Total available-for-sale securities . . . . . . . . . . . . . . . . . . $268,528 $118 $ (26) $268,620
The following table summarizes the estimated fair value of our short-term investments, designated asavailable-for-sale and classified by the contractual maturity date of the securities as of the dates shown (inthousands):
January 31,
2016 2015
Due in one year or less . . . . . . . . . . . . . . . . . . . . . . . . . . . . . . . . . . . . . . . . . . . . . . . . . . . . . $151,214 $224,263Due in greater than one year . . . . . . . . . . . . . . . . . . . . . . . . . . . . . . . . . . . . . . . . . . . . . . . . . 62,810 44,357
Total . . . . . . . . . . . . . . . . . . . . . . . . . . . . . . . . . . . . . . . . . . . . . . . . . . . . . . . . . . . . . . . . . . . $214,024 $268,620
We have certain available-for-sale securities in a gross unrealized loss position. We review our debtsecurities classified as short-term investments on a regular basis to evaluate whether or not any security hasexperienced an other-than-temporary decline in fair value. We consider factors such as the length of time andextent to which the market value has been less than the cost, the financial position and near-term prospects of theissuer and our intent to sell, or whether it is more likely than not we will be required to sell the investment beforerecovery of the investment’s amortized-cost basis. If we determine that an other-than-temporary decline exists inone of these securities, the respective investment would be written down to fair value. For debt securities, theportion of the write-down related to credit loss would be recognized to other income, net in our consolidatedstatements of comprehensive income. Any portion not related to credit loss would be included in accumulated
85

other comprehensive income. There were no impairments considered other-than-temporary as of January 31,2016 and 2015.
The following table shows the fair values and the gross unrealized losses of these available-for-salesecurities aggregated by investment category as of January 31, 2016 (in thousands):
FairValue
GrossUnrealized
Losses
Asset-backed securities . . . . . . . . . . . . . . . . . . . . . . . . . . . . . . . . . . . . . . . . . . . . . . . . . . . . . . $ 2,249 $ (2)Corporate notes and bonds . . . . . . . . . . . . . . . . . . . . . . . . . . . . . . . . . . . . . . . . . . . . . . . . . . . 14,296 (40)U.S. agency obligations . . . . . . . . . . . . . . . . . . . . . . . . . . . . . . . . . . . . . . . . . . . . . . . . . . . . . . 82,806 (54)U.S. treasury securities . . . . . . . . . . . . . . . . . . . . . . . . . . . . . . . . . . . . . . . . . . . . . . . . . . . . . . 33,486 (37)
The following table shows the fair values and the gross unrealized losses of these available-for-salesecurities aggregated by investment category as of January 31, 2015 (in thousands):
FairValue
GrossUnrealized
Losses
Asset-backed securities . . . . . . . . . . . . . . . . . . . . . . . . . . . . . . . . . . . . . . . . . . . . . . . . . . . . . . $ 9,319 $ (4)Corporate notes and bonds . . . . . . . . . . . . . . . . . . . . . . . . . . . . . . . . . . . . . . . . . . . . . . . . . . . 23,239 (19)U.S. agency obligations . . . . . . . . . . . . . . . . . . . . . . . . . . . . . . . . . . . . . . . . . . . . . . . . . . . . . . 18,398 (3)
Note 4. Property and Equipment, Net
Property and equipment, net consists of the following as of the dates shown (in thousands):
January 31,
2016 2015
Land . . . . . . . . . . . . . . . . . . . . . . . . . . . . . . . . . . . . . . . . . . . . . . . . . . . . . . . . . . . . . . . . . . . . . . $ 3,040 $ 3,040Building . . . . . . . . . . . . . . . . . . . . . . . . . . . . . . . . . . . . . . . . . . . . . . . . . . . . . . . . . . . . . . . . . . . 20,984 20,984Land improvements and building improvements . . . . . . . . . . . . . . . . . . . . . . . . . . . . . . . . . . . 14,106 —Equipment and computers . . . . . . . . . . . . . . . . . . . . . . . . . . . . . . . . . . . . . . . . . . . . . . . . . . . . . 5,910 3,103Furniture and fixtures . . . . . . . . . . . . . . . . . . . . . . . . . . . . . . . . . . . . . . . . . . . . . . . . . . . . . . . . 6,453 1,207Leasehold improvements . . . . . . . . . . . . . . . . . . . . . . . . . . . . . . . . . . . . . . . . . . . . . . . . . . . . . . 1,323 1,228Construction in progress . . . . . . . . . . . . . . . . . . . . . . . . . . . . . . . . . . . . . . . . . . . . . . . . . . . . . . — 980
51,816 30,542Less accumulated depreciation . . . . . . . . . . . . . . . . . . . . . . . . . . . . . . . . . . . . . . . . . . . . . . . . . (4,347) (2,339)
Total property and equipment, net . . . . . . . . . . . . . . . . . . . . . . . . . . . . . . . . . . . . . . . . . . $47,469 $28,203
Total depreciation expense was $3.1 million, $1.4 million and $0.9 million for the fiscal years endedJanuary 31, 2016, 2015 and 2014, respectively.
Note 5. Capitalized Internal-Use Software
Capitalized internal-use software, net, consisted of the following as of the dates shown (in thousands):
January 31,
2016 2015
Capitalized internal-use software development costs . . . . . . . . . . . . . . . . . . . . . . . . . . . . . . . . . $ 3,801 $ 3,307Less accumulated amortization . . . . . . . . . . . . . . . . . . . . . . . . . . . . . . . . . . . . . . . . . . . . . . . . . (2,822) (2,067)
Capitalized internal-use software development costs, net . . . . . . . . . . . . . . . . . . . . . . . . . . . . . $ 979 $ 1,240
86

During the fiscal years ended January 31, 2016 and 2015, we capitalized $0.5 million and $0.5 million,respectively, for internal-use software development costs.
Capitalized internal-use software amortization expense totaled $0.8 million, $0.8 million and $0.5 millionfor the fiscal years ended January 31, 2016, 2015 and 2014, respectively.
Note 6. Intangible Assets and Goodwill
The following schedule presents the details of intangible assets as of January 31, 2016 (in thousands):
January 31, 2016
GrossCarryingAmount
AccumulatedAmortization Net
RemainingUseful Life(in years)
Existing technology . . . . . . . . . . . . . . . . . . . . . . . . . . . . . . . . . . . . . $ 3,880 $(1,957) $ 1,923 2.6Database . . . . . . . . . . . . . . . . . . . . . . . . . . . . . . . . . . . . . . . . . . . . . . 4,939 (2,103) 2,836 3.0Customer contracts and relationships . . . . . . . . . . . . . . . . . . . . . . . 33,643 (1,693) 31,950 9.4Software . . . . . . . . . . . . . . . . . . . . . . . . . . . . . . . . . . . . . . . . . . . . . . 10,867 (1,106) 9,761 4.2Brand . . . . . . . . . . . . . . . . . . . . . . . . . . . . . . . . . . . . . . . . . . . . . . . . 1,141 (111) 1,030 3.2
$54,470 $(6,970) $47,500
The following schedule presents the details of intangible assets as of January 31, 2015 (in thousands):
January 31, 2015
GrossCarryingAmount
AccumulatedAmortization Net
RemainingUseful Life(in years)
Existing technology . . . . . . . . . . . . . . . . . . . . . . . . . . . . . . . . . . . . . . $3,680 $(1,188) $2,492 3.4Database . . . . . . . . . . . . . . . . . . . . . . . . . . . . . . . . . . . . . . . . . . . . . . . 2,570 (1,037) 1,533 2.3Customer relationships . . . . . . . . . . . . . . . . . . . . . . . . . . . . . . . . . . . . 1,020 (274) 746 4.3Software . . . . . . . . . . . . . . . . . . . . . . . . . . . . . . . . . . . . . . . . . . . . . . . 304 (171) 133 1.3
$7,574 $(2,670) $4,904
Amortization expense associated with intangible assets for the fiscal years ended January 31, 2016, 2015and 2014 was $4.3 million, $1.7 million and $1.0 million, respectively.
The estimated amortization expense for intangible assets for the next five years and thereafter is as follows(in thousands):
Period
EstimatedAmortization
Expense
Fiscal 2017 . . . . . . . . . . . . . . . . . . . . . . . . . . . . . . . . . . . . . . . . . . . . . . . . . . . . . . . . . . . . . . . . . . . . . . $ 8,221Fiscal 2018 . . . . . . . . . . . . . . . . . . . . . . . . . . . . . . . . . . . . . . . . . . . . . . . . . . . . . . . . . . . . . . . . . . . . . . 7,794Fiscal 2019 . . . . . . . . . . . . . . . . . . . . . . . . . . . . . . . . . . . . . . . . . . . . . . . . . . . . . . . . . . . . . . . . . . . . . . 6,964Fiscal 2020 . . . . . . . . . . . . . . . . . . . . . . . . . . . . . . . . . . . . . . . . . . . . . . . . . . . . . . . . . . . . . . . . . . . . . . 6,062Fiscal 2021 . . . . . . . . . . . . . . . . . . . . . . . . . . . . . . . . . . . . . . . . . . . . . . . . . . . . . . . . . . . . . . . . . . . . . . 3,629Thereafter . . . . . . . . . . . . . . . . . . . . . . . . . . . . . . . . . . . . . . . . . . . . . . . . . . . . . . . . . . . . . . . . . . . . . . . 14,830
Total . . . . . . . . . . . . . . . . . . . . . . . . . . . . . . . . . . . . . . . . . . . . . . . . . . . . . . . . . . . . . . . . . . . . . . . . . . . $47,500
87

The following schedule presents the details of goodwill as of January 31, 2016 (in thousands):
Goodwill
Balance as of January 31, 2015 . . . . . . . . . . . . . . . . . . . . . . . . . . . . . . . . . . . . . . . . . . . . . . . . . . . . . . . . . $ 4,850Goodwill from Qforma CrowdLink acquisition . . . . . . . . . . . . . . . . . . . . . . . . . . . . . . . . . . . . . . . . 5,847Goodwill from Zinc Ahead acquisition . . . . . . . . . . . . . . . . . . . . . . . . . . . . . . . . . . . . . . . . . . . . . . . 85,107
Balance as of January 31, 2016 . . . . . . . . . . . . . . . . . . . . . . . . . . . . . . . . . . . . . . . . . . . . . . . . . . . . . . . . . $95,804
Note 7. Accrued Expenses
Accrued expenses consisted of the following as of the dates shown (in thousands):
January 31,
2016 2015
Accrued commissions . . . . . . . . . . . . . . . . . . . . . . . . . . . . . . . . . . . . . . . . . . . . . . . . . . . . . . . . . $ 2,798 $1,309Accrued bonus . . . . . . . . . . . . . . . . . . . . . . . . . . . . . . . . . . . . . . . . . . . . . . . . . . . . . . . . . . . . . . . 2,957 1,901Deferred compensation associated with Zinc Ahead . . . . . . . . . . . . . . . . . . . . . . . . . . . . . . . . . 1,120 —Accrued other compensation and benefits . . . . . . . . . . . . . . . . . . . . . . . . . . . . . . . . . . . . . . . . . 5,576 3,287
Total accrued compensation and benefits . . . . . . . . . . . . . . . . . . . . . . . . . . . . . . . . . . . . . . . . . . $12,451 $6,497
Accrued fees paid to salesforce.com . . . . . . . . . . . . . . . . . . . . . . . . . . . . . . . . . . . . . . . . . . . . . . 4,222 3,395Accrued third-party professional services subcontractors fees . . . . . . . . . . . . . . . . . . . . . . . . . . 1,152 1,631Sales taxes payable . . . . . . . . . . . . . . . . . . . . . . . . . . . . . . . . . . . . . . . . . . . . . . . . . . . . . . . . . . . 1,597 1,666Other accrued expenses . . . . . . . . . . . . . . . . . . . . . . . . . . . . . . . . . . . . . . . . . . . . . . . . . . . . . . . . 4,088 2,247
Total accrued expenses and other current liabilities . . . . . . . . . . . . . . . . . . . . . . . . . . . . . . . . . . $11,059 $8,939
Note 8. Fair Value Measurements
We apply the provisions of FASB Accounting Standards Codification (ASC) Topic 820, Fair ValueMeasurements and Disclosures, for fair value measurements of financial assets and financial liabilities and forfair value measurements of nonfinancial items that are recognized or disclosed at fair value in the consolidatedfinancial statements. ASC Topic 820 defines fair value as the price that would be received to sell an asset or paidto transfer a liability in an orderly transaction between market participants at the measurement date. ASCTopic 820 also establishes a framework for measuring fair value and expands disclosures about fair valuemeasurements.
The carrying amounts of accounts receivable, accounts payable and accrued liabilities approximate fairvalue due to their short-term nature.
Financial assets and financial liabilities recorded at fair value in the consolidated financial statements arecategorized based upon the level of judgment associated with the inputs used to measure their fair value.Hierarchical levels, which are directly related to the amount of subjectivity associated with the inputs to thevaluation of these assets or liabilities are as follows:
Level 1—Observable inputs, such as quoted prices in active markets for identical assets or liabilities.
Level 2—Observable inputs other than Level 1 prices such as quoted prices for similar assets or liabilities,quoted prices in markets that are not active, or other inputs that are observable or can be corroborated byobservable market data for substantially the full term of the assets or liabilities.
Level 3—Unobservable inputs that are supported by little or no market activity and that are significant tothe fair value of the assets or liabilities.
88

Financial assets and financial liabilities measured at fair value are classified in their entirety based on thelowest level of input that is significant to the fair value measurement. Our assessment of the significance of aparticular input to the fair value measurement in its entirety requires management to make judgments andconsiders factors specific to the asset or liability.
The following table presents the fair value hierarchy for financial assets measured at fair value on arecurring basis as of January 31, 2016 (in thousands):
Level 1 Level 2 Level 3 Total
Cash equivalents:Money market funds . . . . . . . . . . . . . . . . . . . . . . . . . . . . . . . . . . . . $28,087 $ — $— $ 28,087Corporate notes and bonds . . . . . . . . . . . . . . . . . . . . . . . . . . . . . . . — 11,396 — 11,396U.S. agency obligations . . . . . . . . . . . . . . . . . . . . . . . . . . . . . . . . . — 3,002 — 3,002
Short-term investmentsAsset-backed securities . . . . . . . . . . . . . . . . . . . . . . . . . . . . . . . . . — 5,454 — 5,454Commercial paper . . . . . . . . . . . . . . . . . . . . . . . . . . . . . . . . . . . . . — 5,970 — 5,970Corporate notes and bonds . . . . . . . . . . . . . . . . . . . . . . . . . . . . . . . — 38,327 — 38,327U.S. agency obligations . . . . . . . . . . . . . . . . . . . . . . . . . . . . . . . . . — 124,586 — 124,586U.S. treasury securities . . . . . . . . . . . . . . . . . . . . . . . . . . . . . . . . . . — 39,687 — 39,687
Total . . . . . . . . . . . . . . . . . . . . . . . . . . . . . . . . . . . . . . . . . . . . $28,087 $228,422 $— $256,509
The following table presents the fair value hierarchy for financial assets measured at fair value on arecurring basis as of January 31, 2015 (in thousands):
Level 1 Level 2 Level 3 Total
Cash equivalents:Money market funds . . . . . . . . . . . . . . . . . . . . . . . $41,861 $ — $— $ 41,861U.S. agency obligations . . . . . . . . . . . . . . . . . . . . . — 3,595 — 3,595
Short-term investmentsAsset-backed securities . . . . . . . . . . . . . . . . . . . . . — 9,319 — 9,319Commercial paper . . . . . . . . . . . . . . . . . . . . . . . . . — 3,394 — 3,394Corporate notes and bonds . . . . . . . . . . . . . . . . . . — 45,989 — 45,989U.S. agency obligations . . . . . . . . . . . . . . . . . . . . . — 199,911 — 199,911U.S. treasury securities . . . . . . . . . . . . . . . . . . . . . — 10,007 — 10,007
Total . . . . . . . . . . . . . . . . . . . . . . . . . . . . . . . . $41,861 $272,215 $— $314,076
We determine the fair value of our security holdings based on pricing from our pricing vendors. Thevaluation techniques used to measure the fair value of financial instruments having Level 2 inputs were derivedfrom non-binding consensus prices that are corroborated by observable market data or quoted market prices forsimilar instruments. Such market prices may be quoted prices in active markets for identical assets (Level 1inputs) or pricing determined using inputs other than quoted prices that are observable either directly or indirectly(Level 2 inputs). We perform procedures to ensure that appropriate fair values are recorded such as comparingprices obtained from other sources.
89

Note 9. Other Income (Expense), Net
Other income (expense), net consisted of the following (in thousands):
Fiscal Year Ended January 31,
2016 2015 2014
Foreign currency loss . . . . . . . . . . . . . . . . . . . . . . . . . . . . . . . . . . . . . . $(1,785) $(3,893) $(940)Investment amortization . . . . . . . . . . . . . . . . . . . . . . . . . . . . . . . . . . . . (2,804) (2,424) (366)Interest income . . . . . . . . . . . . . . . . . . . . . . . . . . . . . . . . . . . . . . . . . . . 4,617 3,537 502
Other income (expense), net . . . . . . . . . . . . . . . . . . . . . . . . . . . . . . . . . $ 28 $(2,780) $(804)
Note 10. Income Taxes
The components of income (loss) before income taxes by U.S. and foreign jurisdictions were as follows forthe periods shown (in thousands):
Fiscal Year Ended January 31,
2016 2015 2014
United States . . . . . . . . . . . . . . . . . . . . . . . . . . . . . . . . . . . . . . . . . . . . $82,331 $64,178 $35,018Foreign . . . . . . . . . . . . . . . . . . . . . . . . . . . . . . . . . . . . . . . . . . . . . . . . . (3,714) 3,008 3,482
Total . . . . . . . . . . . . . . . . . . . . . . . . . . . . . . . . . . . . . . . . . . . . . . . $78,617 $67,186 $38,500
The majority of our revenues from international sales are invoiced from and collected by our U.S. entity andrecognized as a component of income before taxes in the United States as opposed to a foreign jurisdiction.
Provision for income taxes consisted of the following for the periods shown (in thousands):
Fiscal Year Ended January 31,
2016 2015 2014
Current provision:Federal . . . . . . . . . . . . . . . . . . . . . . . . . . . . . . . . . . . . . . . . . . . . . $26,919 $26,039 $13,837State . . . . . . . . . . . . . . . . . . . . . . . . . . . . . . . . . . . . . . . . . . . . . . . 2,897 3,022 1,186Foreign . . . . . . . . . . . . . . . . . . . . . . . . . . . . . . . . . . . . . . . . . . . . . 826 2,093 1,644
Total . . . . . . . . . . . . . . . . . . . . . . . . . . . . . . . . . . . . . . . . . . . $30,642 $31,154 $16,667
Deferred provision:Federal . . . . . . . . . . . . . . . . . . . . . . . . . . . . . . . . . . . . . . . . . . . . . (4,573) (3,421) (1,360)State . . . . . . . . . . . . . . . . . . . . . . . . . . . . . . . . . . . . . . . . . . . . . . . (209) (197) (94)Foreign . . . . . . . . . . . . . . . . . . . . . . . . . . . . . . . . . . . . . . . . . . . . . (1,703) (733) (328)
Total . . . . . . . . . . . . . . . . . . . . . . . . . . . . . . . . . . . . . . . . . . . $ (6,485) $ (4,351) $ (1,782)
Provision for income taxes . . . . . . . . . . . . . . . . . . . . . . . . . . . . . . . . . . $24,157 $26,803 $14,885
90
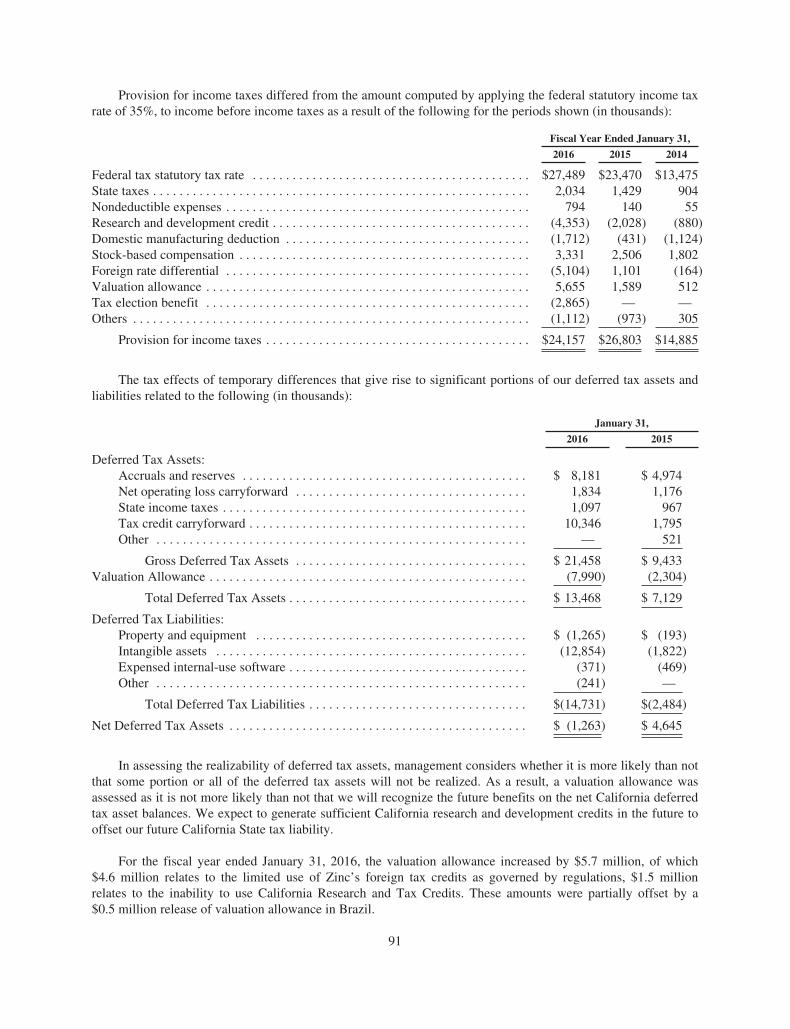
Provision for income taxes differed from the amount computed by applying the federal statutory income taxrate of 35%, to income before income taxes as a result of the following for the periods shown (in thousands):
Fiscal Year Ended January 31,
2016 2015 2014
Federal tax statutory tax rate . . . . . . . . . . . . . . . . . . . . . . . . . . . . . . . . . . . . . . . . . . $27,489 $23,470 $13,475State taxes . . . . . . . . . . . . . . . . . . . . . . . . . . . . . . . . . . . . . . . . . . . . . . . . . . . . . . . . . 2,034 1,429 904Nondeductible expenses . . . . . . . . . . . . . . . . . . . . . . . . . . . . . . . . . . . . . . . . . . . . . . 794 140 55Research and development credit . . . . . . . . . . . . . . . . . . . . . . . . . . . . . . . . . . . . . . . (4,353) (2,028) (880)Domestic manufacturing deduction . . . . . . . . . . . . . . . . . . . . . . . . . . . . . . . . . . . . . (1,712) (431) (1,124)Stock-based compensation . . . . . . . . . . . . . . . . . . . . . . . . . . . . . . . . . . . . . . . . . . . . 3,331 2,506 1,802Foreign rate differential . . . . . . . . . . . . . . . . . . . . . . . . . . . . . . . . . . . . . . . . . . . . . . (5,104) 1,101 (164)Valuation allowance . . . . . . . . . . . . . . . . . . . . . . . . . . . . . . . . . . . . . . . . . . . . . . . . . 5,655 1,589 512Tax election benefit . . . . . . . . . . . . . . . . . . . . . . . . . . . . . . . . . . . . . . . . . . . . . . . . . (2,865) — —Others . . . . . . . . . . . . . . . . . . . . . . . . . . . . . . . . . . . . . . . . . . . . . . . . . . . . . . . . . . . . (1,112) (973) 305
Provision for income taxes . . . . . . . . . . . . . . . . . . . . . . . . . . . . . . . . . . . . . . . . $24,157 $26,803 $14,885
The tax effects of temporary differences that give rise to significant portions of our deferred tax assets andliabilities related to the following (in thousands):
January 31,
2016 2015
Deferred Tax Assets:Accruals and reserves . . . . . . . . . . . . . . . . . . . . . . . . . . . . . . . . . . . . . . . . . . . $ 8,181 $ 4,974Net operating loss carryforward . . . . . . . . . . . . . . . . . . . . . . . . . . . . . . . . . . . 1,834 1,176State income taxes . . . . . . . . . . . . . . . . . . . . . . . . . . . . . . . . . . . . . . . . . . . . . . 1,097 967Tax credit carryforward . . . . . . . . . . . . . . . . . . . . . . . . . . . . . . . . . . . . . . . . . . 10,346 1,795Other . . . . . . . . . . . . . . . . . . . . . . . . . . . . . . . . . . . . . . . . . . . . . . . . . . . . . . . . — 521
Gross Deferred Tax Assets . . . . . . . . . . . . . . . . . . . . . . . . . . . . . . . . . . . $ 21,458 $ 9,433Valuation Allowance . . . . . . . . . . . . . . . . . . . . . . . . . . . . . . . . . . . . . . . . . . . . . . . . (7,990) (2,304)
Total Deferred Tax Assets . . . . . . . . . . . . . . . . . . . . . . . . . . . . . . . . . . . . $ 13,468 $ 7,129
Deferred Tax Liabilities:Property and equipment . . . . . . . . . . . . . . . . . . . . . . . . . . . . . . . . . . . . . . . . . $ (1,265) $ (193)Intangible assets . . . . . . . . . . . . . . . . . . . . . . . . . . . . . . . . . . . . . . . . . . . . . . . (12,854) (1,822)Expensed internal-use software . . . . . . . . . . . . . . . . . . . . . . . . . . . . . . . . . . . . (371) (469)Other . . . . . . . . . . . . . . . . . . . . . . . . . . . . . . . . . . . . . . . . . . . . . . . . . . . . . . . . (241) —
Total Deferred Tax Liabilities . . . . . . . . . . . . . . . . . . . . . . . . . . . . . . . . . $(14,731) $(2,484)
Net Deferred Tax Assets . . . . . . . . . . . . . . . . . . . . . . . . . . . . . . . . . . . . . . . . . . . . . $ (1,263) $ 4,645
In assessing the realizability of deferred tax assets, management considers whether it is more likely than notthat some portion or all of the deferred tax assets will not be realized. As a result, a valuation allowance wasassessed as it is not more likely than not that we will recognize the future benefits on the net California deferredtax asset balances. We expect to generate sufficient California research and development credits in the future tooffset our future California State tax liability.
For the fiscal year ended January 31, 2016, the valuation allowance increased by $5.7 million, of which$4.6 million relates to the limited use of Zinc’s foreign tax credits as governed by regulations, $1.5 millionrelates to the inability to use California Research and Tax Credits. These amounts were partially offset by a$0.5 million release of valuation allowance in Brazil.
91

As of January 31, 2016, the net operating loss carryforwards for federal and state income tax purposes wereapproximately $1.1 million and $4.1 million, respectively. The federal net operating losses and the state netoperating losses begin to expire in 2033.
As of January 31, 2016, we had $5.4 million of California research and development tax credits available tooffset future taxes, which do not expire.
We evaluate tax positions for recognition using a more-likely than-not recognition threshold, and those taxpositions eligible for recognition are measured as the largest amount of tax benefit that is greater than 50% likelyof being realized upon the effective settlement with a taxing authority that has full knowledge of all relevantinformation.
We classify unrecognized tax benefits that are not expected to result in payment or receipt of cash withinone year as “other non-current liabilities” in the consolidated balance sheets. As of January 31, 2016, the totalamount of gross unrecognized tax benefits was $5.2 million, of which $3.0 million, if recognized, wouldfavorably impact our effective tax rate. The aggregate changes in our total gross amount of unrecognized taxbenefits are summarized as follows for the periods shown (in thousands):
Fiscal Year Ended January 31,
2016 2015 2014
Beginning balance . . . . . . . . . . . . . . . . . . . . . . . . . . . . . . . . . . . . . . . . $3,247 $2,439 $1,220Increases related to tax positions taken during the prior period . . . . . 160 169 28Increases related to tax positions taken during the current period . . . . 2,185 869 1,191Lapse of statute of limitations . . . . . . . . . . . . . . . . . . . . . . . . . . . . . . . (344) (230) —
Ending balance . . . . . . . . . . . . . . . . . . . . . . . . . . . . . . . . . . . . . . . . . . . $5,248 $3,247 $2,439
Our policy is to classify interest and penalties associated with unrecognized tax benefits as income taxexpense. Interest and penalties were not significant during fiscal 2016.
We file tax returns in the United States for federal, California, and other states. The tax years from 2011forward remain open to examination for federal, 2007 for California and 2010 for other states. We file tax returnsin multiple foreign jurisdictions. The tax years from 2011 forward remain open to examination in these foreignjurisdictions.
As of January 31, 2016, we had not made any tax provision for U.S. federal and state income taxes andforeign withholding taxes on an immaterial amount of undistributed cumulative earnings of foreign subsidiariesthat would be potentially subject to US upon repatriation, because those earnings are considered to beindefinitely reinvested in those operations. If we were to repatriate these earnings to the United States, we wouldbe subject to an immaterial amount in U.S. income taxes, subject to an adjustment for foreign tax credits andforeign withholding taxes, based on the US statutory tax rate of 35%.
Note 11. Stockholders’ Equity
Common Stock
In connection with our initial public offering in October 2013 (IPO), we amended our certificate ofincorporation to provide for Class A common stock, Class B common stock and preferred stock. Immediatelyprior to the consummation of the IPO, all outstanding shares of convertible preferred stock and common stockwere converted into shares of Class B common stock. As a result, following the IPO, we have two classes ofauthorized common stock: Class A common stock and Class B common stock.
92

As of January 31, 2016, we had 87,359,026 shares of Class A common stock and 46,186,159 shares ofClass B common stock outstanding, of which 56,666 shares of Class B common stock were unvested, resultingfrom employees exercising stock options prior to vesting.
As of January 31, 2015, we had 64,729,479 shares of Class A common stock and 66,338,146 shares ofClass B common stock outstanding, of which 195,833 shares of Class B common stock were unvested, resultingfrom employees exercising stock options prior to vesting.
Employee Equity Plans
2007 Stock Plan
Our board of directors adopted our 2007 Stock Plan (2007 Plan) in February 2007, and our stockholdersapproved it in February 2007. No further awards have been made under our 2007 Plan since the adoption of the2012 Equity Incentive Plan. However, awards outstanding under our 2007 Plan will continue to be governed bytheir existing terms.
2012 Equity Incentive Plan
Our board of directors adopted our 2012 Equity Incentive Plan (2012 EIP) in November 2012, and ourstockholders approved it in December 2012. An amendment and restatement of the 2012 EIP was approved byour board of directors in March 2013, and our stockholders approved it in March 2013. The 2012 EIP becameeffective on adoption and replaced our 2007 Plan. No further awards have been made under our 2012 EIP sincethe adoption of the 2013 Equity Incentive Plan. However, awards outstanding under the 2012 EIP will continueto be governed by their existing terms.
2013 Equity Incentive Plan
Our board of directors adopted our 2013 Equity Incentive Plan (2013 EIP) in August 2013, and ourstockholders approved it in September 2013. The 2013 EIP became effective immediately on adoption althoughno awards were made under it until the date of our IPO on October 15, 2013, at which time our 2013 EIPreplaced our 2012 EIP.
As of January 31, 2016, the number of shares of our Class A common stock available for issuance under the2013 EIP was 12,656,864 plus any shares of our Class B common stock subject to awards under the 2012 EIPand the 2007 Plan that expire or lapse unexercised or, with respect to shares issued pursuant to such awards, areforfeited or repurchased by us after the date of our IPO on October 15, 2013. The number of shares available forissuance under the 2013 EIP automatically increases on the first business day of each of our fiscal years,commencing in 2014, by a number equal to the least of (a) 13.75 million shares, (b) 5% of the shares of allclasses of our common stock outstanding on the last business day of the prior fiscal year, or (c) the number ofshares determined by our board of directors.
2013 Employee Stock Purchase Plan
Our ESPP was adopted by our board of directors in August 2013 and our stockholders approved it inSeptember 2013. The ESPP became effective as of our IPO registration statement on Form S-1, on October 15,2013. Our ESPP is intended to qualify under Section 423 of the Internal Revenue Code of 1986, as amended(Code). The ESPP was approved with a reserve of 4.0 million shares of Class A common stock for futureissuance under various terms provided for in the ESPP. The number of shares available for issuance under theESPP automatically increases on the first business day of each of our fiscal years, commencing in 2014, by anumber equal to the least of (a) 2.2 million shares, (b) 1% of the shares of all classes of our common stockoutstanding on the last business day of the prior fiscal year or (c) the number of shares determined by our boardof directors. Prior to the beginning of our fiscal year ending January 31, 2017 our board of directors determinednot to increase the number of shares available for issuance under the ESPP.
93

During active offering periods, our ESPP permits eligible employees to acquire shares of our common stockat 85% of the lower of the fair market value of our Class A common stock on the first day of the applicableoffering period or the fair market value of our Class A common stock on the purchase date. Participants maypurchase shares of common stock through payroll deductions of up to 15% of their eligible compensation,subject to any plan limitations.
Voting Rights
The holders of our Class B common stock are entitled to ten votes per share, and holders of our Class Acommon stock are entitled to one vote per share. The holders of our Class A common stock and Class B commonstock vote together as a single class, unless otherwise required by our restated certificate of incorporation or law.Delaware law could require either holders of our Class A common stock or our Class B common stock to voteseparately as a single class in the following circumstances:
• if we were to seek to amend our restated certificate of incorporation to increase the authorized numberof shares of a class of stock, or to increase or decrease the par value of a class of stock, then that classwould be required to vote separately to approve the proposed amendment; and
• if we were to seek to amend our restated certificate of incorporation in a manner that alters or changesthe powers, preferences or special rights of a class of stock in a manner that affected its holdersadversely, then that class would be required to vote separately to approve the proposed amendment.
Our restated certificate of incorporation requires the approval of a majority of our outstanding Class Bcommon stock voting as a separate class for any transaction that would result in a change in control of ourcompany.
Stockholders do not have the ability to cumulate votes for the election of directors. Our restated certificateof incorporation and amended and restated bylaws that became effective upon the closing of our IPO provide fora classified board of directors consisting of three classes of approximately equal size, each serving staggeredthree-year terms. Only one class of directors will be elected at each annual meeting of our stockholders, with theother classes continuing for the remainder of their respective three-year terms.
Dividend Rights
Holders of outstanding shares of our common stock are entitled to receive dividends out of funds legallyavailable if our board of directors, in its discretion, determines to issue dividends and only then at the times andin the amounts that our board of directors may determine. To date, no dividends have been declared or paid byus.
No Preemptive or Similar Rights
Our common stock is not entitled to preemptive rights and is not subject to conversion, redemption orsinking fund provisions.
Right to Receive Liquidation Distributions
Upon our dissolution, liquidation or winding-up, the assets legally available for distribution to ourstockholders are distributable ratably among the holders of our common stock, subject to prior satisfaction of alloutstanding debt and liabilities and the preferential rights and payment of liquidation preferences, if any, on anyoutstanding shares of preferred stock.
Conversion Rights
Each outstanding share of Class B common stock is convertible at any time at the option of the holder intoone share of Class A common stock. In addition, each share of Class B common stock will convert automatically
94

into one share of Class A common stock upon any transfer, whether or not for value, which occurs following theclosing of our IPO, except for certain permitted transfers described in our restated certificate of incorporation,including transfers to any “permitted transferee” as defined in our restated certificate of incorporation, whichincludes, among others, transfers:
• to trusts, corporations, limited liability companies, partnerships, foundations or similar entitiesestablished by a Class B stockholder, provided that:
• such transfer is to entities established by a Class B stockholder where the Class B stockholderretains the exclusive right to vote and direct the disposition of the shares of Class B commonstock; or
• such transfer does not involve payment of cash, securities, property or other consideration to theClass B stockholder.
Once converted into Class A common stock, a share of Class B common stock may not be reissued.
All the outstanding shares of Class A and Class B common stock will convert automatically into shares of asingle class of common stock upon the earliest to occur of the following: (i) upon the election of the holders of amajority of the then-outstanding shares of Class B common stock or (ii) October 15, 2023. Following suchconversion, each share of common stock will have one vote per share and the rights of the holders of alloutstanding common stock will be identical. Once converted into a single class of common stock, the Class Aand Class B common stock may not be reissued.
Early Exercise of Employee Options
We historically have allowed for the early exercise of options granted under the 2007 Plan prior to vesting.The 2007 Plan allows for such exercises by means of cash payment, surrender of already outstanding commonstock, a same day broker assisted sale or through any other form or method consistent with applicable laws,regulations and rules. Historically, all exercises have been through cash payment. The unvested shares are subjectto our repurchase right at the original purchase price. The proceeds initially are recorded as an accrued liabilityfrom the early exercise of stock options, and reclassified to common stock as our repurchase right lapses. AtJanuary 31, 2016 and 2015, there were unvested shares in the amount of 56,666 and 195,833, respectively, whichwere subject to repurchase at an aggregate price of an immaterial amount and approximately $0.1 million,respectively.
These repurchase terms are considered to be a forfeiture provision and do not result in variable accounting.The restricted shares issued upon early exercise of stock options are legally issued and outstanding. However,these restricted shares are only deemed outstanding for basic earnings per share computation purposes upon therespective repurchase rights lapsing. We treat cash received from employees for the exercise of unvested optionsas a refundable deposit included as a liability in our consolidated balance sheets. During fiscal 2016, we recordedan immaterial amount of cash received for early exercise of options in accrued expenses. During fiscal 2015,there were no early exercises of options. Amounts from accrued expenses are reclassified to common stock andadditional paid-in capital as the shares vest.
Stock Option Activity
The 2007 Stock Plan and the 2012 EIP provided, and the 2013 EIP provides, for the issuance of incentiveand nonstatutory options to employees, consultants and non-employee directors. Options issued under andoutside of the 2007 Plan generally are exercisable for periods not to exceed 10 years and generally vest over fourto five years. Options issued under the 2012 EIP and 2013 EIP generally are exercisable for periods not to exceed10 years and generally vest over five to nine years. A summary of stock option activity for fiscal 2016 ispresented below:
95
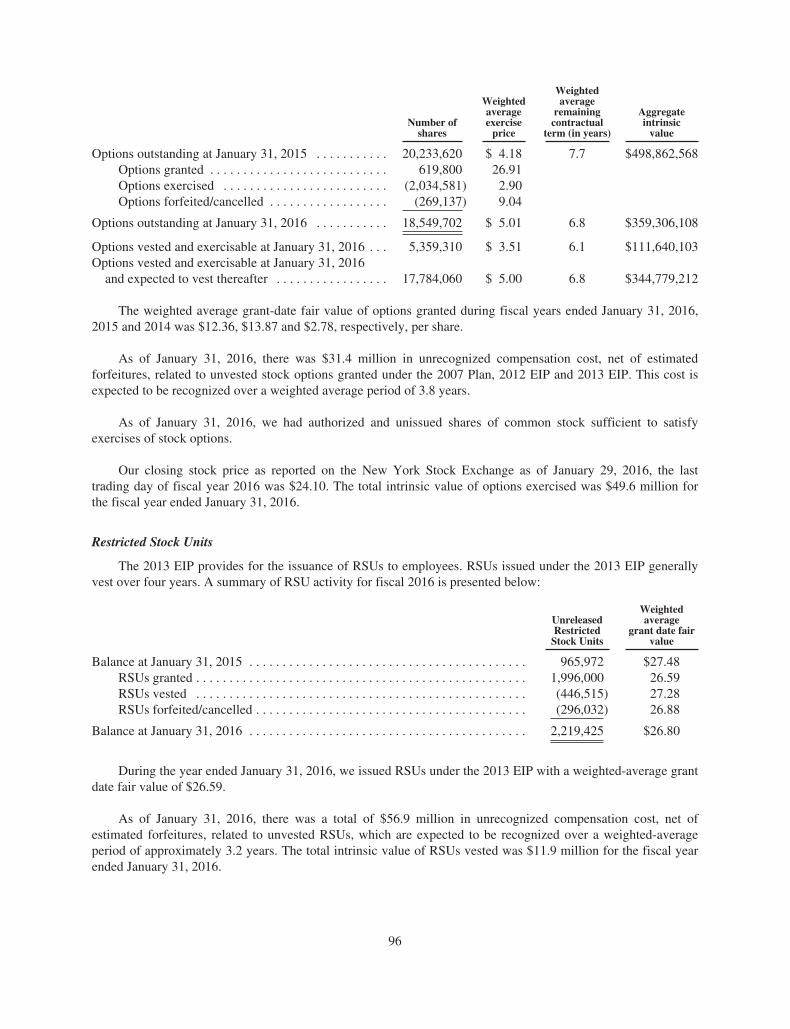
Number ofshares
Weightedaverageexercise
price
Weightedaverage
remainingcontractual
term (in years)
Aggregateintrinsic
value
Options outstanding at January 31, 2015 . . . . . . . . . . . 20,233,620 $ 4.18 7.7 $498,862,568Options granted . . . . . . . . . . . . . . . . . . . . . . . . . . . 619,800 26.91Options exercised . . . . . . . . . . . . . . . . . . . . . . . . . (2,034,581) 2.90Options forfeited/cancelled . . . . . . . . . . . . . . . . . . (269,137) 9.04
Options outstanding at January 31, 2016 . . . . . . . . . . . 18,549,702 $ 5.01 6.8 $359,306,108
Options vested and exercisable at January 31, 2016 . . . 5,359,310 $ 3.51 6.1 $111,640,103Options vested and exercisable at January 31, 2016
and expected to vest thereafter . . . . . . . . . . . . . . . . . 17,784,060 $ 5.00 6.8 $344,779,212
The weighted average grant-date fair value of options granted during fiscal years ended January 31, 2016,2015 and 2014 was $12.36, $13.87 and $2.78, respectively, per share.
As of January 31, 2016, there was $31.4 million in unrecognized compensation cost, net of estimatedforfeitures, related to unvested stock options granted under the 2007 Plan, 2012 EIP and 2013 EIP. This cost isexpected to be recognized over a weighted average period of 3.8 years.
As of January 31, 2016, we had authorized and unissued shares of common stock sufficient to satisfyexercises of stock options.
Our closing stock price as reported on the New York Stock Exchange as of January 29, 2016, the lasttrading day of fiscal year 2016 was $24.10. The total intrinsic value of options exercised was $49.6 million forthe fiscal year ended January 31, 2016.
Restricted Stock Units
The 2013 EIP provides for the issuance of RSUs to employees. RSUs issued under the 2013 EIP generallyvest over four years. A summary of RSU activity for fiscal 2016 is presented below:
UnreleasedRestricted
Stock Units
Weightedaverage
grant date fairvalue
Balance at January 31, 2015 . . . . . . . . . . . . . . . . . . . . . . . . . . . . . . . . . . . . . . . . . . 965,972 $27.48RSUs granted . . . . . . . . . . . . . . . . . . . . . . . . . . . . . . . . . . . . . . . . . . . . . . . . . . 1,996,000 26.59RSUs vested . . . . . . . . . . . . . . . . . . . . . . . . . . . . . . . . . . . . . . . . . . . . . . . . . . (446,515) 27.28RSUs forfeited/cancelled . . . . . . . . . . . . . . . . . . . . . . . . . . . . . . . . . . . . . . . . . (296,032) 26.88
Balance at January 31, 2016 . . . . . . . . . . . . . . . . . . . . . . . . . . . . . . . . . . . . . . . . . . 2,219,425 $26.80
During the year ended January 31, 2016, we issued RSUs under the 2013 EIP with a weighted-average grantdate fair value of $26.59.
As of January 31, 2016, there was a total of $56.9 million in unrecognized compensation cost, net ofestimated forfeitures, related to unvested RSUs, which are expected to be recognized over a weighted-averageperiod of approximately 3.2 years. The total intrinsic value of RSUs vested was $11.9 million for the fiscal yearended January 31, 2016.
96

Stock-Based Compensation
Compensation expense related to share-based transactions, including employee, consultant, and non-employee director stock option awards, is measured and recognized in the consolidated financial statementsbased on fair value. The fair value of each option award is estimated on the grant date using the Black-Scholesoption-pricing model. The stock-based compensation expense, net of forfeitures, is recognized using a straight-line basis over the requisite service periods of the awards, which is generally four to nine years. For restrictedstock awards, fair value is based on the closing price of our common stock on the grant date.
Our option-pricing model requires the input of highly subjective assumptions, including the fair value of theunderlying common stock, the expected term of the option, the expected volatility of the price of our commonstock, risk-free interest rates, and the expected dividend yield of our common stock. The assumptions used in ouroption-pricing model represent management’s best estimates. These estimates involve inherent uncertainties andthe application of management’s judgment. If factors change and different assumptions are used, our stock-basedcompensation expense could be materially different in the future.
These assumptions are estimated as follows:
• Fair Value of Common Stock. Prior to our IPO in October 2013, our compensation committeeconsidered numerous objective and subjective factors to determine the fair value of our common stockat each meeting at which awards were approved. The factors included, but were not limited to:(i) contemporaneous third-party valuations of our common stock; (ii) the prices, rights, preferences andprivileges of our Preferred Stock relative to those of our common stock; (iii) the lack of marketabilityof our common stock; (iv) our actual operating and financial results; (v) current business conditionsand projections; and (vi) the likelihood of achieving a liquidity event, such as an IPO or sale of ourcompany, given prevailing market conditions.
Since our IPO, we have used the market closing price for our Class A common stock as reported on theNew York Stock Exchange.
• Risk-Free Interest Rate. We base the risk-free interest rate used in the Black-Scholes valuation modelon the implied yield available on U.S. Treasury zero-coupon issues with an equivalent expected term ofthe options for each option group.
• Expected Term. The expected term represents the period that our stock-based awards are expected to beoutstanding. As we do not have sufficient historical experience for determining the expected term ofthe stock option awards granted, we have based our expected term on the simplified method availableunder GAAP.
• Volatility. We determine the price volatility factor based on a blend of our historical volatility and thehistorical volatilities of our peer group. Industry peers consist of several public companies in thetechnology industry that are similar to us in size, stage of life cycle and financial leverage. We did notrely on implied volatilities of traded options in our common stock or of our industry peers’ commonstock because the volume of stock option activity was relatively low. We intend to continue toconsistently apply this process using the same or similar public companies until a sufficient amount ofhistorical information regarding the volatility of our own common stock share price becomes available,or unless circumstances change such that the identified companies are no longer similar to us, in whichcase, more suitable companies whose share prices are publicly available would be utilized in thecalculation.
• Dividend Yield. We have not paid and do not expect to pay dividends.
97

The following table presents the weighted-average assumptions used to estimate the fair value of our stockoptions granted during the periods presented:
For the fiscal year ended
2016 2015 2014
Volatility . . . . . . . . . . . . . . . . . . . . . . . . . . . . . . . . . . . . . . . . 45% – 46% 48% – 50% 42% – 50%Expected term (in years) . . . . . . . . . . . . . . . . . . . . . . . . . . . . 5.50 – 6.32 6.00 – 6.32 6.32 – 8.23Risk-free interest rate . . . . . . . . . . . . . . . . . . . . . . . . . . . . . . 1.69% – 1.84% 1.75% – 1.94% 1.03% – 2.09%Dividend yield . . . . . . . . . . . . . . . . . . . . . . . . . . . . . . . . . . . . 0% 0% 0%
For the years ended January 31, 2016, 2015 and 2014, we capitalized an immaterial amount of stock-basedcompensation as part of our internal-use software capitalization.
Employee Stock Purchase Plan
The initial offering period for our Employee Stock Purchase Plan (ESPP) commenced on the date of ourinitial public offering and ended on June 15, 2014. During our initial ESPP offering period 350,059 shares ofClass A Common Stock were purchased. We have not had an open offering period subsequent to the initialoffering period, and do not currently have an active, open offering period under our ESPP.
During active offering periods, our ESPP permits eligible employees to acquire shares of our common stockat 85% of the lower of the fair market value of our Class A common stock on the first day of the applicableoffering period or the fair market value of our Class A common stock on the purchase date. Participants maypurchase shares of common stock through payroll deductions of up to 15% of their eligible compensation,subject to any plan limitations.
The following table presents the weighted-average assumptions used to calculate our stock-basedcompensation for the stock purchases under the ESPP:
Volatility . . . . . . . . . . . . . . . . . . . . . . . . . . . . . . . . . . . . . . . . . . . . . . . . . . . . . . . . . . . . . . . . . . . . . . . . . . . . . . 44%Expected term (in years) . . . . . . . . . . . . . . . . . . . . . . . . . . . . . . . . . . . . . . . . . . . . . . . . . . . . . . . . . . . . . . . . . 0.58Risk-free interest rate . . . . . . . . . . . . . . . . . . . . . . . . . . . . . . . . . . . . . . . . . . . . . . . . . . . . . . . . . . . . . . . . . . . . 0.10%Dividend yield . . . . . . . . . . . . . . . . . . . . . . . . . . . . . . . . . . . . . . . . . . . . . . . . . . . . . . . . . . . . . . . . . . . . . . . . . 0%
Note 12. Net Income per Share Attributable to Common Stockholders
We compute net income per share of Class A and Class B common stock using the two-class methodrequired for participating securities. Prior to the date of our IPO in October 2013, we considered all series of ourconvertible preferred stock to be participating securities due to their non-cumulative dividend rights. Immediatelyprior to the completion of our IPO, all outstanding shares of convertible preferred stock converted to Class Bcommon stock. Additionally, we consider unvested shares issued upon the early exercise of options to beparticipating securities as the holders of these shares have a non-forfeitable right to dividends in the event of ourdeclaration of a dividend for common shares.
Under the two-class method, net income attributable to common stockholders is determined by allocatingundistributed earnings, calculated as net income, less (i) current period convertible preferred stock non-cumulative dividends and (ii) earnings attributable to participating securities.
The net income per share attributable to common stockholders is allocated based on the contractualparticipation rights of the Class A common stock and Class B common stock as if the income for the year hasbeen distributed. As the liquidation and dividend rights are identical, the net income attributable to commonstockholders is allocated on a proportionate basis.
98

Basic net income per share of common stock is computed by dividing the net income attributable tocommon stockholders by the weighted-average number of shares of common stock outstanding during the period.All participating securities are excluded from the basic weighted-average shares of common stock outstanding.Unvested shares of common stock resulting from the early exercises of stock options are excluded from thecalculation of the weighted-average shares of common stock until they vest as they are subject to repurchase untilthey are vested.
Diluted net income per share attributable to common stockholders is computed by dividing net incomeattributable to common stockholders by the weighted-average shares outstanding, including potentially dilutiveshares of common stock assuming the dilutive effect of potential shares of common stock for the perioddetermined using the treasury stock method.
Undistributed net income for a given period is apportioned to participating securities based on the weighted-average shares of each class of common stock outstanding during the applicable period as a percentage of thetotal weighted-average shares outstanding during the same period.
For purposes of the diluted net income per share attributable to common stockholders calculation, unvestedshares of common stock resulting from the early exercises of stock options and unvested options to purchasecommon stock are considered to be potentially dilutive shares of common stock. In addition, the computation ofthe fully diluted net income per share of Class A common stock assumes the conversion from Class B commonstock, while the fully diluted net income per share of Class B common stock does not assume the conversion ofthose shares.
99

The numerators and denominators of the basic and diluted EPS computations for our common stock arecalculated as follows (in thousands, except per share data):
For the fiscal year ended January 31,
2016 2015 2014
Class A Class B Class A Class B Class A Class B
BasicNumerator
Net income . . . . . . . . . . . . . . . . . . . . . . . . . . . . . $ 31,453 $23,007 $ 14,540 $25,843 $ 1,934 $ 21,681Noncumulative dividends on convertible
preferred stock . . . . . . . . . . . . . . . . . . . . . . . . — — — — (33) (371)Undistributed earnings allocated to
participating securities . . . . . . . . . . . . . . . . . . (27) (20) (88) (157) (1,049) (11,757)
Net income attributable to commonstockholders, basic . . . . . . . . . . . . . . . . . . . . . $ 31,426 $22,987 $ 14,452 $25,686 $ 852 $ 9,553
DenominatorWeighted average shares used in computing net
income per share attributable to commonstockholders, basic . . . . . . . . . . . . . . . . . . . . . 76,246 55,774 45,983 81,730 4,237 47,488
Net income per share attributable to commonstockholders, basic . . . . . . . . . . . . . . . . . . . . . . . . . $ 0.41 $ 0.41 $ 0.31 $ 0.31 $ 0.20 $ 0.20
DilutedNumerator
Net income attributable to commonstockholders, basic . . . . . . . . . . . . . . . . . . . . . $ 31,426 $22,987 $ 14,452 $25,686 $ 852 $ 9,553
Reallocation as a result of conversion ofClass B to Class A common stock:
Net income attributable to commonstockholders, basic . . . . . . . . . . . . . . . . . . . . . 22,987 — 25,686 — 9,553 —
Reallocation of net income to Class B commonstock . . . . . . . . . . . . . . . . . . . . . . . . . . . . . . . . — 2,808 — 1,653 — 204
Net income attributable to commonstockholders, diluted . . . . . . . . . . . . . . . . . . . $ 54,413 $25,795 $ 40,138 $27,339 $10,405 $ 9,757
DenominatorNumber of shares used for basic EPS
computation . . . . . . . . . . . . . . . . . . . . . . . . . . 76,246 55,774 45,983 81,730 4,237 47,488Conversion of Class B to Class A common
stock . . . . . . . . . . . . . . . . . . . . . . . . . . . . . . . . 55,774 — 81,730 — 47,488 —Effect of potentially dilutive common shares . . 12,957 12,957 16,491 16,491 16,299 16,299
Weighted average shares used in computing netincome per share attributable to commonstockholders, diluted . . . . . . . . . . . . . . . . . . . 144,977 68,731 144,204 98,221 68,024 63,787
Net income per share attributable to commonstockholders, diluted . . . . . . . . . . . . . . . . . . . . . . . $ 0.38 $ 0.38 $ 0.28 $ 0.28 $ 0.15 $ 0.15
100

Potential common shares excluded where the inclusion would be anti-dilutive are as follows (in thousands):
Fiscal Year Ended January 31,
2016 2015 2014
Options and awards to purchase shares not included in the computation of dilutednet income per share because their inclusion would be anti-dilutive . . . . . . . . . 886 355 15,928
Note 13. Commitments and Contingencies
Litigation
Liabilities for loss contingencies arising from claims, assessments, litigation, fines and penalties and othersources are recorded when it is probable that a liability has been incurred and the amount of the assessment orremediation can be reasonably estimated. Legal costs incurred in connection with loss contingencies areexpensed as incurred.
From time to time, we may be involved in legal proceedings and subject to claims incident to the ordinarycourse of business. Although the results of such legal proceedings and claims cannot be predicted with certainty,we believe we are not currently a party to any legal proceedings, the outcome of which, if determined adverselyto us, would individually or taken together have a material adverse effect on our business, operating results, cashflows or financial position. Regardless of the outcome, such proceedings can have an adverse impact on usbecause of defense and settlement costs, diversion of resources and other factors, and there can be no assurancesthat favorable outcomes will be obtained.
Leases
We have several non-cancelable operating leases, primarily for offices and servers. Rental payments includeminimum rental fees.
Minimum rent payments under operating leases are recognized on a straight-line basis over the term of thelease including any periods of free rent. Rent expense for operating leases were $4.4 million, $2.9 million and$2.5 million, for the fiscal year ended January 31, 2016, 2015 and 2014, respectively.
Future minimum lease payments under non-cancelable operating leases as of January 31, 2016 are asfollows (in thousands):
PeriodOperating
leases
Fiscal 2017 . . . . . . . . . . . . . . . . . . . . . . . . . . . . . . . . . . . . . . . . . . . . . . . . . . . . . . . . . . . . . . . . . . . . . . . . $ 3,079Fiscal 2018 . . . . . . . . . . . . . . . . . . . . . . . . . . . . . . . . . . . . . . . . . . . . . . . . . . . . . . . . . . . . . . . . . . . . . . . . 2,260Fiscal 2019 . . . . . . . . . . . . . . . . . . . . . . . . . . . . . . . . . . . . . . . . . . . . . . . . . . . . . . . . . . . . . . . . . . . . . . . . 1,706Fiscal 2020 . . . . . . . . . . . . . . . . . . . . . . . . . . . . . . . . . . . . . . . . . . . . . . . . . . . . . . . . . . . . . . . . . . . . . . . . 1,559Fiscal 2021 . . . . . . . . . . . . . . . . . . . . . . . . . . . . . . . . . . . . . . . . . . . . . . . . . . . . . . . . . . . . . . . . . . . . . . . . 1,056Thereafter . . . . . . . . . . . . . . . . . . . . . . . . . . . . . . . . . . . . . . . . . . . . . . . . . . . . . . . . . . . . . . . . . . . . . . . . . 1,434
Total . . . . . . . . . . . . . . . . . . . . . . . . . . . . . . . . . . . . . . . . . . . . . . . . . . . . . . . . . . . . . . . . . . . . . . . . . . . . . $11,094
Value-Added Reseller Agreement
We have a value-added reseller agreement with salesforce.com, inc. for our use of the Salesforce Platformin combination with our developed technology to deliver certain of our multichannel customer relationshipmanagement applications, including hosting infrastructure and data center operations provided bysalesforce.com. On March 3, 2014, we extended the term of the Value-Added Reseller Agreement for an
101
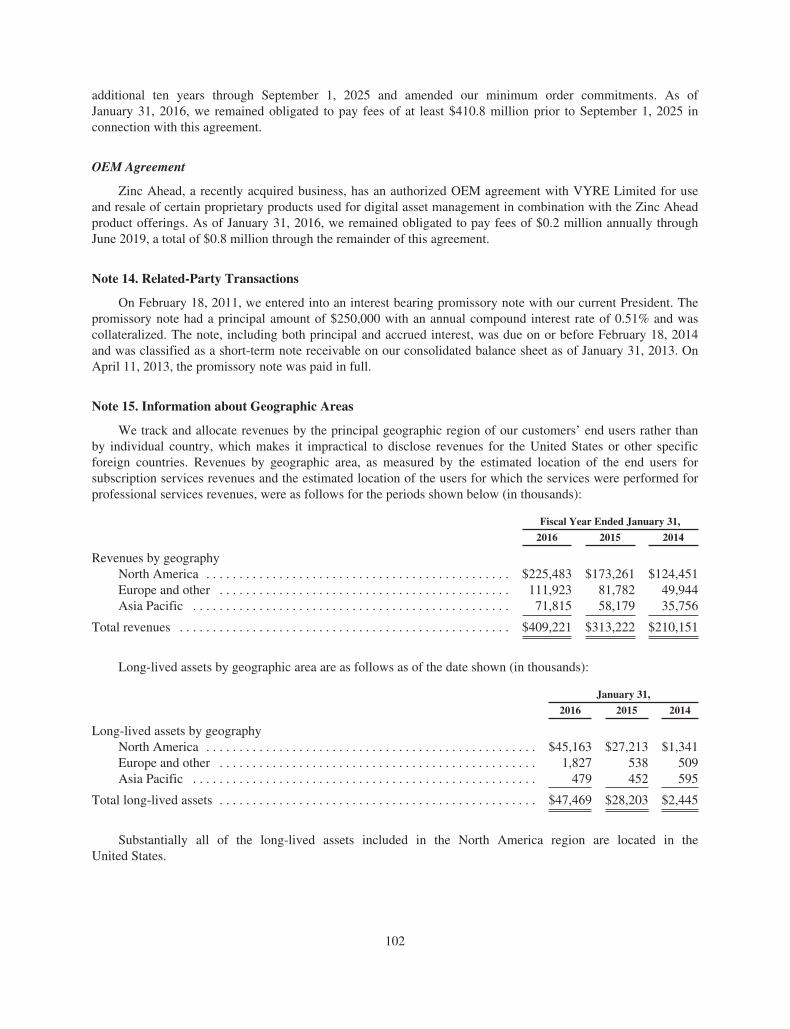
additional ten years through September 1, 2025 and amended our minimum order commitments. As ofJanuary 31, 2016, we remained obligated to pay fees of at least $410.8 million prior to September 1, 2025 inconnection with this agreement.
OEM Agreement
Zinc Ahead, a recently acquired business, has an authorized OEM agreement with VYRE Limited for useand resale of certain proprietary products used for digital asset management in combination with the Zinc Aheadproduct offerings. As of January 31, 2016, we remained obligated to pay fees of $0.2 million annually throughJune 2019, a total of $0.8 million through the remainder of this agreement.
Note 14. Related-Party Transactions
On February 18, 2011, we entered into an interest bearing promissory note with our current President. Thepromissory note had a principal amount of $250,000 with an annual compound interest rate of 0.51% and wascollateralized. The note, including both principal and accrued interest, was due on or before February 18, 2014and was classified as a short-term note receivable on our consolidated balance sheet as of January 31, 2013. OnApril 11, 2013, the promissory note was paid in full.
Note 15. Information about Geographic Areas
We track and allocate revenues by the principal geographic region of our customers’ end users rather thanby individual country, which makes it impractical to disclose revenues for the United States or other specificforeign countries. Revenues by geographic area, as measured by the estimated location of the end users forsubscription services revenues and the estimated location of the users for which the services were performed forprofessional services revenues, were as follows for the periods shown below (in thousands):
Fiscal Year Ended January 31,
2016 2015 2014
Revenues by geographyNorth America . . . . . . . . . . . . . . . . . . . . . . . . . . . . . . . . . . . . . . . . . . . . . . $225,483 $173,261 $124,451Europe and other . . . . . . . . . . . . . . . . . . . . . . . . . . . . . . . . . . . . . . . . . . . . 111,923 81,782 49,944Asia Pacific . . . . . . . . . . . . . . . . . . . . . . . . . . . . . . . . . . . . . . . . . . . . . . . . 71,815 58,179 35,756
Total revenues . . . . . . . . . . . . . . . . . . . . . . . . . . . . . . . . . . . . . . . . . . . . . . . . . . $409,221 $313,222 $210,151
Long-lived assets by geographic area are as follows as of the date shown (in thousands):
January 31,
2016 2015 2014
Long-lived assets by geographyNorth America . . . . . . . . . . . . . . . . . . . . . . . . . . . . . . . . . . . . . . . . . . . . . . . . . . $45,163 $27,213 $1,341Europe and other . . . . . . . . . . . . . . . . . . . . . . . . . . . . . . . . . . . . . . . . . . . . . . . . 1,827 538 509Asia Pacific . . . . . . . . . . . . . . . . . . . . . . . . . . . . . . . . . . . . . . . . . . . . . . . . . . . . 479 452 595
Total long-lived assets . . . . . . . . . . . . . . . . . . . . . . . . . . . . . . . . . . . . . . . . . . . . . . . . $47,469 $28,203 $2,445
Substantially all of the long-lived assets included in the North America region are located in theUnited States.
102
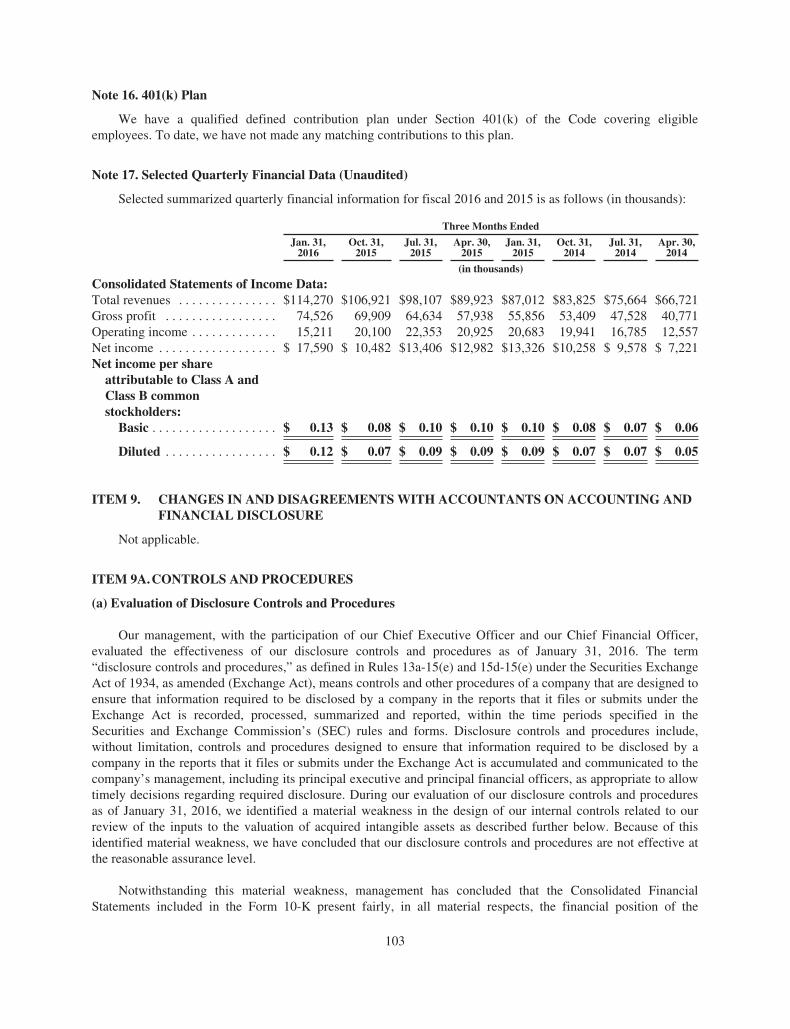
Note 16. 401(k) Plan
We have a qualified defined contribution plan under Section 401(k) of the Code covering eligibleemployees. To date, we have not made any matching contributions to this plan.
Note 17. Selected Quarterly Financial Data (Unaudited)
Selected summarized quarterly financial information for fiscal 2016 and 2015 is as follows (in thousands):
Three Months Ended
Jan. 31,2016
Oct. 31,2015
Jul. 31,2015
Apr. 30,2015
Jan. 31,2015
Oct. 31,2014
Jul. 31,2014
Apr. 30,2014
(in thousands)
Consolidated Statements of Income Data:Total revenues . . . . . . . . . . . . . . . $114,270 $106,921 $98,107 $89,923 $87,012 $83,825 $75,664 $66,721Gross profit . . . . . . . . . . . . . . . . . 74,526 69,909 64,634 57,938 55,856 53,409 47,528 40,771Operating income . . . . . . . . . . . . . 15,211 20,100 22,353 20,925 20,683 19,941 16,785 12,557Net income . . . . . . . . . . . . . . . . . . $ 17,590 $ 10,482 $13,406 $12,982 $13,326 $10,258 $ 9,578 $ 7,221Net income per share
attributable to Class A andClass B commonstockholders:
Basic . . . . . . . . . . . . . . . . . . . $ 0.13 $ 0.08 $ 0.10 $ 0.10 $ 0.10 $ 0.08 $ 0.07 $ 0.06
Diluted . . . . . . . . . . . . . . . . . $ 0.12 $ 0.07 $ 0.09 $ 0.09 $ 0.09 $ 0.07 $ 0.07 $ 0.05
ITEM 9. CHANGES IN AND DISAGREEMENTS WITH ACCOUNTANTS ON ACCOUNTING ANDFINANCIAL DISCLOSURE
Not applicable.
ITEM 9A.CONTROLS AND PROCEDURES
(a) Evaluation of Disclosure Controls and Procedures
Our management, with the participation of our Chief Executive Officer and our Chief Financial Officer,evaluated the effectiveness of our disclosure controls and procedures as of January 31, 2016. The term“disclosure controls and procedures,” as defined in Rules 13a-15(e) and 15d-15(e) under the Securities ExchangeAct of 1934, as amended (Exchange Act), means controls and other procedures of a company that are designed toensure that information required to be disclosed by a company in the reports that it files or submits under theExchange Act is recorded, processed, summarized and reported, within the time periods specified in theSecurities and Exchange Commission’s (SEC) rules and forms. Disclosure controls and procedures include,without limitation, controls and procedures designed to ensure that information required to be disclosed by acompany in the reports that it files or submits under the Exchange Act is accumulated and communicated to thecompany’s management, including its principal executive and principal financial officers, as appropriate to allowtimely decisions regarding required disclosure. During our evaluation of our disclosure controls and proceduresas of January 31, 2016, we identified a material weakness in the design of our internal controls related to ourreview of the inputs to the valuation of acquired intangible assets as described further below. Because of thisidentified material weakness, we have concluded that our disclosure controls and procedures are not effective atthe reasonable assurance level.
Notwithstanding this material weakness, management has concluded that the Consolidated FinancialStatements included in the Form 10-K present fairly, in all material respects, the financial position of the
103

Company at January 31, 2016 and January 31, 2015 and the consolidated results of operations and cash flows foreach of the three fiscal years in the period ended January 31, 2016 in conformity with U.S. generally acceptedaccounting principles.
(b) Management’s Annual Report on Internal Controls Over Financial Reporting
Our management is responsible for establishing and maintaining adequate internal control over financialreporting (as defined in Rule 13a-15(f) under the Exchange Act). Our management conducted an assessment ofthe effectiveness of our internal control over financial reporting as of January 31, 2016 based on the criteria setforth in the 2013 Internal Control-Integrated Framework issued by the Committee of Sponsoring Organizationsof the Treadway Commission. In accordance with guidance issued by the Securities and Exchange Commission,companies are permitted to exclude acquisitions from their final assessment of internal control over financialreporting for the first fiscal year in which the acquisition occurred. Our management’s evaluation of internalcontrol over financial reporting excluded the internal control activities of Zinc Ahead and Qforma CrowdLink,which we acquired on September 29, 2015 and March 31, 2015, respectively. We have included the financialresults of Zinc Ahead and Qforma CrowdLink in the consolidated financial statements from the respective datesof acquisition. Total revenues subject to Zinc Ahead and Qforma CrowdLink’s internal control over financialreporting represented 2% and less than 1%, respectively, of our consolidated total revenues for the fiscal yearended January 31, 2016. Total assets subject to Zinc Ahead and Qforma CrowdLink’s internal control overfinancial reporting represented 1% and less than 1%, respectively, of our consolidated total assets as ofJanuary 31, 2016.
Based on the assessment, our management has concluded that, while there are no misstatements identified inthe Consolidated Financial Statements included in the Form 10-K for the year ended January 31, 2016, ourinternal control over financial reporting are not effective because of the existence of the material weaknessdescribed below.
A material weakness is a deficiency, or combination of deficiencies, in internal control over financialreporting such that there is a reasonable possibility that a material misstatement of our annual or interimconsolidated financial statements will not be prevented or detected on a timely basis.
The material weakness in internal control over financial reporting resulted from the inadequate design ofinternal controls related to management’s review of the completeness and accuracy of key assumptions andfinancial data used to measure the fair value of acquired intangible assets, and the involvement of specialists andthe evidence and documentation of internal control procedures with respect to the process of determining fairvalue of acquired intangible assets. The material weakness indicates that management did not have a control thatwas sufficiently distinct from the process management undertook to measure the fair value of the acquiredintangible assets.
Our internal control over financial reporting as of January 31, 2016, has been audited by KPMG LLP, anindependent registered public company accounting firm, as stated in its report which contains an adverse opinionon the effectiveness of our internal control over financial reporting. This report appears in Part II, Item 8 of thisAnnual Report on Form 10-K.
(c) Remediation Efforts to Address the Material Weakness
We are working to remediate the material weakness. Among other things, we expect to:
• improve the design of internal controls related to management’s review of the completeness andaccuracy of key assumptions and financial data used to measure the fair value of acquired intangibleassets and the involvement of specialists;
• improve the design of internal controls related to the evidence and documentation of internal controlprocedures with respect to the process of determining fair value of acquired intangible assets; and
104
• sufficiently distinguish our internal controls from the process we undertake to measure the fair value ofacquired intangible assets.
(d) Changes in Internal Control over Financial Reporting
There were no changes in our internal control over financial reporting identified in connection with theevaluation required by Rule 13a-15(d) and 15d-15(d) of the Exchange Act that occurred during the quarter endedJanuary 31, 2016 that have materially affected, or are reasonably likely to materially affect, our internal controlover financial reporting other than the material weakness noted above.
(e) Inherent Limitations on Effectiveness of Controls
Our management, including our Chief Executive Officer and Chief Financial Officer, do not expect that ourdisclosure controls or our internal control over financial reporting will prevent all errors and all fraud. A controlsystem, no matter how well conceived and operated, can provide only reasonable, not absolute, assurance that theobjectives of the control system are met. Further, the design of a control system must reflect the fact that thereare resource constraints, and the benefits of controls must be considered relative to their costs. Because of theinherent limitations in all control systems, no evaluation of controls can provide absolute assurance that allcontrol issues and instances of fraud, if any, within the Company have been detected. These inherent limitationsinclude the realities that judgments in decision-making can be faulty, and that breakdowns can occur because of asimple error or mistake. Additionally, controls can be circumvented by the individual acts of some persons, bycollusion of two or more people or by management override of the controls. The design of any system of controlsis also based in part upon certain assumptions about the likelihood of future events, and there can be no assurancethat any design will succeed in achieving its stated goals under all potential future conditions; over time, controlsmay become inadequate because of changes in conditions, or the degree of compliance with policies orprocedures may deteriorate. Because of the inherent limitations in a cost-effective control system, misstatementsdue to error or fraud may occur and not be detected.
ITEM 9B. OTHER INFORMATION
None.
105

PART III.
ITEM 10. DIRECTORS, EXECUTIVE OFFICERS AND CORPORATE GOVERNANCE
The information required by this item will be contained in our definitive proxy statement to be filed with theSecurities and Exchange Commission in connection with our 2016 annual meeting of stockholders (the “ProxyStatement”), which we expect to file not later than 120 days after the end of our fiscal year ended January 31,2016, and is incorporated in this report by reference.
ITEM 11. EXECUTIVE COMPENSATION
The information required by this item will be set forth in the Proxy Statement, which we expect to file notlater than 120 days after the end of our fiscal year ended January 31, 2016, and is incorporated in this report byreference.
ITEM 12. SECURITY OWNERSHIP OF CERTAIN BENEFICIAL OWNERS AND MANAGEMENTAND RELATED STOCKHOLDER MATTERS
The information required by this item will be set forth in the Proxy Statement, which we expect to file notlater than 120 days after the end of our fiscal year ended January 31, 2016, and is incorporated in this report byreference.
ITEM 13. CERTAIN RELATIONSHIPS AND RELATED TRANSACTIONS, AND DIRECTORINDEPENDENCE
The information required by this item will be set forth in the Proxy Statement, which we expect to file notlater than 120 days after the end of our fiscal year ended January 31, 2016, and is incorporated in this report byreference.
ITEM 14. PRINCIPAL ACCOUNTING FEES AND SERVICES
The information required by this item will be set forth in the Proxy Statement, which we expect to file notlater than 120 days after the end of our fiscal year ended January 31, 2016, and is incorporated in this report byreference.
106

PART IV.
Item 15. EXHIBITS, FINANCIAL STATEMENT SCHEDULES
(a) The following documents are filed as part of, or incorporated by reference into, this annual report onForm 10-K:
1. Financial Statements. See Index to Consolidated Financial Statements under Item 8 of this annual reporton Form 10-K.
2. Financial Statement Schedules. All schedules have been omitted because the information required to bepresented in them is not applicable or is shown in the consolidated financial statements or related notes.
3. Exhibits. We have filed, or incorporated into this annual report on Form 10-K by reference, the exhibitslisted on the accompanying Exhibit Index immediately following the signature page of this annual report onForm 10-K.
(b) Exhibits. See Item 15(a)(3) above.
(c) Financial Statement Schedules. See Item 15(a)(2) above.
107

SIGNATURES
Pursuant to the requirements of the Securities Exchange Act of 1934, the registrant has duly caused thisAnnual Report on Form 10-K to be signed on its behalf by the undersigned, thereunto duly authorized, in the Cityof Pleasanton, State of California, on this 31st day of March, 2016.
VEEVA SYSTEMS INC.
/s/ Timothy S. CabralTimothy S. Cabral
Chief Financial Officer
POWER OF ATTORNEY
KNOW ALL PERSONS BY THESE PRESENTS, that each person whose signature appears below herebyconstitutes and appoints Peter P. Gassner and Timothy S. Cabral, and each of them, as his or her true and lawfulattorney-in-fact and agent with full power of substitution, for him or her in any and all capacities, to sign any andall amendments to this Annual Report on Form 10-K, and to file the same, with all exhibits thereto and otherdocuments in connection therewith, with the SEC, granting unto said attorney-in-fact and agent full power andauthority to do and perform each and every act and thing requisite and necessary to be done in connectiontherewith, as fully for all intents and purposes as he or she might or could do in person, hereby ratifying andconfirming all that said attorney-in-fact and agent, or his substitute, may lawfully do or cause to be done byvirtue hereof.
Pursuant to the requirements of the Securities Exchange Act of 1934, as amended, this Annual Report onForm 10-K has been signed by the following persons in the capacities and on the dates indicated.
Signature Title Date
/s/ Peter P. GassnerPeter P. Gassner
Chief Executive Officer and Director(Principal Executive Officer)
March 31, 2016
/s/ Timothy S. CabralTimothy S. Cabral
Chief Financial Officer(Principal Financial and
Accounting Officer)
March 31, 2016
/s/ Tim BarabeTim Barabe
Director March 31, 2016
/s/ Paul ChamberlainPaul Chamberlain
Director March 31, 2016
/s/ Ronald E.F. CoddRonald E.F. Codd
Director March 31, 2016
/s/ Gordon RitterGordon Ritter
Chairman of the Board of Directors March 31, 2016
/s/ Paul SekhriPaul Sekhri
Director March 31, 2016
108

EXHIBIT INDEX
ExhibitNumber
Incorporated by Reference FiledHerewithExhibit Description Form File No. Exhibit Filing Date
2.1 Share Purchase Agreement, datedSeptember 29, 2015, among Veeva SystemsInc., Veeva U.K. Holdings Limited,Accel-KKR Structured Capital Partners, LPand the other sellers party thereto. 8-K 001-36121 2.1 10/1/2015
3.1 Restated Certificate of Incorporation ofRegistrant. 8-K 001-36121 3.1 10/22/2013
3.2 Amended and Restated Bylaws of VeevaSystems Inc. S-1/A 333-191085 3.4 10/3/2013
4.1 Form of Registrant’s Class A common stockcertificate. S-1/A 333-191085 4.1 10/3/2013
4.2 Amended and Restated Investors’ RightsAgreement, dated May 16, 2008, by andamong the Registrant and the other partiesthereto. S-1 333-191085 4.2 9/11/2013
10.1 Data Processing Addendum, dated April 4,2014, to Value-Added Reseller Agreement,between Registrant and salesforce.com, inc.,as amended. 10-Q 001-36121 10.1 6/6/2014
10.2 Purchase and Sale Agreement, dated June 11,2014, between Registrant and The DuffieldFamily Foundation, as amended July 16,2014. 10-Q 001-36121 10.1 9/11/2014
10.3 Description of Non-Employee DirectorCompensation. 8-K 001-36121 Item 5.02 7/10/2014
10.4 Form of Indemnification Agreement betweenthe Registrant and each of its directors andexecutive officers. S-1/A 333-191085 10.1 10/3/2013
10.5* 2007 Stock Plan and forms of agreementsthereunder. S-1 333-191085 10.2 9/11/2013
10.6* 2012 Equity Incentive Plan and forms ofagreements thereunder. S-1 333-191085 10.3 9/11/2013
10.7* 2013 Equity Incentive Plan and forms ofagreements thereunder. S-1/A 333-191085 10.4 10/3/2013
10.8* 2013 Employee Stock Purchase Plan. S-1/A 333-191085 10.5 10/3/2013
10.9** Amended and Restated Value-Added ResellerAgreement, dated September 2, 2010,between Registrant and salesforce.com, inc.,as amended December 3, 2010, December 13,2010, April 15, 2011, August 23, 2011,September 29, 2011, April 3, 2012 andMay 24, 2012. S-1/A 333-191085 10.7 9/20/2013
109

ExhibitNumber
Incorporated by Reference FiledHerewithExhibit Description Form File No. Exhibit Filing Date
10.10** Eighth Amendment, dated March 3, 2014, toAmended and Restated Value-Added ResellerAgreement, dated September 2, 2010,between Registrant and salesforce.com, inc.,as amended. 8-K 001-36121 10.1 3/4/2014
10.11* Offer letter, dated June 20, 2013, betweenPeter P. Gassner and the Registrant. S-1 333-191085 10.8 9/11/2013
10.12* Offer letter, dated June 19, 2013, betweenMatthew J. Wallach and the Registrant. S-1 333-191085 10.9 9/11/2013
10.13* Offer letter, dated January 25, 2010, betweenTimothy S. Cabral and the Registrant. S-1 333-191085 10.10 9/11/2013
10.14* Offer letter, dated March 16, 2012, betweenRonald E. F. Codd and the Registrant. S-1 333-191085 10.11 9/11/2013
10.15* Offer letter, dated August 14, 2012, betweenJonathan W. Faddis and the Registrant. 10-Q 001-36121 10.1 6/4/2015
10.16* Description of Non-Employee DirectorCompensation. 8-K 001-36121 Item 5.02 10/1/2015
10.17 Data Processing Addendum, datedJanuary 23, 2016, to Value-Added ResellerAgreement, between Registrant andsalesforce.com, inc., as amended. X
21.1 List of Subsidiaries of Registrant. X
23.1 Consent of KPMG LLP, IndependentRegistered Public Accounting Firm. X
24.1 Power of Attorney (see page 108 of thisAnnual Report on Form 10-K). X
31.1 Certification of Principal Executive OfficerRequired Under Rule 13a-14(a) and 15d-14(a)of the Securities Exchange Act of 1934, asamended. X
31.2 Certification of Principal Financial OfficerRequired Under Rule 13a-14(a) and 15d-14(a)of the Securities Exchange Act of 1934, asamended. X
32.1† Certification of Chief Executive OfficerRequired Under Rule 13a-14(b) of theSecurities Exchange Act of 1934, as amended,and 18 U.S.C. §1350. X
32.2† Certification of Chief Financial OfficerRequired Under Rule 13a-14(b) of theSecurities Exchange Act of 1934, as amended,and 18 U.S.C. §1350. X
110

ExhibitNumber
Incorporated by Reference FiledHerewithExhibit Description Form File No. Exhibit Filing Date
101.INS XBRL Instance Document. X
101.SCH XBRL Taxonomy Schema LinkbaseDocument. X
101.CAL XBRL Taxonomy Calculation LinkbaseDocument. X
101.DEF XBRL Taxonomy Definition LinkbaseDocument. X
101.LAB XBRL Taxonomy Labels LinkbaseDocument. X
101.PRE XBRL Taxonomy Presentation LinkbaseDocument. X
* Indicates a management contract or compensatory plan.** Portions of this exhibit (indicated by asterisks) have been omitted pursuant to an order granting confidential
treatment. Omitted portions have been submitted separately to the Securities and Exchange Commission(SEC).
† The certifications attached as Exhibit 32.1 and 32.2 that accompany this Annual Report on Form 10-K arenot deemed filed with the SEC and are not to be incorporated by reference into any filing of Veeva SystemsInc. under the Securities Act of 1933, as amended (Securities Act), or the Securities Exchange Act of 1934,as amended (Exchange Act), whether made before or after the date of this Annual Report on Form 10-K,irrespective of any general incorporation language contained in such filing.
111

[THIS PAGE INTENTIONALLY LEFT BLANK]
Board of Directors
Company Executive Officers
Corporate Head uarters
Gordon Ritter
Ron Codd
Peter Gassner
Paul Sekhri
Peter Gassner
Matt Wallach
Tim Cabral
Josh Faddis
Global Head uarters
Europe Head uarters
China Head uarters
Japan Head uarters
egal Counsel
Gunderson Dettmer Stough
Villeneuve Franklin Hachigian, P
Transfer Agent
American Stock Transfer Trust
Company, C
Independent Registered Public
Accounting Firm
PMG P
Notice of Annual Meeting
Investor Relations
q
q
q
q
q
L
LL&
K LL
LL
&
Nitsa Zuppas
Chief Marketing Officer Asia Pacific Headquarters
Level 7, Suite 704275 Alfred StreetNorth Sydney NSW 2060Australia
Headquarters
Rua Funchal 411, 33Vila OlimpiaSão Paulo 04551�060Brazil
Suite
��� �����
��� ���������
��
�����
MateoA���
������ ������

www.veeva.com