vccedge quarterly deal update q3 cy2016 -...
TRANSCRIPT

VCCEdge Quarterly Deal UpdateQ3 CY2016

2
Summary
Number of Deals
Equity Capital Market
PE Exits
Our Quarterly Deal Report presents a data-driven overview of private equity, mergers & acquisitions and equity capital market deals in India.
Our findings reiterate the slowing pace of PE investments this year after a landmark performance in 2015. Some of the key trends are:
• Angel/Seed funds were a beacon of hope amid a complete slump (low fund raising, tepid exits and a moribund/declining deal market).
• PE exits saw a marginal decline. M&A was the preferred exit route.
• Domestic M&A was the strongest, dominated by few large ticket deals.
• The Equity Capital Market saw IPOs make a stellar comeback, replacing QIPs and Rights Issues as the preferred means to raise capital.

Private Equity Investments
Private Equity Mergers & Acquisitions Equity Capital Markets
3

4
Copyright 2016 Property of Mosaic Media Ventures Pvt. Ltd.
Private Equity Investments – Is this yet another slump?
Private Equity Mergers & Acquisitions Equity Capital Markets
4,4
25
1,94
3 2,76
8
1,42
6
2,34
0
3,91
2
2,38
0
2,2
48
2,53
7
3,00
7
3,44
6 4,15
8
4,59
1
5,84
9
6,28
8
5,01
9
4,17
5
2,27
9
2,34
4
276
177 164
210
241
186
210
270 273251
277301
381395
469444
396
291
258
0
100
200
300
400
500
$0
$1,000
$2,000
$3,000
$4,000
$5,000
$6,000
$7,000
$8,000
Q1 Q2 Q3 Q4 Q1 Q2 Q3 Q4 Q1 Q2 Q3 Q4 Q1 Q2 Q3 Q4 Q1 Q2 Q3
2012 2013 2014 2015 2016
Value of Deals ($ mn) Number of Deals
Private equity investments dipped significantly by 63% to $2.3 billion in the Q3 CY16 as compared to $6.3 billion (a peak) a year ago and 3% higher than the already dismal previous quarter.
Deal making activity declined by 45% to 258 deals as compared to 469 for the same period last year, and 11% lower than the previous quarter.

5
Copyright 2016 Property of Mosaic Media Ventures Pvt. Ltd. Private Equity Mergers & Acquisitions Equity Capital Markets
Private Equity – Angel/Seed drive activity and PEs drive value
52
76
101
245
152
40
57
111
151
69
5241
49 51
29
1 0 2 3 0
19
36
14 198
0
50
100
150
200
250
Q3 2012 Q3 2013 Q3 2014 Q3 2015 Q3 2016
Angel/Seed Venture Capital Private Equity Funds Pre-IPO Placements
Number of Deals Value of Deals ($ mn)
Note (NA) : Deal Value not available
21 34 44 121
49
200
570
607
1,87
8
80
3
2,23
7
728
2,43
3
3,44
6
1,20
4
NA
0
110
74
0
309
1,04
8
252
77
0
287
$0
$1,000
$2,000
$3,000
$4,000
Q3 2012 Q3 2013 Q3 2014 Q3 2015 Q3 2016
While investment has declined significantly across all investor types, smaller (and numerous) bets by angels and seed funds seem to hold out hope.

6
Copyright 2016 Property of Mosaic Media Ventures Pvt. Ltd.
Private Equity – Angel/Seed funds keep activity alive
Private Equity Mergers & Acquisitions Equity Capital Markets
Number of Deals Value of Deals ($ mn)
37
1
99
267
541
53
4
157
441
590
0 200 400 600 800
Placements
Pre-IPO
Private EquityFunds
Venture Capital
Angel/Seed
9M 2015 9M 2016
2,044
43
4,545
1,988
179
2,540
90
9,108
4,716
273
$0 $2,000 $4,000 $6,000 $8,000 $10,000
Placements
Pre-IPO
Private EquityFunds
Venture Capital
Angel/Seed
Note (NA) : Deal Value not available
VC & PE fund investment has declined by 39% & 37% respectively by number of deals and 58% & 50% respectively by value. Activity (number of deals) by angel/seed funds has seen a dip of ~8%.

7
Copyright 2016 Property of Mosaic Media Ventures Pvt. Ltd.
0
100
200
300
400
500
Q1 Q2 Q3 Q4 Q1 Q2 Q3 Q4 Q1 Q2 Q3 Q4 Q1 Q2 Q3 Q4 Q1 Q2 Q3
2012 2013 2014 2015 2016
Angel/Seed Venture Capital Private Equity Funds Pre-IPO Placements
Private Equity Mergers & Acquisitions Equity Capital Markets
Private Equity – Deal activity lowest since Q3 2013
$0
$2,000
$4,000
$6,000
$8,000
Q1 Q2 Q3 Q4 Q1 Q2 Q3 Q4 Q1 Q2 Q3 Q4 Q1 Q2 Q3 Q4 Q1 Q2 Q3
2012 2013 2014 2015 2016
Private Equity Breakdown – Number of Deals
Private Equity Breakdown – Value of Deals ($ mn)

8
Copyright 2016 Property of Mosaic Media Ventures Pvt. Ltd. Private Equity Mergers & Acquisitions Equity Capital Markets
Deal Size – Smaller bets, cautious investors
1.9
3.5 3.31.9
2.8 3.01.9
0.81.6 2.2
1.1 1.0 1.0 1.60.8 0.8 0.6 1.0 1.0
18.4
12.8
19.8
8.1
11.8
25.6
13.3
10.010.7
14.3 14.515.9
13.4
17.215.8
14.1 13.512.0
13.9
$0
$5
$10
$15
$20
$25
$30
Q1 Q2 Q3 Q4 Q1 Q2 Q3 Q4 Q1 Q2 Q3 Q4 Q1 Q2 Q3 Q4 Q1 Q2 Q3
2012 2013 2014 2015 2016
Median ($ mn) Mean ($ mn)
The trends in the mean and median deal value clearly suggests that investors have started writing smaller cheques. Hence not only raising capital was difficult this year, the amount raised was also small.
While a few large transactions skew the average deal size upwards, about
half are typically $1mn and below
Median deal values have dropped by more than 70% over the last 5 years

9
Copyright 2016 Property of Mosaic Media Ventures Pvt. Ltd.
Sectors – Secular decline in deal activity all across
Private Equity Mergers & Acquisitions Equity Capital Markets
156
44
17
14
13
8
5
1
258
97
27
24
36
17
5
4
0 50 100 150 200 250 300
Information Technology
Consumer Discretionary
Healthcare
Financials
Industrials
Consumer Staples
Materials
Utilities
Q3 2015 Q3 2016
Number of Deals Value of Deals ($ mn)
603
456
180
642
178
51
202
31
2,015
2,133
257
753
570
102
56
403
$0 $1,000 $2,000 $3,000
Information Technology
Consumer Discretionary
Healthcare
Financials
Industrials
Consumer Staples
Materials
Utilities
Information Technology still rules the roost, others like Consumer Discretionary, Healthcare, and Financials are significant contributors. The decline across all sectors remains secular and worrying.

10
Copyright 2016 Property of Mosaic Media Ventures Pvt. Ltd.
Private Equity – Key Deals
Date Target Buyer Deal Type Deal Value ($ mn)
Sep-2016 Kotak Mahindra Bank Ltd Canada Pension Plan Investment Board Public Equity 190
Aug-2016 Hike Ltd Bharti SoftBank Holdings Pte. Ltd, Tiger Global Private Investment Partners VIII L.P., Tencent Holdings Ltd, Hon Hai Precision Industry Co. Ltd
Venture Capital 175
Jul-2016 India Infoline Finance Ltd CDC Group Plc Private Equity 149
Aug-2016 TCNS Clothing Company Pvt. Ltd TA Associates Advisory Pvt. Ltd Private Equity 140
Jul-2016 Stellar Value Chain Solutions Pvt. Ltd Warburg Pincus India Pvt. Ltd Private Equity 125
Aug-2016 One 97 Communications Ltd Alibaba Group Holding Ltd, MediaTek Inc. Private Equity 120
Sep-2016 Hero FinCorp Ltd ChrysCapital Investment Advisors India Pvt. Ltd, Credit Suisse Group Private Equity 105
Jul-2016 Tata Steel Minerals Canada Ltd Capital Mines Hydrocarbons Fund Private Equity 95
Jul-2016 Oravel Stays Pvt. Ltd VentureNursery, DSG Consumer Partners, Lightspeed Venture Partners IX LP, Sequoia Capital India IV Ltd, Greenoaks Capital Partners LLC, SoftBank Corp.
Venture Capital 90
Sep-2016 Utkarsh Micro Finance Ltd RBL Bank Ltd., Shriram Life Insurance Co. Ltd, ICICI Prudential Life Insurance Company Ltd, HDFC ERGO General Insurance Company Ltd, HDFC Standard Life Insurance Co. Ltd, Small Industries Development Bank of India, Faering Capital Pvt. Ltd, ArpwoodCapital Pvt. Ltd
Venture Capital 59
Private Equity Mergers & Acquisitions Equity Capital Markets

11
Copyright 2016 Property of Mosaic Media Ventures Pvt. Ltd.
Regional Analysis, Top 5 Cities Q3 2016
Private Equity Mergers & Acquisitions Equity Capital Markets
Number of Deals Value of Deals ($ mn)
67 774
Mumbai
Bengaluru
ChennaiPune
14 141
37
2611
7
2 1
Information Technology
Consumer Discretionary
Healthcare
Financials
Others*
507
47 221
17 12
Delhi NCR
101
6
7
12
2
2
4315
24 3
16
92
4
6
Note (*) : Others include, Materials, Industrials & Consumer Staples
While Information Technology dominates all deal markets, consumer discretionary is another dominant sector in Delhi NCR, Mumbai and Bengaluru (the 3 biggest markets)
12
Copyright 2016 Property of Mosaic Media Ventures Pvt. Ltd.
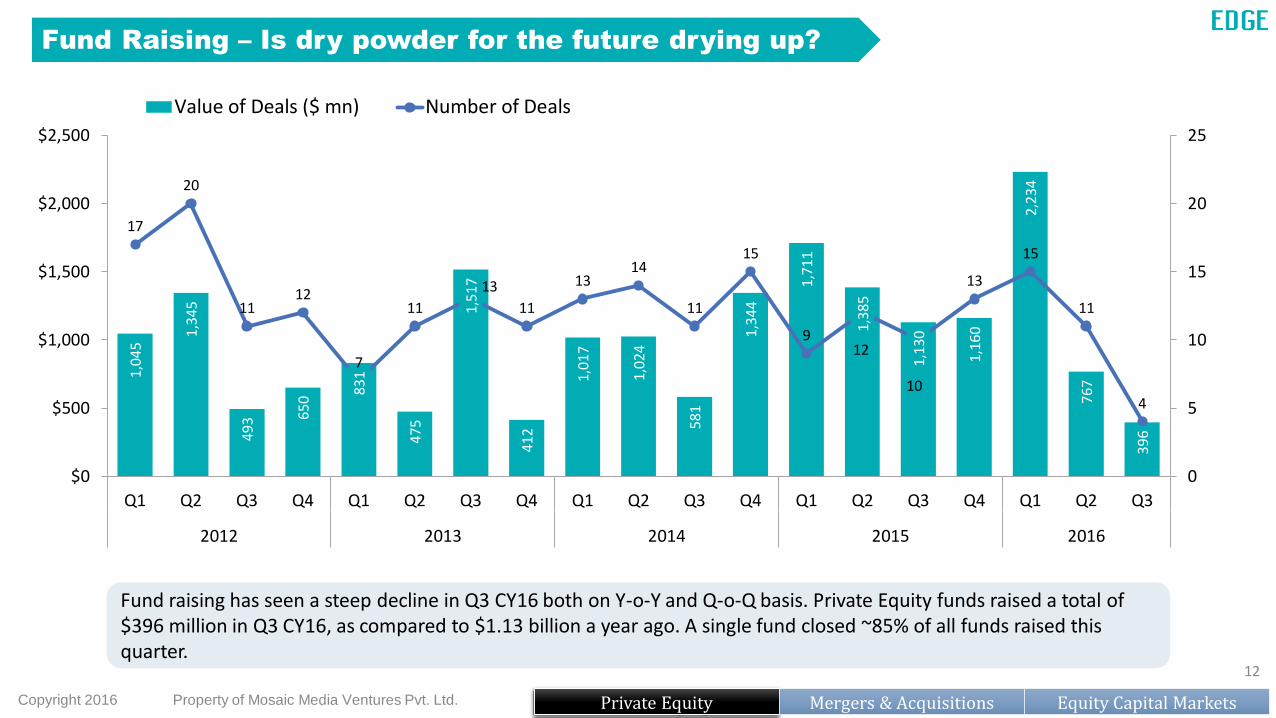
Fund Raising – Is dry powder for the future drying up?
Private Equity Mergers & Acquisitions Equity Capital Markets
1,04
5
1,34
5
493 65
0
831
475
1,51
7
412
1,01
7
1,02
4
581
1,3
44
1,71
1
1,38
5
1,13
0
1,16
0
2,23
4
767
396
17
20
1112
7
11
13
11
1314
11
15
912
10
13
15
11
4
0
5
10
15
20
25
$0
$500
$1,000
$1,500
$2,000
$2,500
Q1 Q2 Q3 Q4 Q1 Q2 Q3 Q4 Q1 Q2 Q3 Q4 Q1 Q2 Q3 Q4 Q1 Q2 Q3
2012 2013 2014 2015 2016
Value of Deals ($ mn) Number of Deals
Fund raising has seen a steep decline in Q3 CY16 both on Y-o-Y and Q-o-Q basis. Private Equity funds raised a total of $396 million in Q3 CY16, as compared to $1.13 billion a year ago. A single fund closed ~85% of all funds raised this quarter.

13
Copyright 2016 Property of Mosaic Media Ventures Pvt. Ltd.
Top Funds Raised
Fund Name Fund Status Fund Size ($ mn)
Amount Raised ($ mn)
Asset Manager Launch Date
HDFC Capital Affordable Real Estate Fund-1 Final Close 748 344 HDFC Capital Advisors Ltd Jan-2016
Amplus Realty Fund II First Close 48 32 Amplus Capital Advisors Pvt. Ltd Mar-2015
CapAleph Indian Millennium Fund Pte. Ltd First Close 25 16 CapAleph Advisors India Pvt. Ltd Feb-2012
Excedo Realty Fund-I First Close 90 4 Athamus Venture Management Pvt. Ltd
Oct-2011
Private Equity Mergers & Acquisitions Equity Capital Markets

14
Copyright 2016 Property of Mosaic Media Ventures Pvt. Ltd.
Exits – Fewer exits, larger ticket size
Private Equity Mergers & Acquisitions Equity Capital Markets
1,77
8
387
1,96
6
1,90
7
1,43
6
1,36
0 1,57
9
1,10
1
850
1,88
6
1,20
5
1,08
0
1,66
2
2,02
8
1,23
8
829
567
1,33
0
2,08
2
76
54
53
65
79
55
6467
62
80 79 78
99
61
59
78
59 58
55
0
20
40
60
80
100
120
$0
$500
$1,000
$1,500
$2,000
$2,500
$3,000
Q1 Q2 Q3 Q4 Q1 Q2 Q3 Q4 Q1 Q2 Q3 Q4 Q1 Q2 Q3 Q4 Q1 Q2 Q3
2012 2013 2014 2015 2016
Value of Deals ($ mn) Number of Deals
Exit activity declined marginally, 7% down from 59 deals in Q3 last year and 5% from 58 deals in Q2 2016. A few large ticket deals (mainly M&A acquisitions) increased the value.

15
Copyright 2016 Property of Mosaic Media Ventures Pvt. Ltd.
Exits – Being acquired finds favour
15 1519
2326
15 4
2321
36
17 17
9
20
12
6
1
68
118 7
0
10
20
30
40
Q3 2012 Q3 2013 Q3 2014 Q3 2015 Q3 2016
Merger and Acquisition Equity Capital Market Open Market Buyback Secondary Sales
Exits Breakdown – Number of Deals
Exits Breakdown – Value of Deals ($ mn)
Private Equity Mergers & Acquisitions Equity Capital Markets
Note (NA) : Deal Value not available
NA
478
13311
1,673
NA NA 36 72 94
717571
810 858
294118
286
69 69 NA
1,132
244157 229
20$0
$600
$1,200
$1,800
Q3 2012 Q3 2013 Q3 2014 Q3 2015 Q3 2016
Being acquired by a larger entity seems to be the favored exit route of late
16
Copyright 2016 Property of Mosaic Media Ventures Pvt. Ltd.
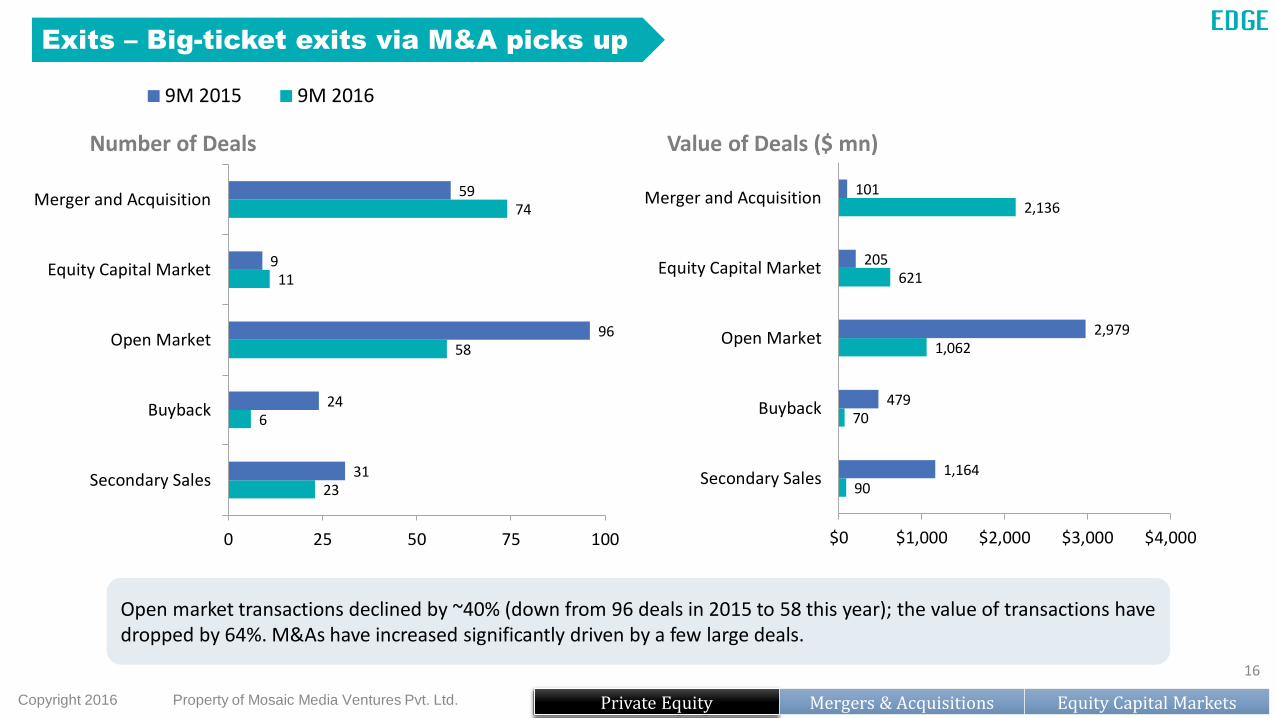
Exits – Big-ticket exits via M&A picks up
Private Equity Mergers & Acquisitions Equity Capital Markets
Number of Deals Value of Deals ($ mn)
23
6
58
11
74
31
24
96
9
59
0 25 50 75 100
Secondary Sales
Buyback
Open Market
Equity Capital Market
Merger and Acquisition
9M 2015 9M 2016
90
70
1,062
621
2,136
1,164
479
2,979
205
101
$0 $1,000 $2,000 $3,000 $4,000
Secondary Sales
Buyback
Open Market
Equity Capital Market
Merger and Acquisition
Open market transactions declined by ~40% (down from 96 deals in 2015 to 58 this year); the value of transactions have dropped by 64%. M&As have increased significantly driven by a few large deals.

17
Copyright 2016 Property of Mosaic Media Ventures Pvt. Ltd. Private Equity Mergers & Acquisitions Equity Capital Markets
Exits – “Open market” loses ground to M&A
Private Equity Exits Breakdown – Number of Deals
Private Equity Exits Breakdown – Value of Deals ($ mn)
0
40
80
120
Q1 Q2 Q3 Q4 Q1 Q2 Q3 Q4 Q1 Q2 Q3 Q4 Q1 Q2 Q3 Q4 Q1 Q2 Q3
2012 2013 2014 2015 2016
Merger and Acquisition Equity Capital Market Open Market Buyback Secondary Sales
$0
$1,000
$2,000
$3,000
Q1 Q2 Q3 Q4 Q1 Q2 Q3 Q4 Q1 Q2 Q3 Q4 Q1 Q2 Q3 Q4 Q1 Q2 Q3
2012 2013 2014 2015 2016

18
Copyright 2016 Property of Mosaic Media Ventures Pvt. Ltd.
Exits – Information technology & healthcare lead value creation
Private Equity Mergers & Acquisitions Equity Capital Markets
13
11
10
8
8
4
1
10
12
5
6
13
7
2
0 5 10 15
Information Technology
Financials
Consumer Discretionary
Healthcare
Industrials
Consumer Staples
Materials
Q3 2015 Q3 2016
Number of Deals Value of Deals ($ mn)
1,077
168
48
612
160
10
8
2
239
149
42
257
229
47
$0 $300 $600 $900 $1,200
Information Technology
Financials
Consumer Discretionary
Healthcare
Industrials
Consumer Staples
Materials
Information technology and healthcare lead value creation with financials, consumer discretionary and industrials chipping in.

Date Target Seller Exit Type Exit Value ($ mn)
Aug-2016 Bharti Telecom Ltd Temasek Holdings Advisors India Pvt. Ltd M&A 657
Jul-2016 Gland Pharma Ltd KKR India Advisors Pvt. Ltd M&A 577
Jul-2016 Minacs Pvt. Ltd Capital Square Partners Pte. Ltd, CX Capital Management Ltd M&A 420
Sep-2016 Cholamandalam Investment and Finance Company Ltd
Apax Partners LLP,Apax VIII- A L.P. Open Market 93
Aug-2016 RBL Bank Ltd Elephant Capital Fund, Beacon India Private Equity Fund, GajaCapital Fund I Ltd, Capvent India Private Equity Fund II
Initial Public Offering 58
Jul-2016 NCC Ltd Blackstone Advisors India Pvt. Ltd Open Market 41
Aug-2016 Aegis Logistics Ltd Infrastructure India Holdings Fund LLC Open Market 35
Aug-2016 Dilip Buildcon Ltd BanyanTree Growth Capital Initial Public Offering 26
Jul-2016 VRL Logistics Ltd New Silk Route PE Asia Fund LP Open Market 22
Jul-2016 UFO Moviez India Ltd 3i Group Plc Open Market 21
19
Copyright 2016 Property of Mosaic Media Ventures Pvt. Ltd.
Exits – Key Deals
Private Equity Mergers & Acquisitions Equity Capital Markets

Mergers & Acquisitions
Private Equity Mergers & Acquisitions Equity Capital Markets
17

21
Copyright 2016 Property of Mosaic Media Ventures Pvt. Ltd. Private Equity Mergers & Acquisitions Equity Capital Markets
M&A – Activity stays as usual, a mega deal busts charts
4,78
3
2,76
0
3,83
0
9,82
3
6,33
4
5,61
8
6,50
3
5,72
1
5,21
5
9,42
1
6,72
7
11,6
10
4,71
0
3,58
8 7,20
6
7,67
4 9,87
6
5,78
2
24,6
73227
178 180
212
256
180
239
188
214 220
257
210
260
200
254266 265
239
232
0
50
100
150
200
250
300
$0
$4,000
$8,000
$12,000
$16,000
$20,000
$24,000
$28,000
Q1 Q2 Q3 Q4 Q1 Q2 Q3 Q4 Q1 Q2 Q3 Q4 Q1 Q2 Q3 Q4 Q1 Q2 Q3
2012 2013 2014 2015 2016
Value of Deals ($ mn) Number of Deals
M&A deals spiked in value, rising 242% (y-o-y) to $25 bn on the back of HDFC Life’s acquisition of Max Life Insurance. Activity has largely kept up with the past quarters and shows no specific departure from the sideways trend.

22
Copyright 2016 Property of Mosaic Media Ventures Pvt. Ltd.
Deal Sub-Type Split – Domestic deal value spiked
Private Equity Mergers & Acquisitions Equity Capital Markets
3647 47 48
3341
33 35 3327
81
131
153 151 154
2228
22 22 18
0
30
60
90
120
150
180
Q3 2012 Q3 2013 Q3 2014 Q3 2015 Q3 2016
Inbound Outbound Domestic Others
797 1,04
2
1,04
2
2,13
5
2,73
8
1,87
9
2,90
5
307
2,88
5
1,2
01
1,03
8 2,47
5 4,23
0
1,54
0
20,4
37
116
81
1,14
8
646
297
$0
$5,000
$10,000
$15,000
$20,000
$25,000
Q3 2012 Q3 2013 Q3 2014 Q3 2015 Q3 2016
M&A Breakdown – Number of Deals M&A Breakdown – Value of Deals ($ mn)
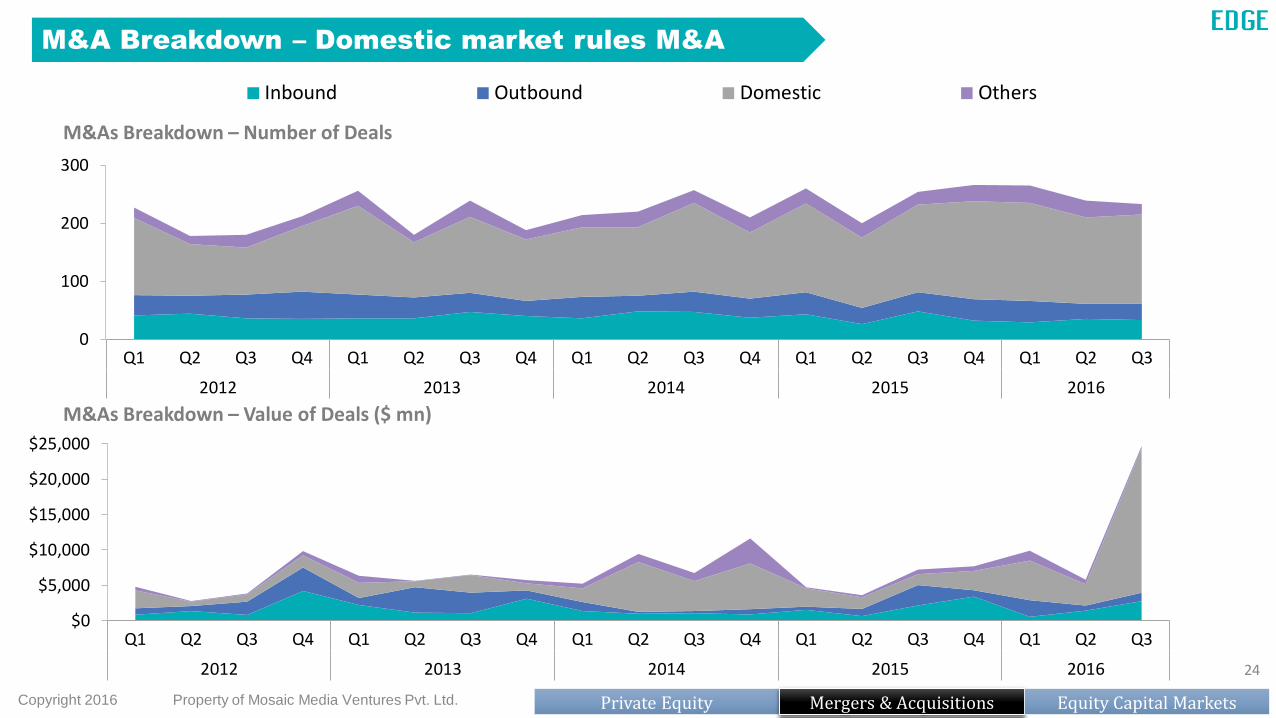
Deal value picked up for domestic M&As from $ 1.5 billion to more than $ 20 billion, while outbound deal value slipped by 58% during the quarter. However, deal activity has declined across all the categories except for domestic M&As.

23
Copyright 2016 Property of Mosaic Media Ventures Pvt. Ltd.
M&A Breakdown – Increased consolidation in domestic market
Private Equity Mergers & Acquisitions Equity Capital Markets
Number of Deals Value of Deals ($ mn)
77
472
91
97
73
425
99
117
0 100 200 300 400 500
Others
Domestic
Outbound
Inbound
9M 2015 9M 2016
2,344
29,041
4,273
4,673
1,089
5,782
4,353
4,281
$0 $10,000 $20,000 $30,000
Others
Domestic
Outbound
Inbound
In 2016 so far, domestic M&As have attracted close to $ 29 billion as against ~$ 6 billion in 2015. The two large domestic deals have contributed more than $ 17 billion, driving the overall share of domestic M&As.
24
Copyright 2016 Property of Mosaic Media Ventures Pvt. Ltd. Private Equity Mergers & Acquisitions Equity Capital Markets
M&A Breakdown – Domestic market rules M&A
M&As Breakdown – Number of Deals
M&As Breakdown – Value of Deals ($ mn)
0
100
200
300
Q1 Q2 Q3 Q4 Q1 Q2 Q3 Q4 Q1 Q2 Q3 Q4 Q1 Q2 Q3 Q4 Q1 Q2 Q3
2012 2013 2014 2015 2016
Inbound Outbound Domestic Others
$0
$5,000
$10,000
$15,000
$20,000
$25,000
Q1 Q2 Q3 Q4 Q1 Q2 Q3 Q4 Q1 Q2 Q3 Q4 Q1 Q2 Q3 Q4 Q1 Q2 Q3
2012 2013 2014 2015 2016

25
Copyright 2016 Property of Mosaic Media Ventures Pvt. Ltd. Private Equity Mergers & Acquisitions Equity Capital Markets
Deal size – Few giants, many midgets
A huge spike in the average deal value clearly indicates the impact of standout deals in Q3 2016.
11.7 11.4 10.9 13.7 8.3 10.7 8.0 13.1 10.0 10.7 8.015.0
6.5 10.5 14.7 13.05.3 7.0 6.2
49.3
32.545.6
107.9
52.8 57.9 63.1 65.852.2 57.9 63.1
122.2
44.0 41.2
63.2 64.078.4
54.0
265.3
$0
$50
$100
$150
$200
$250
$300
Q1 Q2 Q3 Q4 Q1 Q2 Q3 Q4 Q1 Q2 Q3 Q4 Q1 Q2 Q3 Q4 Q1 Q2 Q3
2012 2013 2014 2015 2016
Median ($ mn) Mean ($ mn)

26
Copyright 2016 Property of Mosaic Media Ventures Pvt. Ltd.
Sectors – Similar levels of activity, increased value
Private Equity Mergers & Acquisitions Equity Capital Markets
74
44
28
25
20
17
12
9
3
1
78
45
37
21
23
16
14
7
9
4
0 20 40 60 80 100
Information Technology
Consumer Discretionary
Industrials
Financials
Healthcare
Materials
Consumer Staples
Utilities
Energy
Telecommunication Services
Q3 2015 Q3 2016
Number of Deals Value of Deals ($ mn)
1,618
791
68
9,921
1,337
2,002
209
462
966
7,300
688
946
115
1,006
2,066
578
184
67
1,511
46
$0 $2,500 $5,000 $7,500 $10,000
Information Technology
Consumer Discretionary
Industrials
Financials
Healthcare
Materials
Consumer Staples
Utilities
Energy
Telecommunication Services
While a few large deals always skew the number across sectors in M&A, activity has remained largely unchanged across sectors with significant increase in value within financials, telecommunication services, information technology and materials.

27
Copyright 2016 Property of Mosaic Media Ventures Pvt. Ltd.
M&A – Key Deals
Date Target Buyer M&A Type Deal Value ($ mn)
Aug-2016 Max Life Insurance Co. Ltd HDFC Standard Life Insurance Co. Ltd Domestic 9,730
Sep-2016 Reliance Communications Ltd, Wireless Telecom Business
Aircel Ltd, Dishnet Wireless Ltd Domestic 7,300
Jul-2016 Lafarge India Pvt. Ltd Nirma Ltd Domestic 1,400
Jul-2016 Gland Pharma Ltd Shanghai Fosun Pharmaceutical Group Co. Ltd
Inbound 1,261
Sep-2016 JSC Vankorneft ONGC Videsh Ltd, ONGC VideshVankerneft Pte. Ltd
Outbound 930
Aug-2016 Bharti Telecom Ltd Singapore Telecommunications Ltd Inbound 657
Jul-2016 Minacs Pvt. Ltd Synnex Corporation Inbound 420
Jul-2016 Bina Power Supply Ltd JSW Energy Ltd Domestic 402
Aug-2016 Tata Chemicals Ltd, Urea Business Yara Fertilisers India Pvt. Ltd Domestic 399
Aug-2016 Taj Television India Pvt. Ltd Sony Pictures Networks India Pvt. Ltd Domestic 385
Private Equity Mergers & Acquisitions Equity Capital Markets

28
Equity Capital Market Deals
Private Equity Mergers & Acquisitions Equity Capital Markets

29
Copyright 2016 Property of Mosaic Media Ventures Pvt. Ltd. Private Equity Mergers & Acquisitions Equity Capital Markets
Equity Capital Market – IPO drives the market
561
99
1,66
1
1,82
0
1,95
3
988
556
1,19
7 1,46
5
1,41
7
2,64
6
661
1,44
9
1,55
3
1,06
5
2,10
6
51
1
841
1,97
4
16
8
20
14
25
1624
9
23 16
37
22
31
22
30
15
29
19
44
0
5
10
15
20
25
30
35
40
45
50
$0
$500
$1,000
$1,500
$2,000
$2,500
$3,000
Q1 Q2 Q3 Q4 Q1 Q2 Q3 Q4 Q1 Q2 Q3 Q4 Q1 Q2 Q3 Q4 Q1 Q2 Q3
2012 2013 2014 2015 2016
Capital Raised ($ mn) Number of Deals
The up-down trend continues in the equity markets. However in Q3 2016, the number of deals grew significantly, 44 companies raised ~$ 2 billion during Q3 CY16, as compared to 19 companies that raised $841 million in the previous quarter, and 30 companies that raised ~1.1 billion in an year ago period.

30
Copyright 2016 Property of Mosaic Media Ventures Pvt. Ltd.
Deal Sub-Type Split – QIP shrinks & IPO rises by value
Equity Capital Market Breakdown – Number of Deals Equity Capital Market Breakdown – Value of Deals ($ mn)
8
1418
24 36
7
7
5
414
1
14
27
1 2
0%
20%
40%
60%
80%
100%
Q3 2012 Q3 2013 Q3 2014 Q3 2015 Q3 2016
Initial Public Offering Rights Issue Qualified Institutional Placement Institutional Placement Programme
22 24 121
421
1,7621,337
320
342
33
6237
147
2,184
611
2066665
0%
20%
40%
60%
80%
100%
Q3 2012 Q3 2013 Q3 2014 Q3 2015 Q3 2016
Private Equity Mergers & Acquisitions Equity Capital Markets
The flavor seems to change every 2 years as we moved from Rights Issues (2012) to QIPs (2014) to IPOs (2016) ruling the roost in their respective years.

31
Copyright 2016 Property of Mosaic Media Ventures Pvt. Ltd.
Equity Capital Market Breakdown – QIPs made way for IPOs
Private Equity Mergers & Acquisitions Equity Capital Markets
Number of Deals Value of Deals ($ mn)
8
7
77
22
9
52
0 50 100
Qualified Institutional Placement
Rights Issue
Initial Public Offering
9M 2015 9M 2016
228
112
2,986
2,581
429
1,058
$0 $2,000 $4,000
Qualified Institutional Placement
Rights Issue
Initial Public Offering
IPOs increased by 182% to ~$ 3 billion in value (over the same period last year) while QIPs lost flavor (declining 91% from $2.6 billion to $ 228 million this year).

32
Copyright 2016 Property of Mosaic Media Ventures Pvt. Ltd. Private Equity Mergers & Acquisitions Equity Capital Markets
0
10
20
30
40
50
Q1 Q2 Q3 Q4 Q1 Q2 Q3 Q4 Q1 Q2 Q3 Q4 Q1 Q2 Q3 Q4 Q1 Q2 Q3
2012 2013 2014 2015 2016
Initial Public Offering Follow-On Offering Rights Issue Qualified Institutional Placement Institutional Placement Programme
Equity Capital Market Breakdown – IPOs drive Q3 2016
Equity Capital Market Breakdown – Number of Deals
Equity Capital Market Breakdown – Value of Deals ($ mn)
$0
$1,000
$2,000
$3,000
Q1 Q2 Q3 Q4 Q1 Q2 Q3 Q4 Q1 Q2 Q3 Q4 Q1 Q2 Q3 Q4 Q1 Q2 Q3
2012 2013 2014 2015 2016

33
Copyright 2016 Property of Mosaic Media Ventures Pvt. Ltd.
Equity Capital Markets – Key Deals
Date Target Offering Type Offering Size ($ mn)
Sep-2016 ICICI Prudential Life Insurance Company Ltd Initial Public Offering 905
Jul-2016 Larsen and Toubro Infotech Ltd Initial Public Offering 187
Aug-2016 RBL Bank Ltd Initial Public Offering 179
Sep-2016 L and T Technology Services Ltd Initial Public Offering 134
Aug-2016 Dilip Buildcon Ltd Initial Public Offering 96
Private Equity Mergers & Acquisitions Equity Capital Markets

34
Copyright 2016 Property of Mosaic Media Ventures Pvt. Ltd.
Glossary
PlacementsPlacement deals include QIPs, Open Market & Private Investment in Public Equity (PIPE) deals.
MaterialsMaterial sector covers chemicals used in different segments, construction materials, containers & packaging, metals & mining, and paper & forest products.
Consumer DiscretionaryConsumer Discretionary sector includes automobiles & components, consumer durables & apparel, consumer services, media, and retailing.
Consumer StaplesConsumer Staples sector contains food & staples retailing, food, beverage & tobacco, and household & personal products.
HealthcareHealthcare incorporates healthcare equipment & services, and pharmaceuticals, biotechnology & life sciences.
FinancialsFinancial sector includes banks, diversified financials, insurance, and real estate.
Information Technology (IT)IT comprises software & services, technology hardware & equipment, and semiconductors & semiconductor Equipment.
Telecommunication ServicesIt includes both diversified and wireless telecommunication services.
UtilitiesUtility encompasses electric, gas, water & multi-utilities and independent power producers & energy traders as well.
IndustrialsIndustrial sector contains all the capital goods , Commercial & Professional Services, and Transportation (air freight & logistics, airlines, marines, road & rail, infrastructure).
EnergyEnergy sector consists of energy equipment & services, and oil, gas & consumable fuels.
Private Equity Mergers & Acquisitions Equity Capital Markets

VCCEdge is India’s premier financial research platform providing comprehensive data and information to subscribers for deal origination, deal structuring and valuations, gaining market insights, carrying out due diligence, and tracking competition. The platform has in-depth profiles of private and public companies, including detailed financials, deals including private equity, venture capital, M&A, equity capital market issues and debt offerings, key developments, and detailed data on investors and their portfolios.
VCCEdge is fully hosted solution that users access to follow private equity investments and M&A transactions, industry trends, keep track of companies and markets, generate actionable intelligence, identify targets, originate deals and research on deal multiples and valuations. With the help of its robust search and screening tools and download options, the platform provides information on demand and helps reduce research time, allowing users like strategy managers, investors, bankers and consultants to spend more time on analysis.
Corporate OfficeMosaic Media Ventures Pvt. Ltd.,A-83, Sector 2, Noida-201301, Uttar Pradesh, IndiaPhone: +91-120-4171111, Email: [email protected]
Sales OfficeDow Jones & Co., Unit 93, 9th, Floor, Maker Maxity, Bandra Kurla Complex,Bandra (East), Mumbai, 400051 Maharashtra, IndiaPhone: +91-22-61456100