q3 2019 earnings presentation - almarai€¦ · q3 2019 earnings presentation - almarai. q3 ytd...
TRANSCRIPT


Q3 2019 Earnings Presentation - Almarai

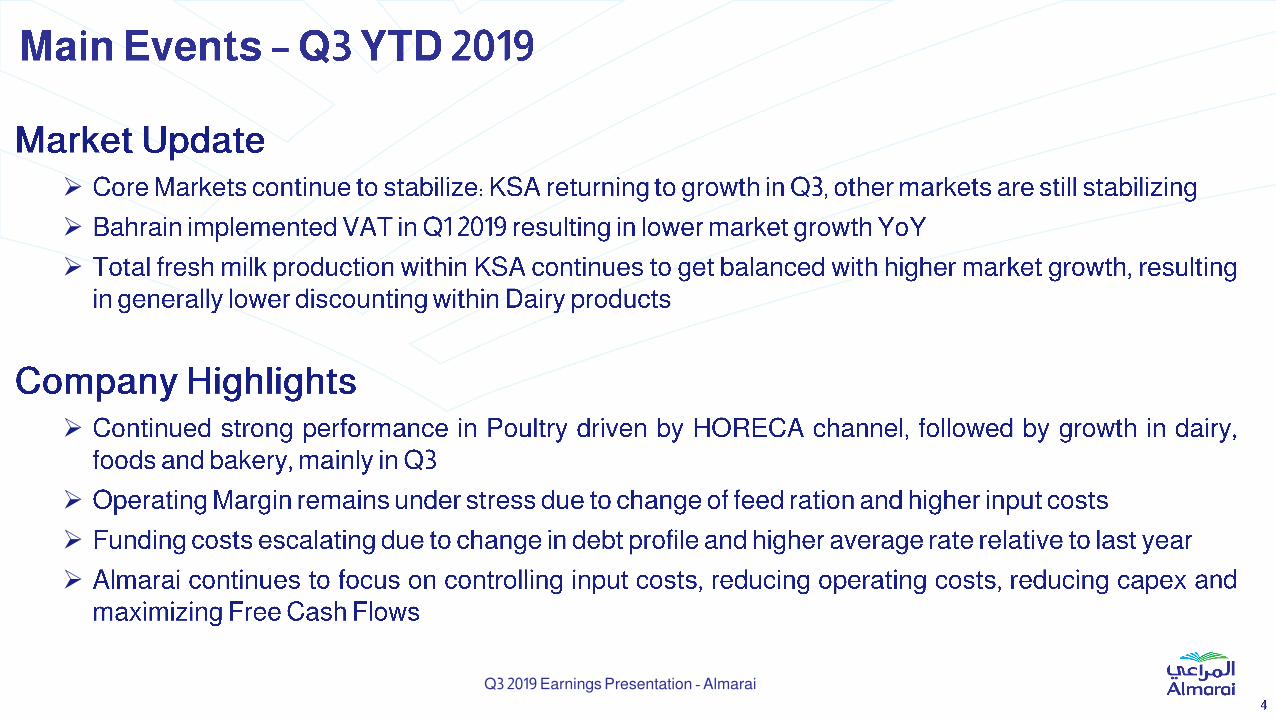
➢
➢
➢
➢
➢
➢
➢
Q3 2019 Earnings Presentation - Almarai
Q3 2019 Earnings Presentation - Almarai
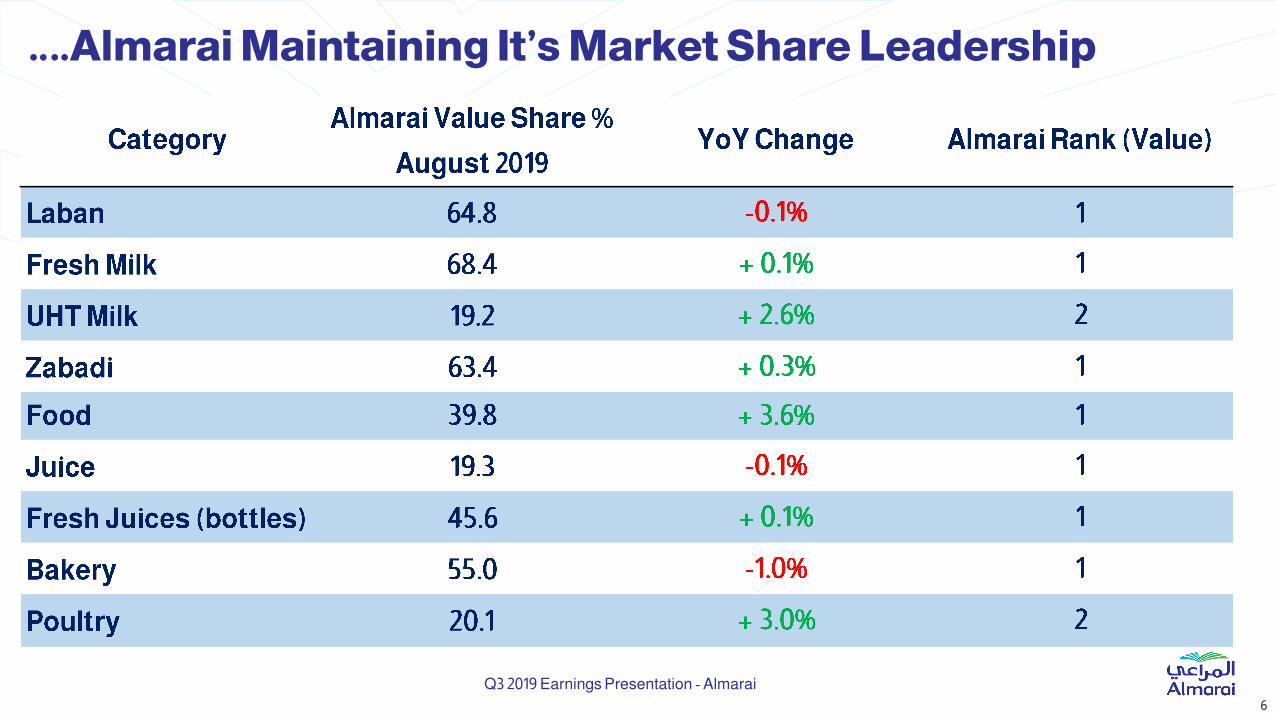
….Almarai Maintaining It’s Market Share Leadership
6
Q3 2019 Earnings Presentation - Almarai


Q3 YTD 2019
Q3 2019
Q3 YTD 2019 Revenue Growth
Q3 2019 Earnings Presentation - Almarai

9
Q3 2019 Earnings Presentation - Almarai
Q3 2019 Earnings Presentation - Almarai
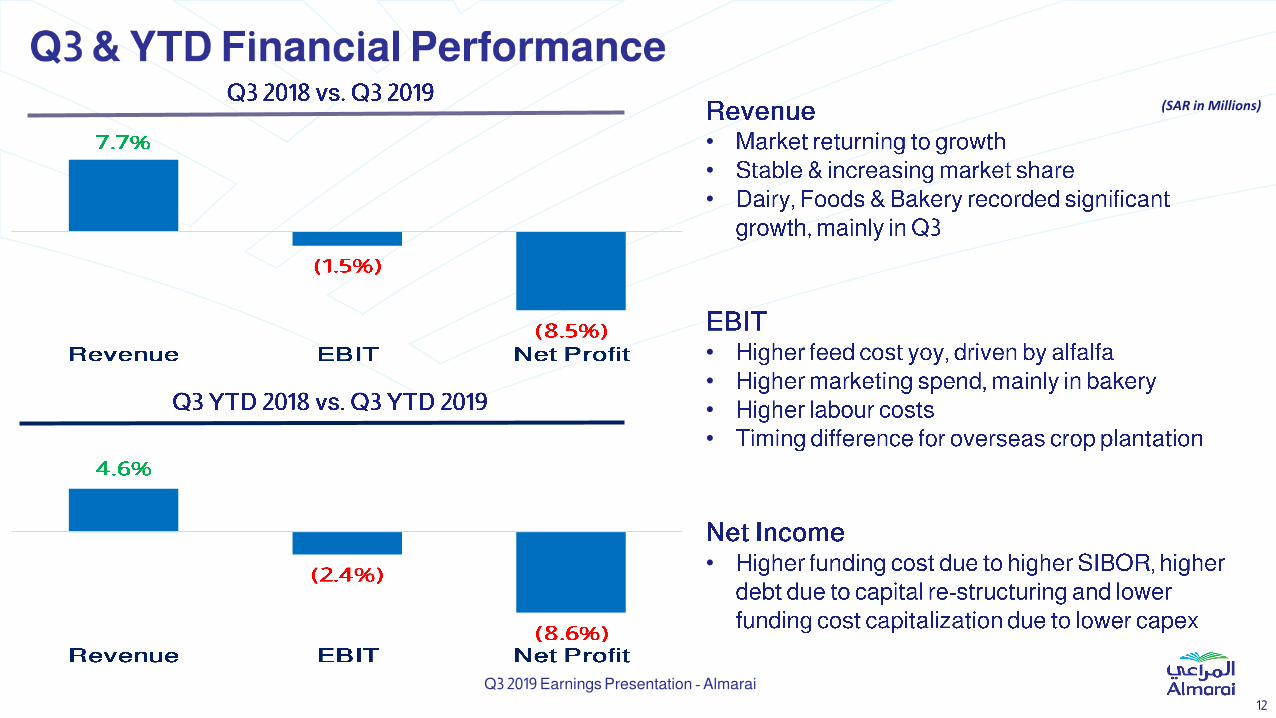
(SAR in Millions)
12
•
•
•
•
•
•
•
•
Q3 2019 Earnings Presentation - Almarai

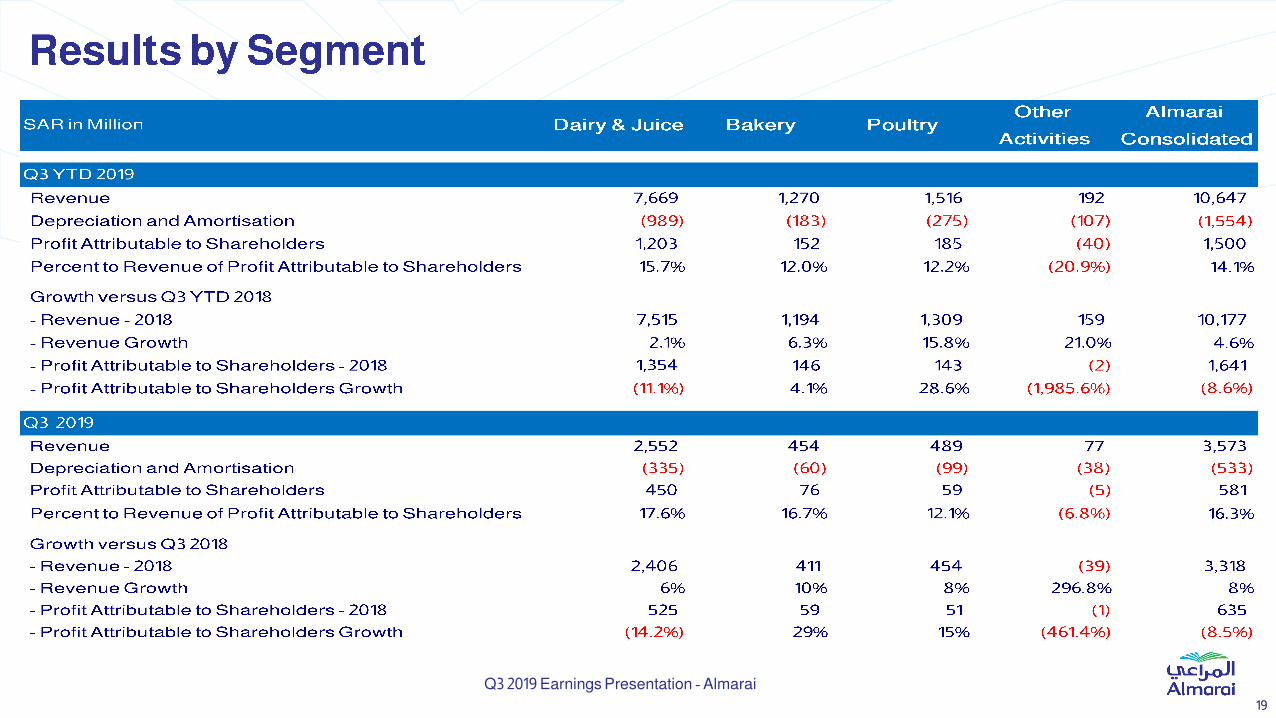
Results by Segment Q3 YTD
Q3 2019 Earnings Presentation - Almarai
Revenues by Segment
•
•
•
•
•
•
•
Profit Margin By Segments
(SAR in Millions)

14
•
••
•
••
(SAR in Billion)
2.9 4.0 4.4 2.8 1.9 1.9
23%
29% 30%
20%
14% 14%
0%
5%
1 0%
1 5%
20%
25%
30%
35%
-
0. 5
1 .0
1 .5
2.0
2.5
3.0
3.5
4. 0
4. 5
5.0
2014 2015 2016 2017 2018 Last 12
Months
Net Cash Used in Investing Activities Investment as a % of Net Sales
Q3 2019 Earnings Presentation - Almarai
(SAR in Billion)

15Q3 2019 Earnings Presentation - Almarai
EBIT and EBITDA Margins
16
Q3 2019 Earnings Presentation - Almarai

Q3 2019 Earnings Presentation - AlmaraiQR Code for Almarai IR App

18
Q3 2019 Earnings Presentation - Almarai
Change Change
Revenue 3,317 1 00. 0% 3,573 1 00. 0% 7.7% 10,177 1 00. 0% 10,647 1 00. 0% 4.6%
Cost of sales (1,918) (57. 8% ) (2,129) (59 . 6 % ) 11.0% (6,113) (6 0. 1 % ) (6,574) (6 1 . 7% ) 7.6%
Gross Profit 1,399 42. 2% 1,444 40. 4% 3.2% 4,064 39 . 9 % 4,073 38. 3% 0.2%
Selling and Distribution Expenses (540) (1 6 . 3% ) (594) (1 6 . 6 % ) (10.1%) (1,647) (1 6 . 2% ) (1,742) (1 6 . 4% ) (5.8%)
General and Administration Expenses (79) (2. 4% ) (80) (2. 2% ) (0.4%) (274) (2. 7% ) (274) (2. 6 % ) 0.1%
Other Expense, net (47) (1 . 4% ) (23) (0. 7% ) 50.4% (116) (1 . 1 % ) (82) (0. 8% ) 29.8%
Impairment (Reversal) / Loss on Financial Assets 24 0. 7% (1) (0. 0% ) 102.7% (3) (0. 0% ) (0) (0. 0% ) 90.5%
Operating Income 757 22. 8% 746 20. 9 % (1.5%) 2,023 1 9 . 9 % 1,975 1 8. 5% (2.4%)
Finance Costs - net (101) (3. 0% ) (131) (3. 7% ) (30.1%) (308) (3. 0% ) (397) (3. 7% ) (29.0%)
1 0. 0% - 0. 0% 100.0% (6) (0. 1 % ) - N/ A N/A
Profit Before Zakat and Income Tax 658 1 9 . 8% 615 1 7. 2% (6.5%) 1,709 1 6 . 8% 1,578 1 4. 8% (7.7%)
Zakat (16) (0. 5% ) (11) (0. 3% ) 31.0% (49) (0. 5% ) (47) (0. 4% ) 5.1%
IncomeTax (0) (0. 0% ) (11) (0. 3% ) N/A (15) (0. 1 % ) (18) (0. 2% ) (16%)
Profit for the Period 641 1 9 . 3% 593 1 6 . 6 % (7.6%) 1,645 1 6 . 2% 1,514 1 4. 2% (8.0%)
Profit Attributable to Non Controlling Interest (6.3) (0. 2% ) (11) (0. 3% ) (82.4%) (4) (0. 0% ) (14) (0. 1 % ) (278.2%)
Profit Attributable to Shareholders 635 1 9 . 1 % 581 1 6 . 3% (8.5%) 1,641 1 00. 0% 1,500 1 4. 1 % (8.6%)
Earnings Per Share (Basic) 0.62 0.59 1.60 1.52
Profit Attributable to Shareholders % 19.1% 16.3% 16.1% 14.1%
2018 2019
3rd Quarter YTD
2018SAR in Millions
3rd Quarter
2019
19
Q3 2019 Earnings Presentation - Almarai

(SAR in Millions)
20
3,307 3,767 3,573
Q1 2019 Q2 2019 Q3 2019
10,177 10,647
Q3 YTD 2018 Q3 YTD 2019

21
Q3 2019 Earnings Presentation - Almarai

➢
➢
➢
➢
Q3 2019 Earnings Presentation - Almarai