variation in the concentration of ground level ozone at · pdf file ·...
TRANSCRIPT

INTERNATIONAL JOURNAL OF ENVIRONMENTAL SCIENCES Volume 1, No 7, 2011
© Copyright 2010 All rights reserved Integrated Publishing Association
Research article ISSN 0976 – 4402
Received on April 2011 Published on August 2011 1899
Variation in the concentration of ground level ozone at selected sites in
Delhi Saxena Pallavi, Ghosh Chirashree
Environmental Pollution Laboratory, Department of Environmental Biology, University of
Delhi, Delhi-110007, India
ABSTRACT
To improve the quality of air in a city like Delhi which is mainly affected by vehicular
exhaust, from 2002 onwards, CNG has been introduced, which shows remarkable change in
the concentration of pollutants, but even then there are some pollutants like NOx, O3 which
are still either crossing their permissible limits or at the margin of their crossing. Objective of
the present study is to compare the variation in concentration of ground level ozone at three
selected sites in Delhi which are distinct in vegetation and traffic densities and to monitor, if
the prevailing meteorological conditions are responsible for spatial variation of pollution in
Delhi. For this, the sampling was carried out during two seasons i.e. monsoon (Aug.-
Sept.’06) and winter season (Nov.-Dec.’06) at three sites - Site I (Inter State Bus Terminus -
ISBT), a high density traffic intersection area with low vegetation, Site II (Yamuna
Biodiversity Park - YBP, Wazirabad), away from traffic intersection with high vegetation,
and Site III (University of Delhi - DU, North Campus), an institutional area which is near to
traffic intersection i.e. with moderate traffic density and high vegetation. The overall result
shows that highest concentration of ground level ozone was found at Site II (YBP) followed
by Site III (DU) and Site I (ISBT) in the month of monsoon (Sept’06) whereas interestingly,
in the month of winter (Nov’06), the highest ozone concentration was found at Site III
followed by Site II and then Site I. This is might be due to the reason, at Site II in the month
of September due to favourable meteorological conditions like less relative humidity which is
negatively and highly significant to ozone concentration whereas, at Site III, in the month of
November, this site is highly dense in vegetation and also near to traffic intersection so might
be acting as an accumulation ozone of pollutants and moreover, with favourable
meteorological conditions like increase in temperature which is positively correlated and
highly significant with ozone concentration along with less relative humidity and wind speed
which are negatively correlated with ozone concentration. Therefore, it was concluded that
the site which is highly dense in vegetation and also have impact of vehicular emission
exhibits high ozone concentration level than less vegetative area.
Keywords: Ground level ozone, VOCs, Nitrogen Oxides, Vegetation, Traffic intersection
1. Introduction
Air is considered as the most important constituent of our life and its quality is affected by
anthropogenic activities, regional weather and topographical variance. Cleaner air means
fewer respiratory diseases among adults, fewer asthma attacks among children, fewer hospital
admissions and fewer premature deaths. In India, about 65% of the total air pollution is
caused by vehicular emissions especially in metropolitan cities and the rest is due to rapid
urbanization and industrialization (CSE, 2004). The available data shows that in Delhi, every
day vehicular emissions form close to two-third (66%) of total air pollution, in Mumbai, this

Variation in the concentration of ground level ozone at selected sites in Delhi
Saxena Pallavi, Ghosh Chirashree International Journal of Environmental Sciences Volume 1 No.7, 2011
1900
contribution is 52%, and in Kolkata, it is close to one-third of total air pollution (Chan and
Kwok, 2001). In addition, contribution of pollution due to vehicular emissions has increased
in the past 2-3 decades. Earlier, it was a paltry 23% in 1971, which rose to 43% in 1981 and
further to 63% in 1991 (Crutzen and Gidel, 1998). The Central Pollution Control Board
(CPCB) has been monitoring ambient air quality at seven locations in Delhi for the last few
years. The locations have been categorized based on land use viz. residential, industrial and
traffic intersection. The data generated between the years 1989 and 1996 showed rapid
increase in the levels of air pollution. In fact, the year 1996 was considered to be the peak
year in terms of air pollution load. It has been reported that “the annual average levels of
Suspended Particulate Matter (SPM) increased to 450 µg/m3 during 1996, which was nearly
three times higher than the National Air Quality Standard of 140 µg/m3 (residential areas), as
notified by the Ministry of Environment and Forests, Govt. of India (2001)”. This trend
continued and contribution of vehicular emissions to air pollution touched an alarming level
of 72% by the year 2001 (Naja et al., 2003). As the condition of Delhi had become worsen
day by day therefore, from 2002 onwards, the condition of Delhi’s pollution had changed
drastically because of implementation of CNG and EURO-III norms and it has reported
overall good results. But interestingly, during the years 2004 to 2006, concentrations of
Suspended Particulate Matter (SPM), Respirable Suspended Particulate Matter (RSPM), Carbon Monoxide (CO) and Sulphur Dioxide (SO2) showed a declining trend compared to the
year 2002-2003 while Nitrogen Dioxide (NO2) had shown an upward trend (Urvashi and
Alan, 2007). As the concentration of primary pollutants is still increasing, at the higher ends,
very often it leads to the production of secondary pollutants like ground level ozone. In India,
systematic monitoring of ground level ozone and other secondary pollutants didn’t show
significant pattern. “According to a report published by Central Road Research Institute
(2006) which showed peak results of ozone with other primary pollutants in the last 5 years”.
“In addition, few more studies clarifies that the ozone level had already crossed the danger
mark in the year 1993 and 2005 as reported by Syri et al. (2001)”. The present study of
monitoring ground level ozone concentration at three different selected sites of Delhi can
reflect a new dimension of understanding tropospheric ozone pollution status in the city. The
prime objective of our study was to compare the variation in concentration of ground level
ozone at three different sites which are distinct in vegetation and traffic densities and to
monitor, if the prevailing meteorological conditions are also responsible for spatial variation
of ozone pollution.
2. Materials and Method
Ground level ozone measurements were carried out with the help of a UV based ozone
analyzer (Model O3 42M, Environment S.A., France). The instrument was kept at a height of
about 10 meters above the ground. A 5 meter long Teflon tube (12mm dia.) was used as the
intake tube for air sampling. An inverted Teflon funnel was fitted at the entrance of the tube
to prevent dust and rain water going directly into the tube and the system. The data was
generated every day at three sites during monsoon season (Aug & Sept’06) and winter season
(Nov & Dec’06). At each site, sampling was done for consecutive 15 days. Simultaneously,
the hourly meteorological parameters viz. relative humidity, air temperature and wind speed
were also recorded using Pocket Weather Monitor (Kestrel, USA). The study was carried out
at three selected sites (Figure 1), viz. Site I (Inter State Bus Terminus - ISBT), a very high
density traffic intersection with low vegetation, is situated in the Northern part of Delhi with
latitude of 28033’27 N, longitude of 077
008’49 E and an altitude of 295 m, Site II (Yamuna
Biodiversity Park - YBP, Wazirabad), a very low density traffic intersection with high
vegetation is situated 1 km away from the bank of river Yamuna near Wazirabad in the

Variation in the concentration of ground level ozone at selected sites in Delhi
Saxena Pallavi, Ghosh Chirashree International Journal of Environmental Sciences Volume 1 No.7, 2011
1901
northern region of Delhi with latitude of 23033’27 N, longitude of 077
008’49 E and an
altitude of 216 m and Site III (University of Delhi - DU, North Campus), an institutional area
with moderate traffic density and high vegetation, is situated in the Northern Ridge area
inside the north campus of University of Delhi with 28037’11 N latitude, 27
040’10 E
longitude and an altitude of 126 m.
Figure 1: Map of Delhi Showing Sites
3. Result and Discussion
As per the EPA guidelines/ National Crop Loss Area Network (NCLAN), the critical value of
ground level ozone concentration is 40ppb/8hr (for plant species) and this threshold value
was compared with the generated ozone concentration at the selected sites. The general trend
of hourly ozone variation at Site I (ISBT) during monitoring period is represented in Figure 2.
Figure 2: Hourly Average Ozone variation (2006) at Site I- ISBT

Variation in the concentration of ground level ozone at selected sites in Delhi
Saxena Pallavi, Ghosh Chirashree International Journal of Environmental Sciences Volume 1 No.7, 2011
1902
In the month of August, the ozone concentration was 8.85 + 1.70 b
and highest concentration
(13.70ppb) was recorded at 15:00 hours, whereas in the month of September, the ozone
concentration was 13.35 + 2.11 ab
and peak concentration of ozone was reported to be 19.12
ppb at 11:00 hours. However, in the month of November, ozone concentration was 18.72 +
9.75 a and highest concentration of ozone was observed to be 30.65 ppb at 13:00 hours. The
data followed by different letters in a column are significantly different at P≤0.05 which
clearly predicts that ozone concentration are different and was highest in November month
followed by September and August (Table 1).
Table 1: Variation in Ozone Concentration in different months (Aug, Sept & Nov) 2006 at
Site 1 (ISBT). The values indicate mean + standard error
Months Ozone concentration (ppb)
August 8.85 + 1.70 b
September 13.35 + 2.11 ab
November 18.72 + 9.75 a
Each value represents mean of 7 replicates + standard error. Data followed by different letters
in a column are significantly different at P≤0.05.
It may be due to low mixing height and higher accumulation rate of ozone in the atmosphere
during winter months (Tiwari and Peshin, 1995). Figure 3 shows the distribution of hourly
day variation of surface ozone in different months (Aug, Sept & Nov, 2006).
Figure 3 (i-ii): Hourly average day & night variation at ISBT in 2006
The diurnal trend evident in Figure 3 indicates the daytime in situ photochemical production
of O3 throughout the seasons with an increase in ozone concentration during daytime and
decline at nighttime. The maximum ozone concentrations were observed between 12 and 14 h.
The decrease in nighttime O3 concentration was mainly due to the titration of O3 by surface
emission of NO and the ground level destruction of O3 in a shallow boundary-layer (Sillman
et al., 2003, Subbaraya et al., 2000). The highest ozone concentration of 30.5 ppb was
reported at 13:00 hrs in the month of November as compared with September of 23.8 ppb at
Figure 3 (i): Hourly average day
variation at ISBT
Figure 3 (ii): Hourly average night
variation at ISBT

Variation in the concentration of ground level ozone at selected sites in Delhi
Saxena Pallavi, Ghosh Chirashree International Journal of Environmental Sciences Volume 1 No.7, 2011
1903
11:00 hrs and August of 10.1 ppb at 15:00 hrs. On most of the days, the nighttime surface O3
concentration was found to be highest in the month of November of 4.20 ppb at 21:00 hrs
followed by September of 2.01 ppb at 2:00 hrs and in the month of August of 1.01 ppb at
20:00 hrs. Variation of ozone concentration, in the recorded months, has also been studied in
relation to meteorological parameters in Figure 4 (i-iii).
Figure 4 (i-iii): Variation in ozone concentration with meteorological parameters at ISBT
“The general trend shows (in all the reported months) that with the increase in ambient
temperature favours the increase of ozone concentration through photochemical reaction
which can be substantiated with the report of Hauglustaine et al. (2001)”. Relative humidity
has a great role in the production of ozone because it begins with the photolysis of ozone and
produces excited oxygen atom {O (1D)} which leads to the formation of hydroxyl radical.
The hydroxyl radical undergoes further reactions, and some of which eventually lead to the
formation of ozone (Pandey and Chasta, 2005). Observing the correlation matrix Table 2,
ozone was significantly positively correlated with temperature at 0.01 level in the month of
November which shows that with the increase in temperature there is increase in ozone
concentration. At Site I, ozone concentration showed low correlation coefficient with
meteorological parameters.
Table 2: Pearson correlation matrix for measured ozone concentration (ppb)
at Site 1 (ISBT).
August September November
Air Temperature 0.287 0.051 0.366**
Relative
Humidity
-0.158 0.032 -0.148
Wind Speed 0.049 0.236 0.375**
The general trend of ozone concentration at Site II (YBP) which can be observed during
experimental period is depicted in Figure 5.
Figure 4(i): Variation in Aug.,
2006
Figure 4(ii): Variation in Sept.,
2006
Figure 4(iii): Variation in Nov.,
2006

Variation in the concentration of ground level ozone at selected sites in Delhi
Saxena Pallavi, Ghosh Chirashree International Journal of Environmental Sciences Volume 1 No.7, 2011
1904
Figure 5: Hourly Average Ozone variation (2006) at Site II- YBP
In the month of September, the ozone concentration was 42.79 + 6.88a and highest was
recorded (51.01 ppb) at 15:00 hours. Besides, major consistent peaks were also observed
between 11:00 hours - 15:00 hours. In the month of November, the ozone concentration was
40.23 + 1.24a and highest was recorded (42.30 ppb) at 16:00 hrs and major consistent peaks
were also observed between 13:00 – 16:00 hrs. In the month of December, the ozone
concentration was 41.23 + 1.84a and highest (48.10 ppb) was recorded at 14:00 hours with
other peak ozone values between 13:00 hours-17:00 hours. The data followed by same letters
in a column are non-significant at P≤0.05 which clearly predicts that ozone concentration
shows no significant difference (Table 3).
Table 3: Variation in Ozone Concentration in different months (Sept & Dec) 2006 at Site II
(YBP). The values indicate mean + standard error.
Months Ozone concentration (ppb)
September 42.79 + 6.88a
November 40.23 + 1.24a
December 41.23 + 1.84a
Each value represents mean of 7 replicates + standard error. Data followed by same letters in
a column are non-significant at P≤0.05.
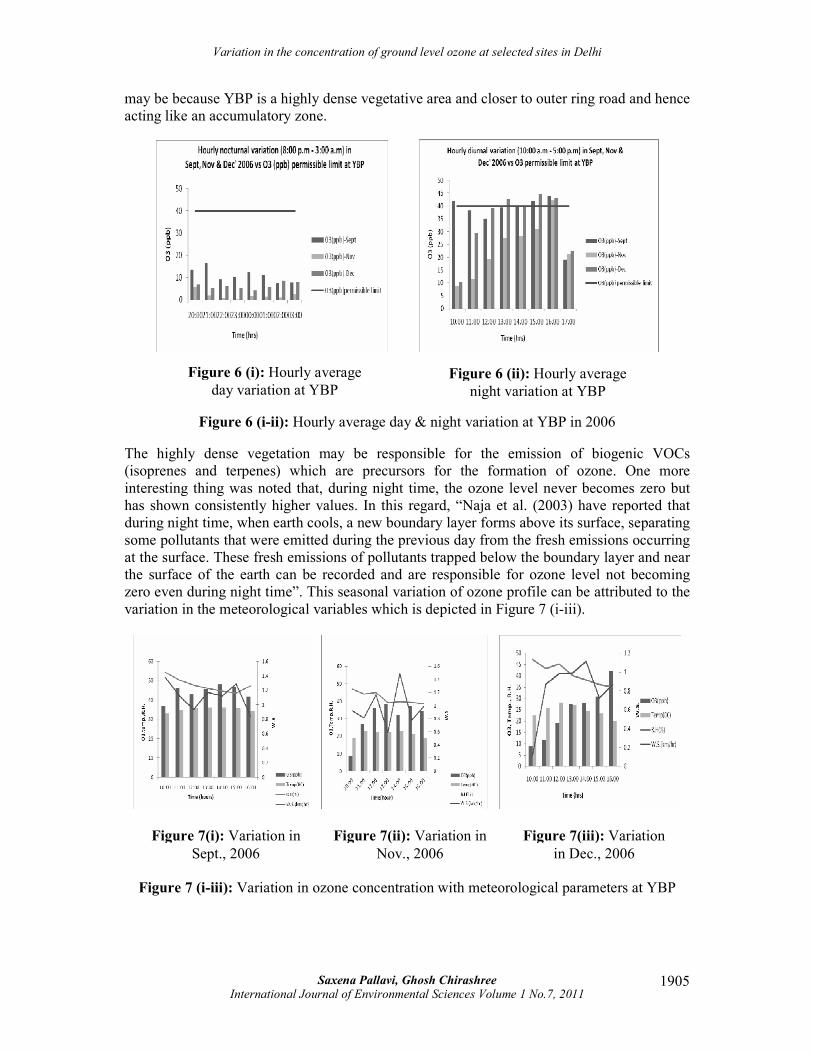
Figure 6 (i-ii) shows the distribution of hourly day variation of surface ozone in different
months (Sept, Nov & Dec, 2006).
The highest ozone concentration (44.2 ppb) was recorded at 16:00 hrs in the month of
September, in the month of November, the highest ozone concentration (42.30 ppb) at 16:00
hrs and in December, the highest ozone concentration was reported to be 44.1 ppb at 15:00
hrs. as shown in Figure 6 (i). Similarly in Figure 6(ii), with respect to hourly night variation
in the month of September, the highest ozone concentration was found to be 16.31 ppb at
21:00 hours, in the month of November, the highest ozone concentration (5.77 ppb) at 20:00
hours and in December, the highest ozone concentration was found to be 8.73 ppb at 2:00 hrs.
Interestingly, it was observed that ozone concentration in the month of September was quite
high at YBP (Site II) as compared to ISBT (Site I), both during day as well as night time. It
Variation in the concentration of ground level ozone at selected sites in Delhi
Saxena Pallavi, Ghosh Chirashree International Journal of Environmental Sciences Volume 1 No.7, 2011
1905
may be because YBP is a highly dense vegetative area and closer to outer ring road and hence
acting like an accumulatory zone.
Figure 6 (i-ii): Hourly average day & night variation at YBP in 2006
The highly dense vegetation may be responsible for the emission of biogenic VOCs
(isoprenes and terpenes) which are precursors for the formation of ozone. One more
interesting thing was noted that, during night time, the ozone level never becomes zero but
has shown consistently higher values. In this regard, “Naja et al. (2003) have reported that
during night time, when earth cools, a new boundary layer forms above its surface, separating
some pollutants that were emitted during the previous day from the fresh emissions occurring
at the surface. These fresh emissions of pollutants trapped below the boundary layer and near
the surface of the earth can be recorded and are responsible for ozone level not becoming
zero even during night time”. This seasonal variation of ozone profile can be attributed to the
variation in the meteorological variables which is depicted in Figure 7 (i-iii).
Figure 7 (i-iii): Variation in ozone concentration with meteorological parameters at YBP
Figure 6 (i): Hourly average
day variation at YBP Figure 6 (ii): Hourly average
night variation at YBP
Figure 7(i): Variation in
Sept., 2006
Figure 7(ii): Variation in
Nov., 2006
Figure 7(iii): Variation
in Dec., 2006

Variation in the concentration of ground level ozone at selected sites in Delhi
Saxena Pallavi, Ghosh Chirashree International Journal of Environmental Sciences Volume 1 No.7, 2011
1906
The general trend shows (in all the recorded months) with the increase in temperature and
relative humidity favoured the formation of ozone concentration (Chan and Kwok, 2001;
Eshel and Joseph, 2006). Observing the correlation matrix Table 4, ozone was significantly
negatively correlated with relative humidity at 0.01 level in all three months of September,
November and December which shows that with the increase in relative humidity there is
decrease in ozone concentration. At Site II, ozone concentration showed low correlation
coefficient with meteorological parameters.
Table 4: Pearson correlation matrix for measured ozone concentration (ppb) at Site II (YBP).
September November December
Air Temperature 0.135 0.154 0.168
Relative Humidity -0.345** -0.352** -0.336**
Wind Speed -0.062 -0.074 0.091
The profile of ozone variation at Site III (DU) in the recorded months is given in Figure 8.
Figure 8: Hourly Average Ozone variation (2006) at Site III- DU
In the month of August, the ozone concentration was 40.11 + 2.88b and highest was found to
be 50.33 ppb at 16:00 hours and the relative peak was accompanied with other shorter peaks
from 14:00-19:00 hours. In the month of September, the ozone concentration was 39.72 +
3.03b and highest was recorded 43.48 ppb at 16:00 hours and similarly other peaks were
observed between 12:00-16:00 hours. In the month of November ozone concentration was
41.06 + 4.76a at 14:00 hours and highest (56.91 ppb) and other accompanying peaks of ozone
were recorded from 12:00-15:00 hours. In the month of December, ozone concentration was
30.80 + 4.39a and highest 36.98ppb at 12:00noon. The data followed by different letters in a
column are significantly different at P≤0.05 which clearly predicts that ozone concentration
are different and was highest in November followed by August, September and December
(Table 5).
Table 5: Variation in Ozone Concentration in different months (Aug, Sept andNov- Dec)
2006 at Site III (DU). The values indicate mean + standard error.
Months Ozone concentration (ppb)

Variation in the concentration of ground level ozone at selected sites in Delhi
Saxena Pallavi, Ghosh Chirashree International Journal of Environmental Sciences Volume 1 No.7, 2011
1907
August 40.11 + 2.88b
September 39.72 + 3.03b
November 41.06 + 4.76a
December 30.80 + 4.39a
Each value represents mean of 7 replicates + standard error. Data followed by different letters
in a column are significantly different at P≤0.05.
It is also alarming to notice that in all the reported months at this site, the ozone concentration
also exceeding the permissible limit (40 ppb), it can be interpretated that as it is an
institutional area, presence of large number of two wheelers (a great source of NOx emission)
and the presence of biogenic VOCs (due to local dense vegetation) accelerates the process of
ground level ozone formation. Figure 9 shows the distribution of hourly day variation of
surface ozone in different months (Aug, Sept, Nov & Dec, 2006).
Figure 9 (i-ii): Hourly average day & night variation at DU in 2006
In case of hourly day variation, the highest ozone concentration (50.2ppb) was recorded at
11:00 hrs in the month of August, in September the highest concentration was 43.3 ppb at
16:00 hrs, in November, it was 58.2ppb at 14:00 hrs and in December, it was 39.9 ppb at
14:00 hrs as shown in Figure 9(i). “According to Tiwari et al. (1995) this may be due to
increase in temperature inversions, lower mixing depths and increase in moisture content”.
But hourly night variation (as shown in Figure 9(ii)) shows the highest concentration of 19.2
ppb at 3:00 hrs in the month of September as compared to other months. This might be due to
higher accumulation of ozone concentration from near emission sources. The ozone
concentration is also high at this site as compared to ISBT (Site I) & YBP (Site II) during day
as well as night probably because DU (Site III) is a dense vegetative area (source of biogenic
VOCs), adjacent to ring road (pollution accumulation rate is high). Figure 10 (i-iv) has been
interpreted the variation of ozone concentration in the recorded months with the
meteorological variables.
Figure 9 (i): Hourly average day
variation at DU Figure 9 (ii): Hourly average night
variation at DU

Variation in the concentration of ground level ozone at selected sites in Delhi
Saxena Pallavi, Ghosh Chirashree International Journal of Environmental Sciences Volume 1 No.7, 2011
1908
Figure 10 (i-iv): Variation in ozone concentration with meteorological parameters at DU
It also shows (in all the recorded months) that increase in temperature favours the formation
of ozone. The declining trend of relative humidity was also showcasing the increase in the
production of ozone after the production of hydroxyl radical (Salve et al., 2005; Lal et al.,
2000 and Walcek and Yuan, 1995). Observing the correlation matrix Table 6, ozone was
significantly positively correlated with temperature and negatively correlated with wind
speed in the month of November at 0.01 level. This clearly shows that at Site III with
increase in temperature there is increase in ozone concentration and moreover, the highest
ozone concentration was reported in the month of November due to favourable
meteorological factor wind speed which represents that when there is low wind speed there is
high ozone concentration. Moreover, it may be due to low mixing height and higher
accumulation rate of ozone in the atmosphere during winter months (Tiwari and Peshin,
1995).
Table 6: Pearson correlation matrix for measured ozone concentration (ppb) at Site III (DU).
August September November December
Air Temperature 0.440** 0.388** 0.496** 0.270
Relative Humidity 0.041 0.451** -0.062 -0.576**
Wind Speed -0.235 0.491** -0.185 0.306*
Figure 10(i): Variation in
Aug., 2006
Figure 10(ii): Variation in
Sept., 2006
Figure 10(iii): Variation in
Nov., 2006
Figure 10(iv): Variation in
Dec., 2006

Variation in the concentration of ground level ozone at selected sites in Delhi
Saxena Pallavi, Ghosh Chirashree International Journal of Environmental Sciences Volume 1 No.7, 2011
1909
A comparison of hourly ozone variation among three different sites has also been presented
in Figure 11 (i&ii) for the month of September and November. According to the profile, in
the month of September (Fig11 (i)), Site II shows higher peak values (48.07ppb) followed by
Site III (43.48 ppb) and Site I (17.33 ppb) and interestingly, in the month of November
(Fig11 (ii)), Site III shows high ozone concentration (56.91 ppb) followed by Site II (42.30
ppb) and Site I (30.65 ppb). Overall, in one of the month of monsoon (Sept’06) Site II (YBP)
shows highest ozone concentration profile in all reported months compared to other sites due
to favourable meteorological conditions like less relative humidity which is negatively and
highly significant at 0.01 level to ozone concentration whereas, conversely, in one of the
month of winter season (Nov’06), Site III (DU) exhibits highest ozone concentration as
compared to other selected sites , which may be due to, this site is highly dense in vegetation
and also near to traffic intersection so might be acting as an accumulation ozone of pollutants
and moreover, with favourable meteorological conditions like increase in temperature which
is positively correlated and highly significant with ozone concentration along with less
relative humidity and wind speed which are negatively correlated with ozone concentration.
Figure 11 (i-ii): Comparison of hourly ozone variation at ISBT,YBP & DU in 2006
4. Conclusion / Suggestions/ Findings
From the overall detailed study at all the three distinct sites, it was concluded that the site
which is highly dense in vegetation and also have impact of vehicular emission exhibits high
ozone concentration level than less vegetative area. So, our monitoring programme in new
areas (where pollution exposures are expected) and reporting of results is an effort to make
public aware of the present dangers they are exposed to. Once more we have to initiate our
thought process on how we can get rid off the harmful secondary pollutants everyday and
also to force the government to make stricter norms for the control of these secondary
pollutants immediately.
Acknowledgement
The author would pay sincere thanks to Mr. J.K. Bassin, Scientist Head, National
Environmental Engineering Research Institute (NEERI), Delhi for providing opportunity to
use their institute’s facilities in carrying out the research work at ISBT and grateful to Dr.
Anupam Joshi, Scientist Incharge, Yamuna Biodiversity Park, Wazirabad, for facilitating
support in regard to this study.
Figure 11 (i): ISBT, YBP
& DU in Sept
Figure 11 (ii): ISBT, YBP
& DU in Nov

Variation in the concentration of ground level ozone at selected sites in Delhi
Saxena Pallavi, Ghosh Chirashree International Journal of Environmental Sciences Volume 1 No.7, 2011
1910
5. References
1. Central Road Research Institute (CRRI). 2006. Annual Report.
2. Centre for Science and Environment (CSE). 2004. Annual Report.
3. Chan L.Y., Kwok W.S. (2001). Roadside Suspended Particulates at Heavily
Trafficked Urban Sites of Hong Kong- Seasonal Variation and Dependence on
Meteorological Conditions. Atmospheric Environment, 35, pp 3177-3182.
4. Crutzen P.J., Fishman J. (1979). Journal of Geophysical Research, 97, pp 6037.
5. Crutzen P.J., Gidel L.T. (1998). Journal of Geophysical Research, 88, pp 6641.
6. Dawson P.J., Adams P.J., Pandis S. (2007). Sensitivity of Ozone to Summertime
Climate in the Eastern USA: A Modelling Case Study, Atmospheric Environment,
41, pp 1494-1511.
7. Eshel G., Bernstein J.J. (2006). Relationship between Large- Scale atmospheric
States, Subsidence, Static Stability and Ground-Level Ozone in Illinois, USA,
Water, Air and Soil Pollution, pp 45-55.
8. Hauglustaine D., Emmons L., Newchurch M., Brasseur G., Takao T., Matsubara
K., Johnson J., Ridley Brian, S.J., Dye J. (2001). On the Role of Lightining NOx
in the Formation of Tropospheric Ozone Plumes: A Global Model Perspective,
Journal of Atmospheric Chemistry, 38, pp 277-294.
9. Lal S., Naja M., Subbaraya B.H. (2000). Seasonal variations in surface ozone and
its precursors over an urban site in India, Atmospheric Environment, 34, pp 2713-
2724.
10. Naja M., Lal S., Chand D. (2003). Diurnal and Seasonal variabilities in Surface
Ozone at a High Altitude Site Mt Abu in India, Atmospheric Environment, 37, pp
4205-4215.
11. Narain U., Krupnick A. (2007). The Impact of Delhi’s CNG Program on Air
Quality. Resources of the Future, pp 6-7.
12. Pandey J., Chasta A. (2005). Surface Ozone Concentrations in a Tropical City in
India, Indian Journal of Environmental Protection, 25 (8), pp 739-752.
13. Salve P.R., Maurya A., Ramteke D.S., Wate S.R. (2005). Measurement of Surface
Ozone Levels in Urban Environment, Indian Journal of Environmental Protection,
25(12), pp 1096-1100.
14. Sillman S. (2003). Overview: Tropospheric Ozone, Smog and Ozone-NOx-VOC
Sensitivity, Treatise on Geochemistry, (9), Environmental Geochemistry, Ch.11,
pp 1-7.
15. Subbaraya B.H., Lal S., Modh K.S., Naja M. (2000). Surface Ozone
Measurements at Ahmedabad, Physical Research Laboratory Report, pp 5-13.

Variation in the concentration of ground level ozone at selected sites in Delhi
Saxena Pallavi, Ghosh Chirashree International Journal of Environmental Sciences Volume 1 No.7, 2011
1911
16. Syri S., Amann M., Schopp W., Heyes C. (2001). Estimating long-term
population exposure to ozone in urban areas of Europe, Environmental Pollution,
113, pp 59-69.
17. Tiwari V.S., Peshin S. (1995). A Prominent Maximum in Surface Ozone
Concentrations during Winter Months at Pune (India), Mausam, 46, (2), pp 155-
162.
18. Walcek J.C., Yuan H.H. (1995). Calculated Influence of Temperature-Related
Factors on Ozone Formation Rates in the Lower Troposphere, Journal of Applied
Meteorology, 34, pp 1056-106.