value paper author: f. podest and r. rea alarm management ... · alarm management and 6-sigma...
TRANSCRIPT

Alarm management and 6-SIGMA analysis: A successful experience in a chemical Plant
Value Paper Author: F. Podest and R. Rea

2 Alarm management and 6-SIGMA analysis | ABB Value Paper
Alarm management and 6-SIGMA analysis: a successful experience in a chemical plant
image area
I. IntroductionA DCS (Distributed Control System) can generate a very high number of alarms and events. Control engineers or control room operators often cannot deal effectively with this number of alarms.
When alarms proliferate their collective value as a tool for diagnosis and preventing problems declines so the overall effec-tiveness of the alarms system suffers with risk of incidents and/or relevant economics losses.
Today for many advanced control systems it is becoming es-sential to have a system to identify and eliminate all nuisance alarms generated by a DCS, a system that allow to manage the alarms and to enhance its reliability.
One useful method for alarm improvement activity is Six-Sigma methodology based on teamwork. The Six-Sigma approach includes the following phases:
− Define: Identify opportunities and Project scope − Measure: Analyze current process and define desired out-
comes − Analyze: ID root causes and proposed solutions − Improve: Prioritize, plan & test proposed solutions. Refine
and implement solutions − Control: Measure progress and hold the gains − Recognize team & communicate results
Statistical tools provided by Six-Sigma methodology and a suitable system to detect all nuisance alarms generated by DCS represent a useful guide and support to fix existing alarm system and to establish a well managed system that provides to the process controllers with the appropriate information in a timely manner. In this way it would be possible to easily identify cause of abnormal process conditions and restore the plant to its normal operations.
Scope to establish a well alarm management system should be: − Enable and empower operating teams to manage their plant − Maximize the safety avoiding hazardous situations − Minimize environmental impact avoiding release in ambient − Push the processes to their optimal limits − Avoid equipment failure decreasing maintenance costs
II. The Termoli Momentive Performance Materials Specialties PlantA. Process DescriptionMomentive Performance Materials Termoli (Molise- Italy) plant produces chemical specialties like Silanes Orgafunctional Liquid, Urethane Additives Copolymers and Silicone Fluids Antifoams and Emulsions. All these products are based on Silicon chemistry.
Final applications of these specialties are in the automotive, personal care, healthcare, electronics, construction, textile and leathers, pulp and paper, domestic applications.
Raw materials and intermediates as well the finished products sometime represent dangerous or toxic materials.
Main equipment used in the several production (continuous and batch) processes are reactors, pumps, heat exchangers, distillation columns working under high vacuum, incinerator unit, boilers and waste water treatment system. So the control system of the different processes must be very effective, efficient and reliable to avoid the risk of incidents, emissions out of the law limits and quality problems of finished products that will create problems in final applications.
B. Automation system descriptionTermoli DCS system, provided by ABB, includes a control network connected to 15 Process Control Units (PCU). The signals from/to the production units (field) are governed by these PCU’s. On the same loop operator interface stations are connected. These stations include 12 computers, called Conductors, installed in the control room governed by control room operators assigned to the process control

ABB Value Paper | Alarm management and 6-SIGMA analysis 3
of the production units. Other interfaces connected to the same loop are the EWS (Engineering Work Station called Composer and used for programming the control logics), LPM (Loop Performance Management) and EAM (Enhanced Alarm Management).
C. Pre-project situationAbout 6000 tags are defined on Termoli DCS, either digital tags or analog tags. The type of analog tags could be temperature, pressure, level, flow rate, pH, electrical input. The type of digital tags could be ON/OFF valve, ON/OFF switches, interlocks, etc.
For each of these tags an alarm is defined. An alarm is generated by when the values of process variables detected by the tags exceed the alarm limits in case of analog tags, or by when the tag change its state in case of digital tags. In this case a signal is sent on the consoles in the control room advising by a sound the operators about the process upset.
If the alarm limits are not well defined or configured we can have way too many signals sounding continuously on the consoles of the control room so the operator is unable to track the status of the process, with risk of incident, equipment failure, process out of control and out of spec production.
Each alarm signal is also recorded on a printer, so in case of alarms proliferation a lot of indecipherable paper is generated.
The process of an alarm management on the ABB control computers (Conductors) includes the following steps:
1. An alarm sounds on DCS computer in the alarm panel due to a process upset
2. The control room operator silences the alarm3. The control room operator acknowledges the alarm4. The control room operator recall the graphic (plant) where the
tag alarming has been configured5. The control room operator takes the necessary actions to
restore normal process conditions6. A new alarm will be generated by DCS when the tag returns
to normal
If the alarms proliferate it is evident that this process cannot be applied in the right way.
D. Problem statementA large number of overall system alarms are more intrusive than individual process alarms and arguably of lesser value to operators; thus they are unable to track the state of the processes and production status.
The number of alarms generated by DCS during a certain period of time can be measured by EAM (Enhanced Alarms Management).
EAM is a powerful software tool developed by ABB by a devoted team in Genova, first of all, to replace the alarms printing system; it also provides additional functions for intelligent alarms monitoring, alarms archiving, off-line alarms and statistical event analysis. A detailed description of this software is in the following paragraphs.
III. Project Scope and DevelopmentA. The DMAIC approachA Six-Sigma study started in May 2008 to monitor the alarms generated by Termoli Plant DCS. Using the EAM tools and DMAIC approach, for 31 days all the alarms have been collected and analyzed statistically to establish the process baseline.
Particularly the team put the attention on the Silane-1 production area that includes critical processes and equipment.
First of all the team introduced on DCS a site Specific Alarm Philosophy as (work practice) based upon alarm levels priority reduction from 16 to 5 as following:
1. Alarm Priority = 1 (red signal on the console):Critical COP/NEL Alarm - Critical Operating Parameter (COP) at the never exceed limit (NEL) requires immediate, predetermined action as specified in COP documentation or an alarm identified in an Operational Safety Standard that is needed to control a risk associated with a Major Process Hazard. These alarms are associated with a critical instrument.
2. Alarm Priority = 2 (yellow signal on the console):Serious Alarm - An alarm that warns of a condition that if not corrected may lead to personal injury, equipment damage, environmental pollution or substantial economic penalties.
3. Alarm Priority = 3 (green signal on the console):Operator Guide Alarm - An alarm that warns of a nonoptimal process condition, and directs the operator to look in a certain area of the process.
4. Alarm Priority = 8 (light blue signal on the console):Bad quality signals arriving on DCS.
5. Alarm Priority = 16 (fuchsia signal on the console): Return to normal, second/third levels alarms, high deviations, etc.

4 Alarm management and 6-SIGMA analysis | ABB Value Paper
By applying the Six-Sigma methodology we then defined the Performance Standards of the process as following:
− Project Y: number of alarms generated by DCS. − Project y: number of alarms generated by DCS in Silane 1 area. − Unit definition: N° of alarms generated by DCS per 10 min-
utes. − Defect Definition: N° of alarms generated by DCS > 10
alarms per 10 minutes. − Operators Target: N° of alarms generated by DCS <=1 per 10
minutes.
Measure System Analysis (MSA) was run as following.The EAM (Enhanced Alarm Management system connected to DCS) can detect a certain number of alarms (or nuisance alarm that is an alarm that sounds continuously) for a fixed period of time.
The control room operator (customer) can see at same time alarms on a graphic page called “Alarm Review” by the computers installed in the control room (called Conductor Servers).
Based upon the comparison between what is recorded by EAM and the two computers (Server-1 and Server-2) installed in control room on Silane-1 console we validated our measurement system.
Result of MSA is that the number of alarms detected by EAM was the same number of alarms reported on the DCS Alarm Review module. See the following Gage R&R results:
Gage R&R
Source VarComp StdDev 5.15*Sigma
Total Gage R&R 0.000 0.02171 0.1118
Repeatability 0.000 0.02070 0.1066
Reproducibility 0.000 0.00655 0.0337
Appraiser 0.000 0.00655 0.0337
Part-To-Part 11.604 3.40645 17.5432
Total Variation 11.604 3.40652 17.5436
Source % Contribution % Study Var % Tolerance
Total Gage R&R 0.00 0.64 1.12
Repeatability 0.00 0.61 1.07
Reproducibility 0.00 0.19 0.34
Appraiser 0.00 0.19 0.34
Part-To-Part 100.00 100.00 175.43
Total Variation 100.00 100.00 175.43
Number of Distinct Categories = 221
B. SW Tool DescriptionABB Enhanced Alarm Management (since now indicated with the acronym EAM) is a software package designed to provide plant engineers and operators with the ability of view, export or analyze alarms and events data. The target of this package is not only to replace alarms printers but also to store all alarms and events of a plant in a rational and more useful manner.
Three software modules compose the ABB Enhanced Alarm Management:1. EAM Datamanager: the software module that takes care of
messages acquisition from external devices and to archive them into the global database.
2. EAM Event Viewer: a light and user-friendly client designed to quickly retrieve, show and print stored alarms.
3. EAM Statistic Toolkit: the software module designed to ana-lyze and clarify the alarms system situation.
EAM DatamanagerThe EAM Datamanager allows configuring your EAM to acquire from several devices alarms and events, storing them in a single relational database and manage it.
To start the acquisition it’s needed to configure an acquisition port for every data source device in the plant. Several predefined port types are available to acquire alarms from ABB systems (Process Control Portal, Conductor, ABB 800XA, etc.) but virtually any device capable of sending message data through a serial port, through OPC, over an Ethernet network or through an ASCII file can be connected to an EAM Datamanager.
In the current case only Conductor acquisition ports were used.
When acquisition starts all alarms and events received are split into their essential information and the result of this operation is stored in the database.
EAM Datamanager also provides all is needed to maintain, manage and backup the database.
EAM Event ViewerThe EAM Event Viewer is an EAM Client that provides a user friendly and quick approach to extract and show data stored in the global database.
It can be installed on the same computer with the EAM Data Manager program or on separate Client machines.
Measurement system has been validated
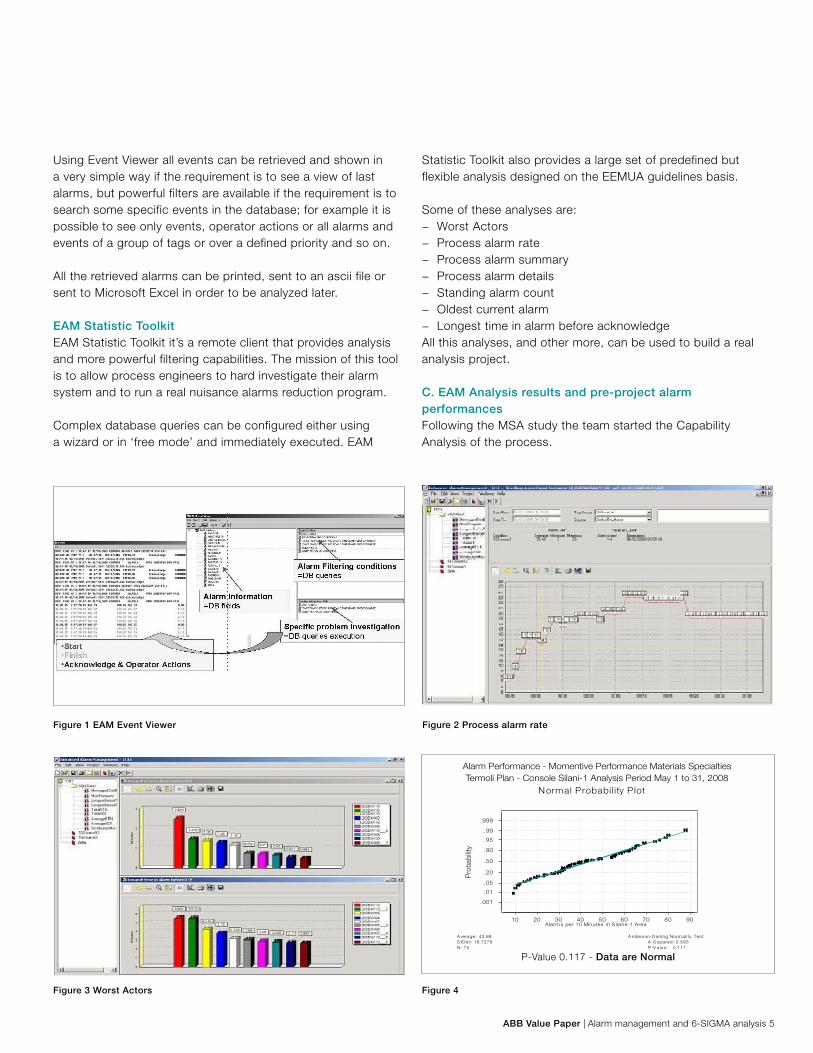
ABB Value Paper | Alarm management and 6-SIGMA analysis 5
Using Event Viewer all events can be retrieved and shown in a very simple way if the requirement is to see a view of last alarms, but powerful filters are available if the requirement is to search some specific events in the database; for example it is possible to see only events, operator actions or all alarms and events of a group of tags or over a defined priority and so on.
All the retrieved alarms can be printed, sent to an ascii file or sent to Microsoft Excel in order to be analyzed later.
EAM Statistic ToolkitEAM Statistic Toolkit it’s a remote client that provides analysis and more powerful filtering capabilities. The mission of this tool is to allow process engineers to hard investigate their alarm system and to run a real nuisance alarms reduction program.
Complex database queries can be configured either using a wizard or in ‘free mode’ and immediately executed. EAM
Statistic Toolkit also provides a large set of predefined but flexible analysis designed on the EEMUA guidelines basis.
Some of these analyses are: − Worst Actors − Process alarm rate − Process alarm summary − Process alarm details − Standing alarm count − Oldest current alarm − Longest time in alarm before acknowledge
All this analyses, and other more, can be used to build a real analysis project.
C. EAM Analysis results and pre-project alarm performancesFollowing the MSA study the team started the Capability Analysis of the process.
Figure 1 EAM Event Viewer Figure 2 Process alarm rate
Figure 3 Worst Actors
A verage: 43.68S tDev: 18.7279N: 75
A nders on-Darl ing Norm ality Tes tA -S quared: 0.593P -V alue: 0.117
10 20 30 40 50 60 70 80 90
.001
.01
.05
.20
.50
.80
.95
.99
.999
Pro
babi
lity
A larm s per 10 Minutes in S ilane-1 Area
Normal Probabi l ity P lot
Alarm Performance - Momentive Performance Materials SpecialtiesTermoli Plan - Console Silani-1 Analysis Period May 1 to 31, 2008
P-Value 0.117 - Data are Normal
Figure 4

6 Alarm management and 6-SIGMA analysis | ABB Value Paper
This analysis is a tool that visually compares actual process performance to the performance standards.
First of all, as requested by Six-Sigma methodology, we verified that the collected data has a normal distribution. The result of the test is showed by Figure 4.
Results of Capability Analysis are showed in Figure 5.
This graphic shows that considering an upper specification limit of 10 alarms per 10 minutes (project defect), the process control was very poor because most of data are above the USL. Sometime the DCS generated almost 100 alarms per 10 minutes making the control room operator almost crazy!
The following graphics in Figure 6 come from the capability process report.
These graphics and tables show how the current process is very far away from the desired process. On average we detected more than 43 alarms per 10 minutes (Stdev of 18.7) generated
by DCS while the number of defects observed during a standard production run divided by the number of opportunities to make a defect during that run, multiplied by one million, the so called current DPMO (Defects per Million of Opportunities) was equal to 936,942!
The team decided then to take as project baseline the following data: − Initial project DPM: 936,942 − Number of alarms per 10 minutes generated by DCS regard-
ing Silane 1 production area: 43.7
An important alarm activity metric highlighted by Capability Analysis and elaborated by EAM special query is the “Intervention to alarm ratio” average. The initial result was 1:4.9, meaning that the control room operator in Silane 1 recognized only 1 alarm (where he followed the process alarm management showed above) for each 5 alarms generated by DCS in the same area. The remaining 4 alarms where just ignored by the operator!
Based upon this data the team started to look at how to improve the process performance.
Alarm Performance - Console Silani-1 - Analysis Period May 1 to 31, 2008
Figure 5
Figure 7 Figure 6
ImpactImplementation High Low
Easy 1 2Hard 3 4
Cause and Effect Diagram – Alarm Management SystemProcess Capability for Alarms per 10 minutes in Silane-1
Process Capability

ABB Value Paper | Alarm management and 6-SIGMA analysis 7
So the team proceeded to define the performance objective of the project indicating 5 alarms per 10 minutes the maximum manageable level of alarms generated by DCS in Silane 1 production area.
By a brainstorming session the team passed to phase of possible variation sources identification. The Cause and Effect Diagram in Figure 7 show the result.
D. New Alarm philosophyUsing the FMEA (Failure Mode Effective Analysis) the team selected the following crucial causes from the X’s of the previous cause-effect diagram:
− Study further X’s: − X1: Alarms Set Limits
− Low Hanging Fruits X’s: − X2: number of alarm priorities − X3: DCS Control Logics − X4: Instrumentation defects
− X5: Control Valve Functionality (tuning) − X6: DCS Connections failures
− Out of scope X’s: − X7: Precipitation, X8: Humidity, X9: Temperature − X10: Computers failure − X11: Operators Work Load − X12: Process parameters
Then the most active alarms were identified by EAM as showed by the following diagram in Figure 8.
As showed in the diagram the 77.88% of the total alarm activity was due to the ten most active points. For example the most active point was LIC-E130-1; concerning this tag actions were taken by reviewing the set limits variations and by tuning the PID parameters (see Figure 9).
The actions that the team put in place can be summarized as following:
− X1: variation of 22 Set Alarms. For example we moved the high level alarm of tag LIC-E130-1 from 60% to 70% (70% +/0 is the new operating tolerance), with no contraindication from process engineer.
− X2: reduced Number of Alarms Priority Levels on DCS from 16 to 5.
− X3: when production is not running, about 20 alarms were inhibited (alarm deactivation is a new operating Tolerance).
− X4: repaired 32 instruments. Some of them were introduced in Routine Maintenance plan.
− X5: tuned 20 PID controllers. For example PIC-D1171 fixed new P/I parameters sets from 2/1 to 0.5/0.2.
− X6: replaced 5 input/output card connections. Improved spare parts from 2 to 10 cards.
Figure 8
Figure 9
Actual (LT) Potential (ST)
726252
Process Performance
USL
Actual (LT) Potential (ST)
1,000,000
100,000
10,000
1000
100
10
1
2001000
Potential (ST)Actual (LT)
Sigma
PPM
(Z.Bench)
Process Benchmarks
999883
-0.68
751372
-3.68
Process Demographics
Opportunity:Nominal:Lower Spec:
Old Upper Spec: 60 %Units: % of LevelCharacteristic: LIC-E130-1Process:Department:Project:Reported by:Date:
Report 1: E xecutive Summary for LIC-E130
DPMO with OLD High Alarm (60%) Limit: 751,372
- Alarm set limits variation - PID parameters tuning
LIC-E130-1 Actions:
Figure 10

8 Alarm management and 6-SIGMA analysis | ABB Value Paper
IV. PROJECT RESULTSA. Post project performancesAfter the implementation of the all identified actions a new data collection was run by using EAM tool in the period 1 _ 31 July 2008 to check the improvement. The overall result is showed in the graphics in Figure 10.
The average alarms number of alarms detected was 4.4 per 10 minutes (StDev was 2.2) well below USL!
B. BenefitsThe overall result of the study can be summarized as following (see Figure 12):
Final result is that the DCS in Silane 1 production area generates 4.4 alarms per 10 minutes.
The “Intervention to alarm ratio” at the end of study is 1: 1.3.
The project achieved a 90% reduction of the alarm rate per 10 minutes and a 99% DPMO reduction!
CONCLUSIONSThe key learning’s coming from this study can be summarized as following:
− Importance of a site-specific alarm philosophy is as useful work practice: control room operators, process engineers and other managers have recognized the benefit of alarms reduction.
− EAM system: is an essential technological tool to keep under control alarms proliferation.
− Cross Functional Support: could not improve the perfor-mance of alarm system without the support of control room operators.
Further activities: − The alarm system must be continuously monitored. Almost
every day the control system manager detects the worst ac-tors of system alarms using EAM computer to avoid alarms proliferation
− Tool to be used to keep the alarm system under control: Control Charts, EAM Tools (Messages Distribution Reports, Worst Actors Tables)
− When new tags are introduce in the DCS specific alarms limits and alarm priority must be correctly defined using tools like T-Test, SPC, and Control Chart
− If new parameters will be set for particular process the alarms limits must be reviewed using tools like T-Test, SPC, Control Chart
− Loop Performance Management will be used for − Tuning PID controllers to avoid oscillations using tools
− Like reports from LPM − Training of Control room operators on new alarm philosophy
must be made using tools like documentation of training and Poke Yoke
− Control room operators must advise in case of nuisance alarm detection specifying the errors detected in the control chart
− Critical instrumentation is inserted in the Routine Mainte-nance Plan by Maintenance
Figure 11
Executive Summary – New Process Capability
0S u b g r o u p 5 0 1 0 0 1 5 0
0
5 0
1 0 0
Indi
vidu
al V
alue
55666
62222
11
2
1
6
65655
151111
622
1
2
111
22
566
5 5666 6662
X = 4 . 4 2 0
3 . 0 S L = 9 . 5 7 0
- 3 . 0 S L = - 0 . 7 3 0 2
2
0
1 0
2 0
3 0
4 0
5 0
Mov
ing
Ran
ge
22
1
1
1 1R = 1 . 9 3 6
3 . 0 S L = 6 . 3 2 7
- 3 . 0 S L = 0 . 0 0 E + 0 0
2
Figure 12
Before improvement After improvement
Baseline
DPMO 936,94
Alarms per 10 minutes 43.7
New Capacity
DPMO 5,412
Alarms per 10 minutes 4.4

ABB Value Paper | Alarm management and 6-SIGMA analysis 9
REFERENCES
1. Hammer, M., “Process Management and the future of six sigma”, Engi-
neering Management Review, IEEE , 2002
2. Jan Noyes., “Alarm systems: a guide to design, management and pro-
curement”, Computing & Control Engineering Journal, April 2000
3. “Process Plant Control Desks Utilising Human-Computer Interfaces - A
Guide to Design, Operational and Human Interface Issues”, EEMUA, 2002
4. Martin Hollender , “Intelligent Alarming”, ABB Review vol. , 1 - 2007.
5. Bonavita, N., Caserza Bovero, J., Martini, R., “Control loops: perfor-
mance and diagnostics”, Proc. of: 48th ANIPLA Conference, Milan, 14-15
September 2004
6. “EAM User Guide”, ABB, 2003
7. Horch, A., “Control Loops: Pleasure or Plague? A view onto the plant
floor in the Process Industries“, ABB Review 4/2005, pp. 56-59
8. Bonavita, N., Caserza-Bovero, J., De Lorenzo, L., Martini, R., 2006,
“Control Performance Monitoring: a Data-driven Approach”, Proc. of
Monitoraggio delle Prestazioni dei Processi e dei Sistemi di Controllo,
Milan 19 September 2006
ACKNOWLEDGEMENT
The authors would like to thank Mr. Nunzio Bonavita for his help and advice
towards the writing of this paper.

Contact us
3BU
S09
4831
A
BB
US
Cre
ativ
e S
ervi
ces
1464ABB Ltd
Affolternstrasse 44 CH-8050 Zurich, Switzerlandwww.abb.com