validity of the ltd-dht shaw and thellier …shibuya/shibuya/oishi+pepi2005.pdf · validity of the...
TRANSCRIPT
Physics of the Earth and Planetary Interiors 149 (2005) 243–257
Validity of the LTD-DHT Shaw and Thellier palaeointensitymethods: a case study of the Kilauea 1970 lava
Yusuke Oishia,1, Hideo Tsunakawaa,∗, Nobutatsu Mochizukia, Yuhji Yamamotob,Ken-Ichi Wakabayashia, Hidetoshi Shibuyac
a Department of Earth and Planetary Sciences, Tokyo Institute of Technology, Tokyo 152-8551, Japanb Geological Survey of Japan, AIST, Tsukuba, Ibaraki 305-8567, Japan
c Department of Earth Science, Kumamoto University, Kumamoto 860-8555, Japan
Received 20 April 2004; received in revised form 4 October 2004; accepted 11 October 2004
Abstract
The double heating technique of the Shaw method with low-temperature demagnetisation (LTD-DHT Shaw method) fordetermination of geomagnetic palaeointensity is applied to samples exhibiting high-temperature oxidation states from the Kilauea1970 lava, Hawaii Island. Results are obtained for 11 of the 12 specimens prepared from five block samples, yielding an averagepalaeointensity of 38.2± 2.8�T (N= 11,±1σ). This value is consistent with the expected value determined from DGRF 1970(35.8�T), and does not appear to be significantly dependent on the high-temperature oxidation state. Coe’s version of the Thelliermethod was also applied to nine specimens prepared from the same block samples, and successful results were obtained for
entkcability ofThellier
ixing lineip may be
ofsti-atedlier
seven specimens, giving an average palaeointensity of 43.2± 8.4�T (N= 7). Although this average is statistically consistwith the expected value, the results include erroneously high palaeointensities (52.1 and 55.4�T) for specimens from one blocsample of intermediate high-temperature oxidation state. The present results therefore reinforce the broader applithe LTD-DHT Shaw method for samples with high-temperature oxidation states compared with Coe’s version of themethod. It is also shown that the samples yielding overestimated Thellier palaeointensities tend to fall close to the mbetween single-domain (and/or pseudo-single-domain) and multidomain components on the Day plot. This relationshuseful as a pre-selection technique for application of the Thellier method.© 2004 Elsevier B.V. All rights reserved.
Keywords:Palaeointensity; Shaw method; Thellier method; Kilauea lava; High-temperature oxidation; Day plot
∗ Corresponding author. Tel.: +81 3 5734 2459;fax: +81 3 5734 3537.
E-mail address:[email protected] (H. Tsunakawa).1 Present address: Department of Earth and Planetary Science,
University of Tokyo, Tokyo 113-0033, Japan.
1. Introduction
Correct determination of the absolute intensitythe ancient geomagnetic field is important for invegating the evolution of the geodynamo and the relconditions in the earth’s deep interior. The Thel
0031-9201/$ – see front matter © 2004 Elsevier B.V. All rights reserved.doi:10.1016/j.pepi.2004.10.009

244 Y. Oishi et al. / Physics of the Earth and Planetary Interiors 149 (2005) 243–257
method (Thellier and Thellier, 1959) applied to naturalremanent magnetisation (NRM) of thermoremanentmagnetisation (TRM) origin is considered at presentto be the most reliable means of determining the ge-omagnetic palaeointensity. Since thermal alteration ofthe sample during heating in the Thellier experimentscan impair the results, the partial thermoremanentmagnetisation (pTRM) check (Coe, 1967) is generallyemployed to detect thermal alteration due to laboratoryheating. Nevertheless, several studies using naturaland artificial samples have indicated that the Thelliermethod often gives an incorrect palaeointensity (e.g.Tanaka and Kono, 1991; Kosterov and Prevot, 1998;Calvo et al., 2002; Yamamoto et al., 2003; Bigginand Thomas, 2003; Mochizuki et al., 2004), andmany improvements to the Thellier method have beenproposed (e.g.Valet, 2003). It should also be notedthat the database of Thellier palaeointensities possiblyincludes a positive bias, as almost all incorrect valuesreported to date have been overestimates.
The Shaw method (Shaw, 1974) is an alternativemethod for determining the palaeointensity in whichsamples are heated above the Curie temperatures in thelaboratory to give a full TRM. The method has sincebeen modified to incorporate a correction techniquefor thermal alteration of the samples due to labora-tory heating (e.g.Kono, 1978; Tsunakawa and Shaw,1994). Yamamoto et al. (2003)andMochizuki et al.(2004) applied the double heating technique of theShaw method with low-temperature demagnetisation( 7;Y a1 vely.T iono entm tingt awm tingw ARMc toryh e(c plea as-s oust di-fi inlyb M
after ARM correction (e.g.Rolph and Shaw, 1985).In the double heating technique, the sample is heatedtwice in the same laboratory field, and the applicabilityof the ARM correction is also examined by agreementbetween the first and second TRM after ARM correc-tion (Tsunakawa and Shaw, 1994). The LTD treatmentprevents possible effects due to multidomain (MD)components (Tsunakawa et al., 1997; Yamamoto et al.,2003).
The LTD-DHT Shaw method has been applied to afew lavas with high-temperature oxidation states, yield-ing average palaeointensities of 35.7± 3.3�T (N= 7)for the Kilauea 1960 lava (Yamamoto et al., 2003)and 46.4± 4.7�T (N= 6) for the Oshima 1986 lava(Mochizuki et al., 2004). These values are consis-tent with the expected values of 36.2�T for HawaiiIsland (DGRF1965) and 45.5�T for Oshima Island(DGRF 1985), suggesting that the LTD-DHT Shawmethod is valid for samples with a wide range ofhigh-temperature oxidation states. Thus, it appearspossible that the use of the LTD-DHT Shaw methodmay give more reliable palaeointensity determinations.In this study, the validity of the LTD-DHT Shawmethod is further examined by application to an-other historical lava with high-temperature oxidationstates.
The Thellier method may prove to be more use-ful if pre-selection criteria can be applied to sam-ples. The erroneously high Thellier palaeointensitiesof the Kilauea 1960 lava (Yamamoto et al., 2003)am ag-n cor-r asda n-i in-d theT on-s ica-t hiss
970l TheL cks om-p llierm
LTD-DHT Shaw method;Tsunakawa et al., 199amamoto et al., 2003) to samples from the Kilaue960 lava and the Oshima 1986 lava, respectihe LTD-DHT Shaw method is an improved versf the Shaw method, utilising anhysteretic remanagnetisation (ARM) correction, the double hea
echnique, and LTD treatment. In the original Shethod, sample alteration due to laboratory heaas checked based on the agreement betweenoercivity spectra obtained before and after laboraeating (Shaw, 1974). The ARM correction technique.g.Kono, 1978; Rolph and Shaw, 1985) allows for theorrection of laboratory-induced TRM due to samlteration during laboratory heating. This techniqueumes that the ARM coercivity spectra are analogo the TRM. In the single heating version of the moed Shaw method, this assumption is examined may the linearity of the diagram of NRM versus TR
nd Oshima 1986 lava (Mochizuki et al., 2004) wereostly obtained for samples containing titanometite grains and well-developed ilmenite lamellae,esponding to oxidation indices of III (or II) to V,efined byWilson and Watkins (1967)and Watkinsnd Haggerty (1967). Volcanic rock samples contai
ng magnetic grains with intermediate oxidationices may therefore be inappropriate for use withhellier method. The potential of such a relatihip for use as a pre-selection criterion for applion of the Thellier method is also investigated in ttudy.
The lava examined in this study is the Kilauea 1ava, which is regarded as a typical hot-spot basalt.TD-DHT Shaw method is applied to several bloamples from a massive section of the lava and cared with the results of Coe’s version of the Theethod applied to the same samples.

Y. Oishi et al. / Physics of the Earth and Planetary Interiors 149 (2005) 243–257 245
2. Samples and magnetic properties
2.1. Samples
Samples were taken from a basaltic lava extrudedin 1970 on the southeast flank of the Kilauea volcano,Hawaii Island (Fig. 1). The sampling site is located at(19.303◦N, 155.174◦W), where the Chain of CratersRoad traverses the 1970 lava exposing a 3 m-high out-crop of a massive section of the lava flow. Five blocksamples (labelled A–E) were collected at a height ofabout 1 m from the road surface within a distance ofabout 10 m along the road. As a sun compass couldnot be used, sample orientation was determined us-ing a magnetic compass after checking for the ab-sence of significant deflection of magnetic north. A fewcores of 25 mm diameter were drilled from the blocksamples and cut into one or two specimens of about25 mm in length in the laboratory for palaeomagneticmeasurements.
The DGRF 1970 field at the sampling site was cal-culated to beD= 11.0◦, I = 36.8◦ andF= 35.8�T. Af-ter alternating field (AF) demagnetisation of the NRM,principal component analysis (Kirschvink, 1980) wasperformed to extract the primary components. The av-erage direction for the five block samples isD= 16.8◦,I = 38.4◦ andα95 = 6.4◦ (N= 5), and thus is not signifi-cantly deflected from the expected field.
2.2. Thermomagnetic analyses, hysteresisproperties and LTD ratios
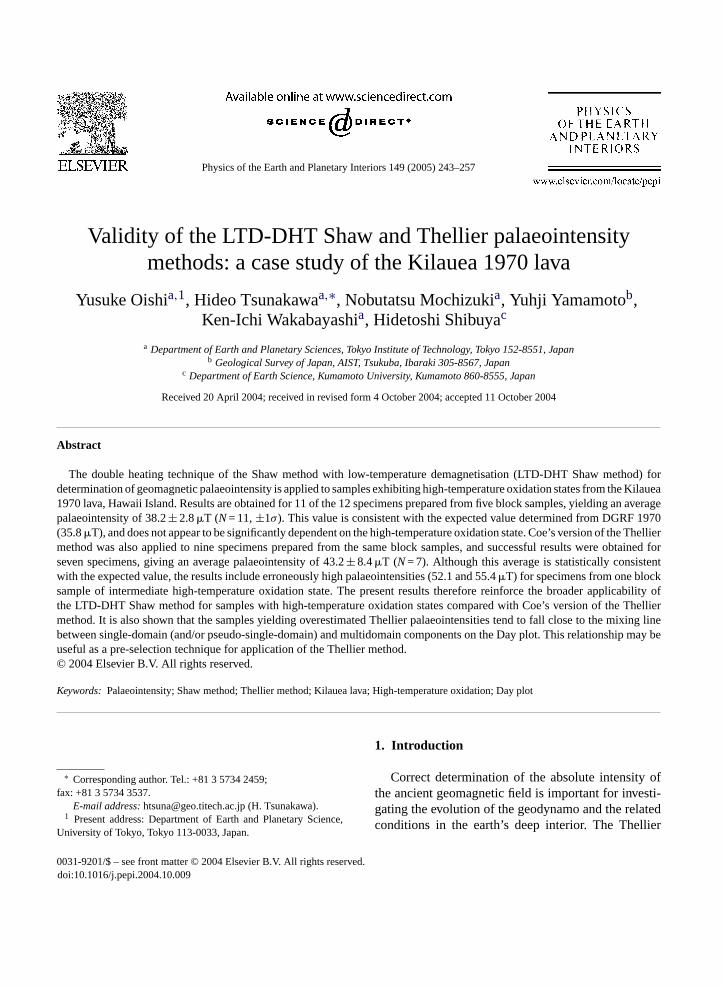
Thermomagnetic analyses of the Curie temperature(Tc) were performed under helium gas flow using avibrating sample magnetometer (VSM; Micro Mag3900, Princeton Measurements Corporation). Most ofthe thermomagnetic curves exhibited a major phasewith Tc > 520◦C (Fig. 2), indicating the presence oftitanium-poor titanomagnetites. Minor phases withTc ∼= 300◦C were identified in the heating curve forsample D and in the heating and cooling curves forsample E. The heating and cooling curves for samplesA, B, C, and E displayed largely reversible features,although the cooling curves were somewhat lowerthan the heating curves possibly due to some thermalalteration during heating and/or instrumental lag in themeasured temperatures between heating and coolingstages. In contrast, the difference between the heatingand cooling curves for sample D is relatively large,probably due to thermal alteration during heating.Sample D also produced an unsuccessful result in theThellier experiment (see Section3.2).
VSM hysteresis property measurements (Ms:saturation magnetisation,Mrs: remanent saturationmagnetisation,Brc: remanent coercivity, andBc:coercivity) were performed at room temperatureusing several small chips from each block sample.
F d from f historicall
ig. 1. Locality map of the sampling site. Samples were collecteavas extruded since 1965.
the Kilauea 1970 lava. Shaded areas indicate the distribution o
246 Y. Oishi et al. / Physics of the Earth and Planetary Interiors 149 (2005) 243–257
Fig. 2. Thermomagnetic curves of the block samples used in this study. The vertical axis is saturation magnetisation (MS) normalised to that atroom temperature (MS0). Arrows indicate heating or cooling curves.

Y. Oishi et al. / Physics of the Earth and Planetary Interiors 149 (2005) 243–257 247
As shown inFig. 3(a), the samples exhibit proper-ties of 0.12 <Mrs/Ms < 0.29 and 1.7 <Brc/Bc < 2.9,corresponding to single-domain (SD) or pseudo-single-domain (PSD) regions of the Day plot (Dayet al., 1977; Dunlop, 2002a). It should be noted that thedata points for samples A and D appear to be distributedalong mixing lines between SD and MD components(after Dunlop, 2002a). This will be discussed inSection4.1.
2.3. High-temperature oxidation states
Magnetic minerals exhibiting various degrees ofhigh-temperature oxidation were observed under areflected-light microscope with a magnification of100–500, and the samples were free of other formsof oxidation such as low-temperature oxidation. Usingoxidation indices of I–VI (Wilson and Watkins, 1967;Watkins and Haggerty, 1967), the high-temperature ox-idation states were classified into three levels in thesame way asMochizuki et al. (2004): (1) a low oxi-dation state with oxidation indices of I–II, (2) an in-termediate oxidation state with III–V, and (3) a highoxidation state with oxidation index VI (Fig. 4). Allsamples contained titanomagnetite grains in both lowand high oxidation states. However, grains of interme-diate oxidation level were not found in samples B, Cand E, whereas some amount was found in samples Aand D. Based on these observations, the block samplescan be divided into two groups: (1) intermediate oxida-tion group (samples A and D) and (2) non-intermediateoxidation group (samples B, C and E). These sampleswere therefore deemed to be suitable for testing the re-liability of palaeointensity determinations using high-temperature oxidation states.
All samples were observed to contain many vesiclesof 102 to 103 �m in size under the microscope, andthe high-temperature oxidation was seen to be moreintensive in magnetic grains in contact with vesicles,similar to observations made for the Oshima 1986 lava( a-t etic
Fs eachb Opena te ox-i theK -p igh
h . Af-t ndM om-p berso thee ti-c m theO s(Mochizuki et al., 2004). As a more detailed investigion, the high-temperature oxidation states of magn
ig. 3. (a) Day plot (Day et al., 1977; Dunlop, 2002a) of the blockamples used in this study. Several small chips were taken fromlock sample and measured at room temperature with a VSM.nd closed symbols denote intermediate and non-intermedia
dation samples, respectively. Data points of the samples fromilauea 1960 lava (Yamamoto et al., 2003) are also shown. Samles from 1960-A, -B and -C are of low, intermediate and high-temperature oxidation levels, respectively (see the text)
er Dunlop (2002a), the theoretical mixing lines between SD aD end members are also shown together with ratios of MD conents: mixing line 1 (dot-dashed line) assuming the end memf Day et al. (1977)and mixing line 2 (dashed line) assumingnd members ofParry (1965). The shift of mixtures with SP parles is represented by an arrow. (b) Day plot of the samples froshima 1986 lava (Mochizuki et al., 2004) and the Mt. Etna lava
Calvo et al., 2002). Other symbols are the same as above.
248 Y. Oishi et al. / Physics of the Earth and Planetary Interiors 149 (2005) 243–257
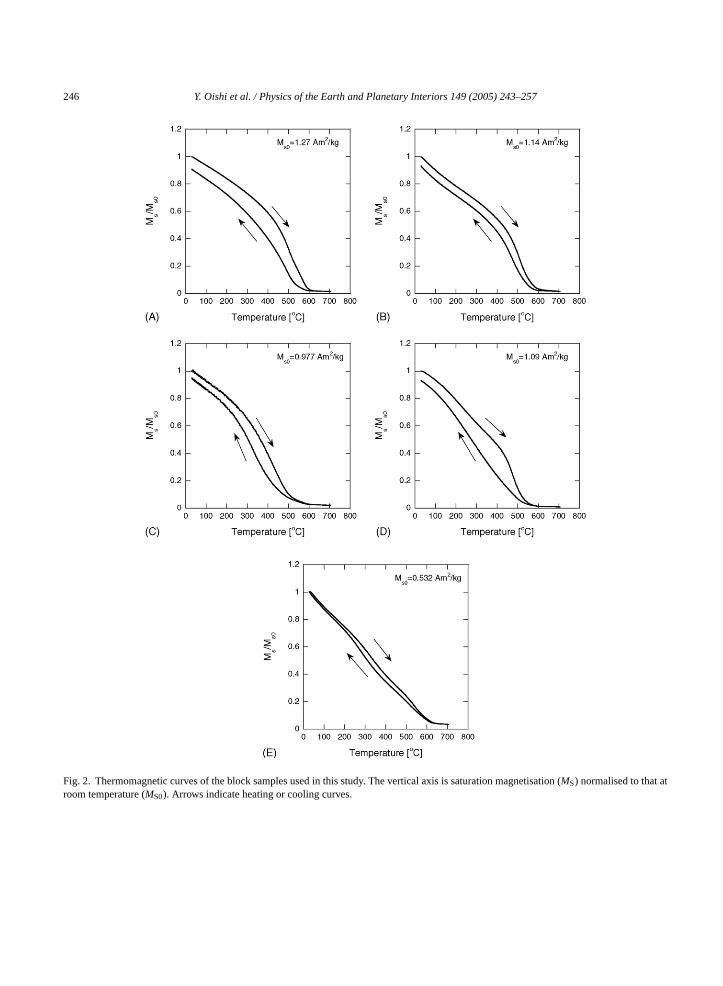
Fig. 4. Representative photographs of titanomagnetite grains takenthrough the reflected-light microscope: low oxidation level (sam-ple D, top), intermediate oxidation level (sample D, middle), andhigh oxidation level (sample A, bottom). Bars indicate 10�mlength.
Table 1Relative distribution of magnetic grains with respect to oxidationindices
Block sample IDobserved part
Oxidation index
I–II III–V VI
Intermediate oxidation groupA
Surrounding vesicles 0.42 0.16 0.42Away from vesicles 0.92 0.05 0.03
DSurrounding vesicles 0.26 0.10 0.64Away from vesicles 0.96 0.02 0.02
Non-intermediate oxidation groupB
Surrounding vesicles 0.03 0.00 0.97Away from vesicles 0.21 0.00 0.79
CSurrounding vesicles 0.19 0.00 0.81Away from vesicles 0.87 0.00 0.13
ESurrounding vesicles 0.00 0.00 1.00Away from vesicles 1.00 0.00 0.00
Several tens of grains were counted in individual regions. The sam-ples are classified into intermediate and non-intermediate groups.Details are in the text.
grains were identified and counted in individualareas surrounding vesicles and distant from vesiclesurfaces. Microscopic identification was confirmedfrom chemical composition measurements of somegrains in each block sample by energy-dispersive x-rayspectroscopy (EDS). The results are summarised inTable 1.
In the intermediate oxidation group (samples Aand D), 10–16% of titanomagnetite grains surround-ing vesicles were in an intermediate oxidation state,while 42–64% were in a high oxidation state (Table 1).Further from vesicle surfaces, only 2–5% of grainswere in an intermediate oxidation state, while most(92–96%) were in a low oxidation state. Therefore, theareas away from vesicles have been subjected to a rela-tively low degree of high-temperature oxidation. In thenon-intermediate oxidation group (samples B, C andE), more than 80% of grains surrounding vesicles werein the high oxidation state, and no grains of interme-diate oxidation state were found. In areas away fromthe vesicle surfaces, the fraction of grains in the highoxidation state varied from 0 to 79%.

Y.O
ishie
tal./P
hysics
ofth
eEarth
andPlanetary
Interio
rs149(2005)243–257
Table 2Palaeointensity results of the LTD-DHT Shaw method
SpecimenID
NRM0*
(10−5 A m2/kg)LTD ratio 1st heating 2nd heating FL (�T) F± σF (�T)
HL SlopeA1 SlopeN fN rN HL SlopeA2 SlopeT fT rT
A-02-1 341 0.174 0 0.919 1.22± 0.01 1.000 0.999 0 1.02 0.926 1.000 1.000 30.0 –A-02-2 346 0.170 5 0.940 1.20± 0.01 0.934 0.999 0 0.969 1.01 1.000 0.999 30.0 36.0± 0.4A-11-2 254 0.304 30 0.909 1.15± 0.02 0.304 0.995 0 0.969 1.01 1.000 1.000 30.0 34.6± 0.7
B-01-2 604 0.132 15 0.823 1.51± 0.01 0.890 1.000 5 0.980 0.982 1.000 1.000 30.0 45.3± 0.2B-02-1 711 0.099 5 0.976 1.21± 0.01 0.969 1.000 0 1.01 0.979 1.000 1.000 30.0 36.3± 0.1B-03-1 501 0.096 15 1.00 1.24± 0.01 0.932 1.000 0 0.982 1.03 1.000 1.000 30.0 37.3± 0.1
C-02-2 286 0.123 10 0.970 1.24± 0.01 0.811 0.999 0 0.956 1.03 1.000 1.000 30.0 37.3± 0.3C-11-1 426 0.103 10 0.978 1.29± 0.01 0.878 1.000 0 0.986 0.975 1.000 1.000 30.0 38.8± 0.1C-12-3 273 0.131 10 1.02 1.26± 0.01 0.777 0.999 0 1.01 0.956 1.000 0.999 30.0 37.8± 0.3
D-02-1 225 0.131 10 0.950 1.27± 0.01 0.729 1.000 0 0.990 0.980 1.000 0.999 30.0 38.1± 0.2D-04-1 232 0.141 0 0.955 1.32± 0.01 1.000 0.999 0 0.968 0.992 1.000 1.000 30.0 39.6± 0.3
E-01-2 272 0.114 0 0.977 1.26± 0.01 1.000 1.000 0 1.00 0.987 1.000 1.000 30.0 37.9± 0.2
Average 38.2± 2.8 (N= 11),37.4± 1.4 (N= 10)
NRM0: NRM intensity before LTD; LTD ratio: a ratio of the LTD-erased component to the initial NRM;HL: the lowest AF step of the linear portion; slopeA1 and slopeA2: slopesof the portion with AF steps >HL in the ARM0–ARM1 and ARM1–ARM2 diagrams, respectively; slopeN and slopeT: a slope of the linear portion in the NRM–TRM1* andTRM1–TRM2* diagrams, respectively;fN: NRM fraction of the linear portion in the NRM–TRM1* diagram;fT: TRM fraction of the linear portion in the TRM1–TRM2* diagram;rN andrT: correlation coefficients of the linear portions in the NRM–TRM1* and TRM1–TRM2* diagrams, respectively;FL: laboratory field;F andσF: palaeointensity and itserror. The averaged palaeointensity is calculated from all the results passing the selection criteria (N= 11) and also from the results except for B-01-2 (N= 10). The italic value doesnot fulfill the selection criteria (sample A-02-1).
249

250 Y. Oishi et al. / Physics of the Earth and Planetary Interiors 149 (2005) 243–257
These observations imply that in addition to thecooling rate, the high-temperature oxidation of thepresent samples was strongly controlled by the oxygenfugacity of the fluid phase in vesicles and by the oxygenpermeability of the regions around vesicles. It is likelythat the high-temperature oxidation of the samples pro-gressed during the initial cooling stage and thus moreintensively in the immediate area around vesicles.
3. Palaeointensity measurements and results
3.1. LTD-DHT Shaw method
The LTD-DHT Shaw method (Tsunakawa et al.,1997; Yamamoto et al., 2003) was applied to thesesamples using the ARM correction technique ofRolphand Shaw (1985)for correction of the TRM for ther-mal alteration of the samples during laboratory heat-ing. Samples were heated twice in a vacuum of 10 to102 Pa at 610◦C. The peak temperature was held for20 and 30 min in the first and second heating stage,respectively. The TRM was induced by applicationof a 30�T dc field during the heating and coolingstages, and the ARM was induced by the applicationof a 100�T dc field. Samples were subjected to step-wise AF demagnetisation in 5–10 mT intervals up to160 mT. All remanences were measured using an au-tomated spinner magnetometer with AF demagnetiser(Natsuhara-Giken Dspin-2;Kono et al., 1984, 1997).T s de-se
oft ;M ,w condh , andT
( nis-tion
(al.
( he5%n-
dition must be satisfied for the TRM1–TRM2*
diagram (fT ≥ 0.15). The associated correlationcoefficients should also be no less than 0.995(rN, rT ≥ 0.995). Slopes of the correspondingcoercivity portion in the ARM0–ARM1 andARM1–ARM2 diagrams are defined by slopeA1and slopeA2, respectively.
The results are summarised inTable 2, and repre-sentative NRM–TRM1* diagrams are shown inFig. 5.Eleven out of the 12 specimens passed the selectioncriteria. The failed specimen was from sample A, withfailure in the double heating test (slopeT = 0.926). Theresultant palaeointensities range from 34.6 to 45.3�Twith an average of 38.2± 2.8�T (N= 11,±1σ), con-sistent with the expected value of 35.8�T (DGRF1970).
Specimen B-01-2 yielded a palaeointensity(45.3�T) that was 27% higher than the expectedvalue. As this result affords the smallest slopeA1(0.823) of the present measurements (Table 2), thishigh palaeointensity may have been induced by a sig-nificant change in the ARM coercivity spectra duringthe first heating step. However, as similar changes inARM coercivity have usually given reasonable valuesin previous studies (Tsunakawa and Shaw, 1994;Yamamoto et al., 2003; Mochizuki et al., 2004), thisinterpretation is not conclusive. If the palaeointensityof B-01-2 is excluded as an outlier, the average iscalculated to be 37.4± 1.4�T (N= 10).
onsela-eco-or
locknts.
ra-
The
M
he details of the experimental procedures are acribed inYamamoto et al. (2002, 2003)andMochizukit al. (2004).
The selection criteria adopted in the applicationhe LTD-DHT Shaw method (Yamamoto et al., 2003ochizuki et al., 2004) in this study are given belowhere the magnetisations after the first and the seeating steps are denoted by suffixes of 1 and 2RM after ARM correction is denoted by TRM* .
1) The stable primary component must be recogable in orthogonal plots of the AF demagnetisaof NRM.
2) The slope of the relation in the TRM1–TRM2* di-agram (slopeT) must be unity within experimenterror, typically 1.05≥ slopeT ≥ 0.95 in this study
3) The linear portions of the relation in tNRM–TRM1* diagram must not be less than 1of the original NRM (fN ≥ 0.15). The same co
Most of the specimens yielded large linear fracti(fN > 0.7). However, specimen A-11-2 displayed a rtively small fraction of NRM (fN = 0.304), attributablto the inclusion of a secondary component withercivity of less than 30 mT, possibly of isothermalviscous origin.
3.2. Thellier method
Coe’s version of the Thellier method (Coe, 1967)was also applied to nine specimens from the same bsamples examined in the LTD-DHT Shaw experimeSpecimens were heated at 100–600◦C in 20–50◦Csteps in air. The reproducibility of the peak tempeture in each heating step was better than 1◦C. The holdtime at the peak temperature was set at 15 min.laboratory dc field intensity was maintained at 30�Tthroughout the heating and cooling cycles for TR

Y. Oishi et al. / Physics of the Earth and Planetary Interiors 149 (2005) 243–257 251
Fig. 5. Representative diagrams of NRM vs. TRM1* by the LTD-DHT Shaw method. Units are 10−5 A m2/kg. Closed circles indicate the linearportion used in the palaeointensity calculation. The lowest coercivity of the linear portion is attached to the least-square-fit line. It is noted that allthe remanences are treated with LTD and the applicability of the ARM correction (Rolph and Shaw, 1985) was examined by the double heatingtest as in TRM1–TRM2* diagrams. The results are summarised inTable 2and details are in Section3.1.

252 Y. Oishi et al. / Physics of the Earth and Planetary Interiors 149 (2005) 243–257
development. In the pTRM checks, the agreement be-tween the TRM values of the present and one or twoprevious temperature steps was tested. Magnetic sus-ceptibility was measured at room temperature using asusceptibility meter (MS2, Bartington Instruments) af-ter each heating step. The details of the procedures areas described inYamamoto et al. (2003)andMochizukiet al. (2004).
Although stringent selection criteria for Thellier-type results have been proposed (e.g.Selkin and Tauxe,2000), there appear to be no definite selection criteriafor the Thellier method (e.g.Calvo et al., 2002; Bigginand Thomas, 2003). In this study, the selection criteriaof Mochizuki et al. (2004)are tentatively employed, asgiven below:
(1) The stable primary component must be recognis-able in the orthogonal plot of the thermal demag-netisation of NRM (zero-field NRM).
(2) The linear portion of the primary component inthe Arai diagram must be defined by four or morepoints (N≥ 4) and must correspond to no less than15% of the original NRM (f≥ 0.15).
(3) The linear portion must have positive pTRMchecks. The pTRM check is judged from agree-ment between the reproduced pTRM and theTRM at the 2σ level. This error (σPTRM) iscalculated from experimental uncertainties ofremanence measurements (σmeas), heating temper-ature (σtemp) and applied dc fields (σDC), that is,
(
o n cri-t auseo n-s byt ivep s of5 iesr p-t uesf
( tedv sol the
expected value at the 1σ level. This large standard de-viation is obviously caused by two anomalously highvalues (52.1 and 55.4�T) from sample A (intermedi-ate oxidation group). If these two values are excludedas outliers, the average for samples B, C and E givea reasonable result with a smaller standard deviation(37.9± 1.7�T,N= 5). This suggests that the high Thel-lier palaeointensities obtained for sample A may not bedue to strong local magnetic anomalies but to the spe-cific magnetic property of the rock itself.
The two specimens that failed, A-11-1 and D-01-1, were rejected due to the lowq values of thelinear portion associated with positive pTRM checks(Table 3). The NRM–TRM diagrams display upwardconcave features (Fig. 6), yielding relatively smalllinear portions (f= 0.304 and 0.259). The calculatedpalaeointensities were 46.8 and 45.2�T for A-11-1and D-01-1, respectively. These values are not used inthe later discussion.
Orthogonal plots of NRMs remaining after zero-field heating (thermal demagnetisation of NRM) areshown in the core-coordinate system inFig. 6, wherethez axis is parallel to the core axis and anti-parallelto the applied dc field. The NRM direction of sampleD-01-1 gradually approaches the−zdirection, sugges-tive of thermal alteration associated with chemical re-manent magnetisation (CRM) acquisition parallel tothe applied laboratory field. This directional changemakes it difficult to recognise the primary NRM com-ponent of D-01-1, which is another reason why thiss Thef mala duet RMc 03;M na ora-t aint ,2 mayh rd
γ
w tialNg di-r
σ2PTRM = σ2
meas+ σ2temp+ σ2
DC.4) The quality factor (Coe et al., 1978) must not be
lower than 5 (q≥ 5).
Representative results are shown inFig. 6. Sevenut of the nine specimens passed these selectio
eria. The two failed specimens were rejected becf low q values (Table 3). For the seven palaeointeities obtained for block samples A, B, C and Ehe Thellier method, the linear portions with positTRM checks extend to relatively high temperature00–600◦C (f≥ 0.43). The resultant palaeointensitange from 35.5 to 55.4�T, with q= 7.1–64.0. Susceibility changes were less than 10% of the initial valor the linear portions.
These seven results give an average of 43.2± 8.4�TN= 7), approximately 21% higher than the expecalue of 35.8�T. However, the standard deviation isarge that the average is statistically consistent with
ample was discarded in the Thellier experiments.ailure of D-01-1 can probably be attributed to therlteration in the laboratory. Such thermal alteration
o laboratory heating is not always detected by pThecks (e.g.Riisager and Riisager, 2001; Valet, 20ochizuki et al., 2004). The thermal alteration calso be estimated based on the intensity ratio of lab
ory CRM to NRM after zero-field heating at a certemperature. This value, denotedγ (Mochizuki et al.004), can be used to determine whether samplesave undergone thermal alteration. The parameteγ isefined as
= sinθ/[sinθ + sin(ϕ − θ)],
hereθ is the angle between the directions of iniRM and NRM after zero-field heating, andϕ the an-le between the initial NRM and laboratory CRMections (Mochizuki et al., 2004). In this study,θ and

Y. Oishi et al. / Physics of the Earth and Planetary Interiors 149 (2005) 243–257 253
Fig. 6. Representative Arai diagrams of Coe’s version of the Thellier method. Closed circles describe the linear portion used in the palaeointensitycalculation and the least-square-fit line is shown as solid. Error bars are at the 2σ level. Sample D-01-1 did not pass the selection criteria and itsreference line is shown as dotted. The orthogonal plots of NRM after zero-field heating are shown in the core-coordinate system: closed circleson theX–Yplane and open circles on theX–Z plane. The results are summarised inTable 3and details are in Section3.2.
254 Y. Oishi et al. / Physics of the Earth and Planetary Interiors 149 (2005) 243–257
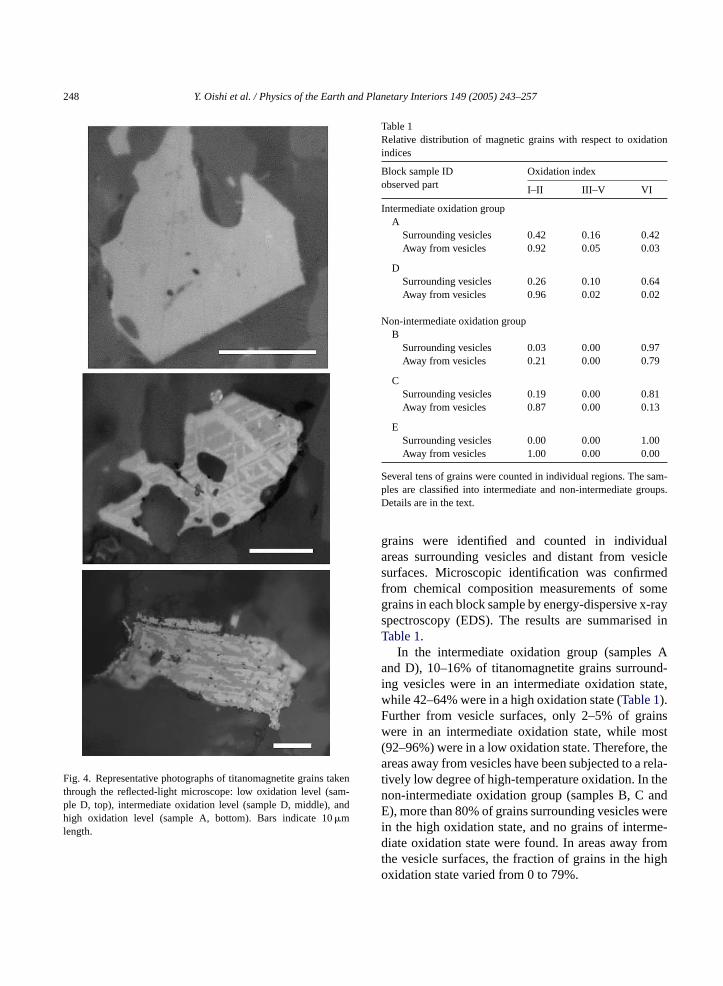
Table 3Palaeointensity results of the Thellier method
SpecimenID
NRM0
(10−5 A m2/kg)�T (◦C) N r f g q Slope FL (�T) F± σF (�T) γ lin γall
A-01-1 355 0–500 12 0.998 0.549 0.866 22.6 1.74± 0.04 30.0 52.1± 1.1* 0.09 0.14A-01-2 304 0–500 10 0.991 0.529 0.881 9.7 1.85± 0.09 30.0 55.4± 2.7* 0.12 0.14A-11-1 322 0–440 7 0.968 0.304 0.8242.2 1.56± 0.18 30.0 (46.8± 5.4) – 0.13
B-01-1 903 0–500 12 0.998 0.517 0.716 17.8 1.31± 0.03 30.0 39.4± 0.8 0.03 0.13B-02-2 453 0–500 10 0.988 0.463 0.865 7.1 1.36± 0.08 30.0 40.8± 2.3 0.12 0.15
C-02-1 452 0–600 16 0.999 0.988 0.877 64.0 1.28± 0.02 30.0 38.3± 0.5 0.09 0.09C-12-2 274 0–600 15 0.997 0.989 0.910 45.3 1.18± 0.02 30.0 35.5± 0.7 0.07 0.07
D-01-1 248 0–300 6 0.982 0.259 0.7882.1 1.51± 0.14 30.0 (45.2± 4.3) – 0.18
E-01-1 286 0–525 13 0.995 0.523 0.884 15.5 1.28± 0.04 30.0 38.3± 1.1 0.09 0.12
Average 43.2± 8.4 (N= 7),37.9± 1.7 (N= 5* )
NRM0: NRM intensity at room temperature;�T: temperature interval used in the palaeointensity calculation;N andr: the number of data andthe associated correlation coefficient of the linear portion;f, gandq: NRM fraction, gap factor and quality factor, respectively (Coe et al., 1978);FL: laboratory field;F andσF: palaeointensity and its error;γ lin : maximum CRM ratio for the linear portion;γall: maximum CRM ratio for allthe temperature steps except 600◦C. The italic value is in contradiction to the selection criteria and the calculatedF is discarded. The averagedpalaeointensity is calculated from all the results passing the selection criteria (N= 7) and also from all results except the two results (A-01-1 andA-01-2;N= 5* ). The parenthesised palaeointensity is shown as a reference value because the corresponding result does not satisfy the selectioncriteria.
ϕ are calculated as follows:
θ = IS (initial NRM)
− IS (NRM after zero-field heating),
ϕ = IS (initial NRM) − (−90◦),
whereIS is the core-coordinate inclination. The maxi-mum values ofγ for the linear portion of the relationin the Arai diagram (γ lin) and for all temperature stepsexcept 600◦C (γall) are summarised inTable 3. Ac-cording toMochizuki et al. (2004), the samples yield-ing erroneously high Thellier palaeointensities havelarger γ lin values than other samples. Block sampleA, however, exhibitsγ lin andγall values comparableto the other samples, suggesting that the effect of ther-mal alteration during laboratory heating is minor in thepresent experiments.
3.3. Summary of palaeointensity results
The palaeointensities obtained by the LTD-DHTShaw method are consistent with the expected values,whereas the values determined by the Thellier methodfor intermediate oxidation samples are anomalouslyhigh. Therefore, the LTD-DHT Shaw method appears
to be applicable irrespective of the high-temperatureoxidation state, whilst the Thellier method tends to giveerroneously high palaeointensities for samples with in-termediate oxidation levels. It should be noted thatthe Thellier method was found to be valid for non-intermediate samples, as shown byYamamoto et al.(2003)andMochizuki et al. (2004).
4. Discussion
4.1. Possible pre-selection techniques for Thellierexperiments
The hysteresis parameters of the intermediate oxi-dation group exhibit a characteristic trend on the Dayplot, whereas the non-intermediate oxidation groupproduces a cluster of data points (Fig. 3(a)). These fea-tures can be seen clearly when compared with the dataset for the Kilauea 1960 lava (Yamamoto et al., 2003;Fig. 3(a)). According to the classification byYamamotoet al. (2003), the samples from group B (1960-B) con-tain grains with oxidation indices of II–V and thuscorrespond to the intermediate oxidation group, whilethose from group A (1960-A; oxidation index of I) and

Y. Oishi et al. / Physics of the Earth and Planetary Interiors 149 (2005) 243–257 255
group C (1960-C; VI) represent a non-intermediate oxi-dation group. Therefore, the 1960 lava samples exhibitthe same characteristics as the 1970 lava on the Dayplot.
Theoretical mixing lines between SD and MD arealso shown inFig. 3(a) for two representative pairs ofend members (SD + MD mixing lines 1 and 2;Dunlop,2002a). Those lines fall close to the data points ofthe intermediate oxidation group. If magnetic grains ofthe intermediate oxidation samples are assumed to becomposed of SD + MD mixtures (represented by mix-ing line 2), the estimated MD volume fractions are60–80%. The corresponding fractions of MD rema-nence are 5–13% based on theMrs/Ms ratio of 0.019for MD and 0.5 for SD (Parry, 1965; Dunlop, 2002a).
The MD content can also be estimated by applyingLTD treatment of NRM at liquid nitrogen temperaturein the LTD-DHT Shaw experiments (see Section3.1).LTD treatment erases the MD component of titanium-poor titanomagnetites (e.g.Ozima et al., 1964; Heideret al., 1992), and is thus expected to be effective forthe present samples, the main phase of which is con-sidered to be titanium-poor titanomagnetite. The ratiosof the LTD-erased component to the initial NRM in-tensity are listed as LTD ratios inTable 2. Accordingto those ratios, the MD remanences are estimated to be10–17% of the initial NRM, except for specimen A-11-2 (about 30%). These MD remanence fractions arenot discordant with those estimated from the SD + MDmixing model (Fig. 3(a)).
stict m-b n ofe MDm rg es ofi byn
ida-t D)m er-p ,2 ingl ins,s atu-r no-m neticm
For volcanic rocks other than hot-spot basalts, hys-teresis properties of the Oshima 1986 lava (Mochizukiet al., 2004) and the Mt. Etna lavas (Calvo et al., 2002)are plotted inFig. 3(b). They are distributed generallybetween the theoretical mixing lines and the cluster ofthe non-intermediate oxidation group of the Kilauealavas. According toMochizuki et al. (2004)andCalvoet al. (2002), those samples contain some amount of in-termediate oxidation grains and their Thellier palaeoin-tensities often resulted in overestimation by about 30%.It is inferred from Fig. 3(a) and (b) that the dis-tance of samples from the SD + MD (or PSD/SD + MD)mixing lines on the Day plot can be utilised asan index of the sample pre-selection in the Thellierexperiment.
4.2. Reasons for the broad applicability of theLTD-DHT Shaw method
The broad applicability of the LTD-DHT Shawmethod for samples with high-temperature oxidationand the possible causes of the erroneously high Thel-lier palaeointensities have been discussed in previousstudies.Yamamoto et al. (2003)suggested that the highThellier palaeointensities obtained for intermediateoxidation samples from the Kilauea 1960 lava werecaused by thermochemical remanent magnetisation(TCRM) during natural cooling. They also indicatedthat TCRM-affected samples could be efficientlyrejected based on the non-linearity of the relationi eTp nedf thee tinga ion,a tionc ringn toryh n onl ught int Ma sualT
m-pt un-
An alternative interpretation of the characterirend seen inFig. 3(a) is that the samples contain a nuer of PSD grains, as suggested by the distributioxperimental data points for PSDs around the SD +ixing lines (Dunlop, 2002a). It is noted that eitherain assemblage is reasonable for titanomagnetit
ntermediate oxidation levels, which are subdividedumerous ilmenite lamellae.
The cluster of data for the non-intermediate oxion group shifts from the SD + MD (or PSD/SD + Mixing lines towards regions of mixtures with suparamagnetic (SP) grains, as shown byDunlop (2002a002b). Therefore, the samples distant from the mix
ine possibly contain significant amounts of SP grauggesting that severe thermal alteration during nal cooling may produce SP-sized domains in titaagnetites and/or new SP particles in paramaginerals.
n the NRM–TRM1* diagram or non-unity of thRM1–TRM2* relation.Mochizuki et al. (2004)im-lied that the high Thellier palaeointensities obtai
or the Oshima 1986 lava could be attributed toffect of thermal alteration during laboratory heat low temperatures. According to their interpretatn intermediate degree of high-temperature oxidaould mean that oxidation may have stopped duatural cooling and then restarted during laboraeating. Whereas the effects of thermal alteratio
aboratory-induced TRMs can be corrected throhe application of the ARM correction techniquehe LTD-DHT Shaw method, the effects on NRnd pTRMs are sometimes undetectable by the uhellier method (Mochizuki et al., 2004).
If the high Thellier values are attributed to MD coonents (e.g.Levi, 1977; Xu and Dunlop, 1995), LTD
reatment and AF demagnetisation may in fact co
256 Y. Oishi et al. / Physics of the Earth and Planetary Interiors 149 (2005) 243–257
teract possible MD effects on NRM, TRM and ARMin the LTD-DHT Shaw experiment. In the case of PSDeffects (e.g.Kosterov and Prevot, 1998), the coerciv-ity spectra of ARM and TRM may reflect the physicalchange of PSD grains during laboratory heating, thusrendering the PSD effect detectable or correctable inthe LTD-DHT Shaw method.
Magnetic interaction between different phases (e.g.Mankinen and Champion, 1993) or different domains(e.g.Mochizuki et al., 2004) may also be a cause ofthe high Thellier values. In this regard, the LTD-DHTShaw procedure for obtaining the full TRM by heatingsamples above their Curie temperatures and cooling toroom temperature in a constant dc field appears to bemore analogous to the natural process than the step-wise heating and cooling cycles applied for pTRM ac-quisition in the Thellier experiment, where the pTRMdirection induced by the applied laboratory field is notusually parallel to the remaining NRM direction. Bythis analogy, the magnetic interaction during naturalcooling appears to be followed more closely by theLTD-DHT Shaw method than by the Thellier method,although the details remain unclear.
5. Conclusions
The LTD-DHT Shaw method for determiningpalaeointensities was applied to five block samplesfrom a massive section of the Kilauea 1970 lava. Re-s aredf ten-s ntw 970( -D h-t
ap-p locks nts.S iteria,a s var-i s4 n-d ctedv neb ten-s n
were found to contain titanomagnetites of intermedi-ate high-temperature oxidation level with oxidation in-dices of III–V. Excluding the palaeointensities of thosespecimens, the average by the Thellier method becamecloser to the expected value with a smaller standard de-viation (37.9± 1.7�T, N= 5). Therefore, the Thelliermethod is valid at least for non-intermediate oxidationsamples from the Kilauea 1970 lava.
Finally, samples lying close to the SD + MD (orPSD/SD + MD) mixing lines on the Day plot werefound to give erroneously high Thellier palaeointen-sities. This relationship may therefore be a potentialpre-selection criterion for application of the Thelliermethod.
Acknowledgements
The authors thank Yozo Hamano (University ofTokyo) and Arata Yoshihara (Toyama University) forassistance with rock magnetic measurements. Grati-tude is also extended to John Shaw and anonymousreferee for valuable comments.
References
Biggin, A., Thomas, D.N., 2003. The application of acceptancecriteria to results of Thellier palaeointensity experiments per-formed on samples with pseudo-single-domain-like characteris-
C ingstudyInt.
C arth’sauselectr.
C ale-and
B 83,
D f ti-Phys.
D /Msmag-0486.
D /Msand
.
ults were obtained for 11 of the 12 specimens preprom those samples, yielding an average palaeoinity of 38.2± 2.8�T (N= 11). This result is consisteith the expected value determined from DGRF 1
35.8�T) at the 1σ level, demonstrating that the LTDHT Shaw method is valid for a wide range of hig
emperature oxidation states.Coe’s version of the Thellier method was also
lied to nine specimens prepared from the same bamples used in the LTD-DHT Shaw experimeeven of the specimens passed the selection crnd the palaeointensities of the passed specimen
ed widely, from 35.5 to 55.4�T. The average wa3.2± 8.4�T (N= 7), which due to the large staard deviation is also consistent with the expealue at the 1σ level. Passed specimens from olock sample yielded anomalously high palaeoinities of 52.1 and 55.4�T, and on further inspectio
tics. Phys. Earth Planet. Inter. 138, 279–287.alvo, M., Prevot, M., Perrin, M., Riisager, J., 2002. Investigat
the reasons for the failure of palaeointensity experiments: aon historical lava flows from Mt. Etna (Italy). Geophys. J.149, 44–63.
oe, R.S., 1967. The determination of paleointensities of the Emagnetic field with emphasis on mechanisms which could cnon-ideal behavior in Thellier’s method. J. Geomagn. Geoe19, 157–179.
oe, R.S., Gromme, S., Mankinen, E.A., 1978. Geomagnetic pointensities from radiocarbon-dated lava flows on Hawaiithe question of the Pacific nondipole low. J. Geophys. Res.1740–1756.
ay, R., Fuller, M., Schmidt, V.A., 1977. Hysteresis properties otanomagnetites: grain-size and compositional dependence.Earth Planet. Inter. 13, 260–267.
unlop, D.J., 2002a. Theory and application of the Day plot (Mrsversus Hcr/Hc). 1. Theoretical curves and tests using titanonetite data. J. Geophys. Res. B 107, doi:10.1029/2001JB00
unlop, D.J., 2002b. Theory and application of the Day plot (Mrsversus Hcr/Hc). 2. Application to data for rocks, sediments,soils. J. Geophys. Res. B 107, doi:10.1029/2001JB000487
Y. Oishi et al. / Physics of the Earth and Planetary Interiors 149 (2005) 243–257 257
Heider, F., Dunlop, D.J., Soffel, H.C., 1992. Low-temperature andalternating field demagnetization of saturation remanence andthermoremanence in magnetite grains (0.037�m to 5 mm). J.Geophys. Res. B 97, 9371–9381.
Kirschvink, J.L., 1980. The least-squares line and plane and the anal-ysis of paleomagnetic data. Geophys. J. Roy. Astrol. Soc. 62,699–718.
Kono, M., 1978. Reliability of palaeointensity methods using alter-nating field demagnetization and anhysteretic remanences. Geo-phys. J. Roy. Astrol. Soc. 54, 241–261.
Kono, M., Hamano, Y., Nishitani, T., Tosha, T., 1984. A new spin-ner magnetometer: principles and techniques. Geophys. J. Roy.Astrol. Soc. 67, 217–227.
Kono, M., Kitagawa, H., Tanaka, H., 1997. Use of automatic spin-ner magnetometer–AF demagnetizer system for magnetostratig-raphy and paleosecular variation studies. In: Eighth ScientificAssembly IAGA, Uppsala.
Kosterov, A.A., Prevot, M., 1998. Possible mechanisms causing fail-ure of Thellier palaeointensity experiments in some basalts. Geo-phys. J. Int. 134, 554–572.
Levi, S., 1977. The effect of magnetite particle size on paleointensitydeterminations of the geomagnetic field. Phys. Earth Planet. Inter.13, 245–259.
Mankinen, E.A., Champion, D.E., 1993. Broad trends in geomag-netic paleointensity on Hawaii during Holocene time. J. Geophys.Res. B 98, 7959–7976.
Mochizuki, N., Tsunakawa, H., Oishi, Y., Wakai, S., Wakabayashi,K., Yamamoto, Y., 2004. Palaeointensity study of the Oshima1986 lava in Japan: implications for the reliability of the Thellierand LTD-DHT Shaw methods. Phys. Earth Planet. Inter. 146,395–416.
Ozima, M., Ozima, M., Akimoto, S., 1964. Low temperature charac-teristics of remanent magnetization of magnetite—self-reversaland recovery phenomena of remanent magnetization. J. Geo-magn. Geoelectr. 16, 165–177.
P pow-
R neticarth
Rolph, T.C., Shaw, J., 1985. A new method of paleofield magnitudecorrection for thermally altered samples and its application toLower Carboniferous lavas. Geophys. J. Roy. Astrol. Soc. 80,773–781.
Selkin, P.A., Tauxe, L., 2000. Long-term variations in palaeointen-sity. Phil. Trans. Roy. Soc. London, Ser. A 358, 1065–1088.
Shaw, J., 1974. A new method of determining the magnitude ofthe palaeomagnetic field: application to five historic lavas andfive archaeological samples. Geophys. J. Roy. Astrol. Soc. 39,133–141.
Tanaka, H., Kono, M., 1991. Preliminary results and reliability ofpalaeointensity studies on historical and14C dated Hawaiianlavas. J. Geomagn. Geoelectr. 43, 375–388.
Thellier, E., Thellier, O., 1959. Sur l’intensite du champ magnetiqueterrestre dans le passe historique et geologique. Ann. Geophys.15, 285–376.
Tsunakawa, H., Shaw, J., 1994. The Shaw method of palaeointen-sity determinations and its application to recent volcanic rocks.Geophys. J. Int. 118, 781–787.
Tsunakawa, H., Shimura, K., Yamamoto, Y., 1997. Application ofdouble heating technique of the Shaw method to the Brunhesepoch volcanic rocks. In: Eighth Scientific Assembly IAGA, Up-psala.
Valet, J.-P., 2003. Time variations in geomagnetic intensity. Rev.Geophys. 41, 1004, doi:10.1029/2001RG000104.
Watkins, N.D., Haggerty, S.E., 1967. Primary oxidation variation andpetrogenesis in a single lava. Contr. Miner. Petrol. 15, 251–271.
Wilson, R.L., Watkins, N.D., 1967. Correlation of petrology andnatural magnetic polarity in Columbia Plateau basalts. Geophys.J. Roy. Astrol. Soc. 12, 405–424.
Xu, S., Dunlop, D.J., 1995. Thellier paleointensity determinationusing PSD and MD grains (abstr.). Eos Trans. Am. Geophys.Union 76 (suppl.), F170.
Yamamoto, Y., Shimura, K., Tsunakawa, H., Kogiso, T., Uto, K.,Barsczus, H.G., Oda, H., Yamazaki, T., Kikawa, E., 2002. Geo-
ciety02.
Y nsityuses76.
arry, L.G., 1965. Magnetic properties of dispersed magneticders. Phil. Mag. 11, 303–312.
iisager, P., Riisager, J., 2001. Detecting multidomain maggrains in Thellier palaeointensity experiments. Phys. EPlanet. Inter. 125, 111–117.
magnetic paleosecular variation for the past 5Ma in the SoIslands, French Polynesia. Earth Planets Space 54, 797–8
amamoto, Y., Tsunakawa, H., Shibuya, H., 2003. Palaeointestudy of the Hawaiian 1960 lava: implications for possible caof erroneously high intensities. Geophys. J. Int. 153, 263–2