validation of the dermal exposure model in...
TRANSCRIPT

Annals of Work Exposures and Health, 2017, Vol. 61, No. 7, 854–871doi: 10.1093/annweh/wxx059
Advance Access publication 25 July 2017Original Article
© The Author 2017. Published by Oxford University Press on behalf of the British Occupational Hygiene Society.
Original Article
Validation of the dermal exposure model in ECETOC TRAHans Marquart1, Remy Franken2, Henk Goede2, Wouter Fransman2, and Jody Schinkel2,*1Triskelion BV, Utrechtseweg 48, 3704 HE Zeist, The Netherlands; 2TNO, Utrechtseweg 48, 3704 HE Zeist, The Netherlands
*Author to whom correspondence should be addressed. [email protected]
Submitted 23 December 2016; revised 5 May 2017; editiorial decision 5 May 2017; revised version accepted 27 June 2017.
Abstract
The ECETOC TRA model (presently version 3.1) is often used to estimate worker inhalation and der-mal exposure in regulatory risk assessment. The dermal model in ECETOC TRA has not yet been vali-dated by comparison with independent measured exposure levels. This was the goal of the present study. Measured exposure levels and relevant contextual information were gathered via literature search, websites of relevant occupational health institutes and direct requests for data to industry. Exposure data were clustered in so-called exposure cases, which are sets of data from one data source that are expected to have the same values for input parameters in the ECETOC TRA dermal exposure model. For each exposure case, the 75th percentile of measured values was calculated, because the model intends to estimate these values. The input values for the parameters in ECETOC TRA were assigned by an expert elicitation and consensus building process, based on descriptions of relevant contextual information.
From more than 35 data sources, 106 useful exposure cases were derived, that were used for direct comparison with the model estimates. The exposure cases covered a large part of the ECETOC TRA dermal exposure model. The model explained 37% of the variance in the 75th percentiles of measured values. In around 80% of the exposure cases, the model estimate was higher than the 75th percentile of measured values. In the remaining exposure cases, the model estimate may not be suf-ficiently conservative.
The model was shown to have a clear bias towards (severe) overestimation of dermal exposure at low measured exposure values, while all cases of apparent underestimation by the ECETOC TRA der-mal exposure model occurred at high measured exposure values. This can be partly explained by a built-in bias in the effect of concentration of substance in product used, duration of exposure and the use of protective gloves in the model. The effect of protective gloves was calculated to be on average a factor of 34 in this data set, while factors of five to ten were used in the model estimations. There was also an effect of the sampling method in the measured data on the exposure levels. Exposure cases where sampling was done via an interception method, such as gloves, on average showed a
Downloaded from https://academic.oup.com/annweh/article-abstract/61/7/854/4036173/Validation-of-the-dermal-exposure-model-in-ECETOCby Wouter Fransmanon 07 September 2017

Annals of Work Exposures and Health, 2017, Vol. 61, No. 7 855
factor of six higher 75th percentiles of measured values than exposure cases where sampling was done via a removal method, such as hand washing. This may partly be responsible for the apparent underestimation of dermal exposure by the model at high exposure values. However, there also appeared to be a relation between expected exposure level (as indicated by the model estimate) and the choice of sampling method.
In this study, solid substances used in liquid products were treated as liquids with negligible vola-tility. The results indicate that the ECETOC TRA dermal exposure model performs equally well for these substances as for liquids. There were suggestions of a difference in performance of the model between solids and liquids.
For several parts of the ECETOC TRA dermal model, no or hardly any measured dermal exposure data were available. Therefore, gathering of more dermal exposure levels is recommended, specifi-cally for situations not yet sufficiently covered in the present data set.
Keywords: Dermal exposure; exposure model; ECETOC TRA; validation
Introduction
The ECETOC Targeted Risk Assessment tool is used widely as a tool for assessing worker, consumer and environmen-tal exposure to chemicals in the scope of regulatory risk assessments, specifically in Regulation (EC) No 1907/2006 concerning the Registration, Evaluation, Authorisation and Restriction of Chemicals (REACH). The tool (now in ver-sion 3.1) contains a model that estimates dermal exposure level for workers in relation to the processes or activities done with a substance or product. This model is largely based on the model Estimation and Assessment of Sub-stance Exposure (EASE; Tickner et al., 2005). It has, as far as we know, not been validated with independent measured dermal exposure data. This publication describes a study intending to validate the ECETOC TRA dermal exposure model with independent dermal exposure measurements, previously gathered for other purposes.
The dermal model in ECETOC TRAThe ECETOC TRA tool has been described in a number of consecutive ECETOC Technical Reports, via which the development of the model to the present version can be followed (ECETOC, 2004, 2009, 2012, 2014). Its pur-pose and development has also been described by Money et al. (2014). The model is a so-called ‘Tier 1’ model, which is designed to have a relatively simple set-up, does not require many inputs or include many exposure modifiers. It intends to provide a conservative estimation of exposure levels for a first assessment, which can, if needed, be followed by a more in-depth assessment by a more complex model, or by measured data.
The ECETOC TRA dermal exposure model estimates dermal exposure to the hands and, in some cases, part of the forearms. Table 1 presents the dermal exposure modifiers in ECETOC TRA v3.1.
The model has basic estimates for the PROCs 1 to 25 of the ECHA Guidance (ECHA, 2015). Because there are two PROCs 8 (PROC8a and PROC8b) with separate estimates in the model, there are 26 PROCs to choose from in total. The model does not provide estimates for PROCs 26 to 28, which have been added to the PROC-system recently.
Although the ECETOC TRA model has a wide scope, there are limits to the applicability domain of the model, that are described in the different ECETOC Technical Reports mentioned before. The model is not intended to estimate exposures to certain types of substances or the guidance documents state that confirmation by mea-sured data is required for these substances, e.g. for car-cinogens or potent contact allergens.
Methods
Dermal exposure studiesFor this study, only already existing dermal exposure measurements were collected, which had not been pre-viously used for the development of the ECETOC TRA. A literature search was conducted, using the search terms ‘dermal OR skin AND exposure AND work’ and addi-tionally the search terms dust, volatiles and pesticides were used. Several journals known to publish results of occupational exposure measurements, as well as PubMed, Google scholar and websites of a number of occupational health institutes, such as NIOSH, were searched. Also, with the help of the European Centre for Exotoxicology and Toxicology of Chemicals (ECETOC), 42 companies that are a member of ECETOC and the European Chemi-cal Industry Council (Cefic) were contacted and requested to submit dermal exposure measurements as well.
A substantial amount of contextual data with the measurements were included, including year of sampling,
Downloaded from https://academic.oup.com/annweh/article-abstract/61/7/854/4036173/Validation-of-the-dermal-exposure-model-in-ECETOCby Wouter Fransmanon 07 September 2017
856 Annals of Work Exposures and Health, 2017, Vol. 61, No. 7
vapour pressure, hazard classification, the activity or pro-cess performed, duration of the activity, the number and duration of measurements and surface area sampled. All information related to the parameters in the ECETOC TRA model was considered to be critical information. If no vapour pressure was reported for a liquid substance, the vapour pressure was searched for by the researchers in relevant sources, such as the database of registered substances at the European Chemical Agency, or in safety datasheets. If no exact vapour pressure was found, but the value was reported as ‘non-volatile’ or ‘< 0.1 Pa’, the vapour pressure category negligible was assigned. If no information on dustiness was available, which is quite
common, it was assumed that the substance had a high dustiness, unless there was specific data indicating a lower dustiness. For example, if a substance was reported to be in the form of pellets or granules, or if the substance was used in a moist form, a low dustiness was assigned. Whether or not an exposure setting was industrial or professional, was hardly ever reported. However, it was considered that this parameter could be assigned via the expert elicitation process, so no prior choices were made.
Since ECETOC TRA only estimates exposure to the surface area of hands and, in some cases forearms, only studies containing measurements on hands and forearms were collected. If studies also included measurements on
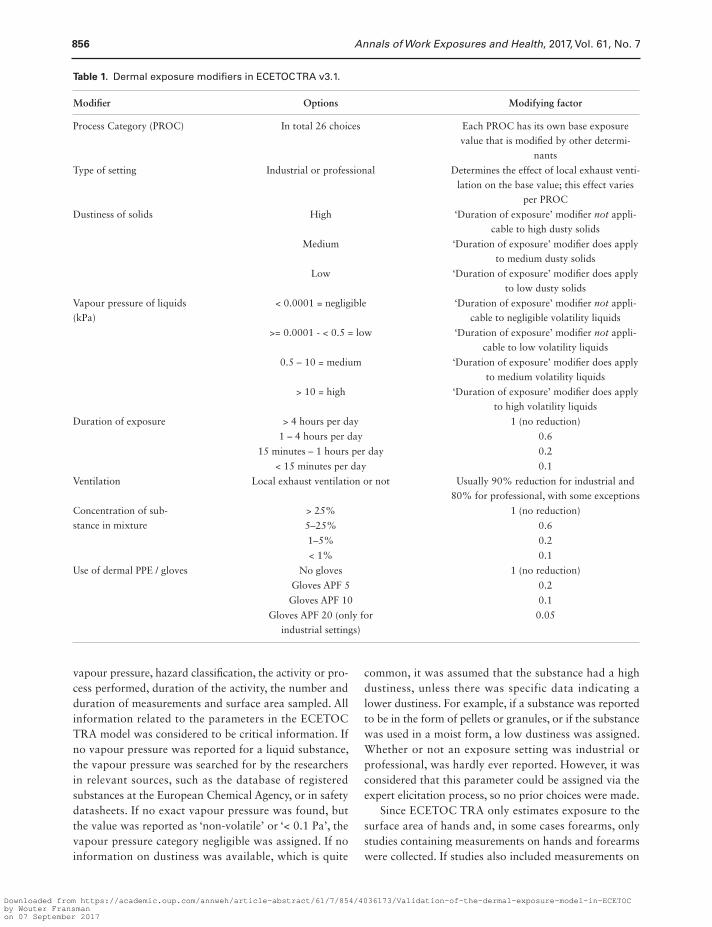
Table 1. Dermal exposure modifiers in ECETOC TRA v3.1.
Modifier Options Modifying factor
Process Category (PROC) In total 26 choices Each PROC has its own base exposure
value that is modified by other determi-
nants
Type of setting Industrial or professional Determines the effect of local exhaust venti-
lation on the base value; this effect varies
per PROC
Dustiness of solids High ‘Duration of exposure’ modifier not appli-
cable to high dusty solids
Medium ‘Duration of exposure’ modifier does apply
to medium dusty solids
Low ‘Duration of exposure’ modifier does apply
to low dusty solids
Vapour pressure of liquids
(kPa)
< 0.0001 = negligible ‘Duration of exposure’ modifier not appli-
cable to negligible volatility liquids
>= 0.0001 - < 0.5 = low ‘Duration of exposure’ modifier not appli-
cable to low volatility liquids
0.5 – 10 = medium ‘Duration of exposure’ modifier does apply
to medium volatility liquids
> 10 = high ‘Duration of exposure’ modifier does apply
to high volatility liquids
Duration of exposure > 4 hours per day 1 (no reduction)
1 – 4 hours per day 0.6
15 minutes – 1 hours per day 0.2
< 15 minutes per day 0.1
Ventilation Local exhaust ventilation or not Usually 90% reduction for industrial and
80% for professional, with some exceptions
Concentration of sub-
stance in mixture
> 25% 1 (no reduction)
5–25% 0.6
1–5% 0.2
< 1% 0.1
Use of dermal PPE / gloves No gloves 1 (no reduction)
Gloves APF 5 0.2
Gloves APF 10 0.1
Gloves APF 20 (only for
industrial settings)
0.05
Downloaded from https://academic.oup.com/annweh/article-abstract/61/7/854/4036173/Validation-of-the-dermal-exposure-model-in-ECETOCby Wouter Fransmanon 07 September 2017
Annals of Work Exposures and Health, 2017, Vol. 61, No. 7 857
other body parts, only the measurements of hands and forearms were used and the measurements for other body parts were disregarded.
All exposure data, for which the critical information (see above) was available, was divided into ‘exposure cases’. The intention was to ensure that all data points from a single study that have the same input values in the ECETOC TRA model would be within the same exposure case, while data points with different values for model parameters would be in different exposure cases. If only ranges were given for factors, such as dura-tion of measurement or concentration of substance in the product, and if no differentiation was possible on the basis of the published data, the data was kept within one exposure case, even if the input values for the relevant ECETOC TRA parameter would span more than one category.
The translation of available information into input values for the model was done via an expert elicitation process. Experienced exposure assessors were suggested and contacted by the Monitoring Team of the project (representatives of ECETOC and Cefic) and the project team. The experts met the following criteria; the experts were familiar with the TRA and its stated domain, all the experts had undertaken REACH Chemical safety assess-ments (CSAs) for a substantial number of substances and scenarios, had advanced education and more than 5 years professional experience in occupational health. All the assessors had direct involvement in preparing or reviewing exposure scenarios for REACH substance registrations using the ECETOC TRA. The expert group was composed of individuals with field knowledge of differing industrial operations. Many of the assessors contributed to the authorship of the relevant REACH Guidance (Ch R12 and R14), and most of the assessors were active in the ECHA ENES Network that, in part, is aimed at facilitating harmonization in the REACH processes for exposure assessment. Twenty experts were contacted and sixteen actually participated in the expert elicitation process. The participating experts were split into four groups. Each group received a quarter of the originally derived exposure cases. Descriptions of the exposure cases were sent to the experts, but the litera-ture reference and the measured exposure levels were not provided, to prevent a bias in the assignment of inputs from knowledge of the exposure levels. Because of the number of exposure cases, four sets of exposure cases were made and each set was considered by four experts. Each expert separately assigned input values to model parameters of ECETOC TRA, based on the descriptions. If three or four experts assigned the same value for a parameter, this was considered to be the consensus value
and that value was used in the model estimations. All exposure cases and parameters for which less than three experts assigned the same input value were discussed in a telephone conference by the project team and the Monitoring Team to reach consensus on the inputs. If no consensus could be reached in the telephone conference, the exposure case was removed from the final data set. Where values for factors, such as duration of exposure, spanned more than one category in the ECETOC TRA model, it was decided to assign that input value that would lead to the highest exposure estimate to make conservative estimates for parameters with uncertain values.
For solid substances used in liquid products, in the consensus process the substance was always considered to be a liquid with negligible vapour pressure.
Because of a lack of information on the regime of glove use in the descriptions of the studies, the experts were only asked to assign ‘yes’ or ‘no’ measurement underneath protective gloves. The ECETOC TRA model itself uses protection factors between 5 and 20 if gloves are assumed to be used, depending on professional or industrial setting and on whether training and manage-ment supervision is in place. In the estimation of expo-sure levels in this study, default protection factors of 5 (80% reduction) for professional situations and 10 (90% reduction) for industrial situations were taken into account.
Comparison of model estimates with measured exposureThe ECETOC TRA model intends to estimate the 75th percentile of the exposure distribution for the situation that is assessed. Therefore, the 75th percentile was also calculated from the measured data for each exposure case. First, if necessary, the unit of measurement was transformed to the unit used in ECETOC TRA (mg ∙ kg-1 ∙ day-1). Especially in case of small datasets the point esti-mate of the 75th-percentile could be uncertain. There-fore, we also calculated the 90% confidence intervals (CI) around the calculated 75th-percentile. This was done by using a simulation study, with 1.000 replications of N (number of measurements in the dataset) simulated val-ues per replication. For each replication the 75th-percen-tile was calculated based on geometric mean (GM) and geometric standard deviation (GSD) of the simulated (n) measurements. The lower bound of the 90% CI of the 75th-percentile is the 5th percentile of the 1000 simulated 75-percentiles, and the upper bound is the 95th percentile of these 1000 simulated percentiles. Next to the direct comparison of model estimates and 75th percentiles of measured values, the influence of model parameters, or
Downloaded from https://academic.oup.com/annweh/article-abstract/61/7/854/4036173/Validation-of-the-dermal-exposure-model-in-ECETOCby Wouter Fransmanon 07 September 2017

858 Annals of Work Exposures and Health, 2017, Vol. 61, No. 7
the original values for the relevant factors, on the mea-sured dermal exposure levels as well as on the ratio between estimate and 75th percentile of measured values was analysed via multivariate analyses in SAS.
Results
Gathered exposure dataMore than 90 publications and reports were collected with measured dermal exposure levels. However, a large number of these sources did not have all the critical information (see above) and was therefore considered not to be useful for the derivation of exposure cases. After exclusion of studies with insufficient contextual data, a random selection of the many pesticide spray-ing studies was made to be included in the exposure cases. Because of the large number of pesticide (i.e. plant protection products and biocides) studies, many of which were for spraying, including all of them would lead to a too large influence of pesticide studies on the evaluation of the validity of the dermal part of ECE-TOC TRA. This was considered unwanted, also because ECETOC TRA is not intended to be used for exposure assessment for pesticides. Twelve studies were included that contained measurements on either plant protection products or biocides, of which seven included measure-ments of exposure at spraying activities. Eighteen stud-ies on plant protection products were not included, of which 17 were (mainly) on spraying activities. A total of 35 reports and publications remained that were used to derive exposure cases in this study. Three out of 42 contacted industrial partners have provided useful data sources.
Originally, the project team described 125 exposure cases. However, in the expert elicitation process and consensus forming on inputs for the ECETOC TRA model, 15 of these cases were excluded, because no consensus could be reached, largely because it was con-sidered that the exposure situation was too complex or too unclear to allow assignment of input values for the model. Table 2 provides some information on the state of substance, sector of use, product type and technical or economical function of the substances studied of the remaining cases.
Furthermore, in three exposure cases, no 75th per-centile could be calculated, because there was only one measurement, while in one exposure case a PROC was assigned for which ECETOC TRA does not make an exposure estimate. Therefore, 106 exposure cases remained for the actual comparison of model and mea-sured data. In total, these cases included more than 1700 separate data points.
A full list of publications and reports from which exposure cases were derived is given in the References.
Inputs for the ECETOC TRA model in the exposure casesAn overview of the frequency of inputs of the ECE-TOC TRA model for the exposure cases is presented in Table 3.
Full consensus between at least three (out of four) experts assigning input values in the separate written process for all parameters of ECETOC TRA occurred in only 27 exposure cases (25%). The parameter for which consensus was most often lacking was the PROC, with 38% of exposure cases without consensus in the written process. Another parameter with a substantial lack of consensus was the vapour pressure or dustiness category with lack of consensus in 36% of exposure cases.
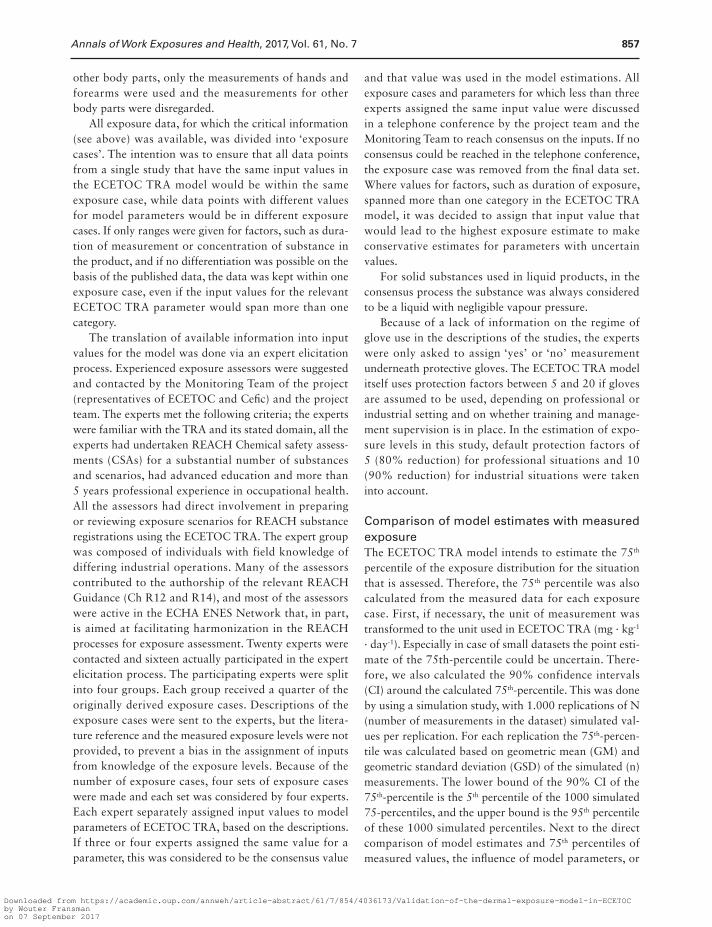
Comparison of the model estimates with the measured valuesThe comparison between model estimates and 75th per-centiles of measured values is visualized in Figure 1.
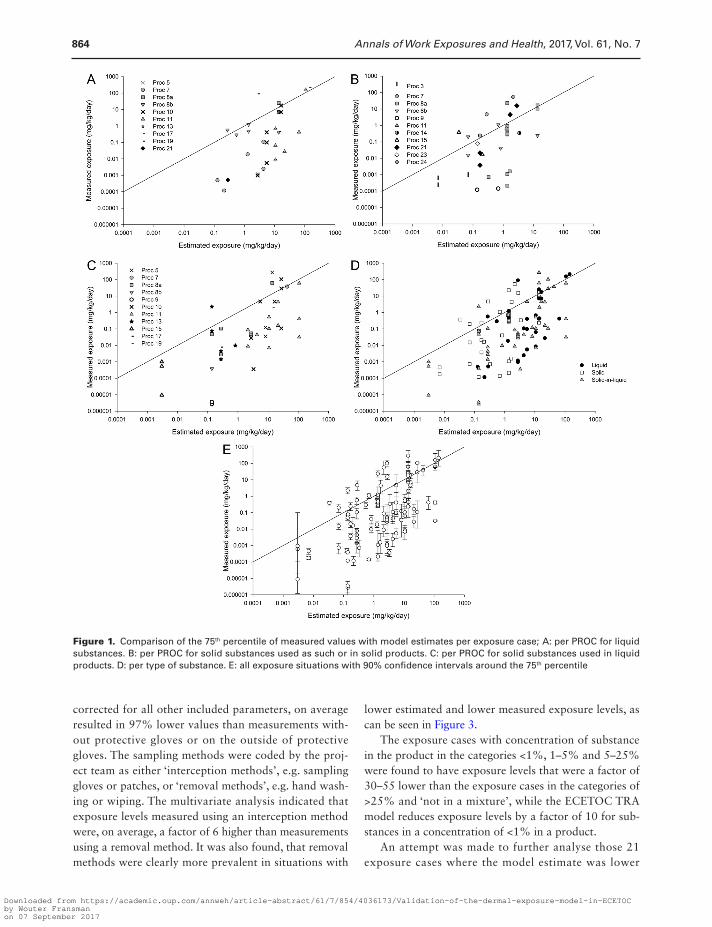
The distribution of ratios between model estimate and 75th percentile of measured value are given in Figure 2. The 90% CI’s around the calculated 75th per-centile are also presented. In 3 out of 106 cases it was not possible to calculate this 90% CI because the refer-ence source presented only the 75th percentile and not the GM and GSD.
Both Figure 1 and Figure 2 show, that in the major-ity of exposure cases (80%) the model estimate is higher than the corresponding 75th percentile of measured val-ues. Taking into account the confidence intervals of the 75-percentile this fraction was 85%. For more than 50% of the exposure cases, the model estimate is more than ten times the corresponding point estimate of the 75th percentile of measured values taking only into account the point estimate.
There was a positive relation between model esti-mates and 75th percentiles of measured values. Approxi-mately 37% of the variance in the total dataset was explained by the ECETOC TRA model. For separate states of substances, this varied between 28% for solids and 46% for solids in liquid products.
A separate statistical multivariate model, that pro-vided the best fit of the 75th percentile of measured values, included the following significant determinants: PROC, concentration of substance in product, use of gloves and sampling method. This statistical model explained 62% of the total variance in the dataset. The average effect of gloves, according to this statistical model, was a factor of 34, i.e. measurements underneath protective gloves,
Downloaded from https://academic.oup.com/annweh/article-abstract/61/7/854/4036173/Validation-of-the-dermal-exposure-model-in-ECETOCby Wouter Fransmanon 07 September 2017

Annals of Work Exposures and Health, 2017, Vol. 61, No. 7 859
Table 2. Information on type of substance, sector of use, type of product and technical or economical function of the substances in the exposure cases.
Type of substance, sector of use, product type of function of substance
No. exposure cases More detailed description
Type of measured substance
Solid 37 Solid substance used as such or in a solid product
Solid-in-liquid 43 Solid substance used in a liquid product
Liquid 30 Liquid substance
Sector of use
SU0: Other 10 Residential settings and public buildings
1 Car wash facility
7 Experimental setting
Formulation (of chemical products) 7 E.g. manufacture of paints or cleaning agents
SU1: Agriculture, forestry, fishery 10 Agriculture
SU4: Manufacture of food products 5 Includes slaughterhouses
SU6a: Manufacture of wood and wood
products
3 Wood treatment
SU7: Printing and reproduction of recorded
media
2 Printing (silk screen)
SU8: Manufacture of bulk, large scale chemi-
cals (including petroleum products)
9 Refueling stations included
SU9: Manufacture of fine chemicals 7 Pharmaceutical industry
SU11: Manufacture of rubber products 1
SU12: Manufacture of plastics products,
including compounding and conversion
1 Reinforced polyester products
SU14: Manufacture of basic metals, including
alloys
13 Including manufacture of inorganic metal chemicals
and an iron foundry
SU17: General manufacturing, e.g. machinery,
equipment, vehicles, other transport equip-
ment
6 Car body repair shops
10 Ship building
12 Metal products industry, vehicle industry, excluding
ship building and car body repair shops
SU20: Health services 7 Hospitals
Product type
PC9a: Coatings and paints, thinners, paint
removersa
27 Mainly paints
PC35: Washing and cleaning products 14 Cleaning agents, including graffiti removers
PC8: Biocidal productsa 24 Including wood preservatives, disinfectants and
antifouling paints
PC32: Polymer preparations and compounds 2 Resins
PC14: Metal surface treatment products 2 Electroplating products
PC25: Metal working fluids 2
PC13: Fuels 10
PC18: Ink and toners 2 Screen printing inks
PC27: Plant protection products 13
PC29: Pharmaceuticals 11
Technical or economical function of the substance
Biocide 24
Monomers, cross-linkers and similar 4
Pigments or fillers 12
Solvents or co-solvents 7
aWhere substances were used as biocide in antifouling paints, they have been counted both for paints and for biocidal products.
Downloaded from https://academic.oup.com/annweh/article-abstract/61/7/854/4036173/Validation-of-the-dermal-exposure-model-in-ECETOCby Wouter Fransmanon 07 September 2017

860 Annals of Work Exposures and Health, 2017, Vol. 61, No. 7
Tab
le 3
. O
verv
iew
of
the
nu
mb
er o
f ex
po
sure
cas
es a
nd
nu
mb
er o
f m
easu
red
exp
osu
re v
alu
es f
or
all i
np
ut
par
amet
ers
of
the
EC
ETO
C T
RA
mo
del
.
Ass
igne
d PR
OC
a
Indu
stri
al o
r pr
ofes
sion
al
sett
ingb
Tot
al n
umbe
r of
stu
dies
and
da
ta p
oint
s
Vap
our
pres
sure
(fo
r liq
uids
)D
usti
ness
(fo
r so
lids)
Dur
atio
n of
mea
sure
men
ts
Exp
osur
e ca
ses
No.
c<
0.01
Pa
0.01
- 5
00
Pa50
0 -
1000
0 Pa
> 10
000
PaL
owM
oder
ate
Hig
h<
15 m
in.
15 m
in -
1
hour
1 -
4 ho
urs
> 4
hour
s (d
efau
lt)
Phys
ical
sta
te: L
iqui
d
5Pr
ofes
sion
al1
31
\ 31
\ 3
7In
dust
rial
555
43
\ 542
2 \ 1
21
\ 114
3 \ 4
371
\ 3
8aIn
dust
rial
258
2 \ 5
81
\ 28
1 \ 3
0
8bIn
dust
rial
319
2 \ 8
1 \ 1
12
\ 81
\ 11
8bPr
ofes
sion
al2
291
\ 18
1 \ 1
11
\ 11
1 \ 1
8
10In
dust
rial
110
1 \ 1
01
\ 10
10Pr
ofes
sion
al5
107
4 \ 7
71
\ 30
1 \ 5
2 \ 6
62
\ 36
11Pr
ofes
sion
al6
712
\ 54
\ 66
1 \ 4
45
\ 27
13In
dust
rial
115
1 \ 1
51
\ 15
17In
dust
rial
118
1 \ 1
81
\ 18
19Pr
ofes
sion
al2
162
\ 16
1 \ 1
21
\ 4
21In
dust
rial
112
1 \ 1
21
\ 12
Phys
ical
sta
te: s
olid
3In
dust
rial
314
2\11
1 \ 3
3 \ 1
4
7In
dust
rial
123
1 \ 2
31
\ 23
8aIn
dust
rial
535
5 \ 3
52
\ 25
3 \ 1
0
8aPr
ofes
sion
al8
797\
691
\ 10
6 \ 6
62
\ 13
8bIn
dust
rial
637
1\4
1 \ 6
4 \ 2
71
\ 12
5 \ 2
5
9In
dust
rial
27
2 \ 7
1 \ 4
1 \ 3
11Pr
ofes
sion
al1
121\
121
\ 12
14In
dust
rial
13
1 \ 3
1 \ 3
15Pr
ofes
sion
al2
251
\ 16
1\9
2 \ 2
5
21In
dust
rial
422
3 \ 1
01
\ 12
1 \ 1
23
\ 10
23In
dust
rial
12
1 \ 2
1 \ 2
24In
dust
rial
238
2 \ 3
82
\ 38
26In
dust
rial
114
1 \ 1
41
\ 14
Downloaded from https://academic.oup.com/annweh/article-abstract/61/7/854/4036173/Validation-of-the-dermal-exposure-model-in-ECETOCby Wouter Fransmanon 07 September 2017

Annals of Work Exposures and Health, 2017, Vol. 61, No. 7 861
Ass
igne
d PR
OC
a
Indu
stri
al o
r pr
ofes
sion
al
sett
ingb
Tot
al n
umbe
r of
stu
dies
and
da
ta p
oint
s
Vap
our
pres
sure
(fo
r liq
uids
)D
usti
ness
(fo
r so
lids)
Dur
atio
n of
mea
sure
men
ts
Exp
osur
e ca
ses
No.
c<
0.01
Pa
0.01
- 5
00
Pa50
0 -
1000
0 Pa
> 10
000
PaL
owM
oder
ate
Hig
h<
15 m
in.
15 m
in -
1
hour
1 -
4 ho
urs
> 4
hour
s (d
efau
lt)
Phys
ical
sta
te: s
olid
-in-
liqui
d
5Pr
ofes
sion
al3
353
\ 35
1 \ 1
91
\ 71
\ 9
7In
dust
rial
112
1 \ 1
21
\ 12
8aIn
dust
rial
216
1 \ 1
01
\ 61
\ 61
\ 10
8aPr
ofes
sion
al5
793
\ 59
2 \ 2
04
\ 77
1 \ 2
8bIn
dust
rial
15
1 \ 5
1 \ 5
8bPr
ofes
sion
al1
81
\ 81
\ 8
9Pr
ofes
sion
al2
81
\ 41
\ 42
\ 8
10In
dust
rial
115
1 \ 1
51
\ 15
10Pr
ofes
sion
al6
446
\ 44
1 \ 6
5 \ 3
8
11Pr
ofes
sion
al11
189
11 \
189
1 \ 3
6 \ 1
154
\ 71
13In
dust
rial
379
3 \ 7
91
\ 25
1 \ 2
91
\ 25
13Pr
ofes
sion
al2
192
\ 19
2 \ 1
9
15In
dust
rial
12
1 \ 2
1 \ 2
15Pr
ofes
sion
al2
82
\ 82
\ 8
17In
dust
rial
17
1 \ 7
1 \ 7
19Pr
ofes
sion
al1
241
\ 24
1 \ 2
4
Ass
igne
d PR
OC
a
Indu
stri
al o
r pr
ofes
sion
al
sett
ingb
Tot
al n
umbe
r of
stu
dies
an
d da
ta p
oint
sC
once
ntra
tion
of
subs
tanc
e in
pro
duct
Loc
al e
xhau
st v
enti
lati
onG
love
s us
ed#
Exp
osur
e ca
ses
No.
c<
1%1
- 5%
5 -
25%
> 25
%no
t in
a
mix
ture
No
Yes
No
Yes
Phys
ical
sta
te: l
iqui
d
5Pr
ofes
sion
al1
31
\ 31
\ 31
\ 3
7In
dust
rial
555
42
\ 117
2 \ 4
281
\ 92
\ 12
3 \ 5
423
\ 231
2 \ 3
23
8aIn
dust
rial
258
1 \ 3
01
\ 28
2 \ 5
82
\ 58
8bIn
dust
rial
319
3 \ 1
93
\ 19
3 \ 1
9
8bPr
ofes
sion
al2
292
\ 29
2 \ 2
91
\ 18
1 \ 1
1
Tab
le 3
. C
ou
nti
ued
Downloaded from https://academic.oup.com/annweh/article-abstract/61/7/854/4036173/Validation-of-the-dermal-exposure-model-in-ECETOCby Wouter Fransmanon 07 September 2017

862 Annals of Work Exposures and Health, 2017, Vol. 61, No. 7
Ass
igne
d PR
OC
a
Indu
stri
al o
r pr
ofes
sion
al
sett
ingb
Tot
al n
umbe
r of
stu
dies
and
da
ta p
oint
sC
once
ntra
tion
of
subs
tanc
e in
pro
duct
Loc
al e
xhau
st v
enti
lati
onG
love
s us
ed#
Exp
osur
e ca
ses
No.
c<
1%1
- 5%
5 -
25%
> 25
%no
t in
a
mix
ture
No
Yes
No
Yes
10In
dust
rial
110
1 \ 1
01
\ 10
1 \ 1
0
10Pr
ofes
sion
al5
107
1 \ 3
61
\ 51
\ 30
2 \ 3
65
\ 107
3 \ 7
12
\ 36
11Pr
ofes
sion
al6
713
\ 49
1 \ 1
21
\ 31
\ 76
\ 71
6 \ 7
1
13In
dust
rial
115
1 \ 1
51
\ 15
1 \ 1
5
17In
dust
rial
118
1 \ 1
81
\ 18
1 \ 1
8
19Pr
ofes
sion
al2
161
\ 12
1 \ 4
2 \ 1
62
\ 16
21In
dust
rial
112
1 \ 1
21
\ 12
1 \ 1
2
Phys
ical
sta
te: s
olid
3In
dust
rial
314
2 \ 1
11
\ 31
\ 32
\ 11
3 \ 1
4
7In
dust
rial
123
1 \ 2
31
\ 23
1 \ 2
3
8aIn
dust
rial
535
2 \ 6
3 \ 2
93
\ 15
2 \ 2
02
\ 25
3 \ 1
0
8aPr
ofes
sion
al8
792
\ 13
1 \ 1
95
\ 47
8 \ 7
97
\ 72
1 \ 7
8bIn
dust
rial
637
6 \ 3
72
\ 10
4 \ 2
72
\ 18
4 \ 1
9
9In
dust
rial
27
1 \ 3
1 \ 4
2 \ 7
2 \ 7
11Pr
ofes
sion
al1
121
\ 12
1 \ 1
21
\ 12
14In
dust
rial
13
1 \ 3
1 \ 3
1 \ 3
15Pr
ofes
sion
al2
251
\ 16
1 \ 9
2 \ 2
52
\ 25
21In
dust
rial
422
3 \ 1
01
\ 12
4 \ 2
22
\ 14
2 \ 8
23In
dust
rial
12
1 \ 2
1 \ 2
1 \ 2
24In
dust
rial
238
1 \ 9
1 \ 2
92
\ 38
1 \ 9
1 \ 2
9
26In
dust
rial
114
1 \ 1
41
\ 14
1 \ 1
4
Phys
ical
sta
te: s
olid
-in-
liqui
d
5Pr
ofes
sion
al3
352
\ 26
1 \ 9
3 \ 3
53
\ 35
7In
dust
rial
112
1 \ 1
21
\ 12
1 \ 1
2
8aIn
dust
rial
216
1 \ 6
1 \ 1
02
\ 16
1 \ 1
01
\ 6
8aPr
ofes
sion
al5
792
\ 20
2 \ 5
81
\ 15
\ 79
3 \ 5
92
\ 20
8bIn
dust
rial
15
1 \ 5
1 \ 5
1 \ 5
8bPr
ofes
sion
al1
81
\ 81
\ 81
\ 8
9Pr
ofes
sion
al2
82
\ 82
\ 82
\ 8
Tab
le 3
. C
ou
nti
ued
Downloaded from https://academic.oup.com/annweh/article-abstract/61/7/854/4036173/Validation-of-the-dermal-exposure-model-in-ECETOCby Wouter Fransmanon 07 September 2017

Annals of Work Exposures and Health, 2017, Vol. 61, No. 7 863
Ass
igne
d PR
OC
a
Indu
stri
al o
r pr
ofes
sion
al
sett
ingb
Tot
al n
umbe
r of
stu
dies
and
da
ta p
oint
sC
once
ntra
tion
of
subs
tanc
e in
pro
duct
Loc
al e
xhau
st v
enti
lati
onG
love
s us
ed#
Exp
osur
e ca
ses
No.
c<
1%1
- 5%
5 -
25%
> 25
%no
t in
a
mix
ture
No
Yes
No
Yes
10In
dust
rial
115
1 \ 1
51
\ 15
1 \ 1
5
10Pr
ofes
sion
al6
441
\ 61
\ 15
4 \ 2
36
\ 44
4 \ 2
12
\ 23
11Pr
ofes
sion
al11
189
5 \ 5
82
\ 86
2 \ 3
52
\ 10
10 \
160
1 \ 2
98
\ 156
3 \ 3
3
13In
dust
rial
379
1 \ 2
51
\ 29
1 \ 2
52
\ 54
1 \ 2
53
\ 79
13Pr
ofes
sion
al2
192
\ 19
2 \ 1
92
\ 19
15In
dust
rial
12
1 \ 2
1 \ 2
1 \ 2
15Pr
ofes
sion
al2
82
\ 82
\ 82
\ 8
17In
dust
rial
17
1 \ 7
1 \ 7
1 \ 7
19Pr
ofes
sion
al1
241
\ 24
1 \ 2
41
\ 24
a)M
eani
ng o
f th
e PR
OC
s (a
ccor
ding
to
EC
HA
, 201
5):
3: M
anuf
actu
re o
r fo
rmul
atio
n in
the
che
mic
al in
dust
ry in
clo
sed
batc
h pr
oces
ses
wit
h oc
casi
onal
con
trol
led
expo
sure
or
proc
esse
s w
ith
equi
vale
nt
cont
ainm
ent
cond
itio
n
5: M
ixin
g or
ble
ndin
g in
bat
ch p
roce
sses
7: I
ndus
tria
l spr
ayin
g
8a: T
rans
fer
of s
ubst
ance
or
mix
ture
(ch
argi
ng a
nd d
isch
argi
ng)
at n
on-d
edic
ated
fac
iliti
es
8b: T
rans
fer
of s
ubst
ance
or
mix
ture
(ch
argi
ng a
nd d
isch
argi
ng)
at d
edic
ated
fac
iliti
es
9: T
rans
fer
of s
ubst
ance
or
mix
ture
into
sm
all c
onta
iner
s (d
edic
ated
filli
ng li
ne, i
nclu
ding
wei
ghin
g)
10: R
olle
r ap
plic
atio
n or
bru
shin
g
11: N
on in
dust
rial
spr
ayin
g
13: T
reat
men
t of
art
icle
s by
dip
ping
and
pou
ring
15: U
se a
s la
bora
tory
rea
gent
17: L
ubri
cati
on a
t hi
gh e
nerg
y co
ndit
ions
in m
etal
wor
king
ope
rati
ons
19: M
anua
l act
ivit
ies
invo
lvin
g ha
nd c
onta
ct
21: L
ow e
nerg
y m
anip
ulat
ion
and
hand
ling
of s
ubst
ance
s bo
und
in/o
n m
ater
ials
or
arti
cles
23: O
pen
proc
essi
ng a
nd t
rans
fer
oper
atio
ns a
t su
bsta
ntia
lly e
leva
ted
tem
pera
ture
24: H
igh
(mec
hani
cal)
ene
rgy
wor
k-up
of
subs
tanc
es b
ound
in /o
n m
ater
ials
and
/or
arti
cles
26: H
andl
ing
of s
olid
inor
gani
c su
bsta
nces
at
ambi
ent
tem
pera
ture
# T
he c
ateg
ory
‘No’
incl
udes
exp
osur
e ca
ses
whe
re m
easu
rem
ents
wer
e do
ne o
utsi
de o
f pr
otec
tive
glo
ves;
‘Yes
’ was
res
erve
d fo
r ex
posu
re c
ases
whe
re m
easu
rem
ents
wer
e do
ne u
nder
neat
h pr
otec
tive
glo
ves.
b)In
the
con
text
of
hum
an e
xpos
ure
asse
ssm
ent,
the
term
s ‘in
dust
rial
’ and
‘pro
fess
iona
l’ fla
g th
e oc
cupa
tion
al c
ondi
tion
s un
der
whi
ch t
he w
orke
rs u
se a
sub
stan
ce o
r pr
oduc
t. In
gen
eral
, ‘in
dust
rial
’ con
diti
ons
are
asso
ciat
ed w
ith
trai
ning
of
wor
kers
, pro
per
wor
k in
stru
ctio
ns a
nd s
uper
visi
on. U
sual
ly, i
ndus
tria
l wor
k in
thi
s sc
ope
take
s pl
ace
‘at
indu
stri
al s
ite’
and
pro
fess
iona
l wor
k in
mob
ile a
nd c
hang
ing
envi
ronm
ents
, but
thi
s is
not
nec
essa
rily
alw
ays
the
case
.c)To
tal n
umbe
r of
mea
sure
men
ts f
or t
he c
ombi
nati
on o
f ph
ysic
al s
tate
, PR
OC
and
set
ting
.
Val
ues
indi
cate
d as
‘x \
y’ s
houl
d be
inte
rpre
ted
as ‘x
exp
osur
e ca
ses
wit
h in
tot
al y
mea
sure
d va
lues
’.
Tab
le 3
. C
ou
nti
ued
Downloaded from https://academic.oup.com/annweh/article-abstract/61/7/854/4036173/Validation-of-the-dermal-exposure-model-in-ECETOCby Wouter Fransmanon 07 September 2017
864 Annals of Work Exposures and Health, 2017, Vol. 61, No. 7
corrected for all other included parameters, on average resulted in 97% lower values than measurements with-out protective gloves or on the outside of protective gloves. The sampling methods were coded by the proj-ect team as either ‘interception methods’, e.g. sampling gloves or patches, or ‘removal methods’, e.g. hand wash-ing or wiping. The multivariate analysis indicated that exposure levels measured using an interception method were, on average, a factor of 6 higher than measurements using a removal method. It was also found, that removal methods were clearly more prevalent in situations with
lower estimated and lower measured exposure levels, as can be seen in Figure 3.
The exposure cases with concentration of substance in the product in the categories <1%, 1–5% and 5–25% were found to have exposure levels that were a factor of 30–55 lower than the exposure cases in the categories of >25% and ‘not in a mixture’, while the ECETOC TRA model reduces exposure levels by a factor of 10 for sub-stances in a concentration of <1% in a product.
An attempt was made to further analyse those 21 exposure cases where the model estimate was lower
Figure 1. Comparison of the 75th percentile of measured values with model estimates per exposure case; A: per PROC for liquid substances. B: per PROC for solid substances used as such or in solid products. C: per PROC for solid substances used in liquid products. D: per type of substance. E: all exposure situations with 90% confidence intervals around the 75th percentile
Downloaded from https://academic.oup.com/annweh/article-abstract/61/7/854/4036173/Validation-of-the-dermal-exposure-model-in-ECETOCby Wouter Fransmanon 07 September 2017
Annals of Work Exposures and Health, 2017, Vol. 61, No. 7 865
than the 75th percentile of measured values. These exposure cases included a number of spray applica-tions, some rolling and wiping activities, scooping, weighing and dumping of powders, grinding of stain-less steel, grit blasting of old paint layers and handling solid objects, apparently contaminated with the mea-sured substance.
Thirty-eight percent of the variance in the logarithm of the ratios between model estimate and 75th percentile of measured values could be explained by a statistical model including PROCs, concentration of substance in product, use of LEV, use of gloves and sampling method. The concentration of substance in the product had a sig-nificant effect with factors of difference between 8 and
Figure 3. Relation between the ratio of model estimate and 75th percentile of measured values for all exposure cases.
Figure 2. Cumulative distribution of the ratio between model estimate and 75th percentile of measured values for the full set of exposure cases and per type of substance.
Downloaded from https://academic.oup.com/annweh/article-abstract/61/7/854/4036173/Validation-of-the-dermal-exposure-model-in-ECETOCby Wouter Fransmanon 07 September 2017
866 Annals of Work Exposures and Health, 2017, Vol. 61, No. 7
27 for different concentration ranges. In exposure cases when LEV was used, the ratio was found to be a fac-tor 8 lower, on average, than in exposure cases when no LEV was used. Furthermore, the ratio was found to be on average a factor 6 higher when measurements were done underneath protective gloves than when measure-ments were done without or outside of protective gloves. Finally, the ratio was a factor of 4 smaller in exposure cases where samples were taken with interception meth-ods than in exposure cases where samples were taken with removal methods. The confidence intervals around the factors mentioned above were large and therefore the results were not statistically significant, so these results are considered to be only indicative.
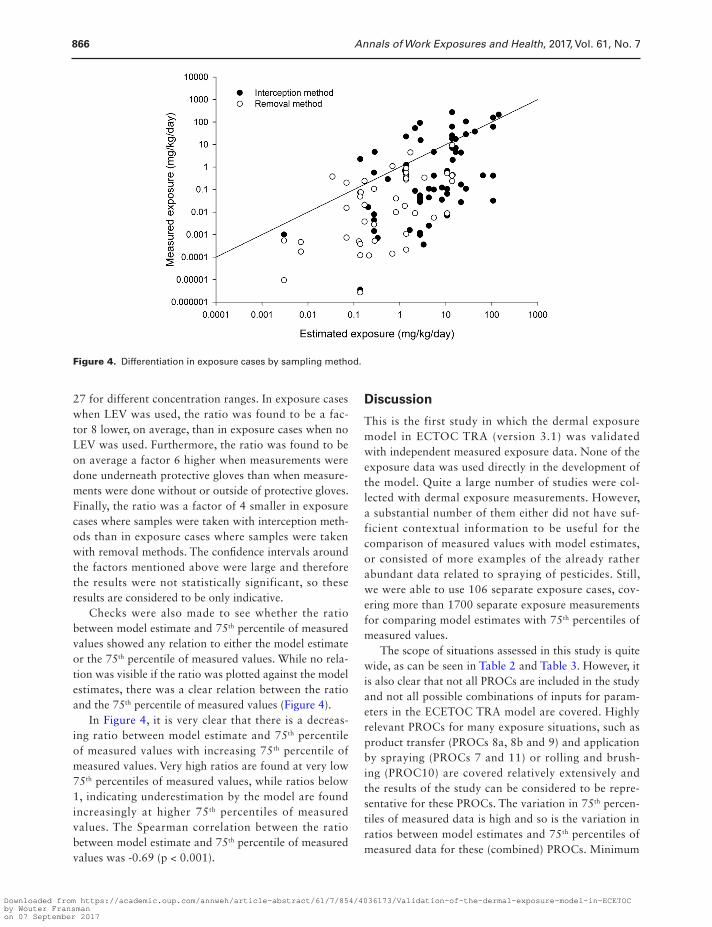
Checks were also made to see whether the ratio between model estimate and 75th percentile of measured values showed any relation to either the model estimate or the 75th percentile of measured values. While no rela-tion was visible if the ratio was plotted against the model estimates, there was a clear relation between the ratio and the 75th percentile of measured values (Figure 4).
In Figure 4, it is very clear that there is a decreas-ing ratio between model estimate and 75th percentile of measured values with increasing 75th percentile of measured values. Very high ratios are found at very low 75th percentiles of measured values, while ratios below 1, indicating underestimation by the model are found increasingly at higher 75th percentiles of measured values. The Spearman correlation between the ratio between model estimate and 75th percentile of measured values was -0.69 (p < 0.001).
Discussion
This is the first study in which the dermal exposure model in ECTOC TRA (version 3.1) was validated with independent measured exposure data. None of the exposure data was used directly in the development of the model. Quite a large number of studies were col-lected with dermal exposure measurements. However, a substantial number of them either did not have suf-ficient contextual information to be useful for the comparison of measured values with model estimates, or consisted of more examples of the already rather abundant data related to spraying of pesticides. Still, we were able to use 106 separate exposure cases, cov-ering more than 1700 separate exposure measurements for comparing model estimates with 75th percentiles of measured values.
The scope of situations assessed in this study is quite wide, as can be seen in Table 2 and Table 3. However, it is also clear that not all PROCs are included in the study and not all possible combinations of inputs for param-eters in the ECETOC TRA model are covered. Highly relevant PROCs for many exposure situations, such as product transfer (PROCs 8a, 8b and 9) and application by spraying (PROCs 7 and 11) or rolling and brush-ing (PROC10) are covered relatively extensively and the results of the study can be considered to be repre-sentative for these PROCs. The variation in 75th percen-tiles of measured data is high and so is the variation in ratios between model estimates and 75th percentiles of measured data for these (combined) PROCs. Minimum
Figure 4. Differentiation in exposure cases by sampling method.
Downloaded from https://academic.oup.com/annweh/article-abstract/61/7/854/4036173/Validation-of-the-dermal-exposure-model-in-ECETOCby Wouter Fransmanon 07 September 2017
Annals of Work Exposures and Health, 2017, Vol. 61, No. 7 867
levels for 75th percentiles are below 0.001 and maxima above 50 and minimum ratios are below 1, with maxima above 300. Several other highly relevant PROCs that are typically found in the manufacturing of chemicals and chemical products in closed systems (PROCs 1 to 4) are not or hardly covered in this study. This is probably due to the fact that these situations are expected to lead to (very) low exposures and therefore are less likely to be the subject of measurements compared to situations where higher exposures are expected, such as in product transfer or application. In our analysed datasets, only three cases were allocated to PROC3, all, with a 75th percentile of measured values below 0.001 mg/kg-1/day-1. No cases were allocated to PROCs 1, 2 or 4. Specifically for PROCs 1, 2 and 3, the interaction between workers and the product or substance is expected to be very lim-ited and therefore dermal exposure levels should be very low as well. This results in low basic exposure values in the ECETOC TRA model between 0.03 and 1.37 mg ∙ kg-1 ∙ day-1. The fact that the ECETOC TRA model is biased towards (severe) overestimation of exposure lev-els at lower levels of exposure, provides assurance that the values used by the model for these PROCs are prob-ably conservative. For PROC4, which includes more opportunity for exposure, the basic exposure value is somewhat higher at 6.86 mg ∙ kg-1 ∙ day-1. This value is in the range where a substantial number of ratios between model estimate and 75th percentile of measured values is lower than 1, indicating possible underestimation by the model. It would therefore be quite relevant to gather exposure data related to this PROC, to allow valida-tion of the model estimate by independent measured data. Several other PROCs without measured values for comparison, or where the number of measured val-ues is rather low, may be less relevant for the chemical industry. However, they are relevant for various other industries and it would therefore also be appropriate to have more measured data to validate the ECETOC TRA model for those PROCs.
The fact that full consensus on inputs by the experts assigning these inputs was only found in a quarter of the exposure cases, clearly indicates that it is very dif-ficult to conclude on some parameters in the ECETOC TRA model. This is especially critical because in a study by Riedmann et. al. (2015) PROCs was found to be the most sensitive parameter influencing model results. Lack of consensus was found to be most common for PROCs, the parameter which is most ‘abstract’ and requires a substantial amount of interpretation, specifically when tasks cannot be fully separated (e.g. mixing paint and then painting). This suggests that the definition and descriptions of PROCs in the relevant guidance docu-
ments by ECHA is not sufficiently clear. Furthermore, some of the PROCs appear to describe overlapping situations, such as the PROCs for mixing and similar processes (PROCs 4 and 5) and those for transfer of products from one container into another (PROCs 8a, 8b and 9). The fact that there sometimes was lack of con-sensus on the input for vapour pressure was partly due to the fact that the instructions on how to assign a value for this parameter for solid substances in liquid prod-ucts were not sufficiently clear, since solid-in-liquids fall outside the score of ECETOC TRA. However, this was corrected by the group of researchers and the Monitor-ing Team of industry experts. It was decided to consider these cases to be a liquid with negligible vapour pressure to ensure that these situations were assessed consistently. This therefore has not influenced the results of the study. Another major cause for lack of consensus was the lack of information on dustiness in virtually all reports and publications on solid substances. While dustiness is gen-erally considered relevant, both for inhalation exposure and for dermal exposure, it is not a parameter that is generally described in measurement reports.
Only 16 exposure cases (15%) related to a situa-tion where LEV was used. These cases were allocated to PROCs 3, 7, 8a, 8b, 11, 13 and 15, which have widely varying exposure levels in the model. This makes it very difficult to study whether the effect of LEV, as included in ECETOC TRA, is realistic or not. More data would be needed to allow a conclusion on the appropriate-ness of the influence of LEV as used by the model. The measured data for these cases (75th percentiles) run from below 0.001 mg/kg-1/day-1 to 56 mg/kg-1/day-1 and the ratios between model estimates and 75th percentiles of measured values run from < 0.1 (for 75th percentiles of 2.2, 23.5 and 56) to above 200 (for 75th percentiles below 0.001).
The fact that the ratio between exposure estimate and 75th percentile of measured values was negatively correlated to the 75th percentile of measured values, as seen in Figure 4, can largely be explained by a number of in-built biases in the model. Both the effect of the concentration of substance in the product used and the effect of duration of exposure on the model estimate are less than linear. In other dermal exposure models, such as e.g. RISKOFDERM (Warren et al., 2006) it is assumed that both factors are linearly correlated with dermal exposure levels. The less than linear effect for these parameters in ECETOC TRA leads to increasing conservatism in the exposure estimates at lower mea-sured exposure levels.
This explanation is supported by the results of the multivariate analyses, at least for the concentration of
Downloaded from https://academic.oup.com/annweh/article-abstract/61/7/854/4036173/Validation-of-the-dermal-exposure-model-in-ECETOCby Wouter Fransmanon 07 September 2017

868 Annals of Work Exposures and Health, 2017, Vol. 61, No. 7
substance in product. Both in the analyses of the 75th percentiles of measured values and in the analyses of the ratios between model estimate and 75th percentile of measured values the concentration of substance in product was a significant determinant. While the effect on measured values is expected, the effect on ratio between model estimate and 75th percentile of measured values indicates that the way in which concentration of substance is built into the model, contributes to the observed bias in the model. Part of the bias can also be directly explained by the fact that the model uses catego-ries of concentrations of substance in products. While the lowest category used in the model is <1%, some of the situations measured had concentrations of substance in products that were much lower and these resulted in the highest ratios between model estimate and 75th per-centile of measured values. There were 13 cases with a concentration below 0.01% of substance in the product used and the ratios between 75th percentiles of measured values and model estimates for these cases ranged from 2.8 to 51031, with eight of these cases having a ratio larger than 100. Three cases with a concentration of substance in product < 0.001% all had ratios of more than 1000.
A couple of factors, not included in the ECETOC TRA model, were found to explain part of the variance in the ratio between model estimates and 75th percentiles of measured values.
Firstly, both the exposure levels and the ratios between model estimate and 75th percentile of mea-sured values appeared to be influenced by the sampling method used. Higher ratios were found for exposure cases where sampling was done with an interception method. This is in line with findings in studies where the two principles of sampling were compared. Fenske et al. (1999), Thomasen et al. (2011), Galea et al. (2014) and Gorman Ng et al. (2014) compared values sampled by a form of interception method with values sampled by a form of removal method. All of these authors tried to correct, as far as possible, for removal efficiency of the removal method. The average values with the removal method, corrected for removal efficiency, were lower than the values with the interception method. The dif-ference varied largely between studies and within studies between different experiments. Measurements gathered with an interception method resulted in values that were between factors of 1.3 and 53 higher than measurements sampled with a removal methods. The combined infor-mation does suggest that interception methods probably overestimate real exposure levels, but the information is not suitable to allow the derivation of a correction fac-tor between the two principles of sampling.
Secondly, in regulatory risk assessment, relatively conservative (i.e. low) values are used as defaults for the effectiveness of gloves, because underestimation of expo-sure is considered more of a problem than overestima-tion. We also used such conservative values in our model estimates. However, the average reduction of exposure by gloves is (of course) clearly higher than the reason-able worst case values used in regulatory risk assessment. An analysis of a number of literature sources (Fransman et al., 2004; KRIOH, 2003; Links et al., 2007; Snippe et al., 2001; Tsakirakis et al., 2010; Tsakirakis et al., 2011; De Zeeuw and De Cock, 2001) was made. These sources include 11 data sets of measurements inside and outside of gloves in the same situation and the average reduction per data set was between 80.5 and 99.99%, with six of the sets having an average reduction of more than 95% (i.e. a reduction factor of more than 20). The analysis of our data also indicates a higher average reduction than usually accounted for in risk assessment. In comparison of measured data with model estimates, therefore the effect of gloves is underestimated if the reasonable worst case defaults used in regulatory risk assessment practice are used.
Thirdly, whereas the use of local exhaust ventilation was not found to be a significant determinant of the vari-ance in 75th percentiles of measured values, it was found to be significant in an analysis of variance of the ratios between model estimate and 75th percentile of measured values. This ratio was lower in cases when LEV was used than in cases when LEV was not used, suggesting that the effect of LEV in these cases is overestimated by the ECETOC TRA model, which most often assumes a reduction of dermal exposure by LEV with a factor of 5 (professional use) or 10 (industrial use). Warren et al. (2006) in their analyses of measured dermal exposure data did conclude that LEV or good general ventila-tion, directing the contamination away from the worker, in transfer activities, spray applications and immersion of articles in products, resulted in a reduction by a fac-tor between 2 and 4, clearly lower than the factor 10 assumed in some cases by the ECETOC TRA model.
The factors discussed above can also partly explain why the ECETOC TRA model itself explains less vari-ance in 75th percentiles of measured values in the total data set (37%) than a statistical model containing original exposure determinants (i.e. without the effect size of the determinant built into the ECETOC TRA model) and sampling method (62%). The variability in exposure levels explained in the different models of the RISKOFDERM model was between 29% (for immer-sion) and 75% (for dispersion with a hand-held tool) as indicated by Warren et al. (2006). In several analyses
Downloaded from https://academic.oup.com/annweh/article-abstract/61/7/854/4036173/Validation-of-the-dermal-exposure-model-in-ECETOCby Wouter Fransmanon 07 September 2017

Annals of Work Exposures and Health, 2017, Vol. 61, No. 7 869
of the semi-quantative model DREAM, the percentage explained by that model varied between 11% and 68%, depending on the factors that were taken into account. The performance of the ECETOC TRA dermal expo-sure model therefore appears to be in the range of the performance of other dermal exposure models, though in the lower half of that range.
While the model shows a reasonable correlation between model estimates and 75th percentiles of mea-sured values, its performance is quite different for (very) low exposure values (e.g. < 0.001) than for (very) high exposure values (e.g. > 100). The overestimation seen at very low exposure values is not per se an issue, because the model is intended to be conservative and any calcu-lated risk with such exposure estimates can be modified by using another, more complex, model (if available) or by doing actual measurements. The apparent under-estimation that occurs at high exposure values gives however more reason to reconsider the model. A Tier 1 model, such as ECETOC TRA, should ideally not lead to a lower estimate of exposure than the value that it intends to estimate. Most of the exposure cases with apparent underestimation by the ECETOC TRA model are gathered by sampling with an interception method and are found at the high end of the distribution of mea-sured dermal exposure values. This may partly explain these apparent underestimations by the model. If an interception method leads to overestimations of actual exposure levels, the underestimation by the model would decrease if such an overestimation could be corrected for. Nevertheless, some of the exposure cases have a 75th percentile of measured values that is much higher than the exposure estimate by the model and some other exposure cases gathered with a removal method also have a higher 75th percentile of measured values than the corresponding exposure estimate. Also, the fact that an interception method tends to be used at higher estimated exposure levels than a removal method (see Figure 3), suggests that there are more factors that lead to the dif-ference between the two types of method than a bias in the interception method.
In this study, it was decided not to limit the analyses to substances and uses that were unequivocally within the scope of the ECETOC TRA model. Several expo-sure cases related to substances with hazards such as sensitization (e.g. isocyanates) or carcinogenicity (e.g. cytostatic pharmaceuticals). The exposures to these sub-stances were generally very low and the ECETOC TRA model tended to severely overestimate the exposure values in these cases. This can be seen as a support for exclusion of this kind of substances from the scope of the ECETOC TRA model and to recommend using more
advanced or more specific models or measured data for these substances.
Pesticides and biocides are also outside the scope of the ECETOC TRA model. ECETOC recommends to apply specific models for these kinds of uses. In this study, no specific analyses were done to study whether there are any good reasons to exclude such uses from the ECETOC TRA model. Some activities with pesticides and biocides, such as mixing and coating of surfaces by rolling, brushing or spraying, are very similar to those activities for other substance types and there is no clear reason why they should be assessed by different mod-els. However, some other activities, e.g. high pressure impregnation with biocides or cutting crops treated with pesticides, are quite different from activities done with other types of products and for those the use of specific models appears to be more necessary.
Finally, situations where solids are used in liquid products are considered outside the scope of the ECE-TOC TRA model. Whether this is mainly because of the difference in inhalation exposure for aerosols compared to vapours, or whether it is also based on expected dif-ferences for dermal exposure, is not mentioned in the ECETOC TRA reports. In this study, solids used in liq-uid products were estimated with the model as if they were liquids with negligible vapour pressure. It was assumed that the processes leading to dermal exposure between non-volatile liquids and solids in liquid prod-ucts would be very similar. A differentiation was made in several analyses in this study for state of substance. This can be seen in Figures 1 and 2. A comparison of Fig-ure 1A (liquids) and Figure 1C (solid-in-liquids) as well as Figure 1D suggests that the exposure cases of solids used in liquid products could be in the same distribu-tion as the exposure cases of liquids. Figure 2 shows that the cumulative distribution of ratios between model esti-mate and 75th percentile of measured values is reason-ably comparable for liquids and for solids used in liquid products. The distribution for solids is more different from the other two distributions. This suggests that it may be relevant to consider creating two sets of separate basic exposure values or modifiers: one set for solids, used as solids, where the exposure is to dust and another set for liquids and solids used in liquid products, where the exposure is basically to a liquid product.
During the gathering of data for this study, it was clear that quite a lot of publications do not provide the necessary information to allow the use of the data for our purpose. Since gathering measured exposure levels needs substantial time and resources, it would be benefi-cial if future authors of studies would gather and report at least a minimum of data, allowing others to use their
Downloaded from https://academic.oup.com/annweh/article-abstract/61/7/854/4036173/Validation-of-the-dermal-exposure-model-in-ECETOCby Wouter Fransmanon 07 September 2017

870 Annals of Work Exposures and Health, 2017, Vol. 61, No. 7
data as well. To allow the use of data for comparison with model estimates, at least a clear separation of data points for different activities (or fixed and clear com-binations thereof) should be presented. Also, statistical parameters, such as averages and percentiles, should not be made for mixed data points with and without LEV or with and without personal protection. Since the per-centage of a substance in a product is a highly important determinant of exposure (not only dermal exposure), it would be recommended that at least reasonable ranges for this parameter are presented and that statistical parameters do not combine measurements over a wide variety of concentrations in products.
Conclusions
A complete validation of the model was not possible, due to a lack of measured data for several activities (PROCs) in combination with several relevant deter-minants. Where data were available, this study showed that, in the majority of cases (approximately 80%), the dermal exposure estimates by ECETOC TRA v3.1 were higher than the corresponding 75th percentiles of mea-sured values. It was also shown that the model tended to (severely) overestimate the exposure levels when very low exposure levels were measured (e.g. < 0.001, which is 30 times lower than the basic value of 0.03 that the model assigns to PROC1 for closed processes; ratios between model estimates and 75th percentiles of mea-sured values for the 18 relevant cases were between 3 and 51031, with 13 of the ratios > 100), while there was a lack of conservatism at (very) high measured exposure levels (e.g. > 0.1, above which all cases with a ratio < 1 are found and certainly > 100, where all ratios are < 1). The model explained approximately 37% of the vari-ance in the 75th percentiles of measured values.
In the analysis of the measured values it was found that the 75th percentiles of measured values for expo-sure cases sampled with an interception method were, on average, a factor of 6 higher than the 75th percentiles of measured values for exposure cases sampled with a removal method. The effect of protective gloves on the 75th percentiles of measured exposure levels was found to be approximately a factor of 34, i.e. approximately 97% reduction of exposure.
The ECETOC TRA model is not intended to be used for solid substances used in liquid products (e.g. pigments in paints). However, the results of this study indicate that the model is just as useful for these kind of situations as for liquids, when the solid substances in liquid products are assigned to the category of negligible volatility liquids.
Acknowledgements
This study was supported by the Cefic Long-range research ini-tiative, project B-16. The authors are thankful to the LRI Moni-toring Team for their input and support during the project and to the expert exposure assessors for their participation in assign-ing input values for the model estimates. The authors declare no conflict of interest relating to the material presented in this Article. Its contents, including any opinions and/or conclusions expressed, are solely those of the authors.
References
De Zeeuw M, de Cock J. (2001) Field study on occupational exposure to the disinfectant O-phenylphenol (OPP) in hos-pitals and related institutions. Zeist: TNO Chemistry. TNO report V3805. (Available from the corresponding author)
ECETOC. Targeted Risk Assessment. (2004) Technical Report No. 93. Brussels: ECETOC. ISSN 0773 8072 93.
ECETOC. Addendum to ECETOC Targeted Risk Assessment Report No. 93. (2009) Technical Report No. 107. Brussels: ECETOC. ISSN 0773 8072 107.
ECETOC. ECETOC TRA version 3: Background and Rationale for the Improvements. (2012) Technical Report No. 114. Brussels: ECETOC. ISSN 0773 8072 114.
ECETOC. Addendum to TR114: Technical Basis for the TRA v3.1. (2014) Technical Report No. 124. Brussels: ECETOC. ISSN 0773 8072 124.
ECHA. Guidance on Information Requirements and Chemical Safety Assessment Chapter R.12: Use description. Version 3.0. (2015). Helsinki: ECHA. ISBN 978 92 9247 685 4.
Fenske RA, Simcox NJ, Camp JE, et al. (1999) Comparison of three methods for assessment of hand exposure to azinphos-methyl (Guthion) during apple thinning. Appl Occup Envi-ron Hyg; 14: 618–23.
Fransman W, Vermeulen R, Kromhout H. (2004) occupational dermal exposure to cyclophosphamide in Dutch hospitals: a pilot study. Ann Occup Hyg; 48: 237–44.
Galea KS, McGonagle C, Sleeuwenhoek A, et al. (2014) Vali-dation and comparison of two sampling methods to assess dermal exposure to drilling fluids and crude oil. Ann Occup Hyg; 58: 591–600.
Gorman Ng M, Semple S, Cherrie JW, et al. (2012) The relation-ship between inadvertent ingestion and dermal exposure pathways: a new integrated conceptual model and a data-base of dermal and oral transfer efficiencies. Ann Occup Hyg; 56: 1000–1012.
RISKOFDERM. (2003) Risk assessment for occupational der-mal exposure to chemicals. Project QLK4-CT-1999-01107. Deliverable 41, Main study report of partner 2. (Available from corresponding author)
Links I, van der Jagt KE, Christopher Y, et al. (2007) Occupational Exposure During Application and Removal of Antifouling Paints. Ann Occup Hyg; 51: 207–18.
Money C, Schnoeder F, Noij D, et al. (2014) ECETOC TRA version 3: capturing and consolidating the experiences of REACH. Environ Sci: Processes Impacts; 16: 970–77.
Downloaded from https://academic.oup.com/annweh/article-abstract/61/7/854/4036173/Validation-of-the-dermal-exposure-model-in-ECETOCby Wouter Fransmanon 07 September 2017

Annals of Work Exposures and Health, 2017, Vol. 61, No. 7 871
Riedmann RA, Gasic B, Vernzez D. (2015) Sensitivity analysis, dominant factors, and robustness of the ECETOC TRA v3, Stoffenmanager 4.5, and ART 1.5 occupational exposure models. Risk Anal; 35(2); 211–25
Snippe RJ, Lurvink MWM, Wezendonk LJW, et al. (2001) Respiratory and dermal exposure to disinfectants during the disinfection of cattle trucks. Zeist: TNO Chemistry. TNO report V3725. (Available from the corresponding author)
Thomasen JM, Fent KW, Nylander-French L. (2011) Devel-opment of a sampling patch to measure dermal expo-sures to monomeric and polymeric 1,6-hexamethylene diisocyanate: a pilot study. J Occup Environ Hyg; 8: 709–17.
Tickner J, Friar J, Creely KS, et al. (2005) The development of the EASE model. Ann Occup Hyg; 49: 103–10.
Tsakirakis AN, Kasiotis KM, Anastasiadou P, et al. (2010) Determination of operator exposure levels to pesticides during greenhouse applications with new type multi-nozzle equipment and the use of two different protective coverall types. Hellenic Plant Protection J; 3: 9–16.
Tsakirakis AN, Kasiotis KM, Arapaki N, et al. (2011) Determi-nation of operator exposure levels to insecticide during bait applications in olive trees: Study of coverall performance and duration of application. Int J Hyg Environ Health; 214: 71–8.
Warren ND, Marquart H, Christopher Y, et al. (2006) Task-based dermal exposure models for regulatory risk assessment. Ann Occup Hyg; 50: 491–503.
Downloaded from https://academic.oup.com/annweh/article-abstract/61/7/854/4036173/Validation-of-the-dermal-exposure-model-in-ECETOCby Wouter Fransmanon 07 September 2017