validated inspection techniques...
TRANSCRIPT

Pour insérer une image :
Menu « Insertion / Image »
ou
Cliquer sur l’icône de la zone
image
Pour personnaliser « nom
événement et auteur » :
« Insertion / En-tête et pied
de page »
Personnaliser la zone de de
pied de page
Cliquer sur appliquer partout VALIDATED INSPECTION TECHNIQUES FOR
COMPOSITES IN ENERGY APPLICATIONS :
VIT-CEA
INSPECTION TECHNIQUES: ULTRASONIC
VITCEA Workshop, 17/02/2015, BAM, Berlin

Pour personnaliser « nom
événement et auteur » :
« Insertion / En-tête et pied
de page »
Personnaliser la zone de de
pied de page
Cliquer sur appliquer partout
|
PAGE
2
VITCEA Workshop, 17/02/2015, BAM, Berlin
SIMULATION : HYBRID MODELING
Principle of the hybrid method : CIVA/Numeric (FDTD code, N. Dominguez)
Development and integration of a coupling code in CIVA : CIVA/Numeric
FDTD box
Semi-analytical path
1. Emission: semi-analytical
Input field at the FDTD box upper boundary
2. FDTD propagation in the box
Output field at the FDTD box upper boundary
+ Field in FDTD box (propag. movie)
3. Reception: Auld reciprocity (semi-analytical)
Pressure field on receiver
Exchange surface

Pour personnaliser « nom
événement et auteur » :
« Insertion / En-tête et pied
de page »
Personnaliser la zone de de
pied de page
Cliquer sur appliquer partout
Incident plane
wave
frontwall Structural noise backwall
Example of the hybrid CIVA/Numeric code
The part under inspection is a curved
composite made of CFRP with an external
radius of 14.5 mm and a thickness of 7 mm
Ply thickness is around 180 µm
An epoxy layer of 20 µm is inserted between
each layer to take the structural noise into
account
The code allows to visualize the propagation
of the ultrasonic waves inside the composite
taking into account the curvature of the part
of the layered structure
VITCEA Workshop, 17/02/2015, BAM, Berlin |
PAGE
3
SIMULATION : HYBRID MODELING

Pour personnaliser « nom
événement et auteur » :
« Insertion / En-tête et pied
de page »
Personnaliser la zone de de
pied de page
Cliquer sur appliquer partout
Experiment Simulation
The model needs to be extended to deal with thick composites
Attenuation and dispersion need to be taken into account
Simulation of delamination inspection
| PAGE
4
SIMULATION : HYBRID MODELING
VITCEA Workshop, 17/02/2015, BAM, Berlin
Experiment
Hybrid code
Pour personnaliser « nom
événement et auteur » :
« Insertion / En-tête et pied
de page »
Personnaliser la zone de de
pied de page
Cliquer sur appliquer partout
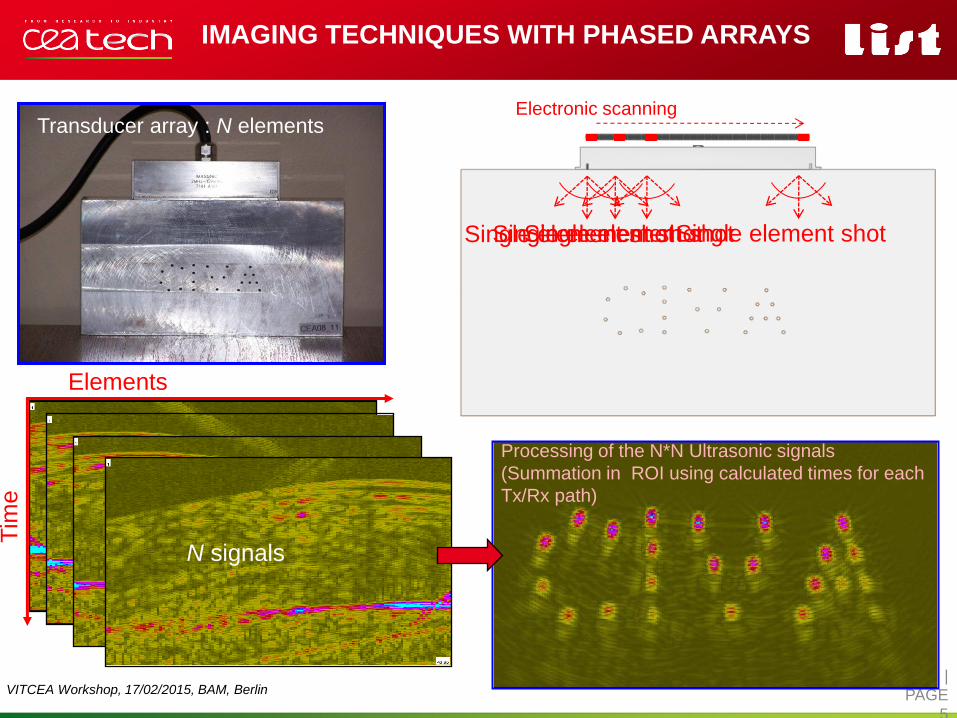
IMAGING TECHNIQUES WITH PHASED ARRAYS
|
PAGE
5
Electronic scanning
N signals
Tim
e
Elements
Transducer array : N elements
Single element shot
N signals N signals
N signals
Single element shot Single element shot Single element shot
Processing of the N*N Ultrasonic signals
(Summation in ROI using calculated times for each
Tx/Rx path)
VITCEA Workshop, 17/02/2015, BAM, Berlin

Pour personnaliser « nom
événement et auteur » :
« Insertion / En-tête et pied
de page »
Personnaliser la zone de de
pied de page
Cliquer sur appliquer partout
VITCEA Workshop, 17/02/2015, BAM, Berlin
Use of simulation is a great opportunity to reduce the cost of POD
S
a
Classical simulation:
deterministic
S(a) = (a)
Deterministic Deterministic
Input parameters Output Values
X Y
Generation of simulated data with variability
Input parameters:
• Part
• Dimensions
• Conductivity
•Inspection
• Start scan position
• Scan increment
• Lift-off
• Flaw
• Shape
• Length
• Height
• Width
With uncertainty With variability
S
a
Targeted simulation:
account for variability
S(a) = (a) + a(M)
Input parameters:
• Part
• Dimensions
• Conductivity
•Inspection
• Start scan position
• Scan increment
• Lift-off
• Flaw
• Shape
• Length
• Height
• Width
Lift-off (µm)
Pro
ba
bili
ty d
en
sity
Uncertainty propagation
Crack length (mm)
PO
D (
%)
|
PAGE
6
PROBABILITY OF DETECTION
Pour personnaliser « nom
événement et auteur » :
« Insertion / En-tête et pied
de page »
Personnaliser la zone de de
pied de page
Cliquer sur appliquer partout
STATISTICAL ANALYSIS S
ign
al re
sp
on
se
S(a
)
Flaw size (a)
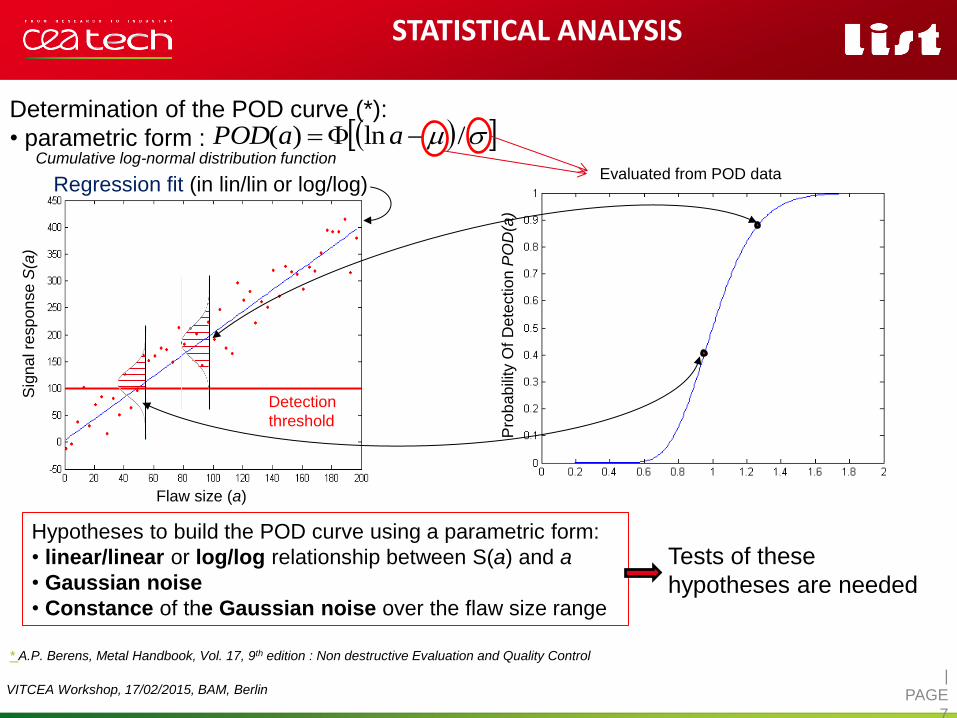
Determination of the POD curve (*):
• parametric form :
* A.P. Berens, Metal Handbook, Vol. 17, 9th edition : Non destructive Evaluation and Quality Control
Regression fit (in lin/lin or log/log)
Detection
threshold
Hypotheses to build the POD curve using a parametric form:
• linear/linear or log/log relationship between S(a) and a
• Gaussian noise
• Constance of the Gaussian noise over the flaw size range
Tests of these
hypotheses are needed
Pro
ba
bili
ty O
f D
ete
ctio
n P
OD
(a)
/ln)( aaPODCumulative log-normal distribution function
Evaluated from POD data
|
PAGE
7
VITCEA Workshop, 17/02/2015, BAM, Berlin

Pour personnaliser « nom
événement et auteur » :
« Insertion / En-tête et pied
de page »
Personnaliser la zone de de
pied de page
Cliquer sur appliquer partout
STATISTICAL ANALYSIS
• POD analysis with thresholds 1
mma 27.095/90 mma 25.095/90
Previously used data as « sure value »: 0.5 mm
This value is confirmed and « consolidated » ( ) mma 5.02 95/90
Lin/Lin assumption Log/Log assumption
|
PAGE
8
VITCEA Workshop, 17/02/2015, BAM, Berlin
Pour personnaliser « nom
événement et auteur » :
« Insertion / En-tête et pied
de page »
Personnaliser la zone de de
pied de page
Cliquer sur appliquer partout
STATISTICAL ANALYSIS
|
PAGE
9
VITCEA Workshop, 17/02/2015, BAM, Berlin
Activity #14 : Calculation of POD curves for UT phased arrays and air-coupled probes (BAM)
experimental or simulated data.
Activity #16 (with PTB and NPL) : Calculation of POD curves from experimental data related
to microwave inspection technique.
Activity #18 : Calculation of POD curves for active thermography data (from BAM)
Activity #20 (with NPL) : Calculation and reports describing POD curves from experimental
data related to laser-shearography technique.

Département Imagerie Simulation pour le Contrôle (DISC)
Commissariat à l’énergie atomique et aux énergies alternatives
Institut Carnot CEA LIST
Centre de Saclay 91191 Gif-sur-Yvette Cedex