vaaluee--aa dddeedd smmeeaassuurrees ooff perfoorrmmaannccee
TRANSCRIPT

VVaalluuee--aaddddeedd mmeeaassuurreess ooff
ppeerrffoorrmmaannccee aanndd rreessiidduuaall
iinnccoommee vvaalluuaattiioonn Pamela Peterson Drake
INTRODUCTION...................................................................................................................................... 1
HOW DOES A FIRM ADD VALUE? ...................................................................................................... 2
Sources of value-added.......................................................................................................................................... 2
Porter’s Five Forces ................................................................................................................................................ 3
WHAT IS ECONOMIC VALUE ADDED? ............................................................................................. 8
Origins of economic value added ........................................................................................................................... 9
Examples ............................................................................................................................................................... 9
Using EVA principles in financial decision-making ............................................................................................. 10
Conceptual Issues ................................................................................................................................................ 10
Computational Issues .......................................................................................................................................... 11
WHAT IS RESIDUAL INCOME? ......................................................................................................... 12
Assumptions ........................................................................................................................................................ 12
SUMMARY ............................................................................................................................................... 13
REFERENCES .......................................................................................................................................... 14
FURTHER READINGS AND RESOURCES ........................................................................................ 14
INDEX ....................................................................................................................................................... 14

1
Introduction Many companies have embraced -- and others have felt obligated to look at -- performance measures that depart from the traditional accounting based measures such as earnings per share and return on
investment. These "value-based" measures include economic value added (which is Stern Stewart's registered EVA™ method), shareholder value increase, economic value creation, and market value added.
Related measures include Holt Value Associates' and Boston Consulting's cash flow return on investment
(CFROI) and LEK/Alcar's Discounted Cash Flow Analysis. 1
Many variants of value-added measures have been spawned and many consulting firms are selling value-
based products. These measures have been used in compensation arrangements, capital decision-making, and in financial disclosures. The basic idea is that the measure of performance is based on how
much value is added to the firm, and this added value is related to the economic profit that a company
generates. Economic profit is the amount by which operating income exceeds the cost of capital: if there is economic profit, the value of the firm increases; if there is an economic loss, the value of the firm
declines.
A related concept is residual income. Residual income is defined as the amount by which the earnings
of a company exceed the cost of capital. While on the surface the concept of economic profit and residual income appear similar since they are based on the concept of generating income beyond the cost
of capital, there are some differences in how these are generally applied in practice.
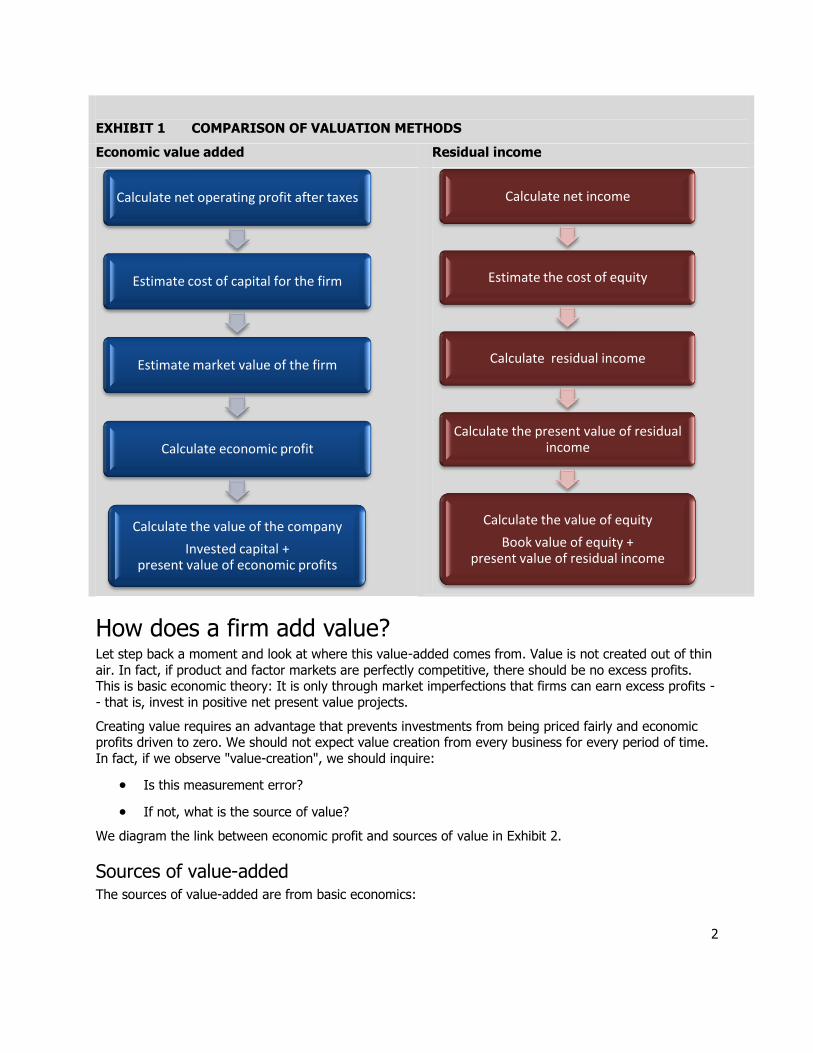
The two methods of operationalizing economic value added and residual income are described broadly in Exhibit 1, though we provide more detail later in this reading. Though both of these methods seek to
value the economic profit of a company to determine the value of a company today, these methods differ in terms of the assumptions, as well as the faith in the quality of accounting information.
For example, to use economic value added the analyst must make numerous adjustments to reported
income and capital to eliminate what are referred to as accounting distortions. Residual income, on the other hand, generally uses reported values, assuming that clean surplus accounting exists.2 Another
difference between these two approaches is that economic value added is used to estimate the value today of invested capital (that is, reflecting both creditors’ and shareholders’ interests), whereas residual
income focuses on the value of equity.
1 Holt Value Associates is now part of CSFB. 2 Clean surplus accounting is the concept that retained earnings – a large part of the book value of equity – reflects only earnings and dividends. For example, clean surplus accounting is violated – and is
therefore referred to as dirty surplus accounting -- if the company chooses a method of accounting
that permits income or losses to bypass the income statement and go directly to equity on the balance sheet. This could happen under different methods of accounting for, say, foreign currency translation.
2
EXHIBIT 1 COMPARISON OF VALUATION METHODS
Economic value added Residual income
How does a firm add value? Let step back a moment and look at where this value-added comes from. Value is not created out of thin
air. In fact, if product and factor markets are perfectly competitive, there should be no excess profits. This is basic economic theory: It is only through market imperfections that firms can earn excess profits -
- that is, invest in positive net present value projects.
Creating value requires an advantage that prevents investments from being priced fairly and economic profits driven to zero. We should not expect value creation from every business for every period of time.
In fact, if we observe "value-creation", we should inquire:
Is this measurement error?
If not, what is the source of value?
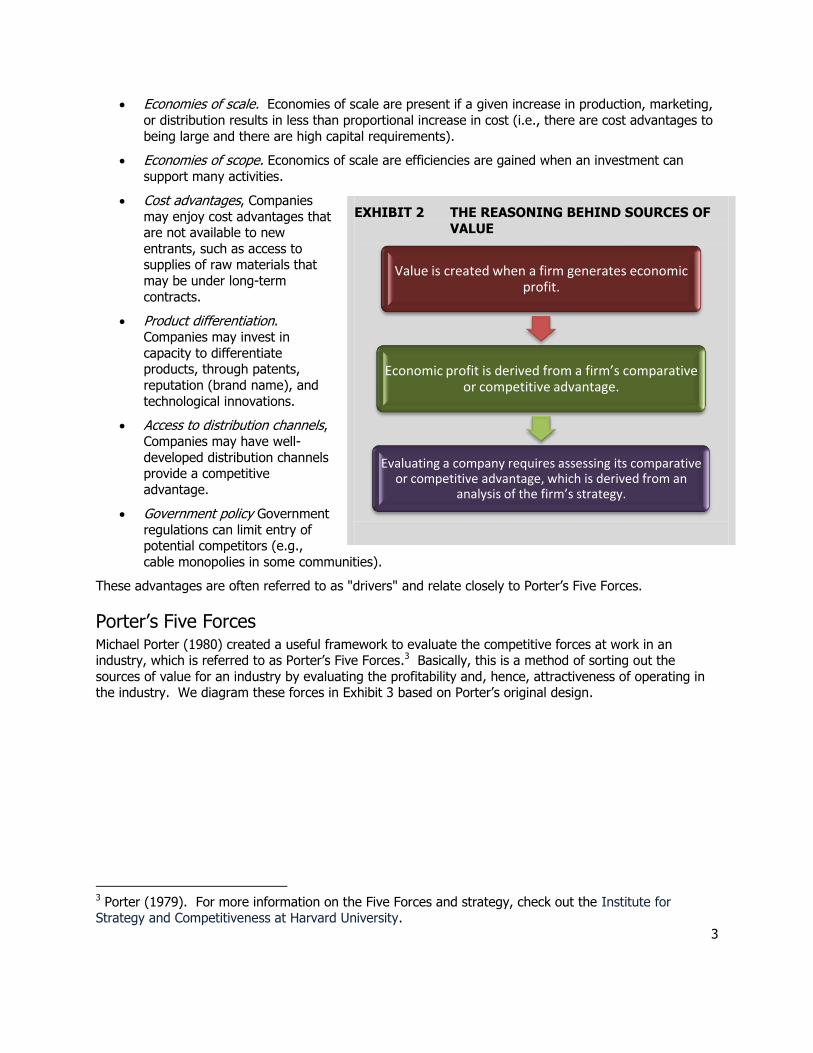
We diagram the link between economic profit and sources of value in Exhibit 2.
Sources of value-added The sources of value-added are from basic economics:
Calculate net operating profit after taxes
Estimate cost of capital for the firm
Estimate market value of the firm
Calculate economic profit
Calculate the value of the company
Invested capital + present value of economic profits
Calculate net income
Estimate the cost of equity
Calculate residual income
Calculate the present value of residual income
Calculate the value of equity
Book value of equity +present value of residual income
3
Economies of scale. Economies of scale are present if a given increase in production, marketing,
or distribution results in less than proportional increase in cost (i.e., there are cost advantages to
being large and there are high capital requirements).
Economies of scope. Economics of scale are efficiencies are gained when an investment can
support many activities.
Cost advantages, Companies
may enjoy cost advantages that are not available to new
entrants, such as access to supplies of raw materials that
may be under long-term
contracts.
Product differentiation.
Companies may invest in
capacity to differentiate products, through patents,
reputation (brand name), and
technological innovations.
Access to distribution channels, Companies may have well-
developed distribution channels provide a competitive
advantage.
Government policy Government
regulations can limit entry of potential competitors (e.g.,
cable monopolies in some communities).
These advantages are often referred to as "drivers" and relate closely to Porter’s Five Forces.
Porter’s Five Forces Michael Porter (1980) created a useful framework to evaluate the competitive forces at work in an industry, which is referred to as Porter’s Five Forces.3 Basically, this is a method of sorting out the
sources of value for an industry by evaluating the profitability and, hence, attractiveness of operating in the industry. We diagram these forces in Exhibit 3 based on Porter’s original design.
3 Porter (1979). For more information on the Five Forces and strategy, check out the Institute for Strategy and Competitiveness at Harvard University.
EXHIBIT 2 THE REASONING BEHIND SOURCES OF
VALUE
Value is created when a firm generates economic profit.
Economic profit is derived from a firm’s comparative or competitive advantage.
Evaluating a company requires assessing its comparative or competitive advantage, which is derived from an
analysis of the firm’s strategy.

4
EXHIBIT 3 PORTER’S FIVE FORCES
Barriers to entry
Barriers to entry in to an industry exist when there is some impediment to entering the industry. Barriers
to entry may be natural barriers (such as extreme high start-up costs) or legal (e.g., patents):
economies of scale or scope;
proprietary product differentiation; brand identity;
significant capital requirements;
high costs to switching; limited access to distribution channels;
cost disadvantages independent of scale; government policy that limits entry;
retaliation anticipated.
The greater the barriers to entry, the more profitable the industry.
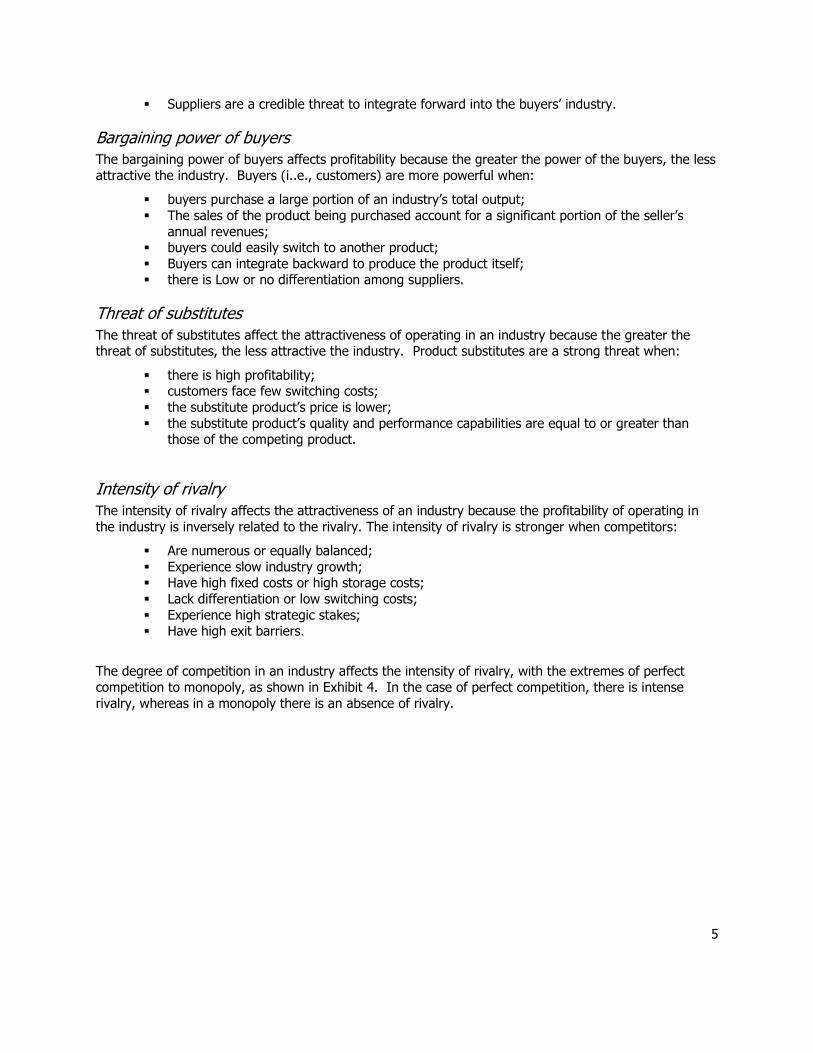
Bargaining power of suppliers
Bargaining power of suppliers refers to the power that the suppliers to the company or industry have.
The more powerful the suppliers, the less attractive the industry. Suppliers are more powerful when:
the suppliers consist of a few, large companies; satisfactory substitute products are not available to firms in the industry;
industry’s firms are not a significant customer for the supplier group; suppliers’ goods are critical to buyers’ marketplace success;
there are high costs to switching; or
Rivalry
Barriers to entry
Suppliers’ power
Threat of substitutes
Buyers’ power
5
Suppliers are a credible threat to integrate forward into the buyers’ industry.
Bargaining power of buyers
The bargaining power of buyers affects profitability because the greater the power of the buyers, the less
attractive the industry. Buyers (i..e., customers) are more powerful when:
buyers purchase a large portion of an industry’s total output;
The sales of the product being purchased account for a significant portion of the seller’s
annual revenues; buyers could easily switch to another product;
Buyers can integrate backward to produce the product itself; there is Low or no differentiation among suppliers.
Threat of substitutes
The threat of substitutes affect the attractiveness of operating in an industry because the greater the threat of substitutes, the less attractive the industry. Product substitutes are a strong threat when:
there is high profitability; customers face few switching costs;
the substitute product’s price is lower;
the substitute product’s quality and performance capabilities are equal to or greater than those of the competing product.
Intensity of rivalry
The intensity of rivalry affects the attractiveness of an industry because the profitability of operating in
the industry is inversely related to the rivalry. The intensity of rivalry is stronger when competitors:
Are numerous or equally balanced;
Experience slow industry growth; Have high fixed costs or high storage costs;
Lack differentiation or low switching costs;
Experience high strategic stakes; Have high exit barriers.
The degree of competition in an industry affects the intensity of rivalry, with the extremes of perfect
competition to monopoly, as shown in Exhibit 4. In the case of perfect competition, there is intense
rivalry, whereas in a monopoly there is an absence of rivalry.

6
EXHIBIT 4 INDUSTRY CHARACTERIZATION BASED ON COMPETITION
Many firms provide a homogeneous good or service.
Identical products New firms enter easily
No firm has control over
price No non-price competition
Many firms provide a good or service, but the good or service is subtly differentiated. Some differentiation
in product
Some control over
price Use of non-price
competition
A few firms provide the vast majority of a good or service.
May or may not have product
differentiation
Heavy use of non-price competition
Some control over price
A single firm is the only provider of a good or service. Perfect control over
price
Entrance is blocked
Non-price competition is not necessary
Porter’s Five Forces is a convenient framework for evaluating the source of value for an industry. The
primary contribution of this framework is to capture sources of economic profit from the vertical chain (supplier buyer), as well as from market competition. As each force is assessed, the question is
raised: Is the force sufficiently strong enough to reduce or eliminate industry economic profit? You can see an example of an industry assessment in Exhibit 5.
What Porter’s forces do not address are the forces that affect the demand for an industry’s product, other than that affected by substitutes. For example, in evaluating the consumer products industry, there is no
mention of how the general economy or demographics affect demand. Also, Porter’s forces focus on the
industry, but not particular companies within the industry. For example, the ability to generate economic profit may be different for the larger companies than the smaller companies in an industry characterized
by monopolistic competition.
Perfect competitionMonopolositic competition
Oligopoly Monopoly
7
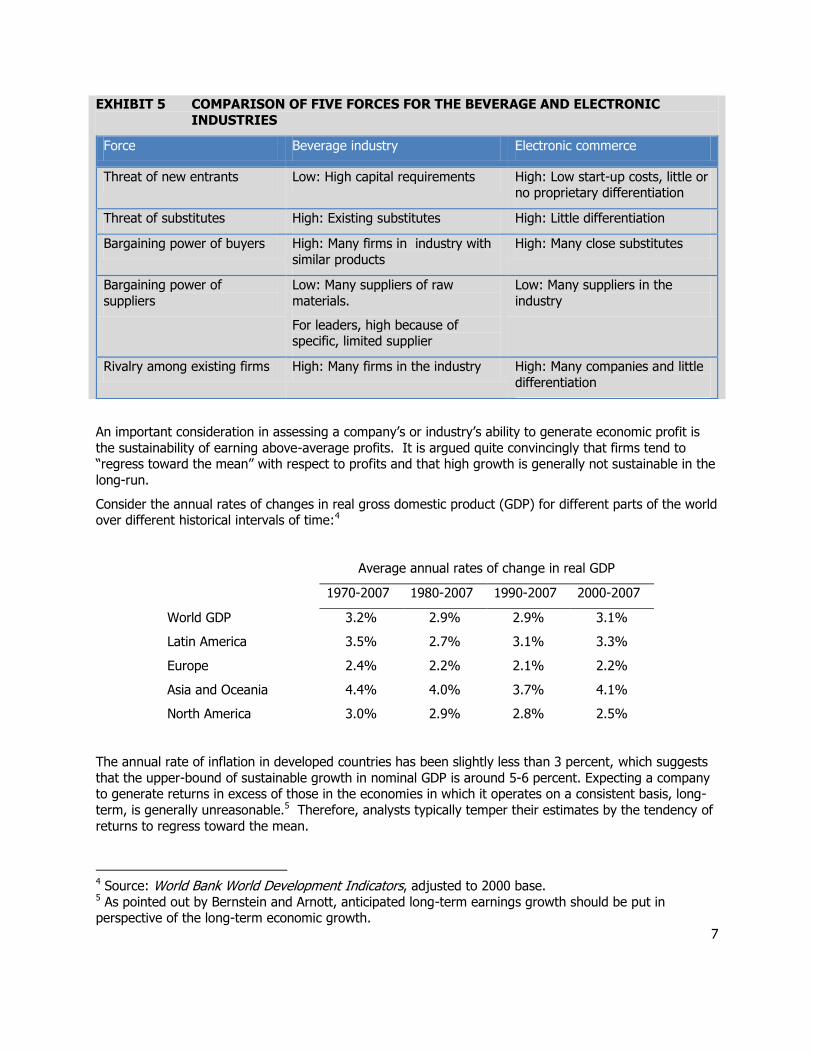
EXHIBIT 5 COMPARISON OF FIVE FORCES FOR THE BEVERAGE AND ELECTRONIC
INDUSTRIES
Force Beverage industry Electronic commerce
Threat of new entrants Low: High capital requirements High: Low start-up costs, little or no proprietary differentiation
Threat of substitutes High: Existing substitutes High: Little differentiation
Bargaining power of buyers High: Many firms in industry with
similar products
High: Many close substitutes
Bargaining power of
suppliers
Low: Many suppliers of raw
materials.
For leaders, high because of specific, limited supplier
Low: Many suppliers in the
industry
Rivalry among existing firms High: Many firms in the industry High: Many companies and little
differentiation
An important consideration in assessing a company’s or industry’s ability to generate economic profit is
the sustainability of earning above-average profits. It is argued quite convincingly that firms tend to “regress toward the mean” with respect to profits and that high growth is generally not sustainable in the
long-run.
Consider the annual rates of changes in real gross domestic product (GDP) for different parts of the world over different historical intervals of time:4
Average annual rates of change in real GDP
1970-2007 1980-2007 1990-2007 2000-2007
World GDP 3.2% 2.9% 2.9% 3.1%
Latin America 3.5% 2.7% 3.1% 3.3%
Europe 2.4% 2.2% 2.1% 2.2%
Asia and Oceania 4.4% 4.0% 3.7% 4.1%
North America 3.0% 2.9% 2.8% 2.5%
The annual rate of inflation in developed countries has been slightly less than 3 percent, which suggests
that the upper-bound of sustainable growth in nominal GDP is around 5-6 percent. Expecting a company to generate returns in excess of those in the economies in which it operates on a consistent basis, long-
term, is generally unreasonable.5 Therefore, analysts typically temper their estimates by the tendency of
returns to regress toward the mean.
4 Source: World Bank World Development Indicators, adjusted to 2000 base. 5 As pointed out by Bernstein and Arnott, anticipated long-term earnings growth should be put in perspective of the long-term economic growth.
8
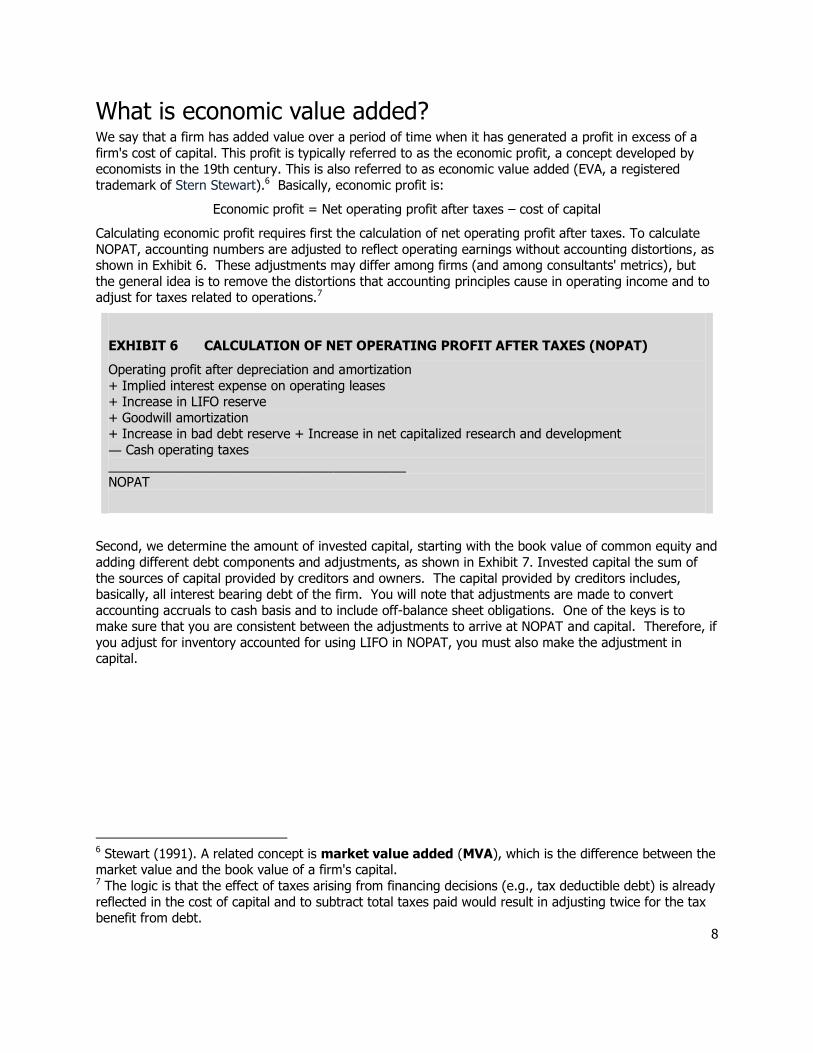
What is economic value added? We say that a firm has added value over a period of time when it has generated a profit in excess of a
firm's cost of capital. This profit is typically referred to as the economic profit, a concept developed by economists in the 19th century. This is also referred to as economic value added (EVA, a registered
trademark of Stern Stewart).6 Basically, economic profit is:
Economic profit = Net operating profit after taxes – cost of capital
Calculating economic profit requires first the calculation of net operating profit after taxes. To calculate
NOPAT, accounting numbers are adjusted to reflect operating earnings without accounting distortions, as shown in Exhibit 6. These adjustments may differ among firms (and among consultants' metrics), but
the general idea is to remove the distortions that accounting principles cause in operating income and to adjust for taxes related to operations.7
EXHIBIT 6 CALCULATION OF NET OPERATING PROFIT AFTER TAXES (NOPAT)
Operating profit after depreciation and amortization
+ Implied interest expense on operating leases + Increase in LIFO reserve
+ Goodwill amortization + Increase in bad debt reserve + Increase in net capitalized research and development
― Cash operating taxes
_________________________________________
NOPAT
Second, we determine the amount of invested capital, starting with the book value of common equity and
adding different debt components and adjustments, as shown in Exhibit 7. Invested capital the sum of
the sources of capital provided by creditors and owners. The capital provided by creditors includes, basically, all interest bearing debt of the firm. You will note that adjustments are made to convert
accounting accruals to cash basis and to include off-balance sheet obligations. One of the keys is to make sure that you are consistent between the adjustments to arrive at NOPAT and capital. Therefore, if
you adjust for inventory accounted for using LIFO in NOPAT, you must also make the adjustment in capital.
6 Stewart (1991). A related concept is market value added (MVA), which is the difference between the market value and the book value of a firm's capital. 7 The logic is that the effect of taxes arising from financing decisions (e.g., tax deductible debt) is already
reflected in the cost of capital and to subtract total taxes paid would result in adjusting twice for the tax benefit from debt.

9
Third, we determine
the cost of capital. This is not as
straightforward as purported. Finally, we
subtract the dollar cost
of capital from net operating profit after
tax. But, as you can see, we could do all
this in a return form as well.
Origins of economic value added Economic profit was established long ago. As an example, consider the writing of Alfred Marshall over 100 years ago. Today we see this concept developed in every principles of economic text. The idea of
economic profit is the basis of the capital budgeting techniques of net present value and the internal rate of return, which can be found in finance texts over the past thirty years.
Economists have been preaching the
concept of economic profit for over 100 years and finance professors have
been putting students through the rigor of net present value and internal
rate of return for thirty years. In the
texts of the late-1960s and early 1970s, the cost of capital is referred to
as the "minimum acceptable return," or the "minimum revenue required". Profit
is defined as earnings in excess of the cost of capital.
Along with promotion of the concept of
economic profit, economics and finance professor have been discouraging the
use of accounting-based performance measures for many years. So why the
change in heart? Most of this change can be credited to Stern Stewart's efforts to develop a product that
has its foundation in economic and financial theory.
Examples Let's look at the basics of determining
value added. Suppose a firm has an accounting profit of $100 million. If the
firm has a cost of capital (in dollar terms) of $75 million, the firm has added $25
million of value during the period. If, on the other hand, the firm has a cost of
EXHIBIT 8 EXAMPLE OF THE CALCULATION OF ECONOMIC PROFIT
NOPAT = $900 million Cost of capital = 10%
Capital = $8,900 million
Economic profit = $900 million - 890 = $10 million
Present value of economic profit = $10 million / 0.10 = $100 million
Value of capital = $8,900 + $100 = $9,000 million
EXHIBIT 7 CALCULATION OF THE AMOUNT OF CAPITAL
Book value of common equity
+ Preferred stock + Minority interest
+ Deferred income tax reserve + LIFO reserve
+ Accumulated goodwill amortization
+ Interest-bearing short-term debt + Long-term debt
+ Capitalized lease obligations + Present value of non capitalized leases
_______________________________ Capital
"When a man is engaged in business, his profits for the year are the excess of his receipts from his business during the year over his outlay for his business. The difference between the value of the stock of plant, material, etc. at the end and at the beginning of the year is taken as part of his receipts or as part of his outlay, according as there has been an increase or decrease of value. What remains of his profits after deducting interest on his capital at the current rate ... is generally called his earnings of undertaking or management."
[Alfred Marshall, Chapter 4, Income, Capital, Book II Some Fundamental Notions, The Principles of Economics, 1890].

10
capital of $125 million, the firm has destroyed $25 million in value.
The cost of capital is the return required by the suppliers of capital. This cost reflects both the time value of money and compensation for risk -- the more risk associated with a firm, the greater the firm's cost of
capital. Factoring in the cost of capital tells us whether the accounting profit of $100 million is sufficient to keep the suppliers of capital (the creditors and the owners) from moving their funds elsewhere.
Let's look at another example of calculating economic profit. If the firm generates $900 million and its
cost of capital is 10%, we say that the firm has added value ($10 million) during the period. If the firm is expected to generate this economic profit in to the future, ad infinitum, we would estimate value of
equity as $9 billion, as we show in Exhibit 8.
Using EVA principles in financial decision-making There is some dissatisfaction with current compensation practices, whether tied to accounting metrics or
using options. One of the most widely touted uses of economic profit metrics is to determine compensation. The basic idea is to tie compensation to a measure of economic profit.
There has not been sufficient time to measure success. Further, there has been a relatively low cost of
capital and an "up" stock market, so we have not seen what happens when the cost of capital increases.
There is anecdotal evidence on both successes and failures of implementing economic value added. It is
difficult to distinguish firms on the basis of the "extent" to which the program is applied
Economic value-added-principles include not only tying compensation to economic profit, but changing
financial policy -- especially capital structure policy. A greater use of debt financing is advocated (i.e., repurchase of common stock financed with debt). This is consistent with financial theory that touts the
benefits from debt financing.
There are several concerns about using value-added measures as a metric for determining investment strategies, including:
1. Economic profit is measured with error.
2. EVA-based policies have not been tested in high-interest environments.
3. The empirical evidence suggests that value-added measures are really not much better than
traditional measures (e.g., return on investment).
Conceptual Issues
Time horizon
Over what period is added value measured? Decisions are made today that, hopefully, generate future cash flows of a firm. How do we measure performance over a recent period of time whose benefit may
not be realized until some time in the future? One approach is to look at current periods' economic profit.
If we calculate economic profit for a period of time, we are measuring income from an historical period.
Have we captured the benefit from this period's decisions on future period's income? Probably not. Only
under specialized circumstances have we captured future benefits.
Short sighted versus far-sightedness
Using economic profit, have we encouraged management to become far-sighted instead of short-sighted? Probably not. Have we improved upon accounting profit as a measure of performance? Probably. What
we have done by using economic profit in place of accounting profit is make the firm's management more
accountable to the suppliers of equity capital.
11
Momentum
Instead of looking at single-period measures, we could look at multiple periods, focusing on year-to-year changes and "momentum". Issues: However, "momentum" is a vague concept (2 years' improvement? 3
years'?) As more time is considered, there is more chance that management has changed.
Momentum tells us that the firm has generated economic profit in the past. This does not tell us that the
firm will generate economic profit in the future. Using economic theory, one may argue that firms that
have generated economic profit in the past are less likely to generate them in the future (since barriers to competition tend to fall over time).
Does it really work?
The key to understanding a performance metric is to see how well it performs in rigorous testing. Are the firms that add value (per the value-added metric) also the firms that benefit shareholders the most? The
answer is empirical. The difficulty is that there is a great deal of anecdotal evidence that touts the success of metrics, but much of this is provided by consulting firms. Academic studies suggest that use of
economic value added in decision-making may not result in better performance by firms.8
Computational Issues
Adjustments to accounting income
One of the primary concerns that we have with accounting principles is that there is one set of principles
(with few choices) that is applied to many different types of firms. Are the adjustments required for economic value-added subject to the same criticism? The adjustments require many assumptions and
estimations. Some of these adjustments are not palatable. Many of these adjustments differ among consultants.
Calculating amount of capital
Adjustments are made (e.g., add back LIFO reserve) to book values. Some estimations are required (e.g., present value of non-capitalized leases) Many book values are used in the calculation of capital. But
just how good a number is a book value of an asset?
Cost of capital calculations
There is no general agreement on the "correct" method of calculating the cost of capital. The cost of
capital is sensitive to the method of calculation. Issues that arise:
1. Dividend valuation method vs. CAPM?
2. If CAPM, which beta to use? We know that individual security betas are unstable over time.
3. Risk-free rate of return? Which rate to use? 5%? 6%?
And economic profit is, in turn, sensitive to the calculation of the cost of capital.
8 Peterson and Peterson show that value-added metrics do not outperform traditional measures (i.e.,
whatever edge the value-added metrics have it is slight). Bacidore, Boquist, Milbourn and Thakor show
that EVA explains 1% of variation in abnormal returns (i.e., R-squared of 1%). Kramer and Pushner
(1997) regress MVA on EVA and find an R-square of 10% and conclude that the market focuses more
on reported earnings than economic value added.
12
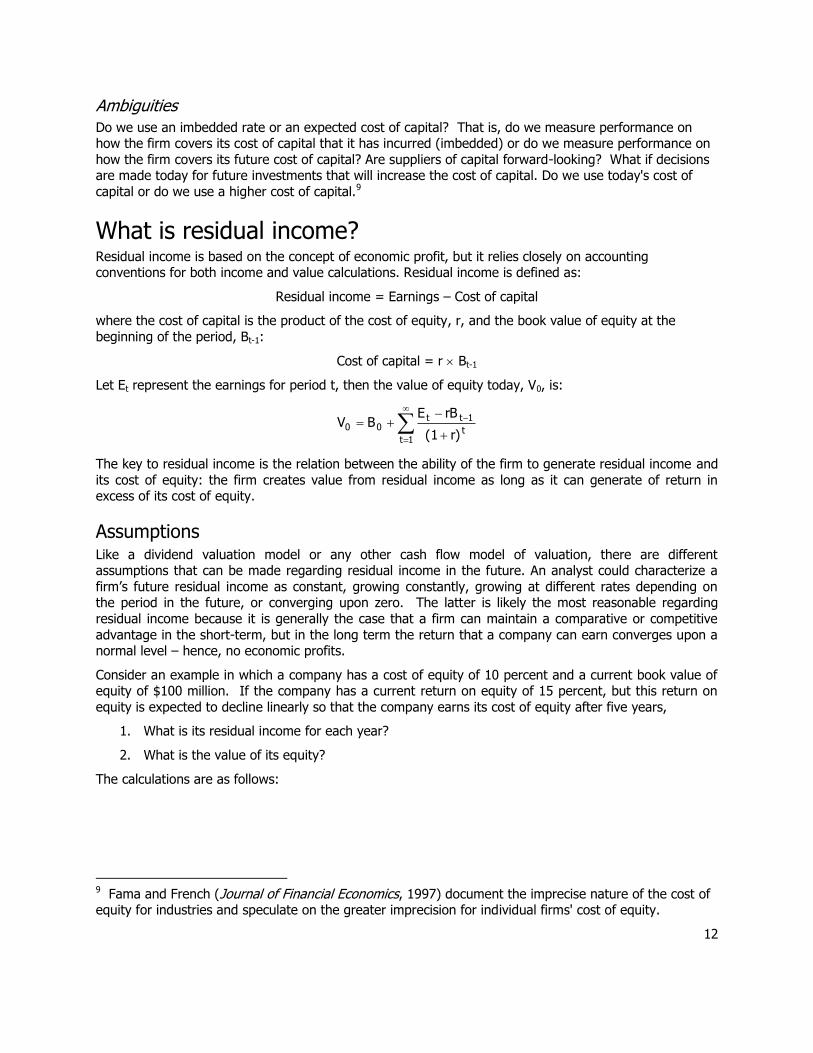
Ambiguities
Do we use an imbedded rate or an expected cost of capital? That is, do we measure performance on how the firm covers its cost of capital that it has incurred (imbedded) or do we measure performance on
how the firm covers its future cost of capital? Are suppliers of capital forward-looking? What if decisions are made today for future investments that will increase the cost of capital. Do we use today's cost of
capital or do we use a higher cost of capital.9
What is residual income? Residual income is based on the concept of economic profit, but it relies closely on accounting conventions for both income and value calculations. Residual income is defined as:
Residual income = Earnings – Cost of capital
where the cost of capital is the product of the cost of equity, r, and the book value of equity at the
beginning of the period, Bt-1:
Cost of capital = r Bt-1
Let Et represent the earnings for period t, then the value of equity today, V0, is:
1tt
1tt00
r)(1
rBEBV
The key to residual income is the relation between the ability of the firm to generate residual income and
its cost of equity: the firm creates value from residual income as long as it can generate of return in excess of its cost of equity.
Assumptions Like a dividend valuation model or any other cash flow model of valuation, there are different assumptions that can be made regarding residual income in the future. An analyst could characterize a
firm’s future residual income as constant, growing constantly, growing at different rates depending on the period in the future, or converging upon zero. The latter is likely the most reasonable regarding
residual income because it is generally the case that a firm can maintain a comparative or competitive
advantage in the short-term, but in the long term the return that a company can earn converges upon a normal level – hence, no economic profits.
Consider an example in which a company has a cost of equity of 10 percent and a current book value of equity of $100 million. If the company has a current return on equity of 15 percent, but this return on
equity is expected to decline linearly so that the company earns its cost of equity after five years,
1. What is its residual income for each year?
2. What is the value of its equity?
The calculations are as follows:
9 Fama and French (Journal of Financial Economics, 1997) document the imprecise nature of the cost of equity for industries and speculate on the greater imprecision for individual firms' cost of equity.
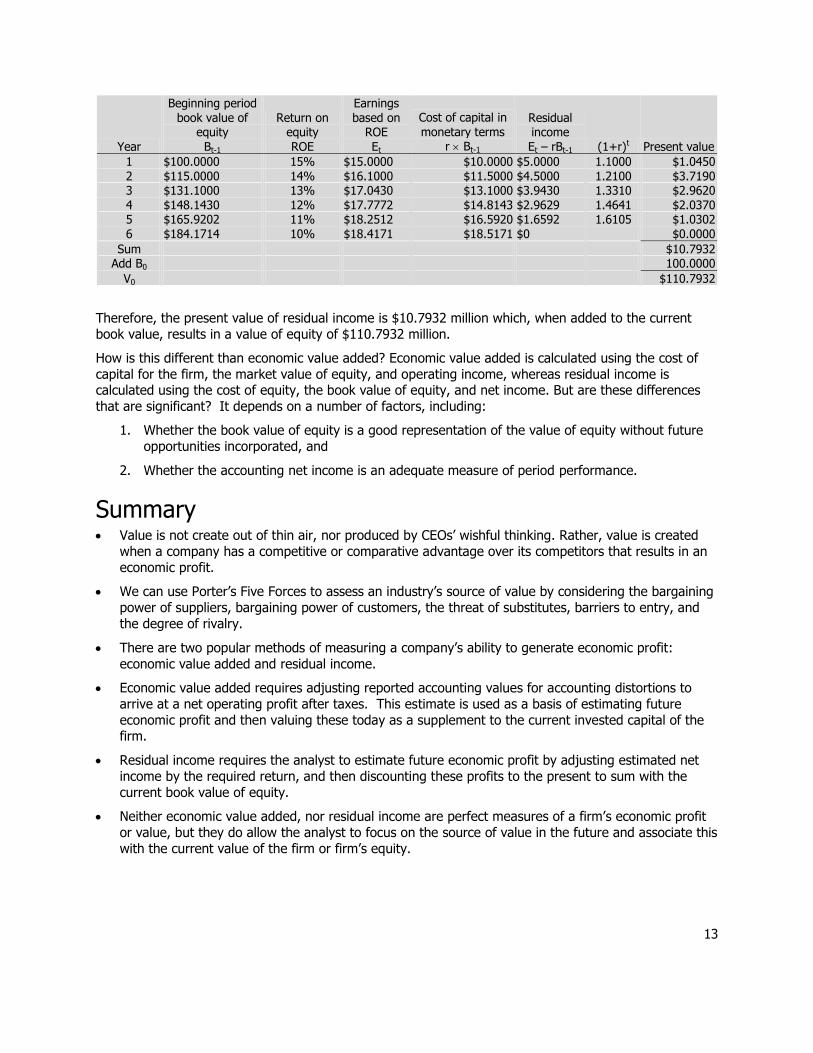
13
Year
Beginning period book value of
equity Bt-1
Return on equity ROE
Earnings based on
ROE Et
Cost of capital in monetary terms
r Bt-1
Residual income Et – rBt-1 (1+r)t Present value
1 $100.0000 15% $15.0000 $10.0000 $5.0000 1.1000 $1.0450 2 $115.0000 14% $16.1000 $11.5000 $4.5000 1.2100 $3.7190 3 $131.1000 13% $17.0430 $13.1000 $3.9430 1.3310 $2.9620 4 $148.1430 12% $17.7772 $14.8143 $2.9629 1.4641 $2.0370 5 $165.9202 11% $18.2512 $16.5920 $1.6592 1.6105 $1.0302 6 $184.1714 10% $18.4171 $18.5171 $0 $0.0000
Sum $10.7932 Add B0 100.0000
V0 $110.7932
Therefore, the present value of residual income is $10.7932 million which, when added to the current
book value, results in a value of equity of $110.7932 million.
How is this different than economic value added? Economic value added is calculated using the cost of
capital for the firm, the market value of equity, and operating income, whereas residual income is calculated using the cost of equity, the book value of equity, and net income. But are these differences
that are significant? It depends on a number of factors, including:
1. Whether the book value of equity is a good representation of the value of equity without future
opportunities incorporated, and
2. Whether the accounting net income is an adequate measure of period performance.
Summary Value is not create out of thin air, nor produced by CEOs’ wishful thinking. Rather, value is created
when a company has a competitive or comparative advantage over its competitors that results in an
economic profit.
We can use Porter’s Five Forces to assess an industry’s source of value by considering the bargaining
power of suppliers, bargaining power of customers, the threat of substitutes, barriers to entry, and
the degree of rivalry.
There are two popular methods of measuring a company’s ability to generate economic profit:
economic value added and residual income.
Economic value added requires adjusting reported accounting values for accounting distortions to
arrive at a net operating profit after taxes. This estimate is used as a basis of estimating future
economic profit and then valuing these today as a supplement to the current invested capital of the firm.
Residual income requires the analyst to estimate future economic profit by adjusting estimated net
income by the required return, and then discounting these profits to the present to sum with the
current book value of equity.
Neither economic value added, nor residual income are perfect measures of a firm’s economic profit
or value, but they do allow the analyst to focus on the source of value in the future and associate this
with the current value of the firm or firm’s equity.

14
References Bacidore, Jeff, John Boquist and Anjan V. Thakor, “The Search for the Best Financial Performance
Measure: Yes, Basics are Better – If You Understand Them”, Financial Analysts Journal, 1999. Bernstein, William J., and Robert D. Arnott, “Earnings Growth: The Two Percent Dilution,” Financial
Analysts Journal, September/October 2003, pp. 47-55.
Fama, Eugene, and Kenneth R. French, “Industry Costs of Equity,” Journal of Financial Economics, 1997.
Kramer, Jonathan K., and George Pushner. “An Empirical Analysis of Economic Value Added as Proxy
of Market Value Added, Financial Practice and Education, Vol. 7 pp. 41-49.
Peterson, Pamela, and David R. Peterson. Company Performance and Measures of Value Added,
Research Foundation of ICFA, December 1, 1996.
Porter, Michael E. “How Competitive Forces Shape Strategy,” Harvard Business Review, March/April
1979. Stewart, G. Bennett, III. The Quest for Value, HarperBusiness, HarperCollins Publishers, Inc. 1991.
Further readings and resources Damodaran, Aswath. “Valuation Approaches and Metrics: A Survey of the Theory and Evidence,”
Stern School of Business, November 2006.
Institute for Strategy and Competitiveness, Harvard University, www.isc.hbs.edu.
Peterson, Pamela, and David R. Peterson. Company Performance and Measures of Value Added,
Research Foundation of ICFA, December 1, 1996. Stern Stewart & Co., www.sternstewart.com.
Value Based Management.net
Index Bargaining power of buyers, 5
Bargaining power of suppliers, 4
Barriers to entry, 4 Clean surplus accounting, 1
Cost of capital, 10 Dirty surplus accounting, 1
Economic profit, 1 Economic value creation, 1
Economics of scale, 3
Economies of scale, 3 EVA, 1
Five Forces, 3
Intensity of rivalry, 5
Market value added, 8 Monopolistic competition, 6
Monopoly, 6 MVA, 8
Oligopoly, 6 Perfect competition, 6
Porter’s Five Forces, 3
Residual income, 1