v. the influence of electricity spot prices on electricity
TRANSCRIPT

Chapter V
Docket No. PA02-2-000 Price Manipulation in Western Markets V-1
V. The Influence of Electricity Spot Prices on Electricity Forward Prices
Summary of Results
The vital link between the spot price and forward price for a commodity is the ability to store the commodity. In essence, someone can meet future needs by purchasing the commodity now and storing it for future consumption. As a result, the forward price that someone is willing to pay will approximate the cost of purchasing plus the carrying cost involved with stockpiling and net of the risk associated with not holding the physical commodity. Since electricity has few storage applications, we would expect to see little or no relationship between spot electric prices today and the forward price of electricity. Instead, forward prices should mostly reflect a buyer’s expectations of prices in the future. Since natural gas is the marginal fuel for producing electricity in the West, forward gas prices should, in large part, explain forward electricity prices. Our analysis shows, however, that the forward power contracts negotiated during the period 2000–2001 in the western United States were influenced by then-current spot prices, presumably because spot power prices influenced buyers’ and sellers’ expectations of spot prices in the future. The influence of spot prices on forward prices was the greatest for forward contracts with the shortest time to delivery (1-2 years) and varied by location. While Staff has found a statistically significant relationship, the magnitude of the impact is limited (that is, the impact of spot power prices on long-term power prices is clearly not dollar-for-dollar). Rather, a reduction of about one-third in the price of a 2-year forward contract would require a finding that spot power prices were three times above the just and reasonable level.
Background The relationship between electricity spot prices and long-term contract prices has been the subject of debate since Enron filed for bankruptcy in December 2001. Questions have been raised in Congress and the media about whether Enron manipulated the spot market to influence the West forward market. The Commission’s February 13, 2002 Order establishing the fact-finding investigation specifically directed FERC Staff to look into whether manipulated spot prices resulted in unjust and unreasonable long-term power sales contracts.
Chapter V
Docket No. PA02-2-000 Price Manipulation in Western Markets V-2
In addition, a number of utilities1 filed complaints with the Commission alleging that dysfunctions in the California electricity spot markets caused long-term contracts negotiated in the bilateral markets in California, Washington, and Nevada to be unjust and unreasonable. The complainants seek the extraordinary remedy of contract modification. The Commission issued an Order on April 11, 2002 consolidating these complaints and set them for an evidentiary hearing.2 Subsequently, additional complaints were set for hearing. Two studies that estimated the electricity spot/forward price relationship were filed in testimony in the proceeding. On July 2, 2002, Snohomish submitted Mr. Robert McCullough’s Direct Testimony. Mr. McCullough alleges a link between short-term prices and the prices of long-term contracts.3 Mr. McCullough’s analysis found a large, significant correlation between prices for short-term and long-term contracts. On August 27, 2002, Mr. McCullough’s analysis was challenged by Mr. William W. Hogan and Mr. Scott M. Harvey.4 Representing Morgan Stanley Capital Group, Inc., Mirant Americas Energy Marketing, L.P., American Electric Power Service Corporation, and Reliant Energy Services in the same proceedings, Mr. Hogan and Mr. Harvey testified that no significant correlation can be demonstrated between spot and long-term power prices.
1Nevada Power Company (Nevada Power) and Sierra Pacific Power Company (Sierra Pacific), Southern California Water Company (SCWC), and Public Utility District No. 1 Snohomish County, Washington (Snohomish). 2Consolidated proceeding: Nevada Power Company and Sierra Pacific Power Company v. Enron Power Marketing, Inc., El Paso Merchant Energy, and American Electricity Power Services Corporation; Nevada Power Company v. Morgan Stanley Capital Group, Calpine Energy Services, Reliant Energy Services, and Mirant Americas Energy Marketing, L.P.; Southern California Water Company v. Mirant Americas Energy Marketing, L.P.; and Public Utility District No. 1, Snohomish County, Washington v. Morgan Stanley Capital Group, Inc.—Docket Nos. EL02-28-000, EL02-33-000, EL02-38-000, EL02-29-000, EL02-30-000, EL02-32-000, EL02-34-000, EL02-39-00, EL02-43-000, and EL02-56-000. 3Testimony of Robert McCullough, Exh. SNO-17. 4Prepared Answering Testimony of Scott M. Harvey and William W. Hogan, Exh. No. MSC-65.

Chapter V
Docket No. PA02-2-000 Price Manipulation in Western Markets V-3
Comparison of the Two Studies
McCullough used different econometric models than Harvey and Hogan to estimate the spot/forward price relationship. McCullough used a simple regression model to estimate the relationship between electricity forward and spot prices. This model uses only two variables: an explanatory variable and a dependent variable. McCullough attempted to estimate how the change of electricity spot prices (explanatory variable) correlates with electricity forward prices (dependent variable). By running this simple regression model with NYMEX strip prices5 and spot prices from Energy Markets Report, McCullough estimated that, at the Palo Verde trading hub, 51 percent of the variance in the forward power price can be explained by the variance in the spot power price, and at the California-Oregon Border (COB) trading hub it is 40 percent. McCullough concluded that the change in the daily price was very closely correlated to the change of the forward price.6 Harvey and Hogan made several refinements to the McCullough analysis. First, they included forward gas prices and other independent variables designed to capture monthly and seasonal effects in their regression analysis. Second, they performed several analyses using alternative measures of forward power prices including NYMEX futures prices and forward prices reported by TFS, a major independent broker. Third, they employed econometric techniques specifically designed to address time-series data with “serial correlation.”7 Their analyses generally show small and statistically insignificant impacts of spot power prices on forward power prices.8 Neither study has the benefit of reliable data on long-term power sales contracts in the West during 2000–2001. There was little or no transaction volume in the NYMEX electricity futures market after February 2000. The electricity futures closing prices published by NYMEX until the product was delisted in February 2002 were not based on actual trading on the exchange. NYMEX maintained its index by surveying prices of bilateral trades.
5NYMEX strip prices are an average of the daily settlement prices of the next 12 months of futures contracts. 6Testimony of Robert McCullough, Exh. SNO-17, pp. 86-87. 7Serial correlation is discussed at more length in Appendix V-D. 8Prepared Answering Testimony of Scott M. Harvey and William W. Hogan, Exh. No. MSC-65, p. 139, line 22 to p. 140, line 2.

Chapter V
Docket No. PA02-2-000 Price Manipulation in Western Markets V-4
Staff’s Analysis To help resolve the debate on this important issue, Staff performed its own statistical analysis with the help of an independent outside consultant, Robert S. Pindyck,9 a nationally recognized econometrician with a specialty in energy futures markets, and consultants from Analysis Group/Economics. Our methods, data, models, and results are presented as follows: the basic economic logic and statistical methods that Staff employed, the data that Staff relied on for the analysis, the regression model used in detail, and the main results. Detailed results are provided in the appendices to this chapter.
Basic Economic and Statistical Methodology
Economics For a storable commodity, such as crude oil, there is a clear relationship between spot and forward (or futures) prices that depends on the flows of benefits to producers and consumers from holding inventories.10 Because of electricity’s limited storability, the relationship between spot and forward prices is not as clear. Instead, forward power prices should largely reflect expectations of future demand and supply conditions. Expectations, however, are often difficult to measure. In electricity markets, forward prices for fuel can provide an important measure of expectations about future electricity costs. In the western United States, natural gas is the marginal fuel for electricity in the short term, particularly in California and even in the Northwest when hydro water levels are low (as they were in 2000–2001), and in the long term for the construction of new generating capacity. As a result, forward gas prices should help explain forward electricity prices to the extent that prices reflect costs. The futures market for gas delivered to Henry Hub provides transparent signals about future input prices. Forward prices 9Robert S. Pindyck is a professor of Economics and Finance, Sloan School of
Management, Massachusetts Institute of Technology. 10See, for example, B. Routledge, D. Seppi, and C. Spatt, “Equilibrium Forward Curves for Commodities,” The Journal of Finance, v. LV, no. 3, June 2000, pp. 1297-1338, and R. Pindyck, “The Dynamics of Commodity Spot and Futures Markets: A Primer,” The Energy Journal, v. 22, no. 3, June 2001.
Chapter V
Docket No. PA02-2-000 Price Manipulation in Western Markets V-5
for delivery of gas to specific locations in the West are less transparent. Nonetheless, market participants had access to forward market price quotations for gas to be delivered in the western United States, and could use these to project likely power prices. In power markets, a relationship between spot and forward prices can exist when current spot prices convey information about spot prices in the future. For example, if one component of the current spot price represents market “dysfunction,” market participants might use current spot prices to formulate expectations about future dysfunction.
Statistical Methodology We tested the relationship between forward and spot power prices using multiple linear regression, because there are many factors that potentially explain forward power prices. Multiple linear regression is a statistical method for decomposing the influence of different factors (independent variables) on a variable of interest (dependent variable). We seek to explain forward power prices as a function of current spot prices, forward gas prices, and seasonal factors. The forward gas price is the fundamental factor that drives the forward power price in the western United States because gas is the short- and long-term marginal fuel. Controlling for the forward gas price, we can test whether the current spot price can explain any portion of the variation in forward power prices. We also include dummy variables to capture seasonal effects.11 Many seasonal factors influence energy markets. On the supply side, hydroelectric resources vary seasonally. On the demand side, weather varies seasonally and influences consumption. A spot price that appears high in the spring may be normal for the summer. By including season dummy variables, we attempt to isolate the effect of abnormal spot price movements on forward prices. Most of our results are based on ordinary least squares (OLS) regression, but we employed several other linear regression techniques to address specific econometric issues.
11Dummy variables are the standard way of representing binary (yes/no) effects in regressions. The dummy variable for a season takes the value of 1 if the observation in question occurs during that season and is 0 otherwise.

Chapter V
Docket No. PA02-2-000 Price Manipulation in Western Markets V-6
Data We requested data from wholesale sellers in the West on their electricity transactions during 2000 and 2001.12 The data request was targeted at all marketers active in the West and compliance with the request was nearly universal. The responses to the Staff data request were provided in electronic templates. These responses left some room for interpretation. As discussed below, we spent a considerable amount of effort in comparing different parties’ responses and verifying responses against written contracts and other documentation provided by most, but not all, sellers. To the best of our knowledge, this is the most comprehensive database of forward power contracts for the period and locations in question.
Sample Size In our March 5, 2002 Data Request, we asked market participants to report all of their short-term, monthly, and long-term energy sales. We defined short-term sales as transactions of a week or less. Monthly sales were defined as transactions with a period of 1 month. Long-term sales were defined as transactions with a contract duration of 1 year or more. We focused our analysis exclusively on long-term contracts. The data reflect contracts for delivery during peak, off-peak, and all hours. The majority of contracts in the database are for peak deliveries. In addition, by definition, peak hours cover the periods of highest demand and hence are the most economically significant. Therefore, our analysis relies on contracts for peak delivery exclusively. Staff received data on long-term transactions (a year or more in duration) that either included the period 2000–2001 or were signed after January 2000. We included in our analysis contracts signed from the beginning of 2000 through March 2002, when the data request was issued. For this 27-month period, we have 2,652 unique contracts for the 5 major delivery locations on which we focus our analysis. We considered two major subperiods: the period from January 2000 leading up to and including the period of high Western power prices, and the period after June 19, 2001 (when West-wide price mitigation
12Staff data request to all jurisdictional sellers and all nonjurisdictional sellers in the West issued March 5, 2002 in Docket PA02-02.

Chapter V
Docket No. PA02-2-000 Price Manipulation in Western Markets V-7
went into effect)13 through March 2002. As Table V-1 demonstrates, the number of observations varies by location and period. The first 18 months account for 1,066 observations, or 40.2 percent of the total. The last 9 months account for 1,586 observations, or 59.8 percent of the total. Table V-1. Sample Size by Region and Period Definition
Hub 1/1/00 – 6/30/01 7/1/01 – 3/31/02 Mid-C/COB 199 163 NP15 136 429 SP15 314 635 PV 417 359 All Hubs 1,066 1,586
Hubs and Duration Classes Our analysis considered contracts at the five main trading hubs in the West—COB, Mid-Columbia (Mid-C), Palo Verde (PV), and California Independent System Operator (ISO) zones NP15 and SP15. We treat Mid-C and COB as a single hub based on the high correlation of prices at these two locations.14
As discussed above, one key issue that we sought to address is how the relationship between spot and forward power prices changes with time to delivery. To simplify our analysis of this issue, we grouped contracts into time-to-delivery bins.15 We initially assigned contract duration classes corresponding roughly to the time between each contract’s signing date and the midpoint of its delivery window rounded to the nearest year—e.g., a contract for 10 years of deliveries signed and commencing today was assigned a duration of 5.
13The June 19, 2001 Order marks the date when all sellers in the western United States were subject to a must-offer requirement and price caps. See 95 FERC at 62, 558. 14In addition, we performed statistical analyses in which we tested whether the relationship between spot and forward prices at the two locations was different. We could never reject the null hypothesis that the relationship at the two hubs was the same. 15Alternatively, we could have used more complicated nonlinear regression techniques in which we allowed various model coefficients to depend on time to delivery.

Chapter V
Docket No. PA02-2-000 Price Manipulation in Western Markets V-8
Forward Gas and Electricity Spot Price Data We relied on two different commercially available databases for our independent variables. We obtained data on forward gas prices for various locations in the West from TFS, an independent power and gas broker16 that has collected the most complete forward gas quotes covering the period and locations in question. Staff also obtained the forward gas prices that Williams and Enron used to price their own trades. Limited forward gas prices from Morgan Stanley are publicly available.17 We have verified that the TFS quotes are broadly consistent with the forward curves used by these major market participants.18 It is useful to know that expectations about forward gas prices were roughly similar among major market participants. For our analysis, however, we used TFS data because of their independence. The long-term transaction data used in our analysis are for periods of 1 year or more. The TFS forward gas quotes are for delivery periods of 1 month. In our regression analysis, we use averages of these monthly gas prices calculated over the entire delivery period of each forward power contract. Because gas and electricity are traded at slightly different locations, we had to decide which forward gas price to assign to the forward power contracts at each location. Our assumed correspondence is as follows: Power Trading Hub Relevant Gas Hub Price
SP15 Topock NP15 Malin COB Malin
Mid-Columbia Sumas Palo Verde Permian
For spot power prices, we used the on-peak firm power prices reported by Bloomberg. For the two delivery locations inside the California ISO (NP15 and SP15), we compared the Bloomberg prices to the average of the hourly day-ahead prices for peak hours of the California Power Exchange (PX) during the period when the PX was still operating. The Bloomberg prices are consistent with the PX prices.
16Information about TFS Brokers is available at http://www.tfsbrokers.com/. 17See Harvey and Hogan, op. cit., note 4. 18The details of this comparison are discussed in Appendix V-B.

Chapter V
Docket No. PA02-2-000 Price Manipulation in Western Markets V-9
Audit Process and Results We performed a number of initial quality checks on the transaction data we collected and contacted respondents to resolve problems with the data. We undertook a comprehensive audit of the filed data by comparing reported transaction data with reported actual contracts and contract confirmations.19 We audited all contracts that were supported with appropriate documentation. Auditable transactions make up about 59 percent of the total number of transactions.20 Once we verified the sales data for these auditable transactions, we compared the results of a statistical analysis that used just the audited data with the results of an analysis that used all transactions.21 The regression results using the audited-only transaction data and the all-transaction data generally are not significantly different statistically. Therefore, we concluded that including the remaining unaudited data did not change our results and decided that further review of the data was not necessary.
Regression Specification
Definition of Sample Period Our primary analysis covers the 18-month period from January 2000 through June 2001. The long-term transaction data we collected cover the period from January 1999 to March 2002. We focused our attention on the period through June 2001 because of the West-wide price mitigation put in place beginning June 19, 2001. We examined the period after June 2001 separately to assess whether the relationship between spot and forward power prices changed with this change in market structure.
19The details of this audit are discussed in Appendix V-A. 20Table V-A2 in Appendix V-A shows the breakdown of documented and undocumented contracts by seller. 21This analysis is shown in Appendix V-A, Tables V-A3 and V-A4.

Chapter V
Docket No. PA02-2-000 Price Manipulation in Western Markets V-10
Basic Equation Our regressions have the following general form: log( ) log( ) log( )ijt ij ij it ij ijt ijtFP a b SP c FG e+= + + +q (1) For example, FPijt is the forward electricity price in year 2003 (time t) for delivery at Palo Verde (location i) in year 2008 (time j), SPit is the spot price at Palo Verde in 2003, and FGijt is the forward gas price in 2003 for delivery at Permian in 2008. Factor q controls for seasonal variations22 and eijt captures any remaining unexplained component of FPijt. We estimate equation (1) in logs. A log specification has a number of desirable properties in the context of estimation such as ours. In particular, it captures a constant proportional relationship between the dependent and independent variables over a wide range of prices. For example, it assumes that an increase in spot power prices from $100 to $110 has the same percentage impact on forward power prices as an increase from $10 to $11.23 When equation (1) is specified in logs, the coefficient on the spot electricity price, bij, is the elasticity of forward electricity prices with respect to spot electricity prices. The elasticity is the ratio of the percentage change in one variable with respect to the percentage change in another variable.
Aggregation As discussed above, we examined data for five hubs and a number of duration classes. After some preliminary analysis, we decided to treat COB and Mid-Columbia as a single hub. In addition, we were able to obtain stable and precise results by aggregating the duration into three classes: (1) contracts with average times to delivery of less than 2 22We define seasons quarterly (i.e., spring is March to May, summer is June to August, fall is September to November, and winter is December to February). 23There are technical reasons for preferring a log specification. The error for regressions based on price data usually is thought to be proportional to price, i.e., a $10 error for a $100 price is equivalent, by some measure, to a $1 error for a $10 price. If the error is in fact proportional to the level of prices, specifying the estimation in logs guarantees that the individual elements of the error are homoscedastic, i.e., equal in variance, and hence that our parameter estimates are unbiased and efficient. In other words, a log specification guarantees that our parameter estimates are as accurate and precise as possible. If the elements of the error are not homoscedastic, not only are parameter estimates from OLS regression inefficient, but estimated standard errors are biased and hence can lead to incorrect statistical inference. For a discussion of these issues see R. Pindyck and D. Rubinfeld, Econometric Models and Economic Forecasts, 4th edition, New York: McGraw-Hill, 1998, pp. 146-152.
Chapter V
Docket No. PA02-2-000 Price Manipulation in Western Markets V-11
years, (2) contracts with average times to delivery of 3 to 4 years, and (3) long-term contracts with average times to delivery of 5 years or greater.24
Instrumental Variables Statistical inference using OLS regression rests on a set of assumptions. One assumption is that the error, i.e., the component of the dependent variable that is not explained by the statistical model, is uncorrelated with any of the independent variables. Given that forward gas and power prices are simultaneously determined, i.e., the forward gas price is a major input to the generation of electricity and the generation of electricity is a major source of demand for gas, this assumption may not hold in our case. Hence, estimation of equation (1) may show a correlation between forward gas and power prices, but that correlation cannot be interpreted as causal. We address this econometric issue using a technique known as instrumental variables (IV) estimation,25 which attempts to break the circle of simultaneity by using proxy variables, or instruments, that are not plagued by the same simultaneity problems. “Good” instruments have two characteristics: (1) they are exogenous, i.e., they are uncorrelated with the error, and (2) they are correlated with the variable for which they are instruments. Our instrument for the forward gas price was the contemporaneous forward gas price at Henry Hub. Henry Hub, near the production basins along the Gulf Coast, is a large and liquid trading hub. Gas originating at or near Henry Hub has a variety of uses throughout the United States, including electricity generation, chemical processing, and heating. Demand for gas for electricity generation in the western United States should have relatively little impact on Henry Hub prices, and the Henry Hub forward price therefore meets the first criterion of a good instrument. With respect to the second criterion for a good instrument, because there is some transportation between Henry Hub and locations in the West, Henry Hub prices are usually correlated with prices in the West. Absent the ability to store electricity, there is no reason to believe that current spot power prices are influenced by expectations about future gas and power prices as reflected in forward prices, so we treat spot power as exogenous in our estimation, i.e., we do not instrument for it.
24Detailed results based on the disaggregated data are presented in Appendix V-D. 25See R. Pindyck and D. Rubinfeld, op. cit., Chapter 7.

Chapter V
Docket No. PA02-2-000 Price Manipulation in Western Markets V-12
Under the assumption that a set of instruments is “valid,” the extent of any bias due to simultaneity can be assessed by comparing instrumental variables and ordinary least squares parameter estimates.26 When these estimates are close, any presumed simultaneity problem is negligible. In the next section, we present the regression results using both ordinary least squares with and without instrumental variables. Our estimates tell us that any simultaneity problem is negligible. Therefore, we believe that the results using the ordinary least squares method are appropriate for use in the long-term power contract proceeding.
Regression Results Our analysis is summarized below. We performed separate analyses for the periods before and after West-wide price mitigation was introduced. The subsequent section discusses a few minor extensions and modifications of our analysis.
“During” Period Results Summary We found that spot power prices influence forward power prices in a statistically significant and economically important way. In the simplest formulation, in which we estimated a single average elasticity for all contracts of different times to delivery and different locations, the elasticity is 0.07. This formulation masks substantial variation in the elasticity by region and time to delivery—the longer the contract duration, the lower the impact of spot market prices upon the forward price. Table V-2 shows results based on an analysis that combines data from all five trading hubs, and shows the effect of time to delivery. As expected, the effect declines with time to delivery. Using ordinary least squares, the point estimates of the spot power coefficients range from 0.05 to 0.33. These estimates imply that for each 10-percent increase in the spot price, forward power prices rose by approximately 0.5 percent to 3.3 percent. These effects are larger for contracts with short times to delivery than contracts with longer times to delivery.
26This comparison can be formalized as a Hausman test. See R. Davidson and J. MacKinnon, Estimation and Inference in Econometrics, New York: Oxford University Press, 1993.

Chapter V
Docket No. PA02-2-000 Price Manipulation in Western Markets V-13
Table V-2. Spot Power Coefficient by Time-to-Delivery Class: “During” Period
Ordinary Least Squares (OLS) With Instrumental Variables (IV) Time-to-Delivery Class
Spot Power Coefficient
Standard Error
t-Statistic Spot Power Coefficient
Standard Error
t-Statistic Number of Observations
1-2 Years 0.33 0.03 9.80 0.27 0.04 6.34 451 3-4 Years 0.12 0.02 6.54 0.11 0.02 5.73 398 5-8 Years 0.05 0.01 3.36 0.06 0.01 4.18 217
The regression results with instrumental variables are generally close to those without instrumental variables. This may indicate that simultaneity is not a significant concern. Alternatively, the results may indicate that, even if the forward gas price is endogenous, it does not bias our estimate of the coefficient on spot power. Table V-2 gives point estimates, standard errors, and t-statistics for the spot power elasticities. The standard error measures the precision of the estimate, i.e., the smaller the standard error the more precise the estimate. The standard error of the OLS estimate for duration class 1-2 years is 0.03. A one standard error band around the point estimate defines a 68-percent confidence interval, i.e., there is a 68-percent probability that the “true” elasticity (i.e., the one we are attempting to estimate) lies between 0.30 (0.33 – 0.03) and 0.36 (0.33 + 0.03). Naturally, our best estimate is in the middle of this range. The t-statistic, which is commonly used to assess whether a parameter estimate is statistically significantly different from zero, is simply the point estimate divided by the standard error. Statistical significance is usually measured at the 90- or 95-percent confidence level. A coefficient is considered statistically significant at the 95-percent confidence level if the value of zero is not within a band around the coefficient value of 1.96 standard deviations. For example, for the OLS for duration class 1-2 years, the 95-percent confidence band is .33 plus or minus (1.96 times .03 = .0588) or between .2712 and .3888. All of the parameter estimates in Table V-2 are statistically significant at the 95-percent level. Table V-3 shows disaggregated results by hub. The OLS and IV coefficients are generally close considering the precision of the estimates. Most estimates of the spot power coefficient are statistically significant at the 90-percent level or higher. For most hubs, we observe the expected pattern of the magnitude of the coefficient on spot power falling with time to delivery. The significance of these results is weakest for contract duration class 5-8. Only for the Palo Verde hub are these results significant at the 95-

Chapter V
Docket No. PA02-2-000 Price Manipulation in Western Markets V-14
percent level. For the other hubs in the 5-8 class, the estimates are not significant at the 90-percent level. Since the effects in Table V-3 seem to vary by location, any policy conclusions should be based on the coefficient for the relevant location.
Table V-3. Spot Power Coefficient by Time to Delivery and Hub: “During” Period
Ordinary Least Squares (OLS) With Instrumental Variables (IV)Hubs Time-to-Delivery Class
Spot Power Coefficient
Standard Error
t-Statistic Spot Power Coefficient
Standard Error t-Statistic
Number of Observations
1-2 Years 0.38 0.09 4.16 0.21 0.13 1.66 101 3-4 Years 0.13 0.04 3.12 0.19 0.05 3.58 62 Mid-C/
COB 5-8 Years (0.00) 0.03 (0.13) (0.01) 0.03 (0.41) 36 1-2 Years 0.22 0.13 1.64 0.29 0.14 2.10 40 3-4 Years 0.14 0.04 3.16 0.14 0.05 3.01 72 NP15 5-8 years 0.06 0.05 1.33 0.06 0.05 1.20 24 1-2 Years 0.38 0.06 6.58 0.40 0.06 6.90 221 3-4 Years 0.09 0.04 2.37 0.08 0.04 2.14 122 PV 5-8 years 0.07 0.02 3.36 0.07 0.02 3.35 74 1-2 Years 0.23 0.08 2.99 0.14 0.08 1.69 89 3-4 Years 0.07 0.03 2.33 0.07 0.03 2.28 142 SP15 5-8 years 0.04 0.03 1.29 0.04 0.03 1.35 83
“After” Period Results Summary Next, we examine whether the relationship between spot and forward power prices changed after the spot market prices stabilized following the introduction of West-wide price mitigation. Tables V-4 and V-5 show these results for the July 2001 to March 2002 period in the same format as Tables V-2 and V-3. They generally show a persistence of the effects found during the crisis, i.e., statistically significant positive elasticities of the forward price with respect to the spot price.
Table V-4. Spot Power Coefficient by Contract Duration Class: “After” Period
Ordinary Least Squares (OLS) With Instrumental Variables (IV) Time-to-Delivery Class
Spot Power Coefficient
Standard Error
t-Statistic Spot Power Coefficient
Standard Error t-Statistic
Number of Observations
1-2 Years 0.12 0.02 7.15 0.13 0.02 7.41 887 3-4 Years 0.12 0.02 7.12 0.14 0.02 7.35 473 5-8 years 0.15 0.02 6.83 0.17 0.02 7.22 226
TableV-4 does not show the decline in elasticity with contract duration observed in Table V-2. On average, the point estimates are smaller than those in Table V-2.

Chapter V
Docket No. PA02-2-000 Price Manipulation in Western Markets V-15
The results in Table V-5 show elasticities that are sometimes smaller and less significant than those in Table V-3, but in other cases the opposite is true. There are regional variations. The SP15 elasticities have larger t-statistics in the “after” period. Several large elasticities estimated for shorter term contracts (0.35 for Mid-C/COB and 0.38 for PV) in Table V-3 are absent from Table V-5. The largest elasticity after the price mitigation is for class 3-4 years at Mid-C/COB. It is unclear why this is the case. Table V-5. Spot Power Coefficient by Hub and Duration: “After” Period
Ordinary Least Squares (OLS) With Instrumental Variables (IV)Hubs Time-to-Delivery Class
Spot Power Coefficient
Standard Error
t-Statistic Spot Power Coefficient
Standard Error t-Statistic
Number of Observations
1-2 Years 0.03 0.05 0.67 0.05 0.05 1.05 91 3-4 Years 0.38 0.08 4.83 0.37 0.08 4.46 45 Mid-C/
COB 5-8 years 0.14 0.07 1.94 0.17 0.08 2.16 27 1-2 Years 0.08 0.02 3.17 0.08 0.02 3.43 204 3-4 Years 0.02 0.02 0.90 0.03 0.02 1.17 145 NP15 5-8 years 0.02 0.03 0.70 0.03 0.03 0.96 80 1-2 Years 0.10 0.06 1.74 0.10 0.06 1.74 197 3-4 Years 0.02 0.05 0.53 0.03 0.05 0.57 106 PV 5-8 years 0.13 0.06 2.30 0.13 0.06 2.27 56 1-2 Years 0.07 0.02 3.26 0.06 0.02 3.04 395 3-4 Years 0.09 0.02 3.82 0.09 0.02 3.88 177 SP15 5-8 years 0.09 0.04 2.29 0.09 0.04 2.28 63
The results for the “after” period show persistence in the relationship between spot and forward power prices. This indicates that the process for forming expectations that developed during the crisis period did not instantly disappear or reverse itself following the implementation of the spot power mitigation measures required by FERC’s June 19, 2001 Order. We have conducted a number of other tests that are described in more detail in Appendix V-C. These are variations on the basic equation using different pooling approaches. The results are broadly consistent with Tables V-2 to V-5. We also report more disaggregated results in this appendix. Finally, we address another econometric issue in Appendix V-D, namely, whether serial correlation affects the estimates and their precision. In Appendix V-D, we show results indicating that this is not the case.

Chapter V
Docket No. PA02-2-000 Price Manipulation in Western Markets V-16
Interpreting Regression Results
To illustrate the implications of the estimated spot power elasticities on forward power prices, we construct some stylized examples. For each of our time-to-delivery classes, we calculated the average forward power price (FP) for all Mid-Columbia and Palo Verde contracts signed between January 1, 2001 and March 31, 2001. To apply the estimated spot power elasticities from Table V-3, we need to assume spot power prices were distorted and by how much. We consider two hypothetical cases: 100-percent and 200-percent distortion. Hypothetical spot power price distortions of 100 percent and 200 percent can be roughly justified with reference to the implied system heat rate calculated in Table V-6 below. The implied system heat rate is simply the spot power price divided by the spot gas price and is a convenient measure of market performance that is sometimes used by traders. Under normal conditions, it would typically be in the range of 10,000 to 11,000 Btu/kWh, representing the thermal efficiency of older steam boilers that typically serve marginal demand in California. Under short supply market conditions the implied system heat rate might be higher than this level. For a useful point of reference, we have calculated the relevant average of “clearing” heat rates that have been used in the California refund case.27 For the same period, these heat rates are in the 15,000 to 17,000 Btu/kWh range during peak demand periods. These values represent very inefficient peaking plants that operated for many peak hours during this period. In comparison, the implied system heat rate for Mid-C and PV in Table V-6 is 2 to 3 times higher.28 This suggests that 100-percent to 200-percent spot price excess may not be unreasonable.
27See Exhibit ISO-6 in the refund case. This exhibit was originally protected; however, the protection was removed by Administrative Law Judge Birchman on December 16, 2001. 28The data in Table V-6 are simple averages over the period between January 1, 2001 and March 31, 2001.

Chapter V
Docket No. PA02-2-000 Price Manipulation in Western Markets V-17
In Table V-6, we calculate the mitigated forward power price (MFP) for each combination of hub and assumed level of spot price distortion using the following equation:29
(1 )MFP FP βγ −= × + where γ is the assumed percentage spot price distortion and β is the estimated elasticity. Table V-6. Impact of Estimated Spot Power Elasticity on Forward Price of Power (January 1, 2001 – March 31, 2001)
Spot
Power Elasticity
Assumed Spot
Power Distortion
Average Forward Power
Price ($/MWh)
Observed31 Mitigated
Hub
Time-to-Delivery
Class
Average Spot
Power Price
($/MWh)30
Average Spot Gas
Price ($/MMBtu)
Implied System
Heat Rate(Btu/kWh) β
γ FP MFP 1-2 Years 0.38 153.75 101.28 3-4 Years 0.13 84.02 72.84 5-8 years -
200% 54.86 54.86
1-2 Years 0.38 153.75 118.15 3-4 Years 0.13 84.02 76.78
Mid-C/ COB
5-8 years
284.21 6.30 (Sumas) 45,113
- 100%
54.86 54.86 1-2 Years 0.38 123.28 81.21 3-4 Years 0.09 71.43 64.71 5-8 years 0.07
200% 52.68 48.78
1-2 Years 0.38 123.28 94.73 3-4 Years 0.09 71.43 67.11
PV
5-8 Years
220.88 6.25 (Permian) 35,341
0.07
100% 52.68 50.18
The calculations in Table V-6 are intended to indicate plausible applications of the statistical results. When we use our estimates of the regression coefficients from Table V-3 under the assumption of 100- to 200-percent spot price excess, we get substantially lower forward
29Starting from the main regression equation FP SP FGβ δα= × × (expressed in equation (1) in logarithmic form), we assume that the observed spot power prices are γ percent inflated over the mitigated spot power prices (MSP), or mathematically, SP = MSP × (1 + γ). Substituting for SP we then get
(1 )(1 )
SPMFP MSP FG FG FPβ
β δ δ ββα α γ
γ−= × × = × × = × +
+
30We calculated the average daily peak spot power prices using historic Bloomberg quotes from January 1, 2001 to March 31, 2001. 31The average observed forward prices were estimated using the actual long-term sales contract data for contracts signed during the period January 1, 2001 to March 31, 2001.

Chapter V
Docket No. PA02-2-000 Price Manipulation in Western Markets V-18
contract prices for time-to-delivery class 1-2. Under the 200-percent spot power prices excess case, the implied reduction in contract price is about one-third. For the 100-percent spot power inflation case, the reduction is about 23 percent for this class. These effects are much smaller for time-to-delivery classes 3-4 and 5-8.
Conclusion Our analysis shows that there is a statistically significant relationship between spot and forward power prices during the period from January 1, 2000 through June 30, 2001. This relationship is somewhat unexpected in a market for a commodity with little storability and reflects the fact that market participants used current spot prices to form expectations about future spot prices during the period in question. Although estimated elasticities vary by hub and time to delivery, the results show that the influence of spot on forward power prices declines with longer times to delivery. This pattern is consistent with the notion that current spot prices convey more information about spot prices in the near future than the distant future. If, as we maintain in earlier chapters, spot power prices were distorted, these results imply that the price distortion flowed through to forward power prices, particularly those for contracts of short (1-2 years) time to delivery. Our analysis shows clearly (Tables V-2 and V-3) that the elasticity of forward power prices with respect to spot power prices is much greater for forward contracts of 1-2 years (about 33 percent) than for contracts of 3-4 years (about 12 percent) and is very small for contracts of longer average time to delivery. Because spot gas prices influence spot power prices, the manipulation of spot gas prices could have led to power prices that were distorted above and beyond the levels established in the refund hearing. According to the analysis in this chapter, this additional distortion would have influenced forward power prices. The magnitude of such an effect can be calculated in the manner illustrated in Table V-6. In addition, because spot and forward gas prices are linked through arbitrage, spot gas manipulation may have influenced forward power prices by inflating the price of forward gas. We have made no estimate of the magnitude of this second effect.

Chapter V
Docket No. PA02-2-000 Price Manipulation in Western Markets V-19
Recommendation
Given the finding that forward power prices were distorted and a detailed statistical analysis providing estimates of the extent of the distortion based on a certain level of distortion in spot power prices, we present the following recommendation:
♦ For contracts that are subject to a just and reasonable standard of review in the ongoing complaint proceeding (see footnote 2), the Commission should send this analysis to the Administrative Law Judges to use as they see fit to resolve the complaints.

Chapter VI
Docket No. PA02-2-000 Price Manipulation in Western Markets VI-1
VI. Trading Strategies, Economic Withholding, Inflated Bidding, and Other Anomalous Activities
Initial Recommendations
In this chapter, Staff will conclude its analysis of the Enron trading strategies (first discussed in the Initial Report) and describe further developments and investigations since the Initial Report was issued. This chapter builds upon the Cal ISO report released on January 6, 2003, which identified potential transactions and parties that may have used the Enron trading strategies. This chapter also discusses potential economic withholding during the summer of 2000. We discuss evidence indicating that Enron worked in concert with other entities, both inside and outside California, to implement these strategies in ways that manipulated market outcomes. In this regard, Enron’s business model is discussed along with Staff’s recommendations. We also discuss whether the Enron trading strategies, underscheduling, economic withholding, and inflated bidding fall within the scope of the antigaming and/or anomalous market behavior provisions in the Cal ISO’s and Cal PX’s Market Monitoring and Information Protocol (MMIP). The MMIP is part of both the Cal PX and Cal ISO tariffs, which have been on file with the Commission since the Cal ISO began operations in April 1998. Staff recommends that the Commission issue orders to show cause why these behaviors did not constitute “gaming” in violation of the MMIP, with disgorgement of unjust profits associated with the violations or other appropriate remedies. Such disgorgement would be in addition to any refunds owed to establish just and reasonable rates in the California Refund Proceeding. The preponderance of evidence reviewed by Staff during this investigation indicates that Enron and its affiliates intentionally engaged in a variety of market manipulation schemes that had profound adverse impacts on market outcomes. Due to this overwhelming evidence, Staff recommends that the Commission issue an order to show cause why its market-based rate authorizations and blanket certificate authority should not be revoked. This order should cover Enron and its affiliates with the exception of Portland General Electric Company, which is the subject of an ongoing investigation in Docket No. EL02-114-000. Staff recommends that such revocation be made effective prospectively so that any preexisting contracts are not affected.

Chapter VI
Docket No. PA02-2-000 Price Manipulation in Western Markets VI-2
Background On May 6, 2002, Enron’s Washington, DC counsel provided the Commission with three internal memoranda, two of which date from December 2000, that describe certain trading strategies employed by Enron’s electricity traders in the West. Enron’s counsel informed Staff that Enron’s Board of Directors had voted to disclose the documents and to waive all claims of privilege. The Commission made these documents publicly available on the Web site for Docket No. PA02-2-000 within hours of receiving them. Staff immediately requested followup information from Enron to better understand the trading strategies discussed in the memoranda, including Enron’s receiving transmission congestion payments without actually relieving any congestion. Among other things, Staff sought any comparable memoranda that discuss trading strategies for natural gas products. Finally, the data request asked Enron to provide all correspondence related to the subject matter of the memoranda. The documents provided by Enron indicated that traders from other companies were also employing several of the trading strategies discussed in the memoranda. In order to pursue this issue, on May 7, 2002, Staff issued a notice to all sellers of wholesale electricity and/or ancillary services in the West, informing them that Staff would soon be sending them a data request seeking information about their use of the trading strategies discussed in the Enron memoranda, and directing them to preserve all documents related to such trading strategies. On May 8, 2002, Staff issued a data request to more than 130 sellers of wholesale electricity and/or ancillary services in the West during 2000–2001, with a due date of May 22, 2002. This data request contained a series of requests for admissions in which an officer of each company was required to admit or to deny, under oath, whether his or her company had engaged in specific activities described in the request. The specific activities were based on the trading strategies discussed in the Enron memoranda; in addition, there was an additional request asking the corporate officer to admit or deny, under oath, whether the company had engaged in any other trading strategies. The data request also sought production of all internal documents relating to trading strategies that the company may have engaged in during the relevant time period, including correspondence between companies, reports, and opinion letters. Staff also requested specific information in regard to any megawatt laundering transactions between any of these sellers and Enron.

Chapter VI
Docket No. PA02-2-000 Price Manipulation in Western Markets VI-3
This data request required a senior officer of the company to state, in an affidavit and under oath, that he or she conducted a thorough investigation of the company’s trading activities in the West during 2000–2001 and that the information being provided in response to the data request was complete and accurate to the best of that person’s knowledge and belief. In our Initial Report, Staff concluded that, while the exact economic impact of the trading strategies is difficult to determine precisely, these now infamous trading strategies have adversely affected the confidence of markets far beyond their dollar impact on spot prices. Even those trading strategies that are not anticompetitive have been viewed by customers as clever exploitations of overly complex rules by companies that do not account for the impact of their decisions on prices and customers. Market participants from all sectors of the industry may have engaged in these trading strategies along with Enron, and in trading strategies of their own, including nonpublic utility entities such as municipal and governmental agencies in California and jurisdictional public utilities (including power marketers). Staff’s initial review of the evidence indicated that Enron, as a corporate entity, displayed great eagerness to experiment with all aspects of market rules and protocols in an effort to “game the system” or to simply provide false information. In fact, shortly after the issuance of our Initial Report, Enron’s former chief West Coast trader, Timothy N. Belden, pleaded guilty to Federal fraud charges for his role in implementing these trading strategies. Enron’s corporate culture fostered a disregard for the American energy customer; the success of the company’s trading strategies, while temporary, demonstrates the need for explicit prohibitions on harmful and fraudulent market behavior and for aggressive market monitoring and enforcement. In a market environment, one expects that traders, working within Commission-approved market rules, will use various strategies in an effort to maximize profits. But a fundamental aspect of some of the Enron trading strategies was the deliberate use of false information. A market cannot operate properly without accurate information. Implicit in Commission orders granting market-based rates is a presumption that the power marketer’s behavior will not involve fraud or deception. For this reason, our Initial Report recommended that the Commission explicitly prohibit the use of false information as a condition for granting all market-based rate authorizations. Staff recommends that this condition also be added to all open access transmission tariffs.

Chapter VI
Docket No. PA02-2-000 Price Manipulation in Western Markets VI-4
Overview of the Cal PX and Cal ISO Operations
The Enron trading strategies and Enron’s use of them to game the system are best understood in the specific context of Western energy markets. Thus, we provide a brief overview of the Cal PX and Cal ISO operations and trading rules. The Cal ISO operates much of the transmission grid in California and is responsible for all real-time operations, such as continually balancing generation and load and managing congestion on the transmission system it controls. In California, a certified scheduling coordinator is the intermediary between the Cal ISO and the ultimate customer. Under California’s restructuring legislation, the Cal PX was created primarily to operate two markets in which energy was traded on an hourly basis. These were the day-ahead and day-of markets. These markets established a single clearing price for each hour across the entire Cal ISO control area, provided there were no transmission constraints. Where transmission congestion existed, a separate clearing price was established for each transmission constrained area or zone in California. Each individual zonal clearing price was based on adjustment bids submitted by buyers and sellers. The adjustment bids represented the value to an entity of increasing or decreasing (i.e., adjusting) its use of the system. In essence, this is a redispatch of the system to deal with congestion. California’s restructuring plan required the three California public utilities (SoCal Edison, San Diego, and PG&E) to sell all of their generation resources into the Cal PX and to buy all of their energy needs from the Cal PX. This made the Cal PX by far the largest scheduling coordinator in California, representing at times close to 90 percent of the load served by the Cal ISO grid. This requirement that the three public utilities exclusively use the Cal PX was critical in the restructuring program, since this was how the three public utilities were to calculate savings from using the new market structure and apply those savings to recover their stranded costs. Under the California restructuring rules, the three California public utilities were both buyers and sellers in the Cal PX. The prices paid for buying back their own resources through the Cal PX served to value those resources for stranded cost purposes. As long as the three public utilities paid less than the frozen retail rates, they used the difference to write off stranded costs. As noted in the Commission’s December

Chapter VI
Docket No. PA02-2-000 Price Manipulation in Western Markets VI-5
15, 2000 Order, stranded cost estimates show PG&E collected $8.3 billion, SoCal Edison collected $9.3 billion, and San Diego fully recovered its stranded costs early in 2000. This formula broke down, however, when the public utilities had to buy back their resources at more than the retail rate. All scheduling coordinators (including the Cal PX before it ceased operations in January 2001) were required to submit a balanced schedule of load and generation to the Cal ISO for the following day. The Cal ISO then performed a security analysis to determine if the generation selected could serve customer demand without causing congestion on the transmission system. Although the rules were being modified constantly during 2000–2001, the basic steps of the day-ahead auction process were as follows:
♦ 7:00 a.m.—The Cal PX conducts 24 hourly energy auctions for the following day.
♦ 9:00 a.m.—The unconstrained market-clearing prices (i.e., a single price for all of the Cal ISO system) become publicly available.
♦ 10:00 a.m.—The Cal PX (like all scheduling coordinators) submits to the Cal ISO the estimated load for the next day and the generating resources that will produce the energy necessary to serve that load.
♦ 11:00 a.m.—The Cal ISO either determines that the initial schedule is feasible (no congestion) using the available transmission facilities or requires that the schedule be modified by redispatch using adjustment bids.
♦ 12:00 p.m.—Modified schedules are submitted. At this time, the Cal ISO can automatically modify schedules to relieve any remaining congestion.
♦ 1:00 p.m.—The Cal ISO calculates the day-ahead charge for congestion on any congested paths.
♦ 3:00 p.m.—The Cal PX publishes zonal price information when there is transmission congestion in the day-ahead market. The zonal price differences are equal to the Cal ISO’s hour-ahead congestion charges along the relevant paths.
The Cal ISO operates a variety of markets in order to procure the resources necessary to reliably operate the transmission system, including a day-ahead market and an hour-ahead market for relieving transmission congestion and an energy market to continuously balance the system’s energy needs in real time. The Cal ISO’s real-time market is the final energy market to clear chronologically, after all other

Chapter VI
Docket No. PA02-2-000 Price Manipulation in Western Markets VI-6
markets in the region. Bilateral spot markets at trading hubs outside California generally operated in the time period between the close of the Cal PX market and the Cal ISO real-time market. Understanding the interaction of the Cal PX and Cal ISO spot markets with all their complexities, together with the different market operations outside of California, is crucial to understanding and analyzing the impact of the various Enron trading strategies. An example of the market complexities in California market rules is the transmission congestion management system. A transmission path is “congested” when total schedules exceed the available transmission capacity of the facilities. The Cal ISO used a zone-based approach to alleviate congestion. Buyers and sellers submitted adjustment bids identifying the prices they were willing to use to increase or decrease their generation on demand to relieve congestion in a particular zone. However, the software used by the Cal ISO to evaluate adjustment bids did not accept prices that were higher than the Cal ISO price cap. These and other market rules not only caused market inefficiencies but also contributed to bidding strategies that circumvented the market design, such as underscheduling by the three California IOUs. This, in turn, created an opportunity for Enron to develop strategies that capitalized on the market rules and the trading behavior of others.
The Cal ISO’s and Cal PX’s MMIP Contains an Antigaming Provision and an Anomalous Market Behavior Provision
The MMIP is one of several protocols that (as explained below) the Commission required the Cal ISO and Cal PX to include as part of their filed rate schedules.1 The underlying purposes of the MMIP are discussed in the Objectives section of the MMIP. In pertinent part, this section reads:
This Protocol (MMIP) sets forth the workplan and, where applicable, the rules under which the ISO will monitor the ISO markets to identify abuses of market power, to ensure to the extent possible the efficient working of the ISO Markets immediately upon commencement of their operation, and to provide for their protection from abuses of market power in both the short term and the long term, and from other abuses that have the potential to undermine their effective functioning
1Both the Cal PX and Cal ISO have substantially similar MMIPs. For convenience sake, we will refer to the language of the Cal ISO’s MMIP.

Chapter VI
Docket No. PA02-2-000 Price Manipulation in Western Markets VI-7
or overall efficiency in accordance with Section 16.3 of the ISO Tariff.2
In Staff’s view, one key function of the MMIP is to put market participants on notice as to the “rules of the road” for them so that the markets operated by the Cal ISO are free from abusive conduct and can function as efficiently and competitively as possible. Thus, while one key function of the market surveillance unit (which is created by the MMIP) is reporting, “that function is designed to facilitate efficient corrective actions to be taken by the appropriate body or bodies [including this Commission] when required.”3 In short, while the MMIP does not expressly prohibit any specific behavior, including the Enron trading strategies, Staff believes that market participants cannot reasonably argue that they were not on notice that misconduct that arose from abuses of market power and that adversely affected the efficient operations of the Cal ISO and Cal PX markets (as delineated in the MMIP) would be a violation of the Cal ISO or Cal PX tariffs. Staff believes that the key function of the MMIP is to put market participants on notice of what practices would be subject to monitoring and, potentially, corrective or enforcement action, by either the Cal ISO in the first instance or, as a last resort, by the Commission, whose function is to enforce the terms and conditions of filed rate schedules. With respect to past actions of sellers (both public utilities and governmental entities) under either the Cal PX tariff or the Cal ISO tariff, however, the Commission’s remedial authority may be broader. Staff believes that most of the misconduct engaged in by participants in the Cal ISO and Cal PX markets may come within the scope of the MMIP found in both tariffs. As set forth in the Cal ISO’s MMIP 1.3.1, the MMIP applies to “all ISO market participants; PX participants; [and] the ISO.”4 As set forth in the Cal PX’s MMIP 1.3.1, the MMIP applies to Cal PX participants, market participants “whose actions have the potential to influence the competitiveness or the achievement of efficiency in the PX markets,” and the Cal PX itself.5 Part 2 of the MMIP specifies what are termed “Practices Subject to Scrutiny.” Among those practices are two of particular concern to the
2MMIP 1.1. 3MMIP 1.1.2 (Reporting Requirements). 4MMIP 1.3.1. 5MMIP 1.3.1.

Chapter VI
Docket No. PA02-2-000 Price Manipulation in Western Markets VI-8
Commission: “gaming” and “anomalous market behavior.” Gaming is defined as:
“Gaming,” or taking unfair advantage of the rules and procedures set forth in the PX or ISO Tariffs, Protocols or Activity Rules, or of transmission constraints in periods in which exist substantial Congestion, to the detriment of the efficiency of, and of consumers in, the ISO [and PX] Markets. “Gaming” may also include taking undue advantage of other conditions that may affect the availability of transmission and generation capacity, such as loop flow, facility outages, level of hydropower output or seasonal limits on energy imports from out-of-state, or actions or behaviors that may otherwise render the system and the ISO [and PX] Markets vulnerable to price manipulation to the detriment of their efficiency.6
Anomalous market behavior is defined as:
Anomalous market behavior . . . is . . . behavior that departs significantly from the normal behavior in competitive markets that do not require continuing regulation or as behavior leading to unusual or unexplained market outcomes. Evidence of such behavior may be derived from a number of circumstances, including:
♦ withholding of Generation capacity under circumstances in which it would normally be offered in a competitive market;
♦ unexplained or unusual redeclarations of availability by Generators;
♦ unusual trades or transactions;
♦ pricing and bidding patterns that are inconsistent with prevailing supply and demand conditions, e.g., prices and bids that appear consistently excessive for or otherwise inconsistent with such conditions; and
♦ unusual activity or circumstances relating to imports from or exports to other markets or exchanges.
The [ISO] Market Surveillance Unit [or PX Compliance Unit] shall evaluate, on an ongoing basis, whether the continued or persistent presence of such circumstances indicates the presence of behavior that is designed to or has the potential to
6Cal ISO MMIP 2.1.3; Cal PX MMIP 2.1.4. Hereafter, for convenience sake, we will refer to the antigaming provision as MMIP 2.1.3.

Chapter VI
Docket No. PA02-2-000 Price Manipulation in Western Markets VI-9
distort the operation and efficient functioning of a competitive market, e.g., the strategic withholding and redeclaring of capacity, and whether it indicates the presence and exercise of market power or of other unacceptable practices.7
Section 2.3 of the MMIP and its several subparts address in detail how the Cal ISO, including the market surveillance unit, is to respond to determinations that market participants are engaged in any of the suspect practices delineated in the MMIP. While the MMIP outlines intermediate steps (such as arranging for alternative dispute resolution or proposing language changes to the tariff), ultimately it directs the market surveillance unit to refer matters to the Commission for enforcement.8 In other words, the MMIP contemplates that, while the Cal ISO may try to correct misconduct on its own, the Commission is to be “the court of last resort” for misconduct committed by market participants, including the gaming and anomalous market behavior misconduct defined in the MMIP. Because of the fact that Part 2 of the MMIP specifically enumerates suspect practices, that Section 7.3 of the MMIP authorizes the Cal ISO to impose “sanctions and penalties” or to refer matters to the Commission for appropriate sanctions or penalties, and that the MMIP is part of the Cal PX’s and Cal ISO’s rate schedules on file with the Commission, Staff concludes that entities that transact through the Cal PX or Cal ISO and engage in such enumerated practices are in violation of those filed rate schedules. The stated objectives of the MMIP are to identify abuses of market power by giving particular scrutiny to a list of abusive practices and misconduct and to take corrective action, including sanctions and penalties. In Staff’s view, the identified misconduct remains a violation of the Cal ISO’s and Cal PX’s filed rate schedules even if such formal procedures as referral outlined in the MMIP did not occur. The Commission can enforce a rate schedule on file even when there are processes in that rate schedule which, had they been used, would have assisted the Commission. Ultimately, the Commission can enforce a tariff with or without the assistance of a complaint or referral. The Cal ISO and Cal PX initially submitted the MMIP (along with other protocols) for informational purposes only on October 31, 1997. The Commission, however, found that the protocols, including the MMIP, “govern a wide range of matters which traditionally and typically appear in agreements that should be filed with and approved
7Cal ISO MMIP 2.1.1 (subparts MMIP 2.1.1.1 through 2.1.1.5 are denoted by bullets); Cal PX MMIP 2.1.1 (subparts a to e). 8MMIP 3.3.4.

Chapter VI
Docket No. PA02-2-000 Price Manipulation in Western Markets VI-10
by the Commission.” 9 Therefore, the Commission accepted the protocols, including the MMIP, for filing, and directed the Cal ISO and Cal PX to post the protocols on their Internet sites and to file the complete protocols pursuant to Section 205 of the Federal Power Act within 60 days of the Cal ISO’s operations date.10 The Cal ISO and the Cal PX made their compliance filings on June 1, 1998. Accordingly, the MMIP has been part of the Cal ISO’s filed rate schedule and the Cal PX’s filed rate schedule since the Cal ISO’s operations date (April 1, 1998).
Staff Finds That There May Have Been Numerous Instances of the Misconduct Addressed in the MMIP
Staff now reviews some of the various forms of misconduct discussed throughout this Report and provides its preliminary views on how the misconduct violated the MMIP. Staff recommends that the Commission issue orders to show cause to the companies specified in this chapter as to why the identified behaviors did not violate the Cal ISO or Cal PX tariff protocols and why unjust profits should not be remitted to customers. Further, because these behaviors involve past violations of a filed rate schedule, such disgorgement of unjust profits would relate to periods prior to the October 2, 2000 refund effective date in the California Refund Proceeding and would be in addition to any refunds owed to customers in establishing just and reasonable rates for the period October 2, 2000 through June 21, 2001. In the Commission’s July 25, 2001 Order in the California Refund Proceeding,11 the Commission discussed at length its establishment of the October 2, 2000 refund effective date. While rejecting a variety of arguments for refunds preceding that date, the Commission expressly noted that one exception to the refund limitations set forth in Section 206 was “where the sellers have charged a rate other than the filed rate.”12 The Commission explained:
We agree that the Commission may take retroactive action to address circumstances where a seller did not charge the filed
9Pacific Gas and Electric Co., et al., 81 FERC ¶ 61,320 at 62,470-471 (1997). 10Id. 11San Diego Gas & Electric Co., et al., 96 FERC ¶ 61,120 at 61,506-511, order on clarification and reh’g, 97 FERC ¶ 61,275 (2001). 1296 FERC at 61,504.

Chapter VI
Docket No. PA02-2-000 Price Manipulation in Western Markets VI-11
rate or violated statutory or regulatory requirements or rules in applicable rate tariffs.13
However, in the July 25 Order, the Commission stated that there had been no demonstration that there were any violations of any Commission-filed tariffs.14 The July 25 Order preceded the initiation of this investigation, and Staff finds that the Commission’s statement that there were no tariff violations that would warrant refunds prior to October 2, 2000 appears to be no longer accurate. In short, Staff believes that numerous participants in the Cal ISO and Cal PX markets violated the terms of the Cal ISO’s or Cal PX’s tariff, specifically the MMIP; thus, the Commission could order disgorgement of unjust profits prior to October 2, 2000 if it determines there have been such violations.
The Enron Trading Strategies and Their Impact on Prices
As stated in our Initial Report, quantifying the exact economic impact of the trading strategies is difficult because we have not identified a way to definitively associate particular transactions with particular strategies. A passage from an undated Enron document entitled “Public Service of New Mexico California Service Overview” illustrates this point. The document describes a partnership arrangement providing mutual benefits and services, e.g., Enron acting as a scheduling coordinator on behalf of Public Service of New Mexico for certain trades. The document states that in Enron’s opinion no Cal ISO forms or notifications are required: “in fact the ISO will not even be aware that PNM is in the path.” On January 6, 2003, the Cal ISO Department of Market Analysis released a 34-page report entitled “Analysis of Trading and Scheduling Strategies Described in Enron Memos” (January 6 Cal ISO Report), originally dated October 4, 2002. While the Cal ISO indicates that some of the results of its analysis require further verification, the analysis is generally consistent with our Initial Report as to the effect these strategies had on the market. The Cal ISO’s Department of Market Analysis issued a report on November 15, 2002 entitled “Did Any of Enron’s Trading and
13Id at 61,507-80 (citing Washington Water Power Co., 83 FERC ¶ 61,282 (1998), in which the Commission imposed sanctions and required public utilities to disgorge profits derived from past violations of the companies’ market-based rate orders). 14Id.

Chapter VI
Docket No. PA02-2-000 Price Manipulation in Western Markets VI-12
Scheduling Tactics Contribute to Outages in California?” (November 15 Cal ISO Report). This report concludes that while Enron strategies could have financial impacts on the markets, they did not contribute to the outages during the winter of 2000–2001. Staff notes that the Cal ISO Report was submitted in a state proceeding before the California Select Committee to Investigate Price Manipulation of the Wholesale Energy Market (California Committee). The November 15 Cal ISO Report addresses and specifically refutes statements and allegations made by Mr. Robert McCullough in two earlier memoranda presented as part of his testimony before the state proceeding. In the memoranda he argues that the Enron strategies played a role in the blackouts during the winter of 2000–2001. The Enron trading strategies clearly fall within the scope of the MMIP’s antigaming and anomalous market behavior prohibitions. Indeed, one of the now infamous Enron memoranda that the Commission posted on the Web site for this proceeding even lists these prohibitions in a discussion of the trading strategies (however, the memorandum does not conclude whether or not the trading strategies are gaming or anomalous market behavior). We will discuss the various trading strategies in the same order as in the Initial Report. We first focused on “load shift” because, by Enron’s own admission, this was an explicit attempt to manipulate prices. The second set of trading strategies discussed includes marketing power and energy in an effort to sell the product where it is needed the most. These strategies include various forms of exports and imports. The last set of trading strategies involves deceitful tactics, such as providing false information or reporting imaginary transactions.
Price Manipulation—Load Shift As described in the May 8, 2002 Data Request, the trading strategy known as load shift involves a company submitting an artificial load schedule in order to receive interzonal transmission congestion payments. Load shift involves deliberately creating congestion on a transmission line to increase the value of Enron’s transmission rights and is clearly an attempt to manipulate prices. This Enron trading strategy is particularly complicated and its success was dependent, in part, on the independent bidding behavior of other entities. By Enron’s own admission, the load shift strategy was not very successful. Enron was not able to move the price paid for congestion

Chapter VI
Docket No. PA02-2-000 Price Manipulation in Western Markets VI-13
management. However, whether successful or not, it was a clear attempt to manipulate prices. As described in the Enron memoranda, the load shift trading strategy involves creating the appearance of congestion by deliberately overscheduling in one zone (e.g., the southern zone) and underscheduling by a corresponding amount in another zone (e.g., the northern zone). For example, assume Enron’s true load and resources were balanced by zone. Enron schedules an additional 100 MW of load in the southern zone and underschedules by the same 100 MW in the northern zone. This inaccurate schedule requires 100 MW of additional north-to-south transmission relative to Enron’s true loads and resources. By shifting load in this manner, Enron created congestion and potentially raised congestion prices. This benefited Enron because it owned Firm Transmission Rights (FTRs) on the paths that it attempted to congest. As stated in the Initial Report, Enron purchased 1,000 MW (62 percent) of the 1,621 MW in rights to north-to-south transmission on Path 26. The purchase of these FTRs cost Enron a total of $3.6 million. Path 26 is one of the two main transmission interfaces linking northern and southern California.15 Enron’s FTRs entitled it to collect a significant portion of all congestion revenues on Path 26 that were due to north-to-south congestion, the typical direction of congestion during periods of peak demand in the summer. This gave Enron an incentive to try to create—through a load shift—north-to-south congestion over this transmission line. If Enron could shift load and thereby increase the congestion price, it would be paid the higher price for all 1,000 MW of the FTRs. The vast majority of Enron’s congestion revenues were from Path 26 during July and August 2000, and totaled approximately $33 million for those 2 months for that path alone. This amount represented a considerable profit above the $3.6 million that Enron paid for the Path 26 FTRs, even though (as explained below) it was not able to manipulate the prices of congestion payments. Enron was generally not able to move the cost of congestion because two large market participants, SoCal Edison and PG&E, often set the price for congestion relief over a large band of load used for congestion relief. Nonetheless, the false schedules that Enron 15It is useful to think of the California system as an hourglass figure, with the two transmission paths connecting the northern and southern zones. During the winter, these paths constrain lower-cost generation in the south from reaching load in the north. Conversely, during the summer, these paths constrain lower-cost generation in the north from reaching load in the south.

Chapter VI
Docket No. PA02-2-000 Price Manipulation in Western Markets VI-14
submitted added unneeded confusion to the already complex congestion management program that the Cal ISO administered. In this manner, Enron harmed the market. It is also important to not view the Enron trading strategies in isolation. In an FTR Market Report dated December 1, 2000, the Cal ISO states that it actively monitored the FTR market and closely scrutinized Enron’s scheduling behavior. The FTR Market Report noted that PG&E’s underscheduling of load in the Cal PX day-ahead market could cause or exacerbate north-to-south congestion on Path 26. The Report concluded:
It is important to note that the [Cal ISO’s] examination of bidding behavior has revealed that the primary FTR owners on Path 26 were not the entities causing these congestion and load scheduling patterns. Rather, these patterns are the result of behavior by other load-serving entities. Thus the major FTR holders were the beneficiaries of usage charge revenues resulting from the cost minimizing bidding strategy of load-serving entities in northern California.16
While Enron’s load shift trading strategy by and large did not move the price paid to relieve congestion, Enron nevertheless attempted to raise the price of congestion by artificially scheduling load in the hopes that it could collect higher revenues. This trading strategy was defeated, not by market rules or oversight, but rather by the actions of other companies (primarily PG&E in the north and SoCal Edison in the south) that were underscheduling load, contrary to the market design rules. Both of these behaviors would be prohibited by Staff’s recommendation to prohibit submission of false information. Market rules should also be designed to economically discourage infeasible schedules. Finally, we note that in Mr. McCullough’s testimony before the California Committee, he references a letter from a former Enron employee named David Fabian to Senator Boxer. The letter refers to Enron’s rights to north-to-south transmission on Path 26. According to Mr. McCullough’s testimony, this person “heard” that Enron overbooked the line and that Enron “was allowed to price-gouge at will.” Both Staff’s analysis and the Cal ISO analysis of the economic impact of this Enron strategy indicate that this allegation is wrong. Additionally, this former Enron employee alleged that this overbooking strategy resulted in 2 days of rolling blackouts in northern California in the summer of 2000. Staff notes that this Enron scheme was designed to increase its congestion revenues. However, there is no 16FTR Market Report, p. 35.

Chapter VI
Docket No. PA02-2-000 Price Manipulation in Western Markets VI-15
evidence to suggest that any of the schemes or other practices discussed in the Enron memos contributed to the blackouts that occurred in California. As a general matter, congestion schemes such as this raise prices but do not factor into actual power flows. Staff concludes that load shift falls within the definition of gaming because it involves taking unfair advantage of the Cal ISO’s or Cal PX’s tariffs or rules, “to the detriment of the efficiency of, and of consumers in, the ISO [or PX] Markets.”17 To the extent that load shift involves creating false congestion or the receipt of excess congestion revenues, it also involved “taking undue advantage of . . . transmission constraints in periods in which exist substantial Congestion.”18 Finally, since load shift is a prime example of price manipulation, it is also a behavior that makes the Cal PX or Cal ISO markets “vulnerable to price manipulation to the detriment of their efficiency.”19 In short, we conclude that all companies, including Enron, that engaged in load shift violated at least MMIP 2.1.3. Price Maximization—Exports The following two trading strategies involve using exports and imports in some way to sell power where or when it is most valued. Export of California Power The trading strategy known as “export of California power” involved buying energy at the Cal PX to export outside of California in order to take advantage of the price spread between the California market (which was capped) and the uncapped markets outside of California. As noted in our Initial Report, fewer than a dozen entities either admitted to engaging in exports of California power or gave answers other than a denial. However, Staff notes that data indicate an increase in total exports from California during this period. In narrative responses to the May 8 Data Request, various market participants argue that some of the Enron trading strategies, such as exports of California power, are examples of economically rational behavior, or legitimate arbitrage. They note that the Cal PX, Cal ISO, and the Commission have never implemented market rules prohibiting the export of energy from California. Respondents maintain that exporting power outside of California in order to reach other market opportunities, or to take advantage of a price spread, is good business
17MMIP 2.1.3. 18Id. 19Id.

Chapter VI
Docket No. PA02-2-000 Price Manipulation in Western Markets VI-16
practice. They argue that, from an individual entity’s perspective, an export may have provided an optimal business opportunity. For example, some respondents state that California generators may have wanted to make a long-term sale to avoid being entirely exposed to the California spot markets. Staff notes that, under California’s restructuring plan, the three California public utilities were required to buy their energy in the spot market. This created an incentive for entities with in-state generation who desired to enter into forward sales to seek markets outside of California. Also, they simply may have exported spot sales to avoid the price cap in California. While it may have been a rational economic decision for an individual company to export its power to a market with higher prices, the large amount of exports collectively contributed to the scarcity in California during 2000–2001. The Enron trading strategy called “thin man” (described as the opposite of the strategy called “fat boy”) involved submitting a false schedule that artificially decreased load in California and an equal amount of energy exports. Moreover, if entities other than Enron acted in concert on a coordinated basis to implement this strategy, it would represent a form of cooperative corporate behavior with significant ramifications. Historically, California has relied heavily on generation imports to meet its peak summer needs. However, the summer of 2000 did not follow this pattern. In fact, compared to earlier periods, the total amount of power exported from California during that summer was significantly larger than expected. This anomaly has been the subject of prior reports and studies. For example, a report by the General Accounting Office (GAO) on California restructuring indicated that monthly exports from May through October 2000 were between 40 and 230 percent higher than the same months in 1998 and 1999. Overall, exports were approximately 200 percent higher from May through October 2000 than in the same period in either 1998 or 1999.20 When California deregulated its retail electric market, the three California public utilities sold their oil- and gas-fired generation assets to other entities that did not have franchised service areas or an obligation to serve particular customers. At the time, this was a unique retail market structure in the West. The differences in retail market structures, including the mandated reliance on the spot market in California, contributed to the regional market problems. A merchant
20U.S. General Accounting Office, Restructured Electricity Markets: California Market Design Enabled Exercise of Market Power, Report No. GAO-02-828 (released July 2002), p. 32 (GAO California restructuring report).

Chapter VI
Docket No. PA02-2-000 Price Manipulation in Western Markets VI-17
generator who exported power out of California in search of a better price or the opportunity to sell in forward (rather than spot) markets was behaving in a rational economic manner. Existing, vertically integrated utilities in neighboring states still had an obligation to serve their native load from their own generation resources. When it was economical, these utilities also bought generation from California to serve their load or for resale in other Western markets, whichever was most valuable. Staff concludes that the export trading strategy was largely the result of asymmetrical market rules under which products were sold where they brought the highest price. Ricochet or Megawatt Laundering The trading strategy known as “ricochet” or “megawatt laundering” involved one entity buying energy from the Cal PX in the day-ahead market and exporting it to a second entity, which received a fee from the first company. The energy was later sold to the Cal ISO in the real-time market (or as an out-of-market sale).21 Ricochets necessarily involve multiple entities, and the responses to Staff’s data requests indicate that there was an abundance of willing counterparties. Because both generation and transmission were required, Enron needed others to move power into and out of the Cal ISO system. As noted in our Initial Report, most of the transmission facilities critical for these trading strategies that are directly connected to the Cal ISO system are owned or controlled by nonpublic utility California municipals, including the Transmission Agency of Northern California (TANC) and the City of Los Angeles Department of Water and Power (LADWP). In addition to California transmission systems not operated by the Cal ISO, Enron also relied on transmission systems in the Pacific Northwest, specifically, those of Bonneville Power Administration (BPA), Avista, and Enron’s public utility affiliate, Portland. Transcripts of Portland traders and transmission personnel include detailed instructions by Enron personnel on how the various participants (Portland and Avista) were to record transactions and how to report the various parts of the transactions consistent with NERC requirements and the Commission’s regulations. 21If there were insufficient bids in the Cal ISO real-time market, the Cal ISO, as a last resort to procure the resources necessary to operate the system, would purchase energy out of its market. These out-of-market resources were paid their bid, but did not affect the market-clearing price paid to other generators.
Chapter VI
Docket No. PA02-2-000 Price Manipulation in Western Markets VI-18
Entities routinely try to capture profits from price differences that exist between different time periods, e.g., purchasing power in the day-ahead market and selling it in real time. The actual price in the real-time market can be higher or lower than the original price paid in the day-ahead market. Entities that engage in these strategies assume this arbitrage risk where others are unwilling to do so. During the 2-year review period, this trading strategy could also be used to avoid the price caps that were set in the Cal ISO real-time market. This is because the Cal ISO also bought power out of market at the last minute when there was insufficient supply bid into its market. These out-of-market purchases were typically priced above the price cap. Suppliers knew that the Cal ISO would pay any price in an effort to avoid blackouts. In the Initial Report, Staff concluded that this behavior (raising prices at the last minute, when buyers are unable or incapable of saying no) was not legitimate arbitrage, but was an exercise of market power. We reaffirm this conclusion and view it as inappropriate gaming of the system. Staff concludes that the ricochet trading strategy, at a minimum, is an example of anomalous market behavior—that is, “behavior that departs significantly from the normal behavior in competitive markets that do not require continuing regulation or behavior leading to unusual or unexplained market outcomes.”22 Indeed, the MMIP includes as one of the examples of anomalous market behavior “unusual activity or circumstances relating to imports from or export to other markets or exchanges.”23 In short, Staff concludes that all entities that engaged in the ricochet trading strategy violated at least MMIP 2.1.1.5. The Enron memoranda indicate that Enron included the generation of other sellers, such as British Columbia Power Exchange (Powerex) and Puget Sound Energy, Inc. (Puget), when employing this trading strategy. In addition, Cal ISO data indicate that during the critical period of the first week in December 2000, 10 market participants may have engaged in this trading strategy and may have generated close to $10 million in profits. The 10 market participants are listed in descending order of potential profits:24
22MMIP 2.1.1. 23MMIP 2.1.1.5. 24These transactions represent exports and imports by the same entity; therefore, the screen used by the Cal ISO is very conservative because it does not include transactions in which the import and export legs were performed by two or more parties. (See Issue 3 Chart in Cal ISO’s Response to Staff’s February 10, 2003 Data Request.)

Chapter VI
Docket No. PA02-2-000 Price Manipulation in Western Markets VI-19
♦ Puget Sound Energy
♦ Powerex or British Columbia
♦ Avista Energy Inc.
♦ Los Angeles Department of Water and Power
♦ PacifiCorp
♦ Enron Energy Services, Inc.
♦ Portland General Electric
♦ Bonneville Power Administration
♦ Arizona Public Service Corporation
♦ Idaho Power Company (also referred to as Ida Corp.) Staff concludes that, to the extent these 10 market participants used exports from California prior to real time in order to withhold generation until the last minute for sales to the Cal ISO, such activity is an exercise of market power and a violation of the Cal ISO tariff. Staff recommends that the potential ricochet transactions of the 10 entities listed in this section be part of the show cause order discussed later in this section. Trading Strategies Based on False Information The following trading strategies are all premised on submitting false information schedules. One trading strategy, fat boy, was designed to offset the bidding strategies of the California public utilities. In addition, this strategy itself did not affect market outcomes. The other trading strategies are all attempts to fabricate transactions for profit and to change market outcomes. After the Staff Initial Report was released, Jeffrey Richter, an employee of Enron and the manager of the Short-Term California trading desk in 2000, pleaded guilty to several counts. The February 3, 2003 Plea Agreement states that he and other individuals at Enron agreed to devise and implement fraudulent schemes through the California spot markets. In this regard, the schemes required them to submit false information to the Cal ISO in the electricity and ancillary services markets. The Plea Agreement states the following:
Among other things, we knowingly and intentionally filed energy schedules and bids that misrepresented the amount and geographic location of the load we intended to serve. We

Chapter VI
Docket No. PA02-2-000 Price Manipulation in Western Markets VI-20
did so for the purpose of increasing the appearance of congestion on transmission lines, increasing the market price for congestion fees for transmission between zones, earning congestion payments that otherwise would not have been available, and increasing the values of our FTRs (which only generated revenue when congestion existed). We also submitted bids to supply ancillary services that we did not have, or did not intend to supply, in the ISO’s day-ahead ancillary services market. The bids we submitted contained fabricated information regarding the source and nature of the ancillary services we proposed to supply to the ISO. Once the bids were accepted, we would cancel our obligation to supply the ancillary services by purchasing them in the ISO’s hour-ahead ancillary services market. Enron would then profit by capturing the difference in price between the two markets.
Fat Boy (or Inc-ing Load) The fat boy trading strategy involved a scheduling coordinator, such as Enron, artificially increasing (“inc-ing”) load on the schedule it submits to the Cal ISO to correspond with the amount of generation in its schedule.25 Under California market rules, all schedules submitted to the Cal ISO had to be balanced (i.e., load and generation had to be equal). The company then dispatched the generation it scheduled, which was in excess of its actual load. This resulted in the Cal ISO paying the company for the excess generation at the clearing price established in the real-time market.26 Staff emphasizes that this trading strategy was conceived and used in response to the procurement strategy used by the three California public utilities, which itself was a response to the unintentional interplay of Cal PX and Cal ISO market rules. The Cal PX, as the scheduling coordinator for the three California public utilities, was required to send the Cal ISO a schedule that balanced an equal amount of generation and load. The Cal PX day-ahead market cleared before the Cal ISO market, which was capped at various levels (depending on the date). Under the original California restructuring program, PG&E and the two other California public utilities were supposed to “bid all 25An Enron strategy with the opposite market effect was called thin man, in which a load is artificially reduced and a corresponding amount of generation is exported out of California. 26Staff performed an electronic search of the Enron transaction database (Enpower) with an explicit reference to “fat boy.” This search produced approximately 100 transactions predominantly in coordination with the Cities of Glendale and Redding, California and Valley Electric.

Chapter VI
Docket No. PA02-2-000 Price Manipulation in Western Markets VI-21
of their generation into the Power Exchange and satisfy their need for electric energy on behalf of their full service customers with purchase made from the Exchange” (D.95-12-063). California required this buy-sell procedure in order to: (1) provide price transparency, (2) mitigate market power and reduce the burden of regulatory issues, (3) ensure that customers would receive the benefit of competitive market prices, and (4) provide sufficient depth to the PX such that its market signals could be relied on as a benchmark. In an effort to minimize their procurement costs under the California market rules, the three California public utilities, especially PG&E, habitually underscheduled their load in the Cal PX market. In other words, they would only buy energy in the Cal PX market that was priced at or below the capped Cal ISO real-time market, relying on the fact that residual load could be supplied in the Cal ISO real-time market at capped prices. PG&E’s strategy involved a deliberate attempt to push the Cal PX price below the capped price in the Cal ISO real-time market.27 PG&E’s load makes up a significant portion of the load in California. Its load represents approximately 85 percent of the demand in northern California, the NP15 zone. Therefore, PG&E’s decisions on how to bid its demand have a significant impact on both buyers and sellers in the market. Due to PG&E’s large size, changes in the company’s bidding behavior that represented a shift from the market design not only caused uncertainty and volatility but also greatly influenced a number of market outcomes, including market-clearing prices. The most obvious problem was shifting a large percentage of its load out of the Cal PX day-ahead market, causing the load to be met with the Cal ISO’s real-time market, resulting in increased reliability problems. Bid data submitted by PG&E to the Cal PX on August 26, 2000 demonstrated its bidding strategy. PG&E’s expected load between 12:00 and 1:00 p.m. was 9,060 MW. PG&E’s bid indicated that it was only willing to purchase its total expected load if the price was less than or equal to $75/MW in that hour. As the Cal PX price increased, PG&E was willing to purchase decreasing amounts. For example, if the expected price rose to $200/MW, PG&E was only willing to purchase half of its total expected load (4,530 MW). Because the actual clearing price in NP15 that hour was $249.39/MW, PG&E actually purchased 3,813 MW in the Cal PX. As a result, the
27As initially proposed in the November 1, 2000 Order and as adopted in the December 15 Order, the Commission halted the practice of near-total reliance on the spot market to allow the three California public utilities to procure a more balanced portfolio and to procure resources under long-term contracts.
Chapter VI
Docket No. PA02-2-000 Price Manipulation in Western Markets VI-22
remainder of PG&E’s load (5,242 MW) would have to be served by purchases in the Cal ISO’s real-time market. Due to this bidding strategy, an equal amount of supply was not committed in the Cal PX day-ahead market. The obvious short-term effect of PG&E’s bidding strategy was to reduce the amount of load in the Cal PX day-ahead market, which reduced the price for every megawatt purchased in that market. However, this bidding strategy had the opposite effect on the Cal ISO real-time market. By increasing the amount of load served by the Cal ISO’s real-time market, the price for every megawatt served increased. Due to PG&E’s large size, its actions caused the market prices to move up and down appreciably. Another disruptive market outcome caused by PG&E’s bidding strategy occurred in December 2000. During this period, other market participants were willing to pay more for energy in the Cal PX market, which resulted in PG&E’s transition from a net buyer of generation (including its own resources bid into the market) to a net seller. In other words, PG&E’s bidding strategy resulted in the loss of its own generation to buyers, including out-of-state entities. This, of course, resulted in an even greater amount of PG&E load relying on service from the Cal ISO in real time. According to PG&E, after it began losing its own generation to other buyers, it sought California Public Utilities Commission (CPUC) support to use an alternative bidding approach to keep its own low-cost generation for its retail customers. Even after discussions with CPUC President Lynch’s office and the head of the Energy Division, it did not receive support to use the alternative bidding approach. Furthermore, the Cal ISO raised new reliability concerns.28 Only after the FERC lifted the requirement that utilities sell their generation into the Cal PX market on December 15, 2000 was PG&E able to keep all of its own generation and contracts to meet its customers’ demand. While this procurement strategy attempted to minimize the public utilities’ wholesale electricity costs, underscheduling caused chronic operational and reliability problems for the Cal ISO (as documented in numerous filings with the Commission). The Cal ISO’s real-time market was designed to supply only the small amount of energy (less than 5 percent) needed to constantly balance generation with actual load. Chronic underscheduling in the Cal PX day-ahead market transformed this “balancing” market into an energy commodity market that served far more load than it was designed to supply. The uncertainty of not knowing how to supply a much larger percentage of 28PG&E e-mail dated January 30, 2001 (p. 0221) of their response to Staff’s data request.

Chapter VI
Docket No. PA02-2-000 Price Manipulation in Western Markets VI-23
the load until real time caused considerable reliability problems for the Cal ISO. In short, California load-serving entities were using the real-time market for a purpose for which it was not intended. Shifting load out of the day-ahead market into the real-time market put additional market pressure on the Cal ISO. When insufficient supplies were available in the Cal ISO real-time market, the Cal ISO was forced to procure necessary supplies through out-of-market purchases that were not subject to a price cap. The uncertainty of this last-ditch effort to procure necessary resources was significant. In addition, the end result was that energy prices in real time were often much higher than the Cal PX clearing price. The effect of both the higher Cal ISO clearing prices and the still higher out-of-market prices was felt by all load-serving entities until December 8, 2000, when the Commission issued its Order Accepting Tariff Amendment on an Emergency Basis. On that date, the Cal ISO made an emergency filing to amend its tariff in an effort to curb the underscheduling problem and to protect the reliability of the system. After this order, only entities that underscheduled or caused the imbalance were directly assigned the costs of out-of-market purchases. In its filing, the Cal ISO stated that it had been forced to declare Stage 2 Emergencies for the previous 4 days, and saw no immediate relief. The Cal ISO requested three tariff modifications as follows: (1) increase the amount of generation in the real-time market by allowing bids above the then-current $250 cap (such bids would not set the market-clearing price); (2) assess penalties (twice the highest price paid by the Cal ISO) against generators that refused to operate in response to a Cal ISO dispatch instruction and, if firm load was curtailed, an additional penalty of $1,000/MWh for energy a generator failed to deliver; and (3) underscheduling entities such as PG&E would be allocated the highest priced energy and out-of-market purchases. Given the extraordinary circumstances, the urgency of the request, and the overriding reliability concerns, Commission acted immediately to accept the Cal ISO’s proposed tariff changes. The fat boy trading strategy was a response to this underscheduling problem. Under California market rules, all scheduling coordinators (e.g., Cal PX and others, such as Enron) were required to submit to the Cal ISO day-ahead schedules that were balanced. The fat boy trading strategy was a way to preschedule on a day-ahead basis an imbalance sale in the Cal ISO’s real-time market. While neither underscheduling nor inc-ing load was an intentional part of California restructuring, it is clear to Staff that underscheduling was of far greater concern to the Cal ISO, no doubt because it led directly to reliability problems. Indeed, some of the respondents informed Staff that the Cal ISO
Chapter VI
Docket No. PA02-2-000 Price Manipulation in Western Markets VI-24
actually helped them to engage in the fat boy trading strategy by providing them with artificial or simulated load and delivery points. For example, an entity with only generation and no load could not submit a balanced schedule to the Cal ISO. According to Reliant, the Cal ISO created an artificial load point that enabled Reliant to submit a balanced schedule to the Cal ISO. Enron’s use of the fat boy trading strategy did not set the market-clearing price in the Cal ISO’s real-time market. Under California market rules, entities are price takers for the amount of generation in excess of actual load; that is, they are paid the clearing price that is established in the Cal ISO market.29 Nevertheless, the submission of false schedules, and the Cal ISO’s encouragement of such fabrications to circumvent the balanced schedule rule, would be prohibited under Staff’s recommendations in the Initial Report. The Initial Report included a recommendation that all tariffs for market-based rates include an express prohibition against submitting false information. In addition, all open access transmission tariffs should be amended to include this prohibition. Flawed market rules that are not working as intended should be amended by the Commission, not circumvented by market participants. More significant was the elimination of the market rule that held the three California public utilities in the spot market. As stated in the Initial Report, allowing a greater use of forward contracting resulted in far less reliance on the spot market, thus reducing the economic incentive for this trading strategy. While Staff has concluded that the fat boy trading strategy alone did not set the market-clearing price in the Cal ISO’s real-time market, and may in fact have been encouraged by at least one Cal ISO employee, this trading strategy nonetheless involves the deliberate submission of false information and falls within the scope of the antigaming provision because it necessarily involves taking “unfair advantage” of the Cal ISO’s rules and may otherwise have made the “ISO Markets vulnerable to price manipulation to the detriment of their efficiency.”30 29The day-ahead and real-time imbalance pricing during May 20-23, 2000 illustrates this trading strategy. Unexpected high loads occurred on May 20-21, which caused prices in the Cal ISO real-time market to reach the $750 price cap while the Cal PX day-ahead prices were in the $40 to $50 range. Reacting to these prices, Enron and British Columbia Power Exchange Corporation overscheduled between 1,000 and 2,000 MW of generation as “price takers” in the Cal ISO real-time market on May 22. Because the Cal ISO market continued to exceed the Cal PX day-ahead prices, the fat boy strategy was profitable relative to selling in the Cal PX. On May 23, 2000, these two scheduling coordinators continued to overschedule more than 1,000 MW in the Cal ISO imbalance market. However, the Cal ISO’s market dropped to the $200 range, while prices in the Cal PX rose to the $300 to $500 range. Thus, this overscheduling strategy ceased, for a time, to be profitable relative to selling in the Cal PX. 30MMIP 2.1.3.

Chapter VI
Docket No. PA02-2-000 Price Manipulation in Western Markets VI-25
Underscheduling by the Three California Public Utilities California public utilities submitted false schedules when they knowingly underscheduled their loads to the Cal PX. Their underscheduling violated the California restructuring plan and the antigaming provisions of the Cal ISO and Cal PX tariffs. Both of these conclusions are true irrespective of the fact that the California public utilities viewed this practice as a cost minimization strategy. While the Commission has the authority to order disgorgement of profits, there are no profits to disgorge from a price-reducing strategy. Cal ISO Actions Staff is also concerned that a review of certain Cal ISO reports indicates a complacency with the submission of false schedules, such as in the fat boy trading strategy. The Cal ISO issued a report by its Department of Market Analysis entitled, “Did Any of Enron’s Trading and Scheduling Practices Contribute to Outages in California?” This report, which was reviewed by the Market Surveillance Committee, addressed issues raised by Robert McCullough before the California Committee. The report concludes that, based on data available to the Cal ISO, the Enron practices reviewed by Mr. McCullough did not cause the blackouts during the winter of 2001. Rather, the blackouts were caused by a combination of the limited supply of energy that was made available to the Cal ISO and limited transmission capacity available to deliver energy from southern to northern California. Within this context, an addendum to the report discusses the fat boy trading strategy. Again, the Cal ISO report criticizes Mr. McCullough’s previous analysis, but in doing so, the Cal ISO appears to view this strategy as benign or even helpful because it “simply has the effect of reducing the Cal ISO’s projected demand for imbalance energy that must be procured by the Cal ISO to meet real time load.” The Cal ISO also describes how, in performing its daily operations (such as system load projections and reserve requirements), it ignored the false information contained in the schedules submitted by Enron and others. The report seems to indicate that the Cal ISO was aware of the false underscheduling by the California public utilities and the counterbalancing effects of the false overscheduling of load by Enron and others. Because the Cal ISO is the control area operator of the transmission grid, it is imperative that the Cal ISO identify poorly designed market rules and make filings with the Commission proposing solutions. However, the Cal ISO must implement the Commission-approved

Chapter VI
Docket No. PA02-2-000 Price Manipulation in Western Markets VI-26
rules until they are changed, as all other public utilities are required to do.
Transmission Congestion Strategies
Non-Firm Exports, Death Star, and Wheel-Out In this section, we examine three Enron trading strategies known as “non-firm exports,” “death star,” and “wheel-out,” along with similar variations.31 All are designed to generate payments for relieving transmission congestion by “fooling” the Cal ISO’s computerized congestion management program. These trading strategies generally involved scheduling transmission in the opposite direction of congestion, and thereby getting paid for the counterflow. They are all premised on imaginary transactions that are nonetheless eligible for congestion payments from the Cal ISO. As described in the May 8, 2002 Data Request, in death star a company schedules energy in the opposite direction of congestion (counterflow), but no energy is actually put onto the grid or taken off of the grid. This trading strategy has been the subject of hearings in California. In a wheel-out, a company, knowing that an intertie is completely constrained (that is, its available capacity is set as zero) or out of service, schedules a transmission flow over the facility, knowing that the schedule will be cut and that it will receive a congestion payment without actually sending energy over the facility. In a non-firm export, a company gets a counterflow congestion payment from the Cal ISO by scheduling non-firm energy from a point in California to a control area outside of California and cutting the non-firm energy after it receives such payment. As discussed in the Initial Report, the first instance of these trading strategies occurred on May 25, 1999. On that day, Enron scheduled an infeasible transaction in the Cal PX market across an intertie between southern California and Nevada. Because this schedule called for 2,900 MW to go across a line with only 15 MW of available capacity, it triggered the Cal ISO’s congestion management procedures. A later investigation into this incident by the Cal PX resulted in a cash settlement by Enron.
31Related schemes that are referenced in documents other than the Enron memoranda include “black widow,” “red congo,” and the “Forney perpetual loop.”

Chapter VI
Docket No. PA02-2-000 Price Manipulation in Western Markets VI-27
However, according to the Enron memoranda, these trading strategies became more complex and included the participation of other entities. The counterparties were used primarily to schedule parts of the transactions or to use transmission facilities outside the Cal ISO’s control area in order to hide the transaction. In fact, no energy flowed because the schedule began and ended at the same location. Noninvestor-owned California utilities, such as the Northern California Power Agency and LADWP, were also particularly crucial to these strategies because they own and control transmission facilities that interconnect with the Cal ISO’s system but are outside the control of the Cal ISO, which was crucial in helping to avoid detection. Staff notes that in its response to the May 8, 2002 Data Request, Powerex states that there is a structural flaw in the Cal ISO’s congestion management software that prevents the software from recognizing that a tie is out of service. Powerex claims that it has a standing practice of maintaining adjustment bids at interties to relieve congestion. The Cal ISO occasionally requested Powerex to remove its adjustment bids when the Cal ISO intended to take the line out of service. However, if the Cal ISO did not provide such advance notice, Powerex would receive a congestion payment. Powerex states that it is unable to identify such payments. In a March 15, 2001 e-mail from an Enron employee to the Enron Portland shift, he describes a new strategy for taking power from southern California to northern California using the Silverpeak intertie with the Sierra Pacific Power Company system as part of the transmission path. There is no indication from this e-mail that Sierra Pacific is aware of the import/export strategy. However, the following quote from the e-mail is interesting:
Also do not sell to a marketer (especially POWEREX) without sleeving. We do not want anybody else to know about the path. If Powerex sees this I guarantee that they would try to schedule this and we do not want competition.
The Cal ISO report identifies Powerex, along with Coral Power, LLC (Coral) and Sempra Energy Trading Corporation (Sempra), as the largest recipients of revenues from this type of activity. In addition, TransAlta described several transactions that have certain operational elements common to these Enron trading strategies. Unlike the Enron trading strategies, however, the TransAlta transactions actually moved power. For example, what TransAlta calls

Chapter VI
Docket No. PA02-2-000 Price Manipulation in Western Markets VI-28
“recirculation” was a way to move energy supply from southern California to northern California when the Cal ISO-controlled transmission path between these regions was fully subscribed. TransAlta would move the energy to the northwest using its transmission rights over non-Cal ISO facilities and then import the power into northern California. At times, the Cal ISO actively sought the assistance of TransAlta in implementing these energy transfers. TransAlta was very helpful and aided Staff’s understanding of different variations of the strategies by volunteering a significant amount of information. While TransAlta used a very broad reading of Staff’s data requests and was very cooperative, many respondents took the opposite approach. In fact, some entities used such a narrow interpretation of the questions about the Enron strategies that, if Enron were to use these interpretations, it would not admit to using its own strategies. An example is Sempra. Sempra denied engaging in the Enron strategies in its original May 22, 2002 response. On October 4, 2002, the Cal ISO issued a report prepared by the Department of Market Analysis, “Analysis of Trading and Scheduling Strategies Described in Enron Memos.” This report was provided to regulatory and law enforcement agencies on a confidential basis. On January 6, 2003, the Cal ISO released the report publicly and posted it on its Web site. The report was intended to (1) indicate how extensively the Enron trading strategies may have been used by Enron and others and (2) identify specific schedules and transactions that could be further investigated. The report identifies Sempra in connection with its analysis of the following Enron trading strategies: wheel-out, scheduling energy to collect congestion charges, death star, and get shorty. The analysis indicates that Sempra was among the top three in all these categories and potentially generated more revenues than Enron in each strategy. In a letter dated January 15, 2003, Sempra informed Staff that nothing in the Cal ISO report suggests that Sempra engaged in the Enron strategies. The Sempra explanation of how they could not have engaged in wheel-out illustrates our point. The Enron memos describe wheel-out as a simple strategy that took advantage of a market design flaw. Knowing that an intertie is completely constrained or out of service, a company schedules a transmission flow over the facility. This strategy generates revenue because the schedule will be cut and it will receive a congestion payment without actually having to send energy over the facility. The Cal ISO report focused on revenues on out-of-service tie points only. In its defense, Sempra states that while it did submit schedules over a

Chapter VI
Docket No. PA02-2-000 Price Manipulation in Western Markets VI-29
facility even after it received notification of constraints on a facility, the Cal ISO notices are only for “informational purposes” and their accuracy cannot be relied on. Next, Sempra explains that it would only receive a payment if the Cal ISO actually cut its schedule. However, a payment can and should be expected when a line is out of service, which is all that the Cal ISO report focused on. Sempra concludes by stating:
Thus, that [Sempra] may have received certain counterflow payments in connection with schedules or adjustment bids on tie points that were out of service, in no way suggests that [Sempra] submitted those schedules or bids knowing that the schedule would be cut and that it would receive a congestion payment without actually having to send energy over the facility.
Sempra wants Staff to believe that it ignored the fact that a facility was out of service, scheduled power over that facility anyway, and was shocked that it actually made money. Using this rationalization, not even Enron could be accused of engaging in the wheel-out trading strategy. This lack of cooperation is not limited to jurisdictional public utilities. For example, the city of Glendale, California (Glendale) also denied any knowledge of the Enron strategies in its May 31, 2002 response to Staff’s data request. On January 16, 2003, Glendale submitted a supplemental response maintaining that Glendale did not knowingly engage in the Enron trading strategies. However, included in the submittal are two memos (one from Enron and one from Coral) that were found during an internal review; these memos describe many of the Enron trading strategies in detail. They also describe the steps Glendale needs to take to implement the strategies in conjunction with Enron. Under the heading “Phantom Ancillary Services,” the Coral memo details how Glendale can bid capacity for day-ahead ancillary services when the capacity is not actually available. The memo describes Glendale’s ability to use its non-Cal ISO transmission rights to “play” the Cal ISO system. Another strategy is called “detrimental price plays in ISO.” Because both Glendale and Coral have load within California, this strategy involves phantom trades between the two in order to capture differences in energy prices between zones and congestion payments. Glendale’s continued denial of any knowledge of the Enron trading strategies is not supported by the evidence it submitted or the evidence
Chapter VI
Docket No. PA02-2-000 Price Manipulation in Western Markets VI-30
in the Enron e-mails described elsewhere in this chapter. For example, an Enron e-mail dated February 17, 2000, from an Enron employee to the Enron Portland shift, states the following:
GLENDALE—we have been getting few opportunities to do profit sharing transactions with certain members of their staff. We need to let [Enron employee name] and myself know when we call to get them involved and they have no interest. Their manager wants to do this every time we see fit. Everyone needs to know why they don’t want to play.
The city of Redding, California (Redding) is also discussed in the Enron e-mails as participating in the congestion relief scheme known as “red congo.” In one e-mail to the Enron Portland shift, it is advised that red congo is a new marketing arrangement to relieve congestion that also uses Pacificorp West as the northwest utility that moves energy from south to north from the Cal ISO. Part of the scheme uses Redding’s existing rights on non-Cal ISO transmission and a series of sales and purchases between the parties. This e-mail also notes the following: “Redding is on board with this strategy as is Pacificorp.” This preponderance of evidence suggests that nonjurisdictional entities such as Redding and Glendale were associated with Enron in executing the trading strategies in a willful and knowing manner. These trading strategies would not be possible if a single comprehensive congestion management system were implemented in the West, as Staff recommends. In addition, artificial congestion or congestion relief would violate Staff’s recommended tariff language prohibiting false schedules and information. Staff concludes that the transmission congestion strategies not only involve gaming, but also may fall into the category of anomalous market behavior because they are departures from normal behavior in competitive markets and lead to unusual or unexplained market outcomes.32 Staff emphasizes that Enron, in conjunction with other parties, took intentional advantage of the market rules in creating and implementing these trading strategies. The Cal ISO Report, as discussed earlier, identifies Powerex, Coral, and Sempra as the largest recipients of revenues for such strategies.
32MMIP 2.1.1.

Chapter VI
Docket No. PA02-2-000 Price Manipulation in Western Markets VI-31
Ancillary Services Strategies
Get Shorty As described in the May 8, 2002 Data Request, the “get shorty” trading strategy involves the “paper trading” of ancillary services. Ancillary services include various types of generation capacity that are held in reserve for use in a contingency situation, such as the loss of a critical generation or transmission facility (e.g., replacement reserves). These services are required by the Cal ISO in order to reliably operate its system and to meet various operational standards. In this trading strategy, Enron would commit to provide the ancillary services in the Cal PX’s day-ahead market and then cover its position by purchasing those services in the Cal ISO’s hour-ahead market. There is a legitimate profit motive here: to sell high in the day-ahead market and buy back at a lower price in the real-time market. Staff notes that Cal ISO Tariff Amendment No. 4, which the Commission accepted for filing,33 permits the buyback of ancillary services as a legitimate form of arbitrage. At one point a Cal ISO employee attempted to stop the buyback by setting a high market-clearing price. In this incident, which was examined by the California Committee, a former Cal ISO employee attempted to stop market participants from buying back ancillary services in the hour-ahead market at a low price. Transcripts from a recorded phone conversation indicate that the Cal ISO employee contacted an Enron trader and suggested that he submit a bid of $91.86 in order to set the market-clearing price at the then-current ceiling price. Following the conversation, the Enron trader did submit a bid at the maximum rate. The incident appears to be an isolated case. The original Enron memoranda indicate that its traders committed to sell ancillary services without actually having the ancillary services on standby (which is why the trading strategy is also called paper trading). Because entities are required to identify the source of the ancillary services (that is, the specific generating unit), Enron’s traders submitted false information to the Cal ISO. It is this aspect of the trading strategy—the deliberate submission of false information to the Cal ISO—that distinguishes it from permissible arbitrage activity. An e-mail dated January 11, 2000 from an Enron employee to the Enron Portland shift explains how Enron will take a more aggressive strategy
33California Independent System Operator Corporation, 82 FERC ¶ 61,327 (1998).

Chapter VI
Docket No. PA02-2-000 Price Manipulation in Western Markets VI-32
(currently used with Glendale) to bid into the day-ahead ancillary services market without the necessary resources (i.e., paper trading of ancillary services). The Initial Report concluded that, to the extent that this trading strategy involves deliberately supplying false information, the practice should also be prohibited. The Cal ISO analysis reporting on this trading strategy notes the difficulty of determining whether resources were actually available when ancillary services were sold in the day-ahead market, especially when the resource is imported from another control area into the Cal ISO’s control area. In an attempt to quantify the potential extent of this practice, the Cal ISO summarized the total amount of ancillary services sold back to the Cal ISO in the hour-ahead market. These data indicated that four entities were far more active than Enron, which had net sales of $5 million. These entities, in order of magnitude, are Coral Power, LLC ($17.1 million), Sempra Energy Trading Corporation ($13 million), Avista Energy Inc. ($11.8 million), and Modesto Irrigation District ($10.3 million). These four entities and Enron had a total net gain of more than $57 million. As discussed in the final section of this chapter, these entities may not have acted independently. In fact, evidence recently produced by Enron in response to Staff data requests indicates that the buyback of ancillary services by certain entities may have been coordinated under the direction of Enron under business alliances. For example, in an Enron document entitled “Washington Water and Power (now Avista) Ancillary Services Information,” the pricing arrangement states the following: “All Capacity revenue will be divided between WWP and [ENRON] in the following ratio: 75 percent to Washington Water and Power and 25 percent to Enron Power Marketing Inc.” Following a similar description for splitting energy revenue, the document states that: “WWP understands this concept and prices accordingly.” An Enron e-mail dated June 5, 2000 describes the results of the joint effort and details “a summary of money made on ancillary services for the month of May” as follows:
Customer Total Amount Enron Amount
Colorado River Commission $401,770 $220,885City of Glendale 608,520 $150,135Valley Electric Association $56,038 $14,010El Paso Electric Company $2,000 $500TOTAL $1,068328 $365,530

Chapter VI
Docket No. PA02-2-000 Price Manipulation in Western Markets VI-33
Another e-mail dated November 5, 1999 to the Portland shift (with the subject line “DEAL ENTRY ERRORS”) explains the consequences of such mistakes from both management’s and the customer’s perspective. For example, the e-mail states: “This morning our book showed us losing $51,000 because the Redding profit sharing deal was incorrectly entered.…” Another customer complaint is explained as follows: “We have had to explain to EPE why they received only expost for their exercised ancillary services deal (it’s because we had a zero exercise price in the hour ahead bid to the Cal ISO).” In the final section of this chapter, Staff makes further recommendations for further investigations of these and similar relationships. Finally, Staff notes that this trading strategy was used more widely by other entities than indicated by the responses to our data request. Certain entities, through a very narrow reading of the question, were not forthcoming in their responses. Sempra’s response is one example. As explained in the Enron memo, the paper trading strategy involves the following: (1) a sale of ancillary services in the day-ahead market and (2) the next day, in the real-time market, the company “zeroes out” the ancillary services by canceling the commitment to sell and buying ancillary services in the real-time market to cover its position. The critical element here is that companies could commit to sell on a day-ahead basis without having capacity available and fulfill their obligation by buying this service from the Cal ISO in the hour-ahead (real-time) market. The Sempra original response states: “[Sempra] did not sell ancillary services in the day-ahead market and later cancel its commitment to do so in the real-time market.” It adds that there is nothing in the Cal ISO report and contradicts this statement because the clause “canceling commitments in the real-time market” is not mentioned. Sempra also argues that the Enron memo and Staff data request incorrectly refer to a buyback in the real-time market (rather than the hour-ahead market); therefore, it correctly denied engaging in the strategy. In spite of this denial, Sempra has stated that it adjusted its ancillary service schedules in the hour-ahead market based on, among other things, market opportunities. However, this does not address the real question: was this revenue earned by legitimate arbitrage or through submitting a false schedule (i.e., committing capacity it did not have on a day-ahead basis). Once again, using Sempra’s reading of the data request, not even Enron could be accused of engaging in the trading strategy. Staff notes that the preliminary screen used in the Cal ISO report shows that Sempra earned over $13 million, which is more than

Chapter VI
Docket No. PA02-2-000 Price Manipulation in Western Markets VI-34
twice the amount that Enron earned ($5 million). Staff notes that, according to the Cal ISO report, Coral Power, LLC, Avista Energy Inc., and Modesto Irrigation District of California also earned more than Enron. Staff concludes that the get shorty trading strategy falls within the scope of the antigaming provision because it makes the Cal ISO or Cal PX markets vulnerable to price manipulation.34 According to the Cal ISO report discussed in this chapter, Coral Power, Sempra, Avista Energy, and Modesto Irrigation District of Northern California, as well as Enron, had a total net gain of more than $57 million from the get shorty trading strategy. Selling Non-Firm Energy as Firm Energy As described in the Initial Report, in this trading strategy a company deliberately sells or resells what is actually non-firm energy to the Cal PX, while claiming that it is firm energy. NERC prohibits this practice since it violates NERC’s existing interchange rules. However, the Enron memoranda attempt to justify this trading strategy on the grounds that it supposedly brought additional supply to California with no apparent impact on Cal PX energy prices. The Enron memoranda also explain that Enron was subject to financial risk because, if the non-firm energy supply were cut, Enron would have to cover its position by purchasing that energy in the Cal ISO’s real-time market as a price taker. Staff finds this rationalization to be particularly troubling because Enron attempted to legitimize deception, the deliberate submission of false information, and actions that NERC expressly prohibited. This is a key example of why Staff is recommending an explicit prohibition against providing false information. This trading strategy also compromises reliability because non-firm energy improperly represented to be firm energy is not backed up with reserve generation by the supplying party. This problem is made worse when non-firm energy is imported into another control area. The receiving control area will not procure reserves for the import under the illusion that the supplying party is responsible for providing adequate generation reserves. Because this Enron trading strategy usually involved a purchase, it is difficult to detect absent the reporting of the entity selling the non-firm energy to Enron.
34MMIP 2.1.3.

Chapter VI
Docket No. PA02-2-000 Price Manipulation in Western Markets VI-35
Recommended Commission Responses The Enron trading strategies that were based on false information and that had an adverse effect on the markets are encompassed within the MMIP protocol of the Cal ISO and Cal PX tariffs. Therefore, Staff recommends that the Commission initiate show cause proceedings for the companies listed in this chapter, with disgorgement of unjust profits associated with the various transmission congestion strategies (e.g., non-firm exports, death star, and wheel-out), load shift, ancillary service sales without the necessary resources, megawatt laundering, and selling non-firm energy as firm energy. These proceedings should involve both public and nonpublic utilities that engaged in these strategies under the Cal ISO and Cal PX tariffs. We emphasize that the trading strategies—while bearing Enron’s name—were not limited to Enron but appear to have been widely engaged in by numerous parties. Indeed, it would appear to Staff that the majority of public utility entities, and some nonpublic utilities, engaged in at least some of the trading strategies some time during the 2-year review period. The cumulative effect of this prevalent alleged misconduct is that customers did not pay just and reasonable rates for wholesale electricity. This is because the trading strategies as a whole adversely affected the operations of Cal ISO or Cal PX markets and the calculation of the market-clearing price, which is dependent on participants engaging in bidding practices consistent with the Cal ISO and Cal PX tariffs and market rules, and not gaming the system or otherwise taking undue advantage of market rules. All of the market participants identified in the Cal ISO study by its initial screen should be required to show cause why their behaviors did not constitute gaming in violation of the Cal ISO and Cal PX tariffs, with disgorgement of unjust profits associated with the violations or other appropriate remedies. Those market participants are as follows:
♦ Sempra
♦ San Diego Gas & Electric
♦ Morgan Stanley Capital Group
♦ Coral Power, LLC
♦ Powerex or British Columbia
♦ Enron Power Marketing Inc. and its affiliate, Enron Energy Services Inc.
♦ Avista Energy Inc.

Chapter VI
Docket No. PA02-2-000 Price Manipulation in Western Markets VI-36
♦ Pacific Gas and Electric Company
♦ American Electric Power Services Corporation
♦ Duke Energy Trading & Marketing
♦ Mirant (previously known as Southern Company Energy Marketing, L.P.)
♦ Cargill-Alliant, LLC
♦ Idaho Power Company
♦ Puget Sound Energy
♦ Dynegy
♦ PGE Energy Services
♦ Calpine Corporation
♦ Modesto Irrigation District
♦ City of Glendale, California
♦ City of Azusa, California
♦ City of Riverside, California
♦ City of Pasadena, California
♦ City of Vernon, California
♦ Salt River Project
♦ Reliant
♦ Arizona Public Service Company
♦ Williams Energy Services Corporation
♦ PacifiCorp
♦ Automated Power Exchange
♦ Bonneville Power Administration (BPA)
♦ Portland General Electric
♦ Los Angeles Department of Water and Power (LADWP)
♦ Aquila
♦ Southern California Edison
♦ Citizens Electric
♦ Constellation Power Service
♦ Sierra Pacific Power Company

Chapter VI
Docket No. PA02-2-000 Price Manipulation in Western Markets VI-37
Staff also recommends that the Commission require the Cal ISO to provide transaction data that its analysis identified. The Cal ISO should also fully explain the screen that was used to identify the subject transactions. This information should also be made available publicly.
Enron’s Business Model In addition to the trading strategies discussed, Enron also created a marketing program based on the use of other entities’ assets, thus avoiding large capital expenditures and the risk of owning its own resources. Business opportunities under Enron’s business model were focused on smaller utilities, such as public utility districts, municipalities, qualifying facilities, and cogeneration facilities. Enron, using partnerships or alliances with others, gained market share, acquired commercially sensitive data, shared decisionmaking authority, and promoted reciprocal dealings and equity sharing of profits, among other things. A company’s business strategy is obviously devised by top management. In Enron’s case, the business model is described in Enron documents from a 30,000-foot view as “Skilling’s ‘Enron Network’ story.” Enron formed business alliances or partnerships without filing the agreements with the Commission as required under its market-based rate authorizations. Its promotional literature entitled “Why customers choose Enron” was intended to convince others that using Enron, with its market knowledge of complicated markets such as in California, was a good business decision. Using Enron would save these entities labor and systems costs. Most importantly, using Enron would be profitable. Under this business model, the nature of Enron’s interaction with its business partners developed over time under a flexible master contract. For example, Enron35 would first offer “consulting” services that allowed entities to outsource certain tasks rather than manage these tasks themselves. Enron gradually developed these relationships by expanding its services in an attempt to effectively control the assets of others in the decisionmaking process. Enron’s compensation for these “services” usually started with a fee structure (e.g., a charge/MWh for 35From the documents in Staff’s possession, it would appear that Enron may have used its jurisdictional and nonjurisdictional affiliates interchangeably; that is, at times, its nonjurisdictional companies performed the functions of jurisdictional companies. To the extent that a nonjurisdictional Enron affiliate in fact performed jurisdictional services, it was operating in the absence of a filed rate schedule and was in violation of the Federal Power Act. Revenues from such services would be refundable to the customers, at least in the absence of Enron’s bankruptcy.

Chapter VI
Docket No. PA02-2-000 Price Manipulation in Western Markets VI-38
scheduling energy with the Cal PX). However, as the original relationship grew into a more comprehensive partnership, the compensation typically changed to an equity basis (share of profits) when the marketing of wholesale power was involved. An Enron Services Handbook explains that in most instances, profits from marketing energy were split on a 50/50 basis while profits from capacity sales for ancillary services were split 25/75, with 25 percent going to Enron and 75 percent to its partner. One exception explained in the handbook involves certain energy sales with Puget when a sliding scale was used. If the sale was under $99/MWh, Enron received $5 and the remainder went to Puget. For sales between $700 and $750/MWh, Enron received $80 and the remainder went to Puget. While some forms of this rate structure may be appropriate under certain situations, this rate structure was used without notification to the Commission and without Commission approval. Another e-mail dated December 24, 1999 explains the Big Foot deal as buying energy from Washington Water Power Company and scheduling it into California as a supplemental energy bid. As explained earlier, supplemental energy bids are associated with available capacity (e.g., generation used for ancillary services). The e-mail suggests that the traders may want to consider the following as part of the profit sharing: “If you buy from WWP and do real well on a supplemental, you might consider giving a few more dollars for their energy.” With these types of profit-sharing arrangements, it is hard to argue that Enron’s “partners” or “customers” did not have an understanding of how their profits were derived. An undated Enron document entitled “Public Service of New Mexico California Service Overview” demonstrates a form of cooperative corporate behavior as follows:
Enron and PNM will partner up and attempt to extract profits by purchasing day-ahead power in bilateral market and sinking the power in one of several markets: […] The combination of these potential sinks should increase the ability of the partnership to find a profitable spread between the cost of purchasing the power and the revenues received from its eventual sale. Any profit/losses after all costs will be split 50 percent by each party. Enron will utilize its trading expertise, SC status, and California load to enhance this partnership. PNM will contribute its trading expertise and SW system to this partnership.

Chapter VI
Docket No. PA02-2-000 Price Manipulation in Western Markets VI-39
Enron’s Business Partners Various Enron documents indicate that Enron had service agreements or other contractual relationships with a number of entities, including the following:
♦ Energy West
♦ Montana Power Company
♦ Puget Sound Power and Lighting Company
♦ Powerex Corporation (formerly British Columbia Power Exchange Corporation)
♦ City of Redding, California
♦ City of Glendale, California
♦ Colorado River Commission (CRC)
♦ Las Vegas Cogeneration
♦ Washington Water Power Company (later named Avista)
♦ Valley Electric Association
♦ Public Service of New Mexico
♦ Grant Public Utility District
♦ Grays Harbor Paper Company
♦ Northern California Power Agency
♦ Modesto Irrigation District of Northern California
♦ TOSCO Mr. Belden explained in an e-mail that Enron was able to develop alliances with other entities because:
As regulatory changes, competitive markets, and institutions such as the California ISO increase the complexity of power trading, scheduling and settlements, more and more organizations are outsourcing certain tasks rather than manage these tasks themselves. Enron Power Marketing, Inc. (EPMI) is increasingly being called on to provide these services. Service transactions generally include ongoing EPMI performance obligations and greater daily customer interaction. Examples of these types of transactions include El Paso Electric, Valley Electric, Glendale, Enron Energy

Chapter VI
Docket No. PA02-2-000 Price Manipulation in Western Markets VI-40
Services, and many others that are currently being contemplated or finalized.36
Gaining Control of Assets A presentation at an Energy West Power Business Review Meeting characterizes the business strategy even more bluntly under a section entitled “Gaining Control of Assets.” The presentation states:
Currently pursuing two strategies. The first is gaining control of a variety of small resources or capabilities around the west. For example, the combination of El Paso Electric, Las Vegas Cogen, Valley Electric, and Glendale joint venture provide us with a useful mix of loads and resources in the southwest. These transactions require relatively little capital, but will require automated IT links to customers and more people in the logistics group.37
Essentially, Enron developed initial business relationships with entities, which over time evolved into alliances in which Enron could gain more control of decisionmaking in a way that maximized profits for itself and its business partners. As the summary of the Energy West Power Business Review Meeting states:
(1) Currently provide scheduling services to El Paso Electric, Glendale, CFE (Mexico), Tosco, Washington Water Power, and Enron Energy Services.
(2) Use scheduling as a platform that will dovetail with click trade and that will lead to larger transactions that will make more money (e.g., joint venture with the City of Glendale).38
An Enron Services Handbook contains a list of California market conditions with instructions for the Enron employee concerning whom to call and what steps the partner should follow in order to take advantage of a particular market situation. For example, if the prices in the California market are high, the Enron employee would refer to the handbook section entitled “Who do you call and what action to take?” The Enron employee first decides if the price is high enough to be profitable to the “customer.” If it is profitable, the Enron employee implements the fat boy strategy: “generate or import and fake, or 36Staff Exhibit No. S-34 in Docket No. EL02-113-000. 37Staff Exhibit No. S-34 in Docket No. EL02-113-000. 38Staff Exhibit No. S-34 in Docket No. EL02-113-000. Click trading refers to the use of electronic trading on the EnronOnline platform.

Chapter VI
Docket No. PA02-2-000 Price Manipulation in Western Markets VI-41
increase, load.” In this situation, the Enron employee could call Glendale, El Paso Electric, CRC, or Valley Electric and instruct them to increase imports into California; the handbook lists the transmission paths to be used. Redding and Tosco could be instructed to increase generation in northern California to implement this strategy. The pricing structure for this strategy specifies an even 50/50 split between Enron and its partner. The instructions alert the Enron employee to check to see if there are also high ancillary service prices. In that situation, the Enron employee should “call Glendale, Puget and El Paso Electric to try to get ancillary services bids in” and “call customers and have them ‘bid in’ more.” The handbook also includes a list of steps to take if the prices in California are low. In this situation, the instructions call for the opposite strategy known as thin man—“artificially reduce load and export.” The same counterparties are listed with corresponding delivery points for exporting their resources out of California. A similar pricing structure is also listed. Staff notes that in an August 22, 2000 West Mid-Market Quarterly Business Review, Enron states that it “touched/managed 3,500 MW/day.” Still other Enron documents describe arrangements that go beyond joint coordinated activity and describe total Enron control of decisionmaking authority. An Enron e-mail dated December 23, 1999 to Portland shift, with the subject “Valley Electric,” states the following:
We will be scheduling and making marketing decisions on Valley’s behalf starting 1/1/2000[...]. There is an agreed on value sharing mechanism, in which Enron will get 40% of this “marketing value.”
Enron literature describes how it planned to grow its relationship with parties. As its relationship grew, Enron collected data from the customer that it used for its own trading and marketing activities. For example, its strategy allowed “Enron to know as much or more about the customer’s near term position.” Finally, under this strategy, Enron planned to:
Store operational data that the customer’s merchant group would not normally be storing. Provide service around analysis and manipulation of data. [Enron North America] would own the data—a potential to lock customers in—if they leave [Enron North America] their data stays here.

Chapter VI
Docket No. PA02-2-000 Price Manipulation in Western Markets VI-42
In our Initial Report, the alliance between El Paso Electric Company and Enron was set for hearing in a proceeding apart from Docket No. PA02-2-000. That proceeding (Docket No. EL02-113-000) investigated whether Enron’s use of El Paso Electric’s facilities, pursuant to an unfiled service agreement, may have been improper. A settlement has been reached in that proceeding and El Paso Electric agreed to a substantial dollar settlement. That partial settlement, which is between El Paso Electric, the California Parties,39 and the Trial Staff, does not address alleged violations of Enron and has not yet been certified to the Commission. Therefore, Staff recommends no further action against El Paso Electric. Recommended Commission Responses Staff believes that some of the Enron trading strategies violated the Cal ISO and Cal PX tariff provisions, which were in effect since operation began in April 1998. If a trade simply took advantage of a legitimate arbitrage opportunity, such as exporting a legitimate energy schedule, there would not be a tariff violation. If, however, in executing an Enron strategy a component was based on fictitious information that adversely affected market outcomes (such as death star or other transmission congestion strategies, get shorty, megawatt laundering simply to raise prices, load shift, or treating non-firm supply as firm supply), such activity could fall within the scope of the antigaming and/or anomalous market behavior provisions of the Cal ISO and Cal PX tariffs.40 Therefore, Staff believes that it would be appropriate to issue an order to Enron and its partners (both public utilities and governmental entities) to show cause why these behaviors did not constitute gaming in violation of the Cal ISO and Cal PX tariffs, with disgorgement of unjust profits associated with the violation or other appropriate remedies. It makes no difference if the Enron partner or Enron itself executed the transaction. In either case, the misconduct falls under the Cal ISO and Cal PX tariffs. All parties subject to the show cause orders41 should be required to inventory all revenues related to the Enron trading strategies and 39The California Attorney General, the California Electricity Oversight Board, the Public Utilities Commission of the State of California, Pacific Gas and Electric Company, and Southern California Edison Company (collectively, California Parties). 40Although the fat boy strategy included submitting false load schedules, it did not adversely affect the market outcomes, if the generation is simply bidding as a “price taker.” To the extent the generator submitted strategic bids that affected the market outcomes, this would constitute market behavior prohibited under the Cal ISO tariff. 41Energy West; Montana Power Company; Puget Sound Power and Lighting Company; Powerex Corporation (formerly British Columbia Power Exchange Corporation); City of Redding, California; City of Glendale, California; Colorado River Commission (CRC); Las Vegas Cogeneration; Washington Water Power
Chapter VI
Docket No. PA02-2-000 Price Manipulation in Western Markets VI-43
demonstrate whether or not the transactions were legitimate as discussed in this chapter. In summary, the evidence indicates that Enron, on its own, could not have implemented its trading strategies. It was only with the willing cooperation of others that these strategies could have been executed. Through Enron’s direction, other entities both inside and outside California made business decisions that capitalized on market conditions in an effort to maximize profits from their assets on a coordinated basis. The coordination activity of Enron and its partners clearly changed market outcomes in a variety of ways. These parties capitalized on the complexities of the California market rules and structure. Market problems and dysfunctions were considered opportunities. As discussed above, Enron either acted on its partners’ behalf or alerted others to act in a like manner in order to capitalize on market conditions that it anticipated or knew about. Profits from this activity were typically shared. Enron systematically acted in partnership with others without the Commission’s knowledge, and the joint behavior of these entities served to game the market. The collective behavior of these entities turned defects in market rules and market structures into profit-making opportunities for Enron and its partners. A critical component of the Commission’s market-based rate authorization involves a determination of an applicant’s relative size in a market (market share). This determination is based on the amount of generation an entity either owns or has under contract, and the applicant is responsible for notifying the Commission in a timely manner of significant changes to its market share. According to the internal Enron documents, Enron controlled a significant amount of generation which it did not disclose in its filings before the Commission, and it never notified the Commission that changes in circumstances had occurred. The preponderance of evidence reviewed by Staff during this investigation indicates that Enron and its affiliates intentionally engaged in a variety of market manipulation schemes that had profound adverse impacts on market outcomes. Due to this overwhelming evidence, Staff recommends that the Commission issue an order to show cause why its market-based rate authorizations and
Company (later named Avista); Valley Electric Association; Public Service of New Mexico; Grant Public Utility District; Grays Harbor Paper Company; Modesto Irrigation District of Northern California; and TOSCO.

Chapter VI
Docket No. PA02-2-000 Price Manipulation in Western Markets VI-44
blanket certificate authority should not be revoked.42 This order should cover Enron and its affiliates with the exception of Portland General Electric Company, which is the subject of an ongoing investigation in Docket No. EL02-114-000. Staff recommends that such revocation be made effective prospectively so that any preexisting contracts are not affected.
Filing Requirements Staff is also aware that other entities conducted promotional activity similar to Enron in an attempt to form similar strategic alliances. For example, Sempra and Public Service of New Mexico may have competed with Enron in an attempt to perform similar services for El Paso Electric Company. Other evidence indicates that various entities may have had agreements with other market participants that had similar attributes as the Enron partnership agreements (e.g., sharing commercially sensitive information and coordinating activities). These entities include Avista and Turlock Irrigation District; Avista and the City of Riverside, California; Coral and the City of Glendale, California; and Coral and Sempra. To address this situation, Staff recommends that the Commission order all public utilities with market-based rates to file any past and present agreements with other entities having any of the characteristics described above within 30 days. This requirement applies to both sides of an agreement regardless of whether the entity is supplying or receiving service. The Commission can determine if such agreements cede operational control of assets or provide for an equity split of profits from unauthorized coordinated marketing activity. The Commission may need to clarify at what point Section 203 and 205 filings should be triggered. Failure to comply with this order should be dealt with harshly. For example, if entities do not provide this information and it is later discovered that such agreements exist, the Commission should immediately revoke market-based rate authorization for that entity.
42The Commission has already instituted formal proceedings to investigate Enron’s ownership interest in various qualifying facilities, including Las Vegas Cogeneration Limited Partnership; Saguaro Power Limited; Victor Garden Phase IV Partnership; Sky River Partnership; Cabazon Power Partners LLC; Zond Wind System Partners, Ltd. Series 85-A; and Zond Wind System Partners, Ltd. Series 85-B.

Chapter VI
Docket No. PA02-2-000 Price Manipulation in Western Markets VI-45
Economic Withholding of Generation and Inflated Bidding During May to October 2000
Staff’s preliminary analysis of the excessively high spot market-clearing prices as compared to the generation input costs (primarily natural gas costs) during May to October 2000 reveals what appear to be potential gaming violations, as defined in the MMIP of the Cal ISO and Cal PX tariffs. Staff has focused its analysis on this period because it covers the period of escalating prices prior to the October 2, 2000 refund effective date. As explained earlier in this chapter, since the commencement of service in April 1998, the MMIP of the Cal ISO and Cal PX tariffs defined anomalous market behavior as including:
♦ Unusual trades or transactions.
♦ Pricing and bidding patterns that are inconsistent with prevailing supply and demand conditions, e.g., prices and bids that appear consistently excessive for or otherwise inconsistent with such conditions.
♦ Unusual activity or circumstances relating to imports from or exports to other markets or exchanges.
Clearing prices for the Cal ISO spot markets between May and October 2000 reached the then-current purchase price caps (that is, the Cal ISO would reject offers to sell power and/or energy to it at prices above these levels).43 As explained below, the input costs for generation during this period do not support these excessively high spot market-clearing prices. An example of the bidding behavior in question is the overall timing of the rise in spot market-clearing prices. As explained in Chapter IV of this Report (Figure IV-1), in May 2000 a disparity began to appear between the input costs of generation and the spot market-clearing prices for electricity. Over this time period, electric prices rose to levels often in excess of $500/MWh even though natural gas prices would have supported electric prices of only about $75/MWh. As explained in Chapter IV, the capital recovery requirement for a hypothetical new power project is between $16 and $19/MWh at a 60-
43The initial $750/MW cap was lowered to $500/MW on July 1, 2000. Subsequently, the purchase price cap was lowered to $250/MW on August 7, 2000.
Chapter VI
Docket No. PA02-2-000 Price Manipulation in Western Markets VI-46
percent plant factor.44 Therefore, the fixed and variable cost of generation would not exceed $100/MWh. As opposed to a rise in input costs, the excessively elevated bid prices appear to be solely an attempt to raise prices and Staff views this as a form of economic withholding. For example, bids were at or near the $750/MWh bid cap in both the Cal ISO and Cal PX until it was lowered on July 1, 2000. Bids for the same units were at or near the $250/MWh cap later in the summer even though input prices had risen during the interim period. The Commission’s June 19, 2001 Order discussed the past performance of the single clearing price auction in California. The marginal unit of the least efficient unit dispatched (i.e., the unit with the highest heat rate) sets the clearing price that is paid to all generation in the market. In 1998 and 1999 (California’s restructuring commenced operation on April 1, 1998), the California spot market produced average annual wholesale energy prices of $29 and $31/MWh, respectively. Staff notes that weather conditions were more favorable during this historical period, resulting in better hydro generation and lower system loads than during 2000 and 2001. Even with these major differences, the disparity in clearing prices before and during the crisis period is instructive. Table VI-1 calculates the implied heat rates of units during the summer of 2000. The spot gas prices during this period ranged from $3.71 to almost $6.00. Dividing bid prices (ranging from $200 to $750/MWh) by the spot gas prices produces a rough approximation of the implied heat rate of a unit. These results show heat rates far beyond even the most inefficient units in California.
44See Chapter IV, footnote 11: California Energy Commission, 2000–2012 Electricity Outlook Report, pp. 32-33.

Chapter VI
Docket No. PA02-2-000 Price Manipulation in Western Markets VI-47
Table VI-1. Implied Heat Rate
Month Cost of Gas
($/MMBtu) Price Cap ($/MWh)
Bid ($/MWh)
Implied Heat Rate (Btu/kWh)
May 2000 $3.711 $750 $200 53,894 $300 80,841 $500 134,735 $750 202,102
June 2000 $4.658 $750 $200 42,937 $300 64,405 $500 107,342 $750 161,013
July 2000 $4.499 $500 $200 44,454 $300 66,681 $500 111,136
Aug 2000 $5.103 $250 $200 39,193 $250 48,991
Sep 2000 $5.975 $250 $200 33,473 $250 41,841
Sources: Gas cost from Gas Daily for PG&E citygate and SoCal large packages; monthly cost is the average of daily prices for the month; California average is 50/50 north/south.
Staff notes that the Commission’s April 26, 2001 Order (95 FERC ¶ 61,115 at 61,360) cites certain anticompetitive behaviors that would be prohibited under public utility sellers’ market-based rate authorizations. First, bids that vary with unit output in a way that is unrelated to the known performance characteristics of the unit are prohibited. An example of this bidding practice is the so-called “hockey stick” bid in which the last megawatts bid from a unit are bid at an excessively high price relative to the bids on the other output from the unit. Another example cited in the order is excessively high bids for a single unit in a portfolio compared with the remainder of the portfolio, without any apparent performance or input cost basis. The order explains a second category of prohibited bids—those that vary over time in a manner that appears unrelated to a change in the unit’s performance or to changes in the supply environment that would induce additional risk or other adverse shifts in the cost basis. An example of this is a bid that appears to change only in response to increased demand or reduced reserve margins, particularly if the timing of the bid is related to public announcements of system conditions or to timing of outages in a participant’s portfolio. Staff now concludes that such behavior was a violation of the MMIP. Staff’s general focus was at a market level, comparing the spot clearing prices with underlying input costs. Staff concludes that input
Chapter VI
Docket No. PA02-2-000 Price Manipulation in Western Markets VI-48
costs and market fundamentals do not explain the excessive rise in clearing prices during the summer of 2000. The California Parties submitted an analysis of certain large market participants during this time period and reached similar conclusions.
The California Parties’ Analysis of Bidding Practices by In-State Generators and Certain Importers The California Parties submitted an analysis of the five large in-state generators together with an analysis of the bidding behavior of five importers: BPA, LADWP, Enron, Idaho Power, and Powerex. Staff’s analysis of generation input costs and spot market-clearing prices is largely consistent with the California Parties’ analysis. Based in large part on actual bid data that were submitted to the Cal ISO, Mirant, Williams, Dynegy, and Reliant had patterns of bidding units into the real-time market at or near $750 in May and June 2000, while the same units were bid at below $200 during September, after the Cal ISO cap was lowered to $250. The California Parties allege that these data indicate that the bid prices for these units in May and June exceeded costs by at least $500. The California Parties state that the bid data indicate that Duke submitted bids during the summer of 2000 that were more consistent with actual marginal costs and contrast Duke’s bidding behavior with the other market participants. However, Duke’s bids in the Cal ISO’s real-time market increased dramatically after the Commission’s December 8, 2000 decision to allow sellers with bids over the price cap that were accepted by the Cal ISO to be paid their bid price. The California Parties also argue that this pattern continued during the subsequent period when spot sales were made directly to CERS. The California Parties allege that other sellers in their study demonstrated noncompetitive bidding patterns consisting of bid price spikes and prolonged elevation of bid prices. In particular, they note that the Cal ISO declared a system emergency on 6 different days in June 2000 (June 13, 14, 26, 27, 28, and 29) and that bid price spikes were submitted during these emergencies by Williams, Dynegy, Mirant, Reliant, Powerex, LADWP, Idaho Power, and BPA. Similar results were shown for the 11 days on which the Cal ISO declared system emergencies in May, July, and August 2000. The California Parties also allege that on various days, two or more of these sellers submitted bid price spikes. The following is a summary of the California Parties’ analysis of the various market participants.

Chapter VI
Docket No. PA02-2-000 Price Manipulation in Western Markets VI-49
Reliant The California Parties allege that Reliant submitted pronounced hockey stick bids for four of its units during the May-June period. The average bid spans (the price difference between the lowest-priced bid segment and the highest-priced bid segment) were as high as $186/MWh. An example of bid price spikes occurred between May 22 (the day of the Cal ISO-declared emergency) and May 24. In June, there were bid price spikes on days when the Cal ISO declared emergencies: June 13, 14, 26, 27, 28, and 29, and June 21-22 (Reliant’s withholding period). Reliant’s bids reached the price cap levels of $750, $500, and $250. Mirant The California Parties characterize Mirant’s bidding behavior during the summer of 2000 as persistently high for some of its units and hockey stick bidding for other units. For example, Mirant’s Potrero Units 4, 5, and 6 were bid at or near the price cap in most hours. In other words, the units were bid with a pattern that simply tracked the price caps, i.e., near $750 at first, then near $500, and, starting in August, near $250. According to the California Parties, Mirant increased its bid prices on all or a large number of bid quantities on May 2-5, 15-16, 19-21, 22 (Cal ISO-declared emergency), 23, 28, and 31. The California Parties identify other similar examples and examples of persistent high bidding patterns throughout the summer of 2000. Dynegy The California Parties allege that Dynegy generally bid its combustion turbines into the real-time market at very high prices, especially during June and July 2000. They also allege that during May through July, hockey stick bidding was used with an average bid span (price difference between the lowest-priced bid segment and the highest-priced bid segment) in excess of $300. Examples of high spikes in bid prices occurred on May 4-5, 21-27, and 30-31. Overall, in June, Dynegy submitted very high bid prices for its units. Only 3 of its 22 units bid into the real-time market had an average bid price of below $200, while others averaged close to $700. Other examples of noncompetitive bidding throughout the summer were identified.

Chapter VI
Docket No. PA02-2-000 Price Manipulation in Western Markets VI-50
Williams Overall, the California Parties allege that Williams bid very high prices for all of its units. Also, substantially similar units are bid in different ways that cannot be explained on a cost basis. For example, in May Alamitos Unit 5 was bid at an average price of $668/MWh, whereas Redondo Unit 7 was bid at an average price of $234/MWh. During May 2000, the California Parties allege that Williams’ bid prices spiked on May 1, 3-5, 6, 10, and 21-23 (including during the Cal ISO-declared emergency on May 22). Bid price spikes in June included June 3, 12, 13-14 (Cal ISO-declared emergencies), 20-22, and 26-29 (Cal ISO-declared emergencies). Similarly, during July, bid price spikes were alleged to have occurred on July 7, 13-14, 18, and 26, and during declared emergencies on July 19-20, 24-25, 27, 28, and 31. Enron The California Parties allege that from January to April 2000, Enron bid into the real-time market almost exclusively at the then-prevailing Cal ISO cap of $750. This pattern appears to persist through the summer of 2000 but with more variability. Powerex The California Parties allege that during the Cal ISO-declared emergency on May 22, 2000, Powerex withdrew approximately 1,000 MW of energy that it typically offered to the real-time market, and therefore allegedly played a role in causing this emergency. On other days, Powerex’s bids would vary by 1,500 to 2,000 MW from hour to hour. On June 15, 2000, Powerex submitted large, infeasible schedules over various interfaces into California (over 10,000 MW) into the real-time market for several hours at or near $750. Powerex changed the nature of its bids in the following hour and bid almost 5,000 MW but at negative $750 (meaning that a reduction of generation will cost $750). This pattern was repeated later in the day. On December 12, 2000, following the Commission’s order to institute a soft cap in place of the $250 cap, Powerex increased its bids by approximately $500 to an average of approximately $750, with a number of bids being submitted over $1,100.

Chapter VI
Docket No. PA02-2-000 Price Manipulation in Western Markets VI-51
LADWP According to the California Parties, LADWP employed bidding patterns that removed supply from the real-time market for small periods, and spiked the bid prices on all or a large number of its bid quantity for small periods. For example, on May 21, 2000, the day preceding the Cal ISO-declared emergency, LADWP raised all bids into the real-time market reaching $750/MWh. Then on May 23-24, LADWP’s bid prices dropped to $200/MWh. LADWP submitted bid price spikes on 6 other days that were Cal ISO-declared emergencies (June 14, 27, 28, and 29, and July 24 and 25). The California Parties cite other nonemergency days on which LADWP submitted bid price spikes, again reaching the bid cap. Idaho Power Company According to the California Parties, the bidding strategies of Idaho Power resembled those of LADWP and Powerex. From May to July, the California Parties identified 23 days, including 8 days that are Cal ISO-declared emergencies, on which Idaho Power submitted bid price spikes. Idaho Power’s bids reached the $750, $500, and $250 levels established by the price caps during this period. BPA According to the California Parties, BPA was an active participant in the real-time market through the summer of 2000. Bid price spikes were observed on May 23-25 and 27; June 1-3, 28-29 (Cal ISO-declared emergencies), and 30; and July 1. Starting after the May 22 emergency, BPA submitted bids at the $750, $500, and $250 cap levels during the various price cap periods.
Responses Filed by the In-State Generators and Importers
The in-state generators and importers filed reply comments and rebuttal testimony and exhibits. These entities raise various objections and argue that there was no requirement under the Cal ISO or Cal PX tariffs or protocols or Commission regulations in effect that generators bid at their marginal cost of production. They conclude that the California Parties have failed to demonstrate that any of the bidding practices constitutes withholding. Similarly, there were no restrictions on a seller’s ability to bid high. Mirant states that after the

Chapter VI
Docket No. PA02-2-000 Price Manipulation in Western Markets VI-52
Commission issued the April 26, 2001 Order, it stopped using hockey stick bidding. In response to the California Parties’ allegations of noncompetitive bidding behavior by these entities, they renew arguments previously made in various proceedings before the Commission in an effort to justify their high bids. Their explanations include: (1) the difficulty in determining the marginal cost of a unit, particularly with respect to startup costs; (2) because there is no capacity market in California, using a marginal cost standard is inappropriate; and (3) a marginal cost standard does not recognize market uncertainty, “scarcity rents,” and legitimate opportunity costs during the summer of 2000. Examples of plants with opportunity costs are limited run-time units, including fossil-fuel plants in California that have operating time limits in their air emissions permits or that must acquire scarce emissions credits. The generators maintain that such units should be bid at the price one would expect to receive during the highest-priced period in the future. They also argue that hockey stick bidding is appropriate for the last increment of a unit because it recognizes the risk of a forced outage. In this event, the seller must purchase replacement energy to meet its commitment. They also argue that it is appropriate to hold units in reserve as a physical hedge against the unexpected loss of a unit. Staff finds that these arguments are unpersuasive and do not adequately explain the dramatic rise in prices starting in May 2000. Such high bids and clearing prices far exceed the level needed to recover the capacity costs of generation. Market uncertainty existed prior to and after the summer of 2000, and this does not explain the price spike. The argument regarding opportunity costs is not persuasive because the units were first bid at $750 and then progressively lower through the summer of 2000. Using hockey stick bidding plus a physical hedge as insurance for a possible forced outage appears duplicative. Finally, Staff has explained that the MMIP was part of the Cal ISO’s and Cal PX’s filed rate schedules.
Recommended Commission Responses Staff recommends that the Commission issue an order to LADWP, Dynegy, Mirant, Reliant, Williams, BPA, Powerex, Enron, and Idaho Power directing them to show cause why their behavior during May 2000 through October 2, 2000 does not constitute a violation of the Cal ISO or Cal PX tariffs, with disgorgement of unjust profits associated with the violation or other appropriate remedies. The market participants discussed in this section of the Report displayed bidding patterns that were higher early in the summer (May and June) than in subsequent summer months even though input costs

Chapter VI
Docket No. PA02-2-000 Price Manipulation in Western Markets VI-53
(such as the cost of natural gas) nearly doubled during that same time period. The data suggest that these market participants’ high bidding behavior was not disciplined by their cost inputs; they simply bid the then-existing price cap—riding the cap from $750 to $500 and then to $250. Taking the example of a hypothetical unit with a 15,000 Btu/kWh heat rate, a bid of $250/MWh in September when gas costs were $6/MMBtu would generate $90 for the cost of fuel and $160 as a margin to recover fixed costs, scarcity, etc. A $250 bid in May for the same unit when gas costs were $3.72/MMBtu would generate $56 for the cost of fuel and $194 as a margin to recover fixed costs, scarcity, etc. Conversely, a $750 bid in May would produce a margin of approximately $700. Staff notes that during the summer of 2000, legitimate scarcity costs should have increased from May to September as the California ISO weather-dependent demand increased. Yet, bidding patterns of these generators show that their bids were not directly related to load levels and associated scarcity levels. Staff also notes that the creditworthiness issue did not arise until after the summer period, so credit risk is not valid support for anomalous bids during this period. Similarly, the emission costs rose steadily in 2000 as the year progressed. If suppliers were willing to voluntarily supply at $250 in August and September as cost inputs rose dramatically, their bids above this level earlier in the summer (when cost inputs were far less) are highly questionable. However, Staff believes that there is reasonable support for prices that include a scarcity premium above marginal costs to reflect the severe scarcity that occurred during the summer of 2000. Bids at the $250 level during August and September reflect the supply/demand imbalance in the Western markets, emission restrictions in the California market, and risks involved in pushing older generating units to their operating limits day after day. Given these circumstances, Staff recommends that the Commission investigate all bids over $250 during the period May 1 through October 1, 2000. During the summer of 2000, Staff notes that one large in-state generator (Duke) submitted bids that appear to be more representative of its actual generation input costs. A possible explanation is that during this time period, unlike the other four large in-state generators, Duke was not heavily exposed to the spot market. During this period, Duke had committed a large amount of its generation to forward purchases. While Duke may have benefited during this period, like all other entities that received a clearing price above their bid, this does not constitute a violation of the Cal ISO or Cal PX tariffs. As noted, Duke’s high bids are covered by the refund proceeding.

Chapter VI
Docket No. PA02-2-000 Price Manipulation in Western Markets VI-54
Staff notes that the transactions with the Cal ISO during the October 2, 2000 forward period are already subject to refunds. This appears to be an appropriate remedy for excessively high bidding. The Commission’s June 19, 2001 Order discussed an example of Duke’s high bidding behavior in February 2001. In that order, the Commission noted that Duke had bid $3,880/MWh. Duke maintained that this bid was a negotiating tool to recover payment for prior transactions and that it included a credit premium. The Commission noted that this premium exceeded Duke’s variable costs by an order of magnitude. The Commission found that Duke’s bidding at multiples of its marginal costs in an attempt to recover past-due amounts can in no way be found to be just and reasonable. The entire period in which Duke submitted high bids to the ISO is covered by the refund proceeding. Finally, as for any transactions with CERS, Staff notes that such transactions are not under the Cal ISO tariff and are therefore not subject to the MMIP. The California Parties submitted a comprehensive list of all transactions with CERS in Exhibit No. CA-197. Staff’s review of these data indicates that Duke’s transactions, like most transactions with other parties, were under the Western Systems Power Pool Agreement. Therefore, Staff recommends that Duke not be subject to a show cause order.
Physical Withholding of Generation
During two days in June 2000, certain Reliant employees reduced the quantity of megawatts offered to the Cal PX on a day-ahead basis below the amount that normally would have been offered under the existing market conditions. Specifically, on Monday, June 20, Reliant reduced the capacity it bid into the Cal PX for delivery on June 21 by approximately 1,000 MW. Reliant increased only slightly the amount of capacity it bid into the Cal PX on June 21 for delivery on June 22. Reliant elected to perform discretionary maintenance on generating units whose output otherwise would have been offered to the Cal PX for those days. By order dated January 31, 2003, in Docket No. PA02-2-001, the Commission approved a Stipulation and Consent Agreement (Agreement) between Staff conducting the investigation in this proceeding and Reliant resolving the actions taken on these two days with respect to sales that would have occurred in the Cal PX market. Under the Agreement, Reliant agreed to pay approximately $13.8 million directly to customers of the Cal PX that purchased energy in the Cal PX’s day-ahead market on June 21 and 22. As explained in the

Chapter VI
Docket No. PA02-2-000 Price Manipulation in Western Markets VI-55
order, the payment reflects the worst-case scenario of the maximum effect of Reliant’s withholding on the California market. Since the issuance of this order, various entities have submitted evidence regarding other alleged incidents of physical withholding by various market participants in the California markets. These allegations are not dealt with in this Staff Report. The issue of potential physical withholding is the subject of a separate and ongoing investigation.
Reliant and BP Energy Traders Appear To Have Engaged in Coordinated Efforts To Manipulate Market Prices
In the course of the investigation, Staff uncovered instances of traders from Reliant and BP Energy (BP) apparently coordinating their efforts to manipulate western electricity prices. Specifically, on three occasions a trader from BP contacted a Reliant trader and asked him to buy electricity from an offer he was going to place on an electronic trading platform (Bloomberg). The BP trader would then sell the power back to the Reliant trader at the same price, but the transaction would not take place on the electronic trading platform. On at least one of the occasions, the BP trader is seemingly manipulating the market price (in this case, electricity delivered at Palo Verde, a large trading hub in Arizona) in order to affect the value of his trading position for mark-to-market accounting purposes. The Reliant trader appears to have no particular interest in manipulating the market price; he simply goes along with the BP trader’s scheme. The evidence comes from recorded telephone conversations and transcripts provided to Staff by Reliant under Docket No. PA02-2-000. Staff has evidence that in April 2000, the BP trader contacted the Reliant trader and asked him to do him a favor. The BP trader (1) will offer to sell electricity on the Bloomberg electronic platform, (2) the Reliant trader will buy at the posted price, and (3) the BP trader will buy back the power (off the exchange) at the same price to negate the deal. The BP trader goes on to explain that he is trying to move the market price to $43.10 but no one will buy it at that price, so he needs the Reliant trader to “lift his offer” in order to increase the price. Our evidence indicates that several days later, the same BP trader contacted the same Reliant trader and offered him a similar proposal. Again, the BP trader is trying to manipulate the price in order to

Chapter VI
Docket No. PA02-2-000 Price Manipulation in Western Markets VI-56
increase the value of his trading position under the company’s mark-to-market accounting.
The BP trader goes on to explain that they are marking their books on the October Palo Verde price. He notes that power for delivery in October at Palo Verde had traded as high as $44. He wants to move the price even higher because of his long position. He indicates that he will post an offer to sell at $44.15 and asks the Reliant trader to lift that offer and then he will buy it back from him at the same price. The BP trader then posts the offer on Bloomberg. Later that day, the BP trader instructs the Reliant trader to lift the offer because he senses the market beginning to move. The Reliant trader lifts the offer and asks the BP trader what they should do next. The evidence indicates that the BP trader informed the Reliant trader that he will buy the power back at the same price. Significantly, when Staff asked BP for information and telephone transcripts of these events, BP simply stated that it had no information regarding the activity of its trader. One of the concerns regarding the apparent price manipulation described above is that it occurred at an important trading hub (Palo Verde) that was presumed to be very liquid and thus not subject to price manipulation. Electricity price indices are a critical part of the market price formation process, and this market was clearly being manipulated. Therefore, Staff recommends that the Commission initiate proceedings to revoke Reliant’s and BP’s ability to sell power at market-based rates.
Spot Prices in the Pacific Northwest—Docket No. EL01-10-000, et al.
The proceeding in Docket No. EL01-10-000, et al. was established to “facilitate development of a factual record on whether there may have been unjust and unreasonable charges for spot market bilateral sales in the Pacific Northwest” for the period December 25, 2000 through June 20, 2001. On September 24, 2001, the presiding Administrative Law Judge (ALJ) issued her proposed findings of fact and recommendations. The ALJ found that while California spot electricity prices affected electricity prices in the Pacific Northwest, prices in the region were driven up by a combination of factors, including reduced hydro generation due to the drought, increased demand, and relatively high

Chapter VI
Docket No. PA02-2-000 Price Manipulation in Western Markets VI-57
natural gas prices. In essence, the ALJ concluded that the record did not support allegations of market manipulation. In numerous orders, the Commission has stated that the spot markets in the West are integrated. Staff’s Final Report concludes that the California spot electricity markets were manipulated. This chapter explains that a variety of strategies were used by Enron and various market participants in an effort to manipulate various market outcomes in California. The manipulations used a variety of techniques, including submitting false information, creating false transmission congestion, and importing and exporting power into and out of California. All of these manipulations may have affected spot prices in the Pacific Northwest. During the course of its investigation, Staff sent a blanket data request to all sellers of electricity in the West for specific transaction data, including actual monthly sales data for bilateral transactions at the Mid-Columbia (Mid-C) trading hub and the California-Oregon Border (COB) trading hub. These are the two primary trading locations in the Pacific Northwest for bilateral electric sales and purchases. These transaction data indicate that, especially during the refund period (January 2001 to June 2001), there was a significant increase in spot prices in the Pacific Northwest similar to the rise in spot prices in California. Because there are no single clearing price markets in the Pacific Northwest, Staff has used bilateral sales of 1 month or less that are entered into no more than 1 month in advance of delivery for spot transactions. Staff has calculated average monthly implied heat rates based on the cost of gas at Malin and Sumas (the two main gas hubs that correspond to power delivered at Mid-C and COB). To perform this calculation, Staff divided the average cost of spot sales (approximately 650 transactions) by the average monthly cost of gas. Table VI-2 illustrates Staff’s results.
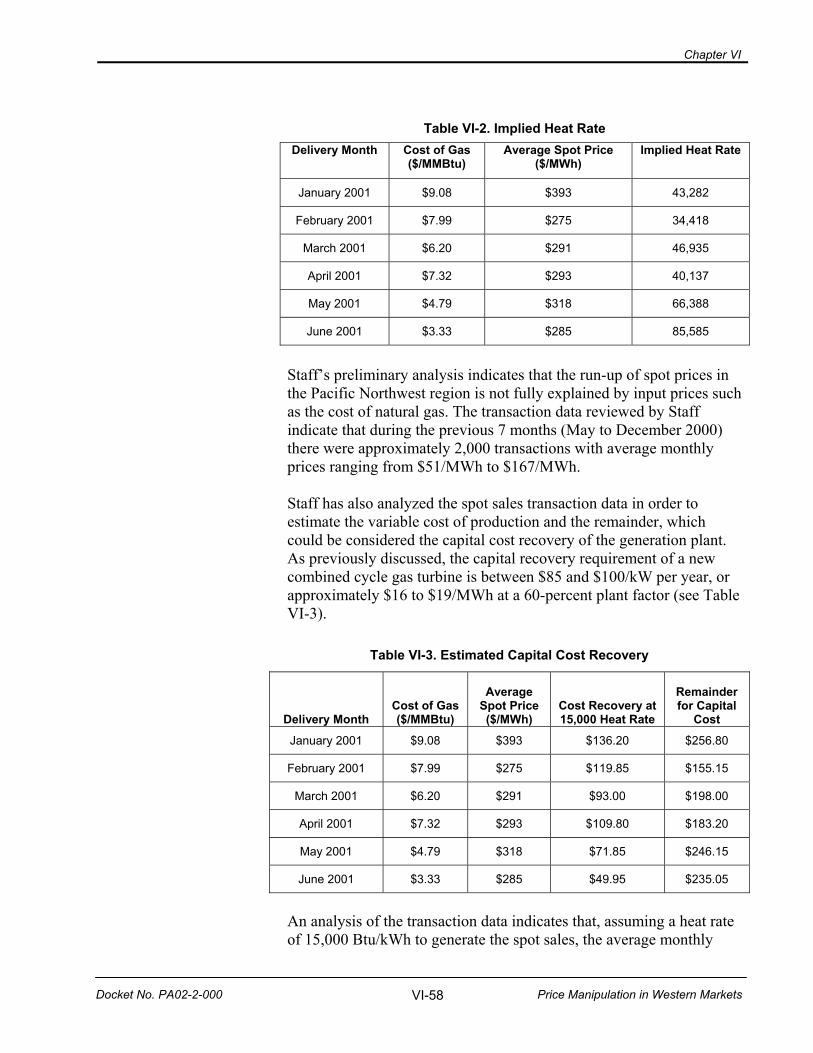
Chapter VI
Docket No. PA02-2-000 Price Manipulation in Western Markets VI-58
Table VI-2. Implied Heat Rate
Delivery Month Cost of Gas ($/MMBtu)
Average Spot Price ($/MWh)
Implied Heat Rate
January 2001 $9.08 $393 43,282
February 2001 $7.99 $275 34,418
March 2001 $6.20 $291 46,935
April 2001 $7.32 $293 40,137
May 2001 $4.79 $318 66,388
June 2001 $3.33 $285 85,585
Staff’s preliminary analysis indicates that the run-up of spot prices in the Pacific Northwest region is not fully explained by input prices such as the cost of natural gas. The transaction data reviewed by Staff indicate that during the previous 7 months (May to December 2000) there were approximately 2,000 transactions with average monthly prices ranging from $51/MWh to $167/MWh. Staff has also analyzed the spot sales transaction data in order to estimate the variable cost of production and the remainder, which could be considered the capital cost recovery of the generation plant. As previously discussed, the capital recovery requirement of a new combined cycle gas turbine is between $85 and $100/kW per year, or approximately $16 to $19/MWh at a 60-percent plant factor (see Table VI-3).
Table VI-3. Estimated Capital Cost Recovery
Delivery Month Cost of Gas ($/MMBtu)
Average Spot Price ($/MWh)
Cost Recovery at 15,000 Heat Rate
Remainder for Capital
Cost January 2001 $9.08 $393 $136.20 $256.80
February 2001 $7.99 $275 $119.85 $155.15
March 2001 $6.20 $291 $93.00 $198.00
April 2001 $7.32 $293 $109.80 $183.20
May 2001 $4.79 $318 $71.85 $246.15
June 2001 $3.33 $285 $49.95 $235.05
An analysis of the transaction data indicates that, assuming a heat rate of 15,000 Btu/kWh to generate the spot sales, the average monthly
Chapter VI
Docket No. PA02-2-000 Price Manipulation in Western Markets VI-59
sales prices recover the cost of gas and the remainder (the last column of the table) would far exceed the capital costs needed for the plant.
Recommended Commission Responses Based on Staff’s preliminary analysis, Staff recommends that the Commission remand this proceeding back to the ALJ in order to consider the additional evidence received after her initial findings.

Chapter VII
Docket No. PA02-2-000 Price Manipulation in Western Markets VII-1
VII. Wash Trading on EnronOnline
Several energy trading companies, including CMS Energy, Dynegy, Williams, and Reliant, have admitted publicly to engaging in “wash trades.” As a result of our analysis of EnronOnline (EOL) data, Staff, with assistance from Hendrik Bessembinder, Blaine Huntsman Chair in Finance, Eccles Business School, University of Utah, has also identified Enron and others as participants in wash trading activities. In fact, Enron’s use of its EOL platform created a fertile ground for wash trading that resulted in multiple forms of manipulation in energy markets. The term “wash trade” is generally defined as a prearranged pair of trades of the same good between the same parties, involving no economic risk and no net change in beneficial ownership. These trades expose the parties to no monetary risk and serve no legitimate business purpose. Potential motives for wash trading are numerous. Wash trades might be used to create the illusion that a market is liquid and active, or to increase reported trading revenue figures. Wash trades might be arranged at prices that diverge from the prevailing market in an attempt to send false signals to other market participants. Alternatively, the intent might be to affect the average or index price reported for a market, which in turn could benefit a derivatives position or affect the magnitude of payments on a contract linked to the index price. In general, wash trading is viewed as damaging to the integrity of a market and has the potential to mislead a host of market stakeholders (including competitors, regulators, analysts, and investors) through the various forms of manipulation outlined above. Although the Commission has no regulations on wash trading, wash trades are prohibited in markets regulated by the Commodity Futures Trading Commission. This chapter provides statistical evidence indicating that wash trading in energy products was more common than previously recognized.
Wash Trading on EnronOnline
The statistical portion of this chapter describes wash trades in natural gas and electricity products on the EOL trading platform from January 2000 to November 2001. This study focuses on EOL trades in which both the buy and sell transactions were recorded in a single database. It seems likely, though, that market participants who intend to use wash

Chapter VII
Docket No. PA02-2-000 Price Manipulation in Western Markets VII-2
trades for illegitimate purposes would be inclined to use methods that did not create a single electronic record of both transactions. The alternatives might include direct bilateral negotiation of both trades by telephone, or completion of one leg by telephone or an alternate electronic platform while completing the other leg on EOL. Our definition of wash trading considers trades that occurred within the same product, at the same price, in the same volume, and at nearly the same time (within 2 minutes of one another). It should be recognized that a company might enter an offsetting pair of trades on EOL for legitimate business purposes. For example, a company anticipating unseasonably warm weather might purchase a quantity of power, only to resell it later as actual weather conditions are milder. Therefore, it is possible that this report includes some “false positives”—paired trades that appear to be inappropriate wash trades but were not. However, given the facts in the specific examples of wash trading described herein, we believe the manipulative nature of these examples is obvious.
Choice Markets EOL market makers are traders assigned to always quote both a bid price and an offer price, representing Enron’s willingness to always buy or sell gas during market hours. Our data analysis and interviews with market makers indicate that they sometimes elected to set the bid-offer spread to zero, which they referred to as making a “choice market.” Choice markets may, in effect, have been an invitation to EOL customers to engage in wash trading. The raw data used in our analysis do not include bid and ask quotes, so it is not possible to directly identify periods of choice (zero spread) markets. However, Staff identified all sequences of trades that occurred during likely choice markets based on the following criteria: (1) all trades in the sequence occurred at identical prices, (2) at least one trade in the sequence was an EOL buy and at least one was an EOL sell, (3) the sequence contained at least four trades, and (4) all trades in the sequence are for the same product at the same volume. Tables VII-1 and VII-2 provide information about EOL trading activity during choice market periods. Table VII-1 reports activity by calendar month, revealing that choice market trading on EOL increased steadily over time. In fact, 45 percent of all choice market trading in gas products and 54 percent of all choice market trading in electricity markets occurred during the last 3 months (September to November 2001) of the 21-month sample. These 3 months coincide with the period of time leading up to Enron’s filing for bankruptcy.

Chapter VII
Docket No. PA02-2-000 Price Manipulation in Western Markets VII-3
The reasons for this upward trend in choice market trading activity are unclear; however, it may have been an attempt to prop up or otherwise maintain Enron’s presence in the market.
Table VII-1. Trades Completed During Choice Markets, by Month
Gas Trades Power Trades
Year Month Choice Trades
Percent of Total Year Month
Choice Trades
Percent of Total
2000 1 749 1.4 2000 1 82 0.5 2000 2 1024 1.9 2000 2 134 0.8 2000 3 1835 3.4 2000 3 195 1.2 2000 4 958 1.8 2000 4 101 0.6 2000 5 887 1.7 2000 5 41 0.2 2000 6 776 1.5 2000 6 23 0.1 2000 7 754 1.4 2000 7 102 0.6 2000 8 1209 2.3 2000 8 222 1.3 2000 9 1046 2.0 2000 9 268 1.6 2000 10 1126 2.1 2000 10 513 3.1 2000 11 1256 2.4 2000 11 165 1.0 2000 12 707 1.3 2000 12 36 0.2 2001 1 1218 2.3 2001 1 344 2.1 2001 2 1314 2.5 2001 2 378 2.3 2001 3 2844 5.3 2001 3 536 3.2 2001 4 1656 3.1 2001 4 412 2.5 2001 5 2015 3.8 2001 5 452 2.7 2001 6 2117 4.0 2001 6 614 3.7 2001 7 2129 4.0 2001 7 1129 6.7 2001 8 3721 7.0 2001 8 1894 11.3 2001 9 6859 12.8 2001 9 2366 14.1 2001 10 10511 19.7 2001 10 4534 27.0 2001 11 6734 12.6 2001 11 2231 13.3 Total 53,445 Total 16,772
Choice market trades were identified as a sequence of at least four consecutive trades at the same price, with at least one buy and one sell included in the sequence. The table reports the number of EOL gas and power trades completed during choice markets, by trading month, from January 2000 to November 2001.
Table VII-2 reports the number of choice market trades completed by several individual Enron market makers. Our analysis indicates that certain market makers created choice markets rather frequently. In gas products, 19,564 choice market trades (36.6 percent of the total) were executed by a single EOL market maker, and 6,285 choice market trades (11.8 percent of the total) were executed by a second EOL market maker. In power products, the most choice market trades executed by any single EOL market maker was 1,814, which was 10.8 percent of the total choice market trades. It is important to note that the total gas trades in choice markets exceed the power trades by greater than 3 to 1. This could be explained by the greater volume of gas trading that occurred on EOL as compared to power trading.

Chapter VII
Docket No. PA02-2-000 Price Manipulation in Western Markets VII-4
Wash Trades Within Choice Markets
Using the choice market data shown above, Staff identified all wash trade pairs that occurred within these choice market events based on the additional criteria that both legs of potential wash trades involved the same counterparty and occurred within 2 minutes of each other. Since these trades occurred during choice markets, the previously mentioned criteria that these trades involve the same product, same price, and same volume also apply. By focusing only on wash trades that occurred within choice markets and within a sequence of at least four trades, we significantly limited the total number of wash trades identified. For example, a deliberate wash trade that included only a single pair of trades between two divergently priced transactions would not have met our criteria for a choice market nor, consequently, for a wash trade. However, by focusing on wash trades that occur within choice markets and within a sequence of four or more trades, we significantly increase the likelihood that the trades we select are indeed wash trades—a single pair of trades not part of a sequence of four or more trades would not be considered. Tables VII-3 through VII-8 provide information about wash trades completed during periods of choice markets. It is important to note that each wash trade represents a matching pair of trades. Therefore, for a
Table VII-2. Trades Executed During Choice Markets, by Trader
Gas Trades Power Trades
Enron Trader Total Trades During
Choice Markets Enron Trader Total Trades During
Choice Markets Trader A 19,564 Trader K 1814 Trader B 6285 Trader L 1373 Trader C 2567 Trader M 1219 Trader D 2431 Trader N 1159 Trader E 2382 Trader O 1008 Trader F 1710 Trader P 934 Trader G 1608 Trader Q 861 Trader H 1127 Trader R 834 Trader I 884 Trader S 731 Trader J 823 Trader T 612
All Traders 53,445 All Traders 16,772
The table reports the top 10 Enron gas and electricity traders in terms of the total trades executed during choice markets between January 2000 and November 2001.

Chapter VII
Docket No. PA02-2-000 Price Manipulation in Western Markets VII-5
trader to complete 10 wash trades, he would actually need to execute 20 trades (10 buys and 10 sells). These trade pairs all involved the same counterparty, the same quantity, and the same product, and occurred within 2 minutes of each other. Also, since they occurred during a period of choice markets as previously defined, each leg of the wash trade as well as any intervening trades occurred at a common price. The fact that these trades occurred during choice markets makes it likely that they were intended to inflate reported trading volumes and/or influence market indices. Table VII-3 reports the number of wash trades by month. In general, these data reveal a trend in which more wash trades occurred later in time. Only 5 percent of gas wash trades and 1 percent of power wash trades occurred during the first 4 months (January to April 2000) examined, while 42 percent of gas wash trades and 46 percent of power wash trades occurred during the last 4 months (August to November 2001) examined. An exception is the month of October 2000 (highlighted in bold), when 27.5 percent of power wash trades occurred.1
1This cluster of wash trading is linked to a previously noted promotional campaign in which a big screen television was awarded as a prize to the counterparty that generated the most trading activity. See “Initial Report on Company-Specific Separate Proceedings and Generic Reevaluations: Published Natural Gas Price Data and Enron Trading Strategies,” Federal Energy Regulatory Commission Staff Report, August 2002, p. 54.

Chapter VII
Docket No. PA02-2-000 Price Manipulation in Western Markets VII-6
Table VII-3. Wash Trades Completed During Choice Markets, by Month
Gas Trades Power Trades
Year Month Wash
Trades Percent of Total Year Month
Wash Trades
Percent of Total
2000 1 1 0.3 2000 1 0 0.0 2000 2 4 1.1 2000 2 3 0.8 2000 3 6 1.6 2000 3 1 0.3 2000 4 8 2.1 2000 4 1 0.3 2000 5 3 0.8 2000 5 0 0.0 2000 6 2 0.5 2000 6 0 0.0 2000 7 1 0.3 2000 7 11 2.8 2000 8 11 2.9 2000 8 10 2.6 2000 9 8 2.1 2000 9 5 1.3 2000 10 5 1.3 2000 10 106 27.5 2000 11 11 2.9 2000 11 0 0.0 2000 12 19 5.0 2000 12 1 0.3 2001 1 6 1.6 2001 1 5 1.3 2001 2 13 3.4 2001 2 5 1.3 2001 3 38 10.1 2001 3 13 3.4 2001 4 13 3.4 2001 4 6 1.6 2001 5 15 4.0 2001 5 8 2.1 2001 6 29 7.7 2001 6 12 3.1 2001 7 25 6.6 2001 7 23 6.0 2001 8 35 9.3 2001 8 42 10.9 2001 9 42 11.1 2001 9 46 11.9 2001 10 50 13.2 2001 10 49 12.7 2001 11 33 8.7 2001 11 39 10.1 Total 378 Total 386
The table reports the number of wash EOL gas and power trades completed during choice markets, by trading month, from January 2000 to November 2001.

Chapter VII
Docket No. PA02-2-000 Price Manipulation in Western Markets VII-7
Table VII-4 reports the EOL market makers involved in the most wash trades. In gas products, 1 trader executed 111 wash trades (29.4 percent of the total) and a second trader executed 73 wash trades (19.3 percent of the total). In power markets, 1 EOL market maker executed 102 wash trades (26.4 percent of the total), a second market maker executed 36 wash trades (9.3 percent of the total), and a third completed 32 wash trades (8.3 percent of the total). The fact that an individual trader would be linked to more than 25 percent of all wash trades in a product is significant evidence that wash trading on EOL was not simply a coincidence or a random occurrence.
Table VII-5 reports the counterparties who engaged in the largest numbers of EOL wash trades. In gas products, Entergy-Koch Trading, LP completed 61 wash trades (16.1 percent of the total). In power products, Aquila Energy Marketing Corporation completed 112 wash trades (29 percent of the total). Again, the high percentage of involvement in wash transactions is significant evidence that certain EOL counterparties regularly and knowingly participated in wash trades.
Table VII-4. Wash Trades Completed During Choice Markets, by Trader
Gas Trades Power Trades
Enron Trader
Total Wash Trades During Choice
Markets Percent of Total Enron Trader
Total Wash Trades During Choice
Markets Percent of Total
Trader A 111 29.4 Trader K 102 26.4 Trader B 73 19.3 Trader L 36 9.3 Trader C 24 6.3 Trader M 32 8.3 Trader D 16 4.2 Trader N 16 4.1 Trader E 13 3.4 Trader O 15 3.9 Trader F 11 2.9 Trader P 13 3.4 Trader G 11 2.9 Trader Q 12 3.1 Trader H 10 2.6 Trader R 12 3.1 Trader I 10 2.6 Trader S 11 2.8 Trader J 9 2.4 Trader T 10 2.6
All Traders 378 All Traders 386
The table reports the numbers of wash trades during choice markets between January 2000 and November 2001 for the 10 most frequent Enron traders.

Chapter VII
Docket No. PA02-2-000 Price Manipulation in Western Markets VII-8
Table VII-6 reports delivery locations for wash trades. Some (34 percent of gas and 17 percent of power) wash trades were for financial products without physical delivery locations. Henry Hub was by far the most common delivery point for gas wash trades (31 percent of the total), while Mid-Columbia (24 percent), Cinergy (17 percent), and the California-Oregon Border (14 percent) were the most frequent delivery points for power wash trades.
Table VII-5. Wash Trades Completed During Choice Markets, by Counterparty
Gas Trades Power Trades
Counterparty
Total Wash Trades During
Choice MarketsPercent of Total Counterparty
Total Wash Trades During
Choice MarketsPercent of Total
Entergy-Koch Trading, LP 61 16.1 Aquila Energy Marketing Corporation 112 29.0
Reliant Energy Services, Inc. 25 6.6
Williams Energy Marketing & Trading Comp 27 7.0
Cook Inlet Energy Supply L.L.C. 22 5.8
Idaho Power Company, dba IDACORP Energy 25 6.5
AEP Energy Services, Inc. 21 5.6 Cinergy Services, Inc. 13 3.4 MidAmerican Energy Company 21 5.6
American Electric Power Service Corporat 9 2.3
Mieco Inc. 19 5.0 Dynegy UK Limited 9 2.3 PG&E Energy Trading-Gas Corporation 15 4.0
EPMI Short Term New England (Enron Affiliate) 9 2.3
Coral Energy Holding, L.P. 11 2.9 El Paso Merchant Energy, L.P. 8 2.1
Aquila Energy Marketing Corporation 9 2.4 IDACORP Energy L.P. 8 2.1 Other Companies 174 46.0 Other Companies 166 43.0 Total 378 Total 386
The table reports the top Enron counterparties in terms of the total wash trades completed during choice markets between January 2000 and November 2001.

Chapter VII
Docket No. PA02-2-000 Price Manipulation in Western Markets VII-9
Table VII-7 reports the individual trading days with the most wash trades in a single product and involving a single counterparty. The heaviest wash trading of gas products occurred on March 26, 2001, when Entergy-Koch Trading, LP completed 12 pairs of wash trades in the next-day contract for physical delivery at Henry Hub. The details of this series of wash trades are provided as an example in Table VII-8, which focuses on a series of 24 trades that occurred in a 5-minute interval on March 26, 2001. With respect to this occurrence, it is interesting that no counterparty other than Entergy-Koch Trading, LP completed any transactions in this EOL product within ±30 minutes of the wash trades. It is difficult to identify any legitimate business reason why Entergy-Koch Trading, LP would need to complete 12 buys and 12 offsetting sells in the same gas product in a period of less than 10 minutes, especially when no other company made any EOL trades in this product and the price remained unchanged. Our analysis also revealed that the trades were executed by three separate Entergy-Koch Trading, LP traders. One of the three Entergy-Koch Trading, LP traders always acted as the buyer or seller in every pair of wash trades, but never completed both sides of the transaction. The other two traders took turns completing the opposite side of each wash transaction. This suggests that the first trader may have recruited other
Table VII-6. Wash Trades Completed During Choice Markets, by Delivery Location
Gas Trades Power Trades
Location Wash Trades at Location
Percent at Location Location
Wash Trades at Location
Percent at Location
Financial 129 34.1 Mid Columbia 92 23.8 HHub 118 31.2 Financial 66 17.1 NGPL NICOR 24 6.3 Cinergy 54 14.0
SoCal Topock EPNG 20 5.3
COB North/South 49 12.7
NBP 11 2.9 Palo Verde 30 7.8 Opal 10 2.6 German Grid 23 6.0
ANR SE Transmission 8 2.1
PJM Western Hub 18 4.7
NIT - AECO 8 2.1 Entergy 13 3.4
NNG Demarc 8 2.1 NEPOOL-PTF Power (3/1/00) 11 2.8
EPNG Keystone Pool 6 1.6 NBP Trans Inc 10 2.6
Other Locations 39 9.5
Other Locations 20 5.2
Total 378 Total 386
The table reports the 10 most common delivery locations for EOL gas and electricity wash trades completed during choice markets between January 2000 and November 2001. The label “Financial” is used for any wash trades in which a delivery point was not specified.

Chapter VII
Docket No. PA02-2-000 Price Manipulation in Western Markets VII-10
Entergy-Koch Trading, LP traders to participate in these wash trades in an effort to avoid detection. Finally, it is interesting to note that every wash trade pair occurred within 5 seconds of each other, while two pairs actually occurred simultaneously. The coordinated nature of the transactions leaves no doubt as to the prearranged nature of these wash trades. Table VII-7. Days in Which Individual Counterparties Conducted the Most
Wash Trades During Choice Markets
Gas Trades
Counterparty Wash Trade
Pairs Date Product
Entergy-Koch Trading, LP 12 26-Mar-01 US Gas Phy HeHub 28Mar01
Entergy-Koch Trading, LP 7 24-Aug-01 US Gas Phy HeHub 25-27Aug01
ENA - IM West 4 30-Aug-00
US Gas Phy Index IF EP Perm Nov00-Mar01
Reliant Energy Services, Inc. 4 7-Dec-00 US Gas Phy EPNG SoCal Topk 08Dec00
Reliant Energy Services, Inc. 4 8-Dec-00
US Gas Phy EPNG SoCal Topk 09-11Dec00
Calpine Energy Services, L.P. 3 27-Sep-01 US Gas Swap Nymex Jan-Dec02
Coral Energy Holding, L.P. 3 5-Oct-01 US Gas Swap Nymex Nov01
Entergy-Koch Trading, LP 3 20-Jul-01 US Gas Phy HeHub 21-23Jul01
Entergy-Koch Trading, LP 3 27-Jul-01 US Gas Phy HeHub 28-30Jul01
Entergy-Koch Trading, LP 3 5-Sep-01 US Gas Phy HeHub 06Sep01
Power Trades
Counterparty Wash Trade
Pairs Date Product Aquila Energy Marketing Corporation 48 6-Oct-00
US Pwr Phy Firm Mid-C Peak Dec00
Aquila Energy Marketing Corporation 45 6-Oct-00
US Pwr Phy Firm COB N/S Peak Nov00
Dynegy UK Limited 4 14-Aug-01 US Pwr Phy Firm Mid-C Peak 15Aug01
Idaho Power Company, dba IDACORP Energy 3 28-Jul-00
US Pwr Phy Firm PALVE Peak Oct00
Idaho Power Company, dba IDACORP Energy 3 6-Nov-01
US Pwr Fin Swap ISO NE HE11-23 EPT 06Nov01
The table reports the days with the most frequent wash trading with a single counterparty and in a single product.
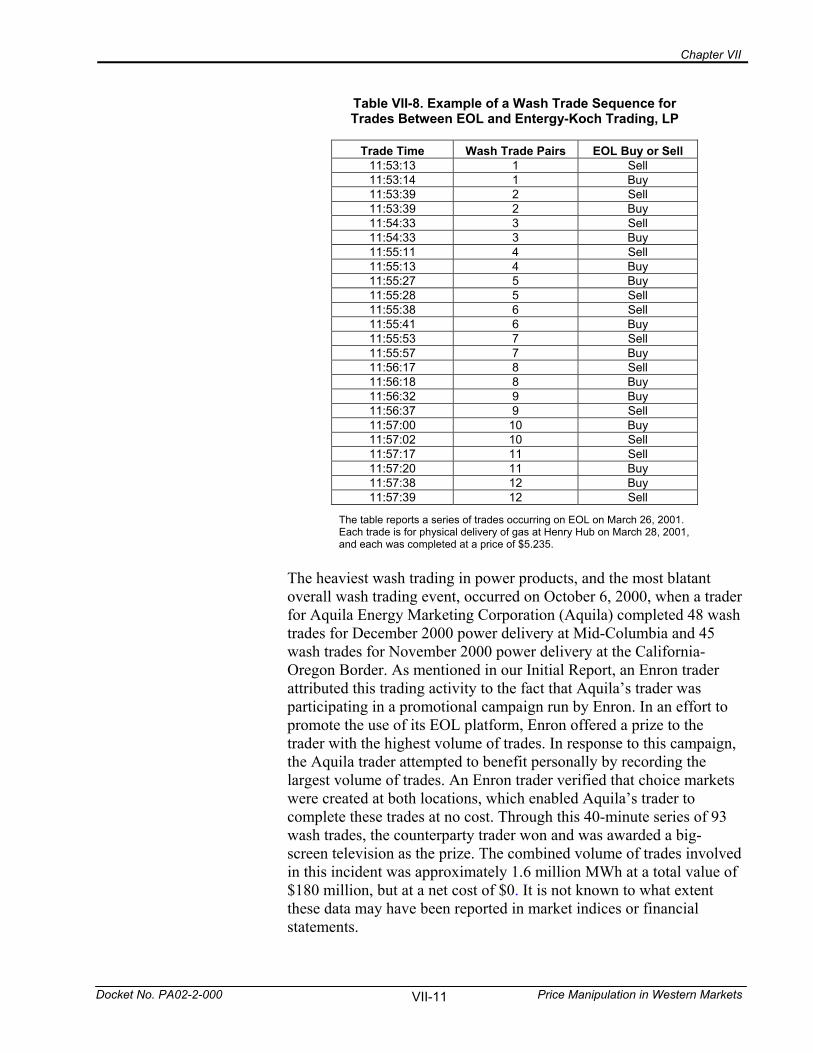
Chapter VII
Docket No. PA02-2-000 Price Manipulation in Western Markets VII-11
Table VII-8. Example of a Wash Trade Sequence for Trades Between EOL and Entergy-Koch Trading, LP
Trade Time Wash Trade Pairs EOL Buy or Sell
11:53:13 1 Sell 11:53:14 1 Buy 11:53:39 2 Sell 11:53:39 2 Buy 11:54:33 3 Sell 11:54:33 3 Buy 11:55:11 4 Sell 11:55:13 4 Buy 11:55:27 5 Buy 11:55:28 5 Sell 11:55:38 6 Sell 11:55:41 6 Buy 11:55:53 7 Sell 11:55:57 7 Buy 11:56:17 8 Sell 11:56:18 8 Buy 11:56:32 9 Buy 11:56:37 9 Sell 11:57:00 10 Buy 11:57:02 10 Sell 11:57:17 11 Sell 11:57:20 11 Buy 11:57:38 12 Buy 11:57:39 12 Sell
The table reports a series of trades occurring on EOL on March 26, 2001. Each trade is for physical delivery of gas at Henry Hub on March 28, 2001, and each was completed at a price of $5.235.
The heaviest wash trading in power products, and the most blatant overall wash trading event, occurred on October 6, 2000, when a trader for Aquila Energy Marketing Corporation (Aquila) completed 48 wash trades for December 2000 power delivery at Mid-Columbia and 45 wash trades for November 2000 power delivery at the California- Oregon Border. As mentioned in our Initial Report, an Enron trader attributed this trading activity to the fact that Aquila’s trader was participating in a promotional campaign run by Enron. In an effort to promote the use of its EOL platform, Enron offered a prize to the trader with the highest volume of trades. In response to this campaign, the Aquila trader attempted to benefit personally by recording the largest volume of trades. An Enron trader verified that choice markets were created at both locations, which enabled Aquila’s trader to complete these trades at no cost. Through this 40-minute series of 93 wash trades, the counterparty trader won and was awarded a big-screen television as the prize. The combined volume of trades involved in this incident was approximately 1.6 million MWh at a total value of $180 million, but at a net cost of $0. It is not known to what extent these data may have been reported in market indices or financial statements.

Chapter VII
Docket No. PA02-2-000 Price Manipulation in Western Markets VII-12
The above transactions by Entergy-Koch Trading, LP and Aquila both appear to have occurred at or near prevailing market prices. However, even a few wash trades at any price other than the average index price could have a substantial, manipulative effect on prices because the index would be skewed in the direction of the wash trades. The impact would be even more profound if the trades occurred at an illiquid location or if a larger number of wash trades occurred. In addition, creating the illusion of liquidity could distort markets, increase prices, and hurt customers.
Affiliate Price Manipulation In many contexts, the definition of a wash trade has been limited to pairs of trades occurring simultaneously and at exactly the same price. Despite the occasional existence of choice markets, the EOL platform is normally characterized by a positive bid-ask spread, in which the ask (or offer) quote exceeds the bid quote. In this case, simultaneous buy and sell orders would be completed at slightly different prices. In order to determine the frequency of divergently priced wash trades, Staff analyzed data based on the criteria that both legs of the wash trade involved the same product, the same volume, and the same counterparty and occurred within 2 minutes of each other; however, Staff did not require prices to be identical or to occur during a choice market. Staff’s analysis identified numerous apparent wash trades at divergent prices between Enron and other nonaffiliated companies, but we were most concerned with trades that occurred between Enron and its affiliates. In fact, as the owner of EOL, Enron had the ability to act as both buyer and seller on a given transaction and use a series of buys and sells with a net cost of zero to manipulate the market. As part of our analysis, Staff identified suspicious trading activity for off-peak delivery of power at Palo Verde for the month of January 2002 (see Table VII-9). All trades in this sequence involved EPMI Long Term Southwest (an Enron affiliate) trading on EOL and occurred on August 14, 2001, over a 5-minute period. At 16:59:49 EPMI sold on EOL at a price of $18. Four seconds later EPMI purchased on EOL at a price of $40. At 17:02:22 EPMI sold on EOL at a price of $15, before purchasing 3 seconds later at a price of $25. Thirty-three seconds later EPMI sold on EOL at $25, and 13 seconds after that EPMI purchased on EOL at $15. At 17:03:46 EPMI sold at $40, and at 17:04:30 the sequence was completed with EPMI purchasing on EOL at $18. Note that the entire sequence of trades examined here is zero-sum. Therefore, collectively, these trades “washed.” The average price of the sequence was $24.50.

Chapter VII
Docket No. PA02-2-000 Price Manipulation in Western Markets VII-13
Possible reasons for entering into these trades would be to give the impression of volatility or to affect average prices reported through market indices. In either event, affiliate trades completed at prices different from the true market would involve no net gain or loss to Enron as a whole. Under no circumstances can we comprehend any legitimate business reason to enter into such a string of transactions. The fact that these trades have a zero-sum gain to both parties also demonstrates how the price (or volume) of a transaction could be varied to make a wash trading effort less obvious, which may have been the case in this instance. Based on our analysis, we conclude that this activity was for no other reason than as a self-serving experiment to create volatility and manipulate industry data.
Table VII-9. Affiliate Trading Between EOL and Enron Affiliate EPMI Long Term Southwest
Time Wash Trade Pairs EOL Buy EOL Sell
16:59:49 1 $18 16:59:53 1 $40 17:02:22 2 $15 17:02:25 2 $25 17:02:58 3 $25 17:03:11 3 $15 17:03:46 4 $40 17:04:30 4 $18
Average Price $24.50 $24.50
The table reports August 14, 2001 power trades for off-peak physical delivery of power at Palo Verde during January 2002.
One-to-Many Versus Many-to-Many Trading Platforms
The design of EOL alone greatly lends itself to trading abuses and gave Enron unprecedented influence over energy markets. Using choice markets, wash trading, and other strategies, EOL’s one-to-many trading platform (in which EOL was the counterparty on every trade) enabled Enron to send false signals, including volume and pricing, to the marketplace. Because the platform was operated entirely under Enron’s discretion, Enron was able to present or influence the market in any way it wished. Specifically, Enron used its wash trading activities to deceive EOL users by giving the impression of a much deeper and more developed market, thus increasing the industry’s faith in EOL. Overall, these false signals increased Enron’s ability to unilaterally manipulate industry data and price indices under EOL’s guise as a legitimate exchange measuring real market activity. On the other hand, exchanges designed using a many-to-many platform better reflect legitimate bargaining between a willing buyer

Chapter VII
Docket No. PA02-2-000 Price Manipulation in Western Markets VII-14
and seller and have the transparency necessary to instill confidence in the market. Staff believes the industry has already recognized the inherent advantages of many-to-many platforms over one-to-many platforms, resulting in the IntercontinentalExchange (ICE) becoming an industry leader. However, even these platforms are not immune to manipulation. In Chapter IX, Staff identifies circumstances on many-to-many platforms in which companies use the creditworthiness of counterparties to restrict trading activity to a single counterparty only. This enables two counterparties to complete prearranged wash trades over a many-to-many platform because only the counterparty they designate as having a sufficient level of credit would have the ability to qualify as an acceptable counterparty and complete the trade at the specific bid or offer price.
Summary and Conclusions Regarding Wash Trades on EnronOnline
The Trade Press has reported that, like a casino, Enron had the “house” advantage by trading on EOL in energy markets. Based on our analysis of the archived EOL database, Staff concludes that this is a flawed analogy. For example, a card game in a casino has set rules and all players can clearly see who they are competing against. On EOL, Enron had access to trading histories, limit orders, and volumes of trades, and therefore understood the liquidity of the market. In contrast, an unaffiliated trader on EOL was only able to see the activity that was posted electronically on the EOL screen. More significantly, when bid and ask prices were changed, the trader was unable to know if it was due to a legitimate trade or if prices were being manipulated. Unlike a casino game, this lack of transparency prevented the trader from knowing with whom he was competing. Moreover, because the EOL platform was wholly controlled by Enron, there were no fixed rules. The EOL operator had an infinite ability to manipulate what was posted in any of the ways described above. Simply put, the use of EOL enabled Enron to post any price it wanted. Staff concludes that wash trading was commonplace on the EOL trading platform between January 2000 and November 2001, and was more prevalent in the later months of this period. The wash trades considered here were identified by statistical criteria. Although it is unlikely that every pair of trades identified here meets the criteria of being prearranged and involving no economic risk, the overall evidence (including the use of choice markets, the volume of actual and apparent wash trades, and the existence of affiliate wash trades) supports the conclusion that trading abuses and market manipulation occurred on EOL.
Chapter VII
Docket No. PA02-2-000 Price Manipulation in Western Markets VII-15
The Enron market maker may have taken positions that favored higher or lower prices. As such, we do not know whether the wash trades pushed gas or electric prices higher or lower.
Recommendations
Staff recommends that future trading platforms be designed to provide a sufficient level of transparency to enable users to understand the movements of the market. This transparency includes the disclosure of specific bids and offers and associated volumes for each product. Staff discourages any exchanges or trading platforms from being managed by any market participant, or combination thereof, in order to avoid the inevitable conflict of interest between the roles of brokers and traders. Finally, Staff recommends that the Commission establish specific rules banning any form of prearranged wash trading activities and prohibiting the reporting of any affiliate trading activities through industry indices. Strict adherence to these rules should be a condition of market-based rate or gas certificate authority. Staff also recommends that the Commission condition blanket gas certificates, as well as electric power market-based rates, to require that sellers who use trading platforms use only those trading platforms that employ a “credit change monitor” that would be used to help evaluate unusual patterns in credit changes in the platform. The reason for this requirement is that the credit structure could be used to manipulate access to other traders and, therefore, the perceived market pricing. In addition, the Commission should disallow market-based rates for public utilities that use trading platforms unless the owners or operators of those platforms agree to provide the Commission Staff with full access to trade reporting and order book information for the trading systems. Given the relative ease with which EOL manipulated the market and deceived its users, we do not believe a one-to-many trading platform is acceptable. We recognize that electronic trading on the EOL platform offered many advantages over historical voice trading. Even with its disadvantages, traders embraced EOL because it was faster, more convenient, and gave a widely accepted point of reference. A combination of our analysis and the further evolution of many-to-many platforms and their inherent advantages over EOL should render the one-to-many platform obsolete. Finally, we note that UBS Warburg, which now operates the EOL platform, suspended its use on December 10, 2002, due to a lack of trade volume. In any event, Staff recommends that market-based rates and gas certificate authority be conditioned on sellers not using their own one-to-many platform.

Chapter VII
Docket No. PA02-2-000 Price Manipulation in Western Markets VII-16
Further, Staff recommends that Congress consider giving direct authority to a Federal agency to ensure that electronic trading platforms for wholesale sales of electric energy and natural gas in interstate commerce are monitored and provide market information that is necessary for price discovery in competitive energy markets.

Chapter VIII
Docket No. PA02-2-000 Price Manipulation in Western Markets VIII-1
VIII. The Profitability of EnronOnline Information Advantage
Staff, with assistance from Hendrik Bessembinder, Blaine Huntsman Chair in Finance, Eccles Business School, University of Utah, analyzed the profits earned by EnronOnline (EOL) market makers in five key product categories. As noted previously in this Report, the EOL platform was characterized by a one-to-many structure in which Enron was the counterparty to all customer trades. The EOL platform was quite successful for a period of time, attracting a substantial portion of overall trading in gas and power products. A question that arises is whether Enron was able to use its position as a market maker and counterparty to a substantial portion of industry trading activity to create monopoly profits for itself, at the expense of its trading partners. The answer to this question is of interest in terms of understanding how energy trading, and the trading of commodities and financial products in general, should optimally be structured. The one-to-many structure used by EOL is relatively rare. Most markets for energy products, including TradeSpark and the IntercontinentalExchange (ICE), are structured on a many-to-many basis. At ICE, disparate traders transact directly with each other and the role of the exchange is mainly limited to disseminating quotations and facilitating trade processing. However, other situations arise in which a single intermediary acts as the counterparty to a substantial portion of customer trades. For example, a New York Stock Exchange (NYSE) specialist may interact with the majority of customer orders in the case of thinly traded stocks. In this case, however, a specialist is subject to substantial affirmative obligations and oversight by the NYSE to ensure that the monopoly position is not used to earn unusual profits at the expense of customers. EOL market makers were subject to no such regulations. EOL market makers may have been able to earn monopoly profits by either of two complementary methods. First, they could have maintained wide bid-ask spreads. Second, they could have exploited the information advantage gained from seeing all customers’ orders and trades (while each customer saw only their own orders and trades) to speculate profitably. Any speculative profit accruing to Enron would have been earned at the expense of its counterparties.

Chapter VIII
Docket No. PA02-2-000 Price Manipulation in Western Markets VIII-2
Measuring Trading Profits
Consider a market maker who hypothetically begins a trading session with no cash and no inventory. Each purchase by the market maker expends cash but adds to inventory, while each market maker sale adds to cash but deletes inventory. Since market-maker purchases do not need to equate to market-maker sales over any given time interval, the accumulated market-making profit after t periods is measured not by the accumulated cash balance, but by the sum of cash accumulated and the value of inventory, as: Πt = Ct + It Vt where Ct is the cash balance, It is inventory in physical units (It > 0 implying that the market maker has accumulated the product and It < 0 implying that the market maker has a net obligation to deliver the product), and Vt is the market value per unit of inventory. To measure inventory gains requires an assessment of the fair market value per unit of inventory, Vt. The approach used here is to rely on the final EOL trade price as a proxy for market value at the end of trading period t in each contract.1 This measure of total market-making profit can be restated in a more useful way. Let Bt and St denote the quantity bought and the quantity sold, respectively, by the market maker from the start of trading until time t. The lesser of Bt and St represents the amount of customer buy (or sell) orders that can be paired or matched with corresponding sell (or buy) orders, while the difference between Bt and St is the unmatched order flow that becomes the market maker’s net inventory, It, i.e., either increases or decreases in inventory. For example, if Bt = 70 and St = 50, the lesser of Bt and St, or min(Bt,St) = 50, and It = 20. Let PB denote the average price for market-maker purchases and let PS denote the average price for market-maker sales.2 The market maker’s trading profit can be measured as: TPt = (min(Bt,St)) × (PS - PB). The market maker earns a trading profit if the average selling price exceeds the average purchase price. This price differential will reflect,
1Using the final trade price as a proxy for fair market value introduces some measurement error. The final trade may occur at either the ask or the bid, while fair value presumably lies between the bid and the ask quotes. However, this measurement error is likely to average to nearly zero across the many individual products studied. 2Each price is computed as the volume-weighted average across trades.

Chapter VIII
Docket No. PA02-2-000 Price Manipulation in Western Markets VIII-3
but is not limited to, the bid-ask spread. It will also include speculative profits if the market maker is able to attract customer buy orders prior to price declines and customer sell orders prior to price increases. Trading profits depend on the excess of the average sell price over the average buy price and on the quantity of matched order flow, i.e., the lesser of Bt and St. In addition to this trading profit, total market- making profit will reflect gains and losses on the net order imbalances (i.e., inventory). If purchases exceed sales (i.e., inventory is positive), the inventory gain as of period t can be measured as: IGt = (Bt - St) × (Vt - PB). This reflects that the market maker gains from a long inventory position if the inventory is worth more than his average acquisition price. In cases where sales exceed purchases so that the market maker is net short, the inventory gain can be computed as: IGt = (St - Bt) × (PS - Vt), reflecting that a market maker gains on a short inventory position if the market value falls below his average sales price. Total market-making profit can then be measured as the sum of trading profits and inventory gains:3 Πt = TPt + IGt. This study estimates EOL market-making profits for five important energy product categories: power trades for physical delivery at the California-Oregon Border (COB); power trades for physical delivery at Palo Verde, Arizona; natural gas trades for physical delivery at Topock, California; natural gas trades for physical delivery at Henry Hub, Louisiana; and trades in the New York Mercantile Exchange (NYMEX) look-alike swap, which is a financial contract that mimics the NYMEX Henry Hub futures contract. The data cover the period January 1, 2000 to December 31, 2001. Profits are measured for each individual product in these categories from the time of the first trade in the product until the last trade. An individual product is distinguished by the product to be delivered, the period during which delivery is to take place, and the firmness of the obligation to deliver. For example, a “next-day” contract to deliver gas at Topock on September 27, 2001 would be evaluated separately from a “rest-of-month” contract to deliver gas on all remaining days during 3It can be verified that market-making profits measured as the sum of trading profits and inventory gain are algebraically identical to profits measured as the sum of cash balance and inventory value.

Chapter VIII
Docket No. PA02-2-000 Price Manipulation in Western Markets VIII-4
September 2001. Trading profits are measured based on balanced trades (the minimum of EOL purchases and sales) from the first trade until the final trade in each individual product. Inventory profits are measured by comparing the average inventory acquisition price with the final EOL price for the product. Trading profits and inventory gains are then summed across all products within a category.4 To demonstrate the calculation of market-making profit for a specific product, consider the contract for delivery of Topock gas on February 28, 2001. This contract traded 44 times, all on February 27, 2001. Enron recorded purchases (Bt) of 195,000 MMBtu and sales (St) of 210,000 MMBtu. Enron’s average purchase price (Pb) was $12.1795, while its average sales price (Ps) was $12.7976. The final trade in the product on EOL (Vt) was at a price of $12.75. The lesser of purchases or sales, representing matched order flow, is calculated as min(Bt,St) and equals 195,000 MMBtu. Net inventory is calculated by the equation St - Bt and represents a short position (sales exceeded purchases) of 15,000 MMBtu. Using the equation TPt = (min(Bt,St)) × (PS - PB), trading gains are 195,000 × (12.7976 - 12.1795) = $120,530. Meanwhile, using the equation IGt = (St - Bt) × (PS - Vt), inventory gains are 15,000 × (12.7976 - 12.75) = $714. This reflects that in accumulating its short position, Enron sold at an average price (PS) slightly above the final price (Vt) for the product. The reasoning is that the short position must be covered from somewhere, and the final price is an estimate of the cost of doing so. Therefore, using the equation Πt = TPt + IGt, total market-making profit in the product defined as delivery of Topock gas on February 28, 2001 is $120,530 + $714 = $121,244.
4Physical purchases Bt, sales St, and inventory It = Bt - St depend on both the contracted quantity and the delivery horizon. For gas products, this is the product of the number of MMBtu and the number of days for which delivery is required. For power contracts, this is the number of MWh times the number of delivery days times the number of delivery hours (8 for off-peak contracts and 16 for on-peak contracts).

Chapter VIII
Docket No. PA02-2-000 Price Manipulation in Western Markets VIII-5
EOL Market-Making Profits Table VIII-1 reports market-making profits in the five product categories described above. EOL market making was highly profitable in aggregate. Across the five product categories and the 2 years of data, trading profits exceeded $641 million. Estimated inventory gains were negative $54 million, leaving $587 million in combined market-making profit. This equated to an average market-making profit of $1,200 for each of the 507,000 trades, or profits that were 0.08 percent of the $506.7 billion in trading activity. The profitability of EOL market making varied dramatically across product categories. Trading of NYMEX look-alike swaps (financially settled swaps whose value is determined based on the settlement of NYMEX futures contracts) was immensely profitable, with trading gains exceeding $764 million and estimated gains on inventory amounting to another $156 million. This equates to a total market-making profit of $2,300 for each of the 400,000 EOL trades in NYMEX look-alike swaps. In contrast to the profitability of this swap trading, EOL market makers took losses in the other four product categories. COB power contracts yielded a trading gain of $10.3 million, but this was more than offset by estimated inventory losses of $25.7 million. Market making in Palo Verde power, Topock gas, and Henry Hub gas led to both trading losses and estimated losses on inventory. Trading losses on Palo Verde power contracts exceeded $128 million, while trading losses in Topock gas and Henry Hub gas were more moderate, amounting to $0.9 million and $3.8 million, respectively. Estimated inventory losses for Palo Verde power were also large, at $168 million, while inventory losses for Topock and Henry Hub gas were estimated at $14 million and $2 million, respectively. Finding trading losses for these physical delivery contracts is surprising. EOL market makers generally charged a positive bid-ask spread, which provided positive trading profits, other things being equal. Measured trading profits were negative for all physical delivery products except COB power. This implies that the average price at which EOL sold was less than the average price at which EOL purchased. Finding the average EOL selling price to be less than the average EOL purchase price is surprising, considering that a positive bid-ask spread

Chapter VIII
Docket No. PA02-2-000 Price Manipulation in Western Markets VIII-6
was charged. The following example illustrates how this occurred. Suppose that the EOL market maker initially posts an ask (willing to sell) quote of $3.02 and a bid (willing to buy) quote of $3.00. A customer buys (EOL sells) at the ask quote of $3.02. Shortly thereafter, the EOL market maker elects (perhaps after learning of bullish fundamental information) to update his quotes to $3.06 ask and $3.04 bid. A customer then sells at the $3.04 bid price, leaving EOL with a trading loss of $.02 in the matched pair of trades comprising this example. The key feature of this example is the upward movement of quotes after the customer purchase. The trading losses observed in this study for the Palo Verde, Topock, and Henry Hub products imply that adverse (to EOL) price changes between trades occurred systematically and more than offset the positive bid-ask spread. The negative estimates of inventory gain for the four physical delivery product categories imply that the EOL market maker tended to accumulate inventory at prices that exceed the eventual, final EOL price and tended to enter short inventory positions at prices below the eventual, final EOL price. These results with respect to both trading losses and inventory losses are the opposite of what would be expected if the EOL market maker were able to extract useful information from an observation of customer orders and trades. There are at least three possible explanations for the results observed here. One possibility is that EOL market makers, with the exception of the market maker in the NYMEX look-alike swap, were not as skilled at trading as their customers and thus were unable to earn trading profits despite the advantages of a positive bid-ask spread and superior information about customers’ orders and trades. However, this explanation does not seem plausible. A second possibility is that the EOL market makers in the physical delivery products were skilled and able to exploit their information advantage, but executed their most profitable trades on platforms other than EOL. This also seems highly unlikely. A third possibility is that EOL market makers used the information obtained from observing customers’ orders and trades in the physical markets not to trade profitably in those markets, but to trade profitably in various financial markets (futures, options, swaps, etc.) whose prices depend on fundamental factors in the physical markets. The large profits observed for the financial NYMEX look-alike swap are certainly consistent with this reasoning. It is also consistent with the manipulation strategies of the physical markets to profit in the financial markets (an issue described elsewhere in this Report). Tables VIII-2 through VIII-6 provide more detail on market-making profits in the individual categories, including profits by calendar

Chapter VIII
Docket No. PA02-2-000 Price Manipulation in Western Markets VIII-7
month and profits on short-term (delivery horizon of 3 days or less), medium-term (delivery horizon between 4 and 31 days), and long-term (delivery on more than 31 days) contracts. A few results are notable. First, trading profits are highly variable over time. NYMEX look-alike swaps provide the most dramatic example. Trading profit exceeded $270 million in October 2001 (although this was dwarfed by an estimated inventory loss of $808 million during the same month). Trading losses of $270 million were incurred in December 2000, followed by trading gains of $166 million in January 2001. Similar variation on a smaller scale is observed in other markets. For example, COB power trading yielded profits of $30 million in January 2001 and losses of $19 million in May 2001. This type of variation in trading gains demonstrates that EOL market makers were active (and sometimes unsuccessful) speculators, not passive market makers earning a living from the bid-ask spread. This, in turn, exacerbates concerns that the market maker in a one-to-many platform could use the information in orders and trades to the detriment of customers.
Conclusions
The EOL platform had a large market share for trading energy products and was characterized by a one-to-many structure that allowed the EOL market maker to see all customer orders and trades, while each customer saw only its own orders and trades. These considerations lead to the possibility that the EOL market maker possessed a degree of monopoly power and would be able to earn monopoly profits at the expense of its customers. This chapter reports on market-making profits in five important energy product categories, including physical power for delivery at COB and Palo Verde, physical gas for delivery at Henry Hub and Topock, and financial swaps based on the NYMEX Henry Hub contract. In aggregate, EOL earned market-making profits in excess of $587 million during 2000 and 2001 for these five product categories. The magnitude and time series variability of these profits suggest that EOL market makers did not simply act as passive suppliers of liquidity, i.e., one who stands ready to buy or sell and earn a moderate but steady profit from the bid-ask spread. Rather, EOL market makers were active and, on average, successful speculators. Somewhat surprisingly, market-making profits were concentrated in the only financial contract studied; EOL market makers actually sustained losses in the four physical delivery contracts examined. This result is consistent with the reasoning that EOL market makers used the information advantage gained from their central position in physical markets not to trade profitably in those markets, but to earn speculative profits in associated financial markets (futures, options, swaps, etc.).

Chapter VIII
Docket No. PA02-2-000 Price Manipulation in Western Markets VIII-8
This analysis highlights the importance of structuring markets to create effective competition for customer orders. A one-to-many format with an unregulated and unconstrained market maker is unlikely to lead to efficient outcomes. Many markets around the world are changing to a many-to-many format in which customers interact directly with each other. In a many-to-many format, customer limit orders compete to win customer market orders. Alternately, competitive market outcomes might be attained by having numerous potential market makers compete for order flow, as on the Nasdaq Stock Market and in the brokered “upstairs markets” that often accompany formal exchanges. In the few situations where a one-to-many structure is still observed (for example, in thinly traded NYSE stocks where the specialist participates in most trades), the specialist is subject to numerous affirmative obligations to protect customers and to oversight by the Exchange. To summarize, efficient market structures require either vigorous competition among potential suppliers of liquidity or oversight of the designated liquidity supplier.
Recommendation Staff recommends that the Commission condition market-based rates and blanket gas certificates to require that sellers who use electronic platforms use only those platforms that agree to provide the Commission with full access to trade and order book information and agree to appropriate monitoring requirements.

Chapter VIII
Docket No. PA02-2-000 Price Manipulation in Western Markets VIII-9
Table VIII-1. Profits to Enron From EOL Market Making in Five Key Products
Product Trading Profit
Gain on Inventory
Total Profit
Profit per Trade
Profit as Percent of
Trading
Total Dollars
TransactedNumber
of Trades
COB Power Physical 10.3 -25.7 -15.4 -3.0 -0.58 2,637.5 5,099
Palo Verde Power Physical -128.8 -168.5 -297.3 -11.4 -1.81 16,460.8 26,164
Topock Gas Physical -0.9 -13.7 -14.6 -0.7 -0.42 3,496.3 21,928 Henry Hub Gas
Physical -3.8 -2.0 -5.8 -0.1 -0.09 6,606.1 52,828
NYMEX Gas Look-Alike Swaps 764.5 155.7 920.2 2.3 0.13 710,836.0 400,663
Total of Five Products 641.3 -54.2 587.1 1.2 0.08 740,036.9 506,682
Trading profit reflects the excess of the average Enron sell price over the average Enron buy price times the quantity of matched EOL trading. Gain on inventory reflects profits on the net EOL order imbalance, measured by the differential between the final EOL price for the contract and the average inventory acquisition price. Total profit is the sum of trading profit and gain on inventory. Total dollars transacted is the sum of total purchases and total sales on EOL. Profit as a percent of trading is total profit relative to total dollars transacted. Dollar amounts are in millions except for profit per trade, which is in thousands. The interval studied is January 2000 to December 2001.

Chapter VIII
Docket No. PA02-2-000 Price Manipulation in Western Markets VIII-10
Table VIII-2. Profits to Enron From EOL Market Making:
Trades for Physical Delivery of Power at the California-Oregon Border
Trading Profit
Gain on Inventory
Total Profit
Profit per Trade
Profit as Percent of
Trading
Total Dollars
TransactedNumber of
Trades
All Trades 10.3 -25.7 -15.4 -3.0 -0.58 2,637.5 5,099
By Contract Term Long Term -10.9 -3.7 -14.6 -42.7 -1.13 1,292.2 342 Medium Term 20.6 -20.6 0.0 0.0 0.00 1,127.5 959 Short Term 0.5 -1.4 -0.8 -0.2 -0.39 217.8 3,798
By Calendar Month January 2000 0.0 0.0 0.0 -0.2 -0.19 2.3 18 February 2000 0.2 -0.2 -0.1 -0.3 -0.08 109.8 272 March 2000 -0.6 -0.7 -1.3 -6.9 -1.44 92.1 193 April 2000 0.4 -0.1 0.3 1.3 0.45 61.8 219 May 2000 4.0 -16.7 -12.8 -133.3 -18.23 70.2 96 June 2000 -4.2 -6.8 -11.0 -123.6 -19.19 57.3 89 July 2000 -2.9 -8.9 -11.9 -54.4 -11.35 104.5 218 August 2000 -4.1 0.4 -3.7 -13.1 -0.83 446.3 284 September 2000 -0.3 -0.5 -0.8 -2.9 -0.35 230.3 275 October 2000 -1.6 -1.6 -3.2 -6.0 -1.01 314.6 529 November 2000 3.5 11.2 14.7 42.6 5.72 257.5 346 December 2000 3.5 -12.8 -9.3 -174.8 -21.07 44.0 53 January 2001 29.7 -68.6 -39.0 -299.9 -29.86 130.6 130 February 2001 1.0 4.5 5.5 44.2 6.90 80.1 125 March 2001 -1.8 -7.8 -9.6 -42.1 -3.59 266.7 227 April 2001 0.0 0.6 0.6 3.0 1.15 51.6 196 May 2001 -18.9 66.1 47.2 186.6 32.06 147.2 253 June 2001 13.7 -0.5 13.2 54.4 25.59 51.4 242 July 2001 -7.8 12.4 4.6 14.3 13.87 33.2 321 August 2001 -2.6 2.3 -0.3 -1.0 -2.17 15.5 336 September 2001 -1.2 2.5 1.3 4.1 7.70 16.9 317 October 2001 0.0 -0.6 -0.6 -2.4 -5.35 10.8 244 November 2001 0.5 0.2 0.7 6.1 1.65 42.9 116 December 2001 0 0 0 0 0 0 0
Trading profit reflects the excess of the average Enron sell price over the average Enron buy price times the quantity of matched EOL trading. Gain on inventory reflects profits on the net EOL order imbalance, measured by the differential between the final EOL price for the contract and the average inventory acquisition price. Total profit is the sum of trading profit and gain on inventory. Total dollars transacted is the sum of total purchases and total sales on EOL. Profit as a percent of trading is total profit relative to total dollars transacted. Dollar amounts are in millions except for profit per trade, which is in thousands. Short-term contracts involve delivery periods of 3 days or less. Medium-term contracts involve delivery periods of 4 to 31 days. Long-term contracts involve delivery periods over 31 days.

Chapter VIII
Docket No. PA02-2-000 Price Manipulation in Western Markets VIII-11
Table VIII-3. Profits to Enron From EOL Market Making:
Trades for Physical Delivery of Power at Palo Verde, Arizona
Trading Profit
Gain on Inventory
Total Profit
Profit per Trade
Profit as Percent of
Trading
Total Dollars
TransactedNumber of
Trades
All Trades -128.8 -168.5 -297.3 -11.4 -1.81 16,460.8 26,164 By Contract Term Long Term -55.7 -100.0 -155.7 -75.3 -2.13 7,293.9 2,069 Medium Term -74.3 -60.5 -134.8 -17.1 -1.59 8,502.7 7,896 Short Term 1.2 -8.0 -6.8 -0.4 -1.03 664.1 16,199 By Calendar Month January 2000 0.0 0.0 0.0 -0.1 -0.07 3.6 25 February 2000 0.3 -1.1 -0.9 -2.1 -0.60 141.6 411 March 2000 -0.8 -0.9 -1.8 -3.9 -0.97 180.7 446 April 2000 0.5 3.3 3.8 8.9 1.49 253.8 426 May 2000 -0.9 36.0 35.1 155.9 18.35 191.1 225 June 2000 33.8 3.2 36.9 95.4 6.81 542.0 387 July 2000 0.0 13.3 13.4 26.1 3.27 408.6 511 August 2000 -13.4 -34.4 -47.8 -60.3 -4.12 1,159.1 793 September 2000 16.8 4.7 21.5 25.9 2.61 822.6 828 October 2000 -8.2 0.7 -7.5 -6.6 -1.06 712.5 1,137 November 2000 24.7 -77.1 -52.4 -37.9 -5.40 969.8 1,382 December 2000 10.2 -290.0 -279.8 -690.7 -94.38 296.4 405 January 2001 13.7 263.9 277.6 488.8 35.89 773.6 568 February 2001 -115.5 91.2 -24.3 -42.9 -2.45 990.3 566 March 2001 39.3 58.3 97.6 97.0 7.49 1,302.7 1,006 April 2001 36.7 -158.1 -121.4 -83.9 -6.78 1,789.5 1,446 May 2001 -27.2 -90.0 -117.3 -72.0 -6.29 1,863.6 1,628 June 2001 -93.9 34.1 -59.7 -27.2 -4.24 1,408.4 2,198 July 2001 0.5 -61.3 -60.8 -31.6 -12.62 481.9 1,921 August 2001 -11.6 5.2 -6.4 -2.1 -0.99 648.4 3,021 September 2001 -19.4 15.0 -4.4 -2.0 -1.32 332.4 2,217 October 2001 -4.6 -12.9 -17.4 -6.1 -3.45 505.8 2,865 November 2001 -9.9 28.6 18.7 10.7 2.74 682.1 1,752 December 2001 0 0 0 0 0 0 0 Trading profit reflects the excess of the average Enron sell price over the average Enron buy price times the quantity of matched EOL trading. Gain on inventory reflects profits on the net EOL order imbalance, measured by the differential between the final EOL price for the contract and the average inventory acquisition price. Total profit is the sum of trading profit and gain on inventory. Total dollars transacted is the sum of total purchases and total sales on EOL. Profit as a percent of trading is total profit relative to total dollars transacted. Dollar amounts are in millions except for profit per trade, which is in thousands. Short-term contracts involve delivery periods of 3 days or less. Medium-term contracts involve delivery periods of 4 to 31 days. Long-term contracts involve delivery periods over 31 days.

Chapter VIII
Docket No. PA02-2-000 Price Manipulation in Western Markets VIII-12
Table VIII-4. Profits to Enron From EOL Market Making:
Trades for Physical Delivery of Gas at Topock, California
Trading Profit
Gain on Inventory
Total Profit
Profit per Trade
Profit as Percent of
Trading
Total Dollars
TransactedNumber of
Trades
All Trades -0.9 -13.7 -14.6 -0.7 -0.42 3,496.3 21,928 By Contract Term Long Term 0 0 0 0 0 0 0 Medium Term 2.1 -6.6 -4.5 -3.8 -0.40 1,115.8 1,179 Short Term -3.0 -7.2 -10.2 -0.5 -0.43 2,380.5 20,749 By Calendar Month January 2000 0 0 0 0 0 0 0 February 2000 0.0 0.0 0.0 0.0 0.09 3.7 199 March 2000 0.0 0.0 0.0 0.0 -0.12 10.8 497 April 2000 0.0 0.0 0.0 0.0 -0.10 10.3 445 May 2000 0.0 -0.1 -0.1 -0.1 -0.10 62.8 1,129 June 2000 0.0 0.0 -0.1 0.0 -0.07 74.9 1,305 July 2000 0.0 0.0 0.0 0.0 -0.03 67.7 1,145 August 2000 -0.6 0.5 -0.1 -0.1 -0.09 162.1 1,236 September 2000 0.0 0.0 0.0 0.0 0.02 127.5 1,222 October 2000 -2.3 0.7 -1.6 -1.4 -0.73 224.5 1,156 November 2000 -2.1 -3.3 -5.3 -3.1 -1.34 398.9 1,703 December 2000 2.6 -5.8 -3.2 -1.3 -0.35 902.4 2,434 January 2001 0.2 -2.4 -2.2 -1.3 -0.69 314.2 1,623 February 2001 3.0 -0.1 2.9 1.9 0.66 440.3 1,557 March 2001 0.0 -1.9 -1.9 -6.4 -2.46 76.6 296 April 2001 -0.6 -0.2 -0.8 -1.0 -0.45 184.9 865 May 2001 0.1 1.0 1.1 1.2 0.78 138.1 921 June 2001 -0.7 0.2 -0.5 -0.4 -0.44 111.6 1,315 July 2001 -0.2 -1.0 -1.2 -1.4 -1.77 66.5 841 August 2001 -0.3 -1.2 -1.5 -1.9 -2.92 51.6 787 September 2001 0.0 0.0 0.0 -0.1 -0.17 25.8 577 October 2001 0.0 0.0 0.0 0.0 0.02 29.9 442 November 2001 0.0 0.0 0.0 -0.2 -0.33 11.3 233 December 2001 0 0 0 0 0 0 0
Trading profit reflects the excess of the average Enron sell price over the average Enron buy price times the quantity of matched EOL trading. Gain on inventory reflects profits on the net EOL order imbalance, measured by the differential between the final EOL price for the contract and the average inventory acquisition price. Total profit is the sum of trading profit and gain on inventory. Total dollars transacted is the sum of total purchases and total sales on EOL. Profit as a percent of trading is total profit relative to total dollars transacted. Dollar amounts are in millions except for profit per trade, which is in thousands. Short-term contracts involve delivery periods of 3 days or less. Medium-term contracts involve delivery periods of 4 to 31 days. Long-term contracts involve delivery periods over 31 days.

Chapter VIII
Docket No. PA02-2-000 Price Manipulation in Western Markets VIII-13
Table VIII-5. Profits to Enron From EOL Market Making:
Trades for Physical Delivery of Gas at Henry Hub, Louisiana
Trading Profit
Gain on Inventory
Total Profit
Profit per Trade
Profit as Percent of
Trading
Total Dollars
TransactedNumber
of Trades
All Trades -3.8 -2.0 -5.8 -0.1 -0.09 6,606.1 52,828 By Contract Term Long Term 0 0 0 0 0 0 0 Medium Term -1.8 0.4 -1.5 -0.4 -0.08 1,819.5 3,524 Short Term -1.9 -2.4 -4.3 -0.1 -0.09 4,786.6 49,304 By Calendar Month January 2000 0.0 0.0 0.0 0.0 -0.20 0.3 14 February 2000 0.0 -0.1 -0.1 -0.2 -0.53 13.0 328 March 2000 0.0 0.0 0.0 0.0 0.04 36.9 570 April 2000 0.0 -0.1 -0.1 -0.1 -0.15 48.4 750 May 2000 -0.1 -0.2 -0.2 -0.2 -0.12 209.4 1,050 June 2000 -0.4 0.0 -0.4 -0.2 -0.09 432.1 1,864 July 2000 -0.1 -0.1 -0.2 -0.2 -0.12 209.8 1,237 August 2000 0.1 -0.1 0.0 0.0 -0.01 309.5 1,546 September 2000 0.0 -0.2 -0.2 -0.1 -0.08 242.2 1,225 October 2000 -0.1 -0.2 -0.4 -0.2 -0.11 336.4 1,972 November 2000 -0.3 0.6 0.3 0.1 0.04 741.2 3,309 December 2000 -1.6 0.6 -1.0 -0.4 -0.20 474.3 2,327 January 2001 0.0 -0.6 -0.5 -0.2 -0.14 374.0 2,328 February 2001 0.3 -0.2 0.2 0.1 0.04 393.4 2,579 March 2001 -0.3 0.0 -0.3 -0.1 -0.07 414.5 3,386 April 2001 -0.2 -0.3 -0.5 -0.1 -0.13 394.6 3,477 May 2001 -0.2 -0.2 -0.4 -0.1 -0.10 396.7 3,540 June 2001 -0.5 -0.4 -0.9 -0.2 -0.17 568.7 4,579 July 2001 -0.1 0.0 -0.1 0.0 -0.04 290.6 3,855 August 2001 -0.5 -0.2 -0.7 -0.2 -0.26 267.8 3,625 September 2001 0.0 0.1 0.2 0.1 0.13 132.0 2,603 October 2001 0.2 -0.1 0.1 0.0 0.04 245.3 4,698 November 2001 -0.1 -0.3 -0.4 -0.2 -0.57 75.2 1,966 December 2001 0 0 0 0 0 0 0
Trading profit reflects the excess of the average Enron sell price over the average Enron buy price times the quantity of matched EOL trading. Gain on inventory reflects profits on the net EOL order imbalance, measured by the differential between the final EOL price for the contract and the average inventory acquisition price. Total profit is the sum of trading profit and gain on inventory. Total dollars transacted is the sum of total purchases and total sales on EOL. Profit as a percent of trading is total profit relative to total dollars transacted. Dollar amounts are in millions except for profit per trade, which is in thousands. Short-term contracts involve delivery periods of 3 days or less. Medium-term contracts involve delivery periods of 4 to 31 days. Long-term contracts involve delivery periods over 31 days.

Chapter VIII
Docket No. PA02-2-000 Price Manipulation in Western Markets VIII-14
Table VIII-6. Profits to Enron From EOL Market Making:
Trades in NYMEX Look-Alike Swaps
Trading Profit
Gain on Inventory
Total Profit
Profit per Trade
Profit as Percent of
Trading
Total Dollars
TransactedNumber of
Trades
All Trades 764.5 155.7 920.2 2.3 0.13 710,836 400,663 By Contract Term Long Term 252.8 900.0 1152.8 14.0 0.39 294,442 82,220 Medium Term 511.7 -744.3 -232.6 -0.7 -0.06 416,394 318,443 Short Term 0 0 0 0 0 0 0 By Calendar Month January 2000 0.3 -0.3 0.1 0.4 0.05 175 195 February 2000 2.6 7.2 9.8 2.6 0.27 3,624 3,770 March 2000 -2.2 16.3 14.1 2.6 0.20 7,127 5,461 April 2000 4.6 11.8 16.4 3.2 0.24 6,696 5,166 May 2000 42.7 9.5 52.2 4.4 0.29 18,183 11,781 June 2000 12.6 -31.6 -19.0 -1.1 -0.07 28,197 17,750 July 2000 58.9 -54.4 4.5 0.4 0.03 17,044 12,315 August 2000 15.0 206.1 221.1 15.8 0.91 24,395 13,962 September 2000 45.6 43.8 89.4 7.0 0.33 26,913 12,852 October 2000 67.6 -257.3 -189.7 -12.6 -0.54 35,143 15,081 November 2000 -108.8 49.0 -59.8 -2.7 -0.11 53,659 22,453 December 2000 -269.9 120.0 -149.9 -7.7 -0.33 45,577 19,437 January 2001 165.6 -41.0 124.6 6.2 0.30 42,151 20,037 February 2001 120.5 -62.0 58.5 3.2 0.16 35,480 18,502 March 2001 46.9 -1.3 45.6 2.4 0.11 41,031 19,251 April 2001 18.9 28.4 47.3 2.4 0.12 39,621 19,466 May 2001 106.9 69.4 176.3 7.9 0.41 43,254 22,238 June 2001 1.2 150.6 151.8 5.7 0.33 46,339 26,413 July 2001 75.3 -61.9 13.3 0.5 0.03 39,619 26,231 August 2001 10.0 431.8 441.8 16.0 1.07 41,228 27,630 September 2001 32.1 217.6 249.7 12.4 0.91 27,391 20,124 October 2001 270.8 -807.8 -537.1 -15.1 -1.05 50,999 35,559 November 2001 40.2 57.9 98.1 3.9 0.27 36,933 24,954 December 2001 7.1 54.0 61.1 1744.9 104.67 58 35 Trading profit reflects the excess of the average Enron sell price over the average Enron buy price times the quantity of matched EOL trading. Gain on inventory reflects profits on the net EOL order imbalance, measured by the differential between the final EOL price for the contract and the average inventory acquisition price. Total profit is the sum of trading profit and gain on inventory. Total dollars transacted is the sum of total purchases and total sales on EOL. Profit as a percent of trading is total profit relative to total dollars transacted. Dollar amounts are in millions except for profit per trade, which is in thousands. Short-term contracts involve delivery periods of 3 days or less. Medium-term contracts involve delivery periods of 4 to 31 days. Long-term contracts involve delivery periods over 31 days.

Chapter IX
Docket No. PA02-2-000 Price Manipulation in Western Markets IX-1
IX. Enron’s Manipulation of the Natural Gas Markets, Portions of the Enron Online Black Box Revealed, and Forward Looking Recommendations1
Background
Financial energy products are used to hedge risk on physical energy products, and the two are interrelated. Physical transaction prices dictate the pricing of financial products, i.e., financial products derive their value from the underlying physical market. The depth and liquidity of financial energy markets are far greater than those of physical markets. The relationship between financial and physical energy products and the relatively thinner and less liquid physical markets provides opportunities to manipulate the physical markets and profit in the financial markets. This is true regardless of whether the manipulation in the physical market raises or lowers prices for the physical commodity. This chapter analyzes an experiment to test a manipulation strategy and an actual manipulation by Enron using EnronOnline (EOL). Enron manipulated the price of physical gas upward, then downward. Although the price change in the physical markets was only about $0.10/MMBtu, Enron profited due to the effect that this small change in the physical price had on its large financial position. Enron earned more than $3 million from this manipulation. FERC Staff obtained information indicating that Enron traders potentially manipulated the price of natural gas at the Henry Hub in Louisiana to profit from positions taken in the over-the-counter (OTC) financial derivatives markets (OTC markets). Through interviews, depositions, document review, and data analysis, Staff found substantial evidence corroborating the initial information.2 It is Staff’s opinion that Enron traders, through transactions falling within the Commission’s jurisdiction and authorized through a blanket certificate, 1This section was prepared by FERC Staff with the assistance of outside consultant Chester Spatt, Mellon Bank Professor of Finance, Graduate School of Industrial Administration, Carnegie Mellon University. 2During the investigation into Enron and EnronOnline, FERC provided the Commodity Futures Trading Commission (CFTC) with access to the electronic databases that FERC Staff relied on to generate the analysis for this and other chapters of the Report. FERC provided the CFTC, Department of Justice (DOJ), and Securities and Exchange Commission (SEC) with a preliminary draft of this Report on March 3, 2003, asking for comments and concerns. FERC then met with the CFTC, DOJ, and SEC on March 10, 2003 to discuss this Report prior to its issuance.
Chapter IX
Docket No. PA02-2-000 Price Manipulation in Western Markets IX-2
successfully manipulated the physical natural gas markets. The manipulation yielded profits in the financial OTC markets.3 Staff reviewed documents disclosed by Enron describing the same strategy hypothetically in a memorandum predating the manipulation that Staff discovered.4 This caused concerns that Enron traders executed this strategy at other times and in other locations. As part of its research into the market manipulation, Staff identified key elements relating to the execution of the market manipulation strategy. Using this information, Staff proceeded to search for additional occurrences of manipulations at other times and in other locations. Staff’s search resulted in the discovery of trading behavior executed by Reliant that involved a different strategy but used similar techniques regarding the physical purchase of gas. As described in Chapter II, this trading behavior caused at least a portion of the increase in gas prices at the Southern California Border from December 2000 through February 2001. In the following sections, Staff describes the financial and physical gas markets, necessary conditions for manipulation, manipulation strategies, and an actual manipulation of Henry Hub prices by Enron traders.
The Relationship Between Natural Gas Financial Derivatives and the Underlying Physical Gas Contracts
General Purpose for Physical and Financial Natural Gas Markets Natural gas traders and marketers in the United States use many different physical and financial natural gas products to absorb the risks associated with fluctuating natural gas prices. For example, traders can purchase gas each day in the spot markets or they can agree in advance 3Commission jurisdiction is pursuant to the Commission’s authority under the Natural Gas Act (NGA) of 1938, particularly Sections 1(b), 4(a), and 5(a). The blanket certificate is provided in Parts 284.284 and 284.402 of this Commission’s Regulations. 4The following excerpt is a hypothetical example extracted from an Enron document to which Enron waived privileges: “Leveraged Trading – Trading Company (“TC”) is short fixed-price physical gas. TC is long financial Gas Daily through gas swap agreements. TC starts buying physical gas and goes beyond what is necessary to cover its short position; prices in the cash market increase and prices reported in Gas Daily are much higher. What are the legal issues? Are the risks greater if the swap reference price is the “average of the last three days of the month” or “average of all the days in a calendar month”?” Bates # EC001653170; “Discussion of Hypothetical Trading Strategies,” January 3, 2001.
Chapter IX
Docket No. PA02-2-000 Price Manipulation in Western Markets IX-3
to purchase gas based on a daily index. Traders also can lock in an average gas price through monthly or longer term physical contracts. Alternatively, these fixed-price contracts can be replicated or achieved through the combined execution of physical index purchases, basis swaps, Gas Daily swaps, and NYMEX futures or swaps. Depending on whether the trader needs to buy or sell gas in the future, the trader would buy or sell the above products. Based on the risks the trader is most concerned about, the trader may enter some or all of these transaction types or the trader may choose to defer trading until prices become more favorable. The availability of diverse types of instruments for bearing risk facilitates the allocation of risk to those best situated to bear these risks, increasing the efficiency of the capital market and lowering the cost of risk bearing. Financial services and energy firms that operate across the relevant markets are potentially willing to intermediate (transform) risks because of their own ability to hedge or offset the underlying exposure.
Importance of Liquidity in the Natural Gas Markets Liquidity refers to the ability to sell an asset and convert it into cash, at a price close to its fundamental value, in a short period of time. Generally, liquid markets form when a large number of buyers and sellers trade substantial volumes of a product. In the natural gas marketplace, the “gold standard” instruments are the physical products traded for delivery at the Henry Hub location, where many pipelines converge near the supply region in Louisiana. In the financial markets, the most important instruments are the NYMEX futures contracts, which settle based on the price of physically delivered natural gas at the Henry Hub. The settlement of the monthly NYMEX futures is determined 3 days from the end of the prior month.5 Because of the direct linkage between Henry Hub and important delivery points in the Northeast and Midwest, the Henry Hub physical market (relative to other physical markets) and the NYMEX futures market both tend to be relatively deep or liquid, thereby providing attractive instruments for many market participants. These instruments correlate reasonably with the hedging needs of many individual market participants. Consequently, although Henry Hub-related markets expose many individual participants to basis risk relative to gas price risk at other locations, the relative attractiveness of the Henry Hub to many of the market participants leads to a concentration of trading activity in Henry Hub-based physical and financial products. 5A NYMEX futures contract is based on the delivery of 10,000 MMBtu. See www.nymex.com.
Chapter IX
Docket No. PA02-2-000 Price Manipulation in Western Markets IX-4
The activity and depth on the NYMEX (next month) futures contract is much greater than that for the Henry Hub next-day physical contract because of the longer 1-month term associated with the contract, which reflects planned gas needs as opposed to marginal unanticipated changes to needs; the attractiveness of financial settlement; and the credit risk reduction associated with daily mark-to-market settlement.6 The liquidity of the Henry Hub next-day physical market is greater than the liquidity of physical markets in other locations. Because of the differing liquidities in these markets, the price impact of trading positions of a given size in these instruments can be relatively less than for instruments traded in smaller, less active products. As in various market settings, liquidity is self-reinforcing because market participants have a strong incentive to trade using the deepest and most liquid markets. Trading activity attracts trading activity and liquidity concentrates at the deepest markets. Traders often use the NYMEX futures to hedge overall market conditions because of its liquidity.
Physical Transaction Values Dictate the Pricing of Financial Derivatives Natural gas financial derivatives “derive” their value from transaction prices at major receipt and delivery points for natural gas. A significant variety of natural gas financial derivatives exist. The most commonly traded natural gas financial derivative is the NYMEX futures contract, which derives its value from physical transactions occurring at Henry Hub in Louisiana.7 The other primary financial derivatives are Gas Daily swaps and basis swaps, which are traded in the OTC markets. These products relate to the Henry Hub and many other locations in North America. The Gas Daily swap hedges the price risk between the price quoted in Inside FERC (whose settlement is determined by the average price for next-month gas at the specified location over the last 5 trading days for the current month) and the price quoted in the Gas Daily index. Basis swaps provide a hedge against relative price changes between two different locations (primarily the Henry Hub and another location), swapping the prices posted as the last-day NYMEX settlement price and the price quoted in Inside FERC for the location being hedged (adjusted by a market premium). One of the most common OTC derivative products is known as the “OTC swap,” also known as the NYMEX look-alike
6Daily “mark-to-market” settlement is the daily cash flow system used by U.S. futures exchanges to maintain a minimum level of margin equity for a given futures or options contract position by calculating the gain or loss in each contract position resulting from changes in the price of the futures or options contracts at the end of the trading day. See www.nymex.com. 7The specific delivery location is the Sabine Pipe Line Co.’s Henry Hub in Louisiana. See www.nymex.com.

Chapter IX
Docket No. PA02-2-000 Price Manipulation in Western Markets IX-5
swap. This swap derives its value from the price of the NYMEX natural gas futures contract. Henry Hub physical transactions strongly correlate with the NYMEX futures and the related OTC NYMEX look-alike swaps because the NYMEX futures directly settle based on the Henry Hub physical delivery price. The correlation between the NYMEX futures and next-day physical gas at Henry Hub is not perfect (although it is very high) because of various timing differences between the futures contract and the next-day physical contract. In particular, the futures contract represents delivery in the following month and the Henry Hub physical contract represents next-day delivery.8 The volatility of Henry Hub should be greater to reflect the inherent volatility in the value of a next-day product (which reflects unanticipated demands) versus the volatility in a monthly futures contract (which reflects anticipated demand). This is reinforced by the mean reversion of commodity spot prices. Many other financial derivative contracts relate in similar ways to underlying physical transactions of varying terms. The direct and indirect relationships between financial derivatives and physical transactions provide the linkage needed to exercise particular manipulation strategies. Generally, the dependence of financial derivative products on physical transaction values results in a strong correlation between changes in the value of the physical product and the financial derivatives. For example, if next-day physical gas (gas that will be delivered the next day) trades at a high level on a particular day, this affects the settlement of the portion of a Gas Daily financial swap that settles the next day. Looking forward, the increase in spot prices for gas indicates an increase in demand for gas (or a decrease in inventory) and may change expectations for prices of gas in the future as well. A change in expectations for future natural gas prices will affect the value of financial derivative transactions designed to settle on those future days. It is this interrelationship that provides an opportunity for manipulation.
8Delivery under NYMEX contracts shall take place no earlier than the first calendar day of the delivery month and shall be completed no later than the last calendar day of the delivery month. All deliveries shall be made at an hourly and daily rate of flow that is as uniform as possible over the course of the delivery month. See www.nymex.com.

Chapter IX
Docket No. PA02-2-000 Price Manipulation in Western Markets IX-6
Relative Differences in Liquidity Across Markets Combined With Correlated Values Between Those Markets Provides an Opportunity for Profitable Manipulation Although there are strong inherent advantages to the diverse ways in which risks are packaged in the marketplace, the presence of alternative instruments reflecting similar risks generates a need for correct relative pricing to avoid the ability to generate arbitrage profits. Arbitrage profits are riskless profits generated by simultaneously selling an overpriced asset while purchasing an underpriced substantively equivalent asset.9 For example, if two marketplaces existed for the same commodity and the first market offered to buy the commodity at $5.00 while the other market offered to sell the commodity at $4.00, an opportunity to simultaneously buy from the $4.00 market and sell to the $5.00 market would arise, yielding a $1.00 profit as long as prices remained the same. As traders take advantage of the arbitrage opportunity, buying pressure in the cheaper market and selling pressure in the expensive market brings the markets in line, resulting in correct relative prices. For similar, but not substantively identical products, these correct relative prices are also expected. However, any substantive differences in the products create some risk that variations may occur or persist. The expectation that related products exhibit correct relative prices results in a strong correlation between prices. This creates the potential to manipulate the related products for a profit. This potential arises when, in the short run, transactions of the same size affect prices in the two markets differently. One factor that distinguishes between markets is relative liquidity. If a market involved a much larger daily transactional volume and a greater number of buyers and sellers relative to another market, the price impact of individual trades might be less in the first market. To take advantage of the different impact, a trader could first take a long (or short) position in the market with greater liquidity. A long position would rise in value as the relevant gas prices rise, while a short position would rise in value as those gas prices fall.10 The trader could then attempt to increase (or decrease) the
9See The Relative Pricing of High Yield Debt: The Case of RJR Nabisco Holdings Capital Corporation,” R. Dammar, K. Dunn, and C. Spatt, American Economic Review, Vol. 83, Issue 5 (Dec. 1993) pp. 1090-1111. 10A “long position” is a financial stake that increases in value when the price level or quoted rate of an asset, index, or product rises. A “short position” is a financial stake that increases in value when the price level or quoted rate of an asset, index, or product falls. A “short sale” is a short position that arises from the sale of a product not owned by the seller. Here, the seller borrows and sells another’s asset with an obligation to return the asset. To close the short sale, the seller buys back the same

Chapter IX
Docket No. PA02-2-000 Price Manipulation in Western Markets IX-7
price of the product in the less liquid market in order to increase (or decrease) the price in the related more liquid market, benefiting the trader’s position. On a net basis, the trader would profit from the manipulation strategy if the absolute value of the gains in the more liquid market exceeds the losses in the less liquid market. The necessity for relative differences in liquidity is illustrated in a case where a market exists for a single asset in which purchases and sales affect the trading price. In this market, the trader can push up prices with additional purchases; however, when he attempts to realize profits at the higher prices, his sales depress the price, eliminating his ability to generate a positive return through the manipulation. This emphasizes the importance of markets with different liquidity. In the presence of two assets with different price sensitivities, price manipulation is possible under the following conditions: First, we suppose that the change in the value of the financial derivative product is sensitive to changes in the value of the physical spot product (e.g., changes in the price of the physical spot product affect the market value of the derivative instrument as a consequence of the correlation between the two). Second, the market for the physical spot product is less liquid than the market for the associated financial derivative instrument (i.e., there is a greater price impact for a given purchase of the physical spot product than there would for the associated derivative security). Under these assumptions the loss from manipulating the physical price (due to the direct price impact) would be less than the potential profit on the derivative because of the difference in depths between the two markets and the ability to implement a large-scale futures trade. As this discussion suggests, the physical spot and derivative instruments are correlated, and the spot market has less depth than the market for the derivative security, thus generating the ability to manipulate the physical spot market to profit in the financial derivatives markets.11 Interesting perspectives about these features are included in the depositions of Enron’s natural gas traders. The trader that evidence indicates planned the manipulation stated in a deposition that:
“ ...there tends to be more of a correlation between people watching the Henry Hub than any other location because that is the physical delivery point of the [NYMEX] futures contract.
asset and returns it to the owner. The short sale is profitable if the price of the asset falls, allowing the short seller to buy back the asset at a lower price. 11Futures Manipulation with “Cash Settlement,” P. Kumar and D. Seppi, The Journal of Finance, Volume 47, Issue 4 (Sep. 1992), pp. 1485-1502 provides a formal analysis of the manipulation of a futures contract in this manner.

Chapter IX
Docket No. PA02-2-000 Price Manipulation in Western Markets IX-8
So people watch that much more often than they watch any other point in the United States.” 12
Of course, the correlation reflects the settlement procedure for the futures contract. Another trader, who worked on the same team as the above trader, provided further detail on the correlation of the Henry Hub next-day physical market and the NYMEX futures contract. When asked, “in your expertise as a gas trader, how large do you expect that correlation to be, based on your historical knowledge of correlations between the [NYMEX and the Henry Hub spot market]?”, he stated:
“I am not a statistician, but I would think that it’s probably higher than 80 percent.”13
Another element necessary to the manipulation is that the financial derivatives markets must have greater liquidity than the physical markets. The relative illiquidity in the physical market provides the trader with the opportunity to push the price up (or down) with his purchases (or sales). The liquidity of the financial market allows the trader to take a relatively larger position in that market without pushing prices up or down when entering or exiting that market. The financial markets are generally known to be far more liquid than the spot physical markets. Regarding the issue of relative liquidity, one Enron trader who worked on the team that manipulated the Henry Hub next-day market stated:
“The volume of cash that is trading is insignificant compared to the amount of futures contracts that are trading.”14
The questioner then asked, “So you would say that the NYMEX futures market is far deeper or more liquid than [the Henry Hub next- day market]?” The trader responded:
“Extraordinarily.”15 12For the analyses provided in this chapter, Staff primarily used data extracted from Enron databases. Staff also used data provided directly by Enron to FERC in various electronic and printed formats. Other than data, Staff primarily discovered the reported information from interviews and depositions with natural gas traders and managers and from discovery provided by Enron. Because of ongoing investigations by other agencies, the confidential and proprietary nature of information provided in discovery, and the forward-looking nature of this investigation, Staff recommends that the Commission not provide sources for the information generated through interviews and depositions at this time. 13Id. 14Id. 15Id.

Chapter IX
Docket No. PA02-2-000 Price Manipulation in Western Markets IX-9
These elements provide the foundation for the manipulation of the natural gas physical markets in order to generate net positive returns by relatively larger investments in the financial markets.
The General Strategy of Manipulating the Financial Markets Through Trading in the Physical Markets
Overview of Manipulation Strategies The relationship between derivatives transactions and the underlying physical products provides opportunities to profitably manipulate the natural gas markets. During the investigation, Staff recognized trading methods used to manipulate the physical markets to profit in the financial markets. A number of variations are described in the following paragraphs. These variations do not exhaust the possibilities but are intended to provide a general framework to help the reader understand the actual manipulation that took place.
Strategy To Profit From Upward Movement in Natural Gas Prices In the first and most straightforward example, a trader enters a relatively large long position in natural gas financial derivative contracts that will settle in the near future (within the month). This position reflects a “bet” that the expected price of natural gas will rise. Once the large position is in place, the trader aggressively purchases physical natural gas in the spot market, causing an actual increase in the spot price for natural gas and increasing the expected price of gas in the near future as well. The change in expected future prices causes a rise in the market value for financial derivative contracts settling on or near those future dates. To be profitable, it is essential that the trader place a larger position in the financial market compared with purchases in the physical market. As long as the trader obtained a large enough long position (a large enough “bet” on rising prices) prior to the physical purchase of gas, profits from the long position should exceed losses from buying the physical gas aggressively to push up prices. Once prices are lifted, the trader must close out or neutralize the long position in financial derivative contracts by settling the contracts or by entering offsetting short financial transactions. Once the trader realizes

Chapter IX
Docket No. PA02-2-000 Price Manipulation in Western Markets IX-10
profits, the physical long position is reduced to match actual needs. The sale of gas necessary to reduce the position creates downward price pressure, just as the initial purchase of the gas created upward price pressure. This may cause the trader to sell the physical gas at a loss. However, the loss is expected to be more than offset by profits in financial derivative markets, where the desk manager held relatively larger positions.
Additional Profit Potentially Yielded From Cornering the Market As discussed above, when selling the physical spot gas the trader will likely push down the price and potentially sell the gas at a loss. However, in some cases, the trader attempts to benefit from “cornering the market.” The trader just purchased a large amount of the gas available in the next-day physical market. That trader may attempt to extract monopoly profits by demanding a premium from those who need the gas. The trader would attempt to do this by selling gas at a premium, late in the trading day, to purchasers who are unaware of the manipulation. This would presumably defer the expected drop in prices to a point after the purchasers are satisfied. Earlier, as prices were rising, those purchasers sold gas into the market and expected to buy the gas back cheaper later in the day. However, late in the trading day, those who sold gas that they needed or those who delayed purchasing due to the high prices might be willing to purchase the gas at a premium if they fear that prices will not fall by the end of the trading day and if they have no reasonable alternatives to secure physical gas supplies (such as withdrawing gas from storage or drawing extra gas from the pipeline, which creates an imbalance and potentially generates imbalance penalties). These traders might be willing to purchase gas at premium prices because of the potential that the price of gas will not fall before the trading day ends, to avoid penalties, to run generators, or to fulfill unavoidable delivery obligations.
Strategy To Profit From Downward Movement in Natural Gas Prices An opposite strategy can be executed with the goal of pushing down prices. The trader can enter a short position in natural gas financial derivatives that will settle in the near future. Following the placement of the short position, the trader sells natural gas in the spot market, which pushes down the spot price. The lower spot price is expected to reduce the expected gas prices for delivery in the near future. Assuming this happens, as the price goes down, the value of the short derivative position rises. To realize profits, the trader would close out or neutralize the short financial position by settling the financial contracts or by entering new, offsetting long financial transactions.

Chapter IX
Docket No. PA02-2-000 Price Manipulation in Western Markets IX-11
After closing the derivative position, the trader purchases back the physical gas to cover his short physical position. The purchase of the physical gas may generate a loss, however, if the trader executed a large enough financial derivative position to generate profits that exceed these losses; the strategy then remains profitable on a net basis. This strategy underscores the point that profitable market manipulations can involve what, in isolation, appear to be a beneficial drop in the price of physical gas.
An Alternative Variation in Which the Trader Gains Profits From the Downward Movement in Prices The first manipulation strategy described above, in which the trader attempts to profit from rising prices, can also generate profits from the downward motion of prices following the trader’s aggressive purchase of gas. When the trader pushes up the physical gas price by buying physical gas, he expects that prices will reverse after the manipulation ceases. In addition, if the trader did not obtain a short physical position prior to the manipulation, he will need to sell the physical position he acquired. This selling pressure will enhance the downward price movement following the manipulation. In this variation, the trader does not need to enter a derivative position at the outset. Instead, the trader first purchases physical spot gas aggressively to push up the spot price. Then, while prices are high, the trader enters or increases short financial positions. Once the short position is in place, the trader sells the long physical position, thereby causing prices to decrease again and increasing the value of the short financial position. The apparent benefit of this strategy is that the trader can increase the derivative positions after or while affecting the market prices of the physical product. This provides the trader with the opportunity to test market strength and gain information regarding the market’s potential response. For example, the trader might learn that there is no interest in buying at certain levels, outside of the trader’s own purchases, verifying the increased potential for downward pressure when the trader stops buying and especially when the trader sells.

Chapter IX
Docket No. PA02-2-000 Price Manipulation in Western Markets IX-12
The Central Desk Manipulation
Enron’s central desk was primarily responsible for trading gas and making markets for locations in the central United States. However, that desk was not responsible for making markets at the Henry Hub; Enron gas traders were generally allowed to trade all locations in North America. According to information gained through interviews, depositions, data analysis, and document review, the desk manager apparently performed a market test to move Henry Hub natural gas prices and, soon after, executed an actual market manipulation. The market test occurred on June 14, 2001 and the market manipulation occurred on July 19, 2001. On both occasions, the desk manager manipulated the price of the Henry Hub next-day physical gas product. The manipulations differed in approach and resulted in somewhat different outcomes. The manipulation relates to the strategy described above. Staff believes the manipulation was intended to first increase the market price of natural gas at the Henry Hub, then enter short financial positions while the market was artificially high, and then push the market down. In an interview, an Enron trader admitted to a manipulation of the Henry Hub market to profit in the derivatives markets in the spring of 2001. Details of that manipulation and its design arose from additional interviews and depositions. An analysis of the Enron database isolated June 14, 2001 and July 19, 2001 as the dates of the potential manipulations. The July 19, 2001 manipulation was further supported by additional corroborating evidence, including a transfer of funds that, according to the depositional testimony of Enron traders, related to the manipulation. The patterns of the manipulations revealed in the data are further supported by the unusual role changes and actions of particular Enron traders. Staff first discusses these role changes and actions and then reports the manipulations in detail.
Unusual Circumstances Surrounding the Trading Activity Because of the desk manager’s regional trading desk management position and the manner in which he executed the trades, these transactions are highly suspect. During the market experiment and the manipulation, the desk manager traded a next-day physical product, an unusual act for a person in his position. In the normal course of
Chapter IX
Docket No. PA02-2-000 Price Manipulation in Western Markets IX-13
business, the trades would have been executed by someone in a subordinate position. Moreover, the next-day physical product of one region typically would not be transacted by traders making markets or scheduling gas for a different region. The desk manager did not trade the physical product to satisfy actual physical needs. During the June 14, 2001 market experiment, within the trading day, he first sold and then bought 360,000 MMBtu. The resulting net purchase of physical gas amounted to zero, reflecting no actual need for gas by the end of the day. A very liquid financial derivatives market existed for exactly the location in which the desk manager chose to trade physically. If he had intended to take a position in anticipation of a value change for the Henry Hub location, the far more liquid August OTC swap (NYMEX look-alike swap) would have been the likely vehicle because of its financial settlement, liquidity, and direct dependence on the Henry Hub location. Transactions of the size traded by the desk manager would not have affected the OTC swap price by as much, or at all, because of the greater depth or liquidity of that market. On July 19, 2001, the date of the actual manipulation, the desk manager took a relatively large long position in the Henry Hub physical markets and then completely reversed the position a short time later, reflecting a need to sell gas by the end of the day. According to depositional testimony, on July 19 the desk manager took this position while unofficially acting as market maker for the Henry Hub. The market maker is the Enron trader assigned to always quote both a bid and an offer price, representing Enron’s willingness to always buy or sell gas during market hours. The desk manager took over the chair of the Henry Hub next-day physical market maker and executed his transactions directly with EOL counterparties. Other Enron traders testified that the desk manager’s action was unusual; in addition, the temporarily displaced market maker was officially supervised by a different desk manager. The actions of the desk manager on July 19 generated losses in the book of the market maker whom he unofficially displaced. Depositional testimony revealed that a transfer of $86,000 to the market maker on the day of the manipulation covered the losses to the market maker generated by the desk manager. Trading large amounts at once or, alternatively, trading many times over a short period, can create supply/demand imbalances and can cause executions at relatively bad prices. During both of the manipulations, the desk manager traded many times and in a short time

Chapter IX
Docket No. PA02-2-000 Price Manipulation in Western Markets IX-14
interval. He could have traded at a slower pace, allowing the market to absorb the additional supply or demand. However, on June 14 he purchased a large amount of gas in a very short period and on July 19 purchased and sold relatively larger amounts at an equally fast pace, generating losses on both days by this manner of trading.
The June 14, 2001 Market Test During a search for what turned out to be the July 19, 2001 manipulation described in the next section, Staff discovered an earlier apparent market experiment or test that involved smaller physical volumes and relatively small financial derivative positions. In executing this test of the next-day physical Henry Hub price, the desk manager sold 360,000 MMBtu slowly on the EOL trading platform during the earlier half of the trading day, obtaining a net short position of 360,000 MMBtu. He then purchased the same amount in just 19 minutes, driving the price up significantly. The NYMEX price rose along with the next-day physical gas price. For a short period following the desk manager’s purchases, an Enron trader assigned to that desk manager entered short positions that would profit from a drop in the NYMEX swap price. Staff believes that the Enron trader may have placed his short position with the expectation that prices would return to premanipulation levels after the desk manager ceased generating the appearance of excess demand. Staff views the physical and financial trades as suspicious because of the involvement of these traders in the July 19, 2001 manipulation and concerns regarding the actions of the desk manager described above. Staff views the June 14, 2001 manipulation as a market test or learning experience. Staff found only a small amount of financial derivative transactions acquired in a manner consistent with foreknowledge that a manipulation would occur. It is Staff’s opinion that the manipulation may have been a test of the market or a learning experience for the manipulators. Staff believes that the market test was profitable, but generated minimal profits. The trader (trader 1), whose position changes were consistent with participation in the manipulation and who claimed to plan the strategy, earned approximately $55,025 in financial trading profits while the losses generated from the physical manipulation amounted to $36,500, resulting in net profits of $18,525. According to depositional testimony, trader 1 claimed to have devised the scheme but denied implementing the strategy. Trader 1 worked directly for the desk manager.

Chapter IX
Docket No. PA02-2-000 Price Manipulation in Western Markets IX-15
The details of the June 14 market test are as follows.16 On June 14, 2001, between 7:39 and 9:04 a.m., the head of the Central desk (the desk manager), in 12 separate transactions, sold a total of 360,000 MMBtu of Henry Hub next-day physical gas to the EOL market maker for that product. During this period the price of the next-day natural gas fell slightly, from $3.93/MMBtu to $3.91/MMBtu. The desk manager accumulated a net short position of 360,000 MMBtu of Henry Hub next-day physical gas during this time. Between 9:42 and 10:01 a.m., the desk manager completely reversed the position by purchasing a total of 360,000 MMBtu in eight transactions. As the desk manager aggressively bought back the gas he had sold, the market price rose significantly. His first purchase of 50,000 MMBtu at 9:42 cost $3.97/MMBtu and his last purchase in the 19-minute timeframe cost $4.06/MMBtu. The desk manager lost a total of $36,500 executing these trades.17
Figure IX-118
The Relevant Hours: Comparison of Spot and Short Term Henry Hub Based Physical and Financial Product Prices on June 14, 2001*
3.85
3.9
3.95
4
4.05
4.1
4.15
7:12 8:09 9:07 10:04 11:02 12:00 12:57
Time
Pric
e ($
per
MM
Btu
)
June Gas Daily Financial July OTC Swap (NYMEX look-alike) Henry Hub Next Day PhysicalDesk Manager Sells Physical Desk Manager Buys Physical
*Larger sized points reflect that Desk Manager's average purchase size equalled 45,000 MMBtu and Desk Manager's average sale size equalled 30,000 MMBtu, while non-Desk Manager trades averaged 13,806 MMBtu.
16For a detailed description of trader 1’s financial trading positions and profits for the June 14, 2001 market testing manipulation, see Appendix IX-A. 17Average sale price less average purchase price multiplied by the total volume purchased (which equaled the total volume sold exactly) equals $36,500. 18With regard to all figures in this chapter, color prints are necessary to fully understand the details of the manipulations.
The Relevant Hours: Comparison of Spot and Short-Term Henry Hub Based Physical and Financial Product Prices on June 14, 2001*

Chapter IX
Docket No. PA02-2-000 Price Manipulation in Western Markets IX-16
Although it took 1 hour and 25 minutes to obtain the short position, it took only 19 minutes to reverse the short position. After 10:01, the price of the next-day gas increased further, to a high of $4.10/MMBtu, before the last trade at 10:45 at the price of $4.06/MMBtu. Trader 1 was positioned to profit from this market test. Trader 1 entered into a short financial derivative position that would profit from a downward movement in prices. He then substantially increased a short position in OTC swaps during the brief time period when the Henry Hub physical markets pulled up the related OTC swap transaction prices. Trader 1 then closed most of the position at a point where the market price for the OTC swap briefly jumped up, reducing the profitability of trader 1’s positions. Trader 1 continued to hold the remainder of his position through the close of trading on EOL, when the OTC swap traded down to near the opening price for the day, thus increasing trader 1’s profits.
Figure IX-2
Comparison of Spot and Short Term Henry Hub Based Physical and Financial Product Prices on June 14, 2001*
3.85
3.9
3.95
4
4.05
4.1
4.15
3:30 4:27 5:25 6:22 7:20 8:18 9:15 10:13 11:10 12:08 13:06 14:03 15:01 15:58 16:56 17:54 18:51 19:49 20:46
Time
Pric
e ($
per
MM
Btu
)
June Gas Daily Financial July OTC Swap (NYMEX look-alike) Henry Hub Next Day PhysicalDesk Manager Sells Physical Desk Manager Buys Physical
*Larger sized points reflect that Desk Manager's average purchase size equalled 45,000 MMBtu and Desk Manager's average sale size equalled 30,000 MMBtu, while non-Desk Manager trades averaged 13,806 MMBtu.
The market test generated an insignificant amount of profit. However, in terms of moving the market price, the scheme proved successful. More importantly, this scheme preceded a greatly expanded scheme that occurred about 1 month later and generated significant profits.
Comparison of Spot and Short-Term Henry Hub Based Physical and Financial Product Prices on June 14, 2001*

Chapter IX
Docket No. PA02-2-000 Price Manipulation in Western Markets IX-17
The July 19, 2001 Manipulation Overview The July 19, 2001 market manipulation is most similar to the strategy described in this chapter in the section titled “An Alternative Variation in Which the Trader Gains Profits From the Downward Movement in Prices.” The July 19 manipulation involved the desk manager, a number of traders, and the EOL Henry Hub next-day gas market maker. A number of traders entered relatively large short positions in the financial markets through OTC swaps and Gas Daily financial swaps. These traders continued to increase the short positions throughout the initial phase of the manipulation, which was the period when the EOL market maker (who was, at times, the desk manager) quickly and steadily raised prices on EOL, resulting in the purchase of a very large amount of next-day physical gas. This purchasing caused prices in the financial markets to rise, but by a lesser amount. The financial traders stopped increasing their short positions near the end of the EOL market maker’s buying streak at a point when the EOL market maker stopped raising prices and began to hold prices steady at the high levels. Once the EOL market maker leveled out prices, the OTC swap began to fall. The EOL market maker then began to lower the prices and sold a very large amount of gas at rapidly falling prices. The falling of the physical price then further pushed down the OTC swap price, generating significant profits for the financial traders. These profits greatly exceeded the losses that were generated from the impatient buying and selling of the physical gas. The physical volumes associated with the above physical manipulation were as follows. Prior to the manipulation, the market maker first accumulated a net short position of 124,613 MMBtu. Then the desk manager, acting as the market maker, drove up the price of gas by buying physical gas at higher and higher purchase prices, generating a net long position of 587,237 MMBtu. This reflects that Enron’s net position changed by 711,850 MMBtu. The selling streak that followed resulted in a net short position of 315,191 MMBtu, or a net change of 902,428 MMBtu. The larger amount of sales on a net basis indicates that Enron intended to ultimately push the price down. According to the financial data, at least eight traders from the Central and East desks (eight traders) positioned themselves to profit from the manipulation in a very timely manner. In the prior June 14, 2001

Chapter IX
Docket No. PA02-2-000 Price Manipulation in Western Markets IX-18
market testing manipulation, the desk manager traded gas with the EOL market maker. In the July 19, 2001 manipulation, the desk manager took direct control of the EOL Henry Hub next-day physical market by taking over the market maker function and posting bids and offers directly, on behalf of EOL, and in the name of the displaced market maker.19 This direct control of the price setting function provided the desk manager with an ability to manipulate the market more precisely. Just after 9:20 a.m., the desk manager began to raise the price of Henry Hub next-day physical gas. During this time, the eight traders significantly increased or obtained net short financial derivative positions. When the desk manager stopped raising the purchase price for a short period and then began lowering the price, the OTC swaps began to drop (reflecting downward movement in the NYMEX). The desk manager then began to aggressively sell off the gas he had just acquired, strengthening the downward movement. By the end of the day, Enron had obtained a significantly large net short position as EOL continued to sell more physical gas on a net basis after already having sold off the net long position. The OTC swaps and the Gas Daily balance-of-the-month contracts fell significantly past the opening price, generating profits for those traders who entered or maintained short positions. Details of the July 19, 2001 Market Manipulation The day began with the physical book slowly growing short. In other words, by 9:22 a.m., Enron sold 124,613 MMBtu more of the next-day gas than it had bought. During this period, which lasted almost 2 hours, the price of gas rose a net $0.01/MMBtu from an opening first trade of $3.02 to $3.03/MMBtu at 9:22 a.m.
19According to depositional testimony and verified by electronic financial records, the desk manager agreed to cover the losses that he would generate in the name of the market maker. See footnote 11.

Chapter IX
Docket No. PA02-2-000 Price Manipulation in Western Markets IX-19
Figure IX-3
July 19, 2001 Morning Hours: EOL Henry Hub Next Day Physical Market Maker Activity and EOL Based Transaction Prices for Related Financial Products
2.9
2.95
3
3.05
3.1
3.15
7:55:12 8:24:00 8:52:48 9:21:36 9:50:24 10:19:12 10:48:00
Time
Pric
e ($
per
MM
Btu
)
August OTC Swap (NYMEX look-alike) July Gas Daily EOL Market Maker Buys Physical EOL Market Maker Sells Physical At 9:22, the selling ended and the market maker began a buying streak. The market maker raised the price at which it was willing to buy the next-day gas. Many sellers came in to take advantage of the increasing prices. The EOL market maker offered such a generous price that, in just 19 minutes, the next-day gas platform purchased gas 43 times while selling gas only a single time. The price peak was reached at 9:35, just 13 minutes after the buying streak began. From 9:35 through 9:40, the next-day gas bounced along a ceiling of $3.10/MMBtu, creating an apparent top. The NYMEX crept upward from $3.00 to $3.02 from 9:22 through 9:36, but then began to decline a few minutes after the ceiling at $3.10/MMBtu had formed. A very interesting phenomenon occurred at this point. The EOL market maker began reducing the price at which it purchased gas, but continued to only buy gas. By reviewing the trading behavior in Figure IX-3 in detail, Staff identified this strange pattern in which the EOL market maker drove the price up by offering a strong bid price and then creating a top, and then began a downward slide, all while selling gas only once.20 20See the section below for a more detailed description of the physical manipulation.
July 19, 2001 Morning Hours: EOL Henry Hub Next-Day Physical Market Maker Activity and EOL-Based Transaction Prices for Related Financial Products
Chapter IX
Docket No. PA02-2-000 Price Manipulation in Western Markets IX-20
Following this unusual buying behavior, at 9:41 the market maker ended the buying streak and began strongly selling gas. Just prior to the selling streak, the market maker held a net long position in the next-day gas of 587,237 MMBtu. During the market maker’s buying streak, prices in the financial markets followed the physical markets upward but to a lesser extent. This emphasizes the unusual and puzzling nature of the market maker’s behavior; he continued to buy the physical product even as it became extremely expensive and disconnected from the financial product. However, the EOL market maker now had a huge store of physical gas that it could sell to move the physical price down. During his deposition, trader 1 denied manipulating the market but claimed to have devised the manipulation strategy consistent with the facts of the July 19, 2001 manipulation. With regard to that strategy, trader 1 stated:
“[W]e were trying to find out if this strategy would work and if Enron would make money if this strategy worked. So if prices went up and [the market maker] would make money by people buying the gas back at a higher price, if they didn’t go up then she had to sell it. There is a chance you could sell OTC [NYMEX] swaps and benefit from the downward movement in the Henry Hub physical and that would offset the losses of selling the actual physical at a lower price.”21
In the next 8 minutes, by 9:49, the market maker sold gas 31 times in a row without buying gas once. The price of the next-day gas at this point fell to $2.935/MMBtu. By 9:54, through these sales, the market maker had reversed the intraday long position to a short position. The price for the next-day gas at this time equaled $2.915/MMBtu. More important for the success of the manipulation, the NYMEX would need to follow and it did so. The OTC swap traded at $2.925/MMBtu at 9:54, which was down from the peak of $3.015 during the earlier part of the manipulation. Until 10:42, the last trade of the day, the market maker continued to be a net seller of gas. By the last trade of the day, the next-day gas traded for $2.905/MMBtu and the EOL next-day gas market maker closed for the day with a net short position of negative 315,191 MMBtu. At 10:42, the OTC swap traded at $2.945/MMBtu. The OTC swap continued to trade in a range from $2.915 to $2.96/MMBtu. At 2:30, the end of the NYMEX futures exchange trading day, the OTC swap traded at $2.935/MMBtu.
21See footnote 11.
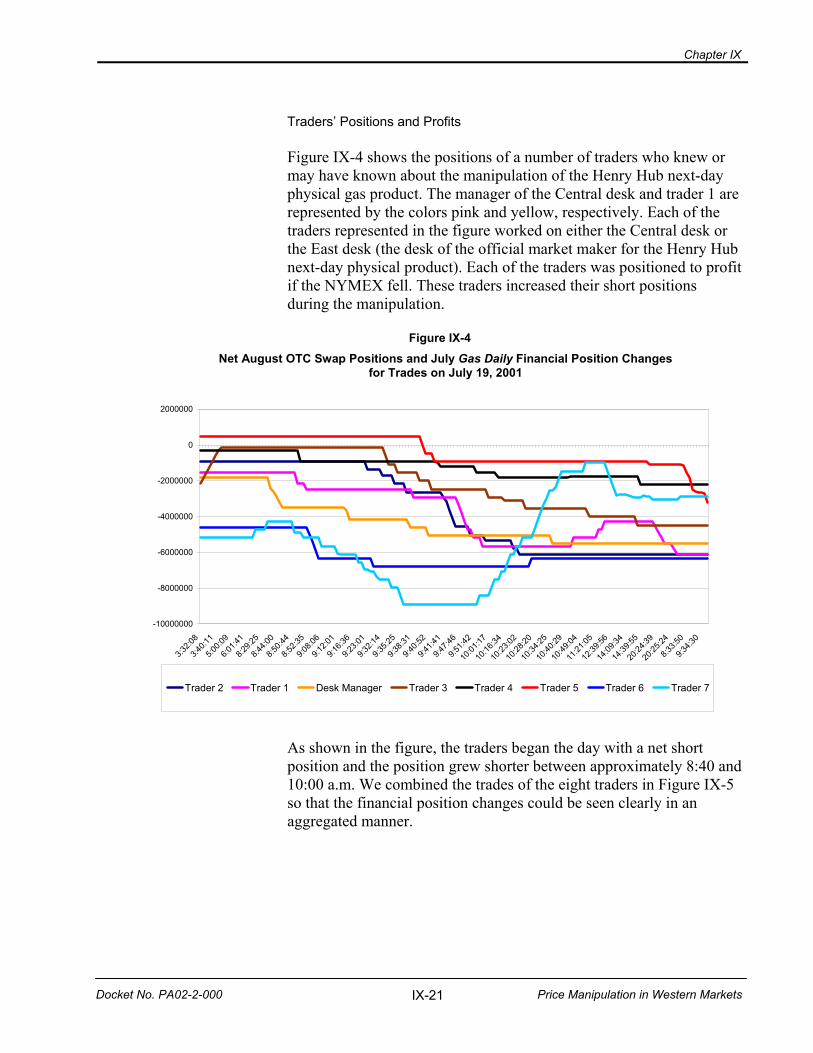
Chapter IX
Docket No. PA02-2-000 Price Manipulation in Western Markets IX-21
Traders’ Positions and Profits Figure IX-4 shows the positions of a number of traders who knew or may have known about the manipulation of the Henry Hub next-day physical gas product. The manager of the Central desk and trader 1 are represented by the colors pink and yellow, respectively. Each of the traders represented in the figure worked on either the Central desk or the East desk (the desk of the official market maker for the Henry Hub next-day physical product). Each of the traders was positioned to profit if the NYMEX fell. These traders increased their short positions during the manipulation.
Figure IX-4
Net August OTC Swap Positions and July Gas Daily Financial Position Changes for Trades on July 19, 2001
-10000000
-8000000
-6000000
-4000000
-2000000
0
2000000
3:32:0
8
3:40:1
1
5:00:0
9
6:01:4
1
8:29:2
5
8:44:0
0
8:50:4
4
8:52:3
5
9:08:0
6
9:12:0
1
9:16:3
6
9:23:0
1
9:32:1
4
9:35:2
5
9:38:3
1
9:40:5
2
9:41:4
1
9:47:4
6
9:51:4
2
10:01
:17
10:16
:34
10:23
:02
10:28
:20
10:34
:25
10:40
:29
10:49
:04
11:21
:05
12:39
:56
14:09
:34
14:39
:55
20:24
:39
20:25
:24
8:33:5
0
9:34:3
0
Trader 2 Trader 1 Desk Manager Trader 3 Trader 4 Trader 5 Trader 6 Trader 7
As shown in the figure, the traders began the day with a net short position and the position grew shorter between approximately 8:40 and 10:00 a.m. We combined the trades of the eight traders in Figure IX-5 so that the financial position changes could be seen clearly in an aggregated manner.
Net August OTC Swap Positions and July Gas Daily Financial Position Changes for Trades on July 19, 2001

Chapter IX
Docket No. PA02-2-000 Price Manipulation in Western Markets IX-22
Figure IX-5
OTC Swap Trading
-40,000,000
-35,000,000
-30,000,000
-25,000,000
-20,000,000
-15,000,000
-10,000,000
-5,000,000
0
3:32:0
8
5:47:4
5
6:41:2
2
7:25:1
1
8:01:0
4
8:20:2
0
8:39:3
6
8:51:3
3
8:54:2
4
8:57:5
9
9:07:1
4
9:23:0
1
9:35:1
3
9:39:3
3
9:44:3
3
9:50:5
3
9:55:3
5
10:03
:48
10:20
:09
10:33
:20
10:59
:57
11:51
:16
13:02
:53
13:44
:49
14:07
:55
14:42
:35
17:03
:58
Time
MM
Btu
2.85
2.9
2.95
3
3.05
3.1
3.15
$/M
MB
tu
Aggregated Positions for Financial Traders OTC Swap Price Staff calculated that these eight traders generated a total profit of $3,181,756 during the day from their net short positions in the August NYMEX contract and the balance-of-the-month July Gas Daily financial swap.22 Regarding the losses that accrued on the physical side, the EOL market maker for the physical Henry Hub next-day gas product lost approximately $86,000 during the manipulation, but was made whole by a payment from the desk manager.23 22Deciding where profits continue to arise from a manipulation and where they cease to arise is a difficult and somewhat arbitrary task. The profit calculation values existing positions at the first transaction price posted for the day. The calculation values all positions that remain open at the end of the day at the price of the last transaction of that day. Other than considering existing positions at the start of the day, profits were calculated in the manner described in Appendix X-A for the June 14, 2001 manipulation. 23See footnote 19.

Chapter IX
Docket No. PA02-2-000 Price Manipulation in Western Markets IX-23
Understanding the Market Maker’s Physical Transactions The description of the July 19, 2001 trading day revealed a strange pattern in which the market maker began to strictly purchase gas and dictate the upward movement of the price, the price ceiling, and the initial downward movement. Then through sales, the market maker dictated the larger downward movement of the price. Finally, at the end of the trading day, the market maker maintained a low price through pricing with a bias toward sales by the market maker. The market maker’s function is to make a market in a product by putting out both an offer to buy gas (bid price) and an offer to sell gas (ask or offer price). The market maker generates profit from a spread between the bid price and the ask price. The ask price should always exceed the bid price because for the market maker to be profitable, he needs to sell gas at prices that exceed the price at which he is willing to buy gas.24 The market maker generally seeks to post a spread that values the product fairly. As supply and demand change, the market maker modifies the spread. For example, if more buyers come to the market than sellers, the market maker raises the price of the product to reduce the demand to buy the product by making it more expensive. If the market maker fails to adjust the spread to raise the price, the market maker will sell too much gas and fall short. To buy back the gas, the market maker will have to raise the price at which he is willing to buy gas, unless market conditions change. This would generate a loss. In illiquid markets, market makers will tend to set wider spreads to generate larger returns in return for taking on greater risk that the market maker will not be able to find buyers and sellers at all times and therefore may need to hold product for longer periods than he would like. With this understanding of market making, consider the market maker’s trading on July 19, 2001, as seen in Figure IX-3. In Figure IX-3, the market maker’s actions are intentional. This is not a case in which the market maker passively failed to adjust prices given changing market conditions. In this case, the market maker raised the price significantly, attracting more and more sellers to the market. The market maker is informed that he or she is the cause of the market price change, but the others are uninformed. They might assume that a large buyer (or buyers) is pushing up the price of gas.
24If the bid price exceeded the ask price, it would be profitable for traders to buy from the market maker and immediately sell back to the market maker. Therefore, whenever transactions do not occur, the ask price must strictly exceed the bid price.

Chapter IX
Docket No. PA02-2-000 Price Manipulation in Western Markets IX-24
The market maker is offering a price that is so far beyond the market’s supply and demand conditions that traders only sell to the market maker for an extended period of time. Yet, interestingly, the price continues to rise. Next, the price begins to form a top where sales to the market maker continue for about 5 minutes, at or near $3.10/MMBtu. The market maker could have chosen to raise the price higher if he or she were willing to pay the price to the incoming sellers. The market maker, after forming the top, chose to bring the price down. The data reflect that the market maker did not want prices to fall too quickly, so while prices were still above the fair market price, the market maker offered a bid that continued to solely attract sellers. Finally, as the price fell in a series of seven transactions from $3.10/MMBtu to $3.055/MMBtu, the market maker began to offer an ask price that solely attracted buyers. At this point the market maker sold the large amount of gas it had just purchased at steeply falling prices. The willing buyers began to come in at $3.015/MMBtu. The market maker sold off far more gas than he or she had acquired. The peak intraday volume of gas purchased by the market maker amounted to 587,237 MMBtu. By 9:54, the price had fallen to $2.915 and the market maker’s intraday MMBtu position fell to just below zero. By the last trade, the market maker was short 315,191 MMBtu and the last physical trade was at $2.905/MMBtu, with a low of $2.89/MMBtu.
Description of EnronOnline and Its Main Features
In this section, Staff discusses the design of EOL and how it facilitated manipulation of the market, the economics of trading, alternative trading systems, and some forward-looking recommendations concerning energy trading mechanisms.25
25This section was prepared by FERC Staff with the assistance of outside consultant Chester Spatt, Mellon Bank Professor of Finance, Graduate School of Industrial Administration, Carnegie Mellon University. Comments and contributions were also provided by Professor Hendrik Bessembinder, Blaine Huntsman Presidential Chair in Finance, David Eccles School of Business, University of Utah.

Chapter IX
Docket No. PA02-2-000 Price Manipulation in Western Markets IX-25
The EOL Trading Platform
The EOL system was the first broadly successful Internet-based system for trading energy products. Enron established this trading platform so that it could serve as market maker in a broad range of physical and financial energy instruments. During the trading hours established for specific products, EOL offered (two-way) bid and ask quotes over the Internet. The quotes could be executed over the Internet directly by those entities with an EOL trading account. Outside traders continuously observed the posted two-sided quotes at specified volumes. These traders could instantaneously execute transactions at those quoted prices. As this suggests, the EOL platform was a one-to-many platform in which many counterparties (customers) were able to access the liquidity or apparent liquidity that Enron supplied. The EOL system allowed the Enron market maker in a particular product to set up a schedule of prices (known as the “stack”) from which customers could execute buy or sell orders. The customers can only see the top of the stack, which shows the current quoted bid and ask prices. Using a tool called the “stack manager,” EOL is set up for Enron to be able to easily modify the stack that it offers on both sides of the market. For example, EOL may have offered gas at a particular location for $4.00 ask and $3.95 bid. In this case, an EOL customer could buy gas at $4.00 from EOL and sell gas to EOL at $3.95. As customers executed transactions on EOL for a particular product, the quoted ask and bid prices would be replaced with the next set of prices and quantities found in the stack. Different portions of the stack would be used, depending on whether an EOL customer bought from EOL (“lifted the offer”) or sold to EOL (“hit the bid”). The Enron market maker specified the total volume of a particular product that he would be willing to buy or sell at the scheduled prices. The market maker could continuously alter the stack in response to both market information and the arrival of orders. Alternatively, the market maker could set a function that increased prices by fixed increments as customers purchased gas and decreased prices by fixed increments as customers sold gas. For example, if EOL quoted an ask price of $4.00 for gas at a particular location and a bid price of $3.95, the EOL market maker could set a fixed increment at plus or minus $0.05. If this were the case, then if two customers bought gas consecutively, the ask price would rise to $4.05 after the first buyer lifted the offer of $4.00 (and the bid price would rise to $4.00). When the second buyer purchased gas, the ask price would rise
Chapter IX
Docket No. PA02-2-000 Price Manipulation in Western Markets IX-26
to $4.10 (and the bid price would rise to $4.05) following the purchase. If a customer then sold gas while the ask price was $4.10 and the bid was $4.05, that customer would receive $4.05 for the gas he sold and the ask price and bid price would fall to $4.05 and $4.00, respectively, following the sale. If the EOL market maker had created a schedule of price changes depending on whether customers bought from or sold to EOL, it is likely that prices would rise as customers bought and prices would fall as customers sold. However, as seen in the July 19 manipulation, the EOL market maker could choose what prices to post and mislead customers regarding the state of supply and demand. The versatility of the EOL system also gave the EOL market maker the ability to automatically accommodate larger orders at less favorable prices. Large orders can potentially “walk up” or “walk down” the EOL stack established by the market maker. For example, a trader may pay a progressively higher price to purchase a large amount of a product through a series of transactions.26 Additionally, the EOL market maker could instantaneously cancel liquidity offered by the EOL platform by modifying the quoted prices to unattractive levels (setting a very high asking price and a very low bid price).
The Lack of Transparency on the EOL Platform Unlike the NASDAQ, from which timely electronic trade reports had been available to the public even prior to its transparency enhancing reforms in 1997, EOL did not offer timely reporting of executions. This means that EOL provided no data regarding recently executed transactions. Consequently, the market would not be viewed as “ex post transparent,” i.e., even after the trades, basic market information was not provided to market participants. This made it difficult for traders to judge the current state of the market and forced traders to position their orders in a somewhat “blind” context. As described above, EOL did not show the stack of prices and volumes. EOL only showed the best bid and the best offer for a specified relatively small volume of a product. This aspect of the EOL market design is similar to the former NASDAQ system, as that system lacks “ex ante” transparency. EOL did not display the potential liquidity available for orders of various sizes. The absence of both ex ante and ex post transparency made it difficult for outside traders to understand both their potential trading opportunities and how well they did on past trades. Under the EOL 26The trading patterns of Reliant at the Topock Southern California Border point, described in Chapter II, reflect the “walking up” of the price of natural gas.

Chapter IX
Docket No. PA02-2-000 Price Manipulation in Western Markets IX-27
system, Enron had complete information on past executions on both sides of the market as well as the current liquidity being offered to Enron that it has elected to not execute immediately when it does not at least match the current EOL quote. Indeed, all of this detail is known by Enron at a completely disaggregated level by counterparty. This may have made traders reluctant to provide orders for execution. The lack of information makes formulating one’s trading strategy particularly difficult. However, despite these imperfections, EOL improved market transparency (relative to voice brokers) by making continuous two-sided quotes available to all for the first time. In the EOL system the EOL market maker was asymmetrically (extremely well) informed. In this system Enron had complete information on past executions on both sides of the market (including the participants associated with each transaction) and control over future quotes. This made many traders reluctant to trade on the platform. EOL was similar to the problematic pre-1997 NASDAQ system in which all customer trades in the NASDAQ equity market were executed with dealers and the quotes displayed were the best market-maker quotes.27 Public limit orders, i.e., price-contingent orders from the public,28 that would improve the quote were not displayed in the basic EOL design and such potential liquidity could not be accessed, except by trading with Enron.
Limit Orders on EOL During the later portion of its operation, EOL accepted limit orders placed by its customers for inclusion in the EOL stack. These limit orders reflected customer willingness to provide liquidity, through offers by customers to buy or sell a product from or to Enron, at specific maximum or minimum prices and volumes not currently available on the EOL platform. These limit orders provided Enron with information on liquidity at the specified price levels by specified counterparties. When such limit orders were executed, Enron acted as the counterparty rather than matching the trade directly with another EOL customer. Effectively, all trades were still cleared using Enron as 27The inadequacy of that system and the collusion among dealers that was documented economically in “Why Do NASDAQ Market Makers Avoid Odd-Eighth Quotes?” W. Christie and P. Schultz, Journal of Finance, Volume 49, Issue 5 (Dec. 1994), pp. 1813-1840 and “Why Did NASDAQ Market Makers Stop Avoiding Odd-Eighth Quotes?” W. Christie, J. Harris, and P. Schultz, Journal of Finance, Volume 49, Issue 5 (Dec. 1994), pp. 1841-1860 led to the 1997 adoption of “order-handling rules” that facilitated the display and execution of public limit orders within a modification of the prior design as well as a $1 billion class-action lawsuit settlement. Unlike the NASDAQ system, EOL had a single market maker (Enron) as the counterparty on all trades, which is why we call it a one-to-many platform. 28A limit order to buy would specify a maximum purchase price, while a limit order to sell would specify a minimum selling price.

Chapter IX
Docket No. PA02-2-000 Price Manipulation in Western Markets IX-28
the counterparty so that the platform still essentially functioned as a one-to-many platform.29 EOL began to accept limit orders from its customers to enhance the attractiveness of its trading platform and increase the flow of information available to it by providing a vehicle for potential orders by outside traders who did not want to execute at the current prevailing price. Enron did not bypass the limit orders provided to it (e.g., it did not sell from its own account at a higher price when a limit order to sell from an outside trader existed in the EOL stack at a lower price) and would execute these orders prior to executing orders from its own book at inferior prices, i.e., the platform executed positions at more favorable prices first and followed “price priority.” The limit orders offered by outside traders provided to Enron an option to meet demands for immediate execution by others using these limit orders as a source of liquidity. The EOL market maker could also step ahead of the limit orders and trade from his own account, with the comfort that the additional demand to trade reflected in the limit orders would potentially move the price in a favorable direction. This would allow the EOL market maker to profit by positioning in the market prior to the impact on prices that the limit orders would generate when executed. These EOL customers, who provided limit orders to EOL, were not able to trade directly with one another using the platform. When matching buy and sell limit orders were provided to EOL, EOL would act as the counterparty to both. The nature of the platform’s structure, particularly the absence of transparency (both with respect to trade reporting and the lack of knowledge by outside investors of the limit order book), the effective inability of public orders to trade directly with one another, and Enron’s inherent last-mover advantage (except for orders at the automatically executed quote), all contributed to Enron’s overall advantage vis-à-vis the limit orders supplied to it.
29The caveat with this interpretation is that investors placing orders on EOL derived a benefit from public limit orders during the period they were allowed, as if the public investors are trading directly with one another.

Chapter IX
Docket No. PA02-2-000 Price Manipulation in Western Markets IX-29
The Role of EOL in Enron’s Strategy and Market Power
At a fundamental level, EOL was an important part of Enron’s business strategy. Prior to EOL, voice broker trading dominated the market. The use of the EOL platform provided a way to benefit from its willingness to make a market and supply liquidity. EOL offered a way for Enron to “market” its products, including positions that it had acquired through these trading activities. In addition, by operating a trading platform, Enron obtained considerable market information on resource flows and trader valuations from other market participants. Given Enron’s substantial overall market position, its decision to concentrate its own trading (about 25 percent of the market) through EOL (thereby dramatically reducing its involvement in the voice broker markets) changed the industrial organization of those trading markets. Its decision to substantially reduce its participation in the voice broker markets reduced the information and liquidity available there. A variety of advantages accrued to Enron from its operation of the EOL platform, many of which exploited its position as the dominant electronic platform. The platform met the need in the marketplace for an electronic platform that provided quick and easy trade executions. Through the broad acceptance of the EOL platform, EOL gained a successful first-mover advantage in which EOL was well positioned to exercise market power in the quoting process and earn rents in the form of wide spreads, or by exploiting its informational advantage. This market power could also create benefits for Enron in its ability to extract information from trading firms, both about the level of demand for different instruments and the location and distribution of various energy products (which may be useful in working to meet future unanticipated needs).30 Enron was also in a better position to capture profits in the financial derivatives markets using this information. More generally, Enron’s information advantage would be valuable in helping it assess the information content of trades and orders. Another example of the value of Enron’s information advantage is the potential assistance it provided in deciding when conditions were ripe for a market corner or manipulation or helping it implement the manipulation or corner quickly. A final example of the value of 30Analogously, one of the advantages often attributed to Michael Milken’s high-yield (“junk”) bond group at Drexel Burnham in the 1980s was its knowledge of the ownership of most high-yield bonds.
Chapter IX
Docket No. PA02-2-000 Price Manipulation in Western Markets IX-30
information to Enron is in helping it identify “stale” orders with which it could execute opportunistically. The monopoly position even increased EOL’s ability to undertake market experiments to further enhance its ability to extract information from its quoting behavior.31 Indeed, these sorts of informational advantages are particularly strong when a platform possesses a large market share. Even after the introduction of competing platforms (such as DynegyDirect and the IntercontinentalExchange (ICE)), much of EOL’s earlier monopoly advantage continued because outside traders had become familiar and comfortable with the EOL platform. The effective cost to traders of learning a new platform gave EOL a considerable first-mover advantage that continued after competing platforms arose. These switching costs and the importance of a successful platform possessing considerable liquidity act as barriers to the entry of competing platforms. Consequently, the initial advantages of being the first successful platform to introduce electronic trading continued for EOL even after it faced competing platforms (even if they had potentially superior market designs).
The Role of EOL in Facilitating Market Manipulation
In earlier chapters of this Report, we described a market test and a market manipulation at the Central desk and also discussed the impact of Reliant’s purchases of next-day natural gas at Topock during the winter of 2000–2001 on the markets. These examples illustrate how the design of the EOL electronic platform facilitated and contributed to these behaviors. As market maker, Enron observed the depth available in the order book across the relevant markets, unlike other traders, because of the absence of ex ante transparency. This allowed Enron to determine when conditions were ripe for a prospective manipulation, without this knowledge being available to other market participants. Furthermore, the lack of transparency reduced the likelihood that other participants would understand contemporaneously that the market was being manipulated. The lack of transparency limited the competition that Enron faced and enhanced its ability to exploit transitory changes in the depth across markets. The trading system provided Enron a continuous option to access liquidity through the orders provided by its clients. This gave Enron the option to move prices quickly if it chose
31An illustration of how experimentation in the quoting process in some markets can be used to create valuable information flow is shown in “Price Experimentation and Security Market Microstructure,” C. Leach and A. Madhavan, Review of Financial Studies, Volume 6, Issue 2 (1993), pp. 375-404.

Chapter IX
Docket No. PA02-2-000 Price Manipulation in Western Markets IX-31
to do so, as it did in some of the instances of manipulation described in this Report. This seemed crucial to the implementation of this manipulation. Enron gained considerable informational advantages from EOL. It alone observed the identities of the counterparties to all trades and, therefore, could observe the volumes and net purchases of every product by counterparty. For example, during the winter of 2000–2001, Enron observed the huge trading volume and net purchases of next-day natural gas at Topock by Reliant. This provided Enron a strong advantage in understanding the market dynamics. Enron would uniquely understand the extent to which the Reliant orders would be more informative and therefore would offer these orders relatively less depth, which means Enron would raise the price by a greater amount after Reliant purchased gas. Enron would do this in anticipation of additional purchases by Reliant, arising out of Enron’s knowledge of Reliant’s historical gas usage at the Topock point. This informational advantage was a consequence of the one-to-many structure, but would not be available to other potential liquidity suppliers to Reliant. Outside traders of a particular product potentially possess more information than market makers. For example, a trader who needs to buy large amounts of gas is fully informed about his own remaining needs and possibly has other information that motivates his purchase of a large amount of the product. The market maker generally does not have this information. This suggests that rational market makers set their bid and ask quotations to reflect the information known about the corresponding bid and ask orders. When a rational market maker offers a two-sided quote, this dealer takes into account the information known about his customer’s order in setting the quote and quoting higher prices to buyers than sellers. The market maker generally quotes less favorable prices for larger (more informed) orders. Market makers are often viewed as having a distinct advantage with respect to their knowledge of the short-term price dynamics because of their direct observation of supply and demand (trading conditions).32 This is especially true when liquidity supply is concentrated so that the information is not too dispersed. In the EOL system, where ex post or
32An interesting empirical study of this advantage is the study of the Chicago futures pits by “Life in the Pits: Competitive Market Making and Inventory Control,” S. Manaster and S. Mann, Review of Financial Studies, Volume 9, Issue 3 (1996), pp. 953-975. In that study the advantage to the market maker from observing the flow of information arises in a situation with competing market makers. Of course, the advantages from observing the short-term liquidity dynamics will be much greater when that information is concentrated in a single dominant market maker, even if that market maker does not attempt to exploit its potential monopoly power, as with the EOL platform.
Chapter IX
Docket No. PA02-2-000 Price Manipulation in Western Markets IX-32
ex ante trade information is not provided to customers, the advantages to EOL market makers increase because none of the advantageous information is shared with others. Of course, it is precisely when liquidity provision is concentrated that there is also the greatest scope for monopoly power. This can manifest itself as the market maker setting relatively wide spreads between bid and ask prices and the extent to which the market maker extracts information from the flow of orders.
ICE and TradeSpark: An Alternative Type of Electronic Platform33
The Basic Structure of the Electronic Markets The introduction of the EOL platform in late 1999 generated tremendous interest and attention, bringing electronic trading to the commodity markets.34 It emerged as a very popular platform and appears to have facilitated Enron’s ability to increase its market share. The EOL system itself was quite easy to use and provided quick executions (immediate trading). EOL brought a “screen” to the OTC energy market at a time when trading occurred through telephone “voice brokers.” The voice brokers performed a matching function and would often need to search for liquidity by “working the market.” In contrast, Enron’s willingness to offer continuous liquidity to the marketplace (e.g., by maintaining two-sided quotes) was very attractive to market participants. From the perspective of many participants, the system provided a form of “price discovery” through the continuous availability of two-sided quotes, even though the quotes certainly reflected Enron’s business interests. The ease of using EOL presumably helped contribute to the growth of the market by simplifying the ability to trade. Indeed, when EOL “went dark,” the trading activity at ICE doubled as traders sought alternative electronic platforms.35 36 33Information about IntercontinentalExchange (ICE) and TradeSpark was primarily provided by interviews with their respective personnel. 34Many equity markets around the globe (such as Toronto and Paris) moved to electronic platforms during the late 1980s and the 1990s (e.g., as illustrated by the analysis of the provision of liquidity in the electronic limit order market in Paris by “An Empirical Analysis of the Limit Order Book and the Order Flow in the Paris Bourse,” B. Biais, P. Hillion, and C. Spatt, Journal of Finance, Volume 50, Issue 5 (Dec. 1995), pp. 1655-1689). In fact, the Toronto market licensed its electronic market structure to a number of other markets. 35When EOL closed, it is likely that many types of trading entities (including voice brokers and even alternative one-to-many platforms, such as Dynegy) increased their market share and overall business activity.

Chapter IX
Docket No. PA02-2-000 Price Manipulation in Western Markets IX-33
Although the introduction of an electronic platform facilitated risk sharing in the energy markets, many of the specific features of EOL were certainly not essential for a successful electronic platform. ICE and TradeSpark offer interesting examples of electronic commodity trading facilities designed from a different underlying premise. They have emerged as major trading platforms, particularly in the aftermath of Enron’s collapse and the demise of its EOL platform. ICE and TradeSpark provide automated execution facilities (electronic markets) in which all traders have identical access and trading opportunities,37 i.e., they serve as electronic brokers. The market systems at ICE and TradeSpark are fully transparent limit order market systems. The entire order book is displayed to all market participants and subscribers rather than just a two-way quote (e.g., the spread). By displaying the entire order book continuously, including the depths at various prices, the market exhibits ex ante transparency. Traders then know the full amount of committed or displayed liquidity that is available in the marketplace from various counterparties without further market reaction. However, the identities of the clients submitting orders are not displayed, so that in this sense the market design is “anonymous.” The ICE and TradeSpark platforms execute orders sequentially in a system in which price and time priority are respected. Price priority ensures that orders at better prices are executed prior to orders at inferior prices, while time priority ensures that orders at a given price are executed in order of submission. Immediately after order execution, trade prices and volumes are reported on ICE and TradeSpark. The systems are ex post transparent because they provide timely transaction reports. Traders then know that other market participants entered into a transaction at the stated price, which gives them information about other market participants’ assessment of supply and demand in this market. However, the privacy of trader identities 36Although ICE’s market design is rather different from that of EOL, ICE does emulate EOL with respect to the broad idea of an easy-to-use electronic platform and such “bells and whistles” as operating out of the browser rather than just in PC mode. The transition in which ICE’s activity increased at the expense of EOL occurred over several months. 37These differ in fundamental ways from EOL. The nature of the access to order flow information on ICE and TradeSpark also contrasts with some of the well-known U.S. trading floors (e.g., the New York Stock Exchange (NYSE), the Chicago Board of Trade (CBOT), the Chicago Board Options Exchange (CBOE), and the New York Mercantile Exchange (NYMEX)), in which specialists and floor traders have access to the flow of information and the right to trade on the floor is restricted to a limited number of members. The capitalized value of that access is illustrated by the market price of a seat (membership) on various floors. Differential access of market makers also arises in other market settings, such as the NASDAQ.

Chapter IX
Docket No. PA02-2-000 Price Manipulation in Western Markets IX-34
continues to be protected subsequent to the trade execution, except that the identity is disclosed after trading to one’s counterparty to facilitate trading. This prevents other traders (except the counterparty) from exploiting information about one trader’s interest in trading.
Credit Risk and the Organization of ICE and TradeSpark A complication that arises in the ICE and TradeSpark platforms is the need to handle credit risks because the trading parties do not know the identity of their counterparty at the time of trade. This complication was not present in EOL because all parties trading with Enron knew their credit limits and standing with Enron. The basic contracting structure underlying ICE and TradeSpark is not a “clearing mechanism” in which the parties trade with a clearing corporation and “margin” (collateral value) adjustments are used to ensure the fulfillment of the contractual obligations (as in conventional futures contracts). Instead, these markets use a set of bilateral contractual arrangements to limit credit exposure to the contractual performance problems of its clients and maintain the overall credit matrix under which the parties define acceptable counterparties.38 Each pair of counterparties trading with each other in the ICE platform is required to have a master contractual agreement. The actual transactions between the parties are bilateral, as the platform’s role is to simply facilitate the matching of buyers and sellers and “confirm” the trade execution with them. The ICE and TradeSpark platforms allow each firm to designate the firms with which it is willing to trade particular products.39 The order book systems prevent ineligible counterparties from trading with one another. The order systems display any orders in the order book that the trader cannot access due to credit issues, and the system design prevents the execution of ineligible orders. Under these systems various clients face different subsets of ineligible (and eligible) orders. This design is a clever way to address the fundamental credit problems (whose centrality in commodity pricing has become especially apparent in the last year) and the diverse views of market participants about the creditworthiness of other market participants. Strikingly, this design can address the creditworthiness of the particular counterparty to a trade (through the prespecified credit matrix) without requiring 38The clients needed to make broad credit determinations outside the trading system. The platforms do not provide any information or services with respect to assessing credit worthiness, as they simply set up a mechanism for the customers to make their own determinations. The participants can then manage the controls provided to them. 39The systems allow flexibility in defining permissible counterparties. Depending on the system, these might vary with the type of product and also are subject to potential restrictions on the size of particular exposures (e.g., the customer can impose daily limits).

Chapter IX
Docket No. PA02-2-000 Price Manipulation in Western Markets IX-35
disclosure of trader identifications. However, the systems do not allow contract pricing to vary by counterparty beyond barring unacceptable matches. To understand the implementation of this credit system it is important to recognize that, as in other electronic limit order markets, there is a common ranking of orders in the limit order book as orders are ranked by price and then by time of submission. Under price and time priority, an investor purchasing in the limit order market purchases the commodity from those offering to sell at the lowest price (price priority), purchasing the good in sequence by the time of order submission (time priority). The role of time priority in such markets is to increase the incentive for providing limit orders that enhance liquidity provision.40 Orders are executed following price (and then time) priority, subject to the credit constraints (two parties can trade with each other only if each is an acceptable credit to the other in the specific product context). However, unlike conventional electronic limit order markets, at a global level departures from price and time priority can arise because the system will not execute a trade with a prohibited counterparty (e.g., in the ICE and TradeSpark displays an order seeking immediate execution skips over the inaccessible orders in the limit order book). “Inverted markets” (in which the bid price exceeds the ask price) can arise because of differences in who is eligible to post or trade quotes. If the same counterparty is eligible to trade with both the bid and ask quoters, then, ignoring credit risk, that party can earn “arbitrage” profits. For example, suppose one party is willing to buy at $4.00 and another is willing to sell at $3.95, but the two cannot trade with each other because of credit restrictions. In this case, a third trader who is allowed to trade with both parties can buy at $3.95 from the credit-inhibited seller and sell the same amount at the same time to the credit-inhibited buyer who posted a $4.00 asking price. Note that parties who are not able to trade at the best quote (because of credit issues) are still not squeezed out of the market completely. Because of differences in their credit evaluations, different firms will trade with different counterparties. Firms with tight credit standards or, alternatively, firms with poor credit, will face higher execution costs. The markets that these firms face have less depth because of access to a more limited set of counterparties. The ICE and TradeSpark systems are intended to create a “Chinese wall” between the trader and the
40However, the role of time priority is modest if the pricing grid is tight (the trader can jump ahead of the queue for a tiny price concession). This is illustrated by the effect of decimalization on time priority on the New York Stock Exchange and NASDAQ. The minimum tick sizes on ICE and TradeSpark are very small (between $.01 and $.001 for various products).

Chapter IX
Docket No. PA02-2-000 Price Manipulation in Western Markets IX-36
client’s credit manager. The same individual should not make decisions concerning both trading and counterparty credit risk. This is intended to avoid the conflict of interest in which the trader would maximize his trading profit by trading with as many counterparties as possible, assuming the trader does not bear consequences for any defaults. The need for a Chinese wall emphasizes the vulnerability of the credit restriction system to collusion between the trader and the credit manager, as well as across firms. In particular, different firms that wish to undertake “wash sale” trades with one another can do so by identifying the remaining trading firms that can intervene and execute on the quote as unacceptable credit risks, thereby disabling the other firms from participating in the wash transactions.41 The wash sales provide a mechanism to increase one’s trading volume and potentially to manipulate the reported price.42 As a by-product of the remainder of the trader’s holdings, there may be natural incentives to provide false prices to alter the perceived value of the asset. Of course, in a conventional electronic market the ability to artificially move the price is limited because of the constraints of competing orders. For example, if a trader posts a price that is above fair market value, that trader faces the risk that another trader who is not involved in the wash trade scheme will execute on that posting. The ICE platform provides notice to parties when their credit status changes. The ability to change the credit setting on ICE and identify rivals as not credit worthy greatly facilitates the ability to manipulate reported prices by wash sales. Evidence indicates that certain members of the consortium that initially formed ICE did execute wash transactions by altering credit acceptance ratings so that they could only trade with a planned partner. The consortium incorporated a variable equity interest that provided incentive for the consortium members to trade on ICE. Ownership interests could rise with increasing transactional volumes by those owners. It appears that some consortium members attempted to increase that ownership interest through wash trades. They placed credit restrictions to prevent others from trading and then executed large trades. These wash trades emphasize the importance of the ownership structure of the trading platform in general and specifically raise
41This occurred on ICE but could not occur on TradeSpark due to TradeSpark’s requirement of allowing transactions only when there are a minimum number of potential counterparties. 42See Chapter VII, p. VII-14 for more detailed discussion on wash transactions.

Chapter IX
Docket No. PA02-2-000 Price Manipulation in Western Markets IX-37
questions about the suitability of the incentives provided to increase volume and whether the credit restriction mechanism can facilitate collusion among firms to create wash sales.
Contrasting ICE and TradeSpark With EOL The contrast between the structure of EOL and these platforms is striking. EOL was initially organized as a dealer market (one-to-many trading platform), while ICE and TradeSpark were multilateral trading platforms (many-to-many trading platforms). Initially, it was intended that EOL would earn the dealer spread and support the trading activities of the parent firm, Enron, which was a major player in most of the underlying energy markets. Enron was the counterparty for all the trades on EOL. EOL lacked transparency as the order book was not displayed (except for its two-way quote) and trades were not reported. As a result of this lack of trade reporting, when prices quoted on EOL changed, investors would not be able to tell if those changes resulted from transactions or for any other reason. For example, the EOL market maker might have changed the price because market fundamentals changed or possibly to mislead the market. In contrast, ICE and TradeSpark are pure brokerage systems based on a multilateral trading platform (these systems do not participate in individual trades), earning brokerage, confirmation, and data fees. They provide equal access and information to all eligible participants. The order book is always displayed and trade executions are reported in a timely manner. Despite its informational structure and other features of the EOL platform by which Enron enjoyed major advantages, the EOL system itself was apparently quite popular. Nevertheless, many participants (who were also competitors with Enron) became frustrated with the EOL platform. For example, the formation of ICE and TradeSpark each reflected a consortium model whose partners (financial institutions and trading firms) were concerned about the monopoly power that had accrued to Enron in establishing EOL as the “marketplace.” In the case of ICE, to help the market get started, the founders agreed to make initial order flow commitments (for relatively small amounts). However, due to the concerns Staff described earlier, and for other reasons, ICE is now evolving to an independent board structure and is trying to provide financial liquidity to its owners.43
43To mitigate conflicts of interest, information about rivals is not shared with the board and decisions as to which contracts to trade are viewed as business development rather than board issues.

Chapter IX
Docket No. PA02-2-000 Price Manipulation in Western Markets IX-38
Although EOL did not engage in trade reporting or order display to retain maximum advantage relative to its counterparties in the trading process, ICE is finding it valuable to publish more of the data because an important portion of its business model is to sell data. Since ICE itself is not a dealer, its sources of revenue are very different than those of EOL. Of course, broad sales of transactional data are a significant part of the revenue of major equity markets (such as the New York Stock Exchange and NASDAQ).
The Role of Voice Brokers
The major competition faced by electronic trading platforms is from voice brokers,44 who perform a central role in searching for and matching potential counterparties to a trade. They are dominant across products (even for month-ahead products), except for the next-day instruments.45 Voice brokers have recently become more important as credit issues are now extremely significant in the marketplace; when one trades through a voice broker, one’s decision can be contingent upon the specific identity of the counterparty (even in the ICE and TradeSpark platforms one can only condition upon the counterparty being an “acceptable” credit). Customers also feel that they obtain valuable information for trading with the use of a voice broker.46 Many of the competing brokers are actually hybrids (a voice broker plus an electronic platform that serves as a “matching engine”). Voice brokers recently formed the Energy Brokers Association to develop a code of ethics for brokers.47 It is important to note that Bloomberg, like ICE, does not have a voice broker; however, it has introduced an electronic platform called “Powermatch.”
44Voice brokers were the dominant portion of the trading system prior to EOL and continue to be widely used at present. 45Because of the industry commission structure, which is proportional to the underlying physical quantities, the single-day contract is not attractive to voice brokers. There are natural economic efficiencies in processing small trades in a relatively automated manner. This is somewhat parallel to traders preferring more customized handling of larger trades (to facilitate strategic handling of the order to minimize its potential price impact), but not smaller trades, for a given instrument. The mechanics of electronic market design are efficient in addressing a high volume of transactions. In short-term instruments there is a lot of trading and a concentration of activity within a few hours. 46However, at some level the information provided by voice brokers must form a “zero-sum” game (i.e., any information received is at the expense of someone else trading through that broker), although voice brokerage still can be an efficient trading system. 47The founding members are Amerex Group, APB Financial LLC, GFI Group Inc., Natsource LLC, Prebon Energy Inc., Starsupply Petroleum LLC, and TFS Energy LLC.

Chapter IX
Docket No. PA02-2-000 Price Manipulation in Western Markets IX-39
While there is considerable bilateral (OTC) trade in the sense that trades in many instruments do not go through a “clearing” exchange (such as the NYMEX), there is very little “direct” trade that does not go through an intermediary in the marketplace. Firms value the anonymity of using a broker and want the maximum amount of competition on the other side of their trade.48
Conclusion: Forward Looking Recommendations
As mentioned earlier in this chapter, Staff provided evidence of the manipulation of the physical natural gas market at the Henry Hub in Louisiana in order to profit in the financial markets. The structure of the EOL platform enhanced Enron’s ability to perpetrate the manipulation. Informational advantages arising out of the EOL platform allowed Enron to directly apply the manipulation as market maker. EOL provided Enron the ability to better time the manipulation through the use of real-time data about individual market participants and by monitoring their responses. The ability to mislead market participants through complete control of the quote-setting process further enhanced Enron’s ability to manipulate the market. Finally, the lack of transparency of the EOL system (in failing to provide information regarding limit orders and the stack, and in failing to provide information on past trades) enhanced Enron’s ability to keep competitors in the dark. As traders lose money in markets where they suffer significant informational disadvantages and manipulations, they may withdraw or reduce trading in those markets, thereby reducing liquidity. As liquidity falls, market makers will tend to demand higher fees because of the additional risks they bear as the difficulties in offsetting purchases and sales rise. These additional costs are borne by all companies that buy, sell, or hedge energy products. Market manipulation also causes the misallocation of resources due to incorrect price signals. The inability to correctly value a particular energy product can lead to inefficient investment choices in energy plants and technology. The potential for future manipulation causes energy product traders to substitute away from instruments likely to be manipulated. As a result, there may be inadequate use of spot markets and excess precautionary use of storage and long-term contracts. Manipulation does not simply transfer wealth among market 48The one exception would be for a very few specialized products in which there are only a few potential suppliers.

Chapter IX
Docket No. PA02-2-000 Price Manipulation in Western Markets IX-40
participants; it causes deadweight losses to society as a whole by distorting consumption and investment decisions. The overall combination of costs and distortions applies not only to manipulation through market trades, but also to the false reporting of index prices to influence settlement prices for derivative instruments and direct bilateral contracts. These latter concerns are described in Chapter III. Low-burden methods of gathering useful information exist and can be implemented at a very low cost. Additional information would allow Staff to more efficiently identify these manipulations. Voluntary disclosures by a gas trader in an informal interview led to Staff’s discovery of the July 19, 2001 Henry Hub manipulation. Without these disclosures, it is unlikely that FERC Staff would have discovered the manipulation. Looking forward, Staff will need to be equipped with additional information to identify similar manipulations. Staff needs the ability to quickly identify evidence of churning. In the investigation of Reliant’s trading in southern California and Enron’s trading at the Henry Hub, Staff identified evidence of churning (in which investors turn over their positions quickly rather than establishing stable positions based on long-term needs). Information about the identity of market participants and associated transactions is available to many of the markets (such as ICE and TradeSpark). This information would be useful to FERC on a historical basis and through a real-time data feed. It would enhance FERC’s understanding of the markets’ operation on an ongoing basis and could significantly enhance its monitoring and enforcement capacity and role. The selection of particular data filters and tests to monitor data would facilitate the automation of this review process. A particularly important approach would be to monitor the markets directly for churning. For example, a “churn alarm,” which would monitor for a large amount of net buying (or selling) in a short period of time, would be helpful in identifying aggressive trading behavior. While this would likely generate a high proportion of false positives due to the nature of liquidity provision, it could also identify more suspect trading behavior. As Staff discussed earlier in this chapter, evidence exists that companies successfully executed wash trades over ICE by restricting the credit of companies not participating in the wash trading scheme. This ensured that competitors could not execute trades on offers placed on ICE that were intended for a specific company. A filter that monitors credit changes for corrupt reasons could be used to help evaluate unusual patterns in credit changes.

Chapter IX
Docket No. PA02-2-000 Price Manipulation in Western Markets IX-41
Staff believes that electronic data that directly provide trading information and efficiently report instances of concern to FERC would provide an effective oversight capability with minimal cost to the industry. FERC would be able to learn from exposure to the information, distinguish false positives, and follow up where concerns remain. The cost of implementing this type of sophisticated system is decreasing and would likely increase Staff’s productivity dramatically. Staff believes that self-monitoring and reporting requirements could be created that would mandate companies to disclose behaviors that fall within certain definitions or risk losing their certificate to trade gas. Under parts 284.284 and 284.402 of its regulations, the Commission issued blanket certificates for unbundled gas sales services and marketing services, respectively. Staff recommends a proceeding to decide if and to what extent regulations should be implemented that require reporting to avoid losing or affecting the rights granted under the blanket certificates. An important fundamental principle about market design and market-based rates is that commodity pricing should reflect competitive market conditions and the minimization of trading costs. The market design should be “workably competitive.” For example, it is difficult to see how a market trading structure in which a single firm (such as Enron) is a dominant player and operates the leading platform (EOL) would meet these competitive standards in light of the potential for rent extraction and information production to advantage the dominant firm. While this report should not be construed as requiring one specific and definitive microstructure design of the trading structure, it does point to some of the types of dimensions in which the efficiencies of the microstructure of trading can be enhanced. Our report emphasizes the importance of effective competition across platforms and market designs. One of the ways in which markets would be less prone to manipulation is by an open architecture and transparent trading system.49 It is striking that EOL participants lacked access to information about the book of limit orders, except for the quotes, including knowledge of the location of the competition. One of the problems in the EOL design is that public investors cannot identify the available pockets of liquidity from Enron and public investors, but yet Enron can. A fundamental aspect of this point concerns the asymmetric observability of information, such as the limit order book, rather than the lack of public information per se. Outsiders would have been especially reluctant to show their hand in light of this asymmetry in the structure of 49This would discourage manipulations through the trading process and by providing false trade information to producers of market indices.

Chapter IX
Docket No. PA02-2-000 Price Manipulation in Western Markets IX-42
information and the potential ability of counterparties (such as Enron) to exploit any informational advantage. Regarding the informational advantage EOL provided to Enron, the markets have adjusted. Currently there are no successful one-to-many platforms. UBS, which took control of the EOL platform, recently announced that it would no longer provide a one-to-many service. Dynegy did the same with regard to its one-to-many platform, DynegyDirect. ICE and TradeSpark are currently operating the leading electronic exchanges and are relatively transparent many-to-many exchanges. Nevertheless, Staff has recommended in Chapter VII of this Report that the Commission condition blanket gas certificates and market-based rates to require that sellers who use these platforms ensure that the platforms have certain information and monitoring features.

Chapter X
Docket No. PA02-2-000 Price Manipulation in Western Markets X-1
X. Analysis of Allegation That Williams Energy Marketing & Trading Company Attempted To Corner the Market in California for January 2001 Gas
The Commission Staff investigated an allegation that appeared in The New York Times on June 2, 2002 that Williams Energy Marketing & Trading Company (Williams) attempted to corner the market for natural gas in California and increase prices for gas delivered in January 2001. Staff examined trade records and other information and documents that Williams provided. Staff concludes that the claims are unsubstantiated.
Williams Energy Marketing & Trading Company
Williams is an energy marketing and trading unit of The Williams Companies, a publicly traded, Tulsa-based firm that owns and operates natural gas pipelines, among other activities. Williams is engaged in the purchase, sale, and arranging of transportation of natural gas. The company also provides risk management services through a variety of financial instruments and structured transactions, including over-the-counter forwards and other energy-related derivatives.1 A major share of Williams’ gas needs relates to tolling agreements that Williams has executed under which it provides gas to three electric generation facilities in southern California.2 During the fall and winter of 2000–2001, in order to provide gas to these facilities Williams’ power desk notified its gas cash desk of the gas volumes required for the next business day. The gas cash desk reviewed prior-day actual gas consumption to determine daily and month-to-date imbalance positions. On a day-ahead basis, the gas cash desk determined whether to physically buy or sell gas to meet its requirements based on (1) the amount of baseload gas already purchased, (2) the amount of expected gas flow on El Paso Natural Gas Company’s pipeline serving southern California, and (3) daily pricing versus forward pricing (balance-of-the-month or next-month pricing), among other factors. The gas cash desk then made trades by telephone or online exchanges. On a same-day basis, the gas cash desk monitored intraday changes in gas demand
1See www.williams.com/productservices/index.jsp and yahoo.marketguide.com/MGI/busidesc.asp?target=/stocks/companyinformation/busidesc&Ticker=WMB. 2See the Capacity Sale and Tolling Agreement filed in Docket Nos. ER98-2184-004, ER98-2185-004, and ER98-2186-004. The Commission summarized the tolling agreement briefly in AES Huntington Beach, L.L.C., 87 FERC ¶ 61,221 at p. 61,877 (1999). Williams also has additional gas customers in southern California.
Chapter X
Docket No. PA02-2-000 Price Manipulation in Western Markets X-2
and purchased or sold gas to stay within pipeline imbalance tolerances. Based on its view of market fundamentals and changes in gas requirements at the electric generation facilities subject to the tolling agreements, the gas cash desk might also have held an incremental position of long or short going into the following month.
The Allegation That Williams Tried To Corner the Market and Drive Up Prices in California
On June 2, 2002, The New York Times printed an article in which it quoted Jones Murphy, a former Williams employee. According to the article, Williams hired Mr. Murphy as the director of emerging products at Williams’ headquarters in Tulsa, Oklahoma, to help manage the company’s trading risks. The article states that Mr. Murphy was on Williams’ trading floor in December 2000 when he heard a commotion at the desk of Blake Herndon, director of risk management. The article quotes Mr. Murphy as stating that he “went over to ask what was going on,” and that “Blake laughed and said they were going to corner the market for natural gas and run it up for December closing, which means delivery in January.”3 The article further states that Mr. Murphy “thinks that an examination of trading records would show that the company succeeded in driving up natural gas prices in California.”4 In the article, Mr. Herndon denies Mr. Murphy’s allegation. Mr. Herndon is quoted as stating that “[i]t is comical to think that anyone could corner the gas market in California. I think this shows the lack of understanding of how these markets work.”5 William Hobbs, president of Williams, is also quoted as denying Mr. Murphy’s statement. Mr. Hobbs stated that “there has been any number of investigations, and Williams has fully cooperated.” He also stated in the article that “[w]e have provided piles and piles of documents, and no one has come back and said that Williams has done anything wrong.”6
3Banerjee, Neela, “A Collision on Risks of Energy Trading,” The New York Times (June 2, 2002) at Business section, p. 1. 4Id. 5Id. 6Id.

Chapter X
Docket No. PA02-2-000 Price Manipulation in Western Markets X-3
The Commission Staff’s Investigation of the Allegation
On June 5, 2002, counsel for Williams stated in a letter to the Commission Staff that it welcomed an independent review of its gas trading data to permit an evaluation of the allegation. Staff requested from Williams, and Williams voluntarily provided, a substantial volume of data and documents, including records of physical and financial transactions executed in the fall and winter of 2000–2001, cash book summary reports for gas, daily position reports, and mark-to-market values. As discussed above, the allegation is that Williams drove up prices in an effort to corner the market for monthly gas in California with delivery in January 2001. Monthly gas is traded over a span of time that can begin several months in advance of the month of delivery. Peak trading typically occurs in the weeks preceding the month of delivery and ends when the month of delivery begins. Positions taken by traders are measured in terms of gas quantities, such as MMBtu or NYMEX contracts. Position reports typically include relevant information such as the geographic location of the gas to be traded and the month of delivery. Position statements provide information about a trading desk’s position by time and location, and profit and loss statements identify profits and losses associated with those positions. As a general matter, a market participant attempts to corner a market by accumulating a long position, which in the context of this investigation would mean entering contracts to purchase physical gas. To successfully corner a market, the market participant’s long position must represent a substantial portion of available supply. When prices have peaked, the market participant liquidates its position at profits that reflect an exercise of market power. By accumulating a substantial position, the market participant can exert market power by raising the price it can secure for its supply.
Conclusion of the Commission Staff’s Investigation
For Williams to corner the market for physical gas, it would have needed to purchase gas in volumes that greatly exceeded the requirements of Williams’ gas customers. We do not see evidence of this purchasing activity on a day-to-day or even an intraday basis. In November 2000, Williams’ customers’ physical needs pursuant to its tolling agreements were 10,274,209 Bcf, and Williams purchased

Chapter X
Docket No. PA02-2-000 Price Manipulation in Western Markets X-4
10,701,353 Bcf. In December 2000, Williams’ customers’ physical needs pursuant to its tolling agreements were 10,905,316 Bcf, and Williams purchased 11,143,809 Bcf. Finally, in January 2001, Williams’ customers’ physical needs pursuant to its tolling agreements were 14,247,195 Bcf, and Williams purchased 12,681,667 Bcf. These data show that Williams did not purchase substantially more gas than it needed to meet its customers’ physical needs. In fact, the amounts that Williams purchased above its needs represent less than 1 percent of the gas market in southern California. In November and December 2000 and January 2001, Williams’ natural gas purchases represented approximately 4, 5, and 6 percent, respectively, of the total demand for Southern California Gas Company and Pacific Gas and Electric Company. During November and December 2000, Williams’ natural gas purchases represented approximately 10 percent of the total Southern California Gas Company demand. These data place into perspective the dimension of Williams’ physical activity in the relevant time period. While not insubstantial, it appears to be too small to constitute a corner-the-market strategy. Williams’ cash desk began the month of November for southern California short approximately 43,000 MMBtu/d at approximately $5.20. Gas prices increased throughout the month, from $5.20 to $17.99. Overall, the gas cash desk incurred a loss for November 2000 on physical gas transactions. In December 2000, the gas cash desk began the month long for southern California approximately 67,000 MMBtu/d at approximately $14. Gas Daily index prices averaged approximately $25 throughout the month. Overall, the cash desk incurred a gain for December 2000 of less than $35 million on physical gas transactions. Williams’ profit and loss activity in the 2 months preceding January indicates a level of profits that is not large relative to the size of the gas market in southern California. In addition to profiting by cornering physical gas, we might also expect to see large positions taken in the financial markets in anticipation of increasing gas prices. However, we do not see evidence of this activity. Williams’ largest long financial position in January 2001 SoCal gas was 80,000 MMBtu/d. This position was active during November 2000. It was small relative to the volume of gas that Williams needed to purchase to meet its customers’ needs. The fact that Williams’ financial position was far smaller than its physical position indicates that Williams did not have a strong belief that prices would rise.

Chapter X
Docket No. PA02-2-000 Price Manipulation in Western Markets X-5
Williams’ gross mark-to-market margin for the forward southern California basis January 2001 contract also does not reflect a strategy to corner the market. Williams recorded a gain of approximately $3.5 million in November 2000 and less than $1 million in December 2000. Williams’ cumulative gross cash margin for the gas cash desk for southern California for January 2001 was a gain of less than $12 million. Based on our review of data, information, and documents that Williams provided, the Commission Staff concludes that the allegations that Williams cornered the market in southern California for January 2001 natural gas and drove up natural gas prices in southern California during the fall and winter of 2000–2001 are unsubstantiated.