uudo oceanographic r—^nt^i institution | feteruio-r-oisd pi j u.» *. 4.«,;.cat i«a _ late...
TRANSCRIPT
3-80
UUdo u ̂_
I*»*?**.
Oceanographic r—^nt^i Institution
..■ .... ■ ' '- ;
K'ffl ts' I« 'VWäsk, ;,*]
1930
LATE QUATERNARY SEDIMENTATION IN THE
EASTERN ANGOLA BASIN
By Brian D. Bornhold
November 1973
TECHNICAL REPORT Prepared under Office of Naval Research Contract N00014-67-A-0108-0004 and the National Science Foundation Grants GA- 29460 and GA-35454 from Lament-Doherty Geological Observatory.
Approved for public release; distribution unlimited.
WOODS HOLE, MASSACHUSETTS 02543
19950320 061
WHOI-73-80 | feteruio-r-oisd pi J u.» *. 4.«,;.cat i«a _
LATE QUATERNARY SEDIMENTATION IN THE
EASTERN ANGOLA BASIN
j »r
Avftilability C©d»s
Dist Spsoial
By
Brian D„ Bornhold
WOODS HOLE OCEANOGRAPHIC INSTITUTION Woods Hole, Massachusetts 02543
5 QT7ÄIJTJ ■f~ >"-'<- £~W.;£l£$&
November 1973
<7
TECHNICAL REPORT
Prepared under Office of Naval Research Contract N00014-67-Ä-0108-0004 and National Science Foundation Grants GA-29460 and GA- 35454 from the Lamont-Doherty Geological Observatory.
Reproduction in whole or in part is permitted for any purpose of the United States Govern- ment. In citing this manuscript in a biblio- graphy, the reference should be followed by the phrase: UNPUBLISHED MANUSCRIPT,
Approved for public release; distribution unlimited.
Approved for Distribution (J^i/i^iA- Ro Heirtzler, Chairman
Department of Geology & Geophysics
LATE QUATERNARY SEDIMENTATION IN THE
EASTERN ANGOLA BASIN
by
BRIAN D. BORNHOLD
B.Sc. University of Waterloo (1967)
A.M. Duke University (1970)
SUBMITTED IN PARTIAL FULFILLMENT OF THE
REQUIREMENTS FOR THE DEGREE OF
DOCTOR OF PHILOSOPHY
at the
MASSACHUSETTS INSTITUTE OF TECHNOLOGY
and the
WOODS HOLE OCEANOGRAPHIC INSTITUTION
Signature of Author.
Certified by.
August, 1973
Joint Program in Oceanography, Massachusetts Institute of Technology - Woods Hole Oceano- graphic Institution, and Department of Earth and Planetary Sciences, and Department of Meteorology, Massachusetts Institute of Tech- Yolp'gy, August, 1973
Accepted by.
Chairman, Joint Oceanography Committee in the Earth Sciences, Massachusetts Institute of Technology - Woods Hole Oceanographic Institution
LATE QUATERNARY SEDIMENTATION IN THE EASTERN ANGOLA BASIN
Brian D. Bornhold
Submitted to the Massachusetts Institute of Technology - Woods Hole Oceano- graphic Institution Joint Program in Oceanography on August 7, 1973 in partial fulfillment of the requirements for the degree of Doctor of Philo-
sophy.
ABSTRACT
Recent sedimentation in the eastern Angola Basin includes calcareous oozes in the north and south (Guinea Rise and Walvis Ridge) and hemipelagic lutites and terrigenous turbidites on the Congo Cone and on the Angola rise and abyssal plain. Slumped and ponded sediments are dominant within the Angola diapir field. Illite and montmorillonite are abundant in the south- ern part of the basin, reflecting the source in soils of South West Africa and northward transport in the Benguela Current system. Kaolinite dominates the clay-mineral assemblage in the north-central part of the basin, reflecting a source in the tropical-humid Congo Basin and transport to the deep-sea through the Congo River and canyon systems.
Piston cores from the continental rise revealed major fluctuations in the surface oceanographic conditions, primary productivity, and near-bottom depositional environment during the late Quaternary. Sediments deposited during glacial intervals contain markedly lower carbonate, higher levels of organic carbon, and more abundant siliceous biogenic components, fecal pellets, and pyrite. Sedimentation rates during the past 200-300 x 10 years re- mained relatively constant on the rise, averaging 3-5 cm/103 years.
Oceanographic changes from interglacial to glacial periods, based on sediment composition and geochemistry, include:
(1) northward extension and intensification of the Benguela Current and associated high primary productivity off southern Angola;
(2) onset of upwelling and high surface productivity off northern Angola,
Congo, and Gabon; and (3) major influx of bottom water into the Angola and Guinea Basins. These conditions resulted in higher benthic productivity, a shallower
lysocline, and a more reducing near-bottom environment, as bottom water in the Angola Basin, produced during glacial maxima, became isolated. This "climax" bottom water was eventually mixed with the overlying water by geo-
thermal heating.
Thesis Supervisor: Dr. John D. Milliman
Title: Associate Scientist
ACKNOWLEDGEMENTS
I wish to express my thanks to Dr. John D. Milliman for his excellent
guidance and encouragement throughout this research project. I should also
like to thank Dr. K. 0. Emery for enabling me to participate in the WALDA
expedition of the N/0 "Jean Charcot" in 1971 and in the Eastern Atlantic
Continental Margin study of R/V "Atlantis II" in 1972, and for permitting me
to use samples and data collected from these cruises.
I also wish to thank Messrs. Guy Pautot, Daniel Reyss, and Vincent
Renard of the Centre Oceanologique de Bretagne for their excellent cooperation
and assistance during the WALDA cruise and M. Leo Pastouret for his help in
describing the piston cores in Brest, France.
I am very grateful, as well, to the following individuals who supplied
samples which were used in this study: Dr. George Keller (NOAA), Dr. Howard
Sanders (WHOI), M. P. Giresse (Laboratoire de Geologie du Centre d'Enseigne-
ment Superieur de Brazzaville), M. Andre Capart (Institut Royal des Sciences
Naturelles de Belgique), and Mr. Roy Capo (Lamont-Doherty Geological Observa-
tory). Cores were made available by the Lamont-Doherty Geological Observatory
through NSF grants GA29460 and GA35454 and ONR grant N00014-67-A-0108-0004.
Mrs. Lois Toner provided invaluable advice and instruction in various
laboratory methods and Mr. Jack Hathaway provided helpful advice on the X-ray
diffraction methods.
The following people critically read the manuscripts and offered many
helpful suggestions: Dr. K. 0. Emery, Dr. Colin Summerhayes, Dr. John Southard,
and Dr. John D. Milliman.
Finally, I should like to thank my wife, Penelope, for her patience and
encouragement throughout this study and for typing various parts of the
manuscript.
CONTENTS
Page
ABSTRACT 2
ACKNOWLEDGEMENTS.. .. . „ „ „ „ 3
LIST OF TABLES 0 „ „. 0 0 7
LIST OF FIGURES 8
INTRODUCTION „. „ 13
PHYSIOGRAPHIC SETTING 17
Guinea Rise 17
Congo Cone 20
Angola Diapir Field 21
Angola Continental Rise 24
Walvis Ridge 24
Angola Abyssal Plain 27
CLIMATE 28
OCEANOGRAPHY 38
Surface Circulation 38
Benguela Current 38
South Equatorial Countercurrent 41
Influx of Fresh Water 42
Deep Circulation 42
Paleoclimatology and Oceanography 52
DISTRIBUTION OF SUSPENDED MATTER 59
Surface Suspended Matter 59
Suspended Matter Distribution 59
Composition of Suspended Matter 65
Page
Suspended Matter in Deep Water 76
RECENT SEDIMENTS 80
Calcium Carbonate 80
Clay Minerals 83
Methods 83
Chlorite 84
Montmorillonite 84
Kaolinite 87
Illite 87
Methods of Transport to the Deep Sea 87
LATE QUATERNARY SEDIMENTS 93
Stratigraphy of Deep-Sea Cores 93
Abundance of the Globorotalia menardii 94
complex 94
Paleoclimatic Curves and Stratigraphic
Zonation 97
Planktonic foraminifera/Radiolaria 100
Variations in Calcium Carbonate Abundance.... 100
Sedimentation Rates 108
Sand and Silt 110
Turbidites 118
Fecal Pellets and Authigenic Silicates 121
Vertical Changes in Clay-mineral Abundance 133
Organic Carbon 133
DISCUSSION 142
CONCLUSIONS : 154
REFERENCES 156
APPENDICES 165
LIST OF TABLES
Table Page
1. Sedimentation rates in the eastern Angola Basin 109
2. Average organic carbon percent in glacial and
interglacial sections of Angola Basin cores 141
LIST OF FIGURES
Figure Page
1. Location of bottom samples in the Angola Basin 16
2. Bathymetry of Angola Basin showing major physiographic
provinces 18
3. 3.5 kHz echo-sounding record showing ponded sediments
within the Angola diapir field 23
4. 3.5 kHz echo-sounding record showing continental rise
swells off southern Angola 26
5. Climatic zonation of western Africa 30
6. Schematic interpretation of climatic features of an
interglacial southern summer in western Africa 32
7. Schematic interpretation of climatic features of an
interglacial northern summer in western Africa 34
8. Pattern of average annual rainfall in southwestern Africa 37
9. Pattern of surface circulation 40
10. Surface salinity distribution 44
11. (a) East-west profile of temperature across the South
Atlantic Ocean at Lat. 16°S 47
(b) East-west profile temperature of salinity across the
South Atlantic Ocean at Lat. 16°S 49
12. Distribution of potential temperatures of bottom water in
the South Atlantic Ocean 51
13. Schematic interpretation of climatic features of a glacial
southern summer 54
14. Schematic interpretation of climatic features of a glacial
northern summer 56
15. Distribution of total suspended matter concentration in
surface waters 61
9
Figure Page
16. Relationship between salinity and total suspended matter
concentration off the Congo River 63
17. Distribution of Forel color (7„ yellow) 67
18. Relationship between Forel color and total suspended matter
concentration in the eastern Angola Basin 69
19. Distribution of Secchi disk transparency values 71
20. Photomicrograph of a fecal pellet in suspended matter
sample off Angola 73
21. Photomicrograph of an organic aggregate in suspended matter
off Angola 75
22. (a) Relationship between near-bottom suspended matter con-
centration and water depth in the eastern Angola Basin 78
(b) Relationship between light-scattering and water depth
in the eastern Angola Basin 78
23. Distribution of percent calcium carbonate in surface sediments.. 82
24. Distribution of percent montmorillonite in the clay
fraction of surface sediments 86
25. Distribution of percent kaolinite in the clay fraction
of surface sediments 89
26. Distribution of percent illite in the clay fraction
of surface sediments 91
27. Abundance of individuals of the Globorotalia menardii
complex in cores from the eastern Angola Basin 96
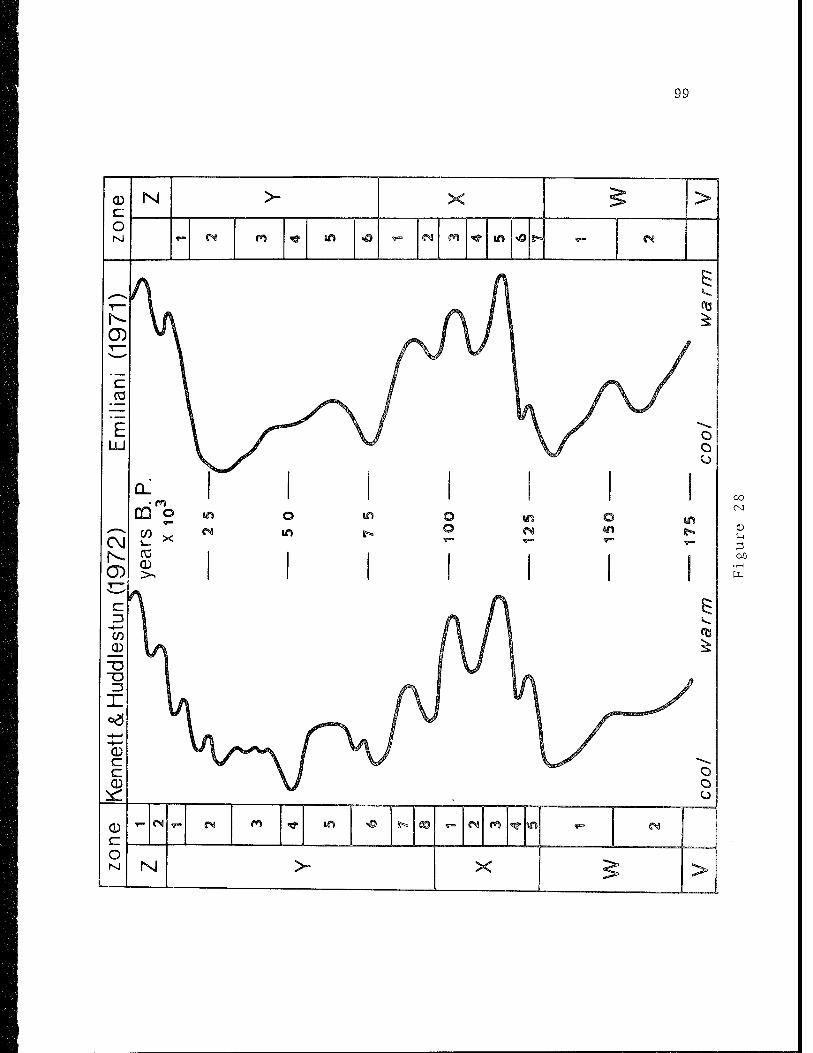
28. Paleoclimatic curves and late Quaternary zonation based
on the work of Emiliäni (1971) and Huddlestun (1972) 99
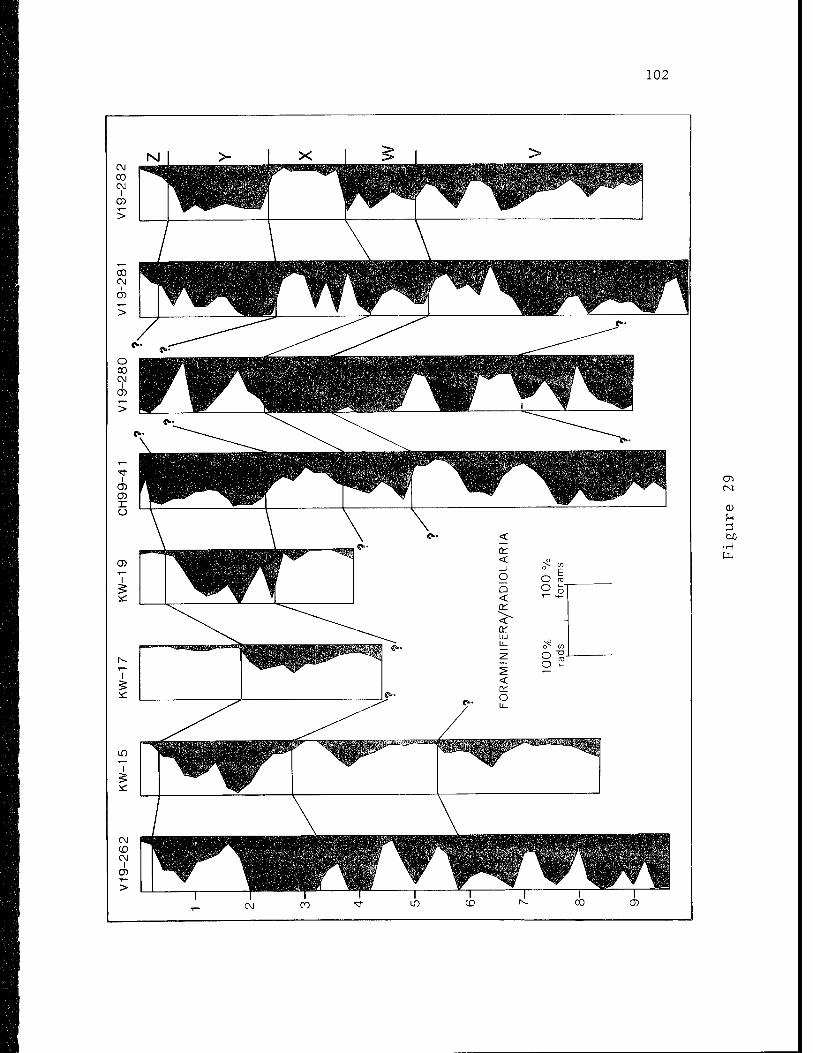
29. Variations in the planktonic foraminifera/radiolaria
ratios in cores from the eastern Angola Basin 102
30. Variations in the calcium carbonate content of the
silt and clay fraction in cores from the eastern
10
Figure Pa§e
Angola Basin. 105
31. Relationship between percent sand, calcium carbonate content
of the silt and clay fraction, and planktonic foraminifera/
radiolaria ratios in core V19-281 112
32. Photomicrograph of smooth, spherical, non-magnetic particle
found in core KW-19 115
33. Photomicrograph of pyritized burrows from core V19-278 117
34. Average centimeters of silt and sand layers per meter of core.... 120
35. Photomicrograph of chamosite pellets from the continental
shelf off the Congo Republic 123
36. Photomicrograph of grey pellets from core KW-15 125
37. Relationship between fecal pellet abundance, abundance of the
G. menardii complex, percent carbonate in the silt and
clay fraction, percent sand, and the for aminifera/radiolaria
rat io in core KW-15 "8
38. Photomicrograph of glauconite and chamosite pellets from the
continental shelf off Gabon 130
39. Photomicrograph of glauconite from core KW-18 132
40. Vertical changes in clay-mineral abundance in cores from the
eastern Angola Basin 135
41. Relationship between percent organic carbon, carbonate content
of the silt and clay fraction, and abundance of the G.
menardii complex in cores V19-262, KW-19, and V19-281 137
42. Graphs of percent organic carbon versus carbonate content of the
silt and clay fraction in cores V19-262 and V19-281.... 139
43. Schematic interpretation of bottom conditions in the
Angola Basin during: (a) glacial maxima; (b) inter-
11
Figure Prior
mediate stages of warmer climate; and, (c) interglacial
maxima , , -.
44. Depth of the lysocline in the equatorial south Atlantic 150
12
LATE QUATERNARY SEDIMENTATION IN THE
EASTERN ANGOLA BASIN
13
INTRODUCTION
The purpose of this investigation is to study the modern conditions of
sedimentation in the Angola Basin and the changes brought about by variations
in the climate of western Africa and in the oceanographic regime during the
late Quaternary. Present sedimentation was studied by attempting to relate
the composition and dispersal of suspended matter in the surface and deep
water and the composition of surface sediments to the prevailing oceanographic
and climatic conditions. Variations in sedimentary conditions and paleo-
environments during the late Quaternary were investigated by studying the
composition of sediments in piston cores from the Angola Basin.
The interacting influences of climate and oceanographic conditions can
have profound effects on sediment sources and volumes, on sedimentary pro-
cesses, and on the environment of deposition. Until recently, studies of
Quaternary marine sedimentation have been concerned primarily with establish-
ing the details of paleoclimatology on the basis of planktonic assemblages,
oxygen isotopic composition of foraminiferal tests, or calcium carbonate con-
tents. Only within the past few years has attention turned to the influence
of changing surface and deep-sea circulation patterns on the nature of marine
sedimentation (e.g., Mclntyre and Ruddiman, 1972; Kennett and Brunner, 1973;
Watkins and Kennett, 1972; Broecker, 1971).
The Angola Basin is well suited for a study of both paleoclimatological
and paleooceanographic effects on sedimentation. The climate of tropical
west Africa underwent major changes during the Quaternary, from tropical-humid
during the interglacial periods to arid-semiarid during glacials. The cir-
culation pattern of surface waters includes two contrasting current systems,
14
the cold, productive, northward-flowing Benguela Current in the south and
the warm, eastward-flowing South Equatorial Countercurrent farther north;
models of Quaternary climatic variation based on studies of the adjacent areas
of Africa, postulated important changes in this scheme. In addition, the
nearly complete restriction of bottom waters of the basin at the present
time offered the opportunity to study the effects of major changes in deep
circulation on the nature of sedimentation during the late Quaternary.
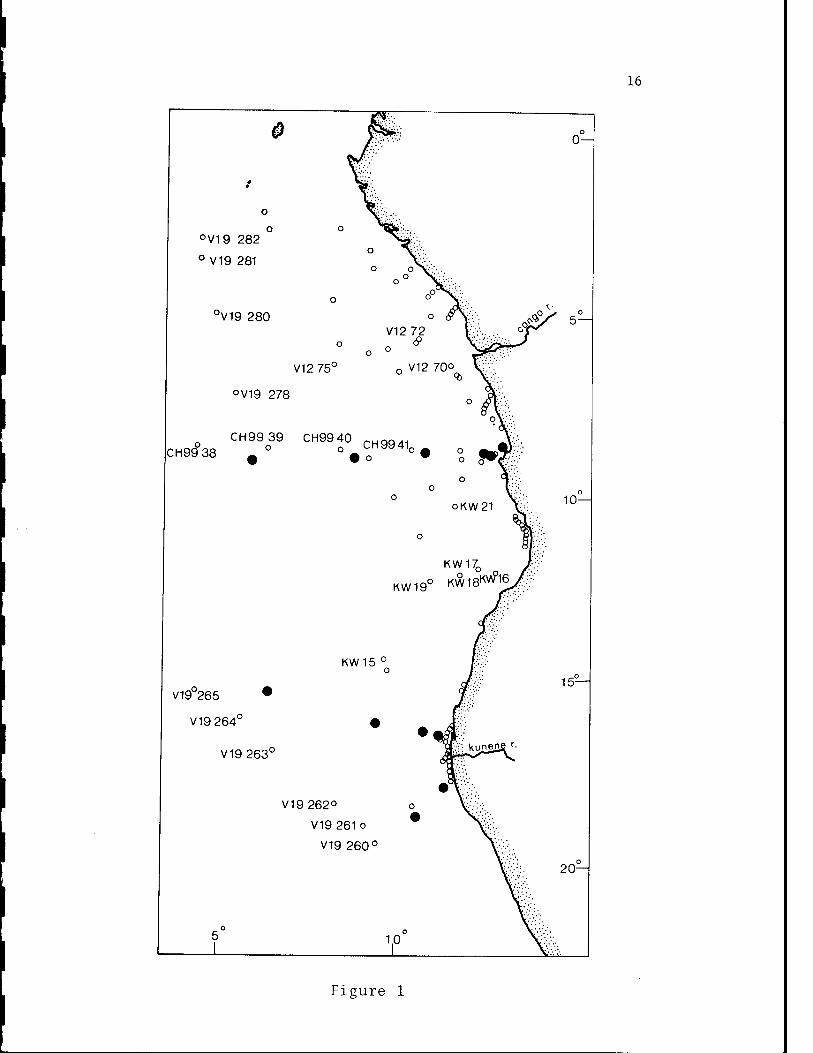
Sediment samples used in this study include both piston cores and bot-
tom samples and were acquired from several sources. Piston cores were ob-
tained from the Lamont-Doherty Geological Observatory, the Centre Oceanologique
de Bretagne, and the Woods Hole Oceanographic Institution; grab samples were
from the Centre Oceanologique de Bretagne, Dr. Howard Sanders (WHOI), Woods
Hole Oceanograprhic Institution, Bureau of Commercial Fisheries (courtesy of
Dr. G. Keller), Institut Royal des Sciences Naturelles de Belgique, and M. P.
Giresse (Congo Republic). The locations of these samples are included in
Appendix I and are shown in Figure 1. The suspended-matter samples were taken
from the N/O "Jean Charcot" during the WALDA expedition of 1971 and from the
R/V "Atlantis II" during the Eastern Atlantic Continental Margin study of
1972.
Figure 1. Location of bottom samples and core descriptions used in
the investigation.
16
°V19 282
° V19 281
3V19 280
CH99°38
V12 75
°V19 278
CH99 39 CH99 40
V19°265
V19 264
V19 263c
KW15 °
•\^-- V19 262° o
V19 261o *
V19 260°
o 5 I
0
V
Figure 1
17
PHYSIOGRAPHIC SETTING
The coastal areas of Angola, Congo, and Gabon are characterized by a
narrow zone of Cretaceous to late Cenozoic sedimentary rocks (10-100 km
wide) to the east of which rises a long high plateau of Precambrian age.
This plateau has its highest elevations in the south, averaging 1500 to
2000 m, with the highest point (2620 m) being east of Lobito, Angola. The
plateau descends towards the north, where it lies at 500 to 1000 m above sea
level. The coastal plain is broadest in areas of major Tertiary embayments
such as the Mocamedes, Cuanza, Cabinda, and Gabon Basins that have received
considerable geological attention in view of their petroleum potential. The
Congo River and its tributaries drain a large interior basin of Tertiary to
Recent continental sediments.
The continental shelf in the study area is generally very narrow (Figure
2), particularly off southern Angola and immediately south of Luanda ( < 5 km).
It is wider off the Kunene River, South West Africa, and in the large reentrant
of the coastline between Lat. 13°S and Luanda, Angola where it is 40 to 50 km
wide. The shelf broadens steadily northward towards the mouth of the Congo
River where it reaches a maximum width of about 80 km. The shelf remains 40
to 60 km wide off Gabon and the Congo Republic.
The offshore area can be subdivided into six major physiographic regions;
(1) the Guinea Rise; (2) the Congo Cone; (3) the Angola diapir field; (4) the
Angola continental rise; (5) the northern Walvis Ridge; and, (6) the Angola
abyssal plain.
Guinea Rise
The Guinea Rise is a broad swell separating the Angola Basin from the
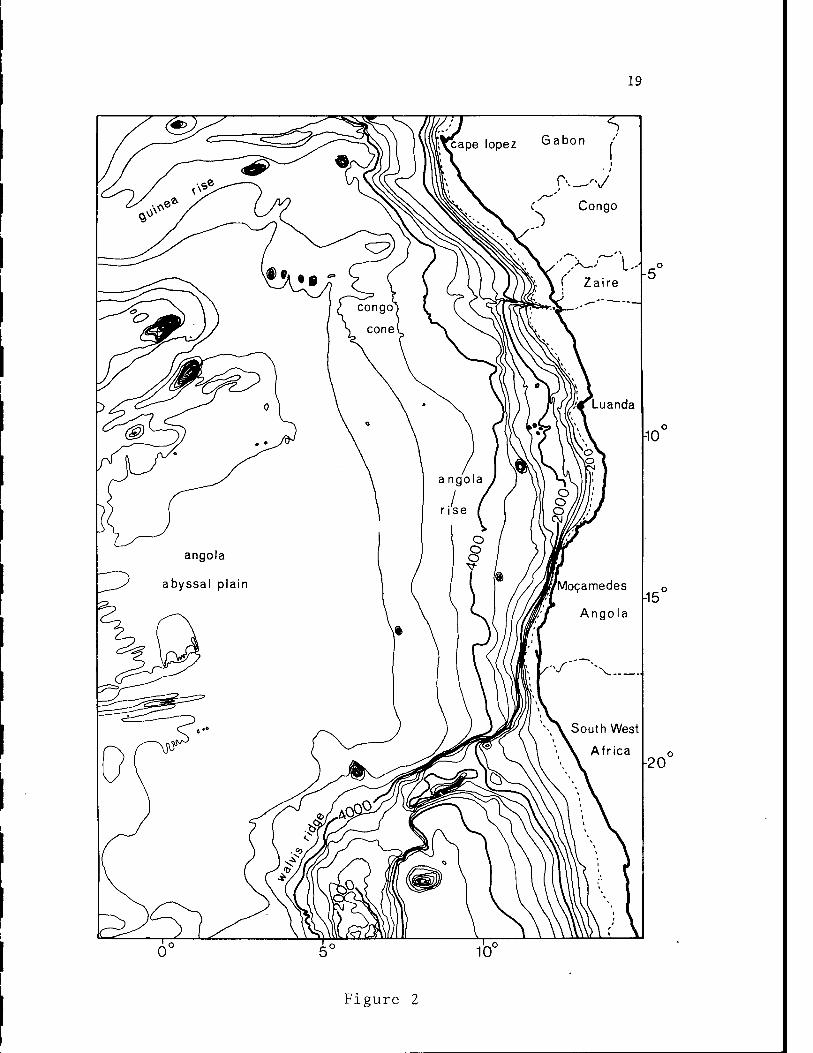
Figure 2. Bathymetry of the Angola Basin and adjacent continental
margin. Depths are in corrected meters with a 400-meter
contour interval (after Uchupi, 1972).
19
Figure 2
20
Guinea Basin, thereby marking the northern boundary of the study area. It
rises to approximately 4400 m depth from the Angola abyssal plain ( > 5200 m)
on the south and is characterized by numerous seamounts and volcanic islands
of the Cameroon Line (Annabon, Principe, Sao Tome, and Fernando Poo). Con-
tinuous seismic profiling data show that the Guinea Rise has a highly ir-
regular sub-bottom topography of very high relief, covered by a thick blanket
of sediments (Heezen et al., 1964; Emery et al., in prep). This topographic
feature is believed to have been built primarily during the Cenozoic as a
fracture zone-ridge system (LePichon and Hayes, 1971).
Congo Cone
2 The Congo Cone occupies an area in excess of 250,000 km to the north-
east of the Angola abyssal plain (Figure 2). The cone and in particular the
associated canyon system have been the subject of a detailed investigation by
Heezen et al. (1964).
The cone is characterized by the undulating topography typical of an
abyssal cone, being dissected by several canyon distributaries, especially
west of 9°E. The overall shape of the continental rise and slope is convex
seaward in this region, in contrast to the slope and rise farther south which
are concave seaward. A positive free-air gravity anomaly (> 40 mgal) is
associated with the area west-southwest of the Congo River (Rabinowitz, 1972).
The following are the important aspects of the Congo canyon system and
its deep-sea fan:
(1) the canyon extends 30 km into the mouth of the river and thus di-
verts virtually all of the river's bedload into the deep sea;
(2) the total length of the canyon system is 800 km and is made up in
21
its lower parts of 8 to 10 branches (below 3500 m);
(3) the canyon is V-shaped to a depth of about 3500 m, with the floor
between 200 and 700 m below the level of the adjacent sea floor;
(4) below a depth of 3500 m, the channel is defined primarily by
natural levees.
Angola Diapir Field
The Angola diapir field has been the focus of several recent studies
(Baumgartner and van Andel, 1971; von Herzen et al., 1972; Leyden et al.,
1972; Rabinowitz, 1972; Emery, 1973) in the light of the area's possible
economic significance and of its position in the reconstruction of the South
Atlantic. The evaporitic nature of these diapirs is supported by gravity,
magnetics, heat flow, seismic refraction, and similarity to known salt
diapirs.
The diapir field, which extends from about Lat. 13.5°S to at least as
far north as Cape Lopez, lies at depths between approximately 1000 and 3500 m
and is characterized by relief of up to several hundred meters. The field
terminates abruptly on the seaward side as a steep scarp up to 1200 m in
height. Articles by Leyden et al. (1972) and Mascle et al. (in press) suggest
that this zone of diapirs may extend into the northern Gulf of Guinea, pos-
sibly as far as the Niger delta. This latter view is also supported by more
recent geophysical data (Emery, personal communication).
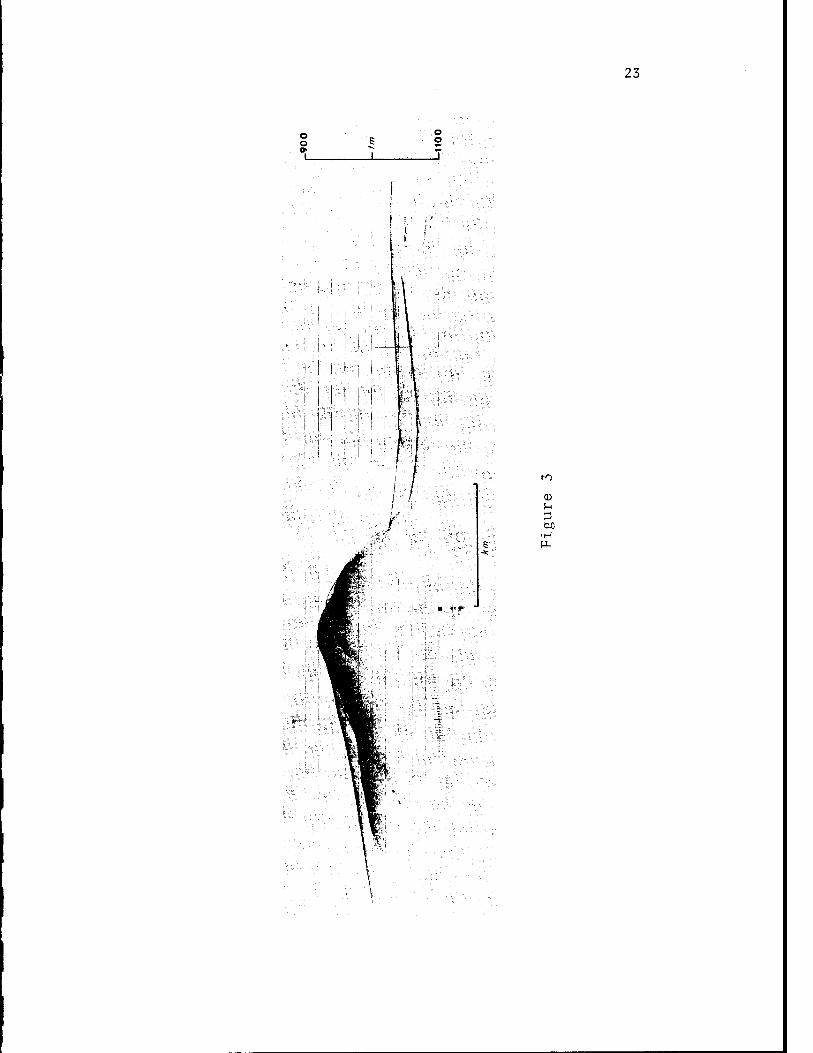
On the basis of sediment ponding observed in seismic reflection pro-
filing (Figure 3), detailed surveys of individual features, and gravity deter-
minations, it has been concluded that many of these individual diapirs must
form linear ridges up to 15 km long and roughly parallel to the bathymetric
contours.
Figure 3. 3.5 kHz echo-sounding record showing ponded sediments
within the Angola diapir field.
o o
o o
23
•H
24
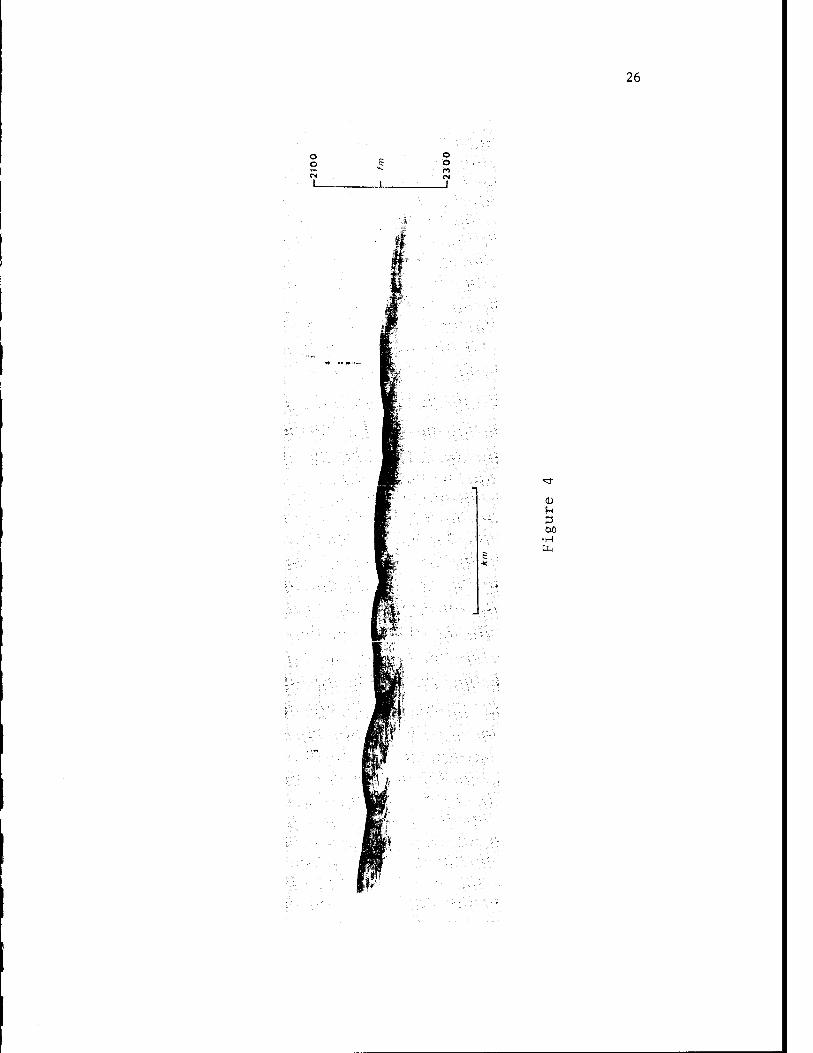
Angola Continental Rise
The Angola continental rise includes the region bounded by the Congo cone
to the north, the Angola diapir field to the east, the Walvis Ridge to the
south, and the Angola abyssal plain to the west. It has smooth topography,
broken only by occasional canyons, seamounts, and small, poorly developed
continental rise hills (Figure 4). The last are most apparent at depths of
about 4000 to 4500 m in the southeastern part of the area. The largest ap-
pear to be approximately 1500 m long and 30 m high and are thought to be the
products of deep currents. For reasons to be presented in a later section,
these features are believed to be relict, dating from before the last major
transgression.
Walvis Ridge
The Walvis Ridge, a major topographic and structural feature exhibiting
rugged volcanic relief of several hundred meters, trends approximately NNE-
SSW from the Mid-Atlantic Ridge to the African continent, and separates the
Cape Basin from the Angola Basin. Its northern sector is a more or less con-
tinuous unit with an average minimum depth of approximately 2500 m. West of
the study area (at about Long. 2°E), the ridge is cut by a deep valley which
reaches a depth of 4000 m. The ridge is a less continuous feature west of
this gap.
The steep north flank merges abruptly with the sea floor of the Angola
Basin (Figure 2). Slump structures and the continental rise hills continue
at least along the northeastern part of the Walvis Ridge.
25
Figure 4. 3.5 kHz echo-sounding record showing continental rise
swells off southern Angola.
26
o o S o "*- r*> es
1 1 CM
1
n%
6
o
•H
IT
27
Angola Abyssal Plain
The abyssal plain occupies an area of approximately 15 x 10 sq km and
lies at a depth of 5200-5600 m. It is essentially flat and featureless in
its central portions. On the west it merges with the abyssal hill province
of the Mid-Atlantic Ridge, on the north with the Congo cone, and elsewhere
with the Angola continental rise or the similar topographic feature on the
north flank of the Walvis Ridge.
CLIMATE
The coastal region adjacent to the Angola Basin belongs primarily within
the Class V or Tropical Climatic Zone of Landsberg et al. (1963) and embraces
four of their five subdivisions within this zone, from "tropical humid-summer
climate" to "tropical semi-desert and desert." These zones are arranged with
the most humid in the north and the driest in the south (Figure 5); the
southernmost sector of the area lies within Class IV or the Warm Temperate
Subtropical Zone and in the "semi-desert and desert" subdivision of this zone.
Inland, the climatic zones penetrate far south of their coastal positions
due to the presence of the nearby Precambrian plateau, located less than 100
kilometers inland (see pagel7). The major effect of this plateau is to in-
crease rainfall in the interior; in southern Angola four major climatic zones
occur within 400 kilometers of the coast. In the northern interior much of
the Congo's drainage basin lies within a tropical-rainy climatic zone. This
distribution of climatic zones has a profound influence upon the hydrologic
regimes of the rivers in this area and cn their contribution of sediment to
the adjacent continental margin.
The climate and hydrographic conditions of this area are controlled prin-
cipally by the presence of a major high-pressure area, the center of which
is located at about Lat. 28°S and Long. 9°W in January and at about Lat. 24°S
and Long. 13°W in July (Figures 6 & 7). In January, a major low-pressure
area is centered over central equatorial Africa but moves far to the north-
east by July.
Offshore, the anticyclonic circulation associated with this configuration
gives rise to dominantly southeast trade winds in the entire area. These
29
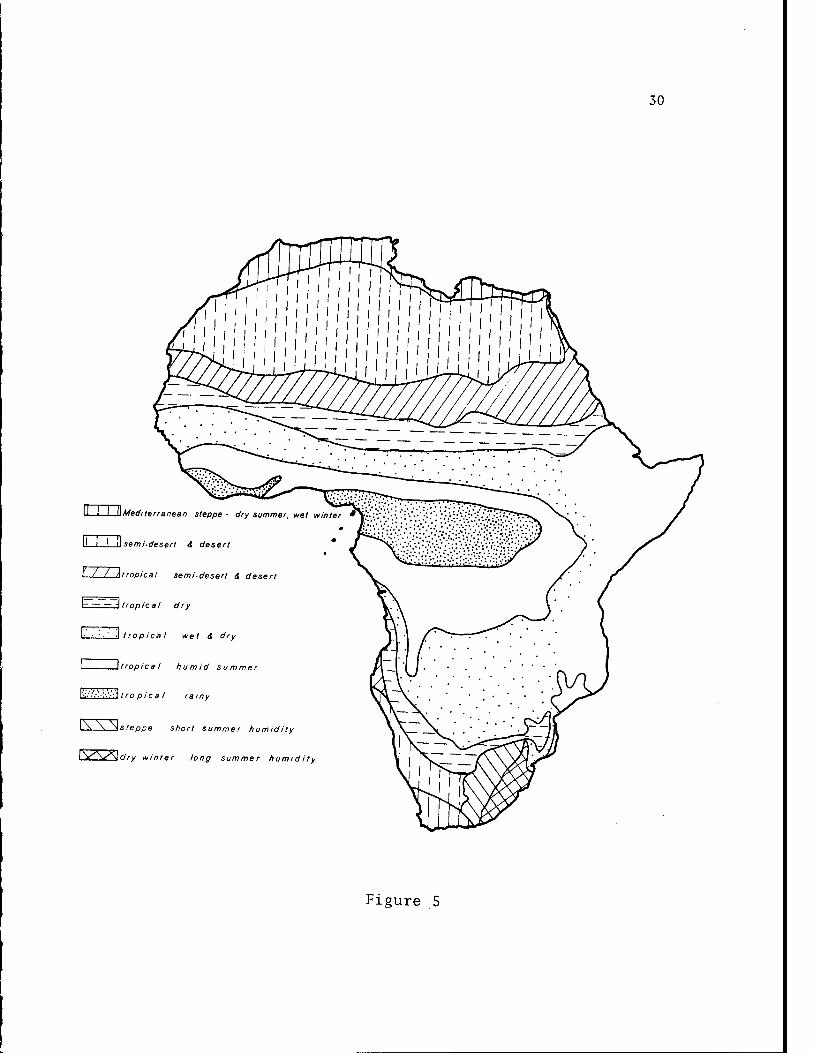
Figure 5. Climatic zonation of Africa (after Landsberg et al.
1963). Details for eastern Africa are not shown.
30
^Mediterranean steppe ■ dry summer, wet winter
U 1 ! U semi-desert <C desert
\ / l ntropical semi-desert & desert
I \trrtpirat dry
tropica I wet & dry
I \tropical humid summer
v-:::.-'.-.-:'--itrn nirn I rainy
I \ \ ^.steppe short summer humidity
I >r\^4dry winter long summer humidity
Figure 5
3]
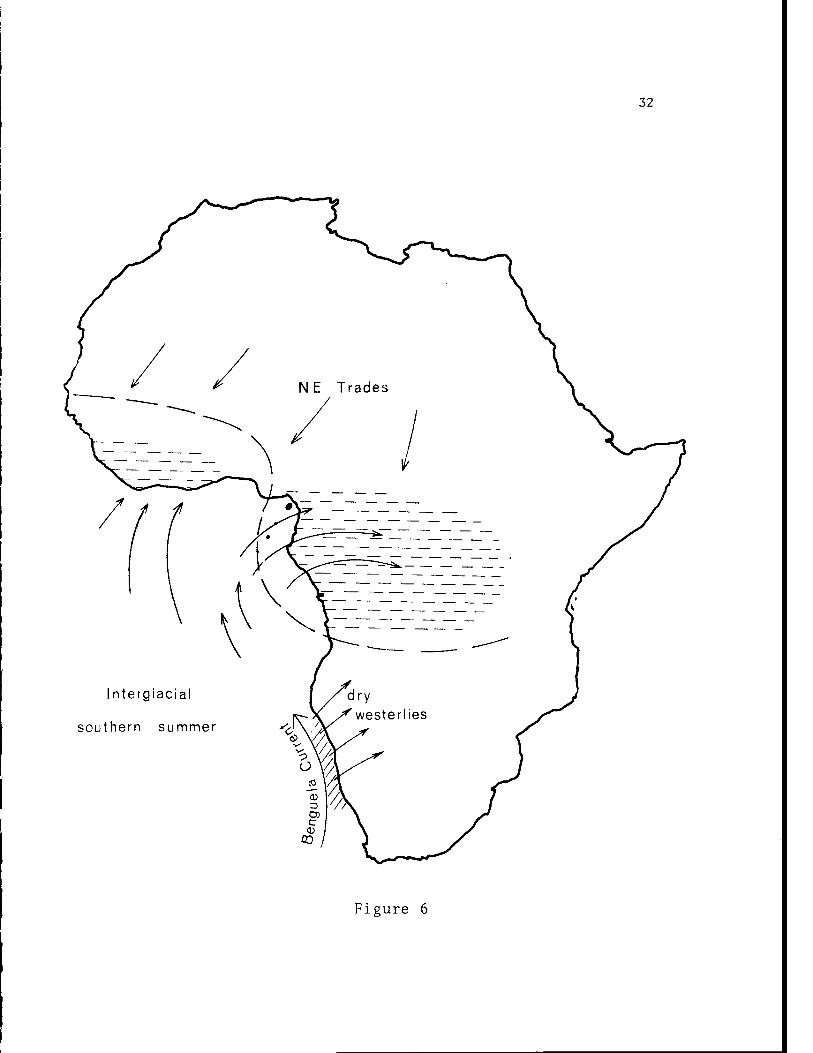
Figure 6. Schematic interpretation of the important climatic
features during an interglacial southern summer in
western Africa (after van Zinderen Bakker, 1967).
Horizontal hatching indicates pluvial conditions; dia-
gonal hatching indicates upwelling.
32
Figure 6
33
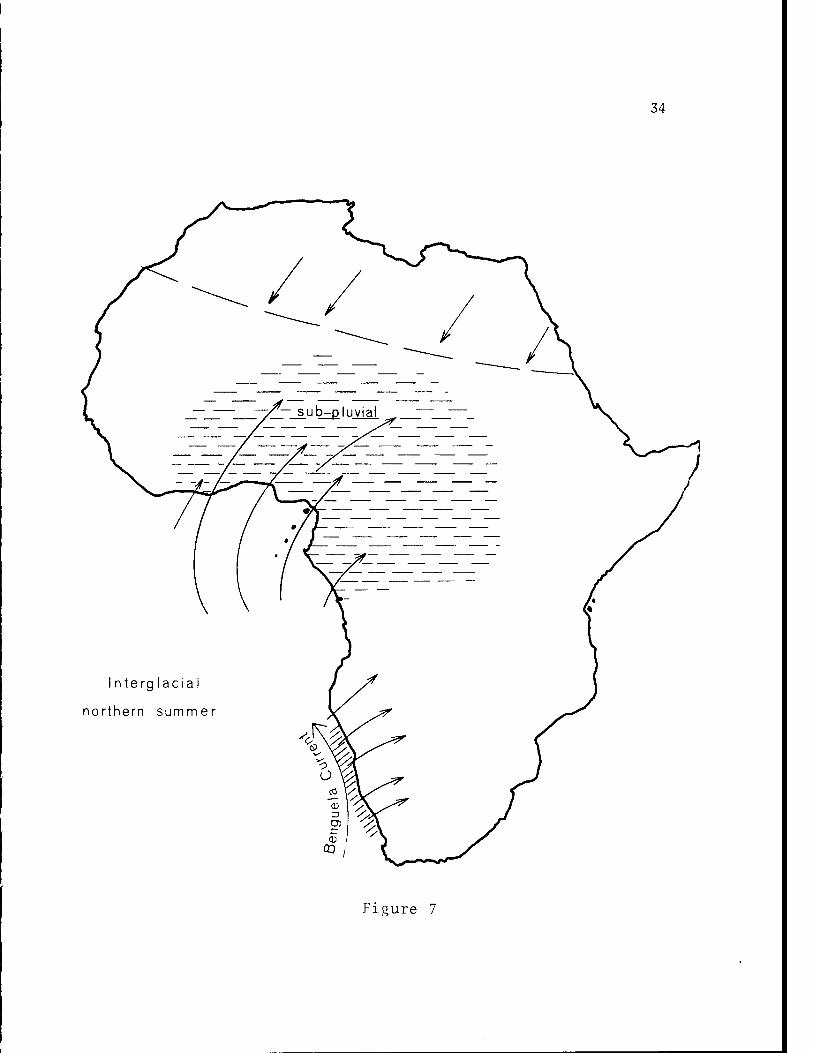
Figure 7. Schematic interpretation of the important climatic features
during an interglacial northern summer in western Africa
(after van Zinderen Bakker, 1967).
34
I nterglacia
northern summer
Figure 7
35
southeast trade winds are particularly important in driving the Benguela
Current (see below). As a result of the presence of a major cold water mass
adjacent to shore, convectional winds very near the coast tend to be relatively
dry.
The prevailing ocean winds are from the south or southeast. Winds
average between Beaufort force 4 and 5 but are slightly stronger during the
winter. North of 15°S the winds are more southerly and weaker.
In the interior of Angola and South West Africa easterly and south-
easterly winds predominate with the strongest coming from a more southerly
direction. Of particular interest with respect to potential offshore eolian
transport of sediment off southern Angola and South West Africa are the Berg
winds. These hot, dry, east winds blow from the plateau and generally are
strong, gusty, and laden with dust and sand. These winds occur commonly in
winter, lasting from several hours to several days, and have velocities of
over forty miles per hour (20 m/sec).
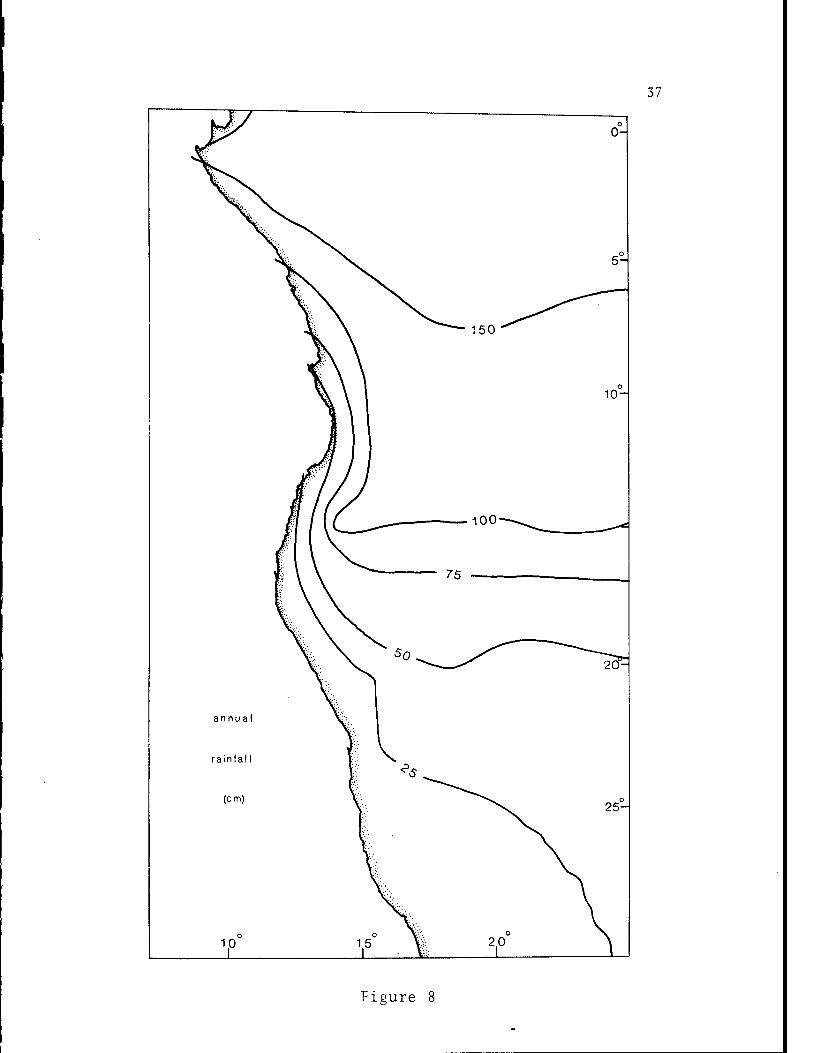
Most of the coastal region receives very little rainfall diminishing from
north to south. Typical annual precipitation is shown in Figure 8- Important
rains in Angola come in summer (October-April) and are chiefly convectional.
In the south, rain comes as occasional showers in late summer. The isohyets
in the study area closely parallel the coast (Figure 8) owing to the rapid
rise in elevation. East of Mocamedes, Angola, on the plateau, the rainfall
is more than 100 cm/yr resulting in the almost annual flooding of the rivers
of Angola, particularly the Cuanza, Cubal, Catumbela, Cuvo, Quicombo, and
Corpolo.
36
Figure 8. Pattern of average rainfall in Gabon, Congo Republic,
Angola, and South West Africa (after Flint, 1959).
37
IK \ " 150 "^
- 100--^^
o 0-
5°-
0 10-
^ S°-^
- 75 .
20^
annual
rainfal 1 1 V (cm) O
25-
o 1.5 • 1
o 2|0
Figure 8
38
OCEANOGRAPHY
Surface Circulation
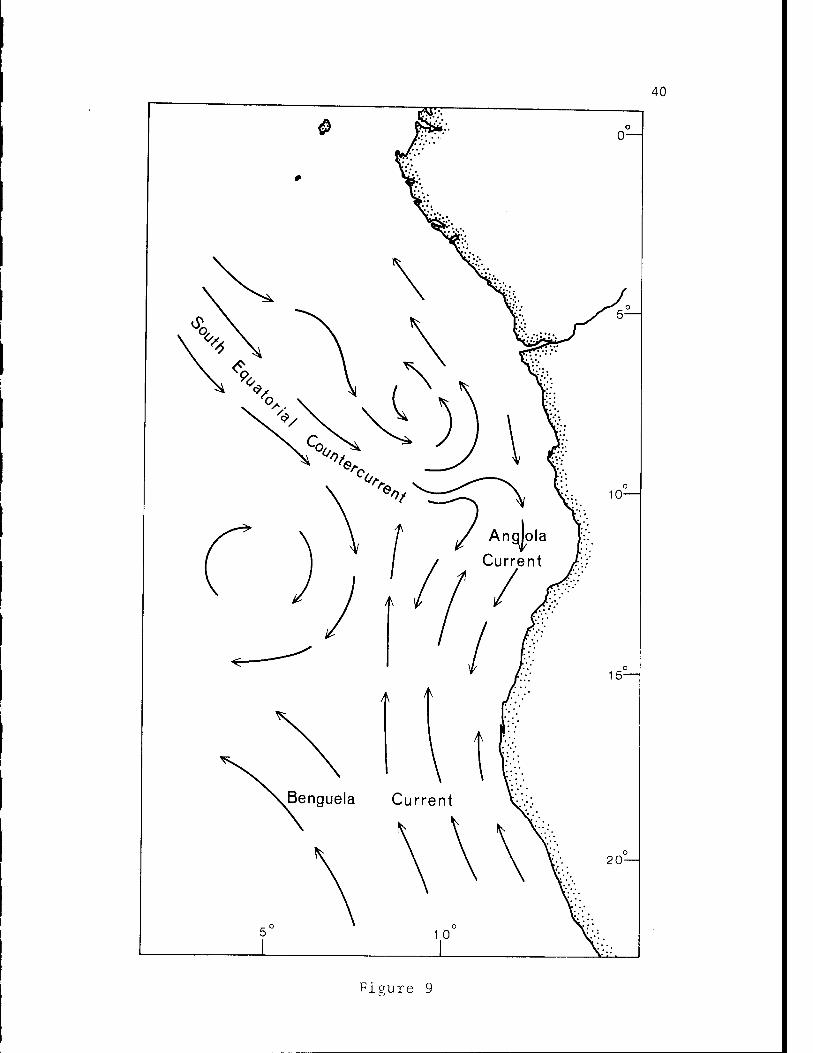
The pattern of surface circulation is dominated in the south by the
Benguela Current, in the north by the South Equatorial Countercurrent, and
between Lat. 10° and 20°S, by their confluence in a complex of surface cur-
rents and gyres (Figure 9).
Benguela Current
The Benguela Current, one of the world's major eastern boundary currents,
owes its existence to wind stress on the sea surface by south and south-
easterly winds and to the density gradients between cold upwelled water along
the coast and warmer, lighter water farther west. The water upwelled along
the South West African coast is South Atlantic central water, a mixture of
sub-Antarctic and sub-tropical waters (Schell, 1968). Drawn to the surface
from depths of between 150 and 400 m (becoming shallower at lower latitudes),
this deep water is characterized by its low temperature (10°-14°C), low
salinity (34.6-35. Q^,), high nutrient content, and low dissolved oxygen con-
tent.
The high nutrient content in surface waters causes high levels of bio-
2 logical productivity, up to 3.8 g C/m /day off South West Africa (Steeman
Nielsen and Jensen, 1957). Eutrophication reduces the oxygen levels, re-
sulting in the accumulation of organic, diatomaceous muds on the continental
shelf off South West Africa.
Upwelling and the consequent high productivity within the Benguela
Current decrease markedly north of about Lat. 23°S as the main branch of the
current leaves the coast to flow northwestward and westward (Figure 9). A
39
Figure 9. Pattern of surface currents over the eastern Angola Basin
(after Moroshkin et al., 1970).
40
o o—l
Figure 9
41
smaller branch continues inshore off the coast of Angola. According to
Moroshkin et al. (1970) this bifurcation of the Benguela Current between Lat.
20° and 15°S gives rise to a small zone of divergence over the north flank
of the Walvis Ridge. Current velocities also diminish from south to north,
being about 25-30 cm/sec off South West Africa and 15-20 cm/sec further north.
A southward-flowing countercurrent has been identified beneath the
Benguela Current (Hart and Currie, 1960). The core of this oxygen-depleted
current lies at approximately 300-400 m depth at 18°S; the flow is several
hundred meters thick and 400 km wide at this latitude. Its presence off South
Africa also has been noted by DeDecker (1970). No estimates of current
velocity have been made, though van Andel and Calvert (1971) suggest that such
a current in the past may account for the erosion they infer to have taken
place on the continental shelf between Lat. 20° and 25°S.
South Equatorial Countercurrent
This current flows generally eastward in a broad band between about Lat.
5° and 9°S with velocities on the south of between 7 and 10 cm/sec, increasing
to 30-50 cm/sec on the northern edge of the flow. The width and velocity of
the flow diminish markedly with depth; at 100 m depth the flow is about 150
km wide with velocities of about 3-5 cm/sec on the south and 15-25 cm/sec on
the north.
Between Lat. 8° and 9°E, the current turns south, dividing into two
branches. One forms an anticyclonic gyre centered at Lat. 7°30'S and Long.
9°30'E; the other flows southward providing a source for the Angola Current.
This latter name was proposed by Moroshkin et al. (1970) for the narrow,
stable, fast (> 50 cm/sec) southward flowing current along the Angolan coast.
The orientation of shoreline features indicates that longshore drift,
42
from South West Africa to Cape Lopez, is towards the north.
Influx of Fresh Water
The Congo River represents the only major source of fresh water off
west Africa between the Niger and Orange Rivers. In terms of discharge it
9 3 ranks as the second largest river in the world (1,400 x 10 m annual dis-
charge), its rate of discharge varying between 26,000 m /sec in August to
3 nearly 60,000 m /sec in December (Donguy et al., 1965).
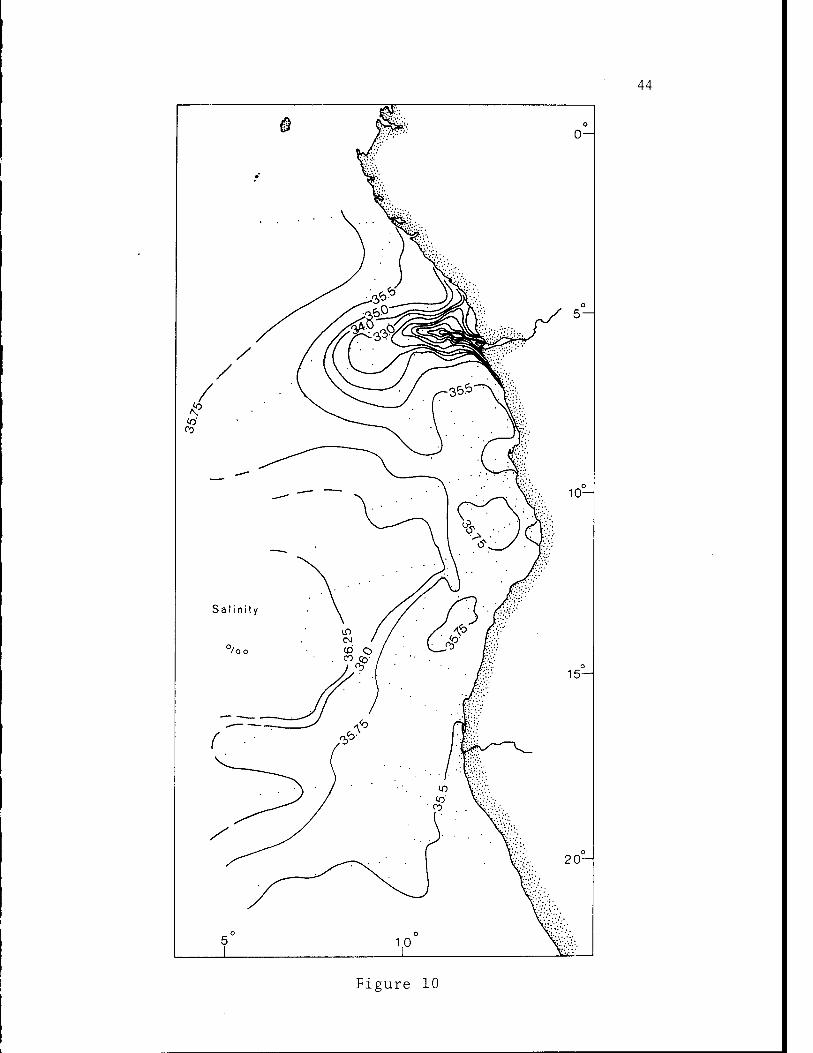
Congo River water moves to the northwest as it enters the Atlantic
Ocean (Figure 10). At about Long. 11°E, the tongue broadens and moves to the
south-southwest as far as about Long. 9°E where salinities of 35#0 are at-
tained. A broad region of slightly lowered salinity can be traced as far
south as Lat. 9°S. In reality, however, this view of the Congo discharge is
too simplistic: detailed continuous salinity measurements made during the
WALDA expedition showed that the Congo River water is distributed in many
narrow "streams" of low-salinity water separated by regions of nearly normal
salinity.
Deep Circulation
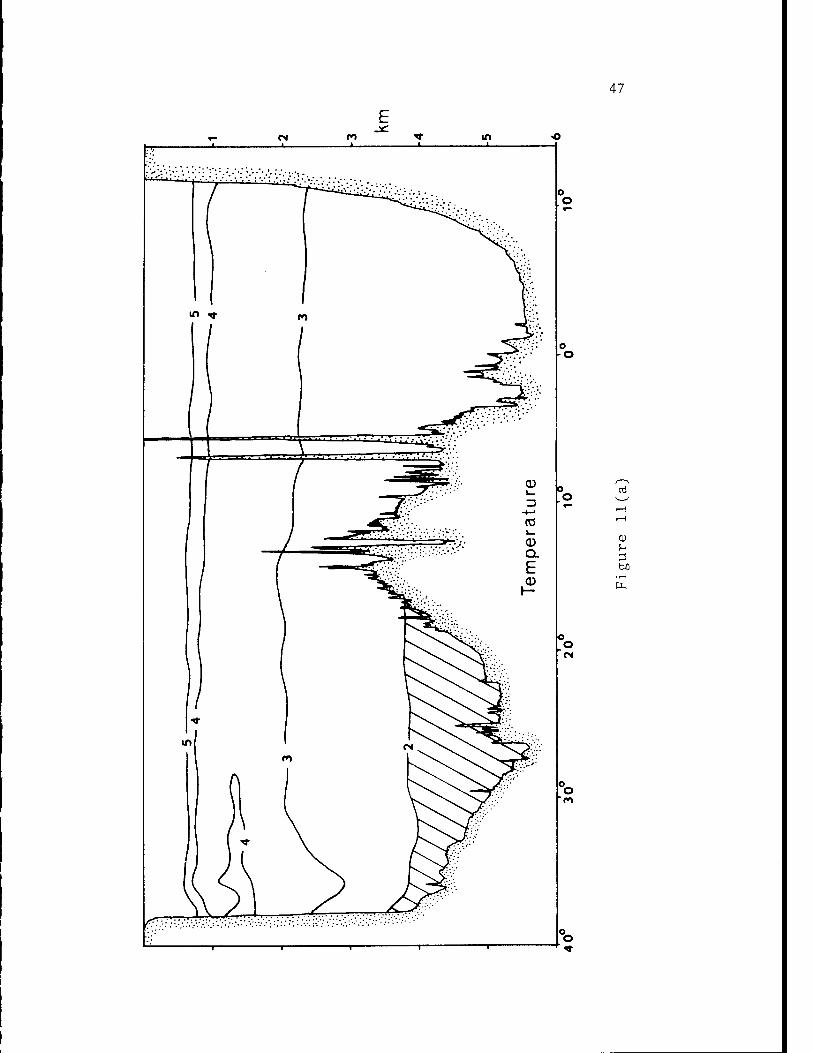
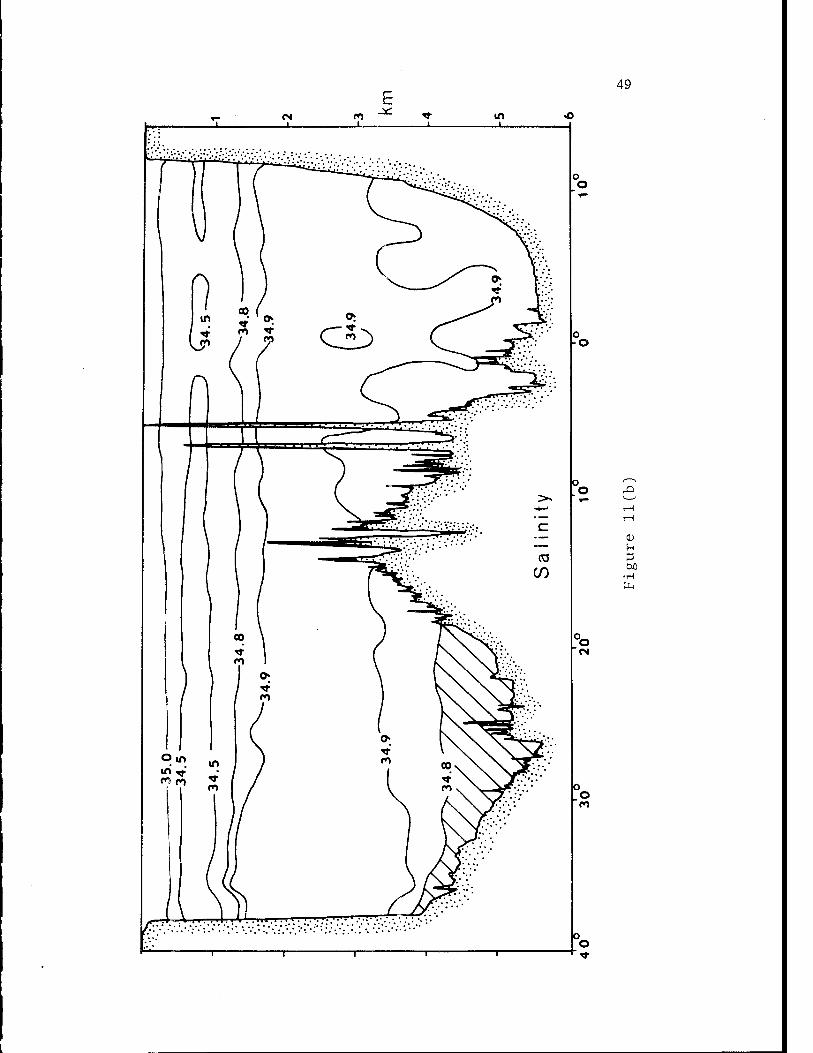
The contrasting bottom water characteristics of the Angola Basin (2.4°C,
34.89$o) and the Cape Basin and western basins of the South Atlantic (1.5°C,
34.77/£>) led Wüst (1933) to conclude that Antarctic Bottom Water was prevented
from spreading into the eastern basins (Angola and Guinea) by the Walvis
Ridge to the south and the Mid-Atlantic Ridge on the west. The differences
in salinity and temperature between the Brazil Basin and the Angola Basin are
shown in the east-west profile at Lat. 16°S taken from Fuglister (1961) (Fig-
43
Figure 10. Salinity distribution in surface waters overlying the
Angola Basin based on data collected from the N/0 "Jean
Charcot" during the WALDA expedition of 1971 and from the
R/V "Atlantis II" during the Eastern Atlantic Continental
Margin Study of 1972.
44
Figure 10
45
ure 11).
On the basis of data presented in Fuglister (1961), Shannon and von
Rijswijck (1969) believed that a small amount of water enters the Angola
Basin through a narrow gap in the Walvis Ridge at about Lat. 31°S. Based on
nephelometer studies, Connary and Ewing (1972) reached the same conclusion.
A small amount of bottom water enters the Guinea and Angola Basins
through equatorial fracture zones, in particular the Romanche Fracture Zone
(Figure 12). Metcalf et al. (1964) determined that the sill depth in these
fracture zones was at approximately 3750 meters. In turn, the Guinea and
Angola Basins are separated by a sill at approximately 4100 meters depth
(Connary and Ewing, 1972).
Wüst (1957) calculated geostrophic currents for the deep waters of the
Angola Basin and concluded that the circulation was very sluggish (everywhere
less than 5 cm/sec). Temperature and salinity data suggest that essentially
homogeneous water exists below 4500 meters. Connary and Ewing (1972) found
that the main nepheloid layer occupies the same homogeneous water mass,
where settling velocities of particles are balanced by turbulence. They also
found that light scattering within the Angola Basin was six times less in-
tense than in the western North Atlantic and four times less than in the
western South Atlantic and Cape Basin, further attesting to the sluggish cir-
culation in this basin.
Photographic evidence also suggests slow bottom circulation. Heezen et
al. (1964) state: "The photographs indicate a generally muddy bottom with
fairly abundant tracks and trails, and indicate a tranquil bottom unaffected
by ocean currents." (p. 1140).
In light of the proposed slow circulation, the presence of well defined
abyssal swells along the continental rise off southern Angola and along the
46
Figure 11. (a) East-west profile of temperatures across the South
Atlantic Ocean at Lat. 16°S (after Fuglister, 1961)
47
m i_
in *
■ ■ -■ .'■ ■- ■■.. ■ -•■■■ . ■■■■ •':■■■■■'.■rrr
o
O
•H
°o
48
Figure 11. (b) East-west profile of salinity across the South Atlantic
Ocean at Lut. 16°S (after Fug]ister, 1961).
49
CM i_
>^ v" v—'
-4—• i—i T—1
c <D
— JH
CO 3
CO •H
o CM
PM
o CO
o
50
Figure 12. Distribution of potential temperature of bottom water
( > 4000 m) in the South Atlantic (after Wüst, 1933).
Diagonal hatching indicates water of less than 1.6°C;
horizontal hatching indicates water of greater than
1.6°C.
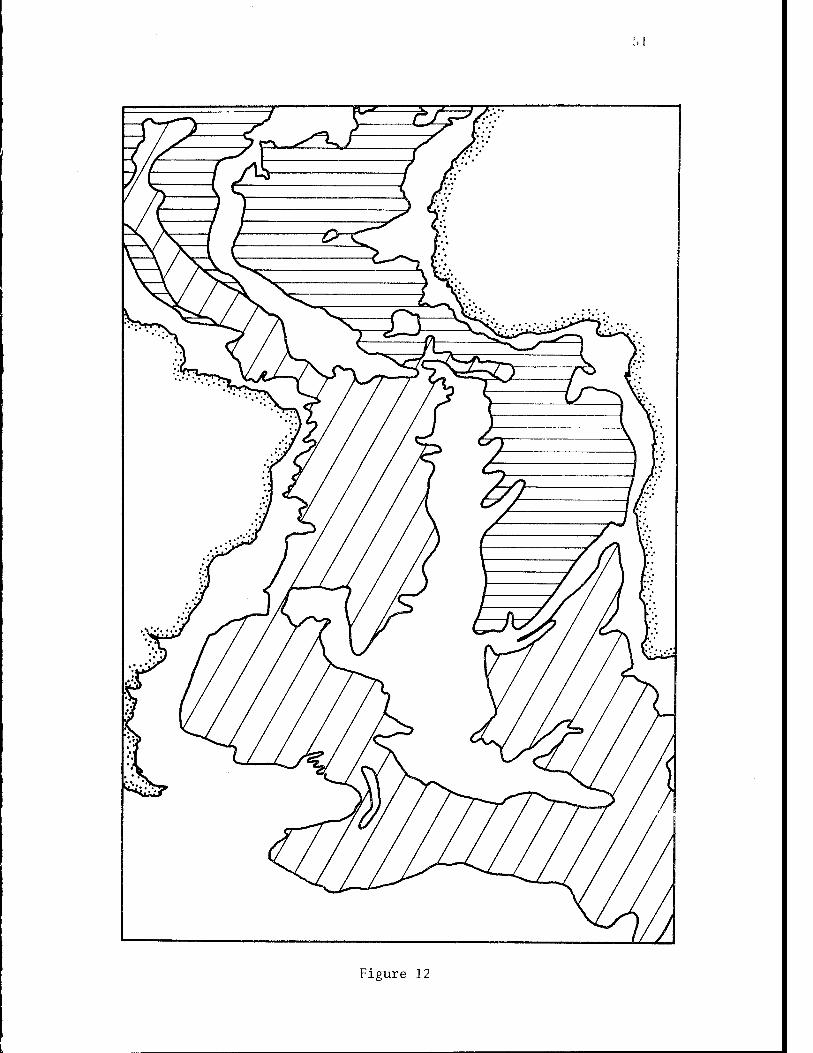
Figure 12
52
lower Walvis Ridge seems anomalous. Though they are not as well developed as
similar features along the eastern United States, these swells may have the
same mode of origin, formed by currents flowing along the continental rise.
Since present currents do not seem capable of producing such features, it can
be assumed: (1) they were not formed by abyssal currents; or, (2) they were
formed at a time when abyssal circulation was more vigorous, perhaps during
glacial periods of the Quaternary. At present the lack of data does not
permit us to choose between these alternatives, though the regularity in size
of these features, their position on the rise, and their form tend to argue
against another mode of origin, such as slumping or sliding.
Paleoclimatology and Oceanography
Variations in environmental conditions within the study area during the
Quaternary undoubtedly had a significant effect on both the terrigenous and
biogenic sources of sediment for the continental margin. Most of the Pleisto-
cene climate research has been conducted in southern and eastern Africa and
has been related primarily to the redistribution of early man and other ver-
tebrates in response to climatic changes (e.g., Cooke, 1947; Jones, 1944;
Moreau, 1933; Leakey, 1949). Angola, South West Africa, and the western Congo
have been very poorly studied, except for a few isolated sites (van Zinderen
Bakker, 1963; van Zinderen Bakker and Clark, 1962; Voss, 1970; de Ploey, 1963,
1964, 1965).
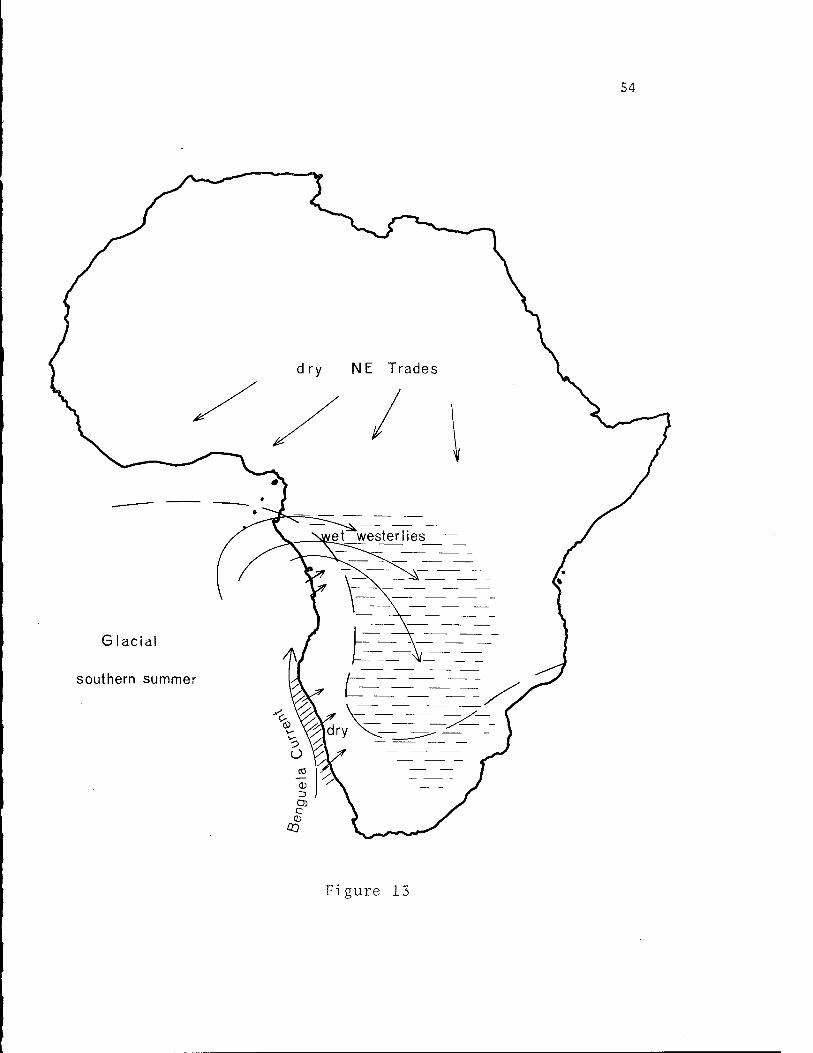
Figures 13 and 14 illustrate van Zinderen Bakker's (1967) interpretation
of the climatic conditions during glacial intervals. The following are the
major differences between glacial and interglacial climatic extremes:
(1) The center of the South Atlantic Anticyclone (high pressure) shifted
northwards (by 8 to 12 degrees) and eastward during glacials.
5.3
Figure 13. Schematic interpretation of the climatic features during
a glacial southern summer in western Africa (after van
Zinderen Bakker, 1967). Horizontal dashed lines indicate
pluvial conditions; diagonal lines indicate upwelling.
54
Glacia
southern summe
Figure 13
55
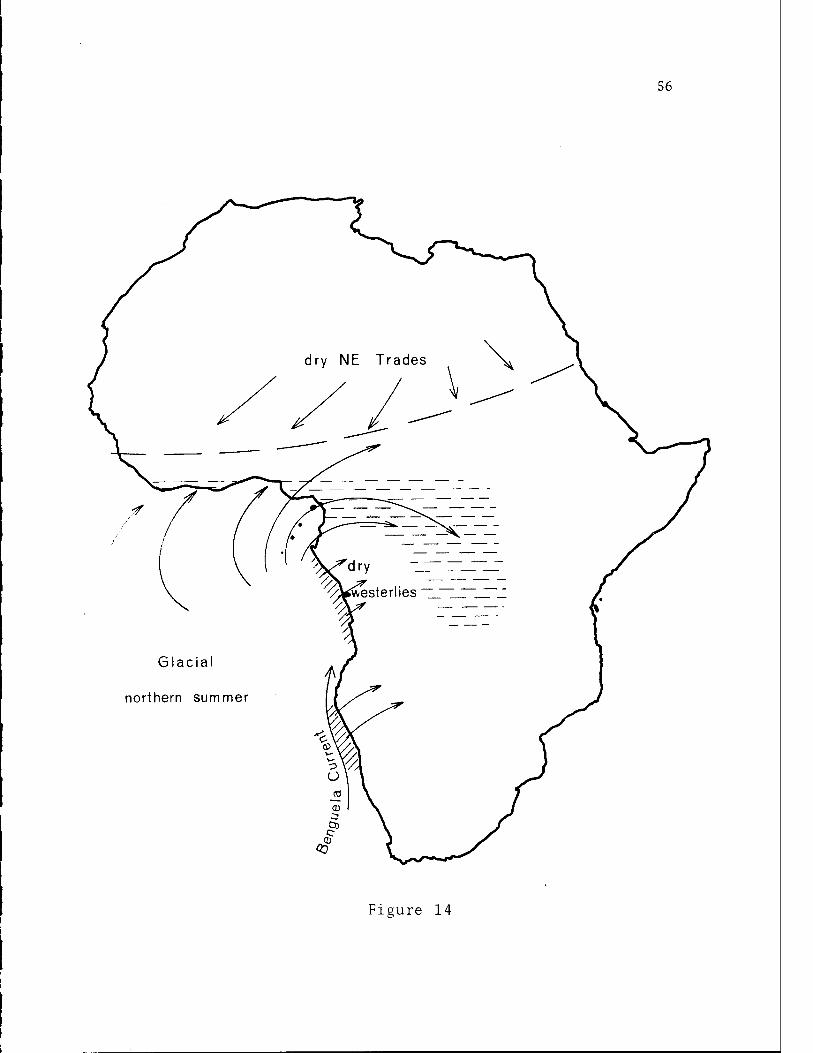
Figure 14. Schematic interpretation of important climatic features
during a glacial northern summer in western Africa (after
van Zinderen Bakker, 1967).
56
Glacial
northern summer
Figure 14
57
(2) During glacial summers, pluvial conditions extended southward in the
interior from the equator to near the southeast coast of Africa
(28°S). During interglacial summers, pluvial conditions were re-
stricted to the Congo Basin (north of Lat. 10°S).
(3) There was a marked intensification and northward extension of the
Benguela Current during the glacial periods. This is indicated by
the northward extension of the Namib Desert during glacials. Van
Andel and Calvert (1971) also suggest that the Benguela Current
flowed faster during times of lowered sea level, in order to ac-
count for the erosion surfaces they observed along the shelf off
South West Africa.
(4) Intensive upwelling, particularly during winter, occurred during
glacials off the Congo Republic, Gabon, and northern Angola. This
did not occur during interglacials.
The direct correlation between glacial conditions in higher latitudes and
pluvial conditions in central Africa has been the focus of several investi-
gations and has generated considerable controversy (van Zinderen Bakker, 1966;
Flint, 1959). Based on a wide variety of evidence from sites throughout sub-
Saharan Africa, van Zinderen Bakker (1972) concludes:
(1) temperature changes coincident with those of the northern hemisphere
also occurred in tropical Africa;
(2) changes in humidity were correlated with temperature changes; and,
(3) the "glacial" climate of tropical Africa was drier and the "inter-
glacial" climate wetter than at present.
As van Zinderen Bakker points out, however, this relationship does not apply
to extratropical regions.
58
Glacial aridity in this region was probably further intensified along the
Angola and Congo coastal areas by the more northward penetration of the Ben-
guela Current and the onset of upwelling conditions along suitably aligned
coastal regions between Luanda and Cape Lopez. According to van Zinderen
Bakker (1967), supported by the work of de Ploey (1963) and Clark (1962),
there was a "desert climate along the coast and a semiarid region reached far-
ther inland, reaching as far as Leopoldville (400 km inland)." These semi-
arid conditions also would have reached as far as central Angola, giving it
a semiarid, cool climate during glacial periods. Fairbridge's (1964) studies
on the distribution of fossil dunes in central Africa also support this con-
clusion. The dry conditions undoubtedly had a significant effect on the
hydrologic regime of the Congo River, the single most important source of
terrigenous sediment for the Angola Basin. This is perhaps of even greater
relevance since most of the sediment delivered to the ocean is derived from
runoff below Stanley Pool (Heezen et al., 1964), a region that was desert or
semi-desert during glacial periods.
Data from earlier than approximately 65,000 years B.P. are completely
lacking for this region of Africa. In addition, no attempts have been made
to determine the precise temperature and rainfall changes that took place
between glacial and interglacial periods, though van Zinderen Bakker and
Clark (1962) and van Zinderen Bakker and Coetzee (1972) suggest that the re-
gion in northeastern Angola experienced temperatures equivalent to at least
500 m greater altitude during the period between 30,000 and 14,000 years B.P.
This was followed by a warmer, humid phase (the Makalian Wet Phase) during
which a climatic optimum was reached (approximately 7,000 to 4,500 years B.P.).
59
DISTRIBUTION OF SUSPENDED MATTER
Surface Suspended Matter
Suspended Matter Distribution
Throughout the WALDA expedition and the "Atlantis II" Cruise 67 surface
suspended matter samples were taken in an effort to determine the pattern of
dispersal of fine sediment in the surface waters off the west coast of Africa.
In addition, Forel color determinations were made during daylight hours and
clay mineral determinations were made on selected samples collected on silver
filters. Temperature and salinity were also recorded when samples were taken.
The results from the "Atlantis II" cruise have been reported by Emery
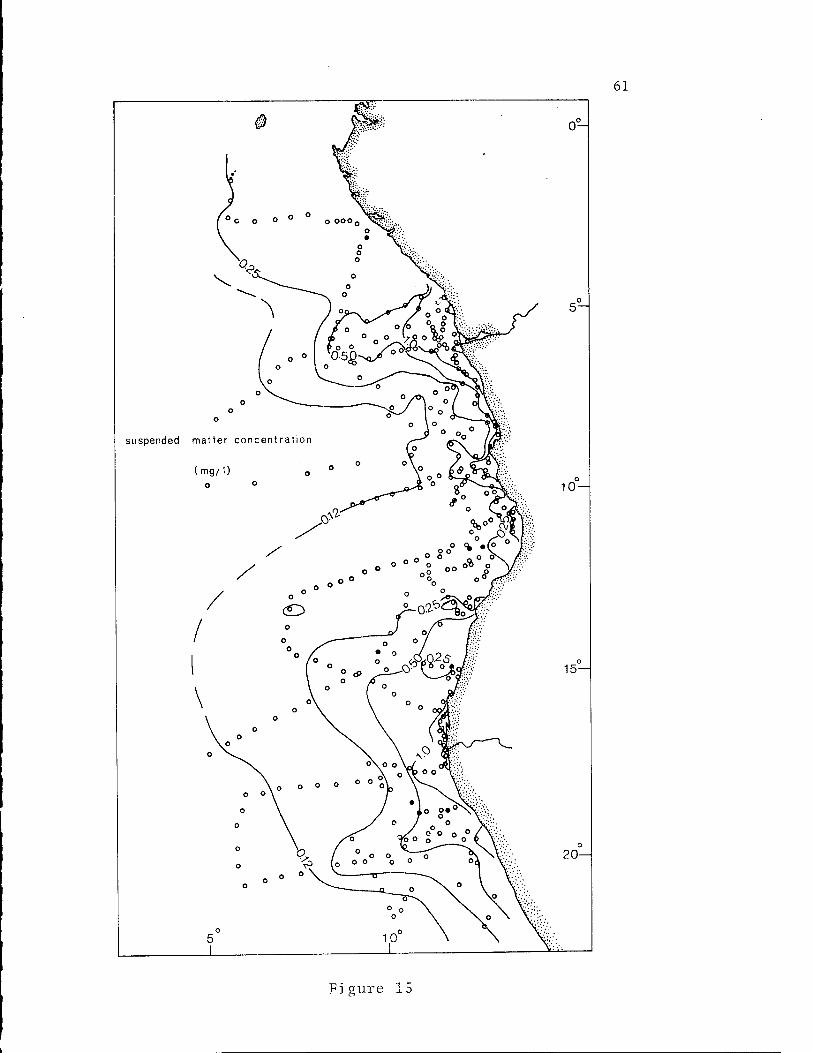
et al. (1973). The combined results from the French and American cruises for
suspended matter concentration (Figure 15) show several significant features:
(1) the broad band of high sediment concentration off South West Africa
and southern Angola;
(2) the high concentrations off major rivers, such as the Kunene,
Cuanza, and Congo; concentrations 150-200 kilometers from the mouth
of the Congo River may exceed 1.0 mg/1;
(3) the large offshore area with very low (less than 0.12 mg/1) concen-
trations between Lat. 7°S and 10°S.
The plume of high sediment concentration from the Congo closely parallels
the salinity distribution (Figure 10). Within the low salinity region off the
Congo, the "Atlantis II" results were consistently lower than the WALDA re-
sults (Figure 16), although they converged at salinities above 35%c. These
discrepancies were apparently not the result of a systematic analytical error
since the "Atlantis II" results off southern Angola were consistently higher
than the WALDA data, and elsewhere were quite compatible. Rather, this dif-
60
Figure 15. Distribution of total suspended matter (mg/1.) off southwestern
Africa based on samples collected from the N/O "Jean Charcot"
during the WALDA expedition of 1971 and from the R/V "Atlantis
II" during the Eastern Atlantic Continental Margin Study of
1972. Solid points are locations of deep-water stations.
61
suspended matter concentration
(mg/l)
o°H
10-
15-
20—
Figure 15
62
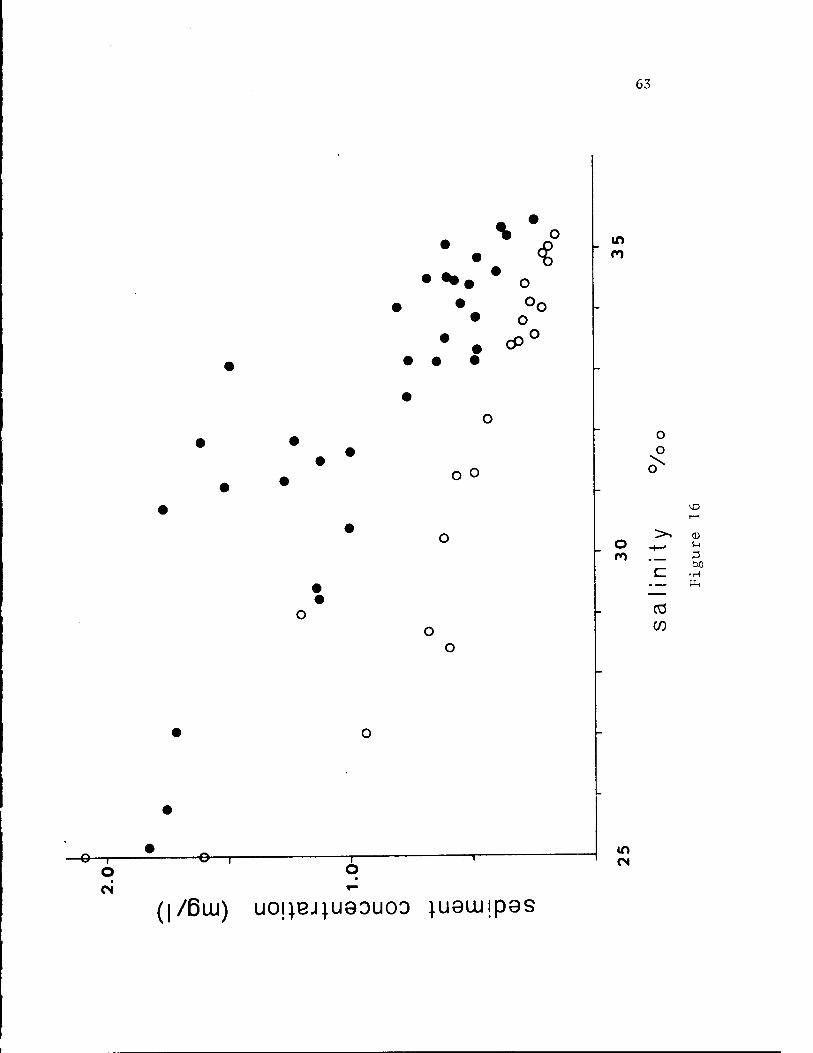
Figure 16. Relationship between salinity and total suspended sediment
concentration off the Congo River based on data from the
"Atlantis II" ( O ) and tne "Jean Charcot" (® ).
63
<%
in en
• • cP
o o
o o
o
M3 t-H
V-,
CO 05
O i o
-e—r o
(I/BLU) UO!^BJ|U9DUOD juauiipas
in
64
ference probably reflects that change in river discharge between June and
3 July, the times of the two cruises. On the average, approximately 5 x 10
m /sec more water is discharged in June than in July (Donguy et al., 1965).
One possible explanation for these differences is that during periods of
high river discharge, the distance from the river mouth to a particular iso-
haline is greater than at times of lowered discharge. This increased dis-
tance may permit more suspended matter to leave the surface waters and to
sink towards the bottom than would occur during periods of lower flow rate.
This would be particularly true if the sediment-discharge relationship were
found to be a convex-upward curve; as pointed out by Bornhold et al. (1973),
considerably more detailed studies are needed to establish the exact mechanisms
controlling the dispersal of fine sediment into the ocean from major rivers.
The high suspended matter concentrations off South West Africa and
southern Angola are directly related to the Benguela Current and the high
biological productivity associated with it (Steeman Nielsen and Jensen, 1957).
Combustible organic matter concentrations exceed 0.25 mg/1 in a band several
hundred kilometers wide along the coast south of 14°S (Emery ej: al., 1973).
In addition, organic concentrations are high off major rivers such as the
Congo and Kunene; much of this organic material probably is derived from the
continent, as evidenced by the frequent observation of roots and branches of
trees offshore from these rivers. In addition, however, much of the measured
organic matter off major rivers probably results from increased phytoplankton
productivity produced by the high nutrient concentrations in the river waters.
The suspended matter distribution off central Angola, Congo, and Gabon
is closely related to the circulation scheme proposed by Moroshkin et al.
(1970). The zone of low sediment concentration off central Angola corresponds
to the eastward influx of water originating in the South Equatorial Counter-
65
current. The path of Congo River water as it enters the Atlantic is also
controlled by the bifurcation of the South Equatorial Countercurrent as it
approaches the coast (Figure 9). Further north, suspended matter from the
shelf off Gabon is carried northward into the Gulf of Guinea (Bornhold et
al., 1973).
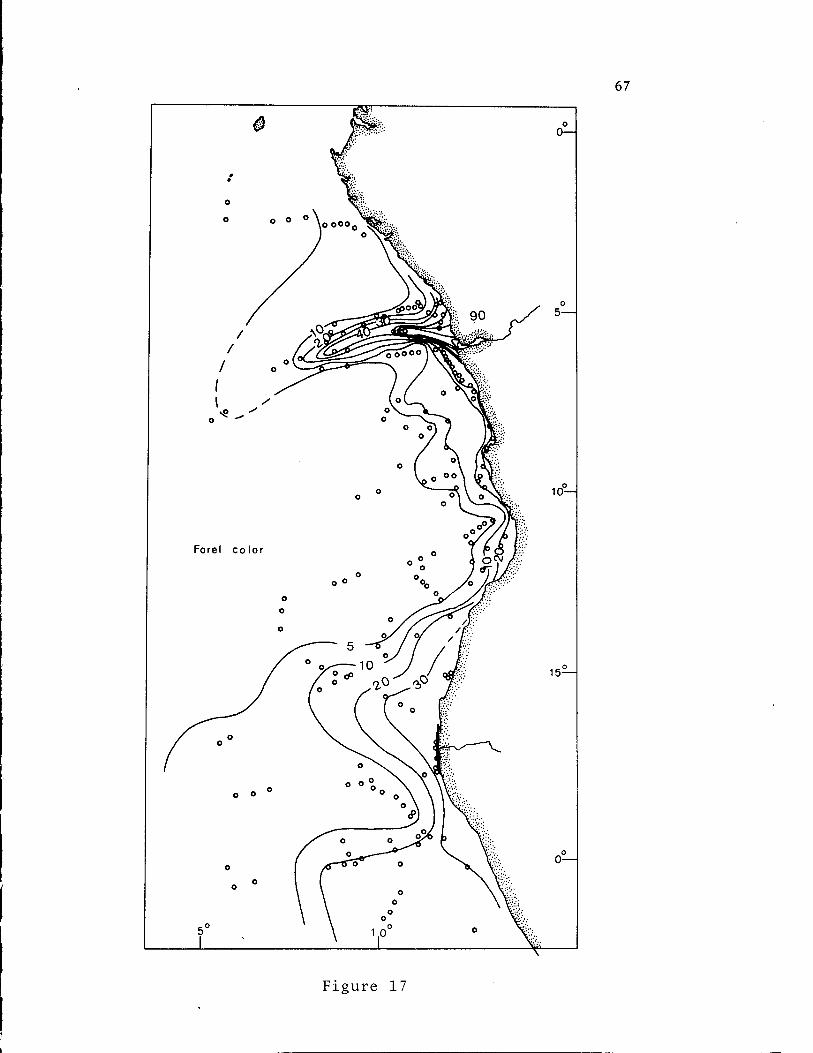
The results of Forel color determinations (Figures 17 and 18) closely-
parallel the total sediment concentration, as do Secchi disc transparency-
results (Figure 19) (Emery et al., 1969; Manheim et al., 1970; Bornhold et
al., 1973).
Composition of Suspended Matter
X-ray diffraction studies of 21 suspended matter samples collected on
silver filters revealed significant latitudinal differences in the importance
of particular clay minerals. Off southern Angola and South West Africa,
montmorillonite is dominant with lesser amounts of illite and kaolinite.
North of central Angola, however, montmorillonite is much less abundant and
the clay-mineral assemblage is dominated by kaolinite. This is particularly
evident within the plume of river water from the Congo where kaolinite is
extremely abundant. Talc was present in all of the samples analyzed; this
mineral has also been noted in other studies of suspended matter in open
ocean waters (Emery et al., in press; Summerhayes, personal communication).
Chlorite was detected in only a few of the samples.
Twenty sections of Millipore filters of suspended matter were mounted in
cedar oil and viewed under a petrographic microscope. Commonly observed
constituents included: diatoms, radiolaria, silicoflagellates, dinoflagellates,
marine algae, fecal pellets, organic aggregates, and inorganic grains.
Fecal pellets (Figure 20) were elongated, oval, dense aggregates of
66
Figure 17. Distribution of Forel color (% yellow) of the sea surface
based on the combined data from the "Jean Charcot" and
the "Atlantis II".
67
o OH
10-
15-
Figure 17
68
Figure 18. Relationship between Forel color and suspended matter
concentration in surface waters over the eastern Angola
Basin based on data from the "Jean Charcot" (O ) and
the"Atlantis II" ( £ ) .
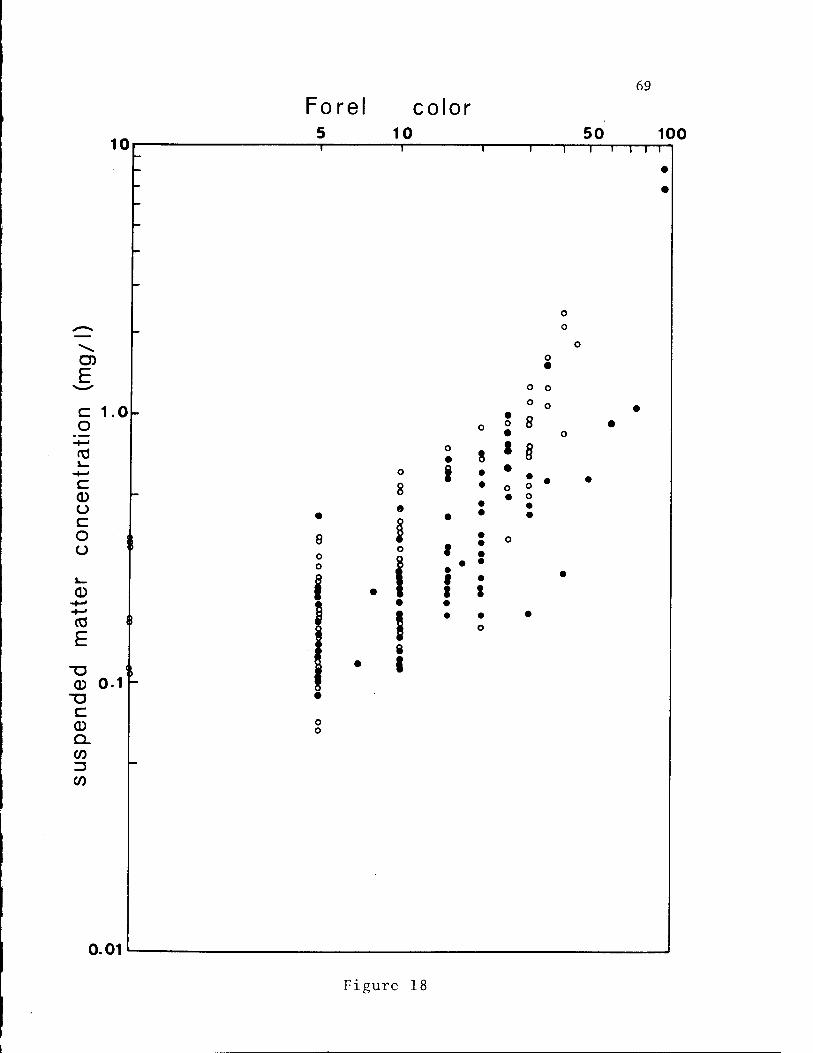
69
Forel color 5 10 50 100
0.01
Figure 18
70
Figure 19. Distribution of Secchi disk transparency based on Capart
(1951) and Gallardc et al. (1969).
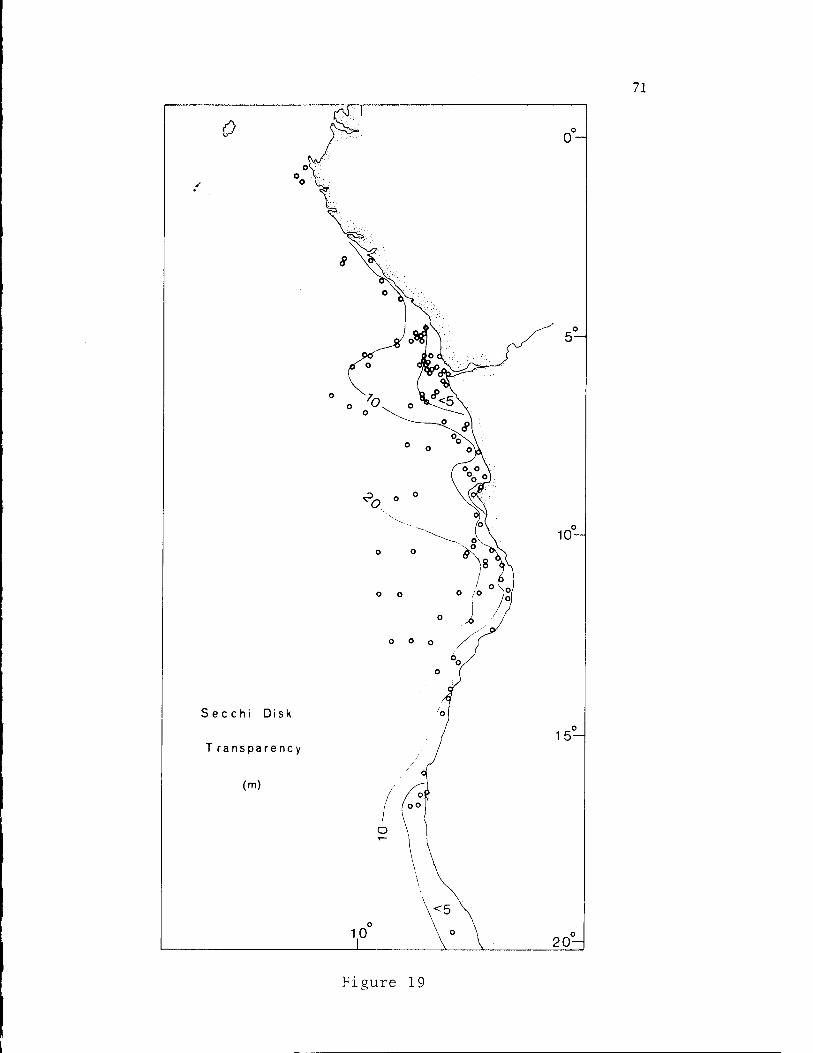
71
Figure 19
72
Figure 20. Photomicrograph of a fecal pellet in a suspended matter
sample off Angola. Scale bar represents 50u.
o
0)
bJD
•H PH
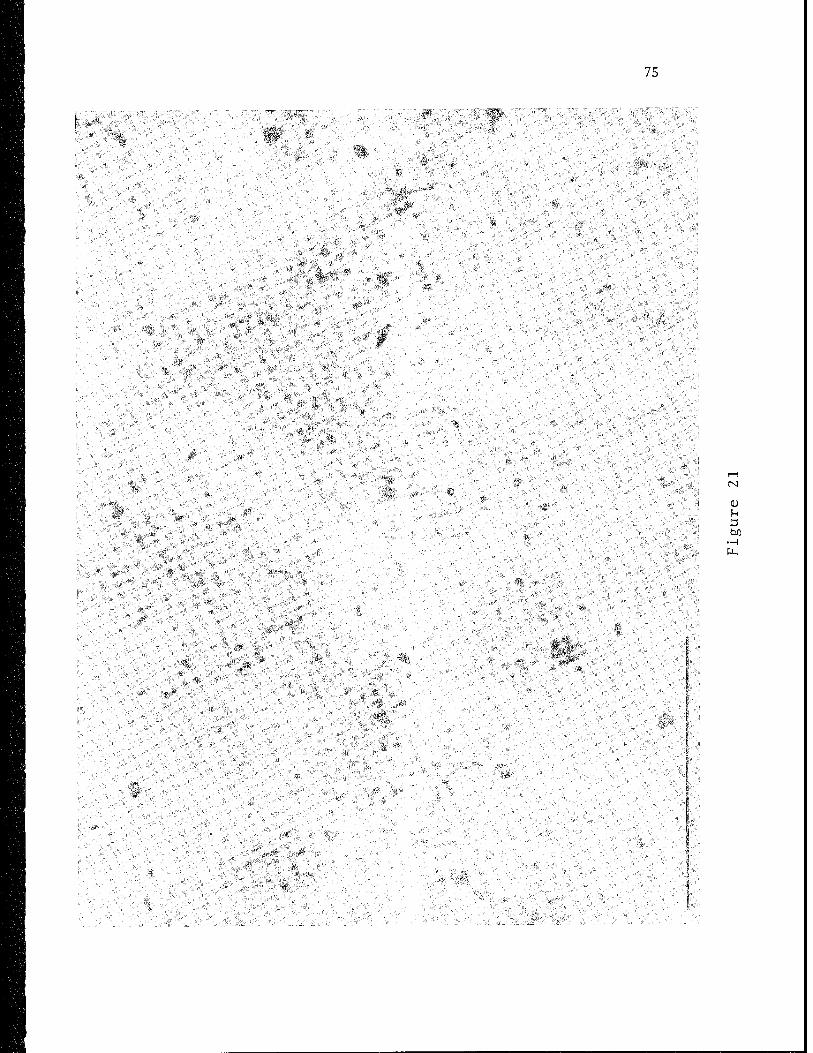
74
Figure 21. Photomicrograph of an organic aggregate in a suspended
matter sample off Angola. Scale bar represents 50\i.
:W:
^:^%P:
%
75
r<i
■m
bo
It
U-.
4%.
76
diatom debris and organic matter. Organic aggregates were, by contrast, more
diffuse "mats" of organic matter with diatoms and inorganic debris adhered to
the surface (Figure 21).
Considerable latitudinal variation is apparent in the density and diver-
sity of diatoms and other components. Silicoflagellates and dinoflagellates
are particularly abundant in the southern part of the area (south of Lat.
10°S). Diatoms reach their highest diversity in the southernmost part of the
region (south of Lat. 15°S) and in samples off the Congo River mouth; between
about Lat. 8° and 15°S very impoverished diatom floras are found. Fecal
pellets and organic aggregates follow the same trend as diatoms, with the
latter being very abundant off the Congo River mouth.
Suspended Matter in the Deep Water
In addition to surface water data, ten stations (Figure 15) were oc-
cupied during the WALDA expedition where suspended matter concentrations were
measured on the near-bottom water off the Angola Basin. These samples were
taken with either a 30-liter Niskin bottle or two van Dorn samplers placed
approximately 10-15 meters above a bottom camera. Because of the very pre-
cise way in which the camera was maintained at or near the bottom, it was felt
that very little sediment was roiled into suspension by the camera frame.
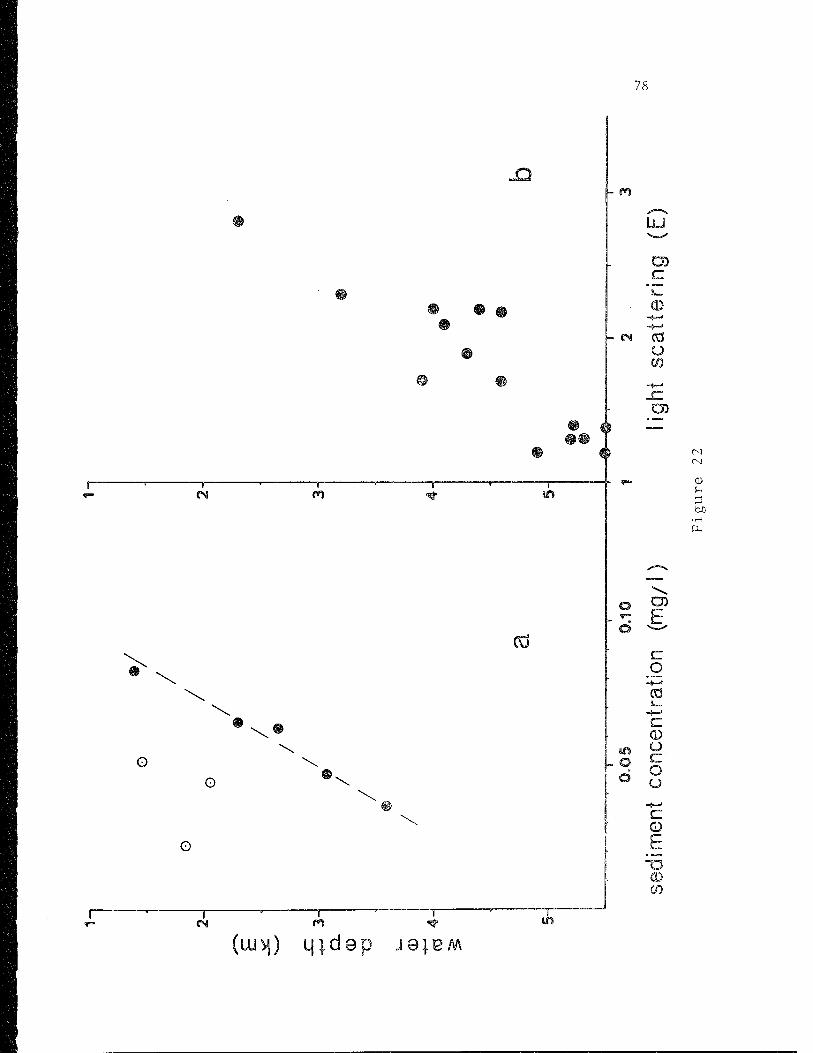
The near-bottom suspended matter concentrations in the Angola Basin ex-
hibit a linear decrease with depth below 1000 meters (Figure 22a). Three
stations (filter numbers 129, 130, and 160), which show distinctly lower
values, were taken within the rough topography of the Angola diapir field.
The topography of the Angola diapir field protects the near-bottom water from
the lateral transport of suspended matter (possible originating from the
Congo River as suggested by Connary and Ewing, 1972). The uniformly linear
77
Figure 22. (a) relationship between suspended matter in near-bottom
water and water depth for eight stations off Angola occupied
during the WALDA expedition.
(b) relationship between light scattering (E) and water depth
for deep nephelometer stations in the Angola Basin (based
on data in Connary and Ewing, 1972).
78
- n
SU
C
0 -s—>
Oi CO o CO
CD
o OD h o
C o
-$—• CO L_
-j~J
c CD
m o m L_
6 o -«—1
£ 0 E
"O CD CO
0)
•H
(UJV|) L|}dap J8|BM
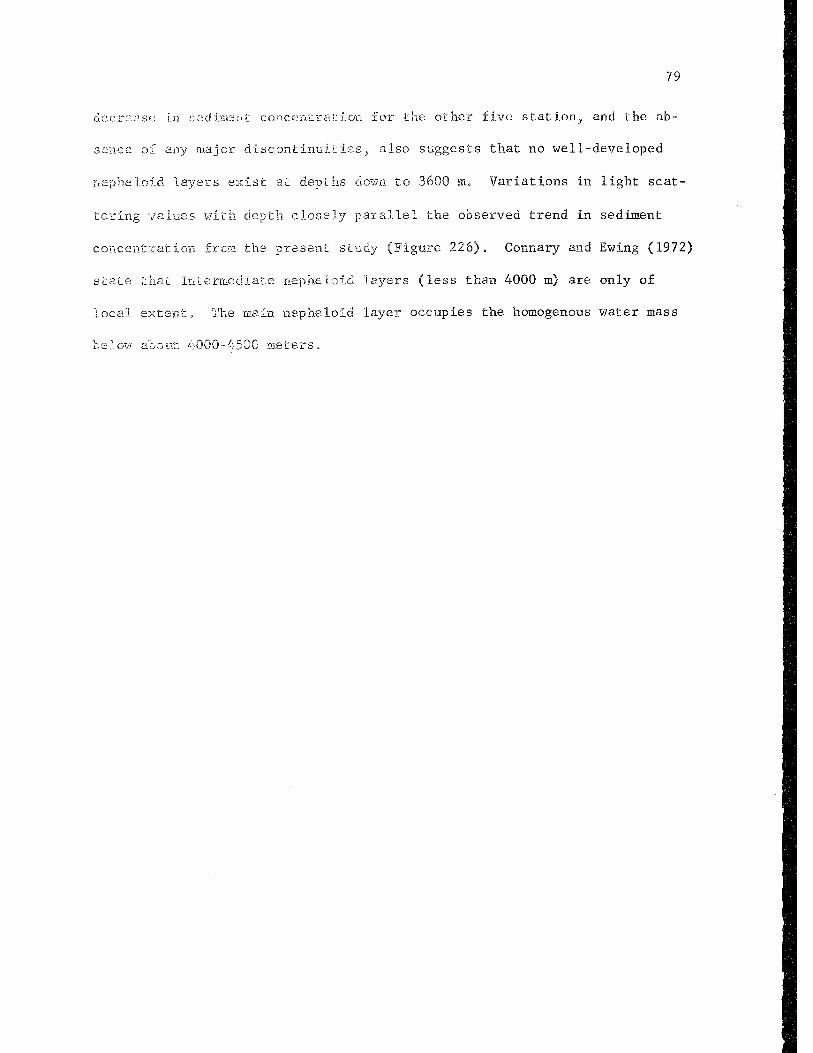
79
decrease in .sediment concentration for the other five station^ and the ab-
sence of any major discontinuities;, also suggests that no well-developed
nepheloid layers exist at depths dox-m to 3600 m. Variations in light scat-
tering values with depth closely parallel the observed trend in sediment
concentration frcm the present study (Figure 226). Connary and Ewing (1972)
state that intermediate nepheloid layers (less than 4000 m) are only of
local extent. The main nepheloid layer occupies the homogenous water mass
below about 4000-4500 meters.
80
RECENT SEDIMENTS
Surface sediments from the continental shelf., slope, rise, and abyssal
plain were analyzed for texture, percent calcium carbonate, clay minerals,
and organic carbon in an effort to determine the nature of sedimentation
during the Holocene in the eastern Angola Basin. The samples were also
studied under a binocular microscope and the abundances of the major com-
ponents were noted. The results of the analyses of surface sediments are
found in Appendix II. The methods used in the analyses are outlined in de-
tail in Appendix III.
Surface Distribution of Calcium Carbonate
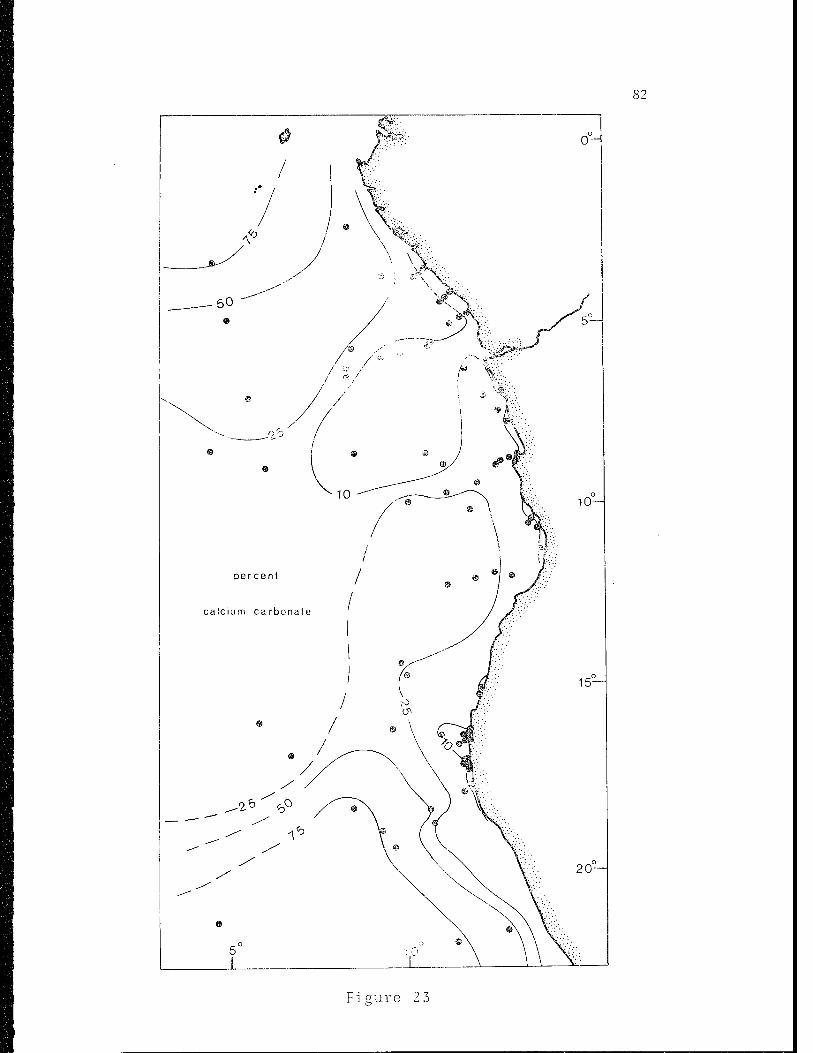
Calcium carbonate content of surface sediments varies considerably
throughout the study area (Figure 23). Continental shelf sediments off Gabon,
Congo, and Angola are characterized by carbonate values of less than 20%.
Sample density is too scattered in most areas to detect any trends among
these samples, although inner shelf samples appear to contain, in general,
less than 101 CaCO , whereas outer shelf samples contain between 10 and 20%.
Carbonate values on the continental, rise off central AngoLa are approx-
imately 25-457,, diminishing seaward to less than 207». This seaward diminution
is primarily controlled by the increasing carbonate dissolution with depth
below 5000 m as evidenced by the corroded appearance of foraminiferal tests.
The Congo Cone is characterized by carbonate values of less than 157o as a
result of the tremendous influx of terrigenous sediment through the Congo
canyon system. The sediments on the Walvis Ridge and Guinea Rise contain more
than 807» carbonate. The Walvis Ridge, isolated from major terrigenous sediment
sources, is dominated by biogenic sediments, as is the Guinea Rise, located
81
Figure 23. Distribution of calcium carbonate in surface sediments
from the eastern Angola Basin and adjacent areas.
82
Figure 23
83
in a region of high surface carbonate productivity.
Clay Minerals
An investigation of the clay ■•mineral composition of Angola Basin
sediments was undertaken in order to: (1) attempt to define the present
ciay-slneral provinces; and, (2) attempt to describe the changes in clay-
mineral abundances throughout the late Pleistocene and Holocene.
Methods
The less-than-2-micron fraction was separated by centrifugation,
sadimented on a silver filter (Selas Flotronics; 0.45u nominal pore size),
and scanned at 2°/minute on a Norelco x-ray diffractometer (nickel filter,
Cu KsC, 40 Kv, 40 ma). The sample was then glycolated by the vapor pressure
technique and scanned again. Some samples were then heated to 400° and
500°C and reanalyzed.
The method for determining mineral percentages is based on weighted peak
area and is summarized by Biscaye (1965). This method was selected primarily
for comparison purposes: Biscaye is the only other worker to have analyzed
the deeo'-sea clay-mineral composition of sediments in this region of the
South Atlantic. As Biscaye (1965) pointed out, however, "the weighted peak-
area percentages...are constructs and, at best, are untestable approximations
of real otrcentafes."
The following clay minerals were identified In this study: montmorillon-
Ite„ kaolinite, lllite, and chlorite. Chlorite and kaolinite were estimated
using; the 3.58Ä/3.54Ä doublet, following Biscaye's (1964) method. The
crystailinity (v/p) of montmorillonite was also calculated; this is the ratio
of the low angle "valley depth" to the peak height of the 17Ä glycolated
84
montmorillonite peak.
Chlorite
Chlorite concentration is uniformly low at mid-low latitudes and only
gains relative importance (greater than 107») at higher latitudes (Goldberg
and Griffin, 1964; Biscaye, 1965). Within the study area, chlorite was
consistently less than 5% of the total clay fraction. This value agrees
with Biscaye, but is under the 10-157» range determined by Goldberg and Grif-
fin (1964).
Montmorillonite
Goldberg and Griffin (1964) stated that montmorillonite distribution is
generally related to sea-floor voicanism. Biscaye (1965), on the other hand,
discounted any clear association between voicanism and montmorillonite abun-
dance and concluded that any relation between this clay mineral and latitude
or source is obscured by the fact that it can be formed under a wide variety
of conditions, both subaerial and submarine. Studies of atmospheric dust by
Chester ejt al. (1972) in the southeastern Atlantic show a very complicated
latitudinal distribution pattern for montmorillonite.
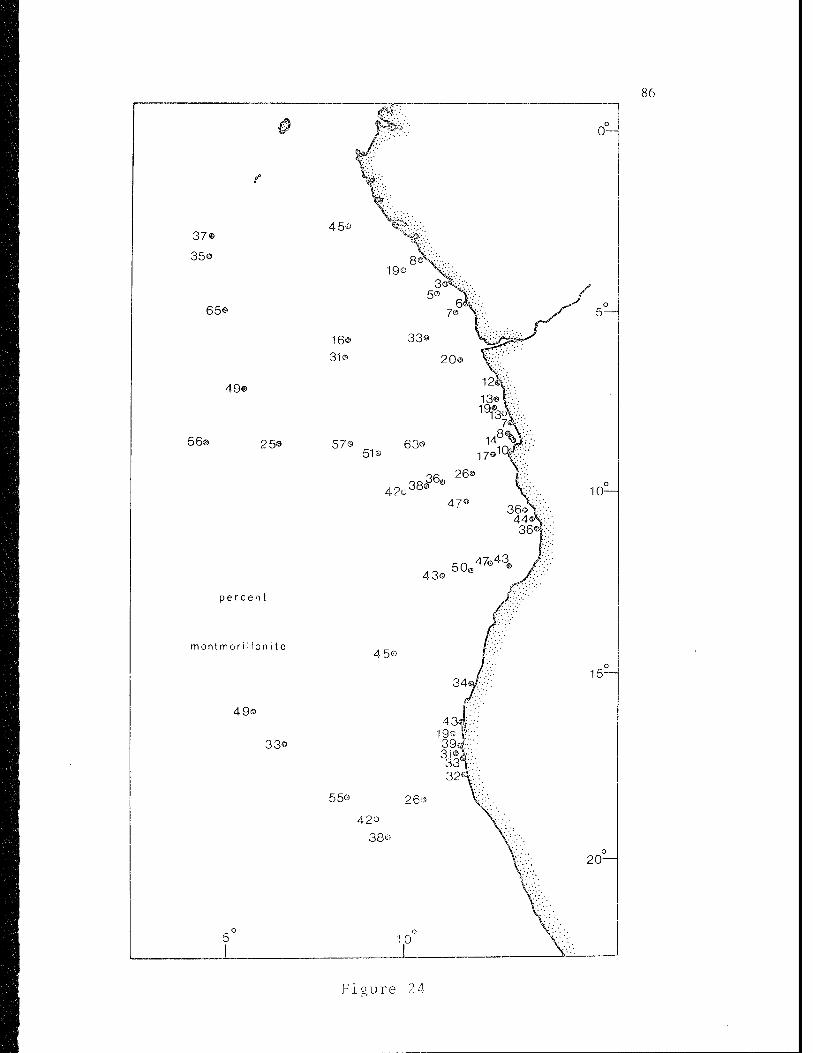
The observations of Biscaye (1965) are clearly supported by the present
study (Figure 24). Montmorillonite varies, in general, between 30 and 607».
A notable exception occurs in the vicinity of the Congo and Kunene Rivers,
where dilution by kaolinite and illite reduces montmorillonite concentrations
to less than 207».
All of the values of crystallinity except two are positive and average
about 0.30, with some as high as 0.74. The values display no systematic
variation within the study area, although a slight trend toward low values in
the northernmost part of the region tends to support Biscaye's conclusion
85
Figure 24. Distribution of montmorillonite in surface sediments of
the eastern Angola Basin.
37«
35®
65®
49©
56s 25®
percent
mont mor i I Ion i t e
4 9©
3 3o
Figure 2 4
that tropical weathering is not conducive to well-developed crystallinity in
montmori.Ilonite .
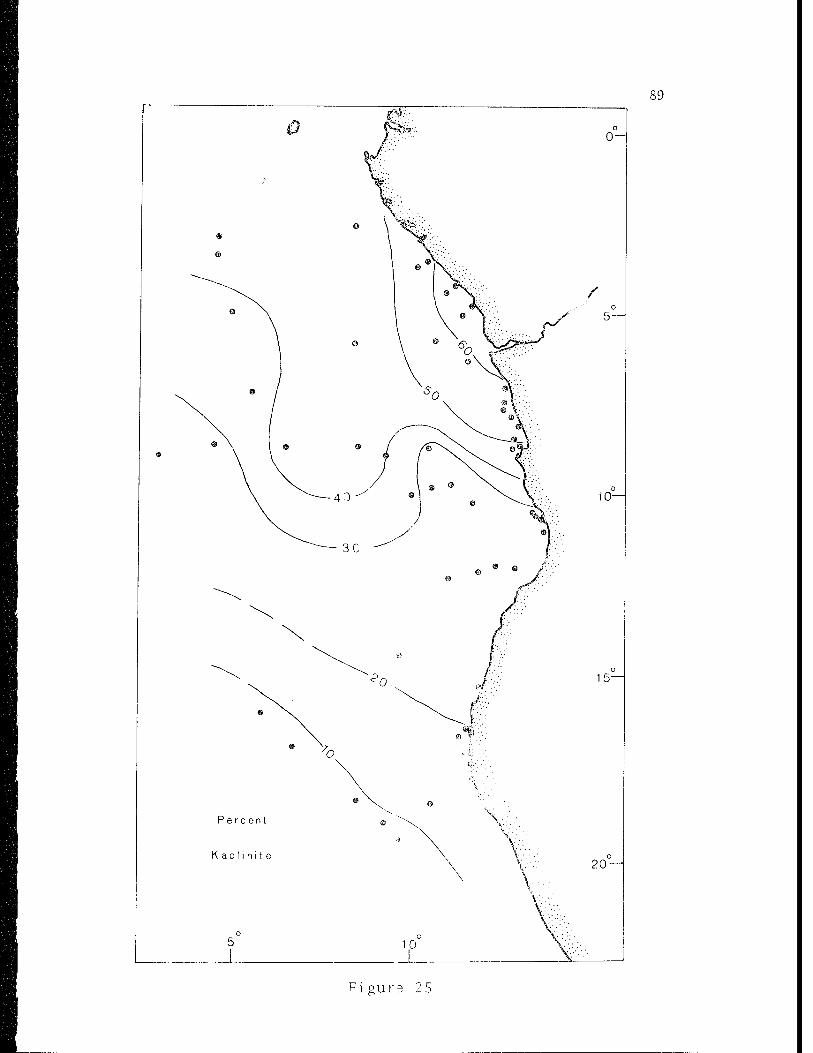
Kaolinite
Kaolinite abundance corresponds directly to the intensity of tropical
weathering on adjacent land masses (Yeroshev-shak, 1961; Goldberg and Griffin,
1964; Biscaye, 1965). The latitudinal variations seen within the present
study area (Figure 25) clearly support this concept. Concentrations of less
than 1G% are evident over the Walvis Ridge and the southern Angola Basin and
increase to a maxisum of 60% on the Congo Cone.
i ! j i i- e
The concentrations of illite in offshore areas of west Africa reflect the
soil composition on adjacent land areas. Illitic soils are dominant in the
arid regions of southern Angola and South West Africa and give way to kaolin-
Ixc SO"
trigure
•oups nearer the equator (van der Merwe, 1966). Therefore, the
.llite concentration is nearly the inverse of that of kaolinite
values oe etween 40 and 60% characterize the Walvis Ridge region
and the nearshore areas off Angola
are generally less than 20%.
North of 10°5, however, concentrations
Methods of Transport to the Deep Sea
The major mechanisms for the delivery of clay minerals to the marine
er.vlrc:iaentj fluvial and eolian, change in relative importance throughout the
srudy area. The Congo, as the single most important source of fine sediment
for the Angola Basin, is the major supplier of kaolinite with lesser amounts
probably originating in the Niger River system (Porrenga, 1965) and other small
88
Figure 25. Distribution of kaolinite in surface sediments of the
eastern Angola Basin.
Figur-3 2 5
90
Figure 26. Distribution of illite in surface sediments of the eastern
Angola Basin.
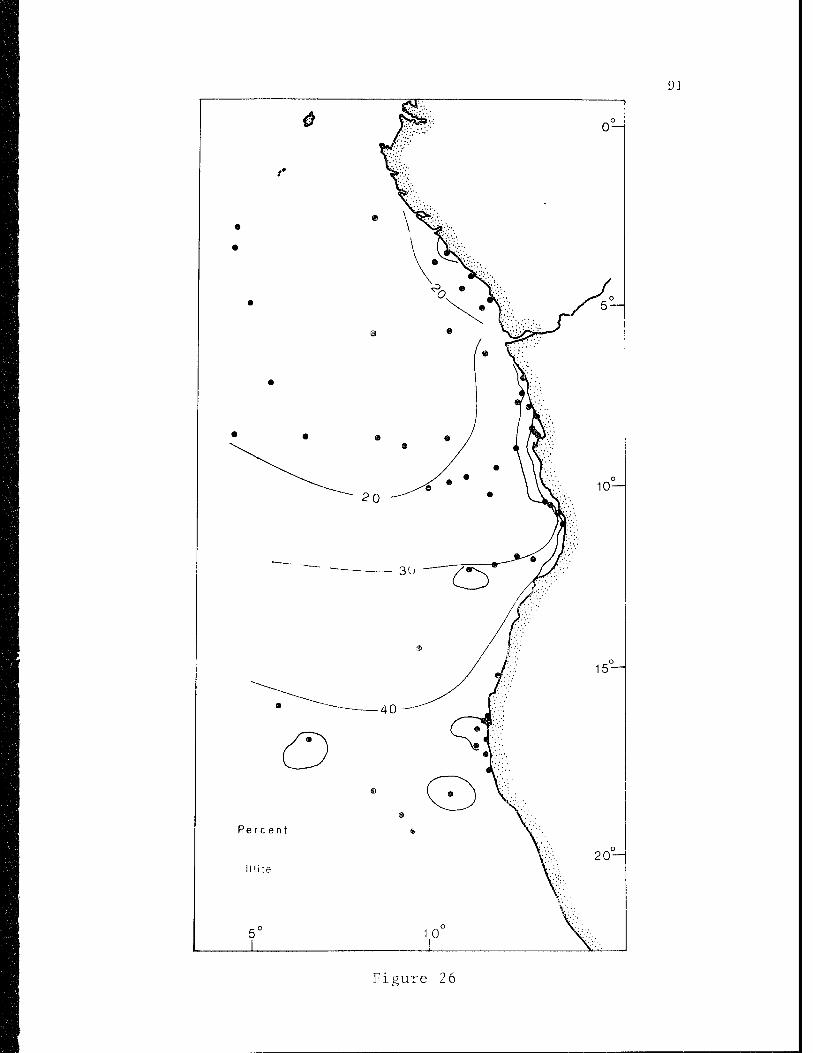
91
Figure 26
92
rivers of Casieroons (Berthois ejt jal., 1968)} Gabon and the Congo Republic
(Brazzaville). Eolian input of kaolinite to the Angola Basin is not sig-
nificant at the present time.
Illite and mcntmorillonite,, on the other hand, are dominant clay minerals
in the soils of South West Africa and South Africa. In view of the paucity
of large rivers in this area,, eolian transport probably is more important
than farther north (Chester et al.; 1972). The prevailing southeast trade
winds carry dust northward from the Namib Desert into the Angola Basin and
the strong, easterly Berg winds,, although only occurring 10% of the time in
South West Africa^ account for large volumes of sediment being blown offshore.
Illite and montmorillonite also are brought to the study area by the Orange
and. Kunene Rivers; suspended terrigenous material from both eolian and
fluvial sources becomes entrained in the Benguela Current and is carried
northward into the Angola Basin area.
9 3
LATE QUATERNARY SEDIMENTS
Piston cores from the Angola Basin were routinely sampled by the writer
at 20 cm intervals and analyzed for percent sand, percent calcium carbonate
within the silt and clay fraction, abundance of the planktonic foraminifera
species, the abundance of fecal pellets, and the ratio of planktonic foramini-
fera to radiolaria. The results of the routine analyses are included in
Appendix II and the methods used for the textural and carbonate analyses are
presented in Appendix III. The sand fractions of the samples were studied
under the binocular microscope and the abundances of the major components
were noted.
In addition, clay mineral and organic carbon analyses were conducted on
samples selected from the major stratigraphic units (defined on the basis of
micropaleontology) within several of the cores. These data are also presented
in Appendix II.
Stratigraphjr of Deep-Sea Cores
Several criteria were used in an effort, to establish the absolute and
relative stratigraphy of the piston cores in the Angola Basin. These included
the carbonate content of the less-than-62u fraction, the abundance of certain
species of planktonic foraminifera (Globorotaiia menardii, G. menardii var.
flexuosa, G. tumida), the ratio of foraminifera to radiolaria, and color dif-
ferences between major units.
All of the cores used in this study were late Pleistocene in age except
two (CH99-42 and KW 18), both of which were from the Angola diapir field re-
gion and were Pliocene in age. The late Pleistocene cores were in general
94
younger than 200-300 x 10"" years B„Po, and several did not penetrate through
the Riss/Würm (125.000 yr B„P„) interglacial.
The ideal pelagic section for the late Quaternary in the Angola Basin
consists of the following units:
(1) a light-colored, 30-60 cm upper unit, highly calcareous, weakly
siliceous, with a typical tropical-transitional foraminiferal fauna;
(2) a very dark green-gray, 1-2 meter unit, low in carbonate, more
highly siliceous (particularly radiolaria), with abundant organic
m.'ii tor, pyrK.i.zccl burrows and focal pellets; fornminifora are rare;
(3) a unit of alternating light and dark layers similar to units (1)
and (2); the overall carbonate content is higher than (2) with warm-
water foraminifera occurring in the light-colored, calcareous zones;
(4) a dark green-gray, low carbonate, highly siliceous unit with few
foraminifera similar to unit (2)„
Despite local variations, this general pattern appears to hold throughout the
study area,,
A very similar sequence of lithologie- was described for cores from the
Guinea Basin (Lavrov and Savel'yeva, 1971). Diatoms, however, were found to
be a more important constituent of their cores and radiolaria were apparently
of verv minor importance.
Abundance of the Globorotalia menardii Complex
Ericson and wo11in (1956) proposed that the abundance of the Globorotalia
menardii complex was a reliable index of climatic oscillations in the tropical
and sub™tropical Atlantic. Since then many other "warm" and "cold" sensi-
tive species have been used to establish climatic curves (e.g., Ruddiman,
1971; Lidz, 1966; Imbrie and Kipp, 1971). As Kennett and Huddlestun (1972)
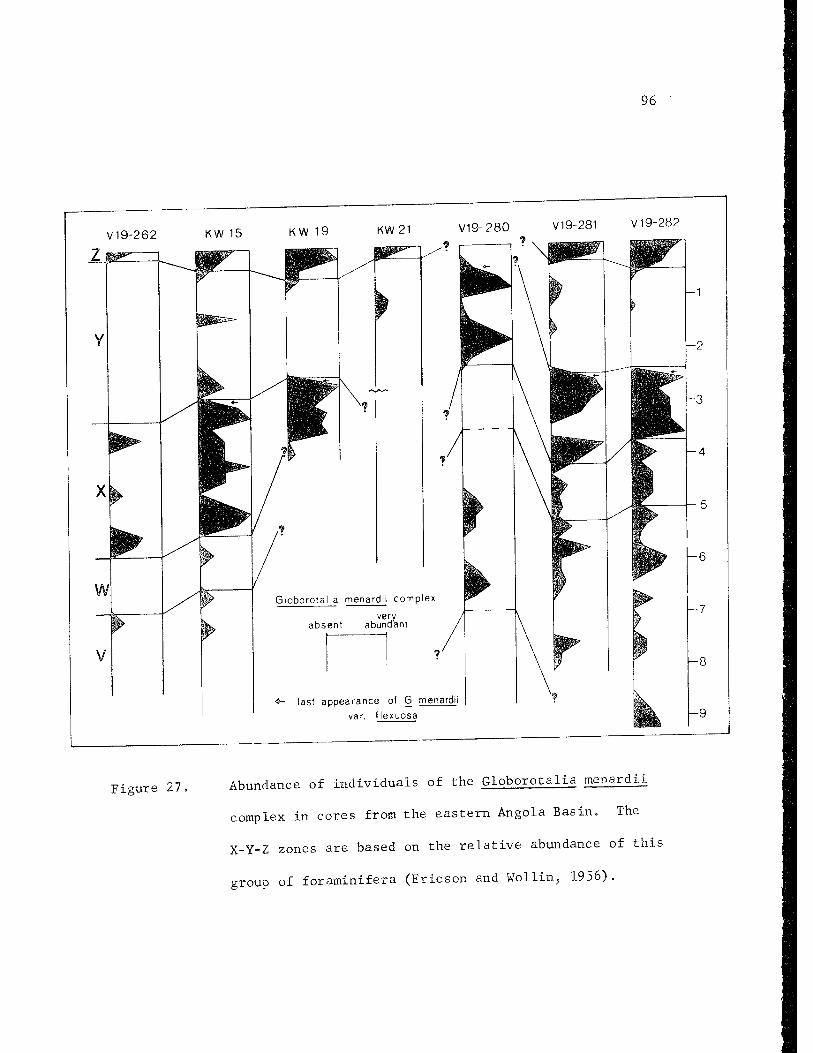
95
point out, however, there is never complete agreement among workers as to
which species are "cool" and which are "warm"; they conclude.;, as did Ericson
and Wollin (1356), that the G. menardii complex is one of the most sensitive
w.Tni-water indicators. The last appearance of the form G. menardii var.
flexuosa is taken to mark the upper part of the X-zone or the Riss/Wiirm
interglacial, and provides a key datum in those cores containing G. menardii.
Although several cores from the Angola Basin did not contain represen-
tatives of the G. menardii complex, many other cores could be confidently
correlated on this basis (Figure 27). The upper 50-100 cm in most of these
cores is characterized by a warm-water foraminifera fauna, including abundant
G. menardii. This zone, the Z, is taken to be the Holocene, the lower boun-
dary of which is marked by a severe reduction with depth in the importance of
G. menardii. The underlying unit is characterized by a general absence of
G. menardii except for a brief recurrence in the middle of the Y zone; this
brief recurrence is thought to mark the Wurm l/Wiirm II interstadial, the peak
3 of which occurred at about 60 x 10 yr B.P. A major reappearance of abundant
G. menardii, G. tumida, and G. menardii var. flexuosa occurs at between 2 and
3 meters in most cores and marks the top of the X zone. This zone is marked
by several peaks of G. menardii abundance and extends approximately 2 meters
in most cores. A severe reduction again occurs at the W/X boundary. The W
zone is characterized by a general absence of G. menardii in its upper part
with a gradual increase in its lower sections; correlations become more dif-
ficult within the W and earlier zones.
Core V19-280 possesses two peaks of G. menardii abundance within the up-
per 2 meters, underlain by a long (2 meters) section in which this faunal
complex is absent. G. menardii var. flexuosa exists in abundance near the
96
KW 15 KW 19 KW 21 V19-280 V19-281 V19-282
*- last appearance of G. menardii
var. f lexuosa -9
Figure 27, Abundance of individuals of the Globorotalia menardii
complex in cores from the eastern Angola Basin. The
X-Y-Z zones are based on the relative abundance of this
group of foraminifera (Ericson and Wollin, 1956).
97
top of the core. On the basis of the above evidence, it was concluded that
the upper part of this core lies at about the top of the X zone (75,000 years
B.P.).
Paleoclimatic Curves and Stratigraphic Zonation
The late Quaternary paleoclimatic curve of Emiliani (1971) was used for
comparison, but was placed within the Broecker and van Donk (1970) time scale.
This time scale was adopted for the present study as it appears to be most
compatible with results of other kinds of Quaternary stratigraphic inves-
tigations (e.g., Mesolella 'et _al., 1969) and has been widely used elsewhere
in the Atlantic.
This climatic curve was subdivided into the X-Y-Z units and subunits of
Ericson and Wollin (1956) and modified from the recent detailed work of
Kennett and Huddlestun (1972) in the western Gulf of Mexico. The X-zone
represents the interglacial or generally warm interval extending from 75 x
3 3 10 yr B.P. to 127 x 10 B.P. (Broecker, 1971; Mclntyre and Ruddiman, 1972).
Kennett and Huddlestun (1972) indicate that the X-zone in the Gulf of Mexic :o
3 3 extends from about 95 x 10 B.P. to 127 x 10 yr B.P. (Figure 28). Their
work has been modified in the present study (Figure 28) to make the X-zone
better correspond with other work in the Atlantic, thus eliminating the
subdivisions Y-, and Y„ and adding X, and X . As they point out, the western
Gulf of Mexico is unique in that Globorotalia menardii disappeared approxi-
mately 20,000 years earlier than in the Caribbean or the rest of the tropical
Atlantic.
98
Figure 28. Paleoclimatic curves from Kermett and Huddlestun's (1972)
work in the western Gulf of Mexico and Emiliani's (1971)
work in the Caribbean and Atlantic. The zonation on the
right of the figure was adapted from that of Kennett and
Huddlestun (1972) for use in the Angola Basin.
99
00 CNI
<D
•H
100
Planktonic Foraminlfera/Radiolaria
The relative abundance of planktonic foraminifera has been used by many
investigators as a method of subdividing the Quaternary. Emiliani (1955?
1964) used percent sand (as an indication of foram abundance) to demonstrate
climatic variations within cores from the Caribbean and found a good agree-
ment wich oxygen isotope data obtained on the same samples. Payne and Conolly
(1972) found a good direct correlation between foraminifera abundance and
inferred Quaternary paleotemperatures in cores taken between Australia and
Antarctica. Duncan et al„ (1970) used the ratio of planktonic foraminifera
to radiolaria in piston cores off Oregon to demonstrate late Quaternary
climatic changes. They found that the Holocene was characterized by a rela-
tively high abundance of radiolaria^, whereas the glacial intervals exhibited
higher concentrations of planktonic foraminifera.
Foraminifera/radiolaria curves in many Angola Basin cores also show good
correlations with inferred climatic curves based on other criteria (Figure 29).
As with carbonate curves, however, the correlation is the inverse of that
found in northeast Pacific ceres* interglacials are characterized by higher
planktonic foraminifera abundances than glacials.
yariations in_jCaIc^i-Lim Carbonate Abundance
Variations in calcium carbonate content have been shown to be correlated
wich climatic change (e.g.,} Schott^ 1935; Arrherrius,, 1952; Ruddiman^ 1971;
Harn and Perruzza. 1972). In general, glacial periods have been characterized -) o
in Atlantic deep-sea sediments by low carbonate values and interglacials by
high values. This pattern contrasts with the Pacific Ocean^ where precisely
the opposite correlation exists. The factors controlling these climatically
101
Figure 29. Vertical changes in the foraminifera/radiolaria ratio
in cores from the eastern Angola Basin.
102
>
v
ÜL < _l
O io o D O fe" < ce <t" CK LU U_ 0N CO
Z <—) "°J <~> m O >- ^ < a: o
llilll/ ISP'' ^ät^^^^^W^^^^. W w
•H
LO CD CD
103
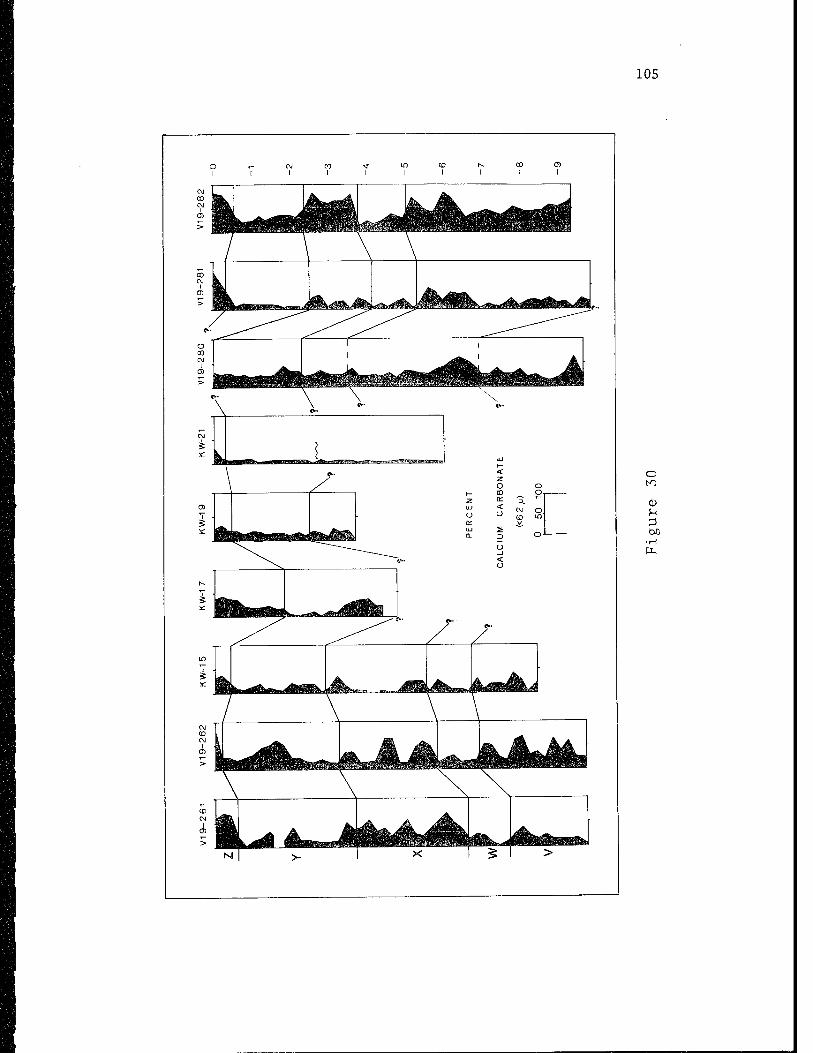
related variations include;
(1) changes in carbonate productivity in surface waters;
(2) varying rates of terrigenous dilution; and
(3) changes in the rate of carbonate dissolution.
Figure 30 shows profiles of carbonate abundance in several of the Angola
Basin cores in which pelagic sedimentation was dominant. The time scale was
based on; (1) the projection of deduced sedimentation rates; (2) comparison
with other Atlantic cores; and (3) Globorotalia menardii abundance. Core V19-
262 provides an ideal example of the variations in calcium carbonate seen in
cores from the eastern Angola Basin. The major units, defined on the basis
of carbonate content can be correlated with the X-Y-Z zones based on foramin-
ifera; for this reason, these units will be given X-Y-Z designations even
though GL menardii may not exist within the core.
Most cores are characterized by a rapid decrease in carbonate content
with depth in the upper 50-60 cm. This zone corresponds to the Bolocene, the
Z zone cf Ericson and Wollin (1956), and begins approximately 12,000 years
B„P<, Cores from regions of presently higti carbonate productivity (Walvis
Ridge and the Guinea Rise) show variations in carbonate content from as high
as 85% at the surface to less than 10% at the base of the Holocene. In
seme cores (e.g., V1S-261, EW1.5, KW19) maximum carbonate values are not at
tue surface but are 20-40 cm down in the cores: this may represent a slight
climatic deterioration since the climate optimum; in other cores this section
may have been removed during the coring operation.
Below this surface unit is a one to two-meter unit of low carbonate con-
tent, broken only by a small subunit of slightly higher carbonate (Y„). This 3
unit is taken to be correlative with the Y zone of Ericson and Wollin (1956)
and comprises the Worm I and II glacial intervals and the intervening inter-
104
Figure 30. Vertical changes in the calcium carbonate content of
the less-than-62|i fraction in cores from the Angola
Basin.
105
< Z o o CO
2 3. ■-
O CJ C\J
(0 o
K s
^
o tn
CD
bO • H
106
stadial (Wurm l/Würm II), as evidenced by the slightly higher carbonate values.
often the lowest carbonate values encountered in these cores are from this
unit.
Below this zone is a generally more calcareous unit containing three major
carbonate maxima and exhibiting a wide range of carbonate values. Differences
between maxima and minima within this unit can be as great as 50% as in core
¥19-262, but are usually in the order of 20 to 30%. This unit is correlative
with the X zone of Eric son and Wo 11 in (1956), the Riss/Wlirm interglacial.
Correlations become more difficult in units underlying the X-zone. There
appear, however, to be two minima in carbonate separated by a slight maximum.
Tuis unit Is thought to correspond to the W zone of Ericson and Wo11in (1956).
This basic scheme is only evident in areas dominated by pelagic sedi-
mentation and is totally non-existent in cores from the Congo Cone. Else-
where slumping and turbidity current erosion and deposition obscure the
general pattern described here.
Core CE99-38, though of exclusively pelagic character, contains vir-
tually no carbonate along its entire lengta. Taken at 5371 m the sediments
at tbi.s location probably have always been below the carbonate compensation
depth. Other cores (e.g., V19-2S1, V19-26I, V19-262) contain pelagic sections
in which no carbonate is present; in other cores carbonate components show
evidence of dissolution in certain sections., These units can be as much as
one to two meters in length and correspond to Increases in pellets, siliceous
coarponsnts, organic content, and pyritized burrows. Although one might ex-
pect a general reduction in total CaC0q with climatic deterioration, carbonate
productivity In the surface water should not cease entirely. For this reason
these non-calcareous units may reflect changes in the position of the car- i-
i 0 7
bonate compensation depth; the mechanism by which this might have been ac-
hieved will be discussed in a later section.
As mentioned previously, carbonate content can be affected in three
ways: (1) by changes in carbonate productivity; (2) by terrigenous dilution;
and (3) by carbonate dissolution. Ruddiman (1971), Broecker (1971)., and
Hays and Perruzza (1972) concluded that the lower carbonate values during
glacial intervals reflect the increased deposition of terrigenous sediment
in the ocean; not a decrease in carbonate productivity. Several problems are
associated with this interpretation. If carbonate productivity is assumed
to remain constant, as stated by Hays and Perruzza (1972),, then a threefold
change in percent carbonate (e.g.,, from 30% to 10%) between interglacials
and glacials must be accompanied by higher terrigenous inputs and consequently
higher sedimentation rates. In core V22-196, Hays and Perruzza (1972; p.
358) show that average interglacial carbonate values are approximately 30%
and glacial values 107». However, interglacial sedimentation rates are
3 3 5.4 cm/10 years and glacial sedimentation rates are 5.0 cm/10 years. Clearly
a sedimentation rate which remains relatively constant from interglacial to
glacial intervals cannot account for a threefold decrease in the observed
carbonate content if carbonate production is held constant. Other mechanisms,
presumably changes in carbonate productivity or dissolution, must be impor-
tant factors in reducing carbonate content.
This conclusion is further substantiated by results from the Angola
Basin: although carbonate values during glacials can be as much as four to
five times lower than during interglacials, glacial Sedimentation rates are
comparable to interglacial rates. Increased terrigenous dilution during
glacials is not consistent with work carried out on land in areas adjacent
108
to the Angola Basin« As mentioned previously, the region of the Congo as far
inland as Kinshasa was a desert or semi-desert during glacial intervals.
Recent work by Degens and others (personal communication, 1973) on equatorial
lakes and by van Zinderen Bakker and Goetsee (1972) supports the view that
cooler periods in higher latitudes were equivalent to drier periods in
equatorial Africa,,
Sedimentation Rates
On the basis of the above criteria, sedimentation rates for glacial and
iriterglacial intervals were determined for the best controlled cores in the
study area (Table 1). An average glacial sedimentation rate was determined
for the entire Y zone, although it was realized that this comprises the
Wiirm I and Wflrm II glacial maxima separated by an interstadial (Wurm 1/ Wurm
II). An average interglacial sedimentation rate was calculated for the Riss/
3 Wurm interglacial (127-75 x iO years B„P„).
Pelagic sedimentation rates for both glacial and interglacial intervals
:i"-tui'e
3 ge approximately 3-5 cm/10 years, w'th very little difference , in gen-
eral^ between warm and cool periods« This is in marked contrast to the
Guiana Basin off the Amazon River, described by Damuth and Fairbridge (1970),
where they inferred greatly increased sedimentation rates during cool inter-
vals. The land areas adjacent to both the Guiana and Angola Basins ex-
perienced arid to semi-arid conditions during glacial periods. Damuth and
Fairbridge (1970) believed that an increase in sedimentation rates during
glacials occurred in response to a deforestation of areas which are presently
tropical rain-forest, and to the growth of mountain glaciers in the Andes,
the source of the Amazon. Two Important features, however, distinguish the
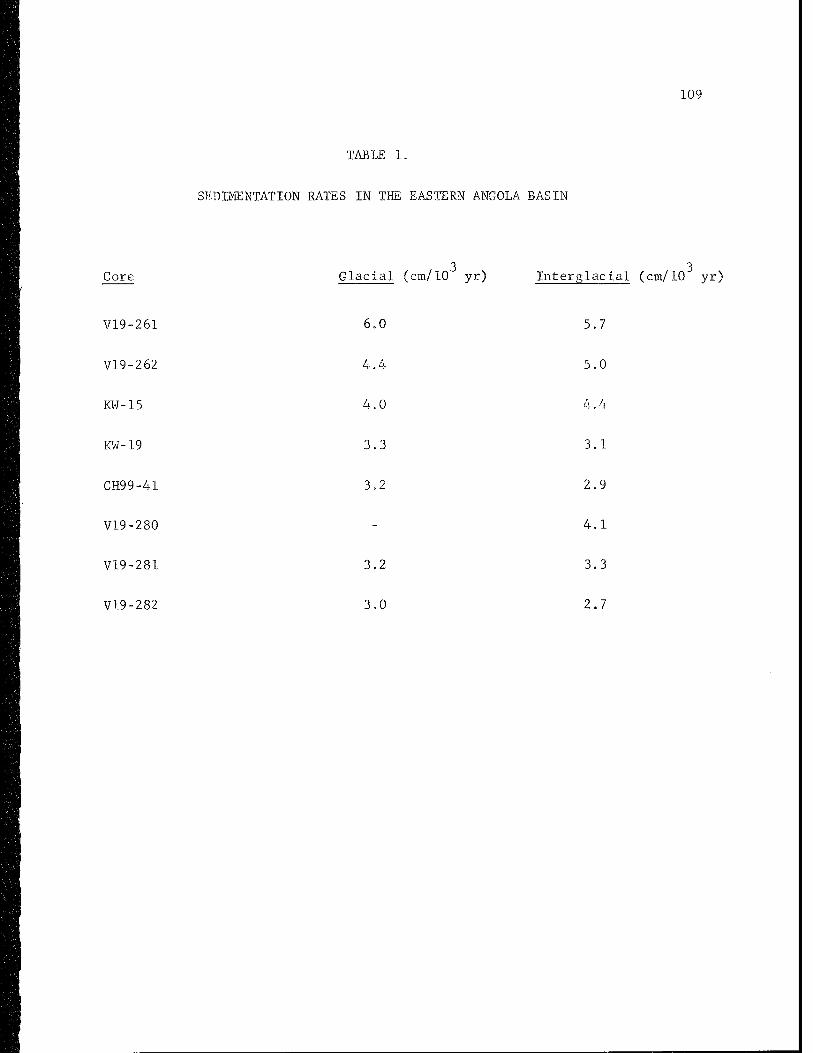
109
TABLE 1.
SEDIMENTATION RATES IN THE EASTERN ANGOLA BASIN
Core
V19-261
V19-262
KW-15
KW-19
CH99-41
V19-280
V19-281
V19-282
Glacial (cm/10 yr) Interglacial (cm/10 yr)
6 0
4 4
L 0
3 3
3 2
3.2
3.0
5 7
5 0
4 4
3 1
2 9
4 1
3 3
2 7
no
Congo River system from that of the Amazon.; (1) the sources of Congo River
water are not in areas which were extensively glaciated during glacial
maxima; and,, (2) most of the sediment carried by the Congo into the Atlantic
Ocean is derived from the area within 400 km of the coast. Thus, although
during cool periods of physical weathering in the deforested areas near the
coast may have been intensified, the discharge of the Congo and its lower
tributaries undoubtedly decreased significantly (dePloey, 1965; Fairbridge,
1954) resulting in relatively constant sedimentation rates throughout the
late Quaternary in the eastern Angola Basin,
Sand and Silt
Emiliani (1955., 1964), Ericson and Wollin (1956), Ewing et al. (1958),
and Ericson et al. (1961) showed that the weight percentage of sediment
larger than 62 u (or 74 p.) often displayed a high correlation with inferred
paleoteisperatures in G_lobigeri:ia.-ooze cores from the Atlantic Ocean. Several
cores from the eastern Angola Baein exhibit agreement between the percentage
sand and carbonate values for the less-than-52u fraction, the abundance of
the GijAorotalia menardil complex:^ and the foraminifera/radiolarian ratio.
The best correlations are apparent in cores from the Waivis Ridge and from
the Guinea Rise, where normal pelagic sedimentation is less influenced by
coarse terrigenous sediment input than the Angola continental rise and abyssal
plain (Figure 31). Correlations between carbonate and percent sand are not
as great as those found elsewhere in the Atlantic principally because of tne
relatively large input of siliceous components.
In addition to plankconic ioraarinifera, radiolaria, and diatoms, the
sand fraction disseminated throughout the hemipelagic sections of the Angola
Basin cores commonly consists of fine quartz, feldspar, mica, glauconite,
Ill
Figure 31. Relationship betweei percent sand (> 62)j.), calcium carbonate
content of the silt and clay, and the foraminifera/radiolaria
ratio in core V19-281 fromthe southern flank of the Guinea
Rise.
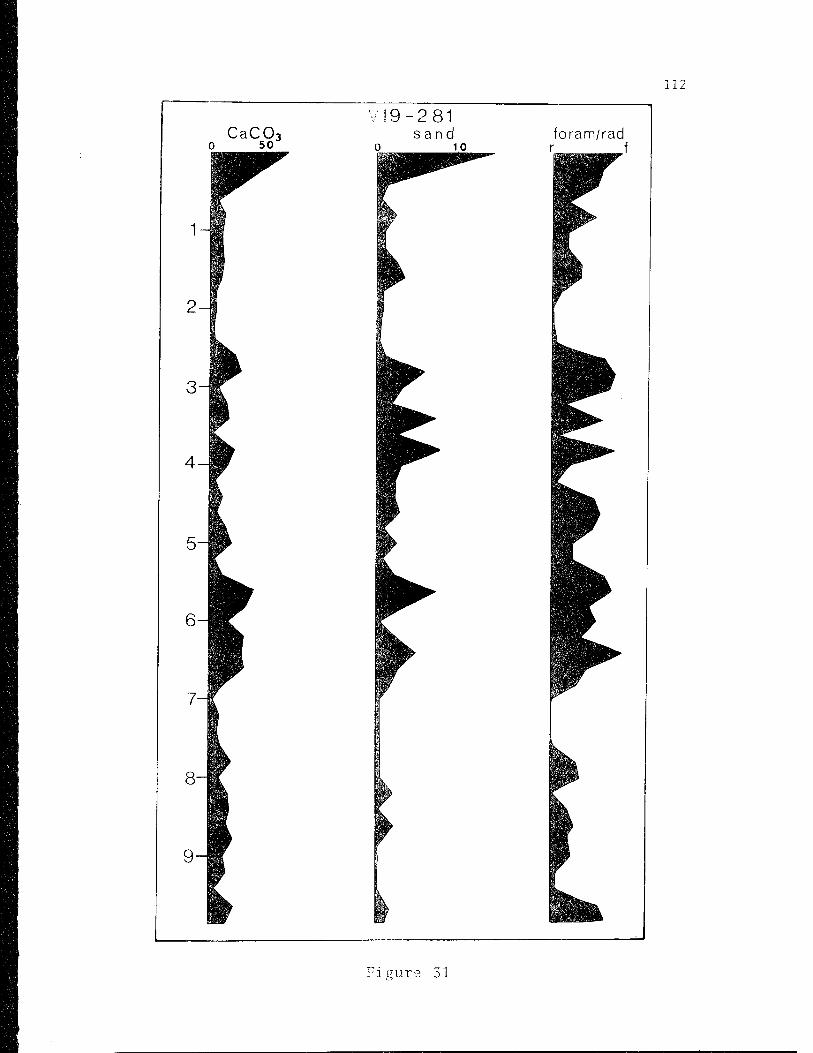
112
Figure 31
113
manganese micronodules, fecal pellets, pyritized foraminifera a ad diatoms,
pyritized burrows, echinoid spines, benthonic foraminifera, ostracods, and
bryozoa. Fish teeth and black,, perfectly spherical, shiny, non-magnetic
particles are occasionally found (Figure 32).
Mica, glauconite, and manganese show definite latitudinal differences
in their contribution to the sand fraction,. Manganese micronodules are more
common in the northern part of the basin than in the southern. Mica is
particularly abundant in cores from the Angola continental rise and is ab-
sent from the pelagic sections of cores V19-280, 281, and 282 from the
southern flank of the Guinea Rise, Not unexpectedly, continental shelf
sediments from off South West Africa and Angola contain appreciably more
mica than sediments from the shelf off Congo and Gabon« Il'iite (mica) in
the clay fraction also is considerably more abundant in the southern part
of the study area (see previous section).
Glauconite is also noticeably more prevalent along the Angola, Congo.,
and Gabon continental margins than on the north flank of the Walvis Ridge
or on the Guinea Rise. The source and mode of origin of this glauconite
is discussed below.. No vertical variations in glauconite abundance were
apparent in cores from this area,
Pyrite is a very abundant component of Angola Basin cores and displays
vertical variations in importance within cores. It occurs in two general
forms: (1) as replacements or fillings of planktonic foraminifera and diatom
frustules; and (2) as replacements of burrows of benthic organisms, The
latter are long, narrow "rods" exhibiting a fine, botrycidal surface texture
(Figure 33). Both modes of occurrence can range, from well-developed pyrite
with a high metallic luster to a poorly developed black iron sulfide precursor
14
Figure 32. Photomicrograph of a smooth, spherical, non-magnetic
particle found in Angola Basin core KW19. Scale
bar represents 0.5 mm.

115
eg
0)
•H
116
Figure 33. Photomicrograph of pyritized burrows from Angola Basin
core V19-278. Scale bar represents 0.5 mm.
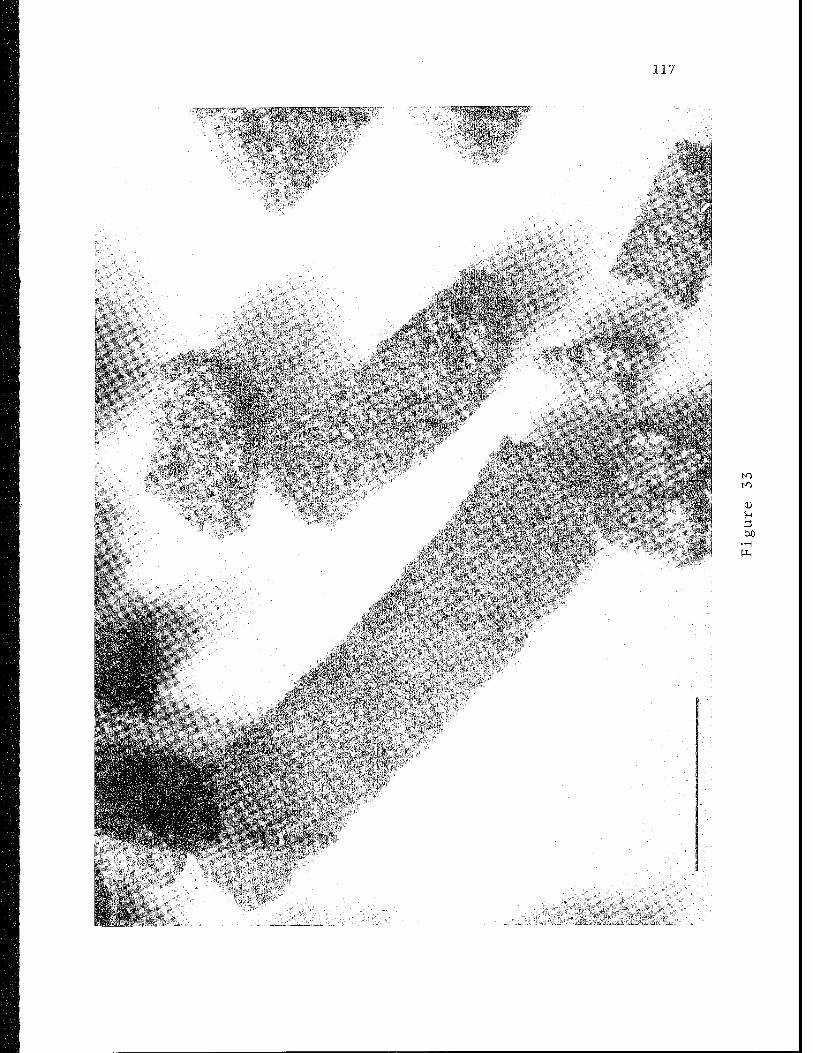
117
jllps^
'■- ft
Mt.
»$Bm ■
* * vif :,
; '.? *■■>'„'; V ■
fill
||jg|pPfi
»fffilSI
11PI!4
apt»»
to
<D U
•H
118
of pyrite (hydrotrollite ?) with a dull nonmetallic luster; burrows are more
commonly of the latter type. In general, pyrite is most, abundant in low-
carbonate sections of the cores from this region and often can constitute
the entire sand fraction (e.g., CH99-40; V19-278, 120 cm). A similar re-
lationship between pyrite and dark gray-black sediment sections in the
Guinea Basin was noted by Lavrov and Savel'yeva (1972),
Turbidites
The contribution to the Angola Basin sediments of silt and sand derived
from turbidity currents varies from negligible on the northern flank of the
Walvis Ridge and the southern flank of the Guinea Rise (except near volcanic
islands and major seamounts) to extremely important on the Angola abyssal
plain and the Congo Cone (Figure 34). Cores V19-263, 264,, and 265 from the
southern abyssal plain are dominated by sub-angular to sub-rounded,, fine to
medium quartz sands with appreciable mica, benthonic foraminifera, radiolaria,
and fecal pellets. Minor constituents include glauconite, pyritized burrows.,
planktonic foramlnifera, byrozoa, ostracods.. sponge spicuies, and small,,
polished dark grains (phosphorite ?). Very large, frosted and very well
rounded, quartz grains were found in core V19-264. The great abundance of
quartz and mica and the almost complete absence of mafic minerals indicates
that these turbidites originated on the Angola continental shelf and slope
and not on, the nearby Walvis Ridge.
Sand layers in cores from the Angola rise and from the sediment ponds
within the Angola diapir field consist of essentially the sain: components
as the sand disseminated throughout the pelagic sections.
Heezen et al. (1964) discussed in detail the composition, texture, and
distribution of silt and sand on the Congo Cone. Two heavy mineral suites
119
Figure 34. Average centimeters of sand and silt layers per meter of
core in the eastern Angola Basin.
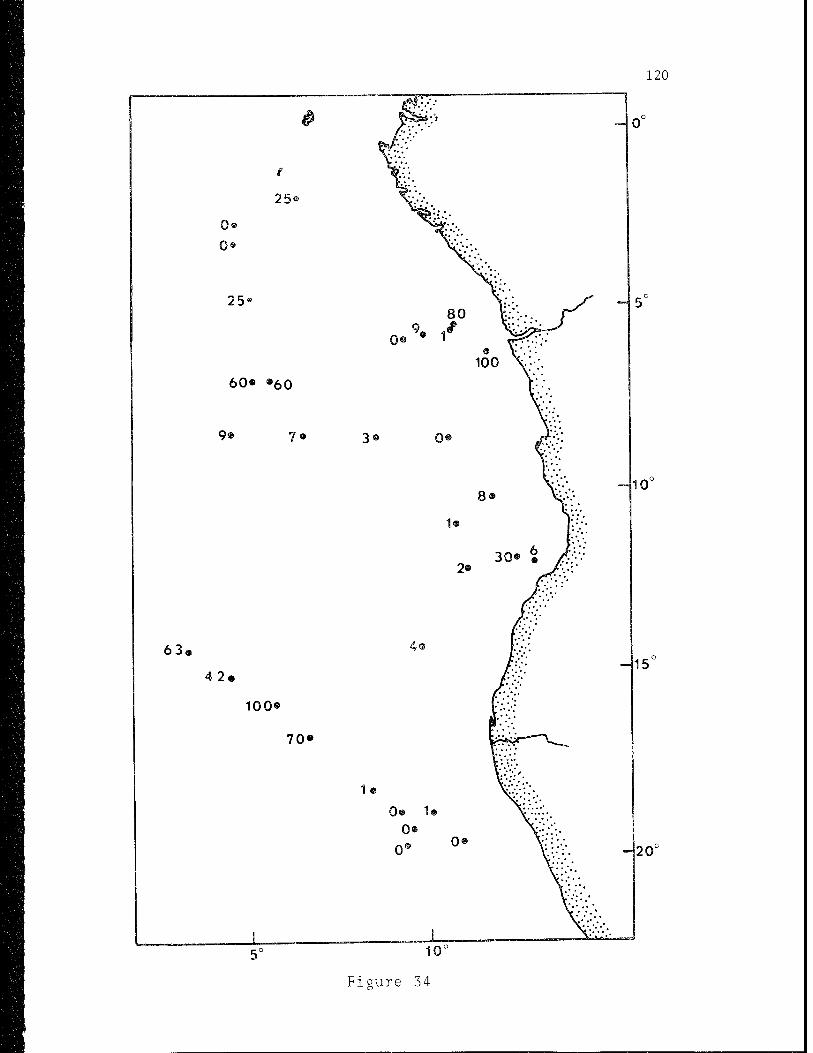
120
f
25®
0®
0®
25«
60« ®60
9®
639
42,
100»
70»
1®
0® 1®
0®
10"
15^
»20c
5° 10c
Figure 34
121
were identified., one containing abundant black opaque minerals., the other
containing hematite. The former is thought to have been derived from sediment
transported by longshore drift into the canyon head. The latter was found
commonly in association with terrestrial plant material and is believed to
have come directly from the Congo River. Based on the frequency of submarine
cable breaks, Heezen et al, (1964) estimated that the Congo Canyon is pre-
sently experiencing approximately fifty major turbidity currents per century.
Fecal Pellets and Authigenic_Silicates
Three types of pellets were found within the study area-; (1) a grey, dull,
"speckled" ellipsoidal type of dominantly smectite composition; (2) a shiny,
brown-grey, ellipsoidal variety of chamosite composition (Emel'ianov and
Senin, 1969); and (3) a shiny dark-green-black ellipsoidal to irregular var-
iety of glauconite. composition (Giresse, 1965; 1969).
According to Emel'ianov and Senin (1959) ehamositic pellets develop within
estuaries, such as the Ogooue or Congo, at depths of less than 70 meters and
locally can constitute more than 40% of the sediment. Goethite is an impor-
tant constituent of these pellets particularly at depths shallower than 40 m.
These pellets are very abundant in samples from the Congo and Gabon con-
tinental shelf (Figure 35) and are commonly found in areas from the Congo
Cone and continental rise, and are abundant within turbidite unites in these
areas.
Grey pellets (Figure 36) are ubiquitous components of both pelagic ana
turbidite units of Angola Basin cores, particularity from the -outhern part of
the study area. Since they are not restricted to turbidite units, and since
they are not found in adjacent continental shelf sediments, these pellets are
believed to have been produced in situ in the deep sea. The abundance of
122
Figure 35. Photomicrograph of chamosite pellets from the continental
shelf off the Congo Republic. Scale bar represents 0.5 mm.
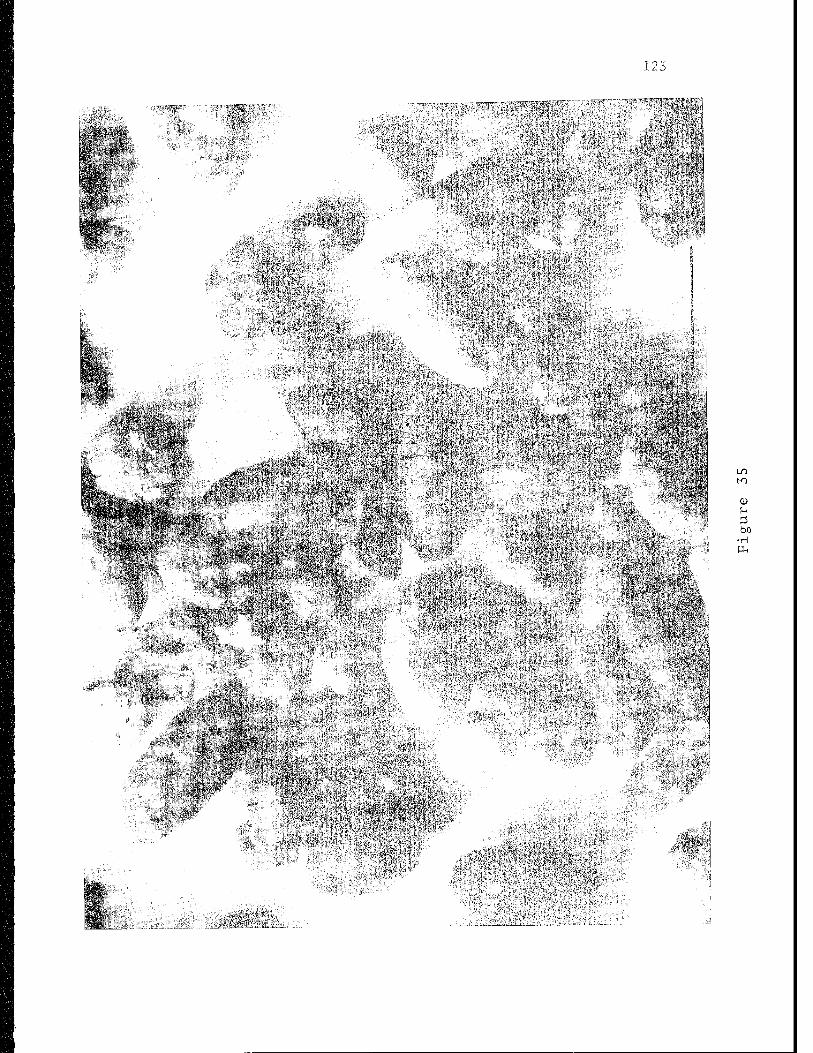
123
\M?M m
^iäM I«' .Ai\,ti !,..'. .,.„..3 '..
'9&H
£...\,J-, v.„
„■^''f, ',,"f"",
to
CD
bO • H
124
Figure 36. Photomicrograph of grey pellets from core KW15 on the
continental rise off southern Angola. Scale bar re-
presents 0.5 mm.
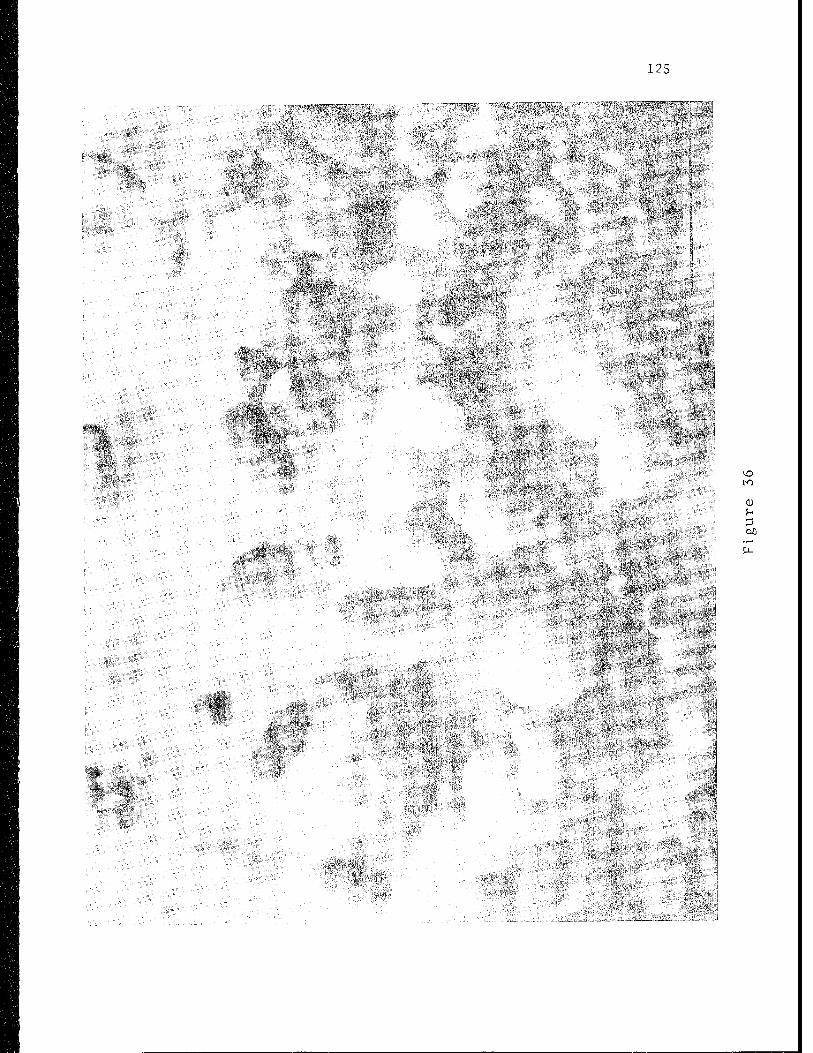
121
liH
:;wm.
im
Ä^MI
,, ^ ff M ' „ . S
/,^# 'V., "s, * *•• * ' *
Ä
Älf
•tÄifs ligii
111
öäsäs
itliilltfli;
1ÜÜ
Ai^pp fei^^^^äi'p'^-^?; ̂ i.^:-^; ÄIÄ? lüilÄS^K • p.
|^ÜI-ä
1^^^||§
. '-K Ä^^^^^^l 6*33$ «ftllfft>
S-i
bß
PH
sptfe-
tflfe'
i§fl ••ills«''
sSlis
Spiitf
StP^iJll
flpK
11*18111!
m
126
this variety of pellet shows significant variation with depth in cores and
displays a good correlation with the abundance of other components, as exem-
plified by core KW15 (Figure 37). Pellets, in general, are significantly
more common in zones of low carbonate. This is particularly apparent for the
suite of cores from the southern part of the study area; cores V19-28G, V19-
281. ¥19-282 from the Guinea Rise do not contain appreciable amounts of
pellets and do not exhibit any clear variations with depth,
Glauconite is a very abundant constituent of both continental shelf and
offshore sediments in this area. It generally occurs as either shiny, dark
green-black to light green pellets or as replacements of foraminifera tests.
The dark green-black variety is particularly abundant on the shelf off Congo
and Gabon (Giresse, 1965; Giresse, 1969; Giresse and Kouyoumontzakis, 1971)
(Figure 38). Light green glauconite, usually in the form of replaced foram-
inifera tests, is much more common in cores from the Angola Basin (Figure 39).
The abundance of the latter type in the pre-Quaternary core KW-18 suggests
that much of the glauconite within the Quaternary cores may have been reworked
from older sediments exposed during slumping and sliding associated with the
diapiric tectonism of the Angola diapir field. Glsueonite is generally ab-
sent in cores from the Walvis Ridge and the Guiaea Rise.
According to Emelhianov and Senin (1969) glauconite is presently form-
ing in the estuaries of the Ogooue and Congo Ri\crs at depths below 50 m
and on the Congo, Gabon and Angola continental shelves. The richest shelf
concentrations of glauconite (10-90% of ehe total sediment) occur off the
Kunene River along the outer shelf.
127
Figure 37. Relationship between pellet abundance and the abundance of
G. menardii, calcium carbonate in the silt and clay fraction,
percent sand, and the foraminifera/radiolaria ratio.
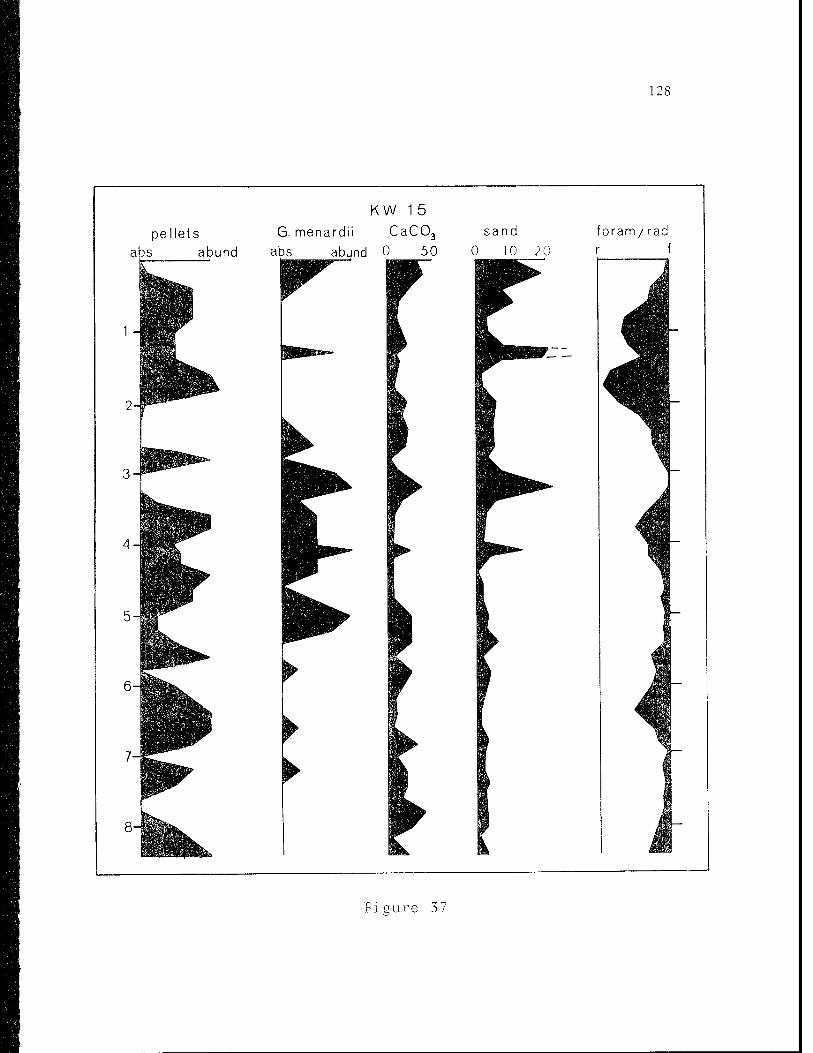
128
pellets abs abund
Sr— '
KW 15
G. menardii CaC03 sand foram/rad
abs abund 0 50 0 10 2 0 r f
Jffl«
Figure 37
129
Figure 38. Photomicrograph of glauconite and chamosite pellets from
the continental shelf off Gabon. Scale bar represents 0.5 mm.
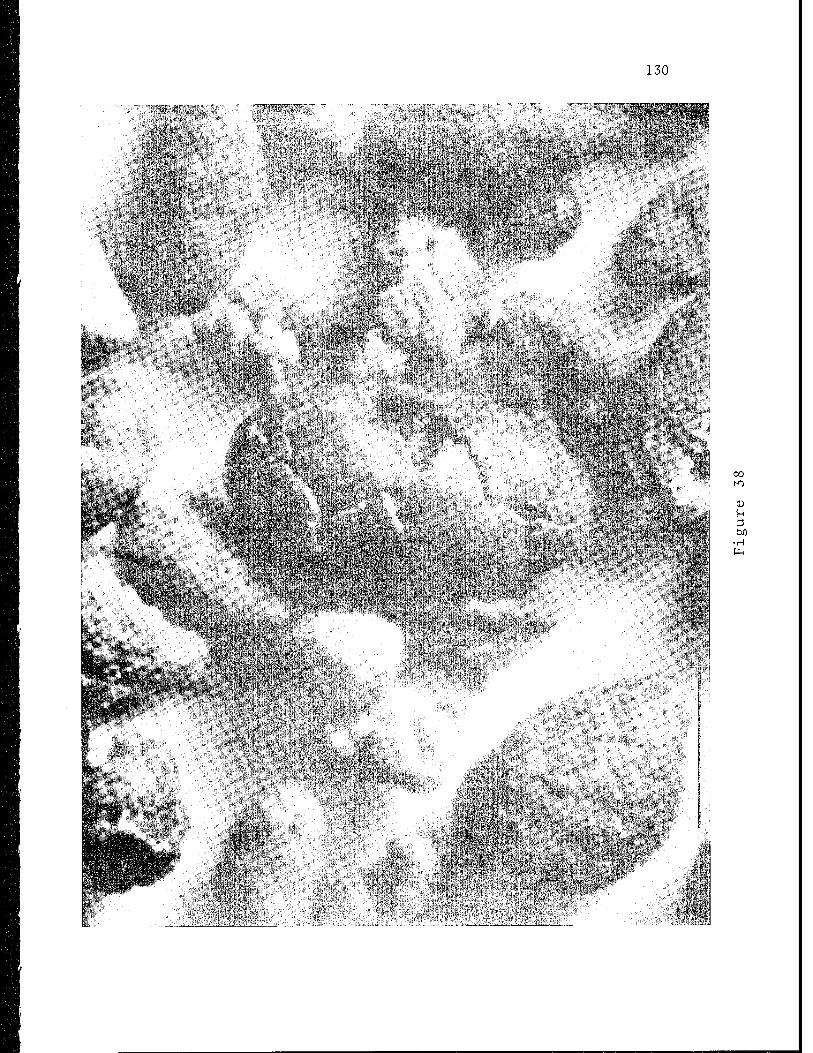
130
^:^Ä^
im .::■/'[
'i'k;
Ä^B
■HM 1
!^P
SÄ ~:'' 'Jil
-,;; r
jj?
^Plü
ßmmmm
te
•fl .■■.v:^':-'-:"''^---.
•f^lllllili
111
oo
CD f-i
bß •H ft
131
Figure 39. Photomicrograph of glauconite from core KW18 off central
Angola. Scale bar represents 0.5 mm.
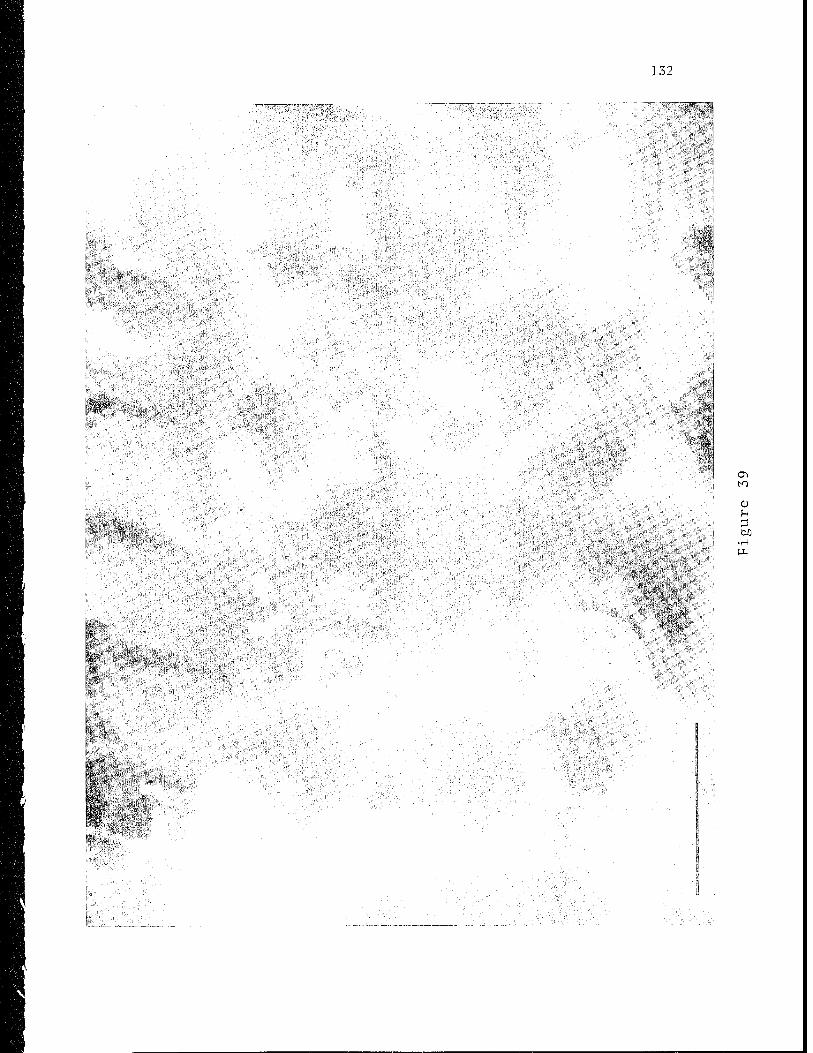
132
fell
t-o
«liiüi
llplifit lÄII
IX,
133
Vertical Changet: In Clay Mineral Abundance
In .'in effort to assess lateral variations la the clay mineral assem-
blage through the late Pleistocene and B.oIocene; samples were analyzed from
the major stratigrapblc units of five cores from the Walvis Ridge to the
Guinea Rise,, Ten to fifteen samples in each core were analyzed and the re-
sults summarized in Figure 40 for montmorillonita„ iHite, and kaolinite.
As can be seen, several apparently significant trends exist within in-
dividual cores,, although no clear relationship to climatic change for the
basin as a whole is evident. The same overall trends observed in the sur-
face sediments are apparent in these cores; illite decreases and kaolinite
and montmorlllonite increase from south to north. The reason for the lack
of any clear vertical changes in clay mineral assemblage within the entire
basin is not obvious In the light of the available data. However, the more
intense circulation of bottom water in the Angola Basin during glacials, in-
ferred from other evidence,, may have redistributed clay minerals throughout
the basin,, thus obscuring vertical variations.
Organic Carbon
Organic carbon content,, determined on selected samples from the major
stratigraphic units cf several cores in the Angola Basin, changes markedly
between cool and warnt periods, as shown by the inverse correlation between
organic carbon ana the carbonate content and the abundance of the Gh menaijjj
complex (Figure 41 and 42)„ Averages for organic carbon were computed for
the Fotocene ana and X„, zones - warm intervals - and for the
Wurm I and il and the X.?. Xy>, and X, zones - cool intervals (Table 2). Cool
y i..!tc...LdCLti'j.2, id by considerably higher organic carbon
134
Figure 40. Vertical distribution of clay minerals within five cores
from the eastern Angola Basin.
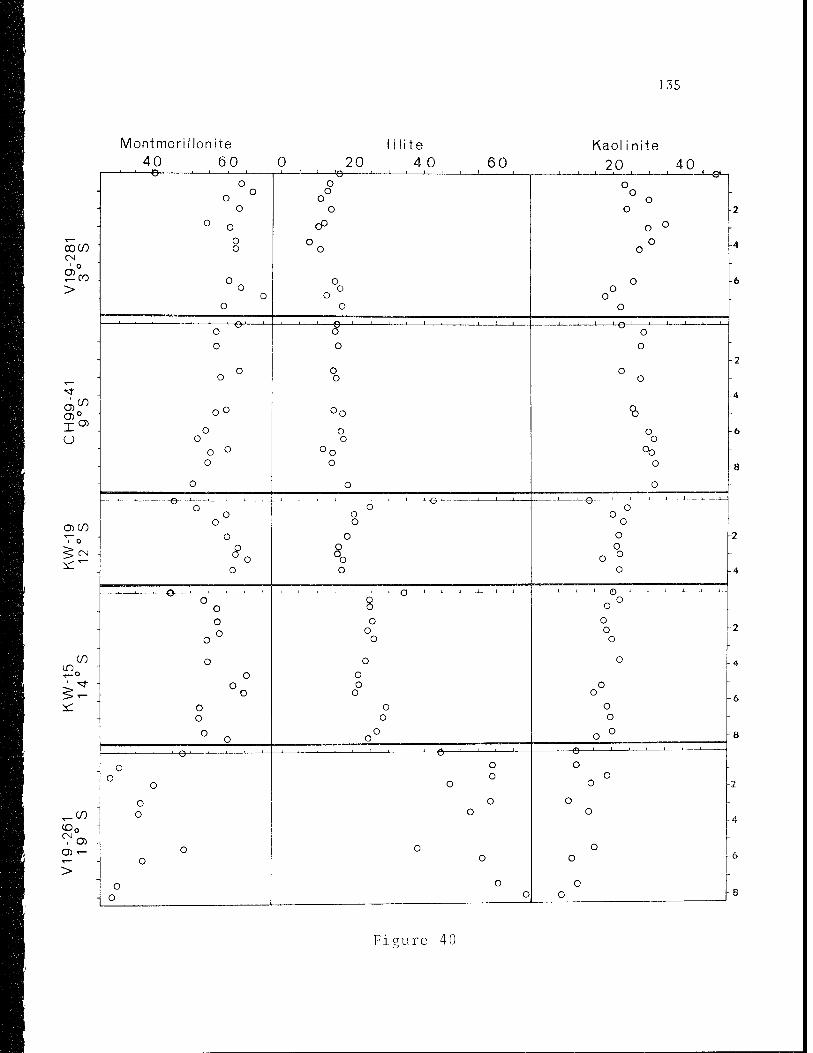
135
Montmori
40 _.—, o '
Ion ite
60 0 20 lite
4 0 ->e-
60 -1 I u
Kaol i nite
20 40 -©*-
oo CO CN
>
o o
o o
cP
-§-
o o
o o
_l 1 L_ _i—L-Q-L-
co a> Z U
O)
O)C0
iC
CO in
>
o o
o o o
8.
o 0 o
o o
o o
o o
—M>-~ o o
&
o o
o
o o
o o o
o o
o o
%
o
o
o o o o
1 f\ .1 1 i ■■o
o o
o o
. o
2
Figure 4 0
136
Figure 41. Relationship between percent organic carbon and the
calcium carbonate content of the silt and clay fraction
and the abundance of G. menardii for cores V19-262, KW-19,
and V19-281.
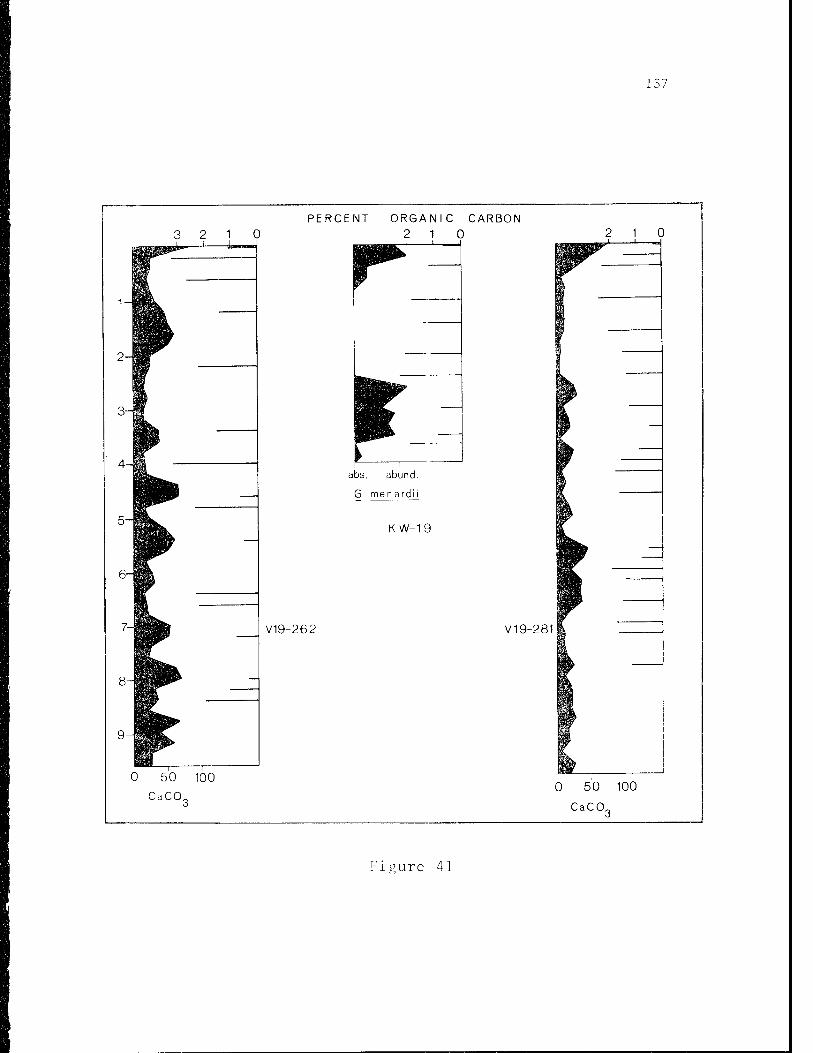
137
PERCENT ORGANIC CARBON
1 0 1 0
abs. abund.
G. men ardii
K W-19
V19-262
0 50 100
CaCO„
W
w w
V19-281
0 50 100
CaCO„
Figure 41
138
Figure 42. Graphs of percent organic carbon versus calcium carbonate
content of the silt and clay fraction for V19-262 and V19-
281 from the northern and southern parts of the Basin.
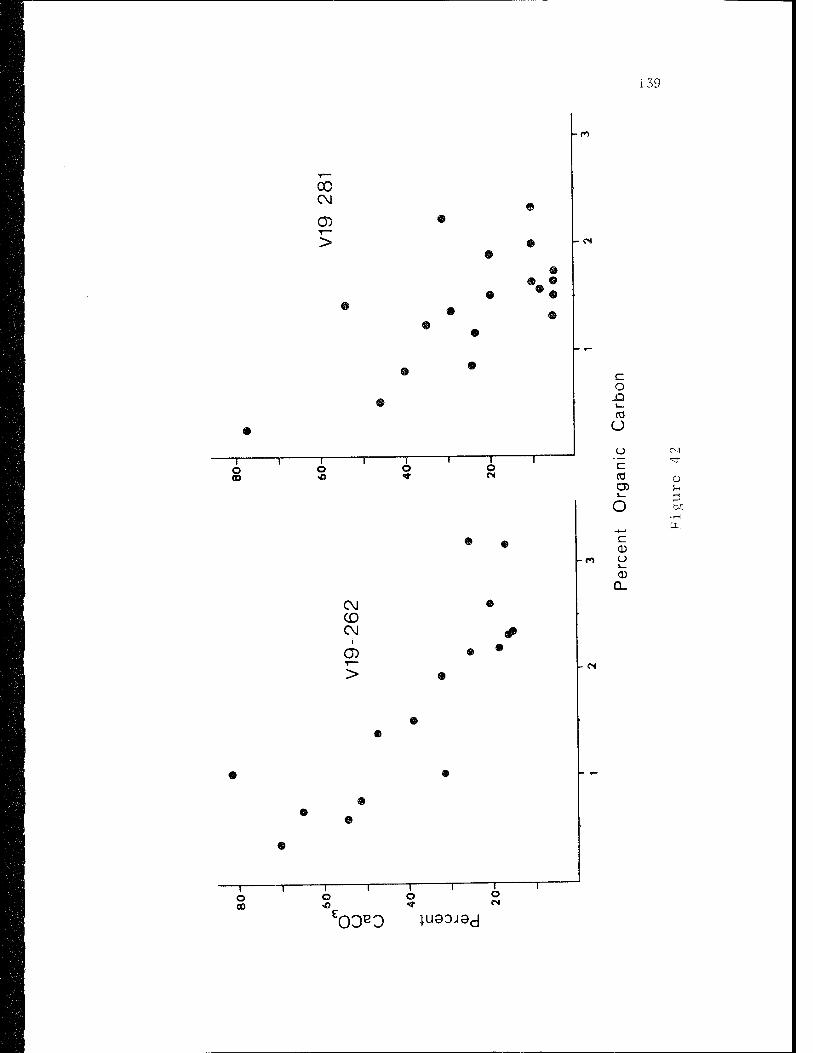
139
-n
T—
CO C\J @ 0) @ ^— > ®
© ®
• ® 9 • 9
- IN
® • ®
• ®
® •
— V
c o
® CO
I • O
-— •=* i r i r i 1 i l 1 o o O O c <a •o
CM CD C\J
6) i—
>
8
• 0
e
• •
9
9
- O
- {N
(0 <D O) U 1_ 3
O M • H
_|_j P-. c CD u ib-
CD a.
' 9
9
* 9
•
•
1 O
1 1 l O
1 l i i o o 00
E03B3
140
values than warm periods, averaging from 0.8 to 1.4% higher. This difference
between warm and cool intervale was shoxva by a Student's t-test to be sig-
nificant at the 95% confidence level.
Organic carbon values measured in these Angola Basin cores in general
are much higher than those reported elsewhere on continental rises, particul-
arly sediments deposited during glacial and cool periods (Table 2). Steven-
son and Cheng (1972) demonstrated differences between warm and cool intervals
in the Argentine Basin similar to those described here, but their highest
measured values were 1.6-1.7% as opposed to 3„2% in the Angola Basin.
Froelich et_ al„ (1971j also showed higher organic carbon values correspon-
ding to low carbonate zones in cores from the continental rise off Cape
Hatteras, though their maximum values were only about 1.5%. The higher
organic carbon values corresponding to low carbonate values in the Angola
Basin can be attributed to the inferred higher surface productivity and
estimated bottom conaiticns conducive to its preservation. The latter will
DO (iis cuss eel i.n more in a .tutor sec Lion.
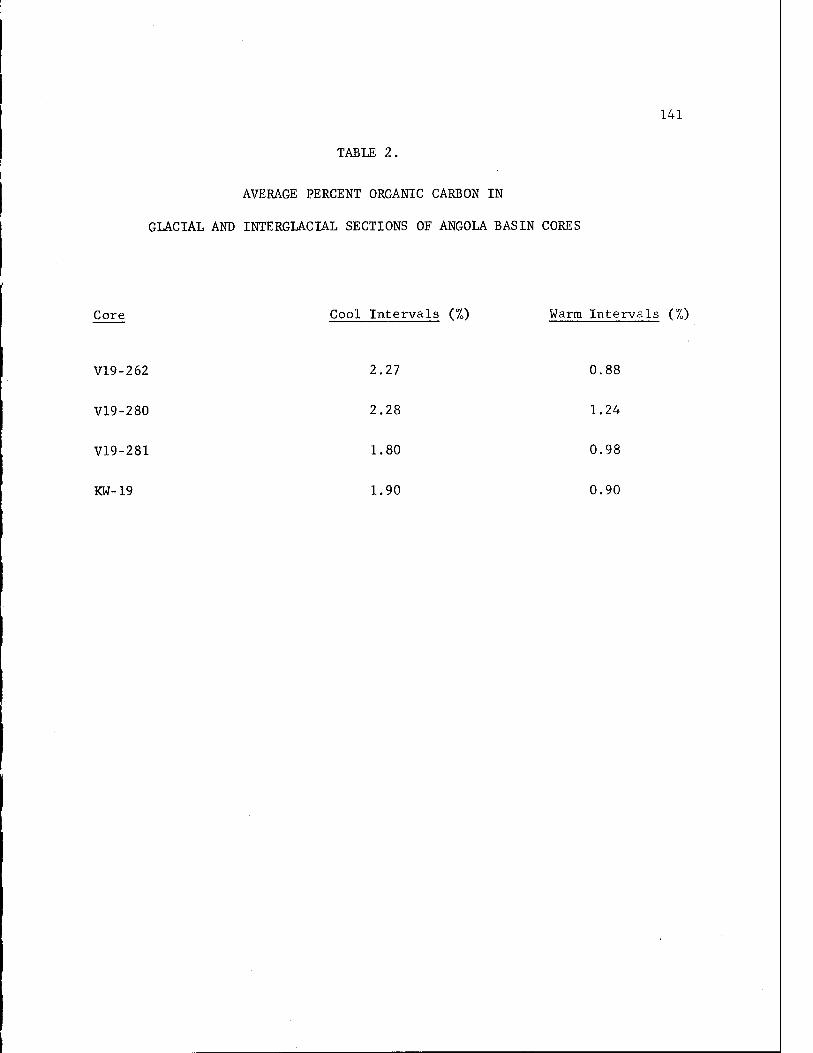
141
TABLE 2.
AVERAGE PERCENT ORGANIC CARBON IN
GLACIAL AND INTERGLACIAL SECTIONS OF ANGOLA BASIN CORES
Core Cool Intervals (70) Warm Intervals (%)
V19-262
V19-280
V19-281
KW-19
2 27
2 28
1 80
1 90
0 88
1 24
0 98
0 90
142 DISCUSSION
The northern and central parts of the Angola Basin derive fine sediment
mainly from the Congo River system.. As Shepard and Emery (in press) indicate,
the Congo River is unique in that its submarine canyon originates over 21 km
inland from the river mouth. Thus, virtually all of the river's bed-load
is delivered to the deep-sea, in contrast to other large tropical river
systems, such as the Amazon, whose sediment is mainly dispersed along the
adjacent continental shelf by longshore currents. The large lobe of kaolin-
itic sediment over the Congo cone and Angola abyssal plain, in the northern
and central regions of the Angola Basin, reflects the source of sediment in
the Congo Basin and its delivery to the deep sea through the Congo Canyon
system. As well, suspended matter dispersal follows a similar areal pattern:
kaolinitic sediment is carried in suspension between 200 and 300 km from
the river mouth where it becomes entrained in a complex surface current sys-
tem. The Angola Current carries this sediment southwards over the central
part of the eastern Angola Basin and longshore currents carry suspended
sediment northwards along the coast of Gabon into the southern Gulf of
Guinea.
At the present time the contribution of fine sediment tc the southern
Angola Basin is primarily accomplished by the northward transport in sus-
pension of illitic and montmorillonitic material mainly from South West Af-
rica in the Benguela Current system. Both the Orange and the Kunene Rivers
are undoubtedly important contributors of fine sediment to the Benguela
Current and ultimately to the Angola Basin; Emel'ianov and Senin (1969),
however, point out that much of the Orange River sediment load is retained
on the South West African shelf and is not carried very far northwards.
143
Thus, although its suspended load is only one tenth that of the Orange
6 6 (15 x 10 tons/yr versus 153 x 10 tons/yr), the Kunene River represents
a very important source of terrigenous sediment in the southern Angola
Basin. In addition, eolian transport of sediment is important in the de-
livery of fine sediment both directly to the Angola Basin and to the
Benguela Current which then carries it northward into the basin (Emel'ianov
and Senin, 1969).
During interglacials, high organic productivity was restricted to the
continental margin along South West Africa and did not extend very far into
the Angola Basin. The highest concentrations and diversities of diatoms,
seen in suspended matter samples, were found south of Lat. 15°S where the
Benguela Current begins to leave the coast. Farther north, the eastward
incursion of the South Equatorial Countercurrent brings unproductive water
over much of the Angola Basin as shown by the impoverished diatom floras
observed in suspended matter samples between latitudes 8° and 15°S; this
water is distributed both southward by the Angola Current and northward by
longshore currents along the coast of Gabon into the southern Gulf of Guinea.
The general sterility of water masses over most of the Angola Basin is inter-
rupted only where major rivers, such as the Congo, deliver sufficient
nutrients to support small localized areas of higher primary productivity.
The relatively low organic carbon values in surface sediments and in
sediments from interglacial intervals (average 1.0%) throughout the basin
reflects this distribution of primary productivity.
At the present time there appears to be very little lateral transport
of fine sediment within the deep basin. Suspended matter concentrations
from deep stations taken during the WALDA expedition display a linear
144
decrease with depth and do not suggest the presence of any nepheloid layers
.'ibovc 4')00 m. Ncphc lomotc.r Htudl.cs (Connnry mid Kwlnp,, 1972), bottom photo-
graphs (Heezen'et al., 1964), and geostrophic current calculations (Wüst,
1957) also support the view that very little lateral sediment dispersal is
presently occurring in the deep Angola Basin. On the other hand, the pre-
sence of continental rise swells off southern Angola and the lack of any
decipherable trends within the clay-mineral distribution pattern within the
late Quaternary suggests that bottom circulation must have been intensified
previously, probably during glacial periods.
Climatic deterioration during the late Cenozoic apparently had a sig-
nificant effect on oceanographic conditions, both surface and deep, and
thereby on the nature of marine sedimentation throughout the world ocean.
Watkins and Kennett (1971, 1972), Kennett and Brunner (1973), and Hayes et
al. (1973) have shown that the growth of Antarctic continental glaciation,
beginning in the Miocene, led to markedly increased rates of bottom water
production and to erosion and non-deposition in parts of the Southern Ocean.
Farther to the north, Johnson (1972) showed that erosion in the equatorial
Pacific by northward-flowing bottom water began during the late Cenozoic.
Emery and others (in prep.) account for the presence of continental rise
swells along the southern flank of the Walvis Ridge and the South West African
continental rise and for the dissection of the western Cape abyssal plain
by the flow of Antarctic Bottom Water, possibly commencing in the late
Cenozoic. Fluctuations in the rate of production and the effects of this
bottom water would be expected to have occurred during the Quaternary in
response to the advance and retreat of continental ice sheets (Gordon, 1971).
The observed topographic features on the continental rise in the southern
145
Angola Basin can be accounted for by the influx of bottom water during
glacial intervals, periods of greater bottom water production. This pro-
posed change in deep circulation is consistent with the model discussed
below (and schematically shown in Figure 43), based on geochemical and
compositional changes within cores, which attempts to account for the
variations in volume and nature of bottom water during the late Quaternary
in the Angola Basin.
At present time virtually no bottom water enters the Angola or Guinea
Basins. The sill depth (3750 m) (Metcalf et al., 1964) of the equatorial
Atlantic region is slightly above the upper level of bottom water in the
western South Atlantic (Figure 11) and only a very small volume of water
passes into the Guinea Basin where it is quickly mixed and loses its
identity (Metcalf et alv 1964). During glacial intervals, however, the
greater production of bottom water would have raised the level above sill
depth, permitting the continuous flow of bottom water into the eastern
basins; this influx would have continued until the level again fell below
sill depth (during interglacials) (Figure 43). A rise in the level of
bottom water in the western equatorial Atlantic of only one to two hun-
dred meters could conceivably have led to the emplacement of a layer of
bottom water up to several hundred meters thick in the Angola and Guinea
Basins. The intensity of deep circulation would have diminished following
a glacial maximum, as less bottom water of progressively lower density
would enter the Angola Basin.
In addition to creating a more intense circulation scheme, greater pro-
duction of bottom water during glacial intervals also probably had an im-
portant effect both on the level of the lysocline in the Angola Basin and on
146
Figure 43. Schematic interpretation of bottom conditions in the
Angola Basin during (a) glacial maxima; (b) an inter-
mediate stage of warmer climate; and (c) interglacial
maximum. (See text for further explanation of the model),
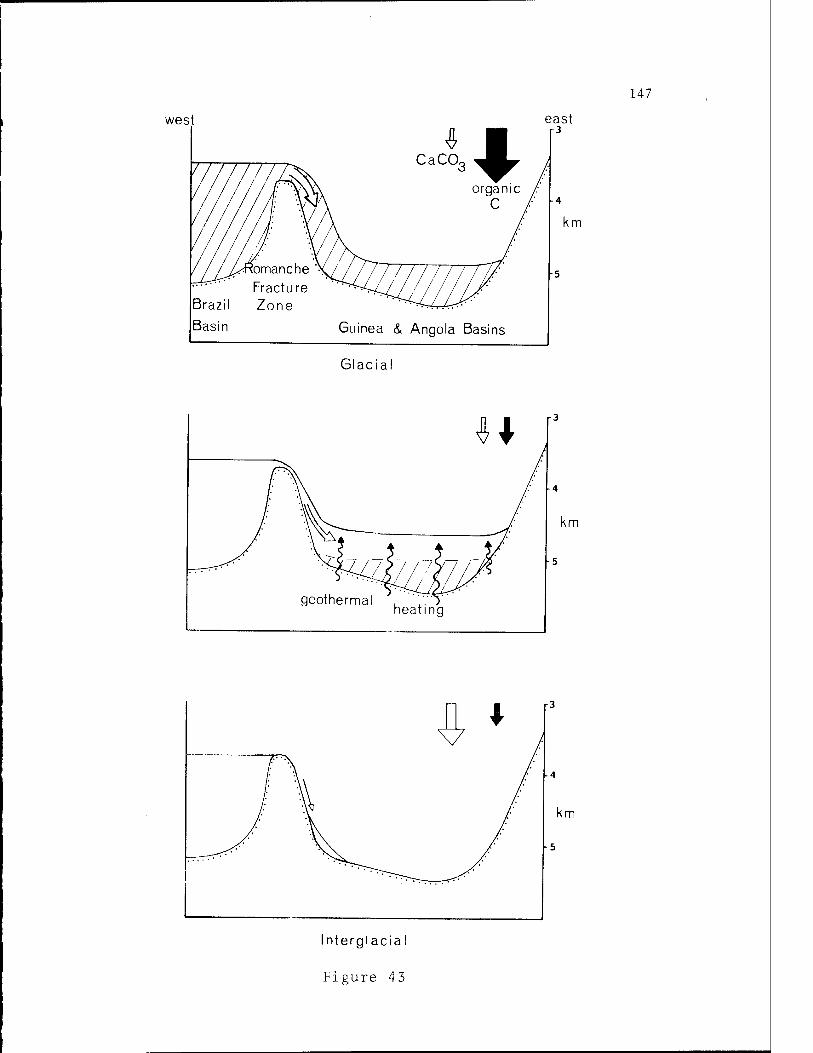
147
wes
Glacial
km
Intergiacial
Figure 43
148
the extent of reducing conditions on the sea floor. As Worthington (1968)
suggested, bottom water derived during the coldest periods would be of
higher salinity and slightly lower temperature than that forming today.
This dense water (1.0286 - 1.0287) would fill the deeper parts of the sea
floor and; subsequent to a glacial maximum, become nearly stagnant since its
upward displacement could only be effected through geothermal heating. This
vertical mixing could take several thousand years, during which time oxygen
levels would be depleted and carbon dioxide levels would be increased leading
to greater rates of solution of carbonate on the sea floor. The increased
rate of production of bottom water during glacials would result in a much
greater influx of corrosive water through the Romanche Fracture Zone into
the Guinea and Angola Basins. This dense water, which was probably initially
more undersaturated with respect to calcite than present bottom water
(Berger, 1968) remained in the deepest parts of these eastern basins until
mixed with the overlying water.
Berger deduced that, the lysocline presently lies at approximately 4700
meters depth in the northern Angola Basin and at 5200 meters in the south.
This latter figure is about 800 m deeper than the level in the Brazil Basin
(Figure 44). The severe reduction in carbonate observed in the deep-sea
cores from the Angola Basin suggests that the lysocline was at least 500 to
600 meters shallower during glacials than interglacials. Based on Worthing-
ton 's (1968) estimate of the geothermal mixing rate of "climax bottom water"
(15, 000 years for a layer 1000 m thick), it would require approximately
7,500 to 9,000 years to completely mix a layer of this water 500 to 600
meters thick in the Angola Basin. Since only a part of the bottom water
entering the basin during glacials would be of this type, however, this
149
Figure 44. Depth of the lysocline (m) in the equatorial South
Atlantic (after Berger, 1968).
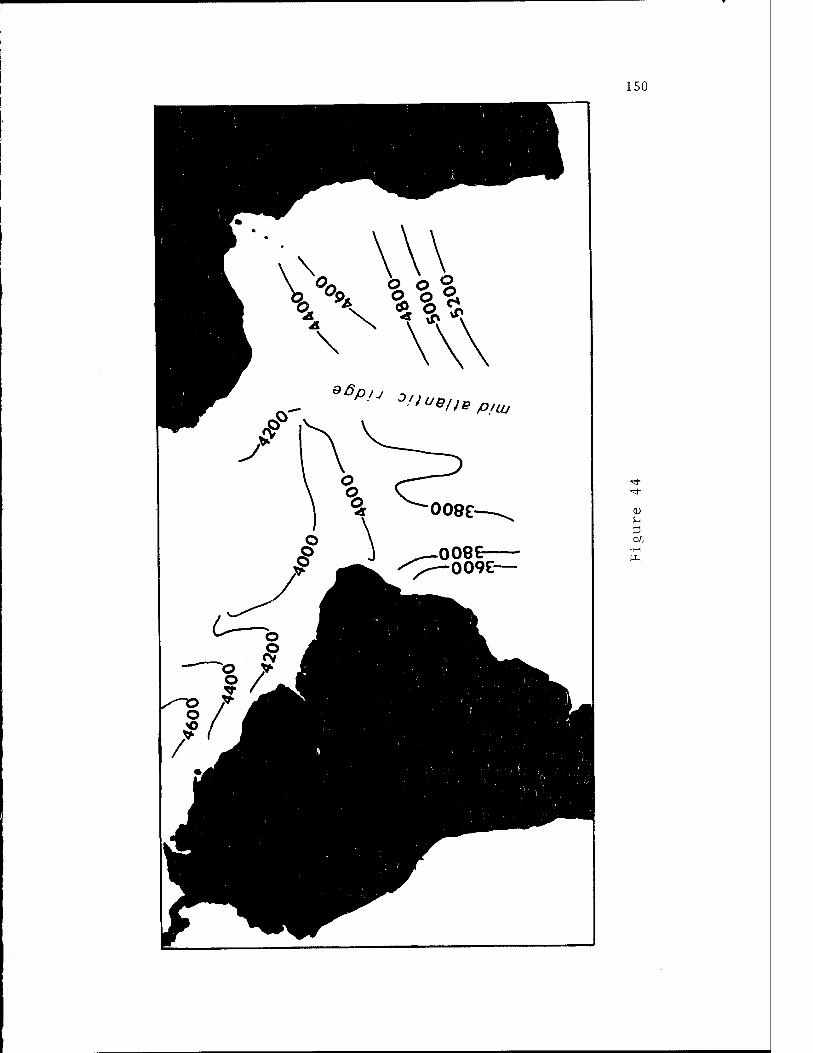
150
■<d-
be • H
151
estimate is probably too high. Based on sedimentation rates inferred for
Angola Basin cores and changes in carbonate content, a period of between
4,000 and 6,000 years would be sufficient to destroy the layer of bottom
water derived during glacials.
More reducing conditions in the Angola Basin would have developed in
response to changes in both bottom circulation and surface oceanographic
conditions, van Zinderen Bakker (1967) deduced that the Benguela Current,
and its associated upwelling, extended northward into the Angola Basin during
glacials as a consequence of the northward displacement of the South At-
lantic Anticyclone. As well, upwelling was initiated along the suitably
aligned section of the coast between Luanda, Angola, and Cape Lopez. Both
of these changes in surface oceanographic conditions led to greater surface
productivity and to the delivery of great amounts of organic matter to the
sea floor in the eastern Angola Basin. As a result, organic carbon levels
from glacial sections of Angola Basin cores are approximately twice those
from interglacial sections, van Andel and Calvert (1971) suggested that
the Benguela Current was intensified during glacials in order to account for
the erosion they observed on the South West African shelf; this would have
led to greater upwelling and higher influx of organic matter into the
Angola and Cape Basins.
The increased delivery of organic matter resulted in higher benthie
productivity as shown by the greater abundance of fecal pellets and burrojs
during glacials. Higher benthic productivity,in turn, would have reduced
oxygen levels and increased carbon dioxide levels, thereby lowering pH and
facilitating the production of pyrite which is commonly found in these sec-
tions of the cores. The rate at which reducing conditions developed pro-
152
bably increased markedly following the height of glaciation as bottom water
became isolated in the deeper parts of the basin.
With regard to the Peru Current, Berger (1970) concluded that greater
than average solution of calcium carbonate would be expected in response to
the rapid delivery of organic matter to the sea floor. The observed drastic
reduction in carbonate during glacials in the deep Angola Basin is in
agreement with Berger's findings. The undersaturation of bottom water with
respect to calcite during glacials would be maintained not only by the in-
creased influx of organic matter, however, but also through the decreased
rate of carbonate input. This is shown by the very marked shift from a
dominantly foraminiferal plankton assemblage in interglacials to a more
radiolarian assemblage during glacials in cores from well above the lysocline.
This change is undoubtedly a result of colder water being brought to the
surface during glacials by the upwelling in the Benguela Current and along
northern Angola, Congo, and Gabon. Thus, the greater solution of carbonate
during glacial intervals was not only effected through the influx of cold,
corrosive bottom water, but also through the increased rate of supply of
organic matter and the decreased rate of carbonate input (Figure 43).
Previous investigators have emphasized the importance of terrigenous
dilution in the reduction of carbonate contents of glacial sections of cores
from the equatorial Atlantic. The. relatively uniform pelagic sedimentation
rates inferred for the Angola Basin throughout the late Quaternary do not
support the concept that terrigenous dilution is the dominant controlling
factor in this area. Based on work on land by dePloey (1963, 1964, 1965)
and Fairbridge (1964) there is considerable evidence that, in fact, the Congo
discharge was probably less during glacials than at present and that its
sediment load was at most the same. Although glacial aridity in the lower
153
Congo Basin led to higher rates of physical weathering, the more readily
available sediment was apparently not removed to the deep sea in appreciably
greater quantities than at present. This is in marked contrast to the
model which Damuth and Fairbridge (1970) proposed for the Amazon-Guiana
Basin system. Glacial aridity in northeastern South America resulted in
deforestation and hence in greater physical weathering and erosion and a
much higher transport of sediment to the deep sea. The Amazon, fed by
Andean glaciers, had a much higher discharge during glacials than inter-
glacials. Changes in carbonate content in cores from the Angola Basin can
be accounted for by variations in surface carbonate productivity and by
changes in sea-floor solution of carbonate tests resulting from fluctuations
in bottom water conditions.
154
CONCLUSIONS
Sedimentation in the eastern Angola Basin throughout the late Quaternary
has been strongly influenced by the prevailing climatic and the oceano-
graphic regimes, both surface and abyssal. High rainfall in modern equator-
ial west Africa leads to large fluvial sediment input from the Congo and
other tropical rivers and results in high sedimentation rates over much of
the continental margin. During glacial intervals the onset of arid and
semi-arid conditions on the adjacent land areas led to higher rates of phys-
ical weathering. The overall lower river discharge during these periods,
however, prevented appreciably greater volumes of sediment from being trans-
ported to the Angola Basin, as evidenced by the relatively uniform sedimen-
tation rates throughout the Quaternary.
At the present time high surface productivity is restricted to the waters
south of the Angola Basin and is associated with the northward flowing cold
Benguela Current. During cooler periods of the Quaternary, however, the
northward extension of the Benguela Current along the coast of Angola and the
onset of upwelling off Congo and Gabon resulted in much greater surface
productivity and led to organic-rich sediments on the underlying continental
margin and to higher benthic productivity. A shift from calcareous to more
siliceous biogenic components also occurred in response to this change in
surface oceanography.
At present very little bottom water enters the eastern basins of the
South Atlantic resulting in a deep lysocline, the widespread accumulation of
calcareous sediments over much of the area, and very sluggish deep circul-
ation. During glacial maxima, however, much more bottom water flowed into
and filled the deeper parts of the Guinea and Angola Basins. This corrosive
155
water significantly raised the lysocline, leading to the dissolution of car-
bonate at depths which are presently dominated by calcareous sediments. The
more vigorous deep circulation during glacials also created continental rise
hills along southern Angola and the Walvis Ridge. The isolation of this
"climax bottom water" in the Angola and Guinea Basins during warmer periods
resulted in the gradual onset of reducing conditions, the preservation of
organic-rich sediments, and the development of authigenic sulfide minerals.
This condition persisted until the "old" bottom water could be mixed, pri-
marily by geothermal heating, with the overlying water mass.
The model proposed to explain the changes in sedimentation during the
late Quaternary in the Angola Basin may find profitable application in
other restricted basins in the world ocean.
156
REFERENCES
Arrhenius, G., 1952, Sediment cores from the East Pacific: Swedish Deep-sea
Expedition. (1947-48) Repts., v. 5, 89 p.
Baumgartner, T.R. and van Andel, Tj.H., 1971, Diapirs of the continental
margin of Angola, Africa: Geol. Soc. Amer. Bull., v. 82, p. 793-802.
Berger, W.H., 1968, Planktonic foraminifera: selective solution and paleo-
climatic interpretation: Deep-Sea Res., v. 15, p. 31-43.
, 1970, Planktonic foraminifera: selective solution and the
lysocline: Marine Geology, v. 8, p. 111-138.
Berthois, L., Crosnier, A. and le Calvez, Y., 1968, Contribution a 1'etude
sedimentologique du plateau continental dans la baie de Biafra: Cah.
O.R.S.T.O.M., ser. oceanogr., IV, p. 55-66.
Biscaye, P.E., 1964, Distinction between kaolinite and chlorite in Recent
sediment by X-ray diffraction: Am. Mineralogist, v. 49, p. 1281-1289.
, 1965, Mineralogy and sedimentation of Recent deep-sea clay
in the Atlantic Ocean and adjacent seas and oceans: Geol. Soc. Amer.
Bull., v. 76, p. 803-832.
Bornhold, B.D., Mascle, J.R. and Harada, K., 1973, Suspended matter in sur-
face waters of the eastern Gulf of Guinea: Marine Geology, in press.
Broecker, W.S., 1971, Calcite accumulation rates and glacial to interglacial
changes in oceanic mixing: _in Turekian, K. (ed.), Late Cenozoic Glacial
Ages, Yale Univ. Press, New Haven, p. 239-265.
and van Donk, J., 1970, Insolation changes, ice volumes, and
18 the 0 record in deep-sea cores: Reviews of Geophysics and Space Physics,
v. 8, p. 169-197.
Capart, A., 1951, Liste des Stations. Expedition Oceanographique Beige dans
157
les Eaux Cötieres Africaines de 1'Atiantique Sud (1948-1949): Institut
Royal des Sciences Naturelles de Belgique.
Chester, R., Elderfield, H., Griffin, J.J., Johnson, L.R. and Padgham, R.C.,
1972, Eolian dust along the eastern margins of the Atlantic Ocean:
Marine Geology, v. 13, p. 91-105.
Connary, S.D. and Ewing, M., 1972, The nepheloid layer and bottom circulation
in the Guinea and Angola Basins: _in A.L. Gordon (ed.), Studies in Physical
Oceanography, Gordon and Breach, London.
Cooke, H.B.S., 1947, The development of the Vaal River and its deposits:
South African Geol. Soc, Trans., v. 49, p. 243-259.
Damuth, J.E. and Fairbridge, R„W., 1970, Equatorial Atlantic deep-sea arkosic
sands and ice-age aridity in tropical South America: Geol. Soc. Amer.
Bull., v. 81, p. 189-206.
DeDecker, A.H.B,, 1970, AD. oxygen-depleted sub-surface current off the west
coast of South Africa: Invest 1. Rept. Div. Sea Fisheries, South Africa,
No. 84, 24 p.
de Ploey, J., 1963, Quelques indices sur l'evolution morphologique et paleo-
climatique des environs du Stanley-Pool (Congo); "Lovanium," Fac. Sc,
v. 17, 16 p.
, 1964, Cartographie geomorphologique et morphogenese aux en-
virons du Stanley-Pool (Congo): Acta Congr. Lovaniensa, v. 3, p. 431-441.
, 1965, Positions geomorphologique, genese et Chronologie de
certains depots superficiels au Congo occidental: Quatemaria, VII,
p. 131-154.
Donguy, J.-R., Hardiville, J. and LeGuen, J.C., 1965, Le parcours maritime
des eaux du Congo: Cahiers Oceanographiques, v. 17, p. 85-97.
158
Fairbridge, R.W., 1964, African ice-age aridity, in A.E.M. Nairn (ed.), Pro-
blems in Paleoclimatology, Interscience, p. 356-374.
Flint, R.F., 1959, Pleistocene climates in eastern and southern Africa: Geol.
Soc. Amer. Bull., v. 70, p. 343-374.
Froelich, P., Golden, B., and Pilkey, O.H., 1971, Organic carbon in sediments
of the North Carolina continental rise: Southeastern Geol.,v. 13, p. 91-
97.
Fuglister, F.C., 1961, Atlantic Ocean atlas of temperature and salinity pro-
files and data from the International Geophysical Year 1957-1958: Atlas
Ser., Woods Hole Oceanographic Institution, 1.
Gallardo, Y., Crosnier, A., Gheno, Y., Guillerm, J.M., LeGuen, J.C. and Rebert,
J.P., 1969, Resultas hydrologiques des campagnes du Centre O.R.S.T.O.M.
de Pointe Noire (Congo-Brazza) devant 1'Angola, de 1965 a 1967: Cah.
Oceanographiques, v. 21, p. 584-593 and 387-400.
Giresse, P., 1965, Oolithes ferrugineuses en voie de formation au large du
Cap Lopez (Gabon): C.R. Acad. Sei., v. 260, p. 2550-2552.
} 1969, Etude des differents grains ferrugineux authigenes des
sediments sous-marins ar large du delta de l'Ogooue (Gabon): Science de
la Terre, v. 14, p. 27-62.
and Kouyoumontzakis, G., 1971, Rapport de la mission effectuee
par la Laboratoire de Geologie du Centre d'Enseignement superieur de
Brazzaville a bord du "Nizery" du 2 au 5 juin 1971: O.R.S.T.O.M,, P.c.
no. 517 SR, Centre de Pointe Noire, 5 p.
Goldberg, E.D. and Griffin, J.J., 1964, Sedimentation rates and mineralogy
in the South Atlantic: Jour. Geophys. Res., v. 69, p. 4293-4309.
159
Gordon, A.L., 1911, Oceanography of Antarctic waters: _in J.L. Reid (ed.),
Antarctic Oceanology I, Antarctic Res. Series, v. 15, p. 169-203.
Hart, T.J. and Currie, R.I., 1960, The Benguela Current: Discovery Reports,
v. 31, p. 123-298.
Hayes, D.E. and others, 1973, Leg 28 deep-sea drilling in the southern Ocean:
Geotimes, v. 18, p. 19-24.
Hays, J.D. and Perruzza, A., 1972, The significance of calcium carbonate
oscillations in eastern equatorial Atlantic deep-sea sediments for the
end of the Holocene warm interval: Quaternary Res., v.2, p. 355-362.
Irnbrie, J. and Kipp, N., 1971, A new micropaleontological method for quan-
titative paleoclimatology: application to a late Pleistocene Caribbean
core: _in K. Turekian (ed.), Late Cenozoic Glacial Ages, Yale Univ. Press,
New Haven, Conn.
Johnson, D.A0, 1972, Ocean-floor erosion in the equatorial Pacific: Geol. Soc.
Amer. Bull., v. 83, p. 3121-3144.
Jones, N., 1944, The climatic and cultural sequence at Sawmills, Southern
Rhodesia: Southern Rhodesia Natl. Museum, Occ. Papers, v. 2, p. 39-46.
Kennett, J.P. and Brunner, CAC, 1973, Antarctic late Cenozoic glaciation:
Evidence for initiation of ice-rafting and inferred increased bottom-
water activity: Geol. Soc. Amer. Bull., v. 84, p. 2043-2052.
and Huddlestun, P., 1972, Late Pleistocene paleoclimatology,
foraminiferal biostratigraphy, and tephrachronology, western Gulf of
Mexico: Quaternary Research, v. 2, p. 38-69.
Landsberg, H.E., Lippman, H., Paffen, Kh. , and Troll, C, 1963, World Maps
of Climatology: Springer-Verlag, Gottingen-Heidelberg, 28 pp.
Lavrov, V.M. and Savel'yeva, K.P., 1972, Deep-water sediments in the Guinea
160
Basin: Oceanology, v. 12, p. 551-562.
Leakey, L.S.B., 1949, Tentative study of the Pleistocene climatic changes
and stone-age culture sequence in northeastern Angola: Diamang Publ.
Cultur., Mus. Dondo, iv.
LePichon, X. and Hayes, D.E., 1971, Marginal offsets, fracture zones, and the
opening of the South Atlantic: Jour. Geophys. Res., v. 76, p. 6283-6293.
Leyden, R., Bryan, G., and Ewing, M., 1972, Geophysical reconnaissance on
African shelf: 2. Marginal sediments from Gulf of Guinea to Walvis
Ridge:
Lidz, L., 1966, Deep-sea Pleistocene biostratigraphy: Science, v. 154, p. 1448-
1452.
Manheim, F.T., Meade, R.H., and Bond, G.C., 1970, Suspended matter in surface
waters of the Atlantic continental margin from Cape Cod to the Florida
Keys: Science, v. 167, p. 371-376.
Mascle, J.R., Bornhold, B.D., and Renard, V., in press, Diapiric structures
off the Niger delta: Bull. Amer. Assoc. Petrol. Geol.
Mclntyre, A. and Ruddiman, W.F., 1972, Northeast Atlantic Post-Eemian paleo-
oceanography, a predictive analog of the future: Quaternary Research,
v. 2, p. 350-354.
Mesolella, K.J., Matthews, R.K., Broecker, W.S., and Thurber, D.L., 1969,
The astronomical theory of climatic change: Barbados data: Jour. Geol.,
v. 77, p. 250-
Metcalf, W.G., Heezen, B.C., and Stalcup, M.C., 1964, The sill depth of the
Mid-Atlantic Ridge in equatorial regions: Deep-Sea Res., v. 11, p. 1-10.
Moreau, R.E., 1933, Pleistocene climatic changes and the distribution of
life in East Africa: Jour Ecology, v. 21, p. 415-435.
161
Moroshkln, K.V., Bubnov, V.A., and Bulatov, R.P., 1970, Water circulation
in the eastern South Atlantic Ocean; Oceanology, v. 10, p. 27-37.
Payne, R.R. and Conolly, J.R„, 1972, Turbidite sedimentation off the Antarctic
continent: _in D.E. Hayes (ed.), Antarctic Oceanology II, The Australian-
New Zealand Sector, Antarctic Res. Series, v. 19, American Geophys.Union.
Porrenga, D.H., 1965, Clay minerals in Recent sediment of the Niger delta:
Clays and Clay Minerals, Proc. 14th Clay Conf., p. 221-233.
Pratje, 0., 1935, Die Sedimente des Sudatlantischen Ozeans: Wiss. Ergeb. dt.
Atl. Exped. Meteor 1925-1927, iii, 2, p. 1-171.
Rabinowitz, P.D., 1972, Gravity anomalies on the continental margin of Angola,
Africa: Jour. Geophys. Res., v. 77, p. 6327-6347.
Ruddiman, W.F., 1971, Pleistocene sedimentation in the equatorial Atlantic:
stratigraphy and faunal paleoclimatology: Geol. Soc. Amer. Bull., v. 82,
p. 283-302.
Schott, W., 1935, Die Foraminiferan in dem äquatorialen Teil des Atlantischen
Ozeans: Wiss. Ergeb. dt. Atl. Exped. Meteor 1925-1927, iii, 3, p. 43-134.
Schell, I.I., 1968, On the relation between winds off Southwest Africa and
the Benguela Current and Aghulhas Current penetration in the South At-
lantic: Deutsche Hydrographische Zeitschrift, v. 21, p. 109-117.
Shepard, F.P. and Emery, K.O., in press, Congo submarine canyon and fan
valley: Amer. Assoc. Petrol. Geol.
Shannon, L.V., and van Rijswijck, M., 1969, Physical Oceanography of th?.
Walvis Ridge region: Invest 1. Rept. Div. Sea Fisheries South Africa,
No. 70.
Steeman Nielsen, E. and Jensen, A.E., 1957, Primary oceanic production:
Galathea Repts., v. 1, p. 47-136.
162
Stevenson, F.J. and Cheng, C.-N., 1972, Organic geochemistry of the Argentine
Basin sediments: carbon-nitrogen relationships and Quaternary correlations:
Geochim. et Cosmochim. Acta, v. 36, p. 653-671.
Uchupi, E., 1972, Bathymetric Atlas of the Atlantic, Caribbean and Gulf of
Mexico: Woods Hole Oceanographic Institution, Ref. No. 71-72, 10 p.
van Andel, Tj.H. and Calvert, S.E., 1971, Evolution of sediment wedge, Walvis
shelf, Southwest Africa: Jour. Geol., v. 79, p. 585-602.
van der Merwe, C.R., 1966, Soil groups and sub-groups of South Africa: Dept.
Agr. Techn. Serv. Science, Publ. 231, 353 p.
van Zinderen Bakker, E.M., 1963, Analysis of pollen samples from northeast
Angola: in J.D. Clark (ed.), Prehistoric Cultures of Northeast Angola
and Their Siginificance in Tropical Africa: Part I, Museo do Dondo,
p. 213-217.
1966, The pluvial theory - an evaluation in the
light of new data, especially for Africa: the Paleobotanist, v. 15,
p. 128-134.
, 1967, Upper Pleistocene and Holocene stratigraphy
and ecology on the basis of vegetation changes in sub-Saharan Africa:
in W.W. Bishop, and J.D. Clark (eds.), Background to Evolution in Africa,
Univ. Chicago Press, p. 125-147.
, 1969, Reconstruction of Quaternary climates: _in
E.M. van Zinderen Bakker (ed.), Paleoecology of Africa, v. iv, Balkema,
Cape Town.
and Clark, J.D., 1962, Pleistocene climates and
cultures northeastern Angola: Nature, v. 196, p. 639-642.
and Coetzee, J.A., 1972, Reappraisal of late
163
Quaternary climatic evidence from tropical Africa: in E.M. van Zinderen
Bakker (ed.), Paleoecology of Africa, the Surrounding Islands and Ant-
arctica, vii, Balkema, Cape Town,
von Herzen, R.P., Hoskins, H., and van Andel, Tj.H., 1972, Geophysical studies
on the Angola diapir field: Geol. Soc. Amer. Bull., v. 83, p. 1901-1910.
Voss, F., 1970, Kaltzeitliche Ablagerungen im Hochland von Angola: Eiszeitalter
u. Gegenwart, v. 21, p. 145-160.
Watkins, N.D. and Kennett, J.P., 1971, Antarctic bottom water: a major change
in velocity during the late Cenozoic between Australia and Antarctica:
Science, v. 173, p. 813-818.
and , 1912, Regional sedimentary disconformities
and upper Cenozoic changes in bottom water velocities between Australia
and Antarctica: Amer. Geophys. Union, Antarctica Res. Series, v. 19,
p. 273-293.
Worthington, L.V., 1968, Genesis and evolution of water masses: Meteorological
Monogr., v. 8, p. 63-67.
and Wright, R., 1970, N<_rth Atlantic Ocean Atlas of Potential
Temperature and Salinity in the Deep Water: Woods Hole Oceanograp hie
Institution, Atlas Series, 2.
Wüst, G., 1933, Das Bodenwasser und die Gliederung der Atlantischen Tiefsee:
Wiss. Ergeb. dt. Atl. Exped. Meteor 1925-1927, vi, p. 1-107.
, 1957, Stromgeschwindigkeiten und Strommengen in der Tiefen das
Atlantishen Ozeans: "Meteor"-Werk, 6 (2), p. 261-420.
Yeroshev-shak, V.A., 1961, Kaolinite in the sediments of the Atlantic Ocean:
Dokl. Akad. Nauk SSSR, v. 137, p. 695-697.
164
Duncan, J.R., Fowler, G.A., and Kulm, L.D., 1970, Planktonic foraminiferan-
radiolarian ratios and Holocene - late Pleistocene deep-sea stratigraphy
off Oregon: Geol. Soc. Amer. Bull., v. 81, p. 561-566.
Emel'ianov, E.M. and Senin, Iu.M., 1969, Composition of the sediments of the
South-west Africa shelf: Litologiia i poleznye iskopaemye, v. 2, p. 10-25.
Emery, K.O., 1973, Eastern Atlantic continental margin: some results of the
1972 cruise of the R.V. "Atlantis II": Science, v. 178, p. 298-301.
, Hayashi, Y., Hilde, T.W.C., Kobayashi, K., Koo, J.H., Meng, C.Y.,
Niino, H., Osterhagen, J.H., Reynolds, L.M., Wageman, J.M., Wang, C.S.,
and Yang, S.J., 1969, Geologic structure and some water characteristics
of the East China Sea and the Yellow Sea: Tech. Bull. Econ. Comm. Asia
Far East, v. 2, p. 3-43.
, Milliman, J.D. and Uchupi, E., 1973, Physial properties and
suspended matter of surface waters in the southeastern Atlantic Ocean:
Jour. Sed. PetroL, in press.
Emiliani, C, 1955, Pleistocene temperatures: Jour. Geol., v. 63, p. 538-578.
.____, 1964, Paleotemperature analysis of Caribbean cores A254-BR-C
and CP.28: Geol. Soc. Amer. Bull., v. 75, p. 129-144.
, 1971, The last interglacial. Paleotemperatures and chronology:
Science, v. 171, p. 571-573.
Ericson, D.B. and Wollin, G., 1956, Micropaleontological and isotopic deter-
minations of Pleistocene climates: Micropaleontology, v. 2, p. 257-270.
, Ewing, M., Wollin, G., and Heezen, B.C., 1961, Atlantic deep-
sea sediment cores: Geol. Soc. Amer. Bull., v. 72, p. 193-286.
Ewing, M., Ericson, D.B. and Heezen, B.C., 1958, Sediments and topography of
the Gulf of Mexico: _in L. Weeks (ed.), Habitat of Oil, Am. Assoc. Petrol.
Geol., p. 995-1053.
165
APPENDIX I
Sample Locations
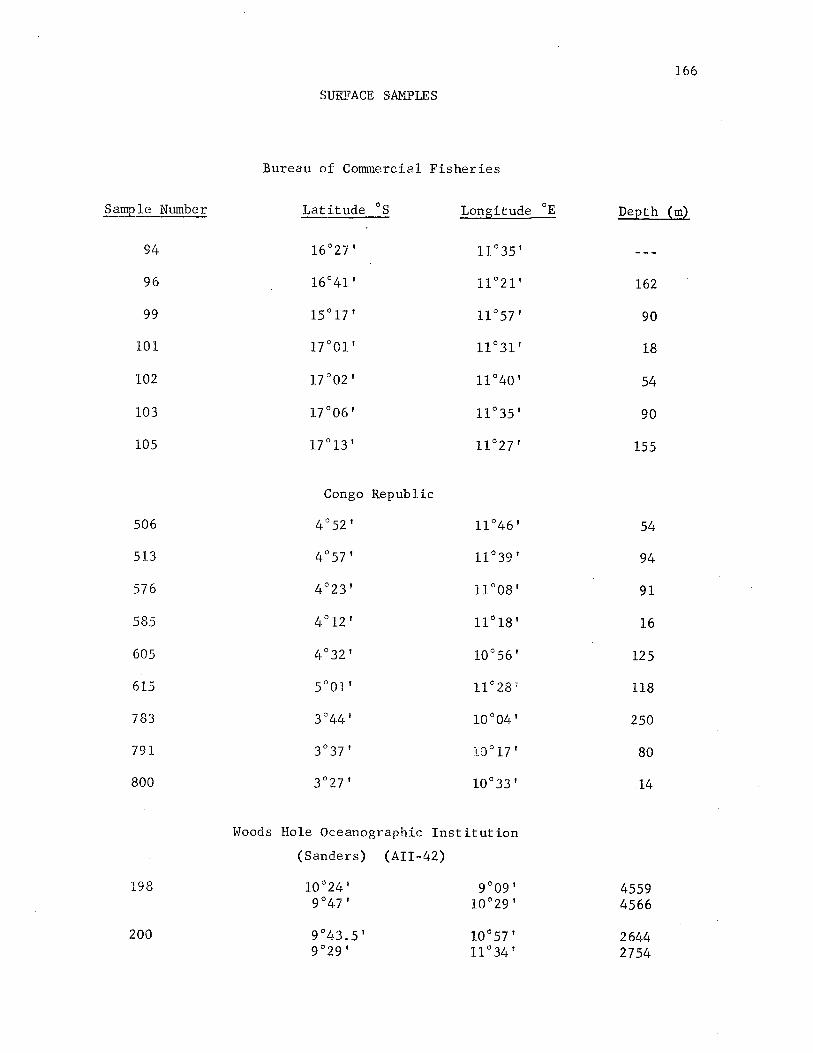
166
SURFACE SAMPLES
Bureau of Commercial Fisheries
Sample Number Latitude °S Longitude °E Depth (m)
94
96 16°41* 11°21* 162
99 15°17' 11°57* 90
101 17°01* 11°31' 18
102 17°02' 11°40' 54
103 17°06* 11°35' 90
105 17°13' 11°27' 155
Latitude S Longitude E
16°27' 11°35"
16°41* 11°21*
15°17' 11°57*
17°01' 11°31'
17°02' 11°40'
17°06* 11°35'
17°13' 11°27'
Congo Republic
4°52' 11°46'
4°57' 11°39'
4°23' 11°08'
4°12' 11°18'
4°32' 10°56'
5°01* 11°28'
3°44' 10°04'
3°37' 10°17'
3°27' 10°33'
506 4°52' 11°46' 54
513 4°57' 11°39' 94
576 4°23' 11°08' 91
585 4°12' 11°18' 16
605 4°32' 10°56' 125
615 5°01f 11°28' 118
783 3°44' 10°04' 250
791 3°37' 10°17' 80
800 3°27' 10°33' 14
Woods Hole Oceanographic Institution
(Sanders) (AII-42)
198 10°24' 9°09' 4559 4566
0 °24 9 °47
9 °43. 5' 9 '29*
200 9°43.5' 10°57' 2644 2754
9 '09' 10( >29'
10' 57' llc 34'
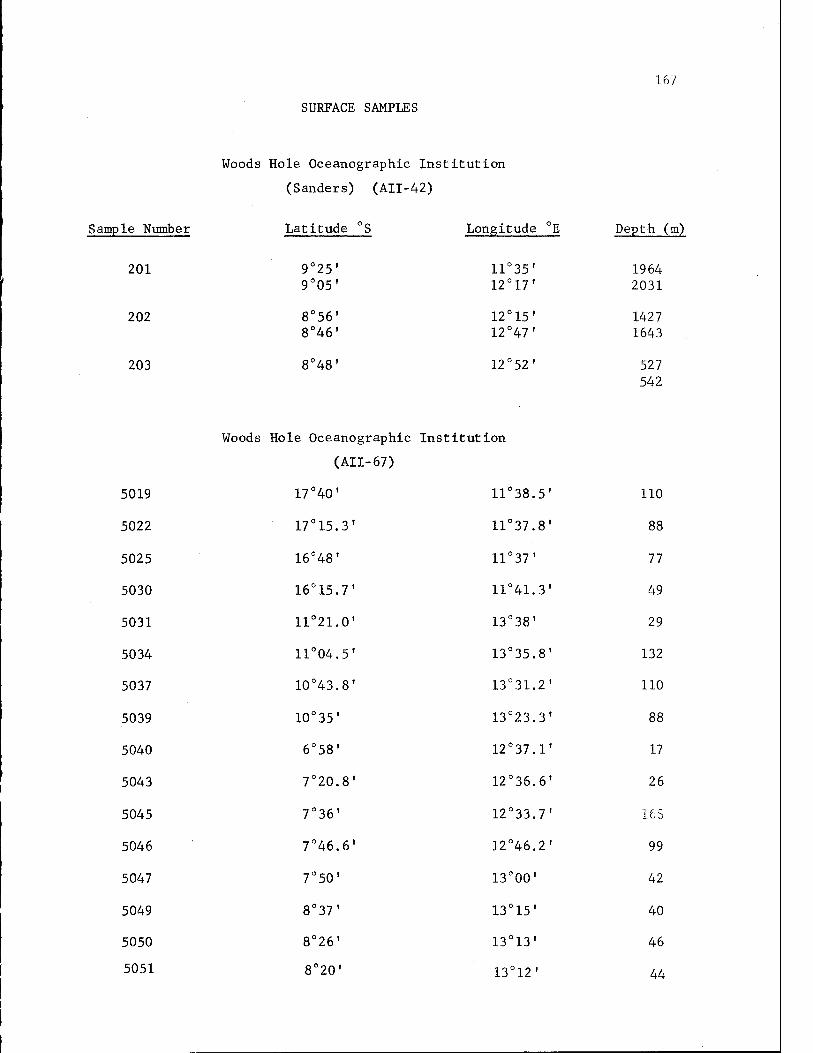
SURFACE SAMPLES
167
Woods Hole Oceanographic Institution
(Sanders) (AII-42)
Sample Number
201
202
203
Latitude °S Longitude °E Depth (m)
9°25' 11°35' 1964 9°05' 12°17' 2031
8°56' 12°15' 1427 8°46' 12°47' 1643
8°48' 12°52' 527 542
5019
5022
5025
5030
5031
5034
5037
5039
5040
5043
5045
5046
5047
5049
5050
5051
Woods Hole Oceanographic Institution
(AII-67)
17°40'
17°15.3'
16°48'
16°15.7'
11°21.0'
11°04.5'
10°43.8'
10°35'
6°58'
7°20.8'
7°36'
7°46.6*
7°50'
8°37'
8°26'
8°20'
11°38.5' 110
11°37.8' 88
11°37' 77
11°41.3' 49
13°38' 29
13°35.8' 132
13°31.2' 110
13°23.3' 88
12°37.1' 17
12°36.6' 26
12°33.7' 163
12°46.2' 99
13°00' 42
13°15' 40
13°13' 46
13°12' 44
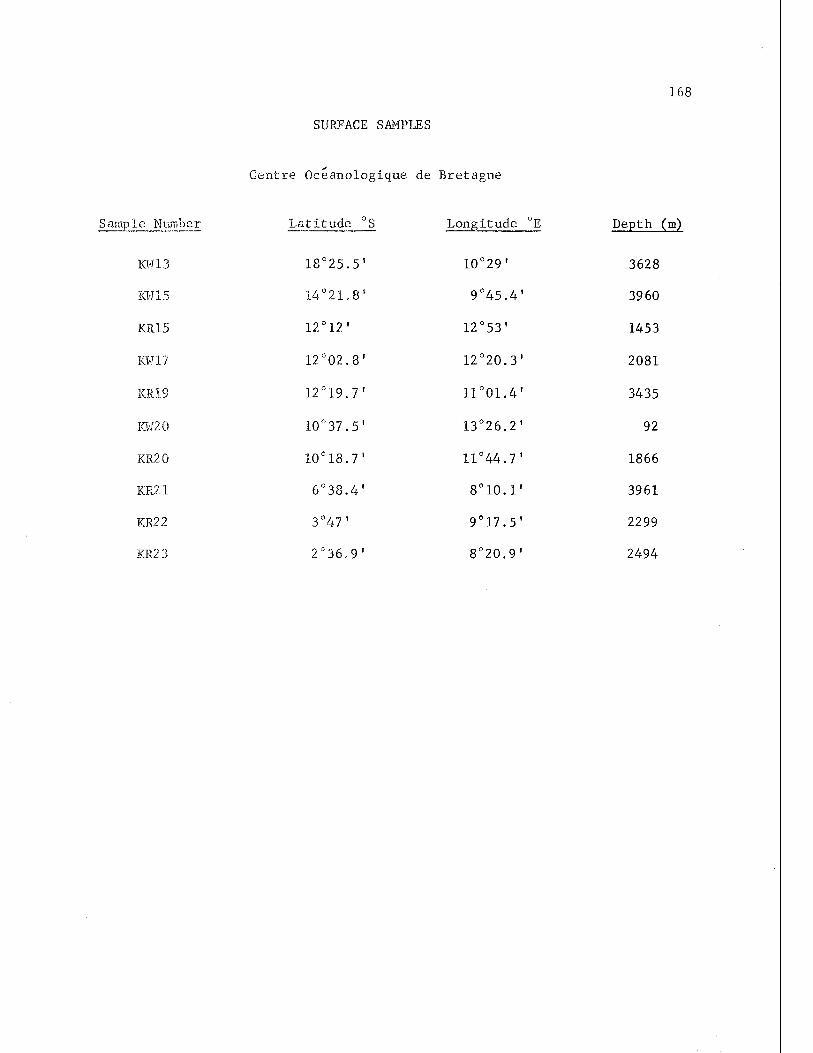
168
SURFACE SAMPLES
Centre Oceanologique de Bretagne
Sjamp_Le Number Latitude S Longitude E Depth (m)
KW13 18°25.5' 10°29' 3628
KW15 14°21.8' 9°45.4* 3960
KR15 12°12* 12°53' 1453
KW17 12°02.8' 12°20.3' 2081
KR19 12°19.7* 11°01.4' 3435
KW20 10°37.5' 13°26.2' 92
KR20 10°18.7' 11°44.7' 1866
KR21 6°38.4' 8°10.1' 3961
KR22 3°47' 9°17.5' 2299
KR23 2°36.9' 8°20.9' 2494
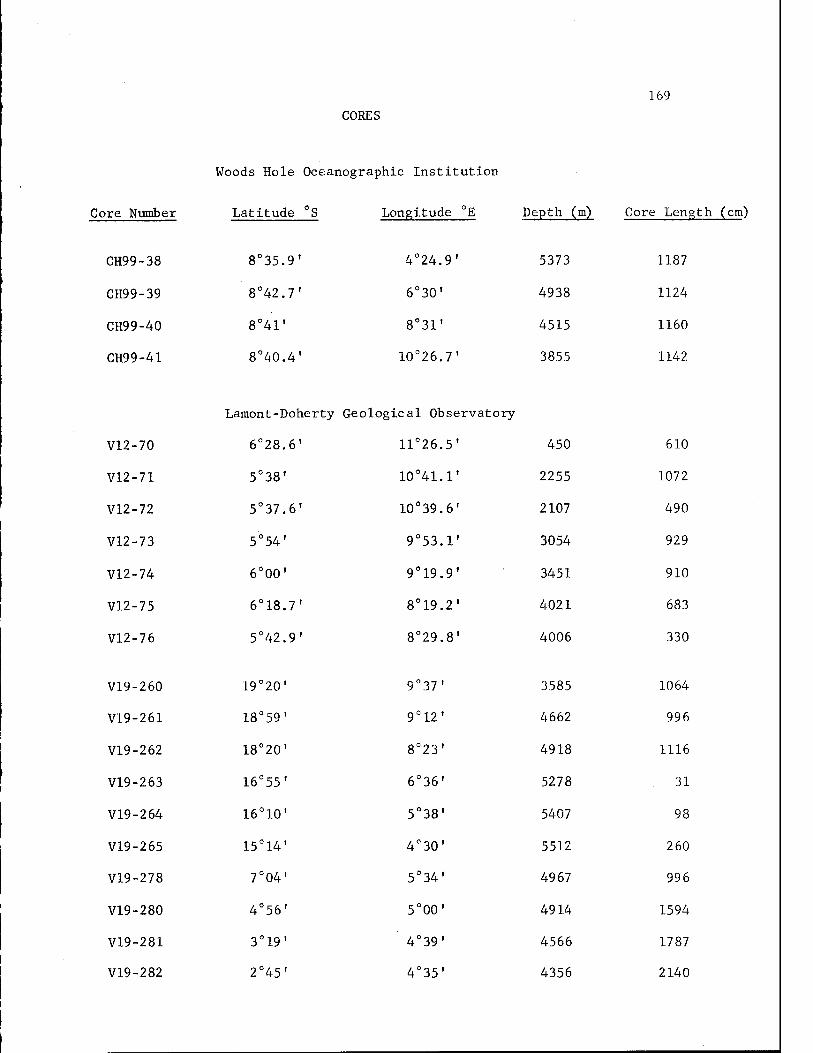
169
CORES
Woods Hole Oceanographic Institution
Core Number Latitude S Longitude °E Depth (m) Core Length (cm
CH99-38 8°35.9' 4°24.9* 5373 1187
CH99-39 8°42.7' 6°30* 4938 1124
CH99-40 8°41' 8°31' 4515 1160
CH99-41 8°40.4* 10°26.7' 3855 1142
Lamont-Doherty Geological Observatory
V12-70 6°28.6'
V12-71 5°38'
V12-72 5°37.6'
V12-73 5°54'
V12-74 6°00'
V12-75 6°18.7'
V12-76 5°42.9'
V19-260 19°20'
V19-261 18°59'
V19-262 18°20"
V19-263 16°55'
V19-264 16°10*
V19-265 15°14*
V19-278 7°04'
V19-280 4°56'
V19-281 3°19'
V19-282 2°45'
11°26.5' 450 610
10°41.1' 2255 1072
10°39.6' 2107 490
9°53.1' 3054 929
9°19.9' 3451 910
8°19.2' 4021 683
8°29.8' 4006 330
9°37' 3585 1064
9°12' 4662 996
8°23' 4918 1116
6°36' 5278 31
5°38' 5407 98
4°30' 5512 260
5°34' 4967 996
5°00' 4914 1594
4°39' 4566 1787
4°35' 4356 2140
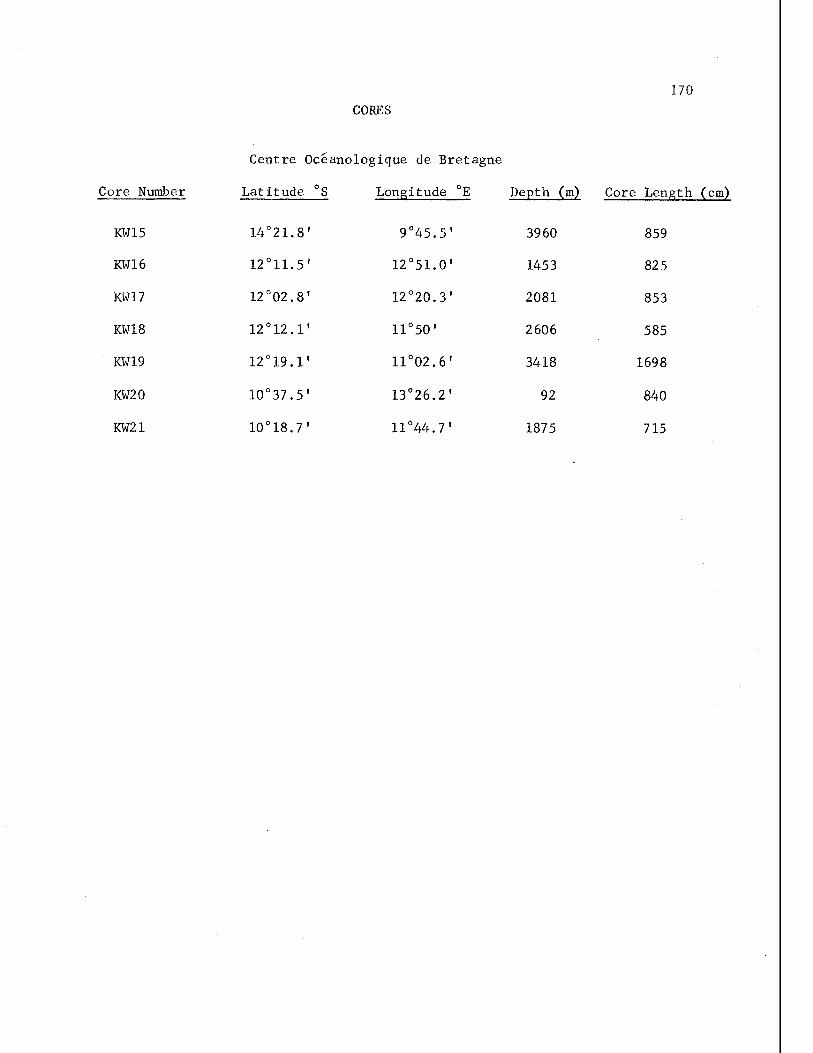
CORES
Centre Oceanologique de Bretagne
170
Core Number Latitude °S Longitude °E Depth (m) Core Length (cm)
KW15 14°21.8 9°45.5" 3960 859
KW16 12°11.5 12°51.0' 1453 825
KW17 12°02.8 12°20.3' 2081 853
KW18 12°12.1 llo50' 2606 585
KW19 12°19.1 llo02.6' 3418 1698
KW20 10°37.5 13°26.2' 92 840
KW21 10°18.7 11°44.7' 1875 715
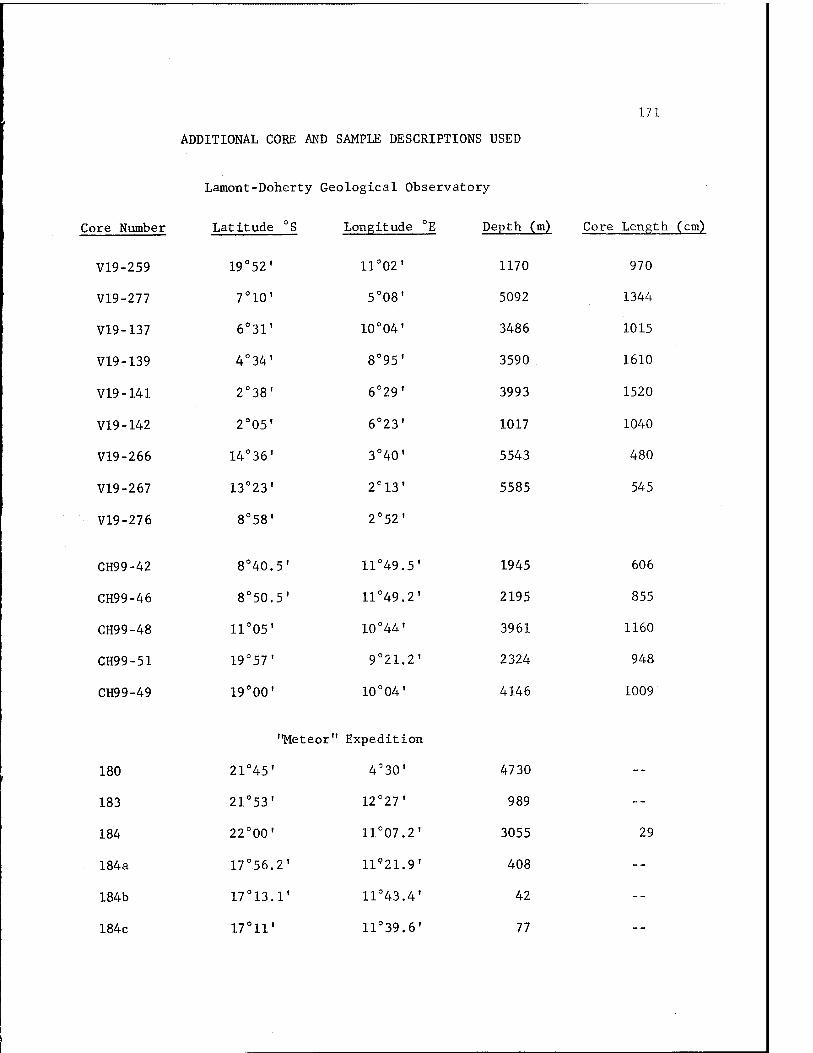
171
ADDITIONAL CORE AND SAMPLE DESCRIPTIONS USED
Lamont-Doherty Geological Observato T
Core Number Latitude °S Longitude °E Depth (m) Core Length (cm)
V19-259 19°52' 11°02' 1170 970
V19-277 7°10' 5°08* 5092 1344
V19-137 6°31' 10°04' 3486 1015
V19-139 4°34' 8°95' 3590 1610
V19-141 2°38' 6°29' 3993 1520
V19-142 2°05' 6°23* 1017 1040
V19-266 14°36' 3°40' 5543 480
V19-267 13°23' 2°13' 5585 545
V19-276 8°58* 2°52'
CH99-42 8°40.5' 11°49.5' 1945 606
CH99-46 8°50.5' 11°49.2» 2195 855
CH99-48 11°05' 10°44' 3961 1160
CH99-51 19°57' 9°21.2' 2324 948
CH99-49 19°00' 10°04* 4146 1009
"Meteor " Expedition
180 21°45' 4°30' 4730 --
183 21°53" 12°27' 989 _.
184 22°00' 11°07.2' 3055 29
184a 17°56.2' 11*21.9' 408 --
184b 17°13.1' 11°43.4' 42 --
184c 17°11' 11°39.6* 77
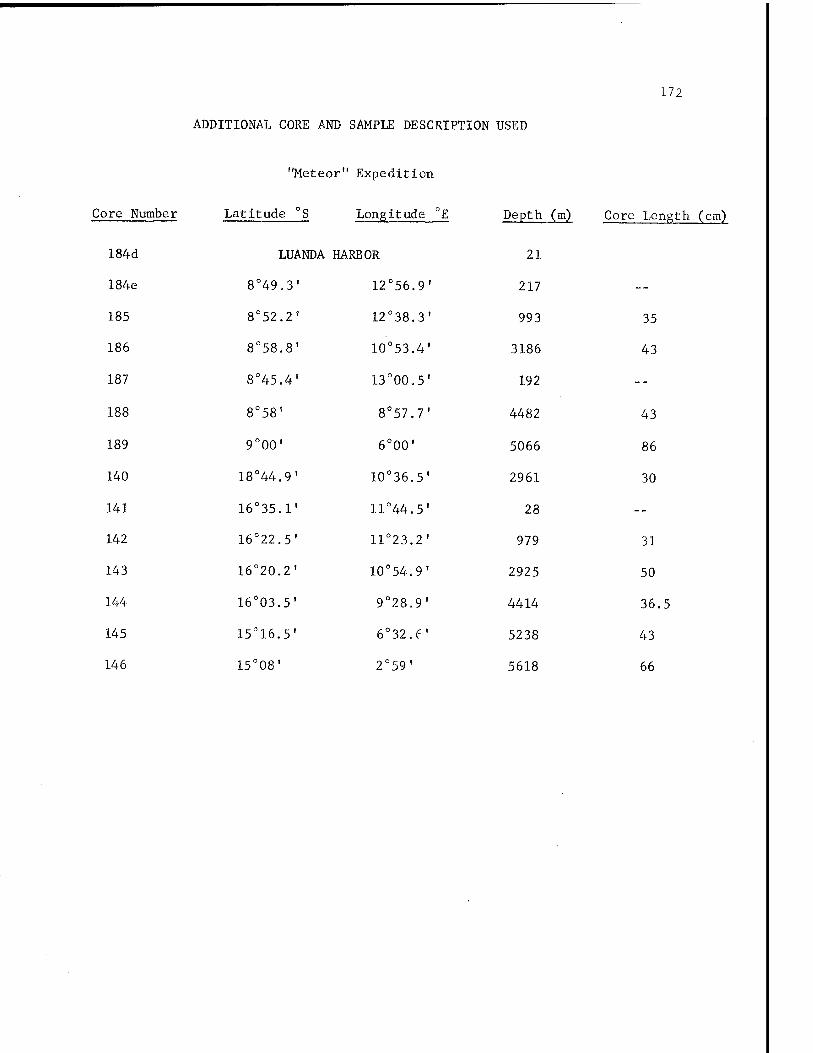
172
ADDITIONAL CORE AND SAMPLE DESCRIPTION USED
"Meteor" Expedition
Core Number Latitude S Longitude °E Depth (m)
184d LUANDA HARBOR 21
I84e 8°49.3' 12°56.9' 217
185 8°52.2' 12°38.3' 993
186 8°58.8' 10°53.4' 3186
187 8°45.4' 13°00.5* 192
188 8°58' 8°57.7' 4482
189 9°00' 6°00* 5066
140 18°44.9' 10°36.5* 2961
141 16°35.1f 11°44.5' 28
142 16°22.5* 11°23.2* 979
143 16°20.2" 10°54.9' 2925
144 16°03.5' 9°28.9' 4414
145 15°16.5' 6°32.f ' 5238
146 15°08' 2°59' 5618
35
43
43
86
30
31
50
36.5
43
66
173
APPENDIX II
Analytical Results
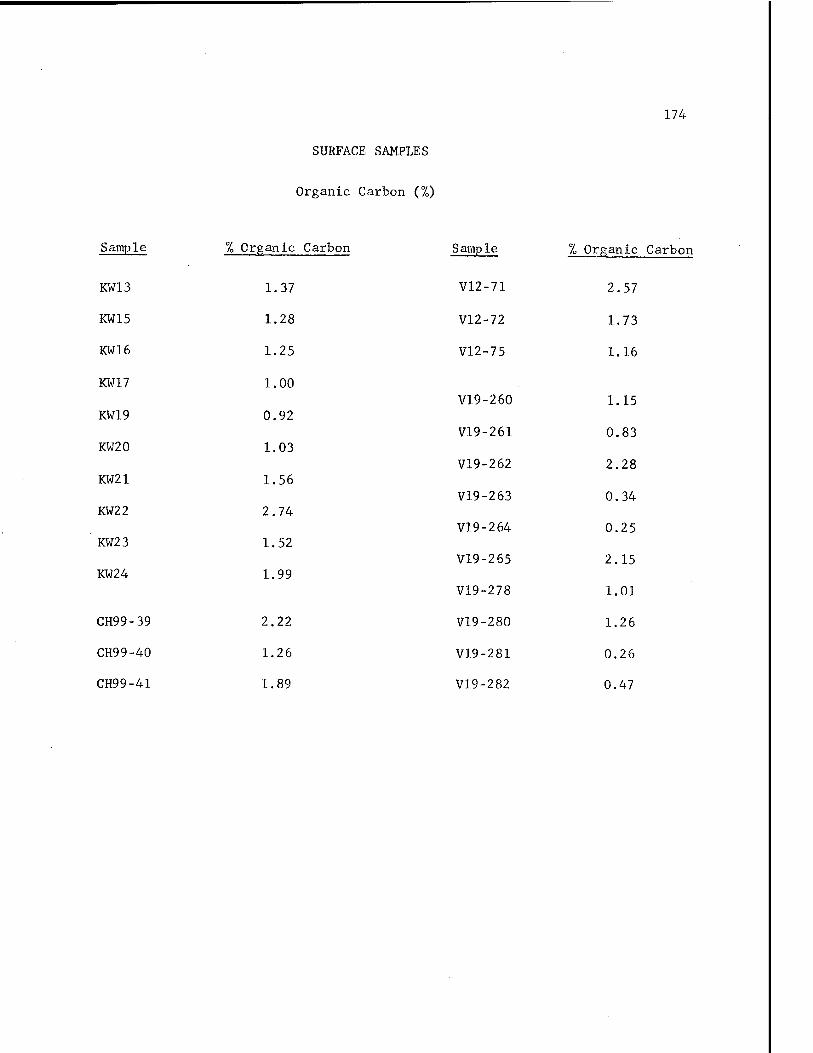
SURFACE SAMPLES
Organic Carbon (7„)
174
Sample
KW13
KW15
KW16
KW17
KW19
KW20
KW21
KW22
KW23
KW24
CH99-39
CH99-40
CH99-41
°/o Organic Carbon
1.37
1.28
1.25
1.00
0.92
1.03
1.56
2.74
1.52
1.99
2.22
1.26
1.89
Sample
V12 -71
V12 -72
V12 -75
V19 -260
V19 -261
V19- -262
V19- -263
V19- ■264
V19- -265
V19- -278
V19- 280
V19- 281
V19- 282
% Organic Carbon
2 .57
1 .73
1 .16
1 .15
0 .83
2 28
0 34
0 25
2. 15
1. 01
1. 26
0. 26
0. 47
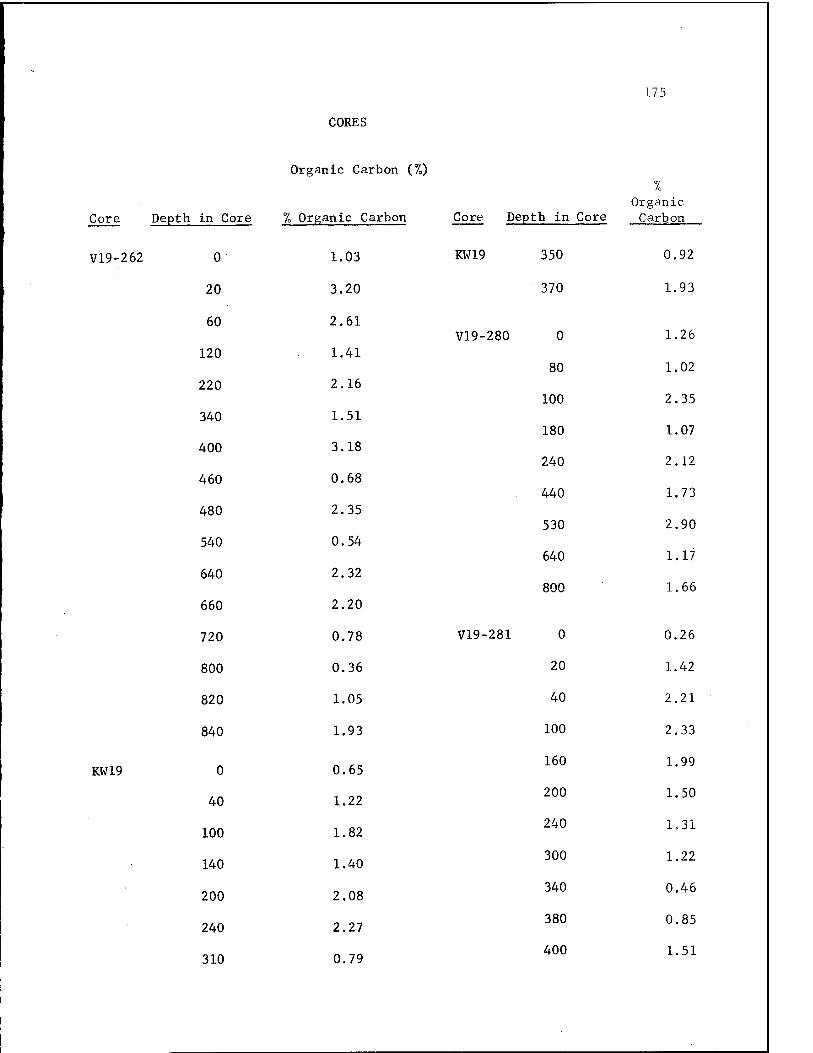
-
CORES
Organic Carbon (%)
175
7» Organic
Core Depth in Core 7„ Organic Carbon Core Depth in Core Carbon
V19-262 0• 1.03 KW19 350 0.92
20 3.20 370 1.93
60 2.61 V19- 280 0 1.26
120 1.41 80 1.02
220 2.16 100 2.35
340 1.51 180 1.07
400 3.18 240 2.12
460 0.68 440 1.73
480 2.35 530 2.90
540 0.54 640 1.17
640 2.32 800 1.66
660 2.20
720 0.78 V19- 281 0 0.26
800 0.36 20 1.42
820 1.05 40 2.21
840 1.93 100 2.33
KW19 0 0.65 160 1.99
40 1.22 200 1.50
100 1.82 240 1.31
140 1.40 300 1.22
200 2.08 340 0.46
240 2.27 380 0.85
310 0.79 400 1.51
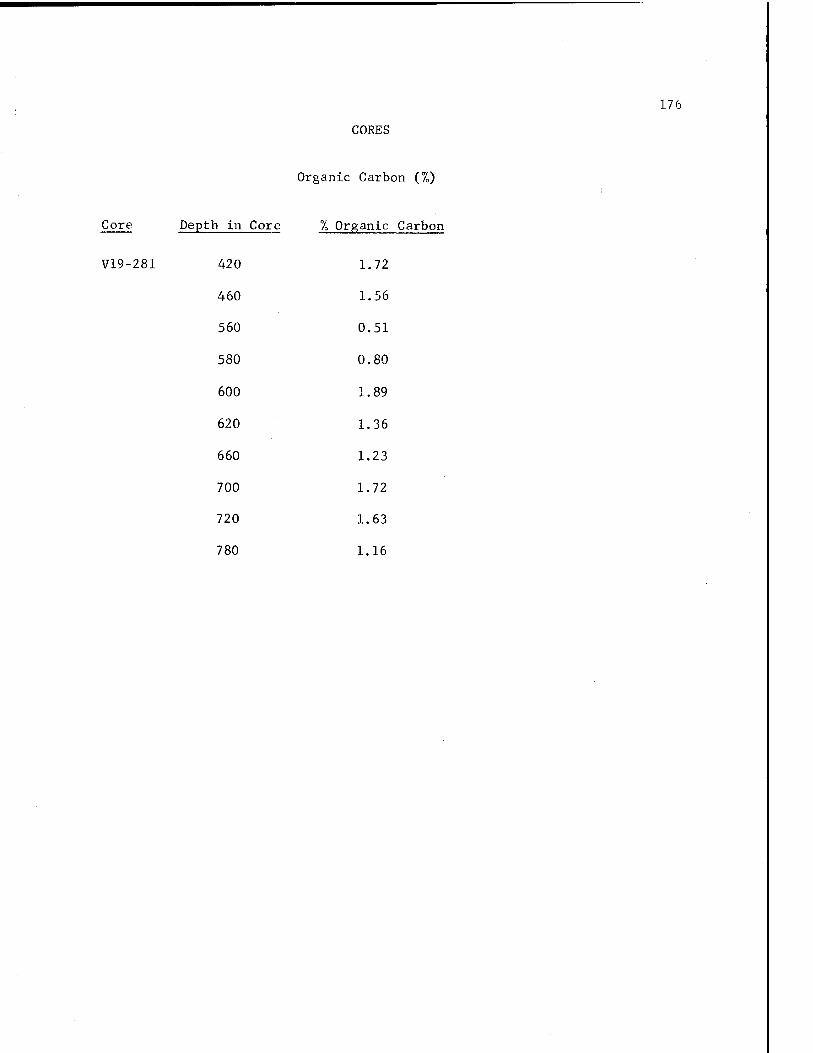
176
CORES
Organic Carbon (%)
Core Depth in Core % Organic Carbon
V19-281 420 1.72
460 1.56
560 0.51
580 0.80
600 1.89
620 1.36
660 1.23
700 1.72
720 1.63
780 1.16
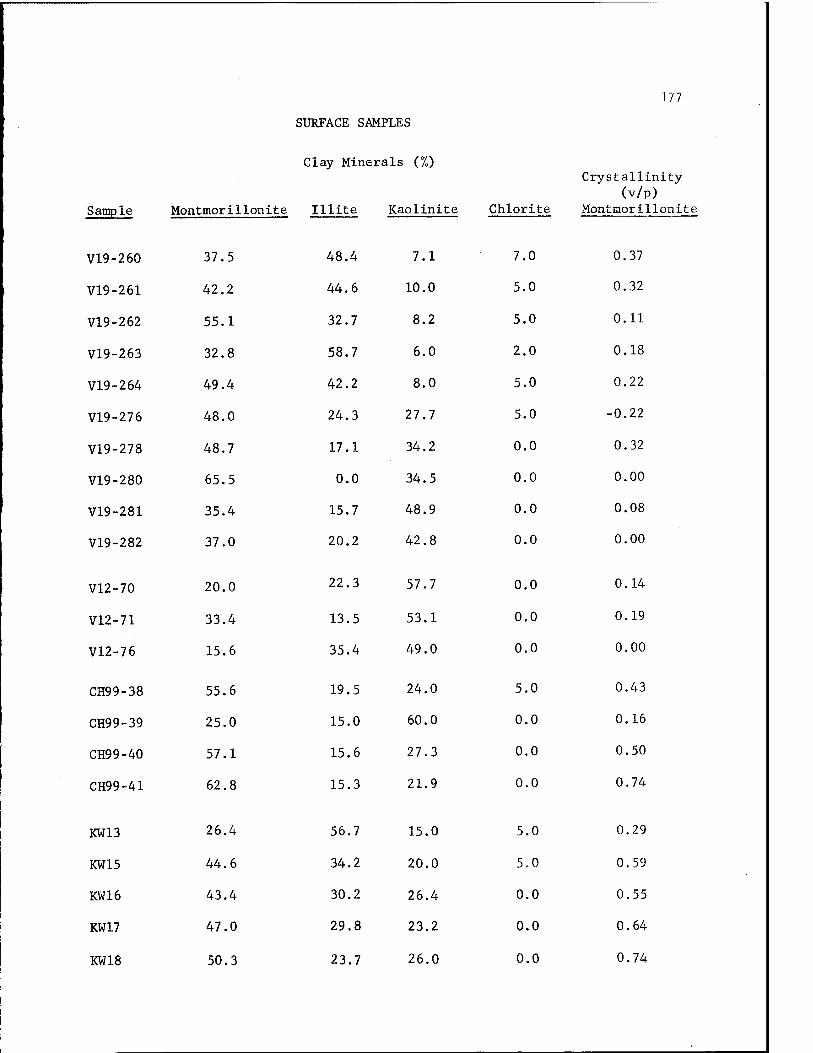
SURFACE SAMPLES
177
Clay Minerals (%) Crystallinity
(v/p) Sample Montmorillonite IIlite Kaolinite Chlorite Montmorillonite
V19-260
V19-261
V19-262
V19-263
V19-264
V19-276
V19-278
V19-280
V19-281
V19-282
V12-70
V12-71
V12-76
CH99-38
CH99-39
CH99-40
CH99-41
KW13
KW15
KW16
KW17
KW18
37. 5
42. 2
55. 1
32. 8
49. 4
48. 0
48. 7
65. 5
35 4
37 0
20 0
33 4
15 6
55 .6
25 .0
57 .1
62 .8
26 .4
44 .6
43 .4
47 .0
50 .3
48.4 7.1 7.0
44.6 10.0 5.0
32.7 8.2 5.0
58.7 6.0 2.0
42.2 8.0 5.0
24.3 27.7 5.0
17.1 34.2 0.0
0.0 34.5 0.0
15.7 48.9 0.0
20.2 42.8 0.0
22.3 57.7 0.0
13.5 53.1 0.0
35.4 49.0 0.0
19.5 24.0 5.0
15.0 60.0 0.0
15.6 27.3 0.0
15.3 21.9 0.0
56.7 15.0 5.0
34.2 20.0 5.0
30.2 26.4 0.0
29.8 23.2 0.0
23.7 26.0 0.0
0. 37
0. 32
0. 11
0. 18
0. 22
-0. 22
0. 32
0. 00
0. 08
0. 00
0 14
0 19
0 00
0 43
0 16
0 .50
0 .74
0 .29
0 .59
0 .55
0 .64
0 .74
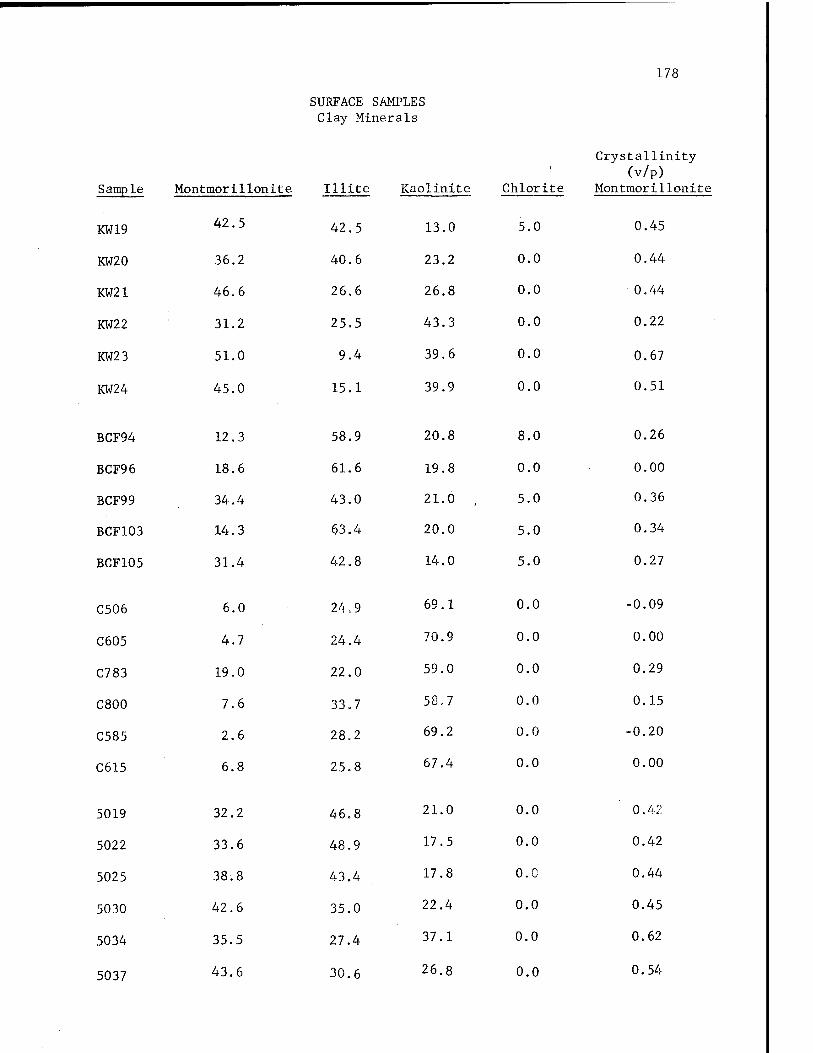
SURFACE SAMPLES Clay Minerals
178
Sample Montmori1Ionite Illite Kaolinite Chlorite
Crystallinity (v/p)
Montmorillonite
KW19 42.5 42.5 13.0 5.0 0.45
KW20 36.2 40.6 23.2 0.0 0.44
KW21 46.6 26.6 26.8 0.0 0.44
KW22 31.2 25.5 43.3 0.0 0.22
KW23 51.0 9.4 39.6 0.0 0.67
KW24 45.0 15.1 39.9 0.0 0.51
BCF94 12.3 58.9 20.8 8.0 0.26
BCF96 18.6 61.6 19.8 0.0 0.00
BCF99 34.4 43.0 21.0 , 5.0 0.36
BCF103 14.3 63.4 20.0 5.0 0.34
BCF105 31.4 42.8 14.0 5.0 0.27
C506 6.0 24.9 69.1 0.0 -0.09
C605 4.7 24.4 70.9 0.0 0.00
C783 19.0 22.0 59.0 0.0 0.29
C800 7.6 33.7 58.7 0.0 0.15
C585 2.6 28.2 69.2 0.0 -0.20
C615 6.8 25.8 67.4 0.0 0.00
5019 32.2 46.8 21.0 0.0 0.42
5022 33.6 48.9 17.5 0.0 0.42
5025 38.8 43.4 17.8 o.c 0.44
5030 42.6 35.0 22.4 0.0 0.45
5034 35.5 27.4 37.1 0.0 0.62
5037 43.6 30.6 26.8 0.0 0.54
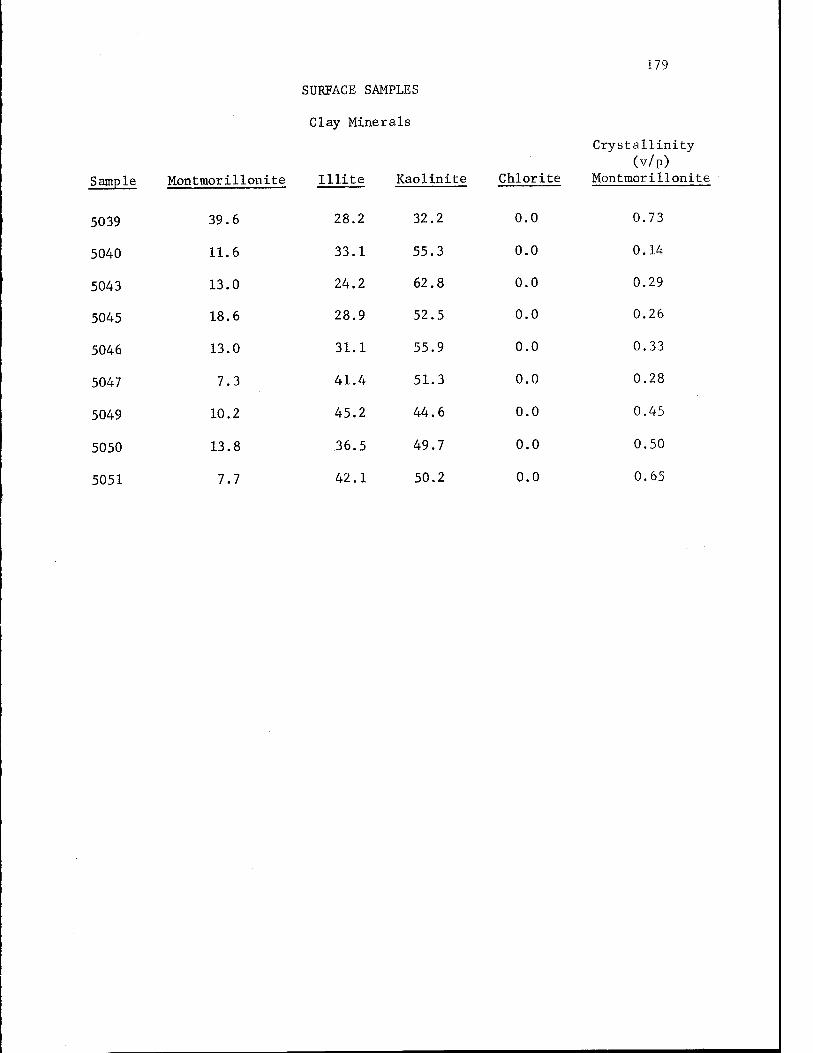
179
SURFACE SAMPLES
Clay Minerals
Sample Montmorillonite Illite Kaolinite Chlorite
Crystallinity (v/p)
Montmorillonite
5039 39.6 28.2 32.2 0.0 0.73
5040 11.6 33.1 55.3 0.0 0.14
5043 13.0 24.2 62.8 0.0 0.29
5045 18.6 28.9 52.5 0.0 0.26
5046 13.0 31.1 55.9 0.0 0.33
5047 7.3 41.4 51.3 0.0 0.28
5049 10.2 45.2 44.6 0.0 0.45
5050 13.8 36.5 49.7 0.0 0.50
5051 7.7 42.1 50.2 0.0 0.65
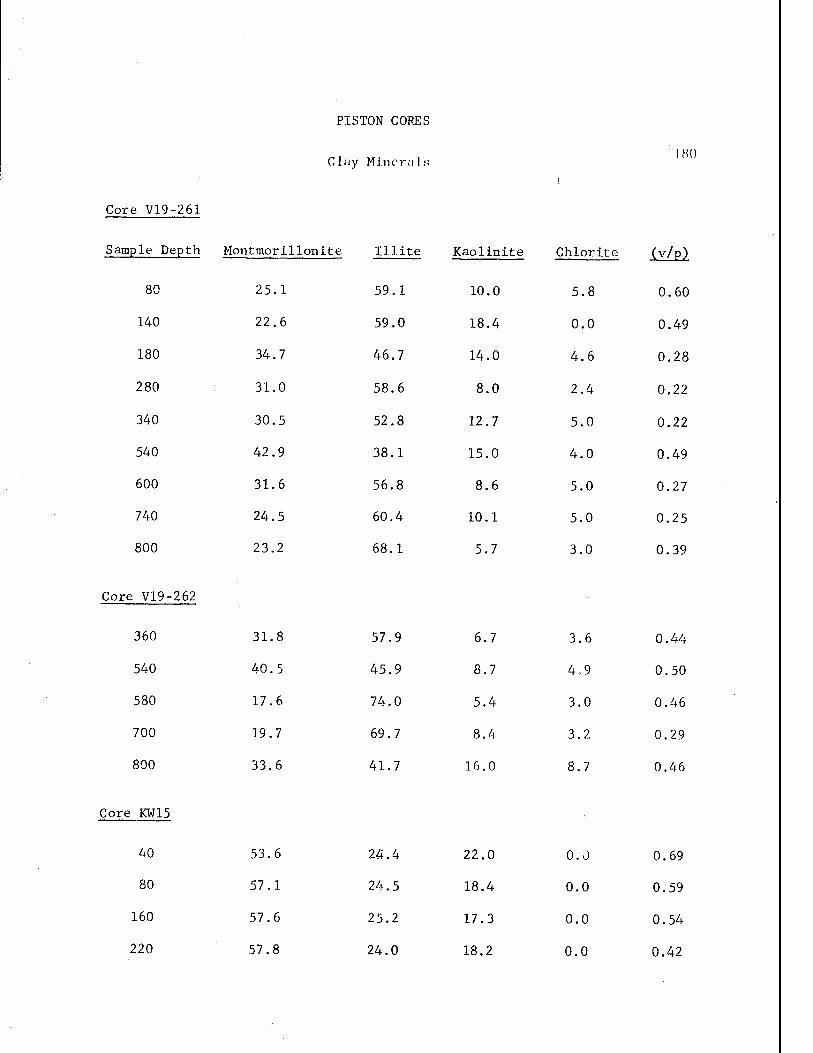
PISTON CORES
CL'iy MinernIs 180
Core V19-261
Sample Depth Montmorillonite Illite Kaolinite Chlorite (v/p)
80 25.1 59.1 10.0 5.8 0.60
140 22.6 59.0 18.4 0.0 0.49
180 34.7 46.7 14.0 4.6 0.28
280 31.0 58.6 8.0 2.4 0.22
340 30.5 52.8 12.7 5.0 0.22
540 42.9 38.1 15.0 4.0 0.49
600 31.6 56.8 8.6 5.0 0.27
740 24.5 60.4 10.1 5.0 0.25
800 23.2 68.1 5.7 3.0 0.39
Core V19-262
360 31.8 57.9 6.7 3.6 0.44
540 40.5 45.9 8.7 4.9 0.50
580 17.6 74.0 5.4 3.0 0.46
700 19.7 69.7 8.4 3.2 0.29
800 33.6 41.7 16.0 8.7 0.46
Core KW15
40 53.6 24.4 22.0 0.0 0.69
80 57.1 24.5 18.4 0.0 0.59
160 57.6 25.2 17.3 0.0 0.54
220 57.8 24.0 18.2 0.0 0.42
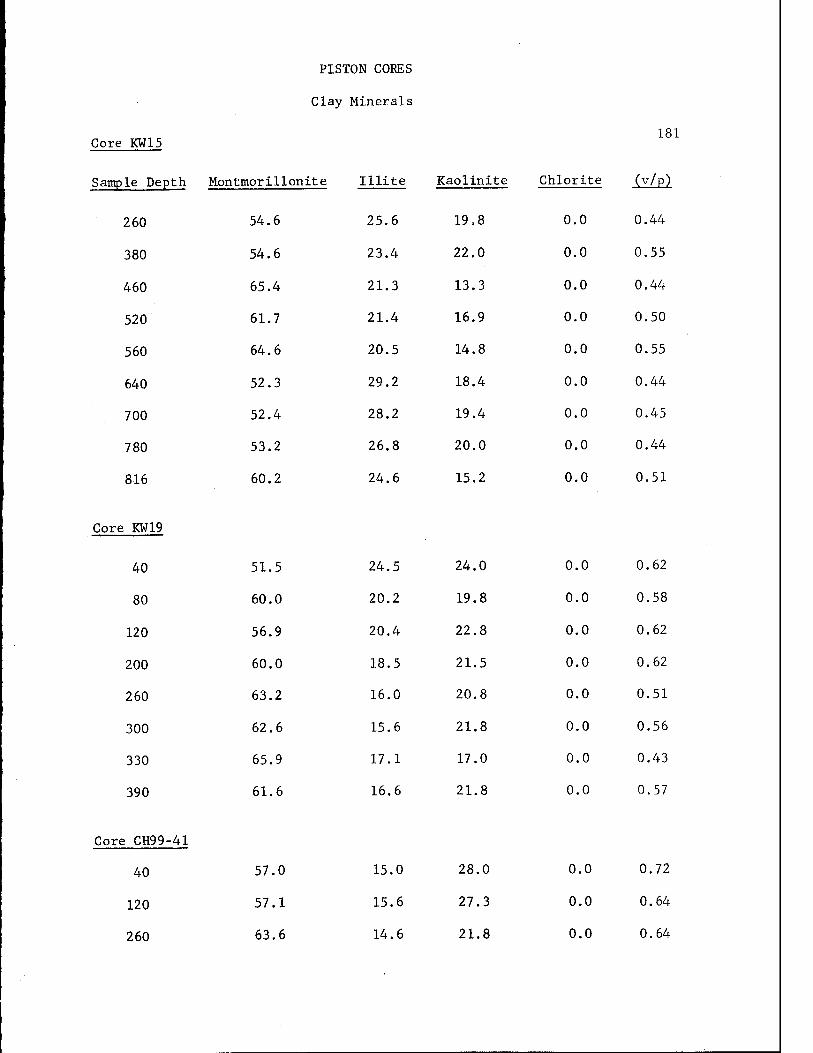
PISTON CORES
Clay Minerals
Core KW15
40
120
260
57.0
57.1
63.6
15.0
15.6
14.6
28.0
27.3
21.8
0.0
0.0
0.0
181
Sample Depth Montmorillonite Illite Kaolinite Chlorite (v/p)
260 54.6 25.6 19.8 0.0 0.44
380 54.6 23.4 22.0 0.0 0.55
460 65.4 21.3 13.3 0.0 0.44
520 61.7 21.4 16.9 0.0 0.50
560 64.6 20.5 14.8 0.0 0.55
640 52.3 29.2 18.4 0.0 0.44
700 52.4 28.2 19.4 0.0 0.45
780 53.2 26.8 20.0 0.0 0.44
816 60.2 24.6 15.2 0.0 0.51
Core KW19
40 51.5 24.5 24.0 0.0 0.62
80 60.0 20.2 19.8 0.0 0.58
120 56.9 20.4 22.8 0.0 0.62
200 60.0 18.5 21.5 0.0 0.62
260 63.2 16.0 20.8 0.0 0.51
300 62.6 15.6 21.8 0.0 0.56
330 65.9 17.1 17.0 0.0 0.43
390 61.6 16.6 21.8 0.0 0.57
Core CH99-41
0.72
0.64
0.64
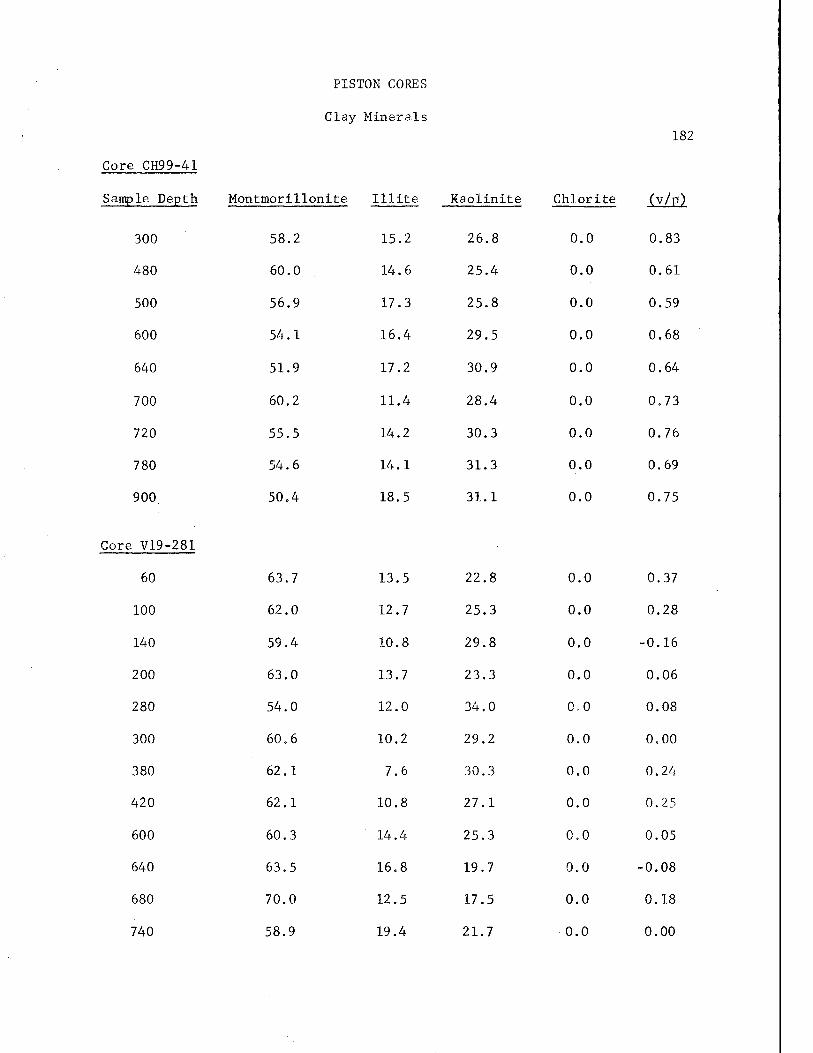
PISTON CORES
Clay Minerals
182
Core CH99-41
Sample Depth Montmorillonite Illite Kaolinite Chlorite (v/p)
300 58.2 15.2 26.8 0.0 0.83
480 60.0 14.6 25.4 0.0 0.61
500 56.9 17.3 25.8 0.0 0.59
600 54.1 16.4 29.5 0.0 0.68
640 51.9 17.2 30.9 0.0 0.64
700 60.2 11.4 28.4 0.0 0.73
720 55.5 14.2 30.3 0.0 0.76
780 54.6 14.1 31.3 0.0 0.69
900 50.4 18.5 31.1 0.0 0.75
Core V19 -281
60
100
140
200
280
300
380
420
600
640
680
740
63.7
62.0
59.4
63.0
54.0
60.6
62.1
62.1
60.3
63.5
70.0
58.9
13.5
12.7
10.8
13.7
12.0
10.2
7.6
10.8
14.4
16.8
12.5
19.4
22.8
25.3
29.8
23.3
34.0
29.2
30.3
27.1
25.3
19.7
17.5
21.7
0.0 0.37
0.0 0.28
0.0 -0.16
0.0 0.06
0.0 0.08
0.0 0.00
0.0 0.24
0.0 0.25
0.0 0.05
0.0 -0.08
0.0 0.18
0.0 0.00
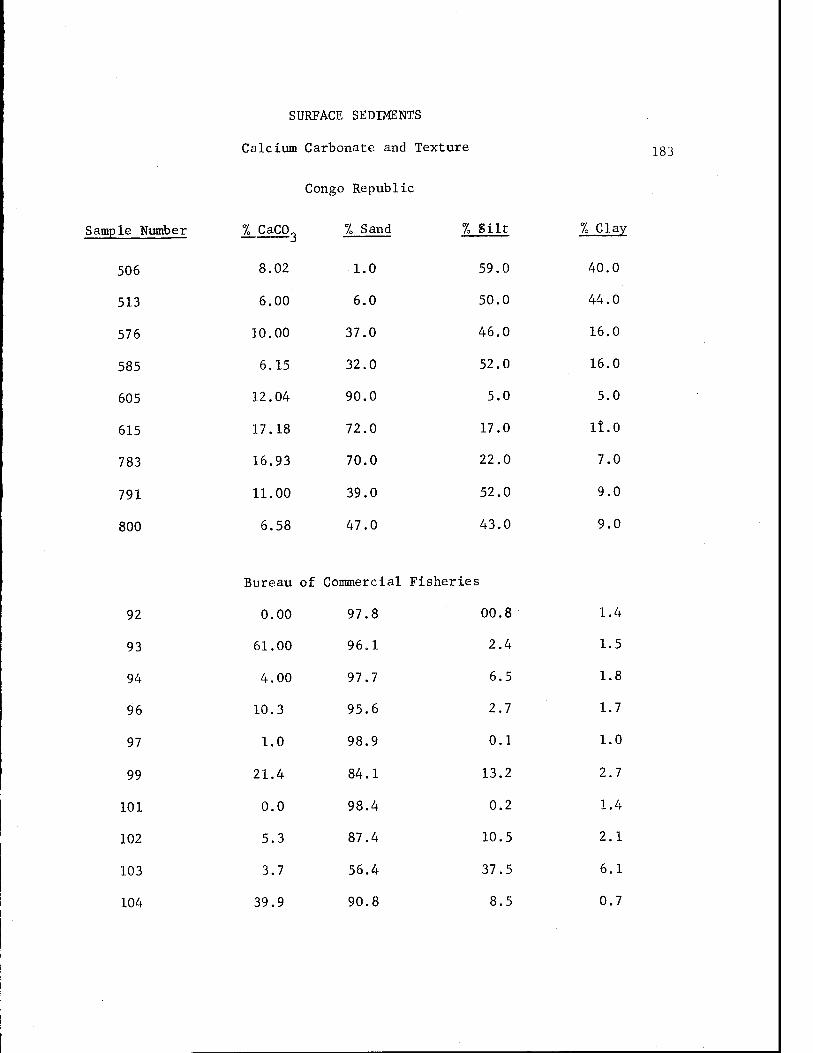
92
93
94
96
97
99
101
102
103
104
SURFACE SEDIMENTS
Calcium Carbonate and Texture -^
Congo Republic
Sample Number % CaC0„ % Sand % Silt % Clay
506 8.02 1.0 59.0 40.0
513 6.00 6.0 50.0 44.0
576 10.00 37.0 46.0 16.0
585 6.15 32.0 52.0 16.0
605 12.04 90.0 5.0 5.0
615 17.18 72.0 17.0 11.0
783 16.93 70.0 22.0 7.0
791 11.00 39.0 52.0 9.0
800 6.58 47.0 43.0 9.0
Bureau of Commercial Fisheries
0.00 97.8
61.00 96.1
4.00 97.7
10.3 95.6
1.0 98.9
21.4 84.1
0.0 98.4
5.3 87.4
3.7 56.4
39.9 90.8
00.8 1.4
2.4 1.5
6.5 1.8
2.7 1.7
0.1 1.0
13.2 2.7
0.2 1.4
10.5 2.1
37.5 6.1
8.5 0.7
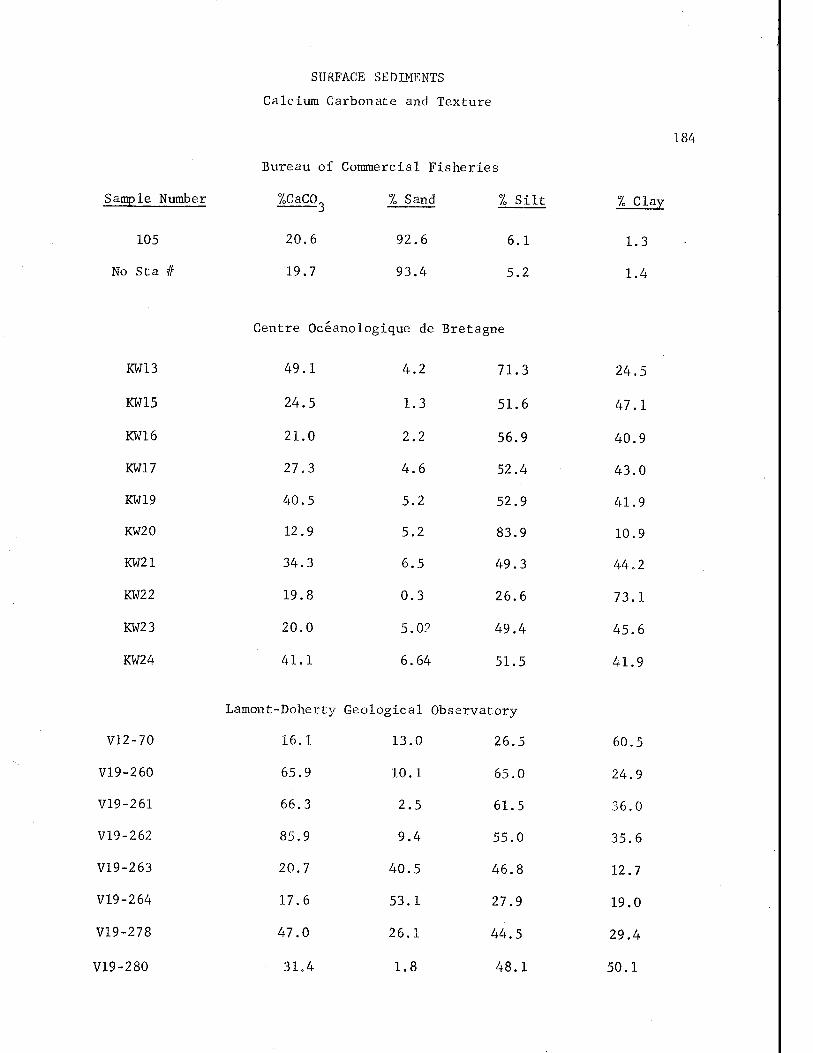
Sample Number
105
No Sta #
SURFACE SEDIMENTS
Calcium Carbonate and Texture
Bureau of Commercial Fisheries
%CaC0-
20.6
19.7
1 Sand
92.6
93.4
1 Silt
6.1
5.2
184
% Clay
1.3
1.4
Centre Oceanologique de Bretagne
KW13
KW15
KW16
KW17
KW19
KW20
KW21
KW22
KW23
KW24
49.1 4.2 71.3 24.5
24.5 1.3 51.6 47.1
21.0 2.2 56.9 40.9
27.3 4.6 52.4 43.0
40.5 5.2 52.9 41.9
12.9 5.2 83.9 10.9
34.3 6.5 49.3 44.2
19.8 0.3 26.6 73.1
20.0 5.0? 49.4 45.6
41.1 6.64 51.5 41.9
Lamont-Doherty Geological Observatory
V12-70
V19-260
V19-261
V19-262
V19-263
V19-264
V19-278
V19-280
16.1 13.0 26.5 60.5
65.9 10.1 65.0 24.9
66.3 2.5 61.5 36.0
85.9 9.4 55.0 35.6
20.7 40.5 46.8 12.7
17.6 53.1 27.9 19.0
47.0 26.1 44.5 29.4
31.4 1.8 48.1 50.1
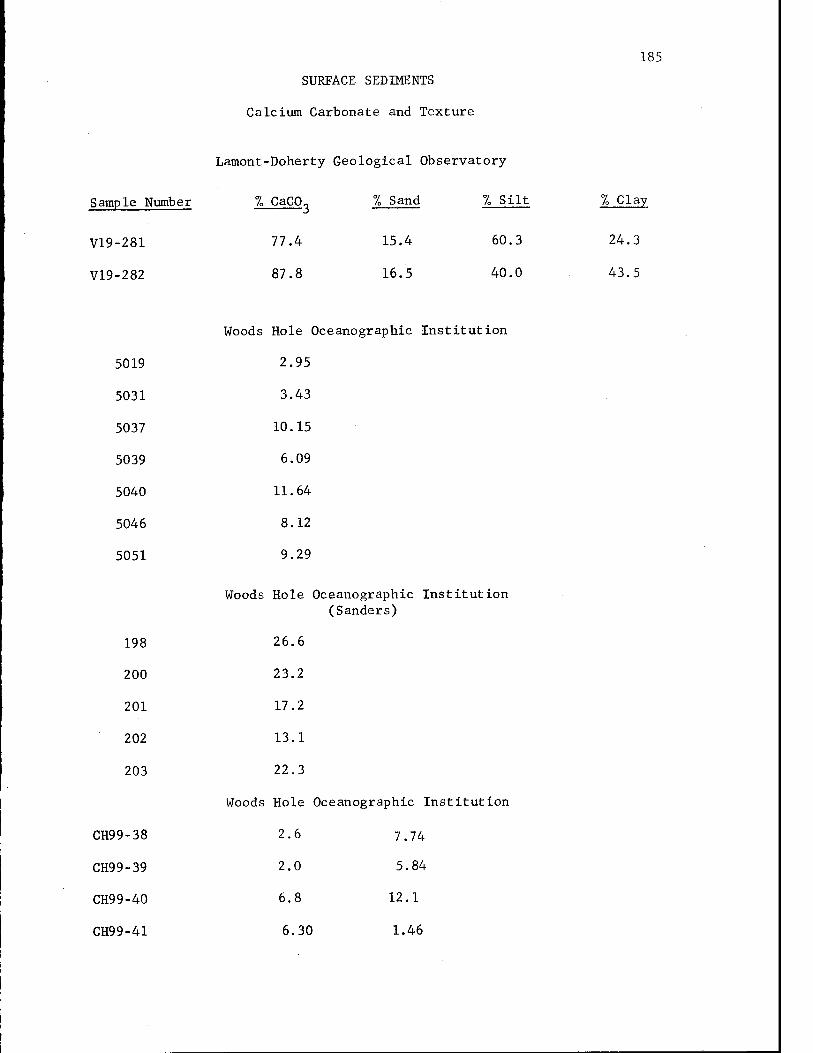
185
SURFACE SEDIMENTS
Calcium Carbonate and Texture
Lamont-Doherty Geological Observatory
Sample Number % CaCO^ % Sand 7» Silt % Clay
V19-281 77.4 15.4 60.3 24.3
V19-282 87.8 16.5 40.0 43.5
Woods Hole Oceanographic Institution
5019 2.95
5031 3.43
5037 10.15
5039 6.09
5040 11.64
5046 8.12
5051 9.29
Woods Hole Oceanographic Institution (Sanders)
198 26.6
200 23.2
201 17.2
202 13.1
203 22.3
Woods Hole Oceanographic Institution
CH99-38 2.6 7.74
CH99-39 2.0 5.84
CH99-40 6.8 12.1
CH99-41 6.30 1.46
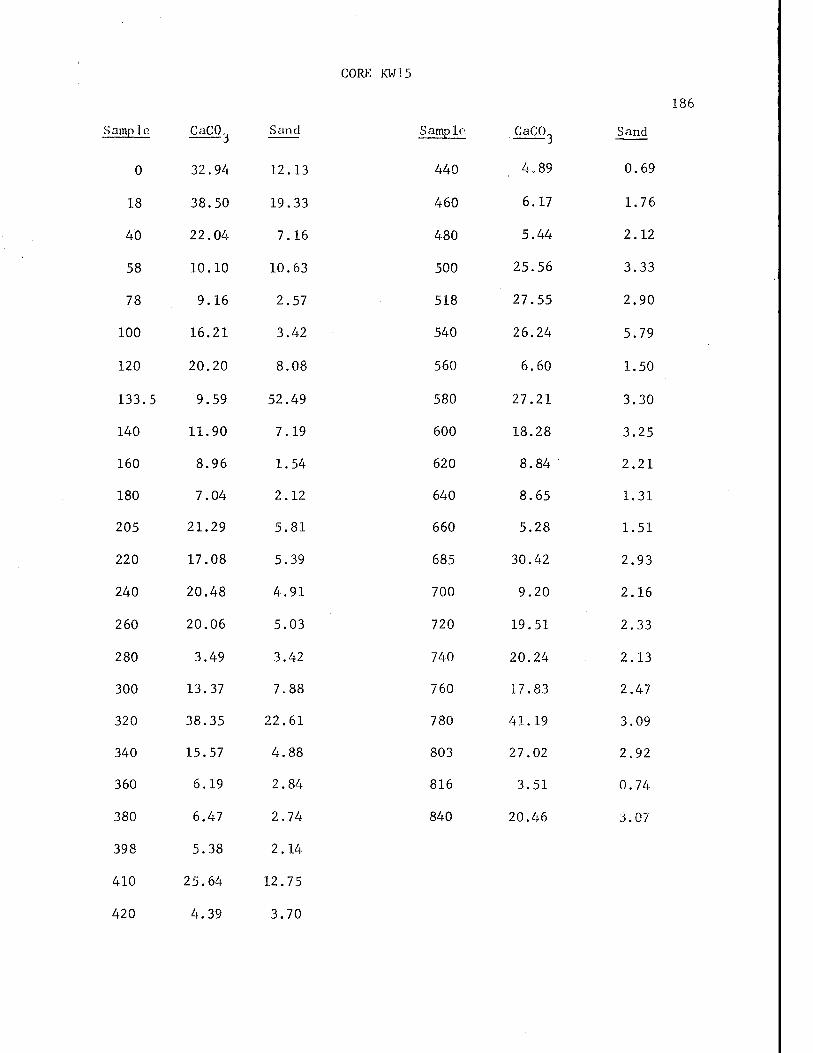
Sample CaC03 Sand
0 32.94 12.13
18 38.50 19.33
40 22.04 7.16
58 10.10 10.63
78 9.16 2.57
100 16.21 3.42
120 20.20 8.08
133.5 9.59 52.49
140 11.90 7.19
160 8.96 1.54
180 7.04 2.12
205 21.29 5.81
220 17.08 5.39
240 20.48 4.91
260 20.06 5.03
280 3.49 3.42
300 13.37 7.88
320 38.35 22.61
340 15.57 4.88
360 6.19 2.84
380 6.47 2.74
398 5.38 2.14
410 25.64 12.75
420 4.39 3.70
CORE KW 15
1
Sample CaCO Sand
440 4,89 0.69
460 6.17 1.76
480 5.44 2.12
500 25.56 3.33
518 27.55 2.90
540 26.24 5.79
560 6.60 1.50
580 27.21 3.30
600 18.28 3.25
620 8.84 2.21
640 8.65 1.31
660 5.28 1.51
685 30.42 2.93
700 9.20 2.16
720 19.51 2.33
740 20.24 2.13
760 17.83 2.47
780 41.19 3.09
803 27.02 2.92
816 3.51 0.74
840 20.46 3.07
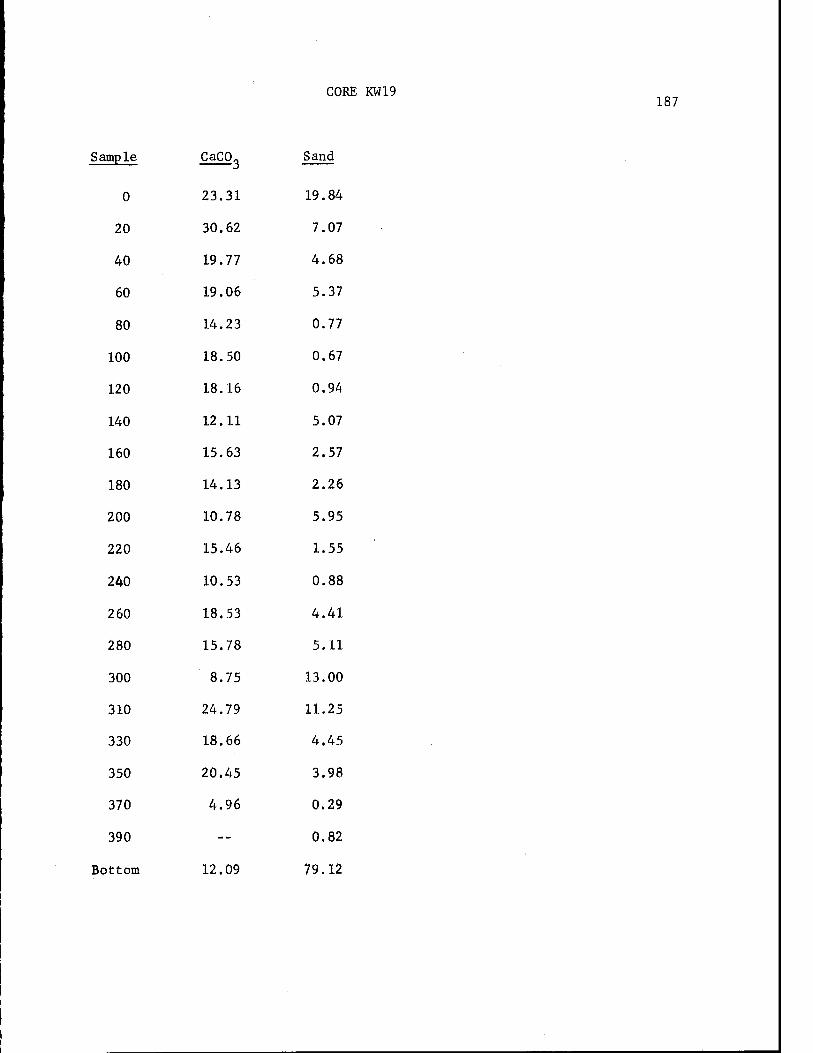
CORE KW19 187
Sample CaCO-
23.31
Sand
0 19.84
20 30.62 7.07
40 19.77 4.68
60 19.06 5.37
80 14.23 0.77
100 18.50 0.67
120 18.16 0.94
140 12.11 5.07
160 15.63 2.57
180 14.13 2.26
200 10.78 5.95
220 15.46 1.55
240 10.53 0.88
260 18.53 4.41
280 15.78 5.11
300 8.75 13.00
310 24.79 11.25
330 18.66 4.45
350 20.45 3.98
370 4.96 0.29
390 __ 0.82
Bottom 12.09 79.12
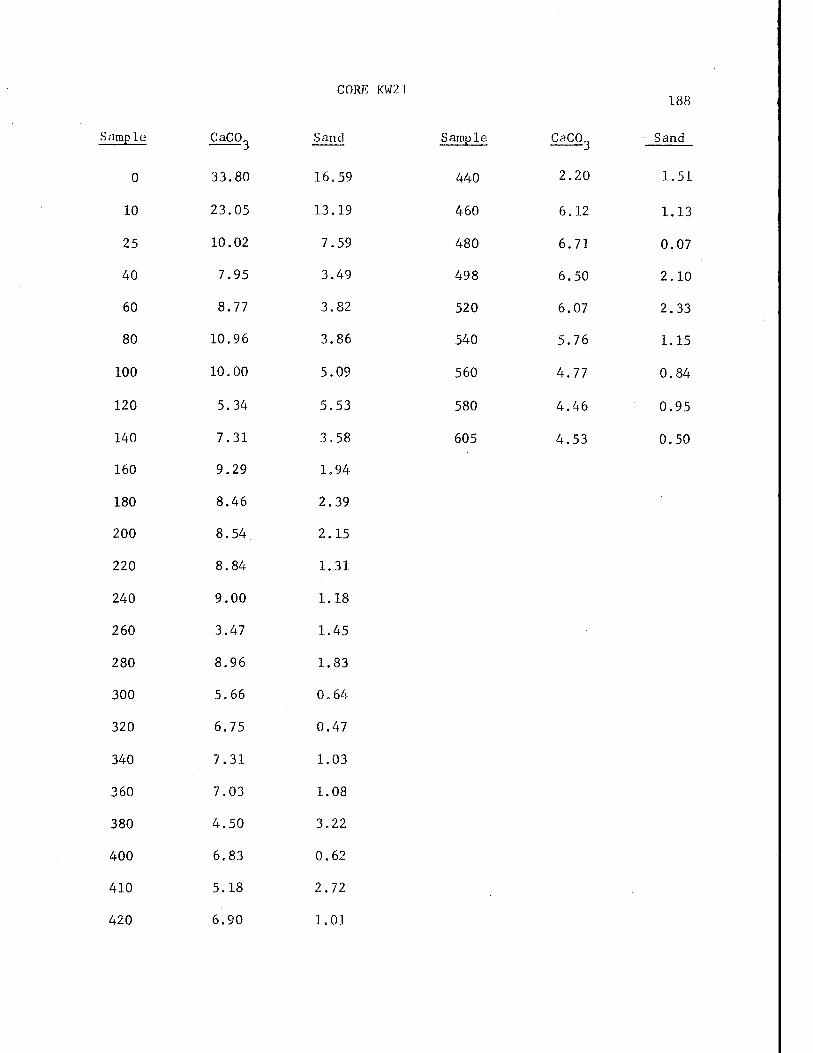
CORE KW2I 188
Sample CaCO Sand Sample CaCO„ Sand
0 33.80 16.59 440 2.20 1.51
10 23.05 13.19 460 6,12 1.13
25 10.02 7.59 480 6.71 0.07
40 7.95 3.49 498 6.50 2.10
60 8.77 3.82 520 6.07 2.33
80 10.96 3.86 540 5.76 1.15
100 10.00 5.09 560 4.77 0.84
120 5.34 5.53 580 4.46 0.95
140 7.31 3.58 605 4.53 0.50
160 9.29 1.94
180 8.46 2.39
200 8.54 2.15
220 8.84 1.31
240 9.00 1.18
260 3.47 1.45
280 8.96 1.83
300 5.66 0.64
320 6.75 0.47
340 7.31 1.03
360 7.03 1.08
380 4.50 3.22
400 6.83 0.62
410 5.18 2.72
420 6.90 1.01
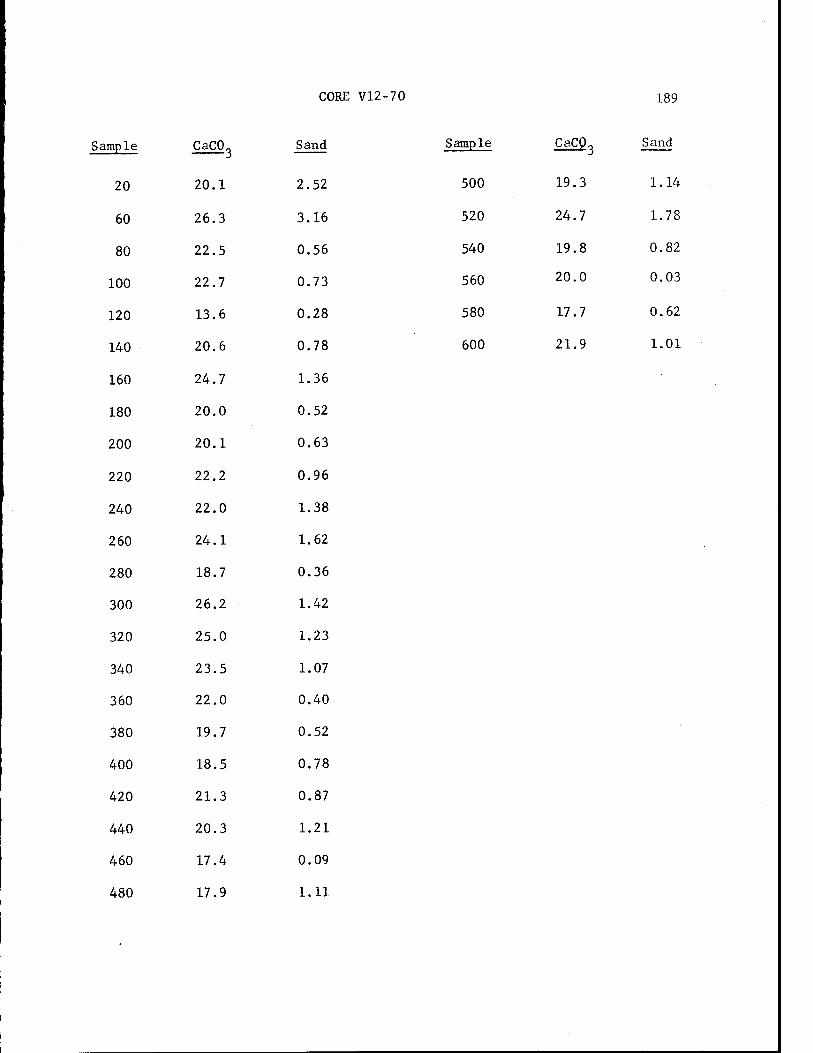
CORE V12-70 189
Sample CaCO« Sand Sample CaCp„ Sand
20 20.1 2.52 500 19.3 1.14
60 26.3 3.16 520 24.7 1.78
80 22.5 0.56 540 19.8 0.82
100 22.7 0.73 560 20.0 0.03
120 13.6 0.28 580 17.7 0.62
140 20.6 0.78 600 21.9 1.01
160 24.7 1.36
180 20.0 0.52
200 20.1 0.63
220 22.2 0.96
240 22.0 1.38
260 24.1 1.62
280 18.7 0.36
300 26.2 1.42
320 25.0 1.23
340 23.5 1.07
360 22.0 0.40
380 19.7 0.52
400 18.5 0.78
420 21.3 0.87
440 20.3 1.21
460 17.4 0.09
480 17.9 1.11
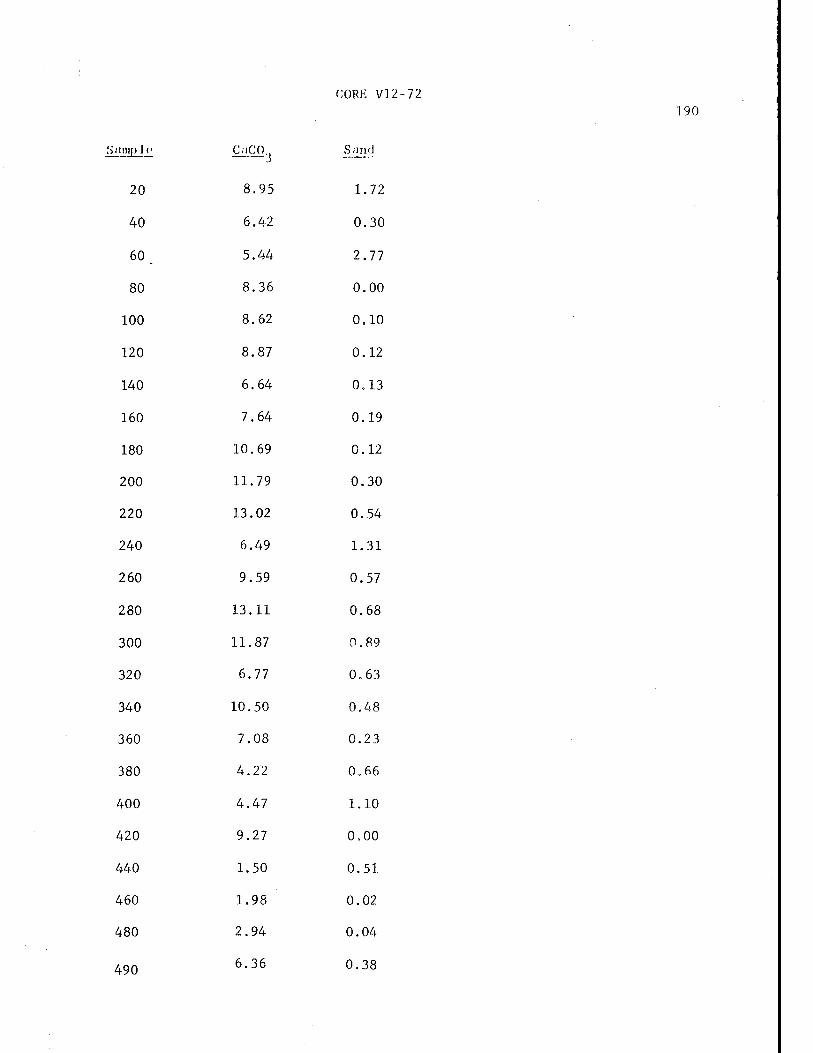
CORE V12-72
Samp J c CaCO Sand
20 8.95 1.72
40 6.42 0.30
60 5.44 2.77
80 8.36 0.00
100 8.62 0.10
120 8.87 0.12
140 6.64 0.13
160 7.64 0.19
180 10.69 0.12
200 11.79 0.30
220 13.02 0.54
240 6.49 1.31
260 9.59 0.57
280 13.11 0.68
300 11.87 0.89
320 6.77 0.63
340 10.50 0.48
360 7.08 0.23
380 4.22 0.66
400 4.47 1.10
420 9.27 0.00
440 1.50 0.51
460 1.98 0.02
480 2.94 0.04
490 6.36 0.38
190
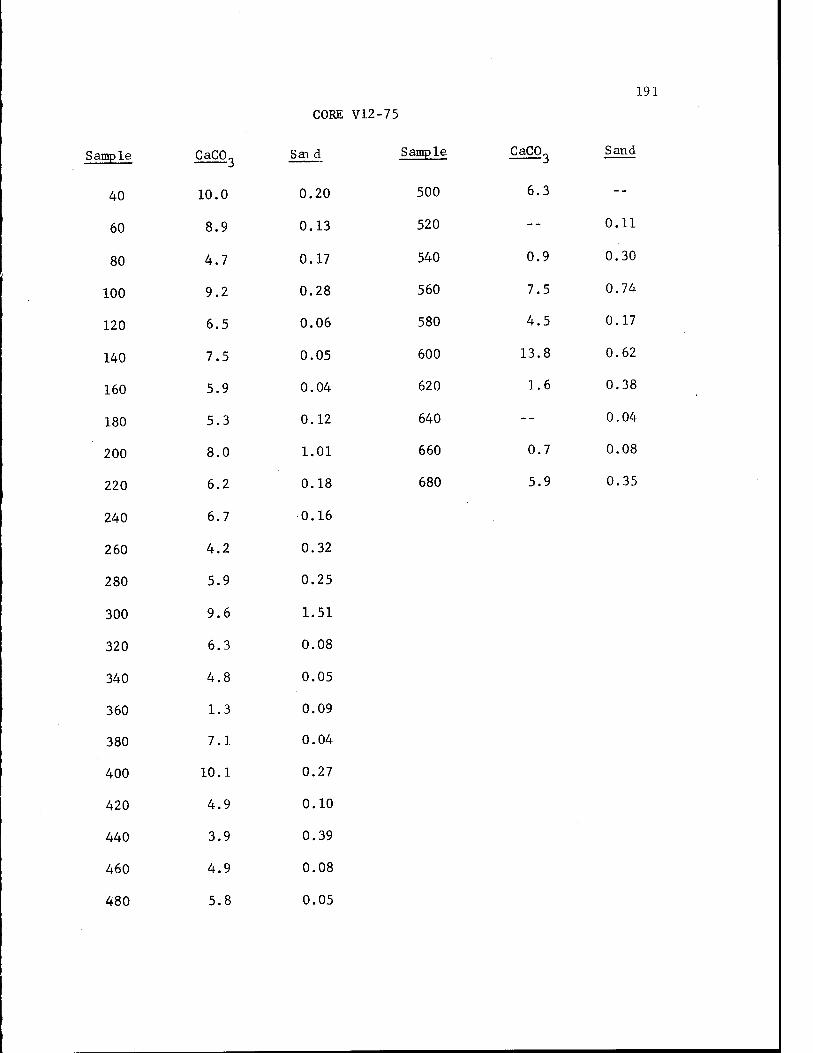
191
CORE V12-75
Sample CaC03 Sai d Sample CaC03 Sand
40 10.0 0.20 500 6.3 --
60 8.9 0.13 520 -- 0.11
80 4.7 0.17 540 0.9 0.30
100 9.2 0.28 560 7.5 0.74
120 6.5 0.06 580 4.5 0.17
140 7.5 0.05 600 13.8 0.62
160 5.9 0.04 620 1.6 0.38
180 5.3 0.12 640 -- 0.04
200 8.0 1.01 660 0.7 0.08
220 6.2 0.18 680 5.9 0.35
240 6.7 0.16
260 4.2 0.32
280 5.9 0.25
300 9.6 1.51
320 6.3 0.08
340 4.8 0.05
360 1.3 0.09
380 7.1 0.04
400 10.1 0.27
420 4.9 0.10
440 3.9 0.39
460 4.9 0.08
480 5.8 0.05
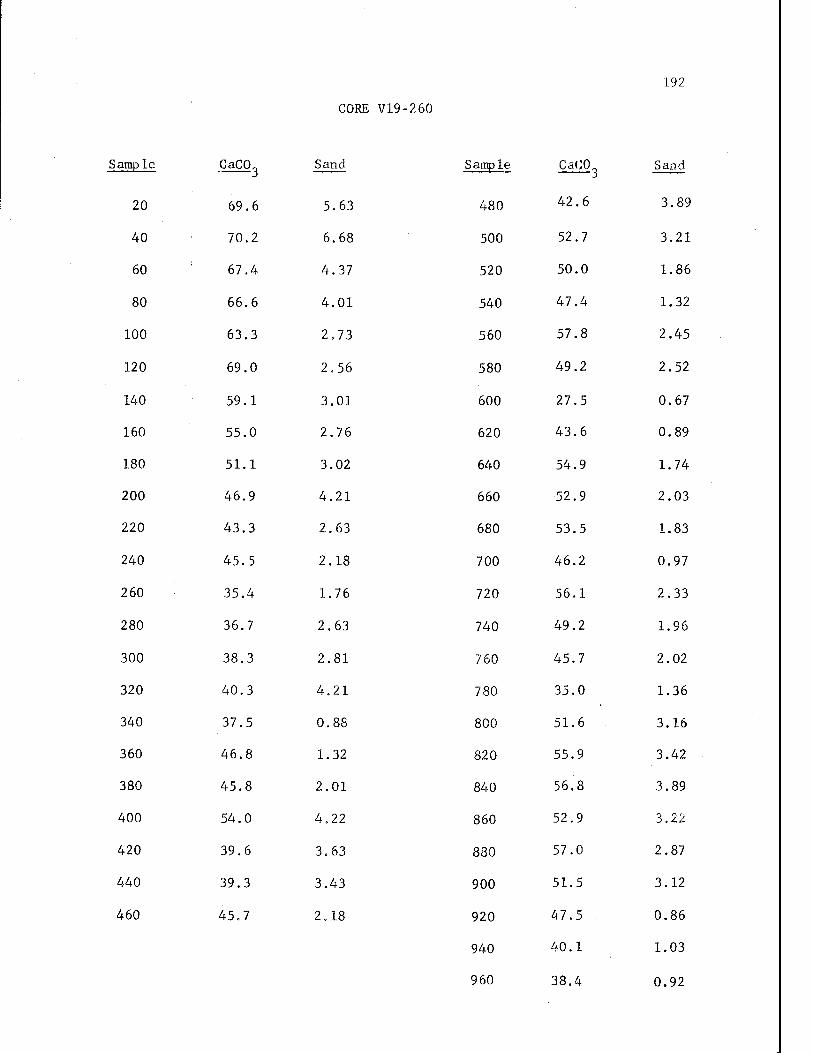
CORE V19-260
Sample CaCO„ Sand
20 69.6 5.63
40 70.2 6.68
60 67.4 4.37
80 66.6 4.01
100 63.3 2.73
120 69.0 2.56
140 59.1 3.01
160 55.0 2.76
180 51.1 3.02
200 46.9 4.21
220 43.3 2.63
240 45.5 2.18
260 35.4 1.76
280 36.7 2.63
300 38.3 2.81
320 40.3 4.21
340 37.5 0.88
360 46.8 1.32
380 45.8 2.01
400 54.0 4.22
420 39.6 3.63
440 39.3 3.43
460 45.7 2.18
192
Sample CaCO Sand
480 42.6 3.89
500 52.7 3.21
520 50.0 1.86
540 47.4 1.32
560 57.8 2.45
580 49.2 2.52
600 27.5 0.67
620 43.6 0.89
640 54.9 1.74
660 52.9 2.03
680 53.5 1.83
700 46.2 0.97
720 56.1 2.33
740 49.2 1.96
760 45.7 2.02
780 35.0 1.36
800 51.6 3.16
820 55.9 3.42
840 56.8 3.89
860 52.9 3.22
880 57.0 2.87
900 51.5 3.12
920 47.5 0.86
940 40.1 1.03
960 38.4 0.92
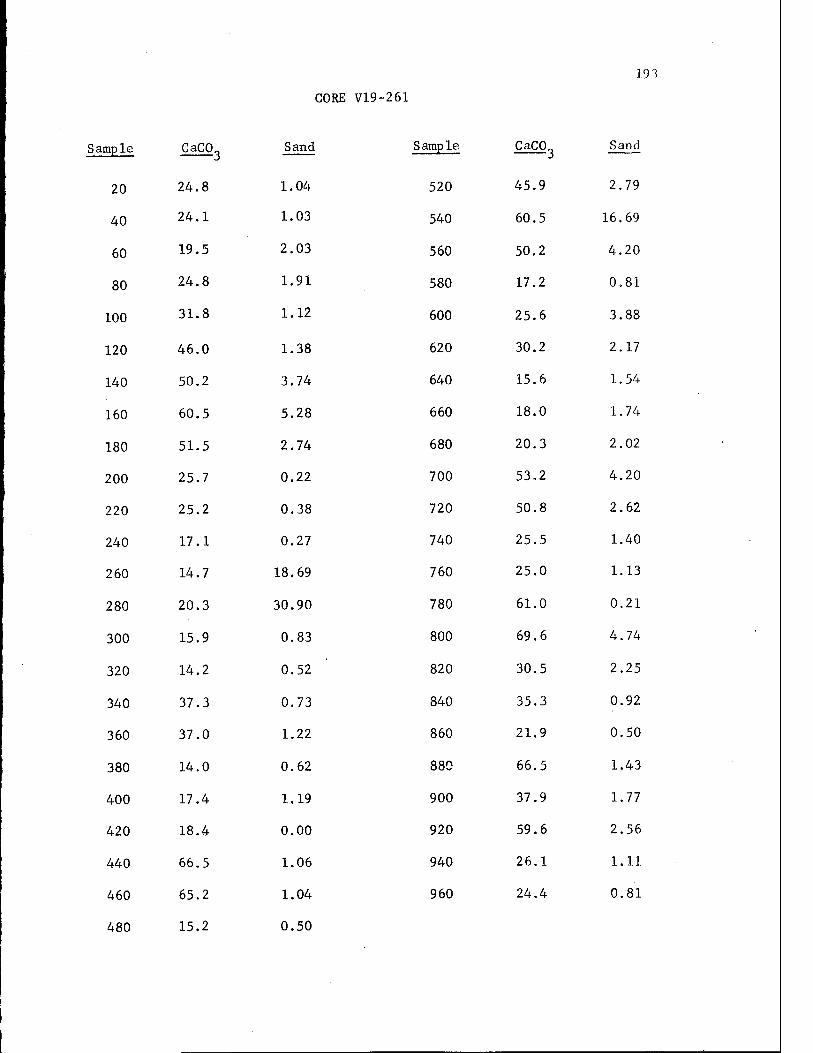
193
CORE V19-26 1
Sample CaCO„ Sand Sample CaC0„ Sand
20 24.8 1.04 520 45.9 2.79
40 24.1 1.03 540 60.5 16.69
60 19.5 2.03 560 50.2 4.20
80 24.8 1.91 580 17.2 0.81
100 31.8 1.12 600 25.6 3.88
120 46.0 1.38 620 30.2 2.17
140 50.2 3.74 640 15.6 1.54
160 60.5 5.28 660 18.0 1.74
180 51.5 2.74 680 20.3 2.02
200 25.7 0.22 700 53.2 4.20
220 25.2 0.38 720 50.8 2.62
240 17.1 0.27 740 25.5 1.40
260 14.7 18.69 760 25.0 1.13
280 20.3 30.90 780 61.0 0.21
300 15.9 0.83 800 69.6 4.74
320 14.2 0.52 820 30.5 2.25
340 37.3 0.73 840 35.3 0.92
360 37.0 1.22 860 21.9 0.50
380 14.0 0.62 880 66.5 1.43
400 17.4 1.19 900 37.9 1.77
420 18.4 0.00 920 59.6 2.56
440 66.5 1.06 940 26.1 1.11
460 65.2 1.04 960 24.4 0.81
480 15.2 0.50
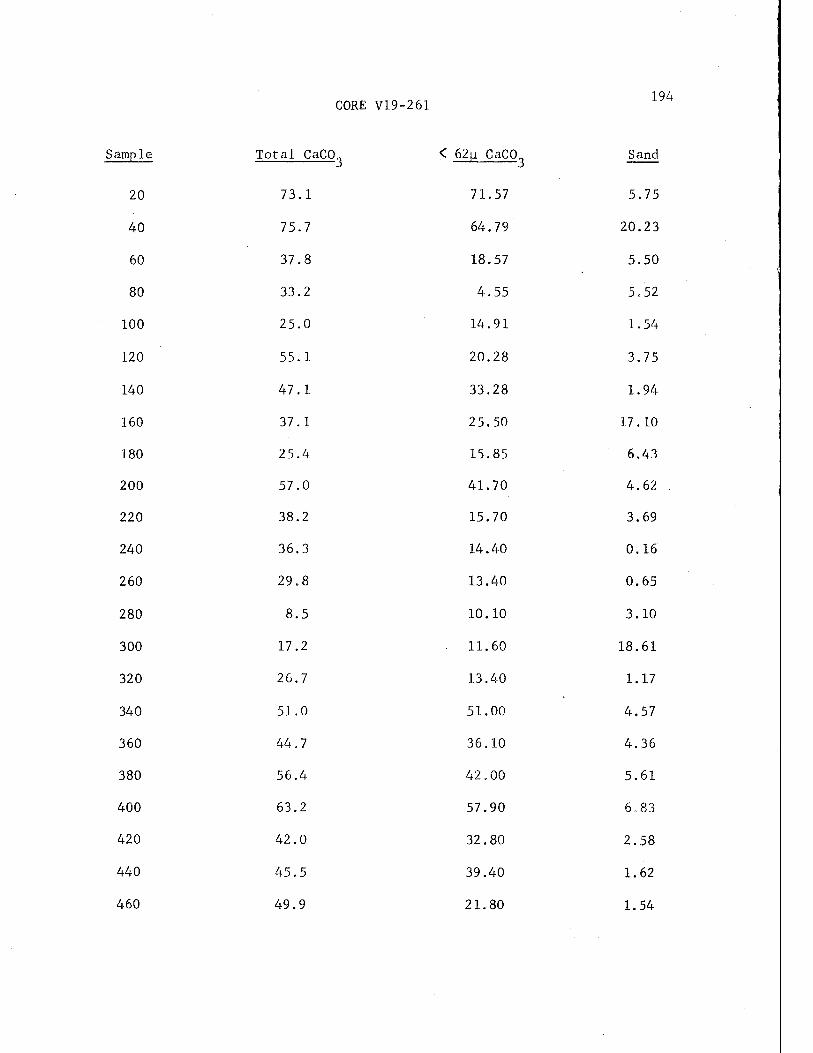
CORE V19-261
Total CaC0„ < 62 u CaCO
73.1 71.57
75.7 64.79
37.8 18.57
33.2 4.55
25.0 14.91
55.1 20.28
47.1 33.28
37.1 25.50
25.4 15.85
57.0 41.70
38.2 15.70
36.3 14.40
29.8 13.40
8.5 10.10
17.2 11.60
26.7 13.40
51.0 51.00
44.7 36.10
56.4 42.00
63.2 57.90
42.0 32.80
45.5 39.40
49.9 21.80
194
Sample Total CaCO.., < 62\i CaC0a Sand
20
40
60
80
100
120
140
160
180
200
220
240
260
280
300
320
340
360
380
400
420
440
460
5 .75
20 .23
5 .50
5 .52
1 .54
3 .75
1 .94
17 .10
6 .43
4 .62 .
3 69
0 16
0 65
3 10
18. 61
1. 17
4. 57
4. 36
5. 61
6. 83
2. 58
1. 62
1. 54
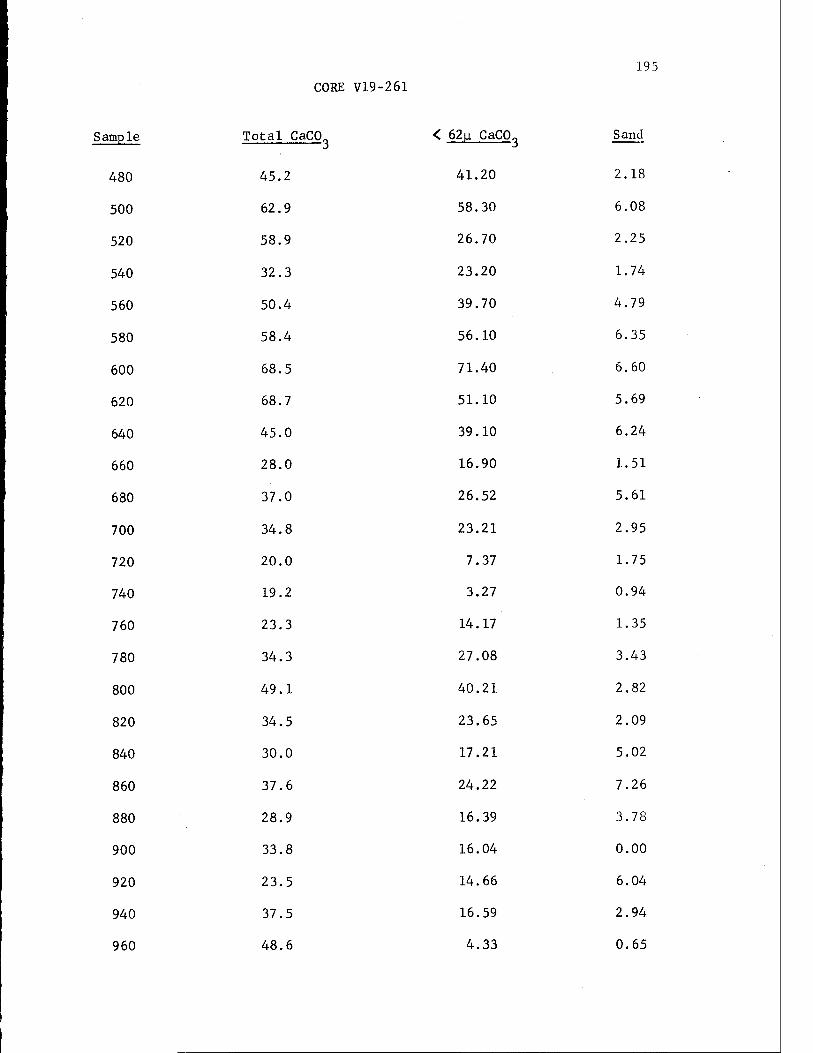
195 CORE V19-261
Sample Total CaCO < 62u CaC03 Sand
480 45.2 41.20 2.18
500 62.9 58.30 6.08
520 58.9 26.70 2.25
540 32.3 23.20 1.74
560 50.4 39.70 4.79
580 58.4 56.10 6.35
600 68.5 71.40 6.60
620 68.7 51.10 5.69
640 45.0 39.10 6.24
660 28.0 16.90 1.51
680 37.0 26.52 5.61
700 34.8 23.21 2.95
720 20.0 7.37 1.75
740 19.2 3.27 0.94
760 23.3 14.17 1.35
780 34.3 27.08 3.43
800 49.1 40.21 2.82
820 34.5 23.65 2.09
840 30.0 17.21 5.02
860 37.6 24.22 7.26
880 28.9 16.39 3.78
900 33.8 16.04 0.00
920 23.5 14.66 6.04
940 37.5 16.59 2.94
960 48.6 4.33 0.65
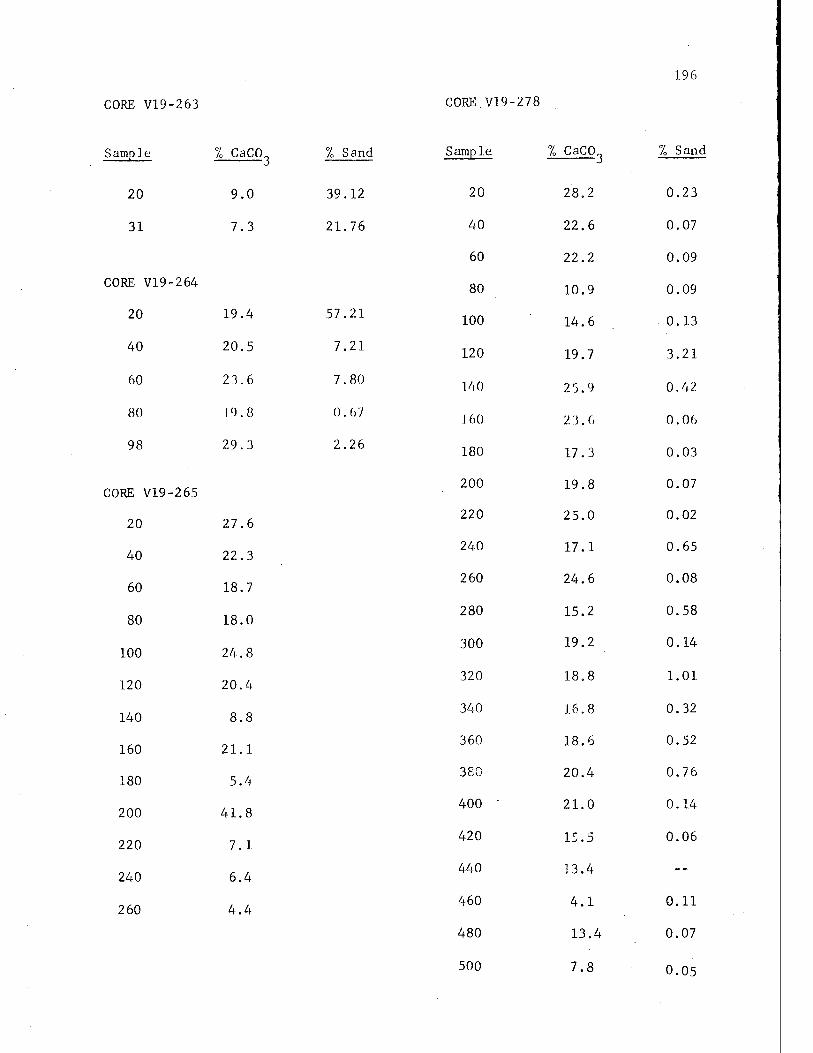
196
CORE V19 -263 CORE V19-278
Sample 1 CaCO„ % . 3 and Sample % CaC0„ 1 Sand
20 9.0 39 .12 20 28.2 0.23
31 7.3 21 .76 40
60
22.6
22.2
0.07
0.09
CORE V19- -264 80 10.9 0.09
20 19.4 57 .21 100 14.6 0.13
40 20.5 7 .21 120 19.7 3.21
60 23.6 7 80 140 2 5.9 0.42
80 19.8 0 67 160 23.6 0.06
98 29.3 2 26 180 17.3 0.03
CORE V19- -265 200 19.8 0.07
20 27.6 220 25.0 0.02
40 22.3 240 17.1 0.65
60 18.7 260 24.6 0.08
80 18.0 280 15.2 0.58
100 24.8 300 19.2 0.14
120 20.4 320 18.8 1.01
140 8.8 340 16.8 0.32
160 21.1 360 18.6 0.52
180 5.4 380 20.4 0.76
200 41.8 400 ■ 21.0 0.14
220 7.1 420 15.5 0.06
240 6.4 440 13.4 --
260 4.4 460
480
500
4.1
13.4
7.8
0.11
0.07
O.OS
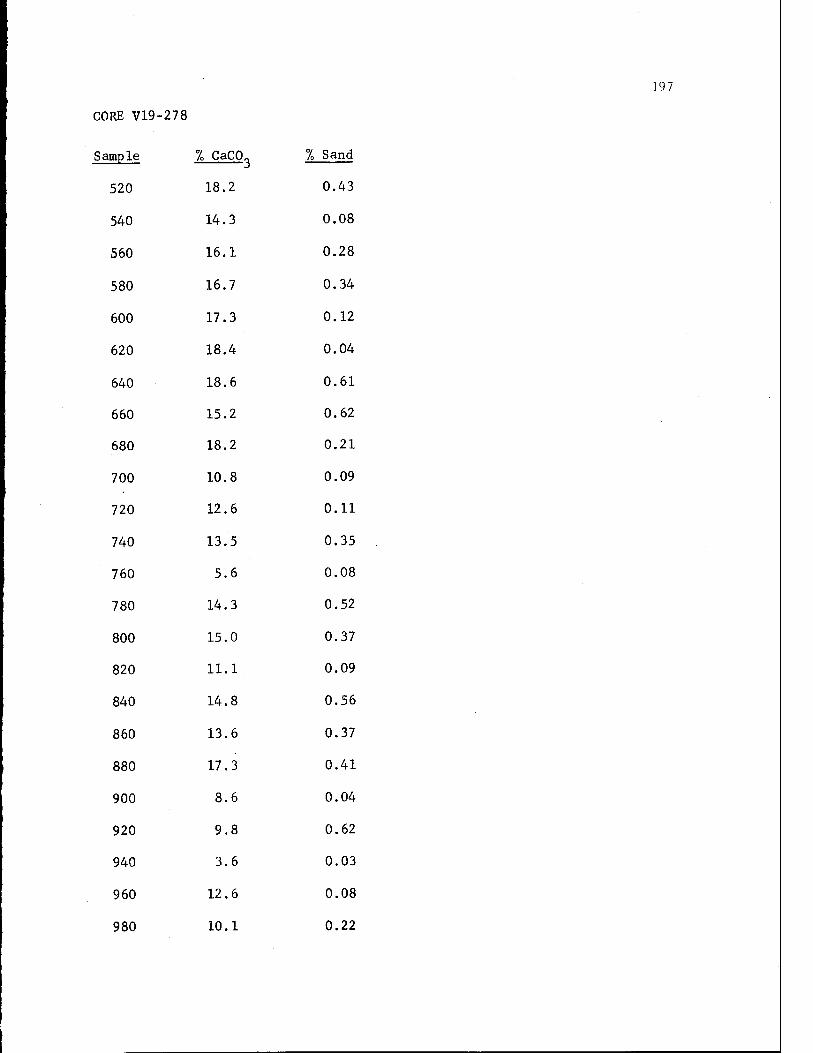
197
CORE V19-278
Sample % CaC03 % Sand
520 18.2 0.43
540 14.3 0.08
560 16.1 0.28
580 16.7 0.34
600 17.3 0.12
620 18.4 0.04
640 18.6 0.61
660 15.2 0.62
680 18.2 0.21
700 10.8 0.09
720 12.6 0.11
740 13.5 0.35
760 5.6 0.08
780 14.3 0.52
800 15.0 0.37
820 11.1 0.09
840 14.8 0.56
860 13.6 0.37
880 17.3 0.41
900 8.6 0.04
920 9.8 0.62
940 3.6 0.03
960 12.6 0.08
980 10.1 0.22
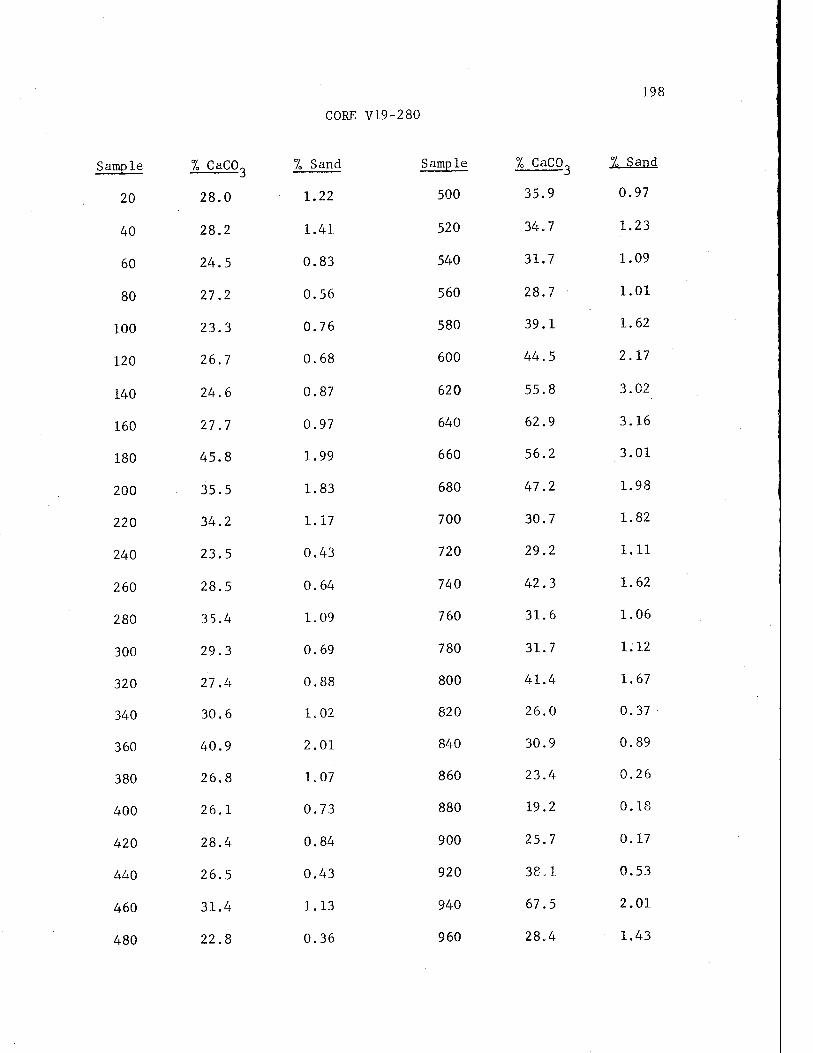
198
CORE V19-280
Sample % CaC03 7o Sand Sample % CaCO^ °L Sand
20 28.0 1.22 500 35.9 0.97
40 28.2 1.41 520 34.7 1.23
60 24.5 0.83 540 31.7 1.09
80 27.2 0.56 560 28.7 1.01
100 23.3 0.76 580 39.1 1.62
120 26.7 0.68 600 44.5 2.17
140 24.6 0.87 620 55.8 3.02
160 27.7 0.97 640 62.9 3.16
180 45.8 1.99 660 56.2 3.01
200 35.5 1.83 680 47.2 1.98
220 34.2 1.17 700 30.7 1.82
240 23.5 0.43 720 29.2 1.11
260 28.5 0.64 740 42.3 1.62
280 35.4 1.09 760 31.6 1.06
300 29.3 0.69 780 31.7 1.12
320 27.4 0.88 800 41.4 1.67
340 30.6 1.02 820 26.0 0.37
360 40.9 2.01 840 30.9 0.89
380 26.8 1.07 860 23.4 0.26
400 26.1 0.73 880 19.2 0.18
420 28.4 0.84 900 25.7 0.17
440 26.5 0.43 920 38.1 0.53
460 31.4 1.13 940 67.5 2.01
480 22.8 0.36 960 28.4 1.43
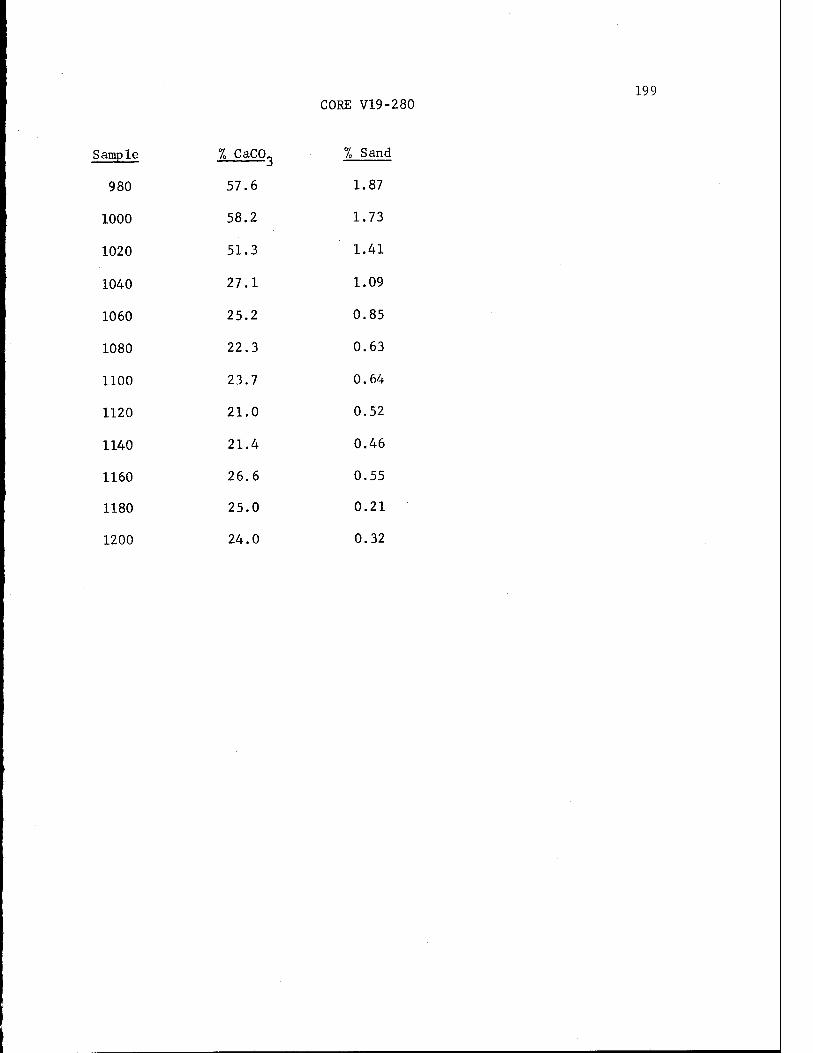
199
Sample
980
1000
1020
1040
1060
1080
1100
1120
1140
1160
1180
1200
CORE V19-280
% CaC03 7= Sand
57.6 1.87
58.2 1.73
51.3 1.41
27.1 1.09
25.2 0.85
22.3 0.63
23.7 0.64
21.0 0.52
21.4 0.46
26.6 0.55
25.0 0.21
24.0 0.32
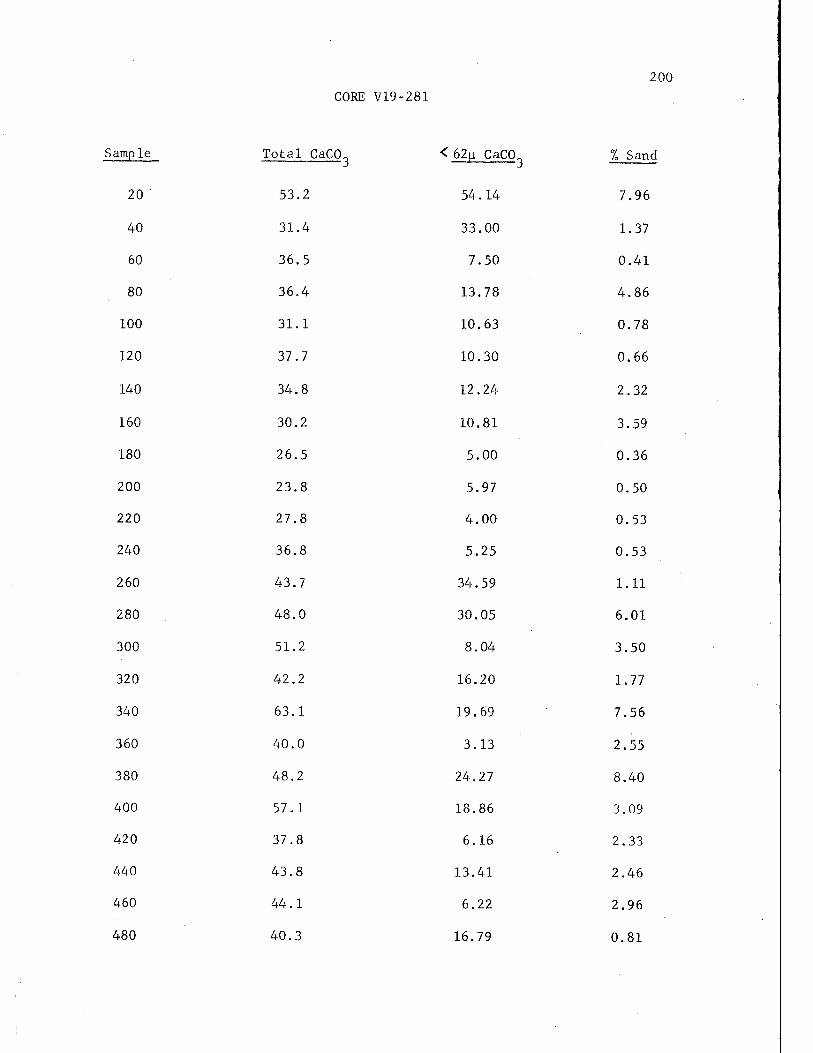
200 CORE V19-281
Sample Total CaCO < 62[i CaC0„ % Sand
20 ' 53.2
40 31.4
60 36.5
80 36.4
100 31.1
120 37.7
140 34.8
160 30.2
180 26.5
200 23.8
220 27.8
240 36.8
260 43.7
280 48.0
300 51.2
320 42.2
340 63.1
360 40.0
380 48.2
400 57.1
420 37.8
440 43.8
460 44.1
480 40.3
1 3
54.14 7.96
33.00 1.37
7.50 0.41
13.78 4.86
10.63 0.78
10.30 0.66
12.24 2.32
10.81 3.59
5.00 0.36
5.97 0.50
4.00 0.53
5.25 0.53
34.59 1.11
30.05 6.01
8.04 3.50
16.20 1.77
19.69 7.56
3.13 2.55
24.27 8.40
18.86 3.09
6.16 2.33
13.41 2.46
6.22 2.96
16.79 0.81
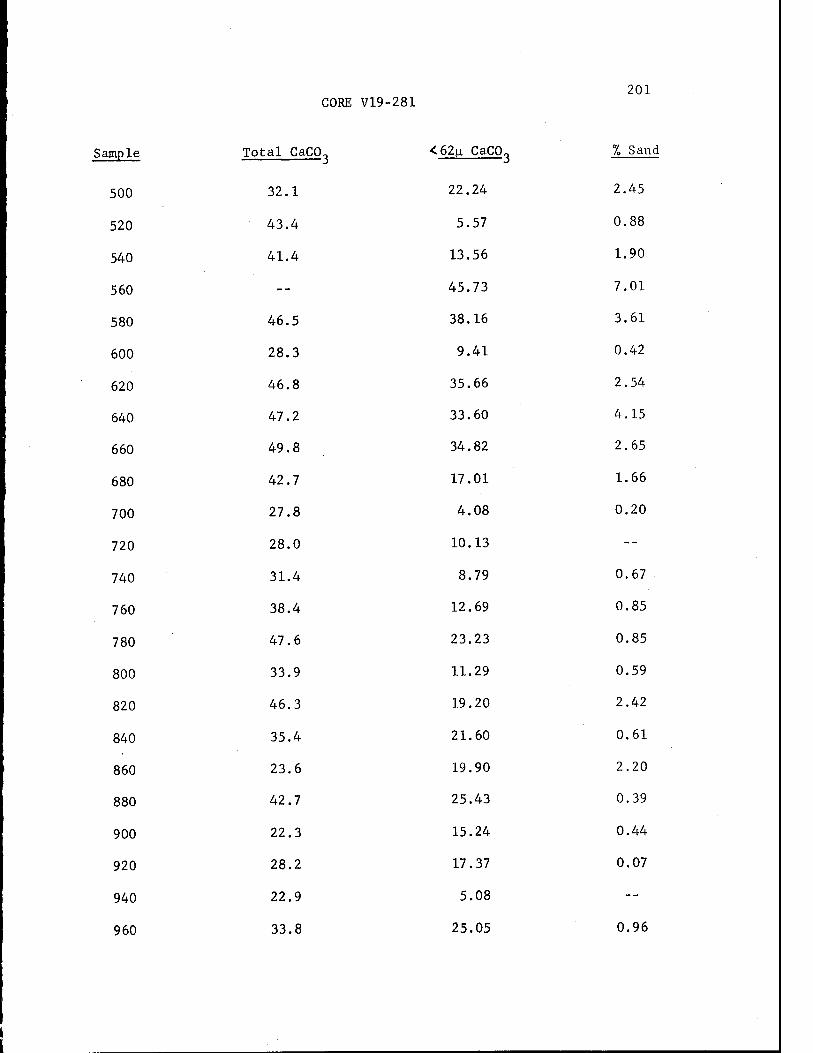
CORE V19-281
Sample Total CaCO- <62u CaC0„
500 32.1 22.24
520 43.4 5.57
540 41.4 13.56
560 -- 45.73
580 46.5 38.16
600 28.3 9.41
620 46.8 35.66
640 47.2 33.60
660 49.8 34.82
680 42.7 17.01
700 27.8 4.08
720 28.0 10.13
740 31.4 8.79
760 38.4 12.69
780 47.6 23.23
800 33.9 11.29
820 46.3 19.20
840 35.4 21.60
860 23.6 19.90
880 42.7 25.43
900 22.3 15.24
920 28.2 17.37
940 22.9 5.08
960 33.8 25.05
201
% Sand
2. 45
0. 88
1. 90
7 01
3 61
0 42
2 54
4 15
2 65
1 .66
0 .20
0.67
0.85
0.85
0.59
2.42
0.61
2.20
0.39
0.44
0.07
0.96
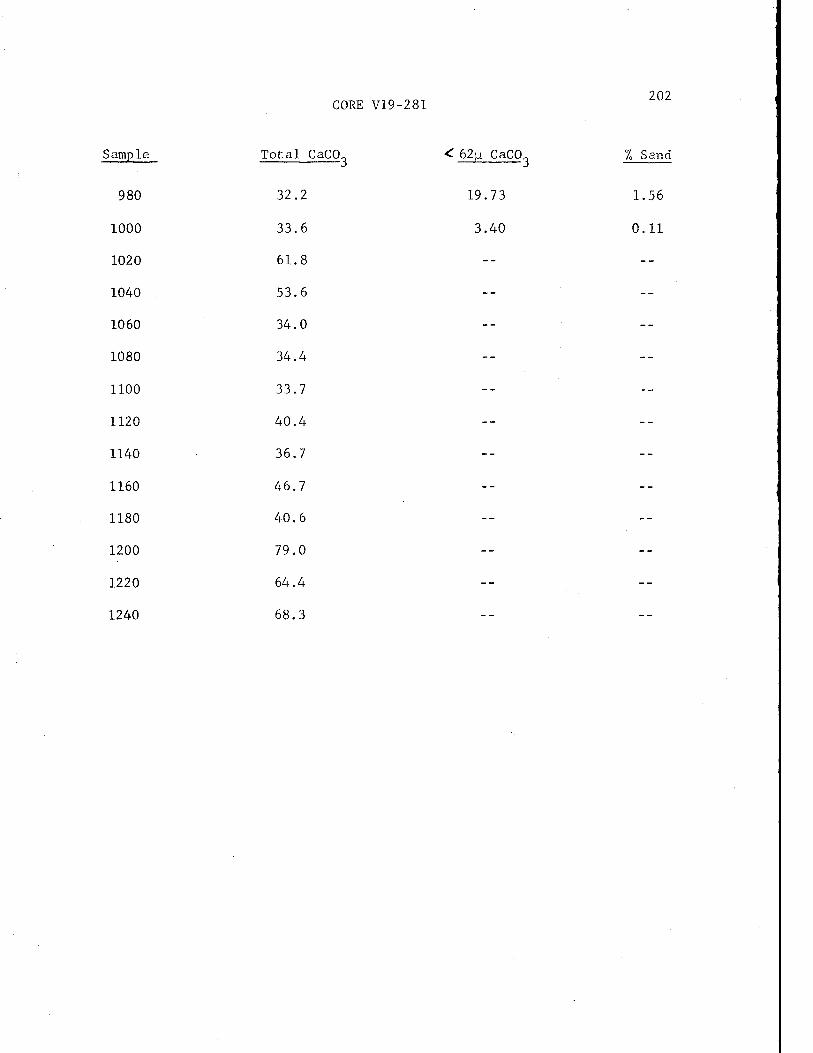
202
Sample Total CaCO,, < 62|g CaCO % Sand
980 32.2 19.73 1.56
1000 33.6 3.40 0.11
1020
1040
1060
1080
1100
1120
1140
1160
1180
1200
1220
1240
CORE V19-281
Total CaC0o < 62|a CaCO
32.2 19.73
33.6 3.40
61.8 --
53.6 --
34.0 --
34.4 --
33.7 --
40.4 --
36.7 --
46.7 --
40.6 --
79.0 --
64.4 --
68.3 _ _
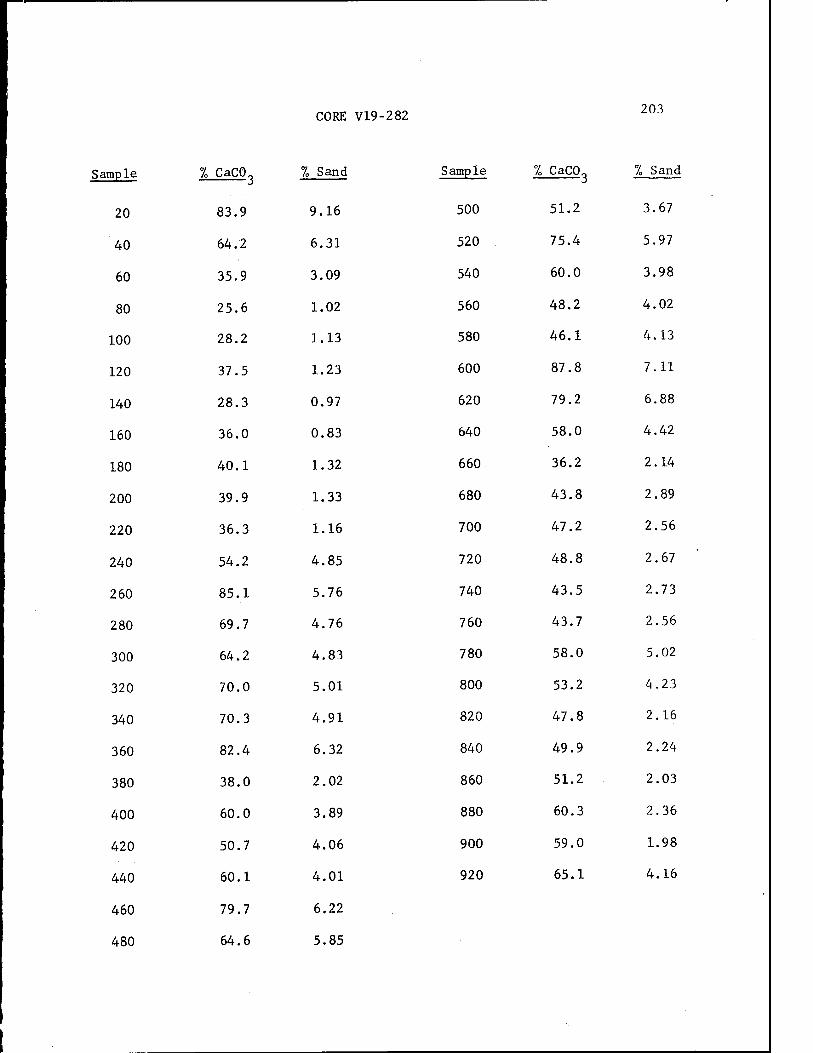
CORE V19-282 203
Sample
20
40
60
80
100
120
140
160
180
200
220
240
260
280
300
320
340
360
380
400
420
440
460
480
% CaC03 % Sand
83.9 9.16
64.2 6.31
35.9 3.09
25.6 1.02
28.2 1.13
37.5 1.23
28.3 0.97
36.0 0.83
40.1 1.32
39.9 1.33
36.3 1.16
54.2 4.85
85.1 5.76
69.7 4.76
64.2 4.83
70.0 5.01
70.3 4.91
82.4 6.32
38.0 2.02
60.0 3.89
50.7 4.06
60.1 4.01
79.7 6.22
64.6 5.85
Sample % CaC03 % Sand
500 51.2 3.67
520 75.4 5.97
540 60.0 3.98
560 48.2 4.02
580 46.1 4.13
600 87.8 7.11
620 79.2 6.88
640 58.0 4.42
660 36.2 2.14
680 43.8 2.89
700 47.2 2.56
720 48.8 2.67
740 43.5 2.73
760 43.7 2.56
780 58.0 5.02
800 53.2 4.23
820 47.8 2.16
840 49.9 2.24
860 51.2 2.03
880 60.3 2.36
900 59.0 1.98
920 65.1 4.16
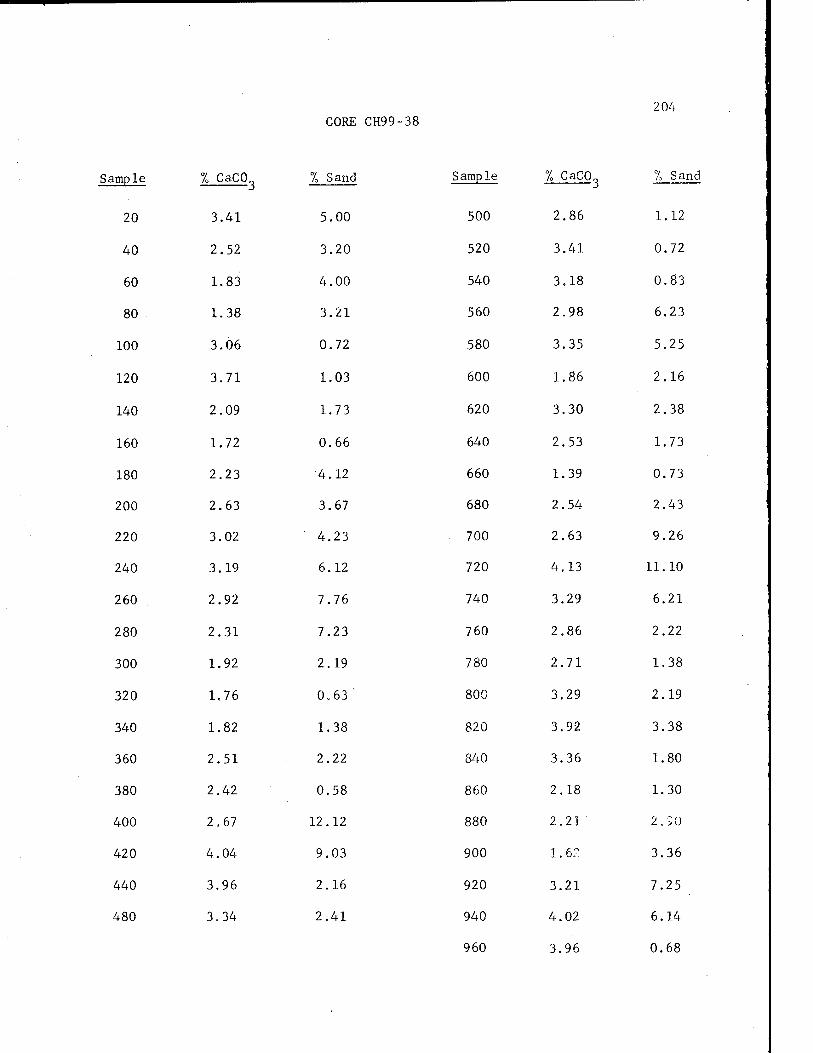
CORE CH99-38 204
Sample
20
40
60
80
100
120
140
160
180
200
220
240
260
280
300
320
340
360
380
400
420
440
480
7„ CaC0„ % Sand
3 .41
2 .52
1 .83
1 .38
3 .06
3 .71
2 .09
1 .72
2 .23
2 .63
3 02
3 19
2 92
2 31
1 92
1 76
1. 82
2. 51
2. 42
2. 67
4. 04
3. 96
3. 34
5 .00
3 .20
4 .00
3 .21
0 .72
1 .03
1 .73
0 .66
4 12
3 67
4 23
6 12
7 76
7 23
2 19
0. 63 '
1. 38
2. 22
0. 58
12. 12
9. 03
2. 16
2. 41
Sample % CaCO. % Sand
500 2.86
520 3.41
540 3.18
560 2.98
580 3.35
600 1.86
620 3.30
640 2.53
660 1.39
680 2.54
700 2.63
720 4.13
740 3.29
760 2.86
780 2.71
800 3.29
820 3.92
840 3.36
860 2.18
880 2.21
900 1.62
920 3.21
940 4.02
960 3.96
1 .12
0 .72
0 .83
6 .23
5 .25
2 .16
2 .38
1 .73
0 .73
2 43
9 26
11 10
6 21
2 22
1 38
2. 19
3. 38
1. 80
1. 30
2. SO
3. 36
7. 25
6. 14
0. 68
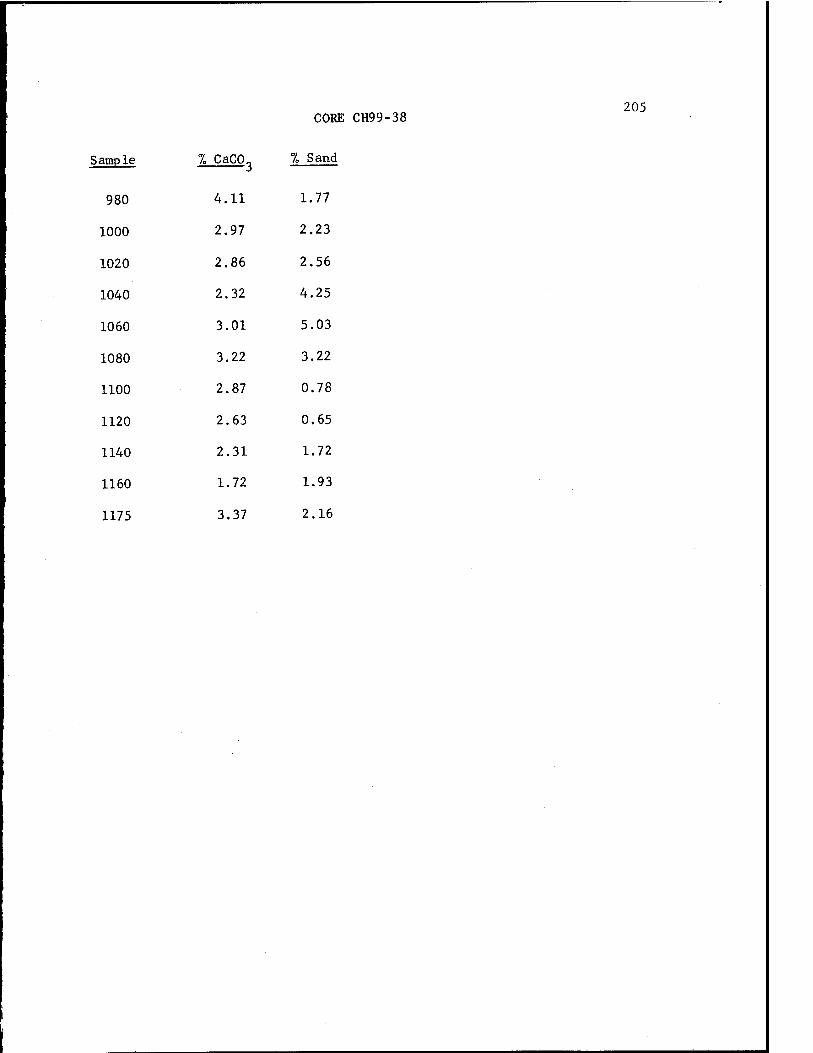
Sample
980
1000
1020
1040
1060
1080
1100
1120
1140
1160
1175
CORE CH99-38
% CaC03 % Sand
4.11 1.77
2.97 2.23
2.86 2.56
2.32 4.25
3.01 5.03
3.22 3.22
2.87 0.78
2.63 0.65
2.31 1.72
1.72 1.93
3.37 2.16
205
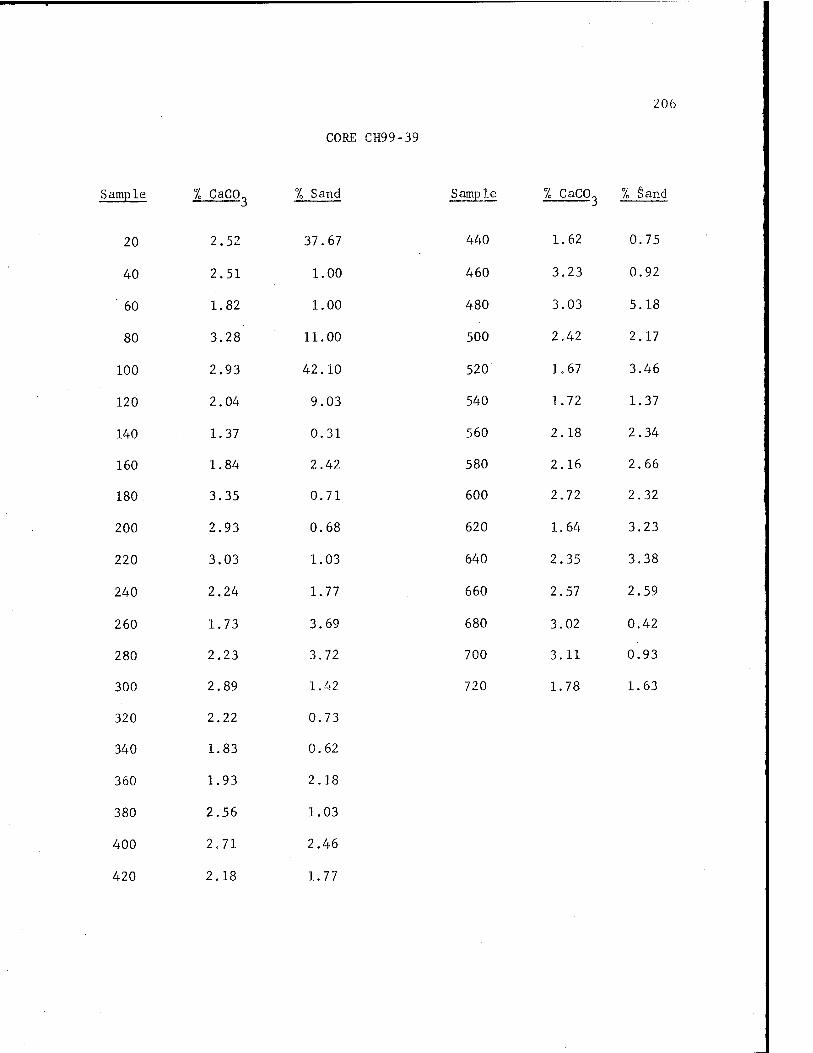
CORE CH99-39
206
Sample 1 CaC0„ % Sand
20 2.52
40 2.51
60 1.82
80 3.28
100 2.93
120 2.04
140 1.37
160 1.84
180 3.35
200 2.93
220 3.03
240 2.24
260 1.73
280 2.23
300 2.89
320 2.22
340 1.83
360 1.93
380 2.56
400 2.71
420 2.18
37 .67
1 .00
1 .00
11 .00
42 .10
9 .03
0 .31
2 42
0 71
0 68
1 03
1 77
3 69
3. 72
1. 42
0. 73
0. 62
2. 18
1. 03
2. 46
1. 77
Sample 7= CaC03 1 Sand
440 1.62 0.75
460 3.23 0.92
480 3.03 5.18
500 2.42 2.17
520 1.67 3.46
540 1.72 1.37
560 2.18 2.34
580 2.16 2.66
600 2.72 2.32
620 1.64 3.23
640 2.35 3.38
660 2.57 2.59
680 3.02 0.42
700 3.11 0.93
720 1.78 1.63
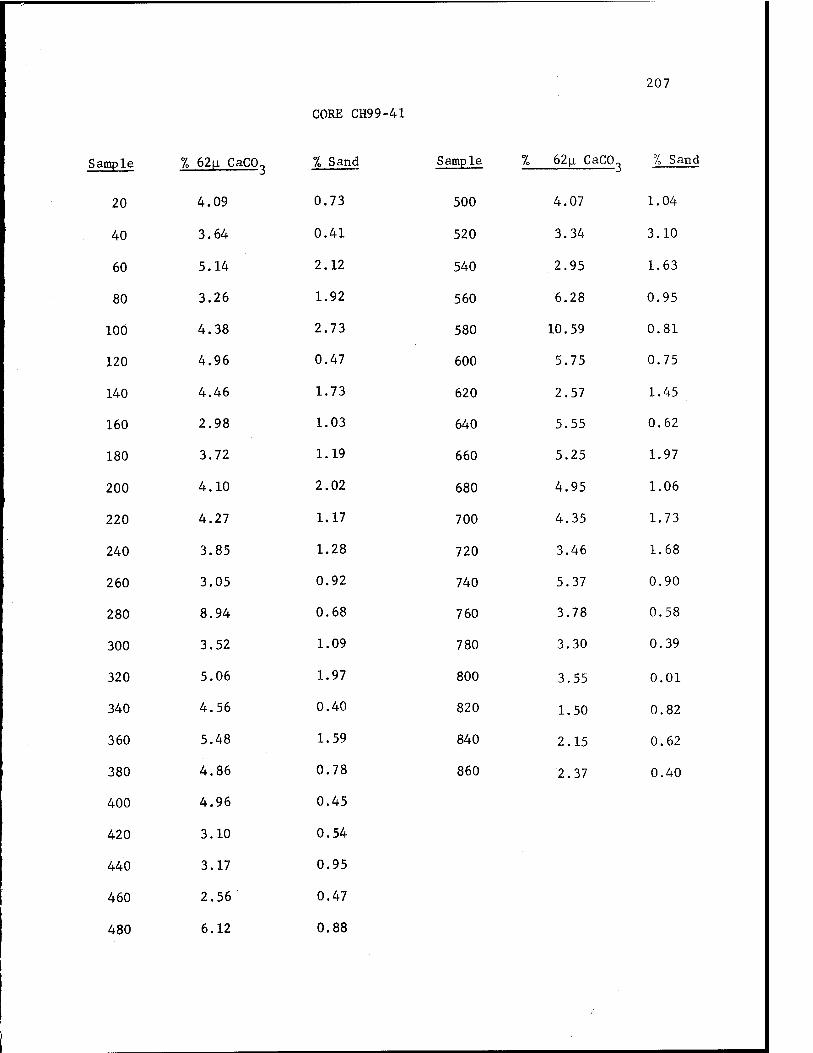
207
CORE CH99-41
Sample % 62u CaCO^ % Sand Sample % 62|a CaC03 % Sand
20 4.09 0.73 500 4.07 1.04
40 3.64 0.41 520 3.34 3.10
60 5.14 2.12 540 2.95 1.63
80 3.26 1.92 560 6.28 0.95
100 4.38 2.73 580 10.59 0.81
120 4.96 0.47 600 5.75 0.75
140 4.46 1.73 620 2.57 1.45
160 2.98 1.03 640 5.55 0.62
180 3.72 1.19 660 5.25 1.97
200 4.10 2.02 680 4.95 1.06
220 4.27 1.17 700 4.35 1.73
240 3.85 1.28 720 3.46 1.68
260 3.05 0.92 740 5.37 0.90
280 8.94 0.68 760 3.78 0.58
300 3.52 1.09 780 3.30 0.39
320 5.06 1.97 800 3.55 0.01
340 4.56 0.40 820 1.50 0.82
360 5.48 1.59 840 2.15 0.62
380 4.86 0.78 860 2.37 0.40
400 4.96 0.45
420 3.10 0.54
440 3.17 0.95
460 2.56 0.47
480 6.12 0.88
208
APPENDIX III
Analytical Methods
209
Percent Sand
1. Approximately 1 to 2 grams of sediment were placed in a pre-weighed 50
ml. beaker and dried for at least 8 hours at 110°C.
2. The samples were removed to a dessicator to cool and then weighed. Sam-
ple weight was determined by subtracting the beaker weight from the total
weight.
3. About 20 to 30 ml of sodium metaphosphate solution were added to each
beaker and the samples were disaggregated. The samples were left to
stand approximately 24 hours.
4. The samples were washed through a 62. 5\± sieve and the silt and clay
fraction collected in a 250 ml. beaker.
5. When thoroughly washed, the sand fractions were rinsed into 50 ml
beakers and placed in an oven at 110°C until completely dry.
6. The silt and clay fractions were allowed to stand undisturbed for one
to two days.
7. The sand fractions and beakers weighed and the percent sand calculated.
The sand fractions were placed in labeled vials.
Percent Calcium Carbonate in the Silt and Clay Fractions
1. After standing for 1 to 2 days, the clear supernatants were poured from
the 250 ml. beakers containing the silt-clay fraction and the remaining
sediment washed into the same 50 ml beakers as used in determining per-
cent sand.
2. The silt-clay fractions were dried for about 12 hours at 110°C.
3. The samples were placed in a dessicator to cool and then weighed. Sample
weights were determined by subtracting the beaker weights from the total
210
weight.
4. 2N HC1 was added to each beaker and the beakers were allowed to stand for
about one hour.
5. During this time, Millipore filters were weighed and placed in numbered
petrie dishes corresponding to the sample numbers.
6. Distilled water was added to the beakers and the supernatants were washed
(decanted) onto their corresponding Millipore filters. Distilled water
was added to the samples and decanted several times.
7. The filters were washed several times with distilled water.
8. The filters were placed in the beakers with their samples and dried at
110°C for about 8 hours or until dry.
9. The samples and filters were cooled in a dessicator and weighed.
10. The acidified sample weight was determined by subtracting the filter
weight and the beaker weight from the final weight.
11. Carbonate content was determined by:
(original weight) - (acidified weight) x 1Q0 original weight
Percent Organic Carbon
1. A 0.25 to 1.0 gram sample was dried at 110°C for 8 hours and weighed.
2. The sample was acidified in 2N HC1 to remove calcium carbonate.
3. The sample was washed into a Leco filter crucible and rinsed several
times with distilled water.
4. The crucible-was covered with metal foil and labelled.
5. The sample was combusted in a Leco induction furnace and the percent
organic carbon determined.
211
Clay Mineral Analyses
1. Samples were acidified in acetic acid and disaggregated completely.
2. The less-than-2|_i fraction was separated by centrifugation.
3. The supernatant in each centrifuge tube was poured through a Selas
Flotronics silver filted and then air dried.
4. The silver filters were placed in a Norelco X-ray diffractometer
(Cu K«< , 40 ma, 40 Kv) and scanned from 2° to 40° 2 0 at 2°/min.
5. The filters were then placed in a dessicator containing ethylene
glycol and glycolated at 70°C for at least 4 hours.
6. The filters were then scanned again from 2° to 40° above the previous
untreated trace.
7. Certain of the samples were then heated to 400°C and 550°C and rerun.
A baseline was sketched on the glycolated trace and the areas of the
major peaks determined by counting the enclosed squares within the peak and
the baseline. The following peak weightings were used (Biscaye, 1965) to
determine the percentages of the clay minerals:
1 x area of the 17Ä glycolated montmorillonite peak
4 x area of the 10Ä glycolated illite peak
2 x area of the 7Ä kaolinite-chlorite peak
Kaolinite and chlorite were divided based on the relative areas of the
two peaks in the kaolinite-chlorite 3.5Ä doublet (kaolinite, 3.58Ä; chiorice,
3.54Ä).
The four weighted peak areas were summed and the weighted area of each
mineral times 100 was divided by the sum of the areas to give the percentage
of each mineral.
212
BIOGRAPHY
Brian Douglas Bomhold
Born: Kitchener, Ontario, Canada - December 13, 1945
Education: University of Waterloo Waterloo, Ontario 1963-1968; B.Sc, 1967
Duke University Durham, North Carolina 1968-1970; A.M., 1970
Massachusetts Institute of Technology - Woods Hole Oceanographic Institution Woods Hole, Massachusetts
Professional Experience:
May 1968 - Sept. 1968 Canada Centre for Inland Waters Burlington, Ontario Sr. Field Assistant
April 1967 - Sept. 1967 Geological Survey of Canada Dr. P. F. Karrow Laboratory Assistant
May 1966 - August 1966 Rio Tinto Canadian Exploration 120 Adelaide Street West Toronto, Ontario Geologist's Assistant
May 1966 - Sept. 1966 Lome* Mining Corporation Ashcroft, British Columbia Geologist's Assistant
Jan. 1965 - April 1965 Tamper Division Canada Iron Lachine, P.Q. Engineer's Assistant
April 1964 - Aug. 1964 Tamper Division, Canada Iron Lachine, P.Q. Engineer's Assistant
213
Academic Awards:
1968 - 1969 Duke University Geology Department Fellowship
1969 - 1970 National Science Foundation Predoctoral Trainee- ship in Oceanography, Duke University Marine Laboratory
1970 - 1973 Woods Hole Oceanographic Institution Research Fellowship
Papers Published:
Bornhold, B.D., 1969, Marine mineral resources: North Carolina En-
gineer, v. XXVI, p. 25-34.
Pilkey, O.H. and Bornhold, B.D., 1970, Gold distribution on the
Carolina Continental margin - a preliminary report: U.S. Geol.
Survey Prof. Paper 700C, p. C30-C34.
Bornhold, B.D. and Pilkey, O.H., 1971, Bioclastic turbidite sedimen-
tation in Columbus Basin, Bahamas: Geol. Soc. Amer. Bull., v. 82,
p. 1341-1354.
Bornhold, B.D. and Milliman, J.D., 1973, Generic and environmental
considerations in the carbonate mineralogy and composition of
serpulid (Polychaete) tubes: Jour. Geol., v. 81, p. 363-373.
Milliman, J.D. and Bornhold, B.D., in press, Peak-heights versus peak
area determination of calcite-aragonite mixtures: a discussion:
Sedimentology.
Mascle, J.R., Bornhold, B.D., and Renard, V., in press, Diapiric
structures off the Niger Delta: Am. Assoc. Petrol. Geol.
Bornhold, B.D., Mascle, J.R., and Harada, K., in press, Suspended matter
in surface waters of the Eastern Gulf of Guinea: Marine Geology.
r i
■=C O C3
O- LlJ O
- 4-> (U O r :'n >i oi«j c; re o <u
in at o o c : cc > U_ Ol-r- c (JJ o c a i
O -t-3 O I O l/l T- •.- E f— o c I
O i- -C T- C_J r— t
: aE c m s. ai • — 3 . <a iu c ■ i/i I 'ri: o »J C >|T)£i OJ E Jl tl
O O -at , E E CU S_ ,— iu o £
0) E O CL s- ■— </) -4-> E tO --,
i >, « c -a tu E E
■ E3|
i o a)-— i_ •— o •.- -a ' ~ ■ no oio) _J
o *d- o
n Qj C (00 a>
- S E 5- ' > E re ■<- c en aj o
. <u
) -r- i- T- t— ^ s: >,J= E ■>- IO: 3 o o 04Jin^3C -r-
> c 3 ,— _c <u "m c £ c n-r- oreaj-MU-s-ajuo O
■r- O > O. 4-> -I
n >, ZJ 4J a.
j -i~ c ■— o o <
: aj -l o +-> c o i
- -r- '■>- 13 O C
- o -u aj c
;<D4->EI-uiEajQJO
-£_ s m re o i-
■S en"0 3 5 re >, c -- s2 *->
o "l ,, O -C re vi E *~ re
3 := UJ u a: (_J re —• 4-j re -o +J re i/i n- Q.-M > u Q-f> re -o
I
•r- -a I a> a) I
i r
<C 4-> S-
r— E ^
<-IO
i „c >,-C £
o -i-1 o i o ;
— > QJ iZ E r- I O +-> J= re >i
o ai D o u 3<
o o n <
L. _ _
I c -O
i E aj"o ui 3 o air- I- i— o 'r- "a
i -a ■*-> re Lo u- D-+J > t-> Q-f re -a
o- LAJ O
i T- +J CD o f
o: tu -a
to ai o o !
: >,J= E —; s- o £
+J o
i +J 1- o
> E O en
i s_ .,_ o +J tu t IDiylQ-reL-JC^Ur lOOCJC^iO^-O I c O.T3 o O •— <U C
c+J+JreEreoJ-'res-QJ oo -<- QJ ,— > i/i • r- i- T- .— O lA 3ulE01WEi-WECiQlO
o *J o "o m c <— o i o o -t-j -i— CJ -r-i-(/)D. E c Z3 en +JOJ-^reLoa.i-reox)^J-'"o E o i— s= aj •■- JC i- a ii-!i-J3 m o c n"o o
: o tu e >,"o _a a> E CU <
loc f= i
•=£ re o ■= D-i- I C o- s_ <: c
a: ro <n 3 0 U O i
i E S- !
: o Q. s- ^- w E re ^.
Jl o O ui o re 1 o:c dot-
S3 cazu
- ~o c"Oi— aj-o E aj"o m D OOJ-— (-■— o->-"o a .,-. o cr-x: c o-d c >,>— i-x:rorecuODici) ja;t_> re ■—< +J HJ *a •*-» re i/>4- Q.4J > (-> o.n rex>
n
_J