uts annual report - university of technology sydney · 2 uts annual report 2016 ... debts as...
TRANSCRIPT
Financial statementsUTS ANNUAL REPORT
UTS RANKEDAUSTRALIA’S #1
YOUNG UNI
1NO.
FINANCIAL STATEMENTS
University of Technology Sydney 1
UTS Global Pty Ltd 62
Piivot Pty Ltd 76
Insearch Limited 91
accessUTS Pty Limited 126
Acknowledgements and contacts 142
Review of operations and statutory reporting see volume one
UTS ANNUAL REPORT 2016 1
University of Technology Sydney
Statement by appointed officers 2
Independent auditor’s report 3
Income statement 5
Statement of comprehensive income 6
Statement of financial position 7
Statement of changes in equity 8
Statement of cash flows 9
Notes to the financial statements 10
1. Summary of significant accounting policies 10
2. Revenue from continuing operations 16
3. Expenses from continuing operations 20
4. Borrowing costs 22
5. Sales of assets 22
6. Income tax 22
7. Key management personnel disclosures 22
8. Remuneration of auditors 25
9. Cash and cash equivalents 25
10. Receivables 25
11. Other financial assets 27
12. Other non-financial assets 28
13. Non-current assets classified as held for sale 29
14. Investments accounted for using the equity method 29
15. Property, plant and equipment 30
16. Intangible assets 32
17. Trade and other payables 34
18. Borrowings 35
19. Provisions 36
20. Other financial liabilities 37
21. Other liabilities 37
22. Reserves and retained earnings 38
23. Commitments 39
24. Non-cash financing and investing activities 40
25. Defined benefits plans 40
26. Contingent assets and contingent liabilities 47
27. Economic dependency 47
28. Subsidiaries 47
29. Related parties 48
30. Disaggregation information (consolidated) 48
31. Events occurring after the balance sheet date 48
32. Reconciliation of net result after income tax to net cash flows from operating activities 49
33. Acquittal of Australian Government financial assistance 50
34. Financial risk management 55
FINANCIAL STATEMENTS: UTS
2 UTS ANNUAL REPORT 2016
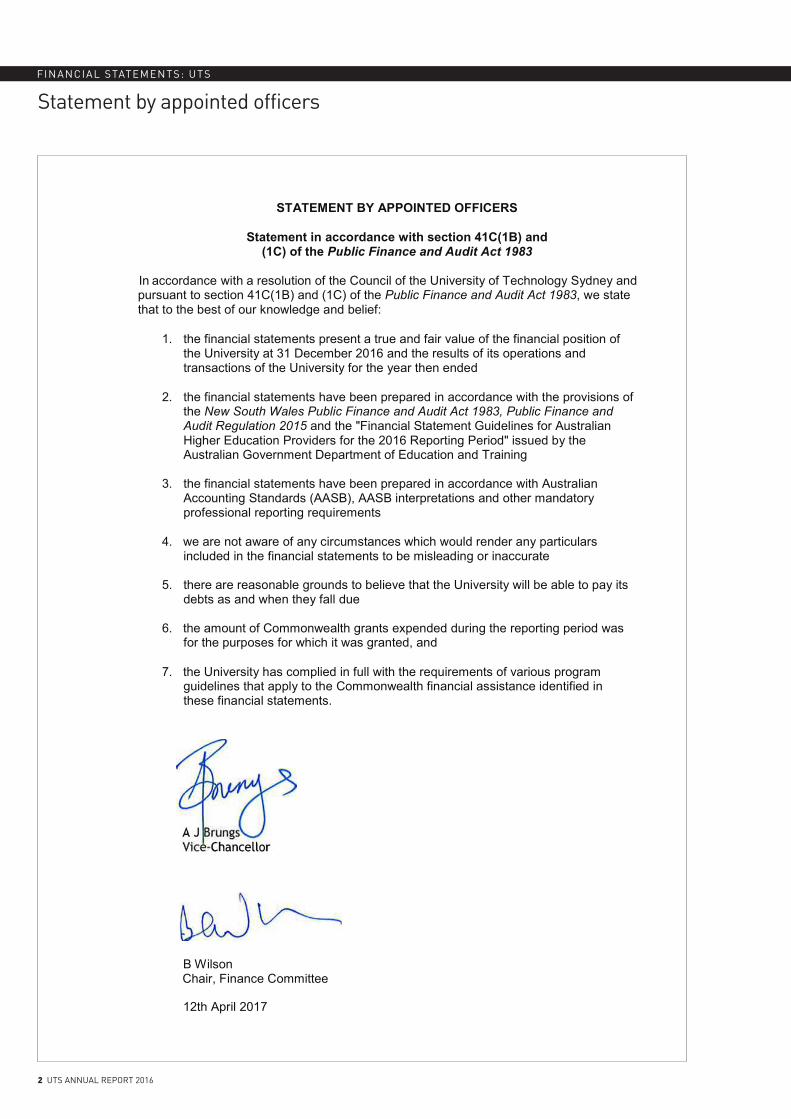
Statement by appointed officers
STATEMENT BY APPOINTED OFFICERS
Statement in accordance with section 41C(1B) and(1C) of the Public Finance and Audit Act 1983
In accordance with a resolution of the Council of the University of Technology Sydney andpursuant to section 41C(1B) and (1C) of the Public Finance and Audit Act 1983, we statethat to the best of our knowledge and belief:
1. the financial statements present a true and fair value of the financial position ofthe University at 31 December 2016 and the results of its operations andtransactions of the University for the year then ended
2. the financial statements have been prepared in accordance with the provisions ofthe New South Wales Public Finance and Audit Act 1983, Public Finance andAudit Regulation 2015 and the "Financial Statement Guidelines for AustralianHigher Education Providers for the 2016 Reporting Period" issued by theAustralian Government Department of Education and Training
3. the financial statements have been prepared in accordance with AustralianAccounting Standards (AASB), AASB interpretations and other mandatoryprofessional reporting requirements
4. we are not aware of any circumstances which would render any particularsincluded in the financial statements to be misleading or inaccurate
5. there are reasonable grounds to believe that the University will be able to pay itsdebts as and when they fall due
6. the amount of Commonwealth grants expended during the reporting period wasfor the purposes for which it was granted, and
7. the University has complied in full with the requirements of various programguidelines that apply to the Commonwealth financial assistance identified inthese financial statements.
B WilsonChair, Finance Committee
12th April 2017
FINANCIAL STATEMENTS: UTS
UTS ANNUAL REPORT 2016 3
Independent auditor’s report
INDEPENDENT AUDITOR’S REPORT
University of Technology Sydney
To Members of the New South Wales Parliament and Members of the University of Technology Sydney
Opinion I have audited the accompanying financial statements of University of Technology Sydney (the University), which comprise the statements of financial position as at 31 December 2016, the statements of comprehensive income, the statements of changes in equity and the statements of cash flows for the year then ended, notes comprising a summary of significant accounting policies and other explanatory information of the University and the consolidated entity. The consolidated entity comprises the University and the entities it controlled at the year’s end or from time to time during the financial year.
In my opinion, the financial statements:
• give a true and fair view of the financial position of the University and the consolidated entity, as at 31 December 2016, and of their financial performance and cash flows for the year then ended in accordance with Australian Accounting Standards
• are in accordance with section 41B of the Public Finance and Audit Act 1983 (PF&A Act) and the Public Finance and Audit Regulation 2015
• comply with the ‘Financial Statement Guidelines for Australian Higher Education Providers for the 2016 Reporting Period’ (the Guidelines), issued by the Australian Government Department of Education and Training, pursuant to the Higher Education Support Act 2003, the Higher Education Funding Act 1988 and the Australian Research Director Act 2001
My opinion should be read in conjunction with the rest of this report.
Basis for Opinion I conducted my audit in accordance with Australian Auditing Standards. My responsibilities under the standards are described in the ‘Auditor’s Responsibilities for the Audit of the Financial Statements’ section of my report.
I am independent of the University in accordance with the requirements of the:
• Australian Auditing Standards • Accounting Professional and Ethical Standards Board’s APES 110 ‘Code of Ethics for
Professional Accountants’ (APES 110).
I have fulfilled my other ethical responsibilities in accordance with APES 110.
The PF&A Act further promotes independence by ensuring the Auditor–General and the Audit Office of New South Wales are not compromised in their roles by:
• providing that only Parliament, and not the executive government, can remove an Auditor–General
FINANCIAL STATEMENTS: UTS
4 UTS ANNUAL REPORT 2016
Independent auditor’s report (continued)
2
• mandating the Auditor–General as auditor of public sector agencies, but precluding the provision of non-audit services.
I believe the audit evidence I have obtained is sufficient and appropriate to provide a basis for my audit opinion.
University Council’s Responsibility for the Financial Statements The Council of the University is responsible for the preparation and fair presentation of the financial statements in accordance with Australian Accounting Standards, the PF&A Act and the Guidelines and for such internal control as the Council determines is necessary to enable the preparation and fair presentation of the financial statements that are free from material misstatement, whether due to fraud or error.
In preparing the financial statements, the Council must assess the University’s ability to continue as a going concern unless the University will be dissolved by an Act of Parliament or otherwise cease operations. The assessment must disclose, as applicable, matters related to going concern and the appropriateness of using the going concern basis of accounting.
Auditor’s Responsibility for the Audit of the Financial Statements My objectives are to:
• obtain reasonable assurance about whether the financial statements as a whole are free from material misstatement, whether due to fraud or error
• issue an Independent Auditor’s Report including my opinion.
Reasonable assurance is a high level of assurance, but does not guarantee an audit conducted in accordance with Australian Auditing Standards will always detect material misstatements. Misstatements can arise from fraud or error. Misstatements are considered material if, individually or in aggregate, they could reasonably be expected to influence the economic decisions users take based on the financial statements.
A description of my responsibilities for the audit of the financial statements is located at the Auditing and Assurance Standards Board website at http://www.auasb.gov.au/auditors_files/ar7.pdf.
The description forms part of my auditor’s report.
My opinion does not provide assurance:
• that the University carried out its activities effectively, efficiently and economically • about the security and controls over the electronic publication of the audited financial
statements on any website where they may be presented • about any other information which may have been hyperlinked to/from the financial statements.
Caroline Karakatsanis Director, Financial Audit Services
13 April 2017 SYDNEY
FINANCIAL STATEMENTS: UTS
UTS ANNUAL REPORT 2016 5
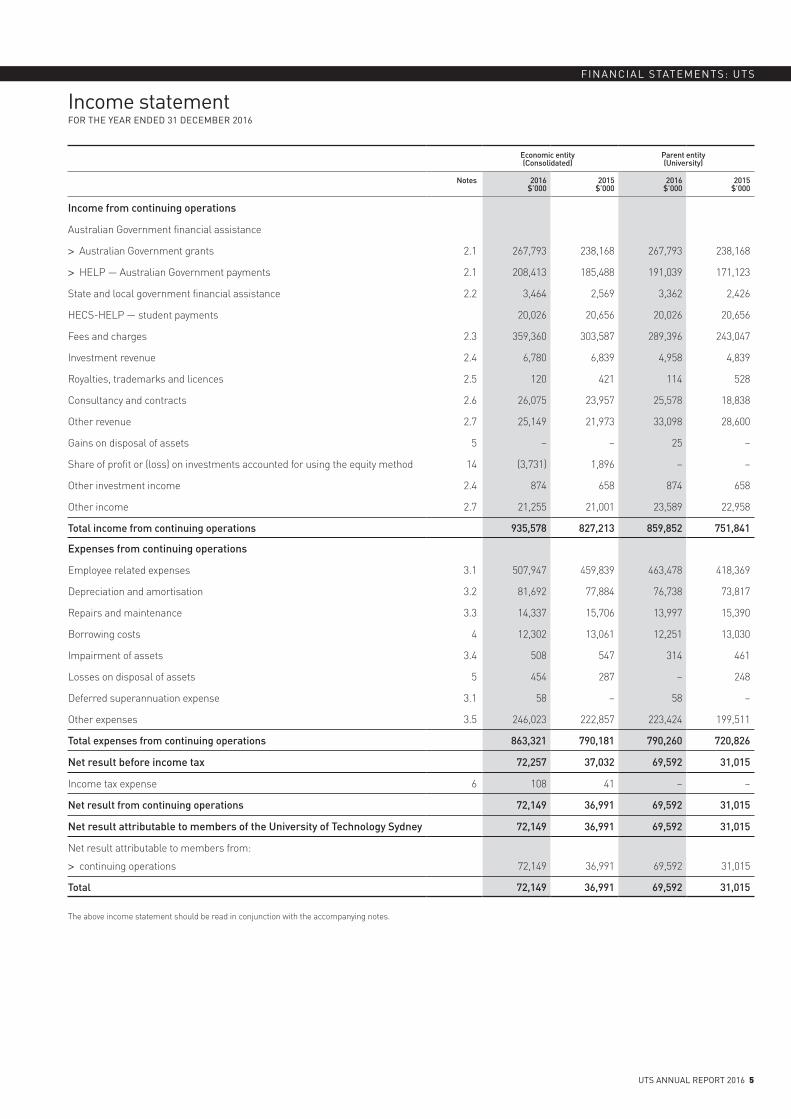
Economic entity (Consolidated)
Parent entity (University)
Notes 2016$’000
2015$’000
2016$’000
2015$’000
Income from continuing operations
Australian Government financial assistance
> Australian Government grants 2.1 267,793 238,168 267,793 238,168
> HELP — Australian Government payments 2.1 208,413 185,488 191,039 171,123
State and local government financial assistance 2.2 3,464 2,569 3,362 2,426
HECS-HELP — student payments 20,026 20,656 20,026 20,656
Fees and charges 2.3 359,360 303,587 289,396 243,047
Investment revenue 2.4 6,780 6,839 4,958 4,839
Royalties, trademarks and licences 2.5 120 421 114 528
Consultancy and contracts 2.6 26,075 23,957 25,578 18,838
Other revenue 2.7 25,149 21,973 33,098 28,600
Gains on disposal of assets 5 – – 25 –
Share of profit or (loss) on investments accounted for using the equity method 14 (3,731) 1,896 – –
Other investment income 2.4 874 658 874 658
Other income 2.7 21,255 21,001 23,589 22,958
Total income from continuing operations 935,578 827,213 859,852 751,841
Expenses from continuing operations
Employee related expenses 3.1 507,947 459,839 463,478 418,369
Depreciation and amortisation 3.2 81,692 77,884 76,738 73,817
Repairs and maintenance 3.3 14,337 15,706 13,997 15,390
Borrowing costs 4 12,302 13,061 12,251 13,030
Impairment of assets 3.4 508 547 314 461
Losses on disposal of assets 5 454 287 – 248
Deferred superannuation expense 3.1 58 – 58 –
Other expenses 3.5 246,023 222,857 223,424 199,511
Total expenses from continuing operations 863,321 790,181 790,260 720,826
Net result before income tax 72,257 37,032 69,592 31,015
Income tax expense 6 108 41 – –
Net result from continuing operations 72,149 36,991 69,592 31,015
Net result attributable to members of the University of Technology Sydney 72,149 36,991 69,592 31,015
Net result attributable to members from:
> continuing operations 72,149 36,991 69,592 31,015
Total 72,149 36,991 69,592 31,015
The above income statement should be read in conjunction with the accompanying notes.
Income statementFOR THE YEAR ENDED 31 DECEMBER 2016

FINANCIAL STATEMENTS: UTS
6 UTS ANNUAL REPORT 2016
Statement of comprehensive incomeFOR THE YEAR ENDED 31 DECEMBER 2016
Economic entity (Consolidated)
Parent entity (University)
Notes 2016$’000
2015$’000
2016$’000
2015$’000
Net result after income tax for the period 72,149 36,991 69,592 31,015
Items that may be reclassified to profit or loss
Exchange differences on translation of foreign operations 22 (b) (36) 91 – –
Gain/(loss) on revaluation of available for sale financial assets, net of tax 22 (b) 1,829 4,345 1,829 4,345
Cash flow hedges, net of tax 22 (b) 2,352 1,337 2,352 1,337
Total items that may be reclassified to profit or loss 4,145 5,773 4,181 5,682
Items that will not be reclassified to profit or loss
Gain/(loss) on revaluation of property, plant and equipment, net of tax 22 (b) 123,407 38,015 123,407 38,015
Net actuarial gains/(losses) recognised in respect of defined benefit plans 25 (182) (1,008) (182) (1,008)
Total items that will not be reclassified to profit or loss 123,225 37,007 123,225 37,007
Total comprehensive income attributable to members of the University of Technology Sydney 199,519 79,771 196,998 73,704
Total comprehensive income attributable to members from:
> continuing operations 199,519 79,771 196,998 73,704
Total 199,519 79,771 196,998 73,704
The above statement of comprehensive income should be read in conjunction with the accompanying notes.

FINANCIAL STATEMENTS: UTS
UTS ANNUAL REPORT 2016 7
Statement of financial positionAS AT 31 DECEMBER 2016
Economic entity (Consolidated)
Parent entity (University)
Notes 2016$’000
2015$’000
2016$’000
2015$’000
Assets
Current assets
Cash and cash equivalents 9 190,197 190,567 114,475 116,336
Receivables 10 23,059 19,452 21,767 17,423
Other financial assets 11 12,238 11,442 12,238 11,442
Other non-financial assets 12 20,493 17,723 15,220 13,195
Non-current assets classified as held for sale 13 – – – –
Total current assets 245,987 239,184 163,700 158,396
Non-current assets
Receivables 10 601,629 617,375 601,629 617,375
Investments accounted for using the equity method 14 5,198 9,322 – –
Other financial assets 11 11,796 9,933 15,719 13,772
Other non-financial assets 12 7,618 570 7,618 570
Property, plant and equipment 15 1,872,600 1,704,829 1,854,457 1,695,096
Intangible assets 16 27,371 28,321 23,844 24,146
Total non-current assets 2,526,212 2,370,350 2,503,267 2,350,959
Total assets 2,772,199 2,609,534 2,666,967 2,509,355
Liabilities
Current liabilities
Trade and other payables 17 55,778 55,051 53,680 49,352
Borrowings 18 4,296 43,822 4,296 43,812
Provisions 19 101,106 95,807 97,546 92,760
Other financial liabilities 20 2,985 2,648 2,985 2,648
Other liabilities 21 54,235 46,444 25,028 19,175
Total current liabilities 218,400 243,772 183,535 207,747
Non-current liabilities
Borrowings 18 204,363 203,813 204,363 203,813
Provisions 19 630,139 639,251 624,067 636,871
Other financial liabilities 20 2,148 5,068 2,148 5,068
Total non-current liabilities 836,650 848,132 830,578 845,752
Total liabilities 1,055,050 1,091,904 1,014,113 1,053,499
Net assets 1,717,149 1,517,630 1,652,854 1,455,856
Equity
Parent entity interest
Reserves 22 (a) 758,973 631,421 759,653 632,065
Retained earnings 22 (d) 958,176 886,209 893,201 823,791
Total equity 1,717,149 1,517,630 1,652,854 1,455,856
The above statement of financial position should be read in conjunction with the accompanying notes.
FINANCIAL STATEMENTS: UTS
8 UTS ANNUAL REPORT 2016
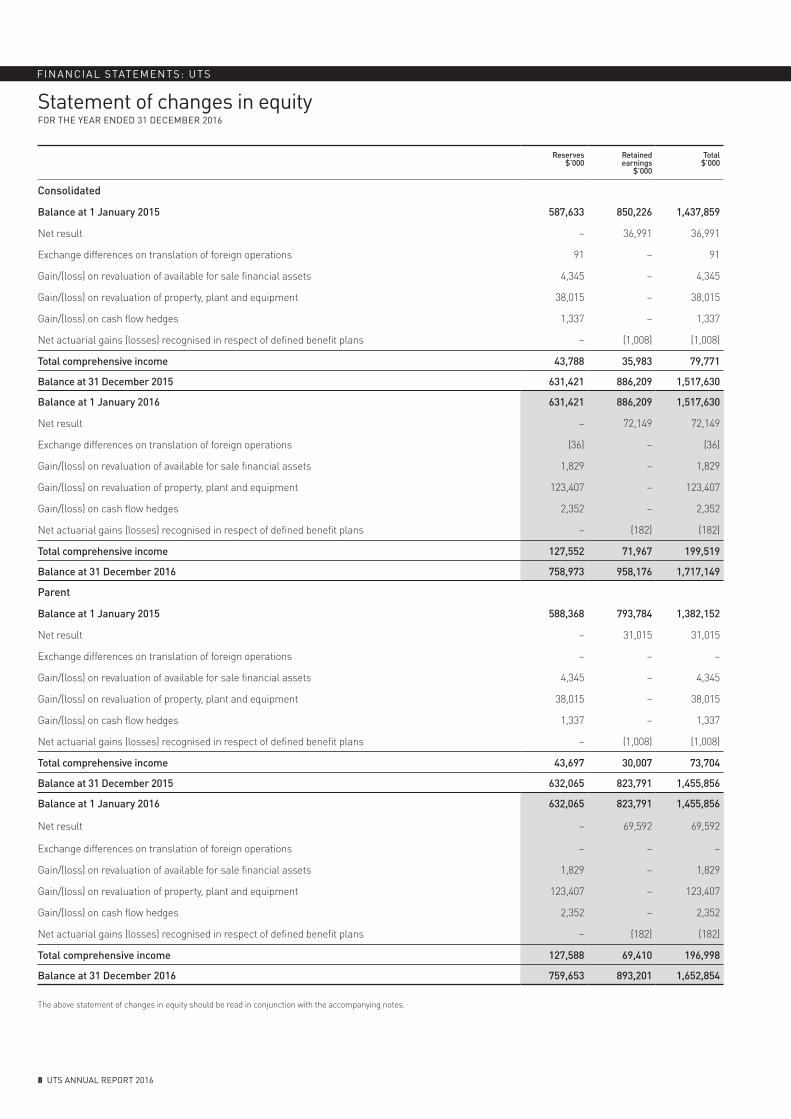
Statement of changes in equityFOR THE YEAR ENDED 31 DECEMBER 2016
Reserves $’000
Retained earnings
$’000
Total $’000
Consolidated
Balance at 1 January 2015 587,633 850,226 1,437,859
Net result – 36,991 36,991
Exchange differences on translation of foreign operations 91 – 91
Gain/(loss) on revaluation of available for sale financial assets 4,345 – 4,345
Gain/(loss) on revaluation of property, plant and equipment 38,015 – 38,015
Gain/(loss) on cash flow hedges 1,337 – 1,337
Net actuarial gains (losses) recognised in respect of defined benefit plans – (1,008) (1,008)
Total comprehensive income 43,788 35,983 79,771
Balance at 31 December 2015 631,421 886,209 1,517,630
Balance at 1 January 2016 631,421 886,209 1,517,630
Net result – 72,149 72,149
Exchange differences on translation of foreign operations (36) – (36)
Gain/(loss) on revaluation of available for sale financial assets 1,829 – 1,829
Gain/(loss) on revaluation of property, plant and equipment 123,407 – 123,407
Gain/(loss) on cash flow hedges 2,352 – 2,352
Net actuarial gains (losses) recognised in respect of defined benefit plans – (182) (182)
Total comprehensive income 127,552 71,967 199,519
Balance at 31 December 2016 758,973 958,176 1,717,149
Parent
Balance at 1 January 2015 588,368 793,784 1,382,152
Net result – 31,015 31,015
Exchange differences on translation of foreign operations – – –
Gain/(loss) on revaluation of available for sale financial assets 4,345 – 4,345
Gain/(loss) on revaluation of property, plant and equipment 38,015 – 38,015
Gain/(loss) on cash flow hedges 1,337 – 1,337
Net actuarial gains (losses) recognised in respect of defined benefit plans – (1,008) (1,008)
Total comprehensive income 43,697 30,007 73,704
Balance at 31 December 2015 632,065 823,791 1,455,856
Balance at 1 January 2016 632,065 823,791 1,455,856
Net result – 69,592 69,592
Exchange differences on translation of foreign operations – – –
Gain/(loss) on revaluation of available for sale financial assets 1,829 – 1,829
Gain/(loss) on revaluation of property, plant and equipment 123,407 – 123,407
Gain/(loss) on cash flow hedges 2,352 – 2,352
Net actuarial gains (losses) recognised in respect of defined benefit plans – (182) (182)
Total comprehensive income 127,588 69,410 196,998
Balance at 31 December 2016 759,653 893,201 1,652,854
The above statement of changes in equity should be read in conjunction with the accompanying notes.
FINANCIAL STATEMENTS: UTS
UTS ANNUAL REPORT 2016 9
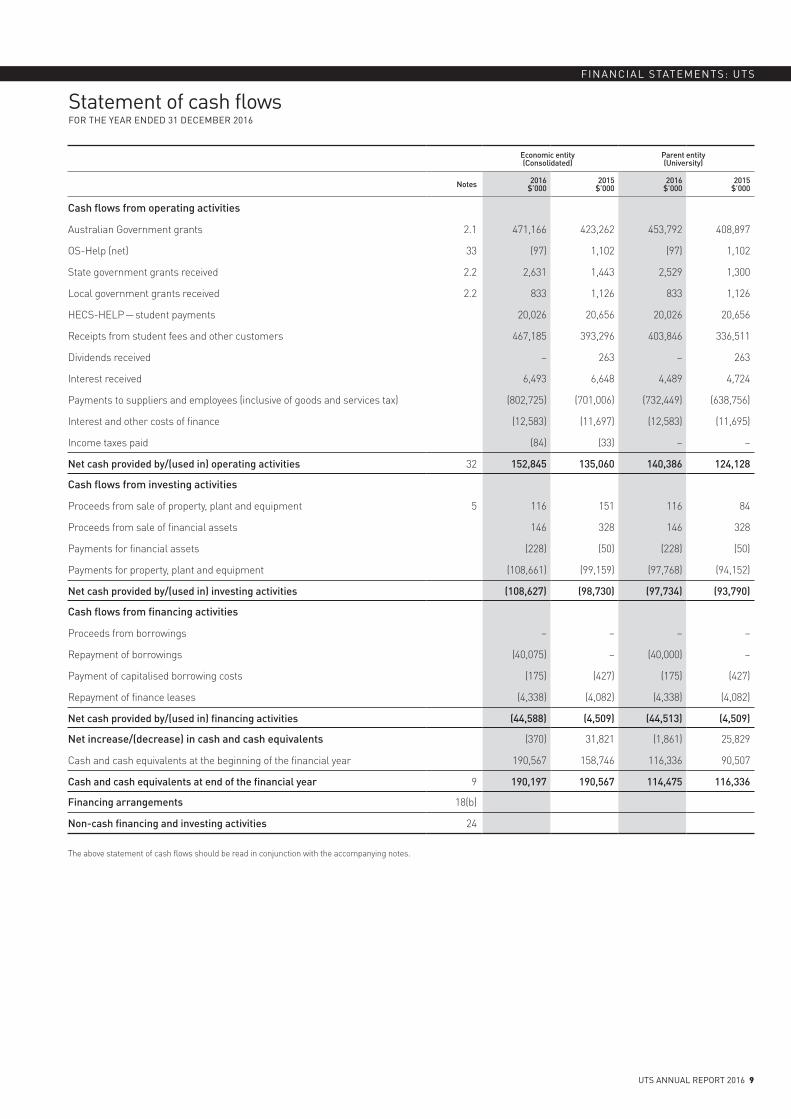
Statement of cash flowsFOR THE YEAR ENDED 31 DECEMBER 2016
Economic entity (Consolidated)
Parent entity (University)
Notes 2016$’000
2015$’000
2016$’000
2015$’000
Cash flows from operating activities
Australian Government grants 2.1 471,166 423,262 453,792 408,897
OS-Help (net) 33 (97) 1,102 (97) 1,102
State government grants received 2.2 2,631 1,443 2,529 1,300
Local government grants received 2.2 833 1,126 833 1,126
HECS-HELP — student payments 20,026 20,656 20,026 20,656
Receipts from student fees and other customers 467,185 393,296 403,846 336,511
Dividends received – 263 – 263
Interest received 6,493 6,648 4,489 4,724
Payments to suppliers and employees (inclusive of goods and services tax) (802,725) (701,006) (732,449) (638,756)
Interest and other costs of finance (12,583) (11,697) (12,583) (11,695)
Income taxes paid (84) (33) – –
Net cash provided by/(used in) operating activities 32 152,845 135,060 140,386 124,128
Cash flows from investing activities
Proceeds from sale of property, plant and equipment 5 116 151 116 84
Proceeds from sale of financial assets 146 328 146 328
Payments for financial assets (228) (50) (228) (50)
Payments for property, plant and equipment (108,661) (99,159) (97,768) (94,152)
Net cash provided by/(used in) investing activities (108,627) (98,730) (97,734) (93,790)
Cash flows from financing activities
Proceeds from borrowings – – – –
Repayment of borrowings (40,075) – (40,000) –
Payment of capitalised borrowing costs (175) (427) (175) (427)
Repayment of finance leases (4,338) (4,082) (4,338) (4,082)
Net cash provided by/(used in) financing activities (44,588) (4,509) (44,513) (4,509)
Net increase/(decrease) in cash and cash equivalents (370) 31,821 (1,861) 25,829
Cash and cash equivalents at the beginning of the financial year 190,567 158,746 116,336 90,507
Cash and cash equivalents at end of the financial year 9 190,197 190,567 114,475 116,336
Financing arrangements 18(b)
Non-cash financing and investing activities 24
The above statement of cash flows should be read in conjunction with the accompanying notes.
Notes to the financial statementsFOR THE YEAR ENDED 31 DECEMBER 2016
FINANCIAL STATEMENTS: UTS
10 UTS ANNUAL REPORT 2016
1. SUMMARY OF SIGNIFICANT ACCOUNTING POLICIESThe principal accounting policies adopted in the preparation of the financial statements are set out below. These policies have been consistently applied by all entities to all the years presented, unless otherwise stated. The financial statements include separate financial statements for the University of Technology Sydney as an individual entity and the consolidated entity consisting of the University of Technology Sydney and its subsidiaries.
The principal address of the University of Technology Sydney is 15 Broadway, Broadway NSW 2007.
The financial statements were authorised for issue by the Council of the University of Technology Sydney on 12 April 2017.
(a) Basis of preparationThese general purpose financial statements have been prepared in accordance with the requirements of:
> the Australian Accounting Standards including the Australian equivalents to the International Financial Reporting Standards (AIFRS)
> other authoritative pronouncements of the Australian Accounting Standards Board (AASB) and AASB Interpretations
> the Financial Statements Guidelines for Australian Higher Education Providers for the 2016 Reporting Period issued by the Commonwealth Department of Education
> the Public Finance and Audit Act 1983 and the Public Finance and Audit Regulation 2016
> the Higher Education Support Act 2003.
These financial statements have been prepared on an accrual accounting and going concern basis and under the historical cost convention, modified by the revaluation at fair value of land and buildings, financial assets, derivative instruments and certain classes of plant and equipment.
Compliance with International Financial Reporting Standards
Australian Accounting Standards include Australian equivalents to the International Financial Reporting Standards (AIFRS) but also include some requirements specific to not-for-profit entities that are inconsistent with IFRS requirements. The financial statements and notes of the University of Technology Sydney comply with the Australian Accounting Standards as they apply to not-for-profit entities and hence are inconsistent with IFRS requirements in some instances.
Critical accounting estimates
The preparation of financial statements in conformity with the Australian equivalents to IFRS requires the use of certain critical accounting estimates. It also requires management to exercise its judgement in the process of applying the University of Technology Sydney’s accounting policies. The areas involving a higher degree of judgement or complexity, or areas where assumptions and estimates are significant to the financial statements, are the calculation of the defined superannuation benefits, land, buildings and building infrastructure, long service leave, annual leave and doubtful debt provisions.
Land, buildings and infrastructure have been valued based on fair value assessments by Colliers International having regard to the highest and best use of the assets as well as the fair value hierarchy within the standard. For properties that are non-specialised, quoted unadjusted prices for identical assets in active markets have been used. For all other properties, land values are based on market value which is adjusted for condition, location and use if applicable. The added fair value of the buildings upon the land are calculated having regard to the depreciated replacement cost approach which in turn is compared with observable market evidence adjusted for differences in condition.
Annual leave and long service leave provisions have been valued based on actuarial assessments conducted by Deloitte Actuaries & Consultants Limited. The major assumptions relate to future salary increases and the applicable discount rate. Future salary increases are based on the current Senior Staff Agreement, the UTS Academic Staff Agreement 2014 and the UTS Professional Staff Agreement 2014. The discount rates used is based on yields reported by the Reserve Bank of Australia on zero-coupon Australian Government bonds. The estimates and underlying assumptions are reviewed on an ongoing basis. The unfunded superannuation liabilities recorded in the statement of financial position under provisions have been determined by the fund’s actuary (refer note 25). The projected unit credit valuation method was used to determine the present value of the defined benefit obligations and the related current service costs. Actuarial gains and losses are recognised immediately in the statement of comprehensive income in the year in which they occur.
(b) Basis of consolidation
(i) Subsidiaries
The financial statements are for the University of Technology Sydney consolidated reporting entity consisting of:
> University of Technology Sydney
> Insearch Limited, a controlled entity of the university
> Insearch Shanghai Limited, a controlled entity of Insearch Limited
> Insearch Education International Pty Limited, a controlled entity of Insearch Limited
> accessUTS Pty Ltd, a controlled entity of the university
> Piivot Pty Ltd, a controlled entity of the university
> UTS Global Pty Ltd, a controlled entity of the university
> UTS Beijing Ltd, a controlled entity of UTS Global Pty Ltd.
The accounting policies adopted in preparing the financial statements have been consistently applied by entities in the consolidated entity except as otherwise indicated. The balances, and effects of transactions, between controlled entities included in the consolidated financial statements have been eliminated. Separate financial statements are prepared for the same period by the university’s controlled entities, which are audited by the Auditor General of New South Wales.
Power over the investee exists when the group has existing rights that give it current ability to direct the relevant activities of the investee. The existence and effect of potential voting rights that are currently exercisable or convertible are considered when assessing whether the group controls another entity. Returns are not necessarily monetary and can be only positive, only negative, or both positive and negative.

Notes to the financial statementsFOR THE YEAR ENDED 31 DECEMBER 2016
UTS ANNUAL REPORT 2016 11
FINANCIAL STATEMENTS: UTS
(c) Foreign currency translation
(i) Functional and presentation currency
Items included in the financial statements of each of the group’s entities are measured using the currency of the primary economic environment in which the entity operates (‘the functional currency’). The consolidated financial statements are presented in Australian dollars, which is the University of Technology Sydney’s functional and presentation currency.
(ii) Transactions and balances
Foreign currency transactions are initially translated into Australian currency at the rate of exchange current at the date of transaction. At balance date, amounts payable and receivable in foreign currencies are translated to Australian currency at rates current at balance date. Resulting exchange differences are brought to account in determining the profit or loss for the year.
(iii) Group companies
The results and financial position of all the group entities (none of which has the currency of a hyperinflationary economy) that have a functional currency different from the presentation currency are translated into the presentation currency as follows:
> assets and liabilities for each balance sheet presented are translated at the closing rate at the date of that balance sheet
> income and expenses for each income statement are translated at average exchange rates (unless this is not a reasonable approximation of the cumulative effect of the rates prevailing on the transaction dates, in which case income and expenses are translated at the dates of the transactions), and
> all resulting exchange differences are recognised as a separate component of equity.
(d) Revenue recognition In accordance with AASB1004 Contributions, the operating and research grants provided by the government under the Higher Education Support Act 2003 are considered to be contributions of assets, or non-reciprocal transfers, and are therefore recognised in the year in which they are received. Payments from the Higher Education Trust Fund are considered to be revenue arising from the provision of a service and so have been treated as income in advance where they relate to the next reporting period.
Revenue from student fees is recognised for enrolments current as at the census date for each semester.
Investment income is recognised as it accrues.
Revenue from sales or the provision of services is recognised in the period in which the goods are supplied or the services provided.
Donations are accounted for on a cash basis.
(e) Income tax The parent entity, the University of Technology Sydney, is exempt from income tax under section 50-1 of the Income Tax Assessment Act 1997.
For the tax paying entities of the group, the income tax expense on revenue for the period is the tax payable on the current period’s taxable income based on the national income tax rate for each jurisdiction adjusted by changes in deferred tax assets and liabilities and their carrying amounts in the financial statements and to unused tax losses.
Deferred tax assets and liabilities are recognised for temporary differences at the tax rates expected to apply when the assets are recovered or liabilities are settled, based on those tax rates which are enacted or substantively enacted for each jurisdiction.
Deferred tax assets are recognised for deductible temporary differences and unused tax losses only if it is probable that future taxable amounts will be available to utilise those temporary differences and losses.
(f) Leases The university leases a range of assets and accounts for these as either operating or finance leases in accordance with the requirements of AASB117 Leases.
Finance leases, which transfer to the group substantially all the risks and benefits incidental to ownership of the leased item, are capitalised at the inception of the lease at the present value of the minimum lease payments. The corresponding rental obligations, net of finance charges, are included in other short-term and long-term payables. Each lease payment is allocated between the liability and finance cost. The finance cost is charged to the income statement over the lease period so as to produce a constant periodic rate of interest on the remaining balance of the liability for each period. The property, plant and equipment acquired under finance leases are depreciated over the shorter of the asset’s useful life and the lease term.
Payments made under operating leases (net of any incentives received from the lessor) are recognised as an expense in the income statement on a straight-line basis over the period of the lease.
Lease income from operating leases is recognised in income on a straight-line basis over the lease term.
Operating lease commitments are recorded on a GST inclusive basis. Finance leases are recorded on a GST exclusive basis.
Details of leased assets are provided in note 23.
The IASB issued IFRS 16 Leases with an effective date of 1 January 2019. Early adoption will be permitted for entities that also adopt IFRS 15 Revenue from Contracts with Customers. Management has not yet assessed the impact of IFRS 16.
(g) Business combinationsThe acquisition method of accounting is used to account for all business combinations, including business combinations involving entities or businesses under common control, regardless of whether equity instruments or other assets are acquired. Cost is measured as the fair value of the assets given, equity instruments issued or liabilities incurred or assumed at the date of exchange plus costs directly attributable to the acquisition.
Identifiable assets acquired and liabilities and contingent liabilities assumed in a business combination are measured initially at their fair values at the acquisition date, irrespective of the extent of any minority interest. The excess of the cost of acquisition over the fair value of the group’s share of the identifiable net assets acquired is recorded as goodwill. If the cost of acquisition is less than the fair value of the identifiable net assets of the subsidiary acquired, the difference is recognised directly in the income statement, but only after a reassessment of the identification and measurement of the net assets acquired.
Notes to the financial statementsFOR THE YEAR ENDED 31 DECEMBER 2016
FINANCIAL STATEMENTS: UTS
12 UTS ANNUAL REPORT 2016
1. SUMMARY OF SIGNIFICANT ACCOUNTING POLICIES (CONTINUED)(h) Impairment of assets
Assets that have an infinite useful life are not subject to amortisation and are tested annually for impairment. Assets that are subject to amortisation are reviewed for impairment whenever events or changes in circumstances indicate that the carrying amount may not be recoverable. An impairment loss is recognised for the amount by which the asset’s carrying amount exceeds its recoverable amount. The recoverable amount is the higher of an asset’s fair value less costs to sell and value in use.
(i) Cash and cash equivalentsCash and cash equivalents includes cash on hand, cash at banks, term deposits and deposits at call.
(j) Receivables Trade receivables, which generally have 30 day terms, are recognised and carried at original invoice amount less provision for impairment.
Non-current receivables are recognised at fair value.
Collectability of trade receivables is reviewed on an ongoing basis. An estimate for doubtful debts is made when collection of the full amount is no longer probable. Debts that are known to be uncollectible are written off to the income statement.
(k) Inventories The university holds no inventory.
(l) Non-current assets held for saleNon-current assets are classified as held for sale if their carrying amount will be recovered principally through a sale transaction rather than through continuing use. They are stated at the lower of their carrying amount and fair value less costs to sell.
Non-current assets are not depreciated or amortised while they are classified as held for sale. Interest and other expenses attributable to the holding of assets classified as held for sale continue to be recognised.
(m) Investments and other financial assets The group classifies its investments in the following categories:
(i) Financial assets at fair value through profit or loss
The group’s investments in managed funds are classified as financial assets at fair value through profit or loss. The policy of management is to designate a financial asset if there exists the possibility it will be sold in the short term and the asset is subject to frequent changes in fair value. These assets are initially recognised at cost, being the fair value of the consideration given. They are subsequently recognised at fair value and gains or losses are recognised in the income statement.
(ii) Available-for-sale financial assetsInvestments in listed securities have been classified as available-for-sale financial assets. These assets are initially recognised at cost including the acquisition charges associated with the investment, being the fair value of the consideration given. Available-for-sale financial assets are subject to review for impairment. Gains or losses on available-for-sale investments are recognised in equity until the investment is sold or until the investment is determined to be impaired, at which time the cumulative gain or loss previously reported in equity is included in the income statement.
(iii) Other financial assets
Equity instruments that are not quoted in an active market have been classified as other financial assets and have been recognised at cost less impairment.
(n) DerivativesDerivatives are initially recognised at fair value on the date a derivative contract is entered into and are subsequently remeasured to their fair value at each reporting date. The method of recognising the resulting gain or loss depends on whether the derivative is designated as a hedging instrument, and, if so, the nature of the item being hedged. The group designates derivatives as hedges of highly probable forecast transactions (cash flow hedges).
(i) Cash flow hedge
The effective portion of changes in the fair value of derivatives that are designated and qualify as cash flow hedges is recognised in other comprehensive income. The gain or loss relating to the ineffective portion is recognised immediately in the income statement within other income or other expense.
The gain or loss relating to the effective portion of interest rate swaps hedging variable rate borrowings is recognised in the balance sheet under property, plant and equipment as per the capitalisation election under AASB 123 Borrowing Costs.
When a hedging instrument expires or is sold or terminated, or when a hedge no longer meets the criteria for hedge accounting, any cumulative gain or loss that has been recognised in other comprehensive income from the period when the hedge was effective shall remain separately in equity until the forecast transaction occurs. When a forecast transaction is no longer expected to occur, the cumulative gain or loss that was recognised in other comprehensive income shall be reclassified to profit or loss as a reclassification adjustment.
Details of the derivatives held by the group are disclosed in note 34.
(o) Fair value measurementThe fair value of financial assets and financial liabilities must be estimated for recognition and measurement or for disclosure purposes.
The group classifies fair value measurements using a fair value hierarchy that reflects the significance of the inputs used in making the measurements.
The fair value of assets and liabilities traded in active markets, such as financial instruments traded in active markets, is based on quoted market prices at the balance sheet date (level 1).

Notes to the financial statementsFOR THE YEAR ENDED 31 DECEMBER 2016
UTS ANNUAL REPORT 2016 13
FINANCIAL STATEMENTS: UTS
(o) Fair value measurement (continued)The fair value of assets or liabilities that are not traded in an active market (for example, defined benefit superannuation liabilities) is determined using valuation techniques. The group uses a variety of methods and makes assumptions that are based on market conditions existing at each balance date (level 2). Fair value measurement of non-financial assets is based on the highest and best use of the asset. The group considers market participants use of, or purchase price of the asset, to use it in a manner that would be highest and best use. The nominal value less estimated credit adjustments of trade receivables and payables are assumed to approximate their fair values. The value of long-term debt instruments has been calculated using the amortised cost method.
Other techniques that are not based on observable market data (level 3), such as estimated discounted cash flows or cost, are used to determine fair value for the remaining assets and liabilities.
(p) Property, plant and equipment
(i) Initial recognition and measurement
Assets with a useful life of more than 12 months and an acquisition cost of more than $5000 are initially capitalised at cost. Costs incurred on plant and equipment which do not meet the capitalisation criteria are expensed as incurred. Following initial recognition at cost, land, buildings and works of art are carried at fair value. Fair value is the amount for which the assets could be exchanged between a knowledgeable willing buyer and a knowledgeable willing seller in an arm’s length transaction at the date of revaluation less any subsequent accumulated depreciation on buildings.
The library collection is recorded at depreciated replacement cost.
All other property, plant and equipment is stated at historical cost less depreciation. Historical cost includes expenditure that is directly attributable to the acquisition of the items.
Subsequent costs are included in the asset’s carrying amount or recognised as a separate asset as appropriate, only when it is probable that future economic benefits associated with the item will flow to the group and the cost of the item can be measured reliably. All other repairs and maintenance costs are charged to the income statement during the financial period in which they are incurred.
(ii) Revaluations
Independent valuations are performed with sufficient regularity or once every three years to ensure that the carrying amount does not differ materially from the asset’s fair value at the balance date.
Revaluation surpluses have been credited to the asset revaluation reserve included in the equity section of the statement of financial position.
(iii) Depreciation
Land and works of art are not depreciated. Depreciation on other assets is calculated using the straight line method to allocate their cost or revalued amounts, net of their residual values, over their estimated useful lives, as follows:
Asset class Depreciation rate (%) Depreciation method
Buildings 2.00 Straight lineBuilding infrastructure 4.00 Straight lineElectrical installations 4.00 Straight lineSuspended ceilings 5.00 Straight lineCarpet and carpet tiles 6.67 Straight lineMotor vehicles 20.00 Straight lineComputer hardware 20.00 Straight lineComputer software — minor 33.33 Straight lineComputer software — major 14.30 Straight lineOffice, teaching and research equipment 10 to 25 Straight lineLibrary collection 12.50 Straight line, 5% residual
The assets’ residual values and useful lives are reviewed, and adjusted if appropriate, at each balance sheet date.
(iv) Leasehold improvements
Leasehold improvements are capitalised and amortised over the shorter of their useful life or the remaining life of the lease.
(v) Impairment
Property, plant and equipment assets are reviewed for impairment whenever events or changes in circumstances indicate that the carrying amount may not be recoverable.
(vi) Disposals
Gains and losses on disposals are determined by comparing proceeds with carrying amount. These are included in the income statement.
(q) Intangible assets
(i) Research and development
In accordance with the requirements of AASB 138 Intangible Assets, no intangible asset arising from research is recognised. Expenditure on research activities is recognised in the income statement as an expense when it is incurred.
The group has not incurred expenditure on development activities that meets the capitalisation criteria under AASB 138 Intangible Assets and hence has not recognised any intangible assets arising from development projects.
Notes to the financial statementsFOR THE YEAR ENDED 31 DECEMBER 2016
FINANCIAL STATEMENTS: UTS
14 UTS ANNUAL REPORT 2016
1. SUMMARY OF SIGNIFICANT ACCOUNTING POLICIES (CONTINUED)(ii) Software
Software, where the software is not an integral part of the related hardware, is classified as an intangible asset with a finite life. Amortisation is charged on a straight line basis at the rate of 14.30 per cent per annum.
(iii) Perpetual licences for online serials
The consolidated entity has purchased a number of licences that provide access to online serials in perpetuity. These assets are not subject to amortisation as they have an indefinite useful life but are tested annually for impairment.
(r) Unfunded superannuation In accordance with the 1998 instructions issued by the Department of Education, Training and Youth Affairs (DETYA), now known as the Department of Education, the effects of the unfunded superannuation liabilities of the group were recorded in the income statement and the balance sheet for the first time in 1998. The previous practice had been to disclose these liabilities by way of a note to the financial statements.
The unfunded liabilities recorded in the statement of financial position under provisions have been determined by the fund’s actuary (refer note 25). The projected unit credit valuation method was used to determine the present value of the defined benefit obligations and the related current service costs. Actuarial gains and losses are recognised immediately in the statement of comprehensive income in the year in which they occur.
An arrangement exists between the Australian Government and the New South Wales Government to meet the unfunded liability for the group’s beneficiaries of the State Superannuation Scheme on an emerging cost basis. This arrangement is evidenced by the Higher Education Funding Act 1988, the Higher Education Support Act 2003 (Cwlth) and a memorandum of understanding signed by the federal government and the New South Wales Government on 5 December 2014. Accordingly the unfunded liabilities have been recognised in the statement of financial position under provisions with a corresponding asset recognised under receivables. The recognition of both the asset and the liability consequently does not materially affect the year end net asset position of the group.
(s) Trade and other payables Accounts payable, including accruals, represent liabilities for goods and services provided to the economic entity prior to the end of the 2016 reporting period. These amounts are usually settled on 30 day terms.
(t) Borrowings Borrowings are initially recognised at fair value, net of transaction costs incurred. Borrowings are subsequently measured at amortised cost using the effective interest method. Gains and losses are recognised in the income statement through the amortisation process.
Borrowings are classified as current liabilities unless the group has an unconditional right to defer settlement of the liability and does not expect to settle the liability for at least 12 months after the balance sheet date.
The university has obtained a $300 million revolving five-year debt facility ending in March 2018 to fund the current capital expenditure program. As at 31 December 2016 funds to the value of $200 million have been drawn down from this facility by the university.
(u) Borrowing costsBorrowing costs except those incurred for the construction of any qualifying asset are expensed as per AASB 123 Borrowing Costs. Borrowing costs incurred for the construction of any qualifying assets are capitalised as per AASB 123 Borrowing Costs. For immaterial prepaid borrowing costs relating to qualifying assets, the university amortises the expense on a straight line basis, which is a departure from the standard. The amounts are regarded as immaterial and does not affect the operating result over the term of the loan. Finance charges in respect of finance leases are included in the definition of borrowing costs.
(v) ProvisionsProvisions are recognised when the group has a present legal or constructive obligation as a result of past events; that is, when it is more likely than not that an outflow of resources will be required to settle the obligation and the amount can be reliably estimated.
If the effect of the time value of money is material, provisions are determined by discounting the expected future cash flows at the Australian Government bond rate.
(w) Employee benefits
(i) Wages, salaries and sick leave
Liabilities for wages and salaries, including non-monetary benefits, expected to be settled within 12 months of the reporting date are recognised in other payables and provisions in respect of employees’ services up to the reporting date. They are measured at the amounts expected to be paid when the liabilities are settled. Sick leave is included in salaries and wages when the sick leave is taken.
(ii) Long service leave and annual leave
The liability for long service leave and annual leave is calculated on a present value basis. This is done using the total nominal value, including on costs and allowing for known pay increases, of all leave accrued but not taken, including pre-conditional leave. This figure is then adjusted according to the staff profile and a factor designed to compensate for inflation and wage increases. Expected future payments are discounted using market yields at the reporting date on national government bonds. The group records long service leave and annual leave as a current liability when all conditions for settlement are met.
Regardless of the expected timing of settlements, provisions made in respect of employee benefits are classified as a current liability, unless there is an unconditional right to defer the settlement of the liability for at least 12 months after the reporting date, in which case it would be classified as a non-current liability.
The university in 2016 engaged Deloitte to conduct an actuarial assessment of the long service leave provision and annual leave provision to satisfy the requirements of AASB 119 Employee Benefits. The actuarial assessment for long service leave and annual leave updated the previous assessment conducted in 2015 by Deloitte.
Notes to the financial statementsFOR THE YEAR ENDED 31 DECEMBER 2016
UTS ANNUAL REPORT 2016 15
FINANCIAL STATEMENTS: UTS
(iii) Superannuation
Employees of the group are entitled to benefits on retirement, disability or death from the group’s superannuation plans. The group has both defined contribution plans and defined benefit plans. The defined benefit plans provide employees with defined benefits based on years of service and final average salary.
Contributions to the superannuation funds are recognised in the income statement as an expense as they become payable.
The liability or asset in respect of the defined benefit plans is measured as the present value of the defined benefit obligation at the reporting date plus unrecognised actuarial gains (less unrecognised actuarial losses) less the fair value of the superannuation fund’s assets at that date and any unrecognised past service cost. The present value of the defined benefit obligation is based on expected future payments which arise from membership of the fund to the reporting date, calculated annually by independent actuaries. Consideration is given to expected future salary levels, experience of employee departures and periods of service.
Remeasurement gains and losses arising from experience adjustments and changes in actuarial assumptions are recognised in the period in which they occur, directly in other comprehensive income. They are included in retained earnings in the statement of changes in equity and in the balance sheet. Past service costs are recognised in income immediately. Contributions to the defined contribution section of the university’s superannuation fund and other independent defined contribution superannuation funds are recognised as an expense as they become payable.
A liability or asset in respect of the defined benefit superannuation plan for UniSuper has not been recognised in the statement of financial position based on advice from UniSuper that the defined benefit plan is a contribution fund for the purposes of AASB119 due to the amendment of the trust deed during 2006 (clause 34 of the UniSuper Trust Deed). The plan has been classified as a contribution plan in the parent entity’s accounts.
(iv) Termination benefits
Termination benefits are payable when employment is terminated before the normal retirement date, or when an employee accepts voluntary redundancy in exchange for those benefits. The group recognises termination benefits when it is demonstrably committed to either terminating the employment of current employees according to a detailed formal plan without possibility of withdrawal or providing termination benefits as a result of an offer made to encourage voluntary redundancy.
(x) Joint venturesFor the consolidated entity financial statements, the interest in jointly controlled entities are accounted for using the equity method. Under this method, the share of the profits or losses of the joint venture is recognised in the income statement. In addition the share of movements in reserves are recognised in the statement of comprehensive income and the statement of changes in equity. Details of joint ventures are set out in note 14.
(y) Associates Associates are all entities over which the group has significant influence but not control, generally accompanying a shareholding of between 20 per cent and 50 per cent of the voting rights. Investments in associates are accounted for in the parent entity financial statements using the cost method and in the consolidated financial statements using the equity method of accounting, after initially being recognised at cost.
The group’s share of its associates’ post acquisition profits or losses is recognised in the income statement, and its share of post acquisition movements in reserves is recognised in reserves. The cumulative post acquisition movements are adjusted against the carrying amount of the investment. Dividends receivable from associates are recognised in the parent entity’s income statement, while in the consolidated financial statements they reduce the carrying amount of the investment.
Gains or losses resulting from ‘upstream’ and ‘downstream’ transactions, involving assets that do not constitute a business, are recognised in the consolidated financial statements only to the extent of unrelated investors’ interests in the associate or joint venture. Gains or losses resulting from the contribution of non-monetary assets in exchange for an equity interest are accounted for in the same method.
When the group’s share of losses in an associate equals or exceeds its interest in the associate, including any other unsecured receivables, the group does not recognise further losses, unless it has incurred obligations or made payments on behalf of the associate.
(z) Goods and services tax Revenues, expenses and assets are recognised net of the amount of goods and services tax (GST), except where the amount of GST incurred is not recoverable from the Australian Taxation Office (ATO). In these circumstances the GST is recognised as part of the costs of acquisition of the asset or as part of an item of expense.
Receivables and payables are stated with the amount of GST included.
The net amount of GST recoverable from, or payable to, the ATO is included as a current asset or liability in the balance sheet.
The GST components of cash flows arising from investing and financing activities which are recoverable from, or payable to, the ATO are classified as operating cash flows.
(aa) Comparative amounts Where necessary, the classifications of 2016 comparative figures have been adjusted to conform with the mandatory presentation for the current year. These reclassifications have no effect on the 2015 operating result (or the financial position) of the university.
(ab) Financial guarantee contractsFinancial guarantee contracts are recognised as a financial liability at the time the guarantee is issued. The liability is initially measured at fair value and subsequently at the higher of the amount determined in accordance with AASB137 Provisions, Contingent Liabilities and Contingent Assets and the amount initially recognised less cumulative amortisation, where appropriate.
The fair value of financial guarantees is determined as the present value of the difference in net cash flows between the contractual payments under the debt instrument and the payments that would be required without the guarantee, or the estimated amount that would be payable to a third party for assuming the obligations.
Notes to the financial statementsFOR THE YEAR ENDED 31 DECEMBER 2016
FINANCIAL STATEMENTS: UTS
16 UTS ANNUAL REPORT 2016
1. SUMMARY OF SIGNIFICANT ACCOUNTING POLICIES (CONTINUED)(ac) New accounting standards and interpretations
Certain new accounting standards and interpretations have been published that are not mandatory for 31 December 2016 reporting period. The recently issued or amended standards are not expected to have a material impact on the university’s statutory accounts. The university has not exercised the right to early adopt any new or revised accounting standard.
(ad) Changes in accounting policy There have been no changes to accounting policy in the 2016 year apart from the adoption of certain mandatory standards.
(ae) Rounding of amountsAmounts in the financial statements where applicable have been rounded off to the nearest thousand dollars.
Economic entity(Consolidated)
Parent entity (University)
Notes 2016$’000
2015$’000
2016$’000
2015$’000
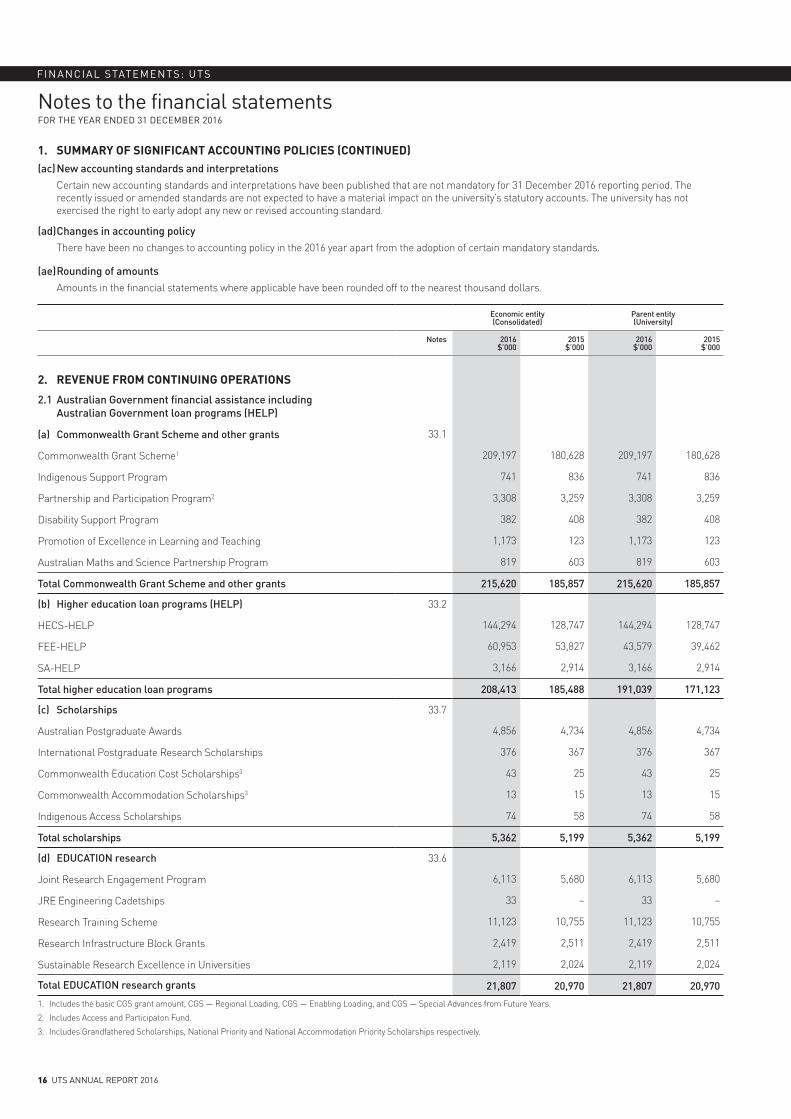
2. REVENUE FROM CONTINUING OPERATIONS
2.1 Australian Government financial assistance including Australian Government loan programs (HELP)
(a) Commonwealth Grant Scheme and other grants 33.1
Commonwealth Grant Scheme1 209,197 180,628 209,197 180,628
Indigenous Support Program 741 836 741 836
Partnership and Participation Program2 3,308 3,259 3,308 3,259
Disability Support Program 382 408 382 408
Promotion of Excellence in Learning and Teaching 1,173 123 1,173 123
Australian Maths and Science Partnership Program 819 603 819 603
Total Commonwealth Grant Scheme and other grants 215,620 185,857 215,620 185,857
(b) Higher education loan programs (HELP) 33.2
HECS-HELP 144,294 128,747 144,294 128,747
FEE-HELP 60,953 53,827 43,579 39,462
SA-HELP 3,166 2,914 3,166 2,914
Total higher education loan programs 208,413 185,488 191,039 171,123
(c) Scholarships 33.7
Australian Postgraduate Awards 4,856 4,734 4,856 4,734
International Postgraduate Research Scholarships 376 367 376 367
Commonwealth Education Cost Scholarships3 43 25 43 25
Commonwealth Accommodation Scholarships3 13 15 13 15
Indigenous Access Scholarships 74 58 74 58
Total scholarships 5,362 5,199 5,362 5,199
(d) EDUCATION research 33.6
Joint Research Engagement Program 6,113 5,680 6,113 5,680
JRE Engineering Cadetships 33 – 33 –
Research Training Scheme 11,123 10,755 11,123 10,755
Research Infrastructure Block Grants 2,419 2,511 2,419 2,511
Sustainable Research Excellence in Universities 2,119 2,024 2,119 2,024
Total EDUCATION research grants 21,807 20,970 21,807 20,970
1. Includes the basic CGS grant amount, CGS — Regional Loading, CGS — Enabling Loading, and CGS — Special Advances from Future Years.
2. Includes Access and Participaton Fund.
3. Includes Grandfathered Scholarships, National Priority and National Accommodation Priority Scholarships respectively.

Notes to the financial statementsFOR THE YEAR ENDED 31 DECEMBER 2016
UTS ANNUAL REPORT 2016 17
FINANCIAL STATEMENTS: UTS
Economic entity(Consolidated)
Parent entity (University)
Notes 2016$’000
2015$’000
2016$’000
2015$’000
2.1 Australian Government financial assistance including Australian Government loan programs (HELP) (continued)
(e) Australian Research Council 33.3
(i) Discovery
Project 5,749 5,335 5,749 5,335
Future Fellowships 1,966 2,589 1,966 2,589
Early Career Researcher Award 2,026 2,090 2,026 2,090
Indigenous 320 201 320 201
Total Discovery 10,061 10,215 10,061 10,215
(ii) Linkages 33.4
Projects 1,975 1,812 1,975 1,812
Infrastructure 240 442 240 442
Special research initiatives 13 13 13 13
Industrial Transformation Research Hubs 1,123 – 1,123 –
Total Linkages 3,351 2,267 3,351 2,267
(iii) Networks and centres 33.5
Centres 530 552 530 552
Total networks and centres 530 552 530 552
Total ARC 13,942 13,034 13,942 13,034
(f) Other Australian Government financial assistance
Non-capital
National Health and Medical Research Council 1,731 1,298 1,731 1,298
Department of Health and Ageing 1,494 2,107 1,494 2,107
ARENA 1,291 625 1,291 625
Department of Education 1,032 820 1,032 820
CSIRO 845 1,814 845 1,814
Department of Foreign Affairs and Trade 645 933 645 933
Department of the Prime Minister and Cabinet 568 279 568 279
Monash University 484 818 484 818
University of New South Wales 30 194 30 194
Other 2,942 4,220 2,942 4,220
Total non-capital other Australian Government financial assistance 11,062 13,108 11,062 13,108
Total Australian Government financial assistance 476,206 423,656 458,832 409,291
Reconciliation
Australian Government grants (a+c+d+e+f+g) 267,793 238,168 267,793 238,168
Higher education loan programs (b) 208,413 185,488 191,039 171,123
Total Australian Government financial assistance 476,206 423,656 458,832 409,291
Notes to the financial statementsFOR THE YEAR ENDED 31 DECEMBER 2016
FINANCIAL STATEMENTS: UTS
18 UTS ANNUAL REPORT 2016
Economic entity(Consolidated)
Parent entity (University)
Notes 2016$’000
2015$’000
2016$’000
2015$’000
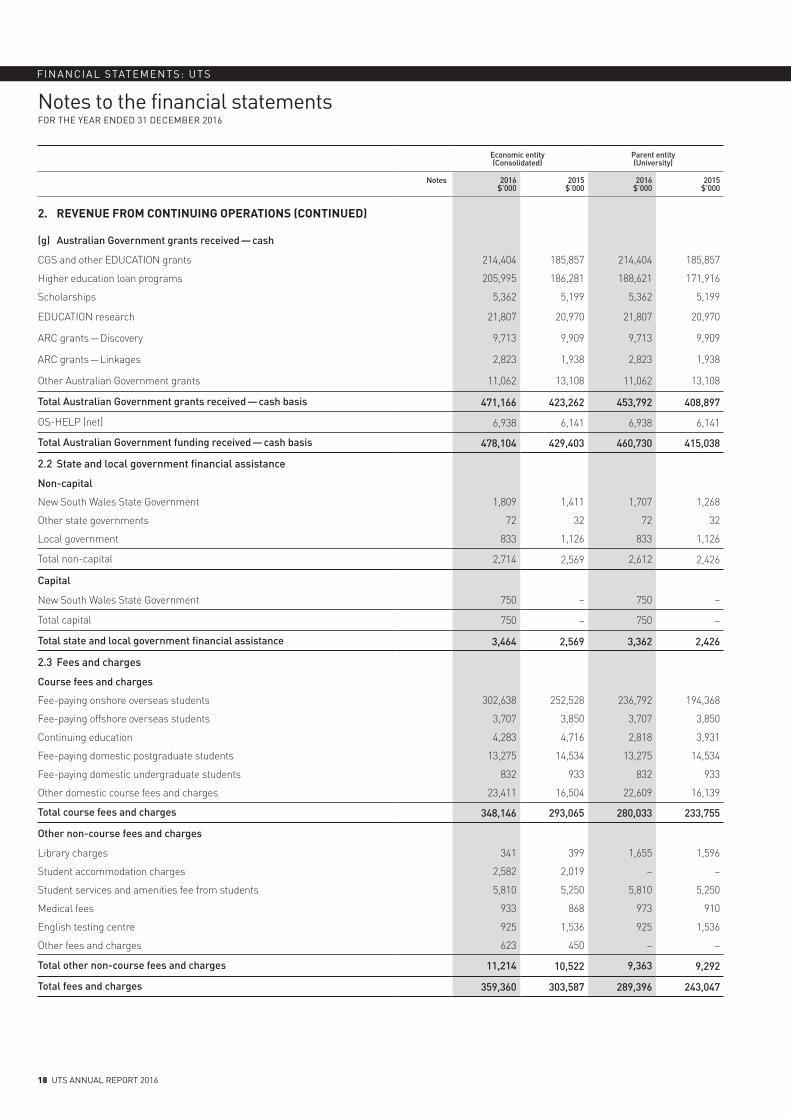
2. REVENUE FROM CONTINUING OPERATIONS (CONTINUED)
(g) Australian Government grants received — cash
CGS and other EDUCATION grants 214,404 185,857 214,404 185,857
Higher education loan programs 205,995 186,281 188,621 171,916
Scholarships 5,362 5,199 5,362 5,199
EDUCATION research 21,807 20,970 21,807 20,970
ARC grants — Discovery 9,713 9,909 9,713 9,909
ARC grants — Linkages 2,823 1,938 2,823 1,938
Other Australian Government grants 11,062 13,108 11,062 13,108
Total Australian Government grants received — cash basis 471,166 423,262 453,792 408,897
OS-HELP (net) 6,938 6,141 6,938 6,141
Total Australian Government funding received — cash basis 478,104 429,403 460,730 415,038
2.2 State and local government financial assistance
Non-capital
New South Wales State Government 1,809 1,411 1,707 1,268
Other state governments 72 32 72 32
Local government 833 1,126 833 1,126
Total non-capital 2,714 2,569 2,612 2,426
Capital
New South Wales State Government 750 – 750 –
Total capital 750 – 750 –
Total state and local government financial assistance 3,464 2,569 3,362 2,426
2.3 Fees and charges
Course fees and charges
Fee-paying onshore overseas students 302,638 252,528 236,792 194,368
Fee-paying offshore overseas students 3,707 3,850 3,707 3,850
Continuing education 4,283 4,716 2,818 3,931
Fee-paying domestic postgraduate students 13,275 14,534 13,275 14,534
Fee-paying domestic undergraduate students 832 933 832 933
Other domestic course fees and charges 23,411 16,504 22,609 16,139
Total course fees and charges 348,146 293,065 280,033 233,755
Other non-course fees and charges
Library charges 341 399 1,655 1,596
Student accommodation charges 2,582 2,019 – –
Student services and amenities fee from students 5,810 5,250 5,810 5,250
Medical fees 933 868 973 910
English testing centre 925 1,536 925 1,536
Other fees and charges 623 450 – –
Total other non-course fees and charges 11,214 10,522 9,363 9,292
Total fees and charges 359,360 303,587 289,396 243,047
Notes to the financial statementsFOR THE YEAR ENDED 31 DECEMBER 2016
UTS ANNUAL REPORT 2016 19
FINANCIAL STATEMENTS: UTS
Economic entity(Consolidated)
Parent entity (University)
Notes 2016$’000
2015$’000
2016$’000
2015$’000
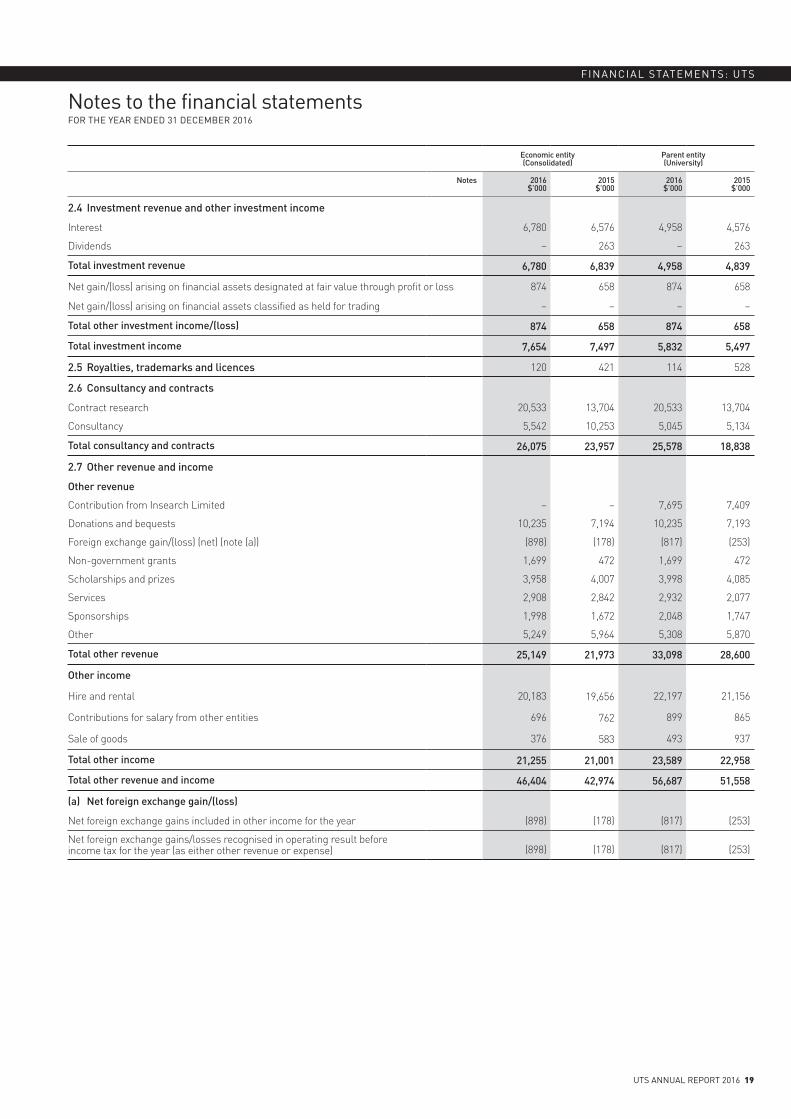
2.4 Investment revenue and other investment income
Interest 6,780 6,576 4,958 4,576
Dividends – 263 – 263
Total investment revenue 6,780 6,839 4,958 4,839
Net gain/(loss) arising on financial assets designated at fair value through profit or loss 874 658 874 658
Net gain/(loss) arising on financial assets classified as held for trading – – – –
Total other investment income/(loss) 874 658 874 658
Total investment income 7,654 7,497 5,832 5,497
2.5 Royalties, trademarks and licences 120 421 114 528
2.6 Consultancy and contracts
Contract research 20,533 13,704 20,533 13,704
Consultancy 5,542 10,253 5,045 5,134
Total consultancy and contracts 26,075 23,957 25,578 18,838
2.7 Other revenue and income
Other revenue
Contribution from Insearch Limited – – 7,695 7,409
Donations and bequests 10,235 7,194 10,235 7,193
Foreign exchange gain/(loss) (net) (note (a)) (898) (178) (817) (253)
Non-government grants 1,699 472 1,699 472
Scholarships and prizes 3,958 4,007 3,998 4,085
Services 2,908 2,842 2,932 2,077
Sponsorships 1,998 1,672 2,048 1,747
Other 5,249 5,964 5,308 5,870
Total other revenue 25,149 21,973 33,098 28,600
Other income
Hire and rental 20,183 19,656 22,197 21,156
Contributions for salary from other entities 696 762 899 865
Sale of goods 376 583 493 937
Total other income 21,255 21,001 23,589 22,958
Total other revenue and income 46,404 42,974 56,687 51,558
(a) Net foreign exchange gain/(loss)
Net foreign exchange gains included in other income for the year (898) (178) (817) (253)
Net foreign exchange gains/losses recognised in operating result before income tax for the year (as either other revenue or expense) (898) (178) (817) (253)
Notes to the financial statementsFOR THE YEAR ENDED 31 DECEMBER 2016
FINANCIAL STATEMENTS: UTS
20 UTS ANNUAL REPORT 2016
Economic entity(Consolidated)
Parent entity (University)
Notes 2016$’000
2015$’000
2016$’000
2015$’000
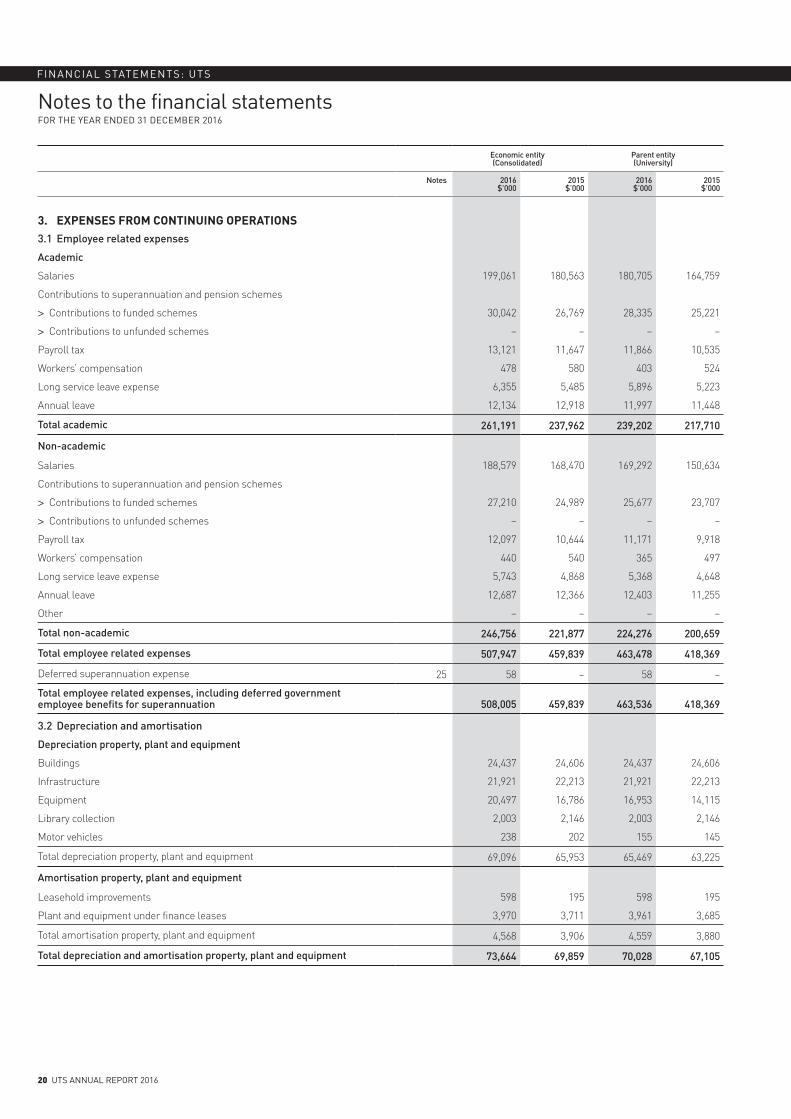
3. EXPENSES FROM CONTINUING OPERATIONS3.1 Employee related expenses
Academic
Salaries 199,061 180,563 180,705 164,759
Contributions to superannuation and pension schemes
> Contributions to funded schemes 30,042 26,769 28,335 25,221
> Contributions to unfunded schemes – – – –
Payroll tax 13,121 11,647 11,866 10,535
Workers’ compensation 478 580 403 524
Long service leave expense 6,355 5,485 5,896 5,223
Annual leave 12,134 12,918 11,997 11,448
Total academic 261,191 237,962 239,202 217,710
Non-academic
Salaries 188,579 168,470 169,292 150,634
Contributions to superannuation and pension schemes
> Contributions to funded schemes 27,210 24,989 25,677 23,707
> Contributions to unfunded schemes – – – –
Payroll tax 12,097 10,644 11,171 9,918
Workers’ compensation 440 540 365 497
Long service leave expense 5,743 4,868 5,368 4,648
Annual leave 12,687 12,366 12,403 11,255
Other – – – –
Total non-academic 246,756 221,877 224,276 200,659
Total employee related expenses 507,947 459,839 463,478 418,369
Deferred superannuation expense 25 58 – 58 –
Total employee related expenses, including deferred government employee benefits for superannuation 508,005 459,839 463,536 418,369
3.2 Depreciation and amortisation
Depreciation property, plant and equipment
Buildings 24,437 24,606 24,437 24,606
Infrastructure 21,921 22,213 21,921 22,213
Equipment 20,497 16,786 16,953 14,115
Library collection 2,003 2,146 2,003 2,146
Motor vehicles 238 202 155 145
Total depreciation property, plant and equipment 69,096 65,953 65,469 63,225
Amortisation property, plant and equipment
Leasehold improvements 598 195 598 195
Plant and equipment under finance leases 3,970 3,711 3,961 3,685
Total amortisation property, plant and equipment 4,568 3,906 4,559 3,880
Total depreciation and amortisation property, plant and equipment 73,664 69,859 70,028 67,105
Notes to the financial statementsFOR THE YEAR ENDED 31 DECEMBER 2016
UTS ANNUAL REPORT 2016 21
FINANCIAL STATEMENTS: UTS
Economic entity(Consolidated)
Parent entity (University)
Notes 2016$’000
2015$’000
2016$’000
2015$’000
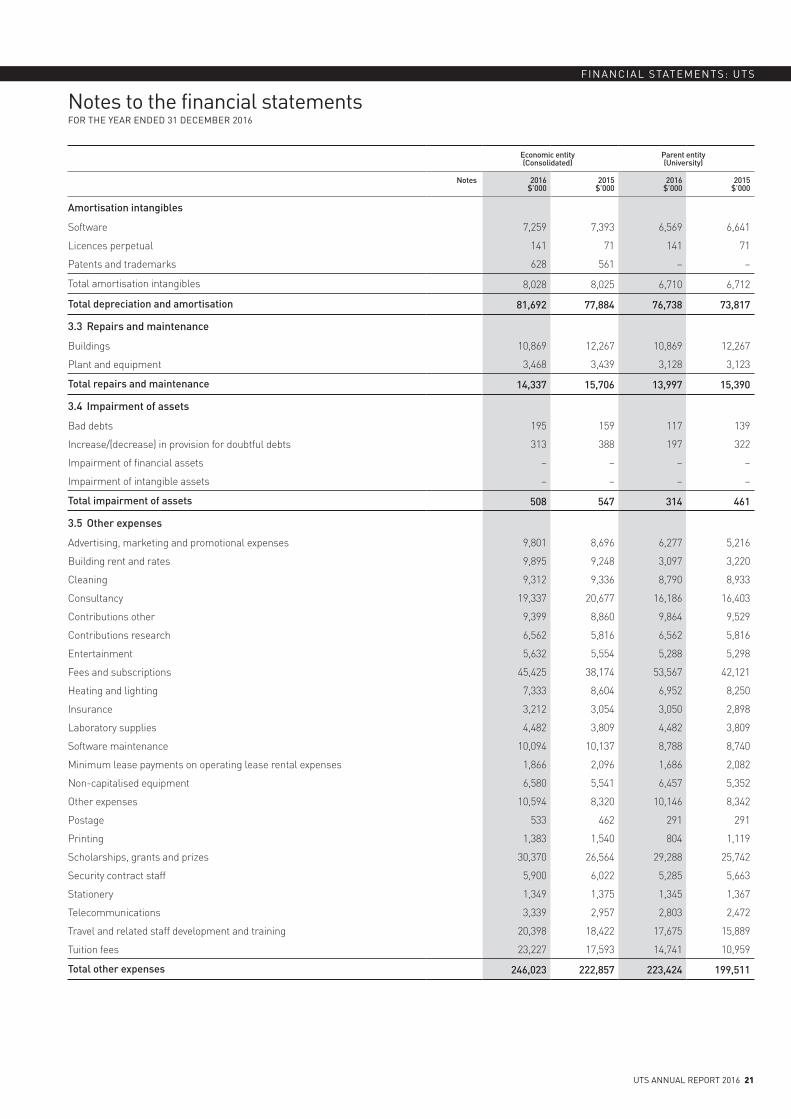
Amortisation intangibles
Software 7,259 7,393 6,569 6,641
Licences perpetual 141 71 141 71
Patents and trademarks 628 561 – –
Total amortisation intangibles 8,028 8,025 6,710 6,712
Total depreciation and amortisation 81,692 77,884 76,738 73,817
3.3 Repairs and maintenance
Buildings 10,869 12,267 10,869 12,267
Plant and equipment 3,468 3,439 3,128 3,123
Total repairs and maintenance 14,337 15,706 13,997 15,390
3.4 Impairment of assets
Bad debts 195 159 117 139
Increase/(decrease) in provision for doubtful debts 313 388 197 322
Impairment of financial assets – – – –
Impairment of intangible assets – – – –
Total impairment of assets 508 547 314 461
3.5 Other expenses
Advertising, marketing and promotional expenses 9,801 8,696 6,277 5,216
Building rent and rates 9,895 9,248 3,097 3,220
Cleaning 9,312 9,336 8,790 8,933
Consultancy 19,337 20,677 16,186 16,403
Contributions other 9,399 8,860 9,864 9,529
Contributions research 6,562 5,816 6,562 5,816
Entertainment 5,632 5,554 5,288 5,298
Fees and subscriptions 45,425 38,174 53,567 42,121
Heating and lighting 7,333 8,604 6,952 8,250
Insurance 3,212 3,054 3,050 2,898
Laboratory supplies 4,482 3,809 4,482 3,809
Software maintenance 10,094 10,137 8,788 8,740
Minimum lease payments on operating lease rental expenses 1,866 2,096 1,686 2,082
Non-capitalised equipment 6,580 5,541 6,457 5,352
Other expenses 10,594 8,320 10,146 8,342
Postage 533 462 291 291
Printing 1,383 1,540 804 1,119
Scholarships, grants and prizes 30,370 26,564 29,288 25,742
Security contract staff 5,900 6,022 5,285 5,663
Stationery 1,349 1,375 1,345 1,367
Telecommunications 3,339 2,957 2,803 2,472
Travel and related staff development and training 20,398 18,422 17,675 15,889
Tuition fees 23,227 17,593 14,741 10,959
Total other expenses 246,023 222,857 223,424 199,511
Notes to the financial statementsFOR THE YEAR ENDED 31 DECEMBER 2016
FINANCIAL STATEMENTS: UTS
22 UTS ANNUAL REPORT 2016
Economic entity(Consolidated)
Parent entity (University)
Notes 2016$’000
2015$’000
2016$’000
2015$’000
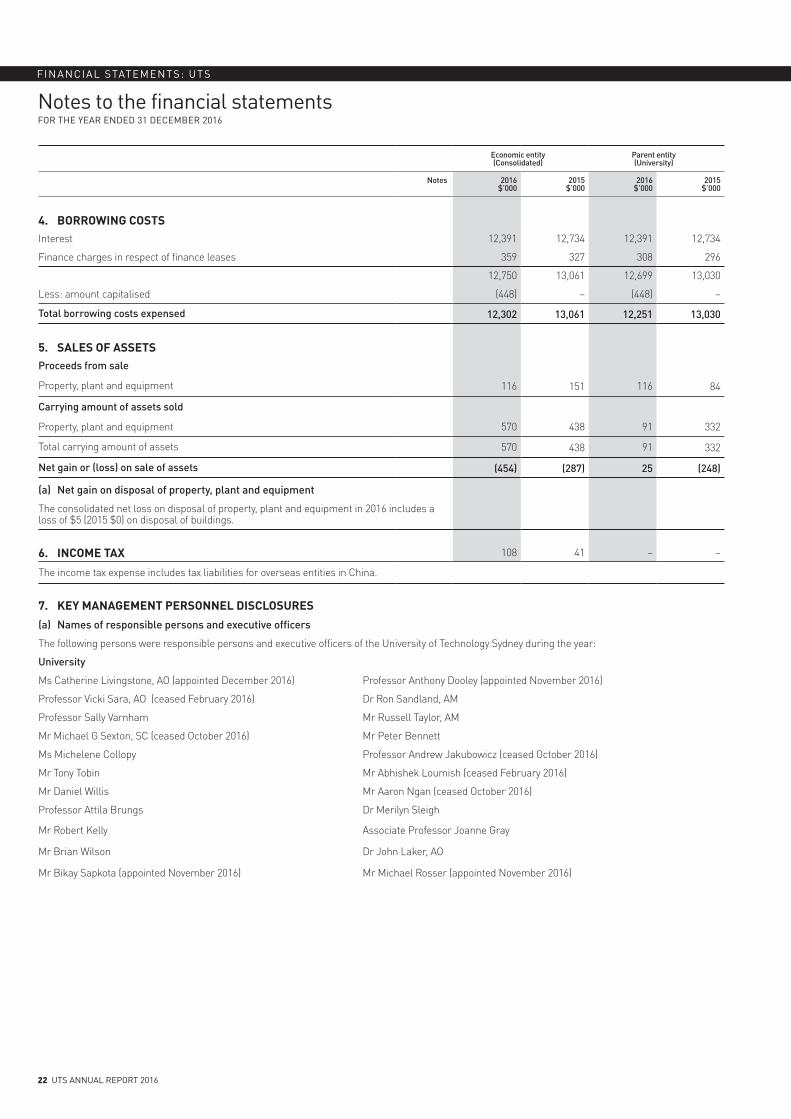
4. BORROWING COSTSInterest 12,391 12,734 12,391 12,734
Finance charges in respect of finance leases 359 327 308 296
12,750 13,061 12,699 13,030
Less: amount capitalised (448) – (448) –
Total borrowing costs expensed 12,302 13,061 12,251 13,030
5. SALES OF ASSETSProceeds from sale
Property, plant and equipment 116 151 116 84
Carrying amount of assets sold
Property, plant and equipment 570 438 91 332
Total carrying amount of assets 570 438 91 332
Net gain or (loss) on sale of assets (454) (287) 25 (248)
(a) Net gain on disposal of property, plant and equipment
The consolidated net loss on disposal of property, plant and equipment in 2016 includes a loss of $5 (2015 $0) on disposal of buildings.
6. INCOME TAX 108 41 – –
The income tax expense includes tax liabilities for overseas entities in China.
7. KEY MANAGEMENT PERSONNEL DISCLOSURES
(a) Names of responsible persons and executive officers
The following persons were responsible persons and executive officers of the University of Technology Sydney during the year:
University
Ms Catherine Livingstone, AO (appointed December 2016) Professor Anthony Dooley (appointed November 2016)
Professor Vicki Sara, AO (ceased February 2016) Dr Ron Sandland, AM
Professor Sally Varnham Mr Russell Taylor, AM
Mr Michael G Sexton, SC (ceased October 2016) Mr Peter Bennett
Ms Michelene Collopy Professor Andrew Jakubowicz (ceased October 2016)
Mr Tony Tobin Mr Abhishek Loumish (ceased February 2016)
Mr Daniel Willis Mr Aaron Ngan (ceased October 2016)
Professor Attila Brungs Dr Merilyn Sleigh
Mr Robert Kelly Associate Professor Joanne Gray
Mr Brian Wilson Dr John Laker, AO
Mr Bikay Sapkota (appointed November 2016) Mr Michael Rosser (appointed November 2016)
Notes to the financial statementsFOR THE YEAR ENDED 31 DECEMBER 2016
UTS ANNUAL REPORT 2016 23
FINANCIAL STATEMENTS: UTS
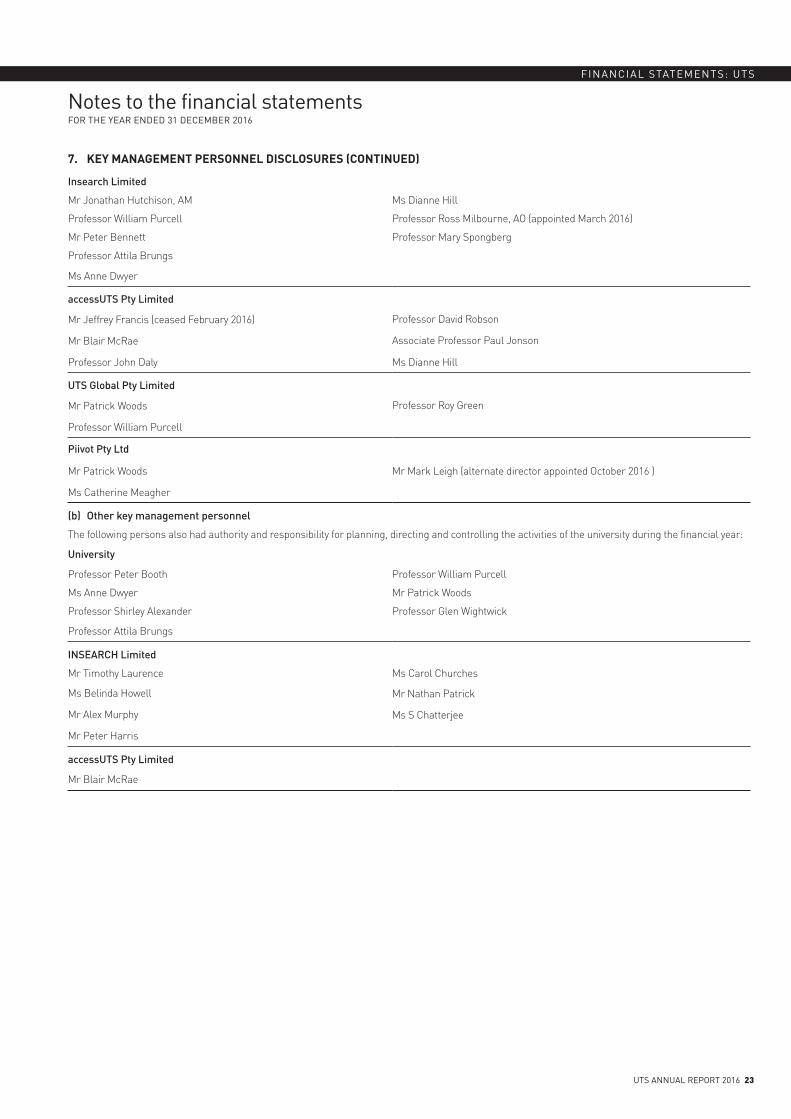
7. KEY MANAGEMENT PERSONNEL DISCLOSURES (CONTINUED)
Insearch Limited
Mr Jonathan Hutchison, AM Ms Dianne Hill
Professor William Purcell Professor Ross Milbourne, AO (appointed March 2016)
Mr Peter Bennett Professor Mary Spongberg
Professor Attila Brungs
Ms Anne Dwyer
accessUTS Pty Limited
Mr Jeffrey Francis (ceased February 2016) Professor David Robson
Mr Blair McRae Associate Professor Paul Jonson
Professor John Daly Ms Dianne Hill
UTS Global Pty Limited
Mr Patrick Woods Professor Roy Green
Professor William Purcell
Piivot Pty Ltd
Mr Patrick Woods Mr Mark Leigh (alternate director appointed October 2016 )
Ms Catherine Meagher
(b) Other key management personnel
The following persons also had authority and responsibility for planning, directing and controlling the activities of the university during the financial year:
University
Professor Peter Booth Professor William Purcell
Ms Anne Dwyer Mr Patrick Woods
Professor Shirley Alexander Professor Glen Wightwick
Professor Attila Brungs
INSEARCH Limited
Mr Timothy Laurence Ms Carol Churches
Ms Belinda Howell Mr Nathan Patrick
Mr Alex Murphy Ms S Chatterjee
Mr Peter Harris
accessUTS Pty Limited
Mr Blair McRae
Notes to the financial statementsFOR THE YEAR ENDED 31 DECEMBER 2016
FINANCIAL STATEMENTS: UTS
24 UTS ANNUAL REPORT 2016
Economic entity(Consolidated)
Parent entity (University)
2016 2015 2016 2015
7. KEY MANAGEMENT PERSONNEL DISCLOSURES (CONTINUED)
(c) Remuneration of board members and executives
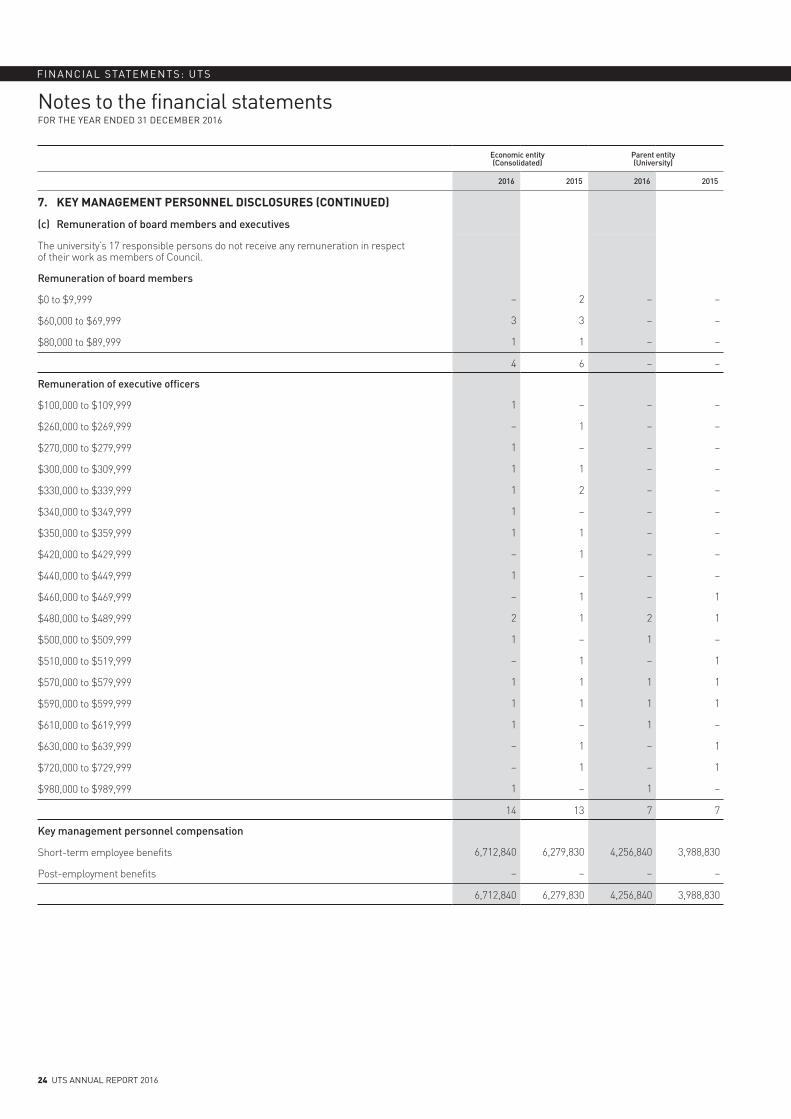
The university’s 17 responsible persons do not receive any remuneration in respect of their work as members of Council.
Remuneration of board members
$0 to $9,999 – 2 – –
$60,000 to $69,999 3 3 – –
$80,000 to $89,999 1 1 – –
4 6 – –
Remuneration of executive officers
$100,000 to $109,999 1 – – –
$260,000 to $269,999 – 1 – –
$270,000 to $279,999 1 – – –
$300,000 to $309,999 1 1 – –
$330,000 to $339,999 1 2 – –
$340,000 to $349,999 1 – – –
$350,000 to $359,999 1 1 – –
$420,000 to $429,999 – 1 – –
$440,000 to $449,999 1 – – –
$460,000 to $469,999 – 1 – 1
$480,000 to $489,999 2 1 2 1
$500,000 to $509,999 1 – 1 –
$510,000 to $519,999 – 1 – 1
$570,000 to $579,999 1 1 1 1
$590,000 to $599,999 1 1 1 1
$610,000 to $619,999 1 – 1 –
$630,000 to $639,999 – 1 – 1
$720,000 to $729,999 – 1 – 1
$980,000 to $989,999 1 – 1 –
14 13 7 7
Key management personnel compensation
Short-term employee benefits 6,712,840 6,279,830 4,256,840 3,988,830
Post-employment benefits – – – –
6,712,840 6,279,830 4,256,840 3,988,830
Notes to the financial statementsFOR THE YEAR ENDED 31 DECEMBER 2016
UTS ANNUAL REPORT 2016 25
FINANCIAL STATEMENTS: UTS
Economic entity(Consolidated)
Parent entity (University)
2016$’000
2015$’000
2016$’000
2015$’000
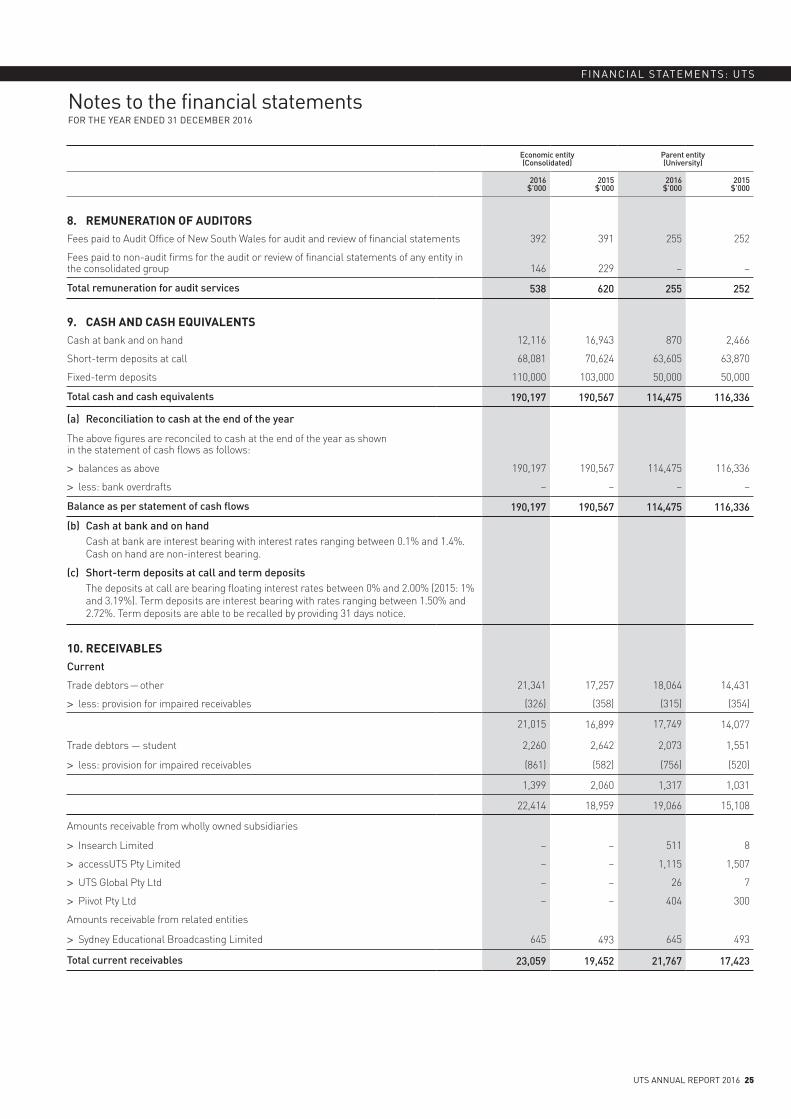
8. REMUNERATION OF AUDITORSFees paid to Audit Office of New South Wales for audit and review of financial statements 392 391 255 252
Fees paid to non-audit firms for the audit or review of financial statements of any entity in the consolidated group 146 229 – –
Total remuneration for audit services 538 620 255 252
9. CASH AND CASH EQUIVALENTSCash at bank and on hand 12,116 16,943 870 2,466
Short-term deposits at call 68,081 70,624 63,605 63,870
Fixed-term deposits 110,000 103,000 50,000 50,000
Total cash and cash equivalents 190,197 190,567 114,475 116,336
(a) Reconciliation to cash at the end of the year
The above figures are reconciled to cash at the end of the year as shown in the statement of cash flows as follows:
> balances as above 190,197 190,567 114,475 116,336
> less: bank overdrafts – – – –
Balance as per statement of cash flows 190,197 190,567 114,475 116,336
(b) Cash at bank and on handCash at bank are interest bearing with interest rates ranging between 0.1% and 1.4%. Cash on hand are non-interest bearing.
(c) Short-term deposits at call and term depositsThe deposits at call are bearing floating interest rates between 0% and 2.00% (2015: 1% and 3.19%). Term deposits are interest bearing with rates ranging between 1.50% and 2.72%. Term deposits are able to be recalled by providing 31 days notice.
10. RECEIVABLESCurrent
Trade debtors — other 21,341 17,257 18,064 14,431
> less: provision for impaired receivables (326) (358) (315) (354)
21,015 16,899 17,749 14,077
Trade debtors — student 2,260 2,642 2,073 1,551
> less: provision for impaired receivables (861) (582) (756) (520)
1,399 2,060 1,317 1,031
22,414 18,959 19,066 15,108
Amounts receivable from wholly owned subsidiaries
> Insearch Limited – – 511 8
> accessUTS Pty Limited – – 1,115 1,507
> UTS Global Pty Ltd – – 26 7
> Piivot Pty Ltd – – 404 300
Amounts receivable from related entities
> Sydney Educational Broadcasting Limited 645 493 645 493
Total current receivables 23,059 19,452 21,767 17,423
Notes to the financial statementsFOR THE YEAR ENDED 31 DECEMBER 2016
FINANCIAL STATEMENTS: UTS
26 UTS ANNUAL REPORT 2016
Economic entity(Consolidated)
Parent entity (University)
2016$’000
2015$’000
2016$’000
2015$’000
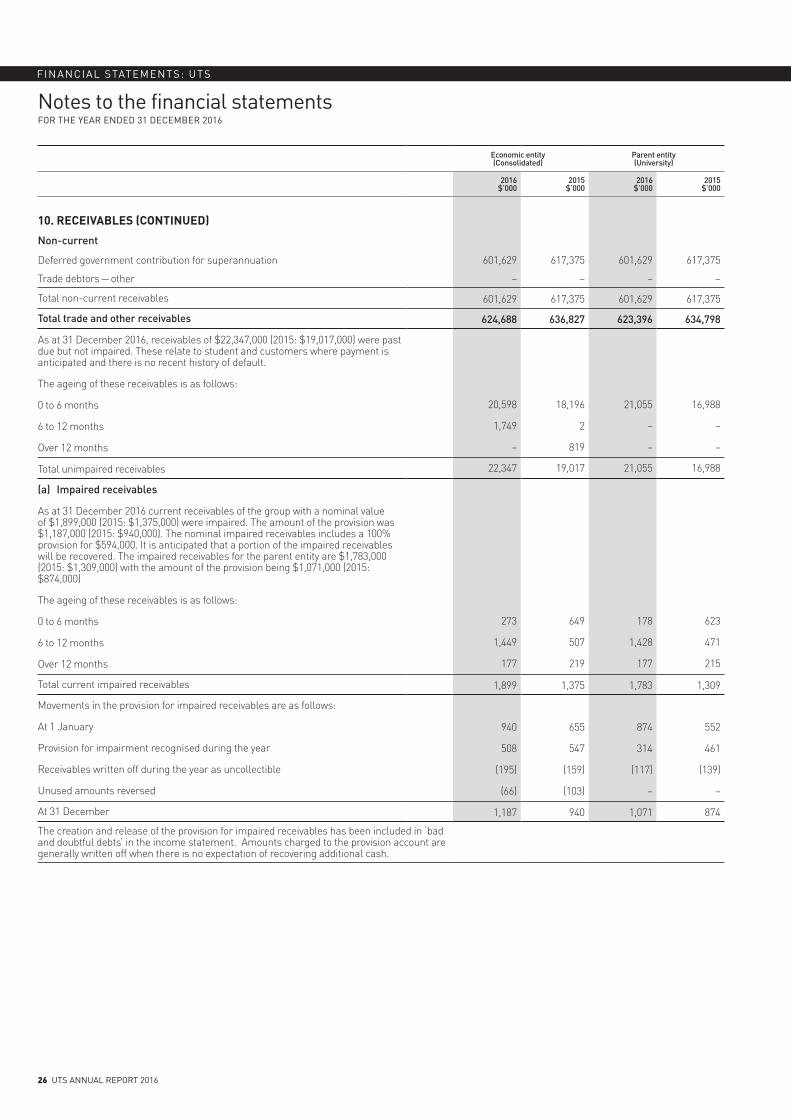
10. RECEIVABLES (CONTINUED)
Non-current
Deferred government contribution for superannuation 601,629 617,375 601,629 617,375
Trade debtors — other – – – –
Total non-current receivables 601,629 617,375 601,629 617,375
Total trade and other receivables 624,688 636,827 623,396 634,798
As at 31 December 2016, receivables of $22,347,000 (2015: $19,017,000) were past due but not impaired. These relate to student and customers where payment is anticipated and there is no recent history of default.
The ageing of these receivables is as follows:
0 to 6 months 20,598 18,196 21,055 16,988
6 to 12 months 1,749 2 – –
Over 12 months – 819 – –
Total unimpaired receivables 22,347 19,017 21,055 16,988
(a) Impaired receivables
As at 31 December 2016 current receivables of the group with a nominal value of $1,899,000 (2015: $1,375,000) were impaired. The amount of the provision was $1,187,000 (2015: $940,000). The nominal impaired receivables includes a 100% provision for $594,000. It is anticipated that a portion of the impaired receivables will be recovered. The impaired receivables for the parent entity are $1,783,000 (2015: $1,309,000) with the amount of the provision being $1,071,000 (2015: $874,000)
The ageing of these receivables is as follows:
0 to 6 months 273 649 178 623
6 to 12 months 1,449 507 1,428 471
Over 12 months 177 219 177 215
Total current impaired receivables 1,899 1,375 1,783 1,309
Movements in the provision for impaired receivables are as follows:
At 1 January 940 655 874 552
Provision for impairment recognised during the year 508 547 314 461
Receivables written off during the year as uncollectible (195) (159) (117) (139)
Unused amounts reversed (66) (103) – –
At 31 December 1,187 940 1,071 874
The creation and release of the provision for impaired receivables has been included in ‘bad and doubtful debts’ in the income statement. Amounts charged to the provision account are generally written off when there is no expectation of recovering additional cash.
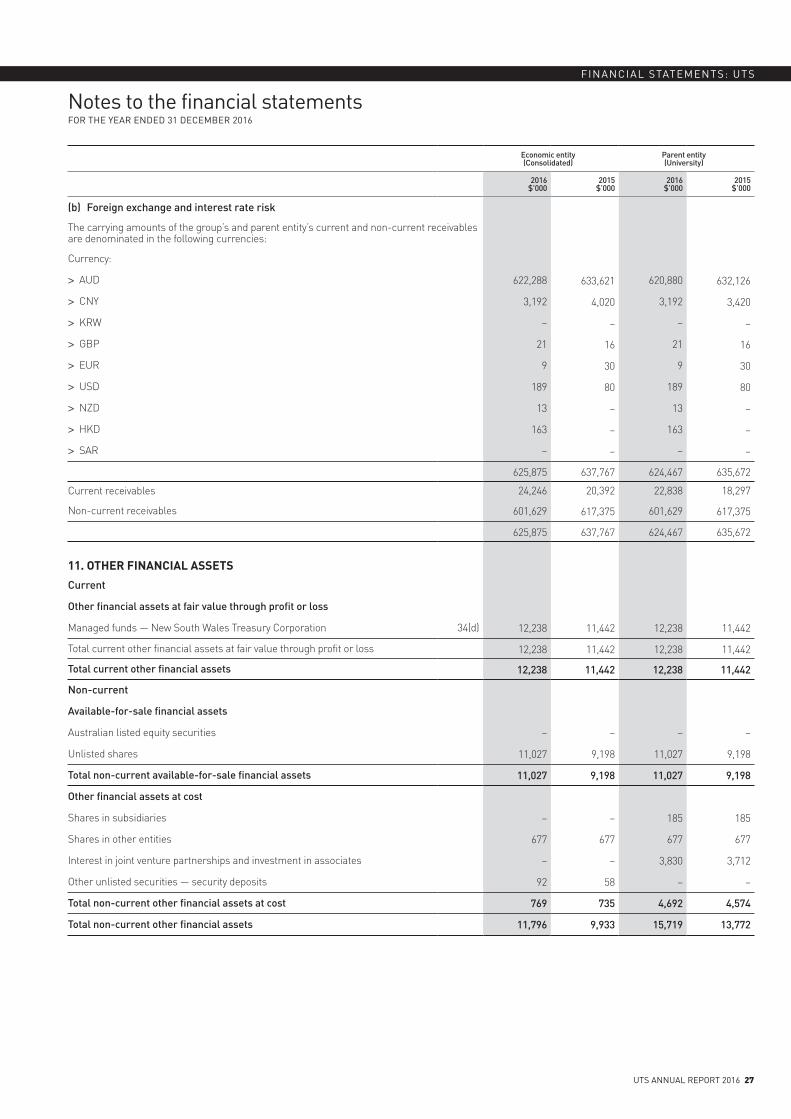
Notes to the financial statementsFOR THE YEAR ENDED 31 DECEMBER 2016
UTS ANNUAL REPORT 2016 27
FINANCIAL STATEMENTS: UTS
Economic entity(Consolidated)
Parent entity (University)
2016$’000
2015$’000
2016$’000
2015$’000
(b) Foreign exchange and interest rate risk
The carrying amounts of the group’s and parent entity’s current and non-current receivables are denominated in the following currencies:
Currency:
> AUD 622,288 633,621 620,880 632,126
> CNY 3,192 4,020 3,192 3,420
> KRW – – – –
> GBP 21 16 21 16
> EUR 9 30 9 30
> USD 189 80 189 80
> NZD 13 – 13 –
> HKD 163 – 163 –
> SAR – – – –
625,875 637,767 624,467 635,672
Current receivables 24,246 20,392 22,838 18,297
Non-current receivables 601,629 617,375 601,629 617,375
625,875 637,767 624,467 635,672
11. OTHER FINANCIAL ASSETS
Current
Other financial assets at fair value through profit or loss
Managed funds — New South Wales Treasury Corporation 34(d) 12,238 11,442 12,238 11,442
Total current other financial assets at fair value through profit or loss 12,238 11,442 12,238 11,442
Total current other financial assets 12,238 11,442 12,238 11,442
Non-current
Available-for-sale financial assets
Australian listed equity securities – – – –
Unlisted shares 11,027 9,198 11,027 9,198
Total non-current available-for-sale financial assets 11,027 9,198 11,027 9,198
Other financial assets at cost
Shares in subsidiaries – – 185 185
Shares in other entities 677 677 677 677
Interest in joint venture partnerships and investment in associates – – 3,830 3,712
Other unlisted securities — security deposits 92 58 – –
Total non-current other financial assets at cost 769 735 4,692 4,574
Total non-current other financial assets 11,796 9,933 15,719 13,772
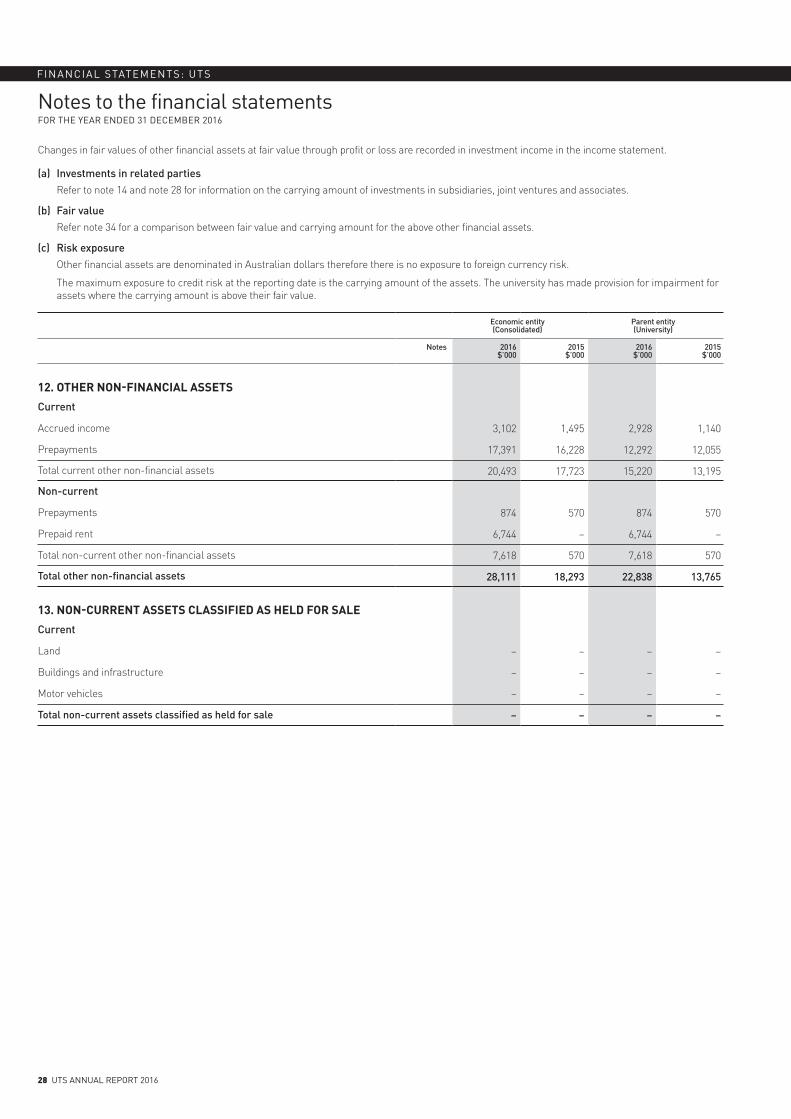
Notes to the financial statementsFOR THE YEAR ENDED 31 DECEMBER 2016
FINANCIAL STATEMENTS: UTS
28 UTS ANNUAL REPORT 2016
Changes in fair values of other financial assets at fair value through profit or loss are recorded in investment income in the income statement.
(a) Investments in related partiesRefer to note 14 and note 28 for information on the carrying amount of investments in subsidiaries, joint ventures and associates.
(b) Fair valueRefer note 34 for a comparison between fair value and carrying amount for the above other financial assets.
(c) Risk exposureOther financial assets are denominated in Australian dollars therefore there is no exposure to foreign currency risk.
The maximum exposure to credit risk at the reporting date is the carrying amount of the assets. The university has made provision for impairment for assets where the carrying amount is above their fair value.
Economic entity(Consolidated)
Parent entity (University)
Notes 2016$’000
2015$’000
2016$’000
2015$’000
12. OTHER NON-FINANCIAL ASSETS
Current
Accrued income 3,102 1,495 2,928 1,140
Prepayments 17,391 16,228 12,292 12,055
Total current other non-financial assets 20,493 17,723 15,220 13,195
Non-current
Prepayments 874 570 874 570
Prepaid rent 6,744 – 6,744 –
Total non-current other non-financial assets 7,618 570 7,618 570
Total other non-financial assets 28,111 18,293 22,838 13,765
13. NON-CURRENT ASSETS CLASSIFIED AS HELD FOR SALE
Current
Land – – – –
Buildings and infrastructure – – – –
Motor vehicles – – – –
Total non-current assets classified as held for sale – – – –

Notes to the financial statementsFOR THE YEAR ENDED 31 DECEMBER 2016
UTS ANNUAL REPORT 2016 29
FINANCIAL STATEMENTS: UTS
Economic entity(Consolidated)
Parent entity (University)
Notes 2016$’000
2015$’000
2016$’000
2015$’000
14. INVESTMENTS ACCOUNTED FOR USING THE EQUITY METHOD
Investments in associates 1,613 5,795 – –
Investments in joint ventures 3,585 3,527 – –
Total investments accounted for using the equity method 5,198 9,322 – –
(a) Reconciliation
Balance at 1 January 9,322 8,000 – –
Share of profit/(loss) for the year (3,731) 1,896 – –
Dividends (555) (819) – –
Foreign currency translation (21) 69 – –
Additional equity income 65 71 – –
Add additional shares in associate 118 – – –
Disposal of joint venture – (675) – –
Joint venture reclassified – 780 – –
Balance at 31 December 5,198 9,322 – –
1. Cicada Innovations Pty Ltd (formerly Australian Technology Park Innovation Proprietory Limited (ATPI)) has a reporting date of 30 June 2016. The university has relied on the statutory accounts to the 30 June 2016 for Cicada Innovations Pty Ltd.
2. Cicada Innovations Pty Ltd results included a correction of a prior period error of $15.6m (UTS share $3.9m) due to the reversal of a previously recognised fair value revaluation on an investment property which was leased by Cicada Innovations Pty Ltd. The university has recognised this loss during the 2016 financial year as the amount is deemed not material for the economic entity.
3. Rugby Australia House Pty Ltd, a joint venture between the University of Technology Sydney and the Australian Rugby Union Ltd, was established in December 2015 to construct a building on land owned by the SCG Trust. The building, when completed, will be owned by the SCG Trust and, in recognition of receipt of the building, the SCG Trust will provide leased premises within the building to the university at reduced rates for a minimum of 25 years.
4. Sabre Autonomous Solutions Pty Ltd has a reporting date of 30 June 2016. The university has relied on the statutory accounts to the 30 June 2016 for Sabre Autonomous Solutions Pty Ltd.
(b) Individually immaterial joint ventures or associatesThe university’s joint ventures and associates are regarded as financially immaterial and are therefore aggregated.
Economic entity(Consolidated)
Parent entity (University)
2016$’000
2015$’000
2016$’000
2015$’000
Aggregate carrying amount of interests in joint ventures and associates accounted for using the equity method that are not individually material in the consolidated financial statements:
Profit/(loss) from continuing operations
Profit/(loss) from continuing operations after income tax
(3,731) 1,896 – –
(3,731) 1,896 – –
Other comprehensive income – – – –
Total comprehensive income (3,731) 1,896 – –
Total share of profit or loss on investments accounted for using the equity method (3,731) 1,896 – –
(c) Contingent liabilities relating to joint ventures No material losses are anticipated in respect to contingent liabilities.
(d) RestrictionsJoint venture and associates that are limited by guarantee companies and, where the university is a member, are unable to pay dividends or repay capital upon liquidation.
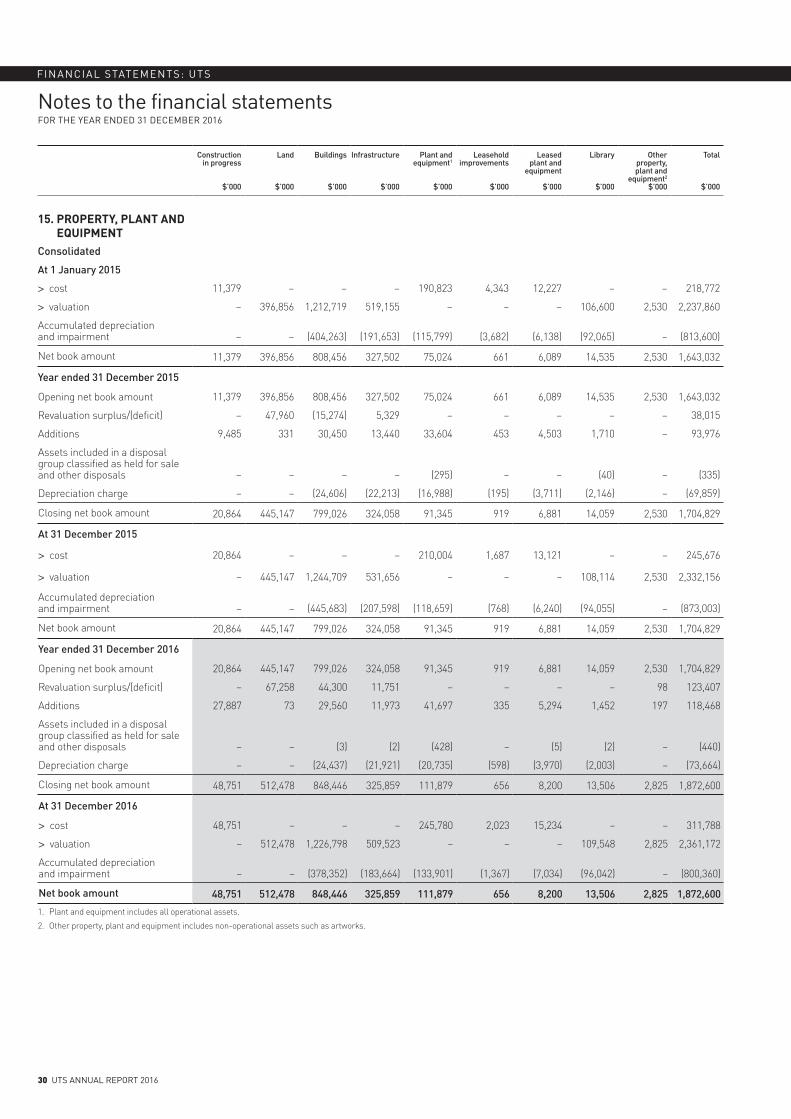
Notes to the financial statementsFOR THE YEAR ENDED 31 DECEMBER 2016
FINANCIAL STATEMENTS: UTS
30 UTS ANNUAL REPORT 2016
Construction in progress
$’000
Land
$’000
Buildings
$’000
Infrastructure
$’000
Plant and equipment1
$’000
Leasehold improvements
$’000
Leased plant and
equipment
$’000
Library
$’000
Other property, plant and
equipment2
$’000
Total
$’000
15. PROPERTY, PLANT AND EQUIPMENT
Consolidated
At 1 January 2015
> cost 11,379 – – – 190,823 4,343 12,227 – – 218,772
> valuation – 396,856 1,212,719 519,155 – – – 106,600 2,530 2,237,860
Accumulated depreciation and impairment – – (404,263) (191,653) (115,799) (3,682) (6,138) (92,065) – (813,600)
Net book amount 11,379 396,856 808,456 327,502 75,024 661 6,089 14,535 2,530 1,643,032
Year ended 31 December 2015
Opening net book amount 11,379 396,856 808,456 327,502 75,024 661 6,089 14,535 2,530 1,643,032
Revaluation surplus/(deficit) – 47,960 (15,274) 5,329 – – – – – 38,015
Additions 9,485 331 30,450 13,440 33,604 453 4,503 1,710 – 93,976
Assets included in a disposal group classified as held for sale and other disposals – – – – (295) – – (40) – (335)
Depreciation charge – – (24,606) (22,213) (16,988) (195) (3,711) (2,146) – (69,859)
Closing net book amount 20,864 445,147 799,026 324,058 91,345 919 6,881 14,059 2,530 1,704,829
At 31 December 2015
> cost 20,864 – – – 210,004 1,687 13,121 – – 245,676
> valuation – 445,147 1,244,709 531,656 – – – 108,114 2,530 2,332,156
Accumulated depreciation and impairment – – (445,683) (207,598) (118,659) (768) (6,240) (94,055) – (873,003)
Net book amount 20,864 445,147 799,026 324,058 91,345 919 6,881 14,059 2,530 1,704,829
Year ended 31 December 2016
Opening net book amount 20,864 445,147 799,026 324,058 91,345 919 6,881 14,059 2,530 1,704,829
Revaluation surplus/(deficit) – 67,258 44,300 11,751 – – – – 98 123,407
Additions 27,887 73 29,560 11,973 41,697 335 5,294 1,452 197 118,468
Assets included in a disposal group classified as held for sale and other disposals – – (3) (2) (428) – (5) (2) – (440)
Depreciation charge – – (24,437) (21,921) (20,735) (598) (3,970) (2,003) – (73,664)
Closing net book amount 48,751 512,478 848,446 325,859 111,879 656 8,200 13,506 2,825 1,872,600
At 31 December 2016
> cost 48,751 – – – 245,780 2,023 15,234 – – 311,788
> valuation – 512,478 1,226,798 509,523 – – – 109,548 2,825 2,361,172
Accumulated depreciation and impairment – – (378,352) (183,664) (133,901) (1,367) (7,034) (96,042) – (800,360)
Net book amount 48,751 512,478 848,446 325,859 111,879 656 8,200 13,506 2,825 1,872,600
1. Plant and equipment includes all operational assets.
2. Other property, plant and equipment includes non-operational assets such as artworks.
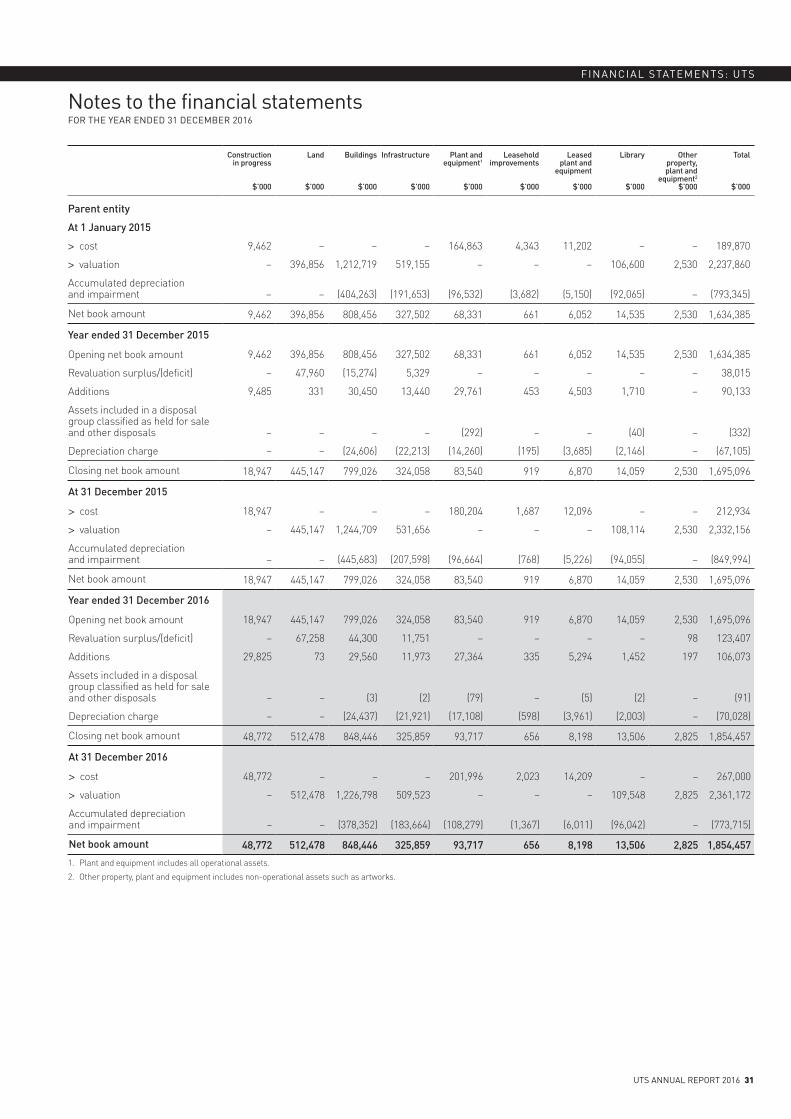
Notes to the financial statementsFOR THE YEAR ENDED 31 DECEMBER 2016
UTS ANNUAL REPORT 2016 31
FINANCIAL STATEMENTS: UTS
Construction in progress
$’000
Land
$’000
Buildings
$’000
Infrastructure
$’000
Plant and equipment1
$’000
Leasehold improvements
$’000
Leased plant and
equipment
$’000
Library
$’000
Other property, plant and
equipment2
$’000
Total
$’000
Parent entity
At 1 January 2015
> cost 9,462 – – – 164,863 4,343 11,202 – – 189,870
> valuation – 396,856 1,212,719 519,155 – – – 106,600 2,530 2,237,860
Accumulated depreciation and impairment – – (404,263) (191,653) (96,532) (3,682) (5,150) (92,065) – (793,345)
Net book amount 9,462 396,856 808,456 327,502 68,331 661 6,052 14,535 2,530 1,634,385
Year ended 31 December 2015
Opening net book amount 9,462 396,856 808,456 327,502 68,331 661 6,052 14,535 2,530 1,634,385
Revaluation surplus/(deficit) – 47,960 (15,274) 5,329 – – – – – 38,015
Additions 9,485 331 30,450 13,440 29,761 453 4,503 1,710 – 90,133
Assets included in a disposal group classified as held for sale and other disposals – – – – (292) – – (40) – (332)
Depreciation charge – – (24,606) (22,213) (14,260) (195) (3,685) (2,146) – (67,105)
Closing net book amount 18,947 445,147 799,026 324,058 83,540 919 6,870 14,059 2,530 1,695,096
At 31 December 2015
> cost 18,947 – – – 180,204 1,687 12,096 – – 212,934
> valuation – 445,147 1,244,709 531,656 – – – 108,114 2,530 2,332,156
Accumulated depreciation and impairment – – (445,683) (207,598) (96,664) (768) (5,226) (94,055) – (849,994)
Net book amount 18,947 445,147 799,026 324,058 83,540 919 6,870 14,059 2,530 1,695,096
Year ended 31 December 2016
Opening net book amount 18,947 445,147 799,026 324,058 83,540 919 6,870 14,059 2,530 1,695,096
Revaluation surplus/(deficit) – 67,258 44,300 11,751 – – – – 98 123,407
Additions 29,825 73 29,560 11,973 27,364 335 5,294 1,452 197 106,073
Assets included in a disposal group classified as held for sale and other disposals – – (3) (2) (79) – (5) (2) – (91)
Depreciation charge – – (24,437) (21,921) (17,108) (598) (3,961) (2,003) – (70,028)
Closing net book amount 48,772 512,478 848,446 325,859 93,717 656 8,198 13,506 2,825 1,854,457
At 31 December 2016
> cost 48,772 – – – 201,996 2,023 14,209 – – 267,000
> valuation – 512,478 1,226,798 509,523 – – – 109,548 2,825 2,361,172
Accumulated depreciation and impairment – – (378,352) (183,664) (108,279) (1,367) (6,011) (96,042) – (773,715)
Net book amount 48,772 512,478 848,446 325,859 93,717 656 8,198 13,506 2,825 1,854,457
1. Plant and equipment includes all operational assets.
2. Other property, plant and equipment includes non-operational assets such as artworks.
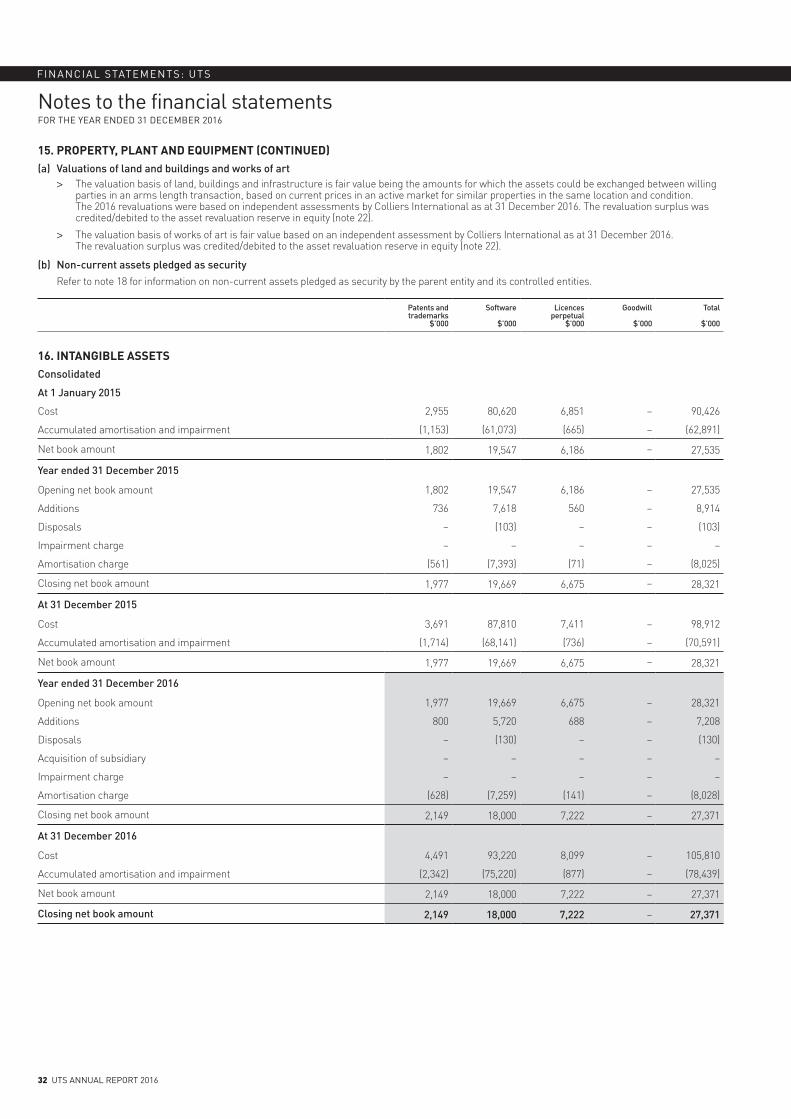
Notes to the financial statementsFOR THE YEAR ENDED 31 DECEMBER 2016
FINANCIAL STATEMENTS: UTS
32 UTS ANNUAL REPORT 2016
15. PROPERTY, PLANT AND EQUIPMENT (CONTINUED)(a) Valuations of land and buildings and works of art
> The valuation basis of land, buildings and infrastructure is fair value being the amounts for which the assets could be exchanged between willing parties in an arms length transaction, based on current prices in an active market for similar properties in the same location and condition. The 2016 revaluations were based on independent assessments by Colliers International as at 31 December 2016. The revaluation surplus was credited/debited to the asset revaluation reserve in equity (note 22).
> The valuation basis of works of art is fair value based on an independent assessment by Colliers International as at 31 December 2016. The revaluation surplus was credited/debited to the asset revaluation reserve in equity (note 22).
(b) Non-current assets pledged as securityRefer to note 18 for information on non-current assets pledged as security by the parent entity and its controlled entities.
Patents and trademarks
$’000
Software
$’000
Licences perpetual
$’000
Goodwill
$’000
Total
$’000
16. INTANGIBLE ASSETSConsolidated
At 1 January 2015
Cost 2,955 80,620 6,851 – 90,426
Accumulated amortisation and impairment (1,153) (61,073) (665) – (62,891)
Net book amount 1,802 19,547 6,186 – 27,535
Year ended 31 December 2015
Opening net book amount 1,802 19,547 6,186 – 27,535
Additions 736 7,618 560 – 8,914
Disposals – (103) – – (103)
Impairment charge – – – – –
Amortisation charge (561) (7,393) (71) – (8,025)
Closing net book amount 1,977 19,669 6,675 – 28,321
At 31 December 2015
Cost 3,691 87,810 7,411 – 98,912
Accumulated amortisation and impairment (1,714) (68,141) (736) – (70,591)
Net book amount 1,977 19,669 6,675 – 28,321
Year ended 31 December 2016
Opening net book amount 1,977 19,669 6,675 – 28,321
Additions 800 5,720 688 – 7,208
Disposals – (130) – – (130)
Acquisition of subsidiary – – – – –
Impairment charge – – – – –
Amortisation charge (628) (7,259) (141) – (8,028)
Closing net book amount 2,149 18,000 7,222 – 27,371
At 31 December 2016
Cost 4,491 93,220 8,099 – 105,810
Accumulated amortisation and impairment (2,342) (75,220) (877) – (78,439)
Net book amount 2,149 18,000 7,222 – 27,371
Closing net book amount 2,149 18,000 7,222 – 27,371
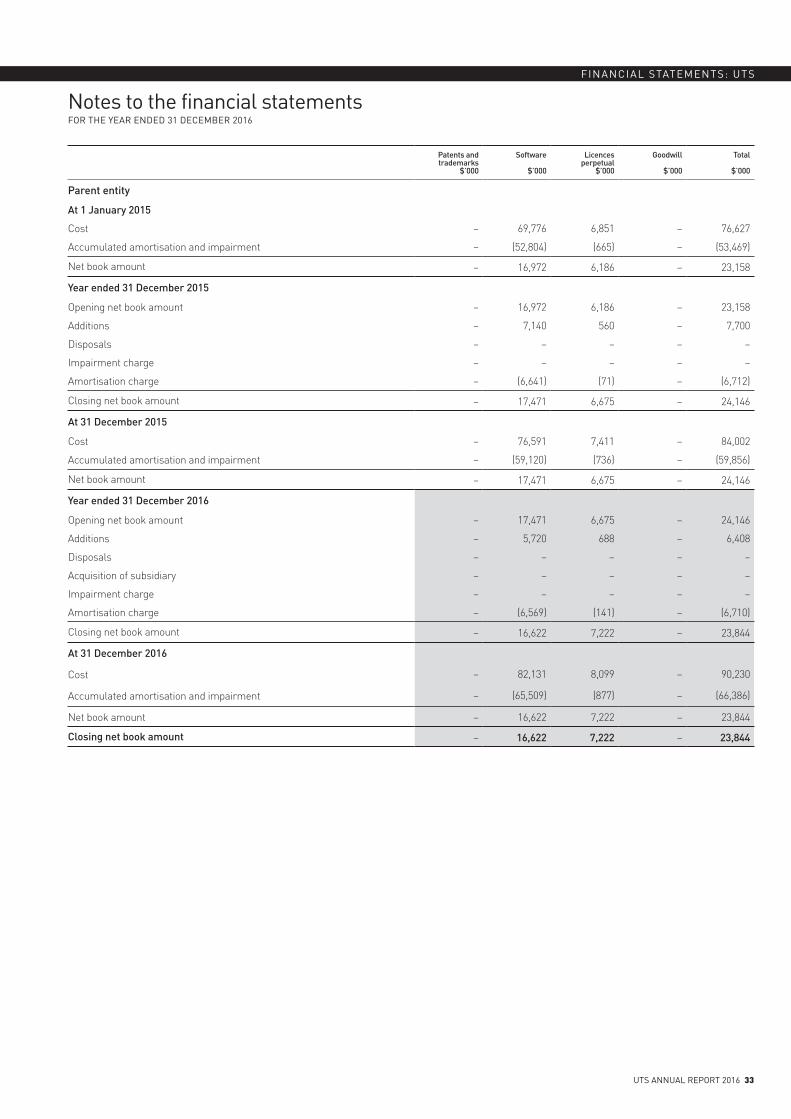
Notes to the financial statementsFOR THE YEAR ENDED 31 DECEMBER 2016
UTS ANNUAL REPORT 2016 33
FINANCIAL STATEMENTS: UTS
Patents and trademarks
$’000
Software
$’000
Licences perpetual
$’000
Goodwill
$’000
Total
$’000
Parent entity
At 1 January 2015
Cost – 69,776 6,851 – 76,627
Accumulated amortisation and impairment – (52,804) (665) – (53,469)
Net book amount – 16,972 6,186 – 23,158
Year ended 31 December 2015
Opening net book amount – 16,972 6,186 – 23,158
Additions – 7,140 560 – 7,700
Disposals – – – – –
Impairment charge – – – – –
Amortisation charge – (6,641) (71) – (6,712)
Closing net book amount – 17,471 6,675 – 24,146
At 31 December 2015
Cost – 76,591 7,411 – 84,002
Accumulated amortisation and impairment – (59,120) (736) – (59,856)
Net book amount – 17,471 6,675 – 24,146
Year ended 31 December 2016
Opening net book amount – 17,471 6,675 – 24,146
Additions – 5,720 688 – 6,408
Disposals – – – – –
Acquisition of subsidiary – – – – –
Impairment charge – – – – –
Amortisation charge – (6,569) (141) – (6,710)
Closing net book amount – 16,622 7,222 – 23,844
At 31 December 2016
Cost – 82,131 8,099 – 90,230
Accumulated amortisation and impairment – (65,509) (877) – (66,386)
Net book amount – 16,622 7,222 – 23,844
Closing net book amount – 16,622 7,222 – 23,844

Notes to the financial statementsFOR THE YEAR ENDED 31 DECEMBER 2016
FINANCIAL STATEMENTS: UTS
34 UTS ANNUAL REPORT 2016
Economic entity (Consolidated)
Parent entity (University)
Notes 2016$’000
2015$’000
2016$’000
2015$’000
17. TRADE AND OTHER PAYABLES
Current
HELP liability to Australian Government 3,505 4,077 3,505 4,077
Deputy Commissioner of Taxation — PAYG 3,927 4,083 3,927 4,083
Office of State Revenue — payroll tax 2,852 2,468 2,852 2,468
Trade creditors and accruals 29,005 29,318 27,363 23,783
Capital accruals 5,093 882 5,093 882
Other payroll accruals 7,451 9,904 7,392 9,904
Other 3,945 4,319 3,548 4,155
Total trade and other payables 55,778 55,051 53,680 49,352
(a) Foreign currency risk
The carrying amounts of the group’s and parent entity’s trade and other payables are denominated in the following currencies:
> AUD 54,394 53,935 52,357 48,306
> CAD 2 – 2 –
> CNY – 11 – –
> SEK 5 – 5 –
> EUR 80 197 80 197
> GBP 440 53 440 53
> JPY 3 – 3 –
> NZD – 1 – 1
> INR 25 87 25 28
> IDR 61 – – –
> USD 764 751 764 751
> CHF – 9 – 9
> SGD 3 7 3 7
> DKK 1 – 1 –
55,778 55,051 53,680 49,352
For an analysis of the sensitivity of trade and other payables to foreign currency risk refer to note 34.
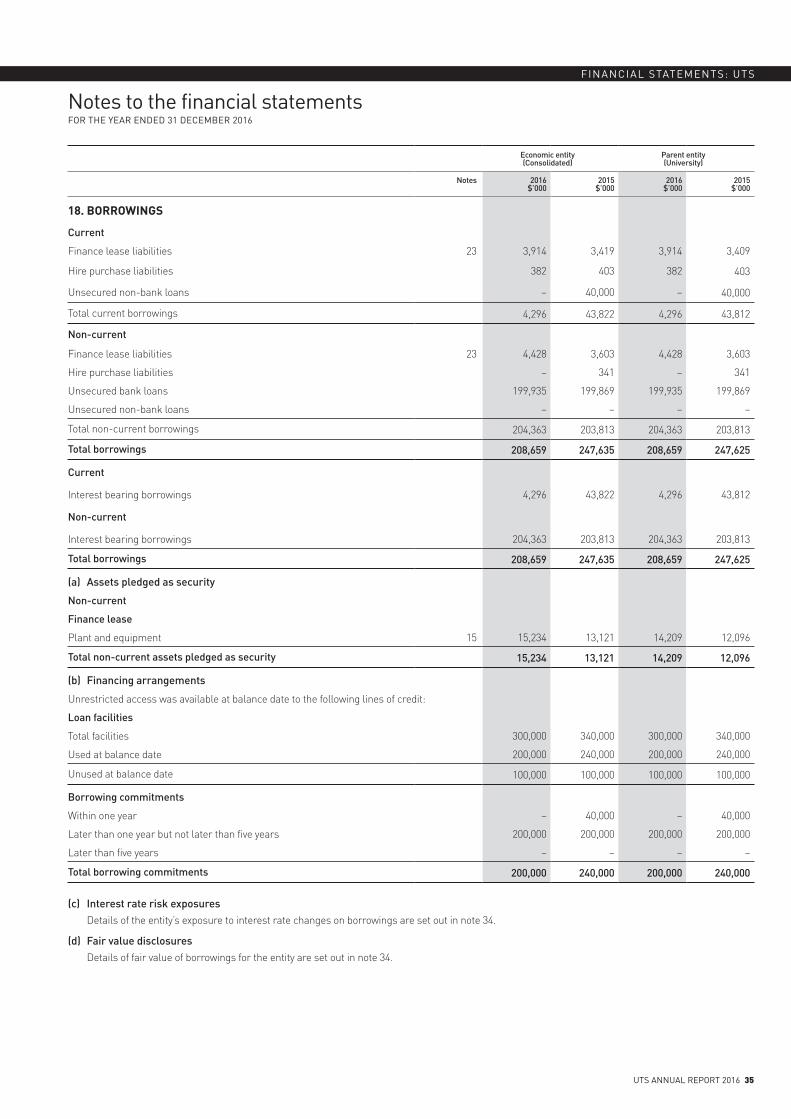
Notes to the financial statementsFOR THE YEAR ENDED 31 DECEMBER 2016
UTS ANNUAL REPORT 2016 35
FINANCIAL STATEMENTS: UTS
Economic entity (Consolidated)
Parent entity (University)
Notes 2016$’000
2015$’000
2016$’000
2015$’000
18. BORROWINGS
Current
Finance lease liabilities 23 3,914 3,419 3,914 3,409
Hire purchase liabilities 382 403 382 403
Unsecured non-bank loans – 40,000 – 40,000
Total current borrowings 4,296 43,822 4,296 43,812
Non-current
Finance lease liabilities 23 4,428 3,603 4,428 3,603
Hire purchase liabilities – 341 – 341
Unsecured bank loans 199,935 199,869 199,935 199,869
Unsecured non-bank loans – – – –
Total non-current borrowings 204,363 203,813 204,363 203,813
Total borrowings 208,659 247,635 208,659 247,625
Current
Interest bearing borrowings 4,296 43,822 4,296 43,812
Non-current
Interest bearing borrowings 204,363 203,813 204,363 203,813
Total borrowings 208,659 247,635 208,659 247,625
(a) Assets pledged as security
Non-current
Finance lease
Plant and equipment 15 15,234 13,121 14,209 12,096
Total non-current assets pledged as security 15,234 13,121 14,209 12,096
(b) Financing arrangements
Unrestricted access was available at balance date to the following lines of credit:
Loan facilities
Total facilities 300,000 340,000 300,000 340,000
Used at balance date 200,000 240,000 200,000 240,000
Unused at balance date 100,000 100,000 100,000 100,000
Borrowing commitments
Within one year – 40,000 – 40,000
Later than one year but not later than five years 200,000 200,000 200,000 200,000
Later than five years – – – –
Total borrowing commitments 200,000 240,000 200,000 240,000
(c) Interest rate risk exposuresDetails of the entity’s exposure to interest rate changes on borrowings are set out in note 34.
(d) Fair value disclosuresDetails of fair value of borrowings for the entity are set out in note 34.
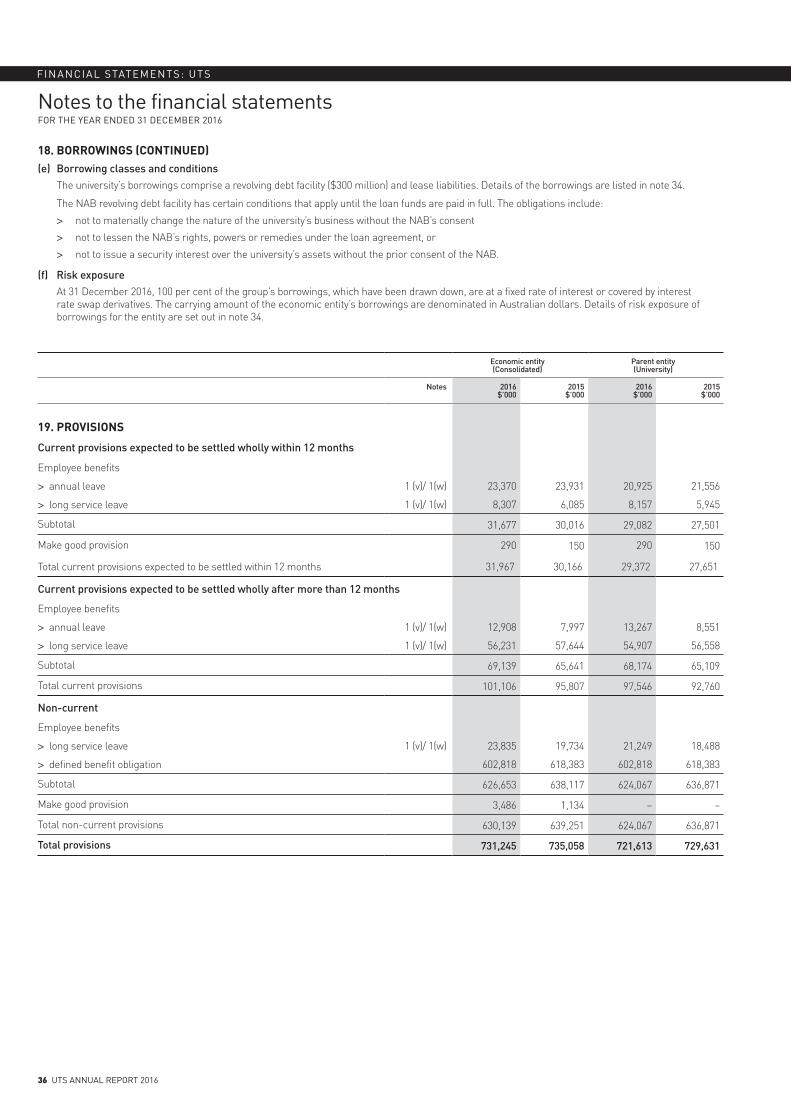
Notes to the financial statementsFOR THE YEAR ENDED 31 DECEMBER 2016
FINANCIAL STATEMENTS: UTS
36 UTS ANNUAL REPORT 2016
18. BORROWINGS (CONTINUED)(e) Borrowing classes and conditions
The university’s borrowings comprise a revolving debt facility ($300 million) and lease liabilities. Details of the borrowings are listed in note 34.
The NAB revolving debt facility has certain conditions that apply until the loan funds are paid in full. The obligations include:
> not to materially change the nature of the university’s business without the NAB’s consent
> not to lessen the NAB’s rights, powers or remedies under the loan agreement, or
> not to issue a security interest over the university’s assets without the prior consent of the NAB.
(f) Risk exposureAt 31 December 2016, 100 per cent of the group’s borrowings, which have been drawn down, are at a fixed rate of interest or covered by interest rate swap derivatives. The carrying amount of the economic entity’s borrowings are denominated in Australian dollars. Details of risk exposure of borrowings for the entity are set out in note 34.
Economic entity (Consolidated)
Parent entity (University)
Notes 2016$’000
2015$’000
2016$’000
2015$’000
19. PROVISIONS
Current provisions expected to be settled wholly within 12 months
Employee benefits
> annual leave 1 (v)/ 1(w) 23,370 23,931 20,925 21,556
> long service leave 1 (v)/ 1(w) 8,307 6,085 8,157 5,945
Subtotal 31,677 30,016 29,082 27,501
Make good provision 290 150 290 150
Total current provisions expected to be settled within 12 months 31,967 30,166 29,372 27,651
Current provisions expected to be settled wholly after more than 12 months
Employee benefits
> annual leave 1 (v)/ 1(w) 12,908 7,997 13,267 8,551
> long service leave 1 (v)/ 1(w) 56,231 57,644 54,907 56,558
Subtotal 69,139 65,641 68,174 65,109
Total current provisions 101,106 95,807 97,546 92,760
Non-current
Employee benefits
> long service leave 1 (v)/ 1(w) 23,835 19,734 21,249 18,488
> defined benefit obligation 602,818 618,383 602,818 618,383
Subtotal 626,653 638,117 624,067 636,871
Make good provision 3,486 1,134 – –
Total non-current provisions 630,139 639,251 624,067 636,871
Total provisions 731,245 735,058 721,613 729,631
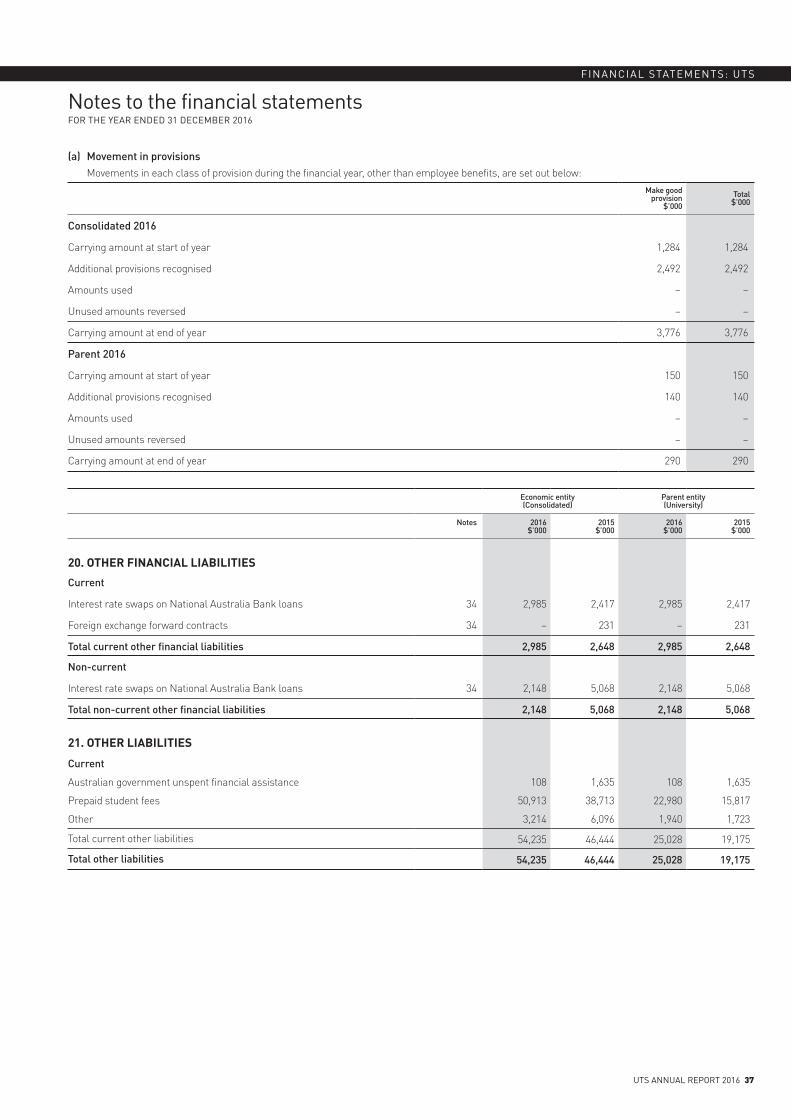
Notes to the financial statementsFOR THE YEAR ENDED 31 DECEMBER 2016
UTS ANNUAL REPORT 2016 37
FINANCIAL STATEMENTS: UTS
(a) Movement in provisionsMovements in each class of provision during the financial year, other than employee benefits, are set out below:
Make good provision
$’000Total
$’000
Consolidated 2016
Carrying amount at start of year 1,284 1,284
Additional provisions recognised 2,492 2,492
Amounts used – –
Unused amounts reversed – –
Carrying amount at end of year 3,776 3,776
Parent 2016
Carrying amount at start of year 150 150
Additional provisions recognised 140 140
Amounts used – –
Unused amounts reversed – –
Carrying amount at end of year 290 290
Economic entity (Consolidated)
Parent entity (University)
Notes 2016$’000
2015$’000
2016$’000
2015$’000
20. OTHER FINANCIAL LIABILITIES
Current
Interest rate swaps on National Australia Bank loans 34 2,985 2,417 2,985 2,417
Foreign exchange forward contracts 34 – 231 – 231
Total current other financial liabilities 2,985 2,648 2,985 2,648
Non-current
Interest rate swaps on National Australia Bank loans 34 2,148 5,068 2,148 5,068
Total non-current other financial liabilities 2,148 5,068 2,148 5,068
21. OTHER LIABILITIES
Current
Australian government unspent financial assistance 108 1,635 108 1,635
Prepaid student fees 50,913 38,713 22,980 15,817
Other 3,214 6,096 1,940 1,723
Total current other liabilities 54,235 46,444 25,028 19,175
Total other liabilities 54,235 46,444 25,028 19,175
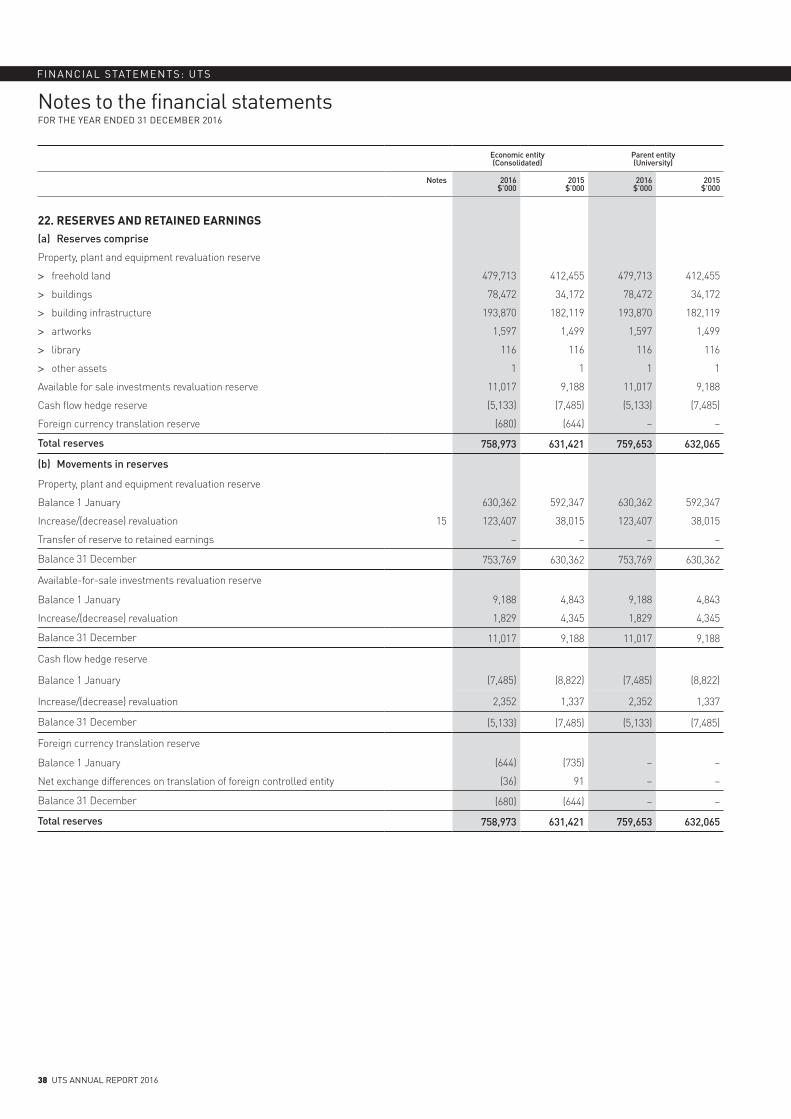
Notes to the financial statementsFOR THE YEAR ENDED 31 DECEMBER 2016
FINANCIAL STATEMENTS: UTS
38 UTS ANNUAL REPORT 2016
Economic entity (Consolidated)
Parent entity (University)
Notes 2016$’000
2015$’000
2016$’000
2015$’000
22. RESERVES AND RETAINED EARNINGS(a) Reserves comprise
Property, plant and equipment revaluation reserve
> freehold land 479,713 412,455 479,713 412,455
> buildings 78,472 34,172 78,472 34,172
> building infrastructure 193,870 182,119 193,870 182,119
> artworks 1,597 1,499 1,597 1,499
> library 116 116 116 116
> other assets 1 1 1 1
Available for sale investments revaluation reserve 11,017 9,188 11,017 9,188
Cash flow hedge reserve (5,133) (7,485) (5,133) (7,485)
Foreign currency translation reserve (680) (644) – –
Total reserves 758,973 631,421 759,653 632,065
(b) Movements in reserves
Property, plant and equipment revaluation reserve
Balance 1 January 630,362 592,347 630,362 592,347
Increase/(decrease) revaluation 15 123,407 38,015 123,407 38,015
Transfer of reserve to retained earnings – – – –
Balance 31 December 753,769 630,362 753,769 630,362
Available-for-sale investments revaluation reserve
Balance 1 January 9,188 4,843 9,188 4,843
Increase/(decrease) revaluation 1,829 4,345 1,829 4,345
Balance 31 December 11,017 9,188 11,017 9,188
Cash flow hedge reserve
Balance 1 January (7,485) (8,822) (7,485) (8,822)
Increase/(decrease) revaluation 2,352 1,337 2,352 1,337
Balance 31 December (5,133) (7,485) (5,133) (7,485)
Foreign currency translation reserve
Balance 1 January (644) (735) – –
Net exchange differences on translation of foreign controlled entity (36) 91 – –
Balance 31 December (680) (644) – –
Total reserves 758,973 631,421 759,653 632,065
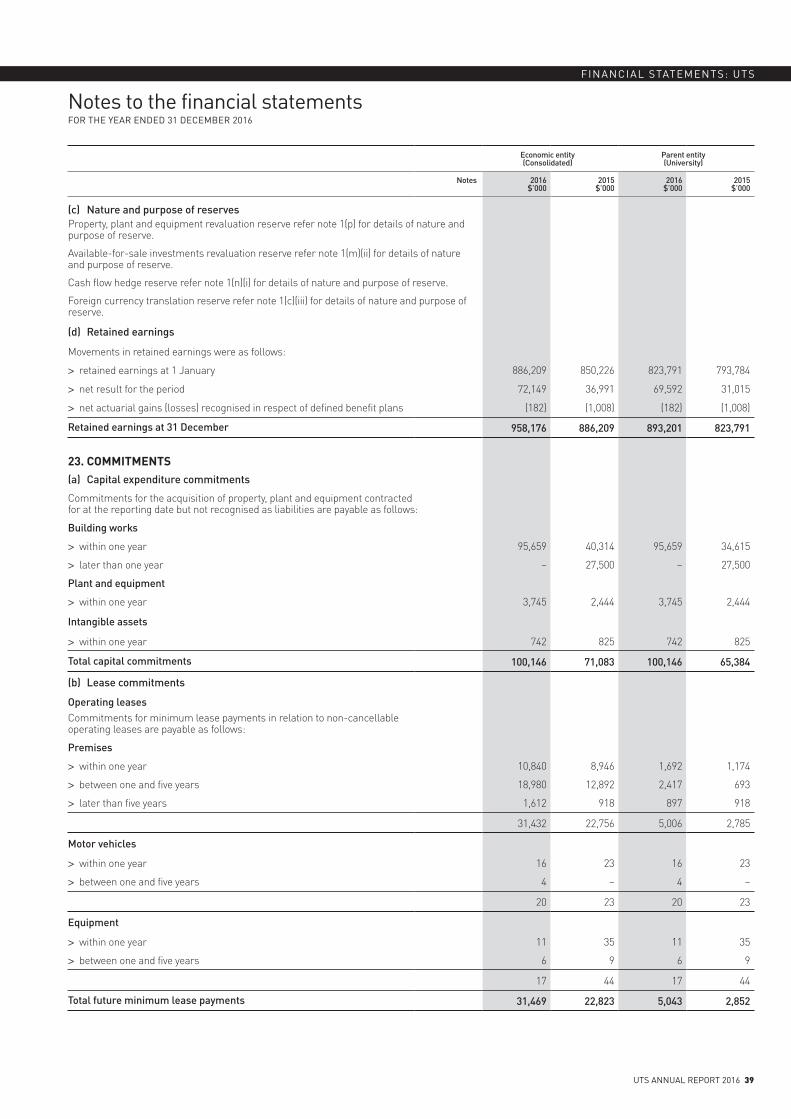
Notes to the financial statementsFOR THE YEAR ENDED 31 DECEMBER 2016
UTS ANNUAL REPORT 2016 39
FINANCIAL STATEMENTS: UTS
Economic entity (Consolidated)
Parent entity (University)
Notes 2016$’000
2015$’000
2016$’000
2015$’000
(c) Nature and purpose of reservesProperty, plant and equipment revaluation reserve refer note 1(p) for details of nature and purpose of reserve.
Available-for-sale investments revaluation reserve refer note 1(m)(ii) for details of nature and purpose of reserve.
Cash flow hedge reserve refer note 1(n)(i) for details of nature and purpose of reserve.
Foreign currency translation reserve refer note 1(c)(iii) for details of nature and purpose of reserve.
(d) Retained earnings
Movements in retained earnings were as follows:
> retained earnings at 1 January 886,209 850,226 823,791 793,784
> net result for the period 72,149 36,991 69,592 31,015
> net actuarial gains (losses) recognised in respect of defined benefit plans (182) (1,008) (182) (1,008)
Retained earnings at 31 December 958,176 886,209 893,201 823,791
23. COMMITMENTS(a) Capital expenditure commitments
Commitments for the acquisition of property, plant and equipment contracted for at the reporting date but not recognised as liabilities are payable as follows:
Building works
> within one year 95,659 40,314 95,659 34,615
> later than one year – 27,500 – 27,500
Plant and equipment
> within one year 3,745 2,444 3,745 2,444
Intangible assets
> within one year 742 825 742 825
Total capital commitments 100,146 71,083 100,146 65,384
(b) Lease commitments
Operating leasesCommitments for minimum lease payments in relation to non-cancellable operating leases are payable as follows:
Premises
> within one year 10,840 8,946 1,692 1,174
> between one and five years 18,980 12,892 2,417 693
> later than five years 1,612 918 897 918
31,432 22,756 5,006 2,785
Motor vehicles
> within one year 16 23 16 23
> between one and five years 4 – 4 –
20 23 20 23
Equipment
> within one year 11 35 11 35
> between one and five years 6 9 6 9
17 44 17 44
Total future minimum lease payments 31,469 22,823 5,043 2,852
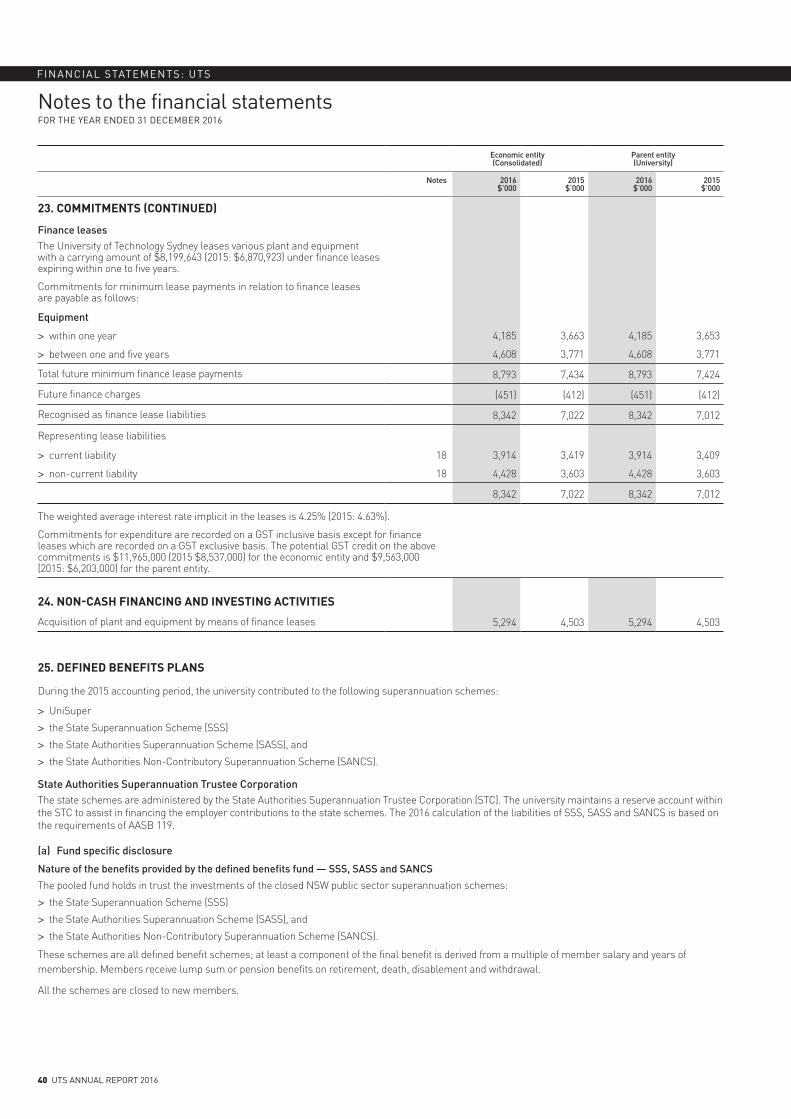
Notes to the financial statementsFOR THE YEAR ENDED 31 DECEMBER 2016
FINANCIAL STATEMENTS: UTS
40 UTS ANNUAL REPORT 2016
Economic entity (Consolidated)
Parent entity (University)
Notes 2016$’000
2015$’000
2016$’000
2015$’000
23. COMMITMENTS (CONTINUED)
Finance leasesThe University of Technology Sydney leases various plant and equipment with a carrying amount of $8,199,643 (2015: $6,870,923) under finance leases expiring within one to five years.
Commitments for minimum lease payments in relation to finance leases are payable as follows:
Equipment
> within one year 4,185 3,663 4,185 3,653
> between one and five years 4,608 3,771 4,608 3,771
Total future minimum finance lease payments 8,793 7,434 8,793 7,424
Future finance charges (451) (412) (451) (412)
Recognised as finance lease liabilities 8,342 7,022 8,342 7,012
Representing lease liabilities
> current liability 18 3,914 3,419 3,914 3,409
> non-current liability 18 4,428 3,603 4,428 3,603
8,342 7,022 8,342 7,012
The weighted average interest rate implicit in the leases is 4.25% (2015: 4.63%).
Commitments for expenditure are recorded on a GST inclusive basis except for finance leases which are recorded on a GST exclusive basis. The potential GST credit on the above commitments is $11,965,000 (2015 $8,537,000) for the economic entity and $9,563,000 (2015: $6,203,000) for the parent entity.
24. NON-CASH FINANCING AND INVESTING ACTIVITIES
Acquisition of plant and equipment by means of finance leases 5,294 4,503 5,294 4,503
25. DEFINED BENEFITS PLANS
During the 2015 accounting period, the university contributed to the following superannuation schemes:
> UniSuper
> the State Superannuation Scheme (SSS)
> the State Authorities Superannuation Scheme (SASS), and
> the State Authorities Non-Contributory Superannuation Scheme (SANCS).
State Authorities Superannuation Trustee CorporationThe state schemes are administered by the State Authorities Superannuation Trustee Corporation (STC). The university maintains a reserve account within the STC to assist in financing the employer contributions to the state schemes. The 2016 calculation of the liabilities of SSS, SASS and SANCS is based on the requirements of AASB 119.
(a) Fund specific disclosure
Nature of the benefits provided by the defined benefits fund — SSS, SASS and SANCS
The pooled fund holds in trust the investments of the closed NSW public sector superannuation schemes:
> the State Superannuation Scheme (SSS)
> the State Authorities Superannuation Scheme (SASS), and
> the State Authorities Non-Contributory Superannuation Scheme (SANCS).
These schemes are all defined benefit schemes; at least a component of the final benefit is derived from a multiple of member salary and years of membership. Members receive lump sum or pension benefits on retirement, death, disablement and withdrawal.
All the schemes are closed to new members.

Notes to the financial statementsFOR THE YEAR ENDED 31 DECEMBER 2016
UTS ANNUAL REPORT 2016 41
FINANCIAL STATEMENTS: UTS
Description of the regulatory framework
The schemes in the pooled fund are established and governed by the following NSW legislation: Superannuation Act 1916, State Authorities Superannuation Act 1987, Police Regulation (Superannuation) Act 1906, State Authorities Non-Contributory Superannuation Act 1987, and their associated regulations.
The schemes in the pooled fund are exempt public sector superannuation schemes under the Superannuation Industry (Supervision) Act 1993 (Cwlth) (SIS Act). The SIS legislation treats exempt public sector superannuation funds as complying funds for concessional taxation and superannuation guarantee purposes.
Under a heads of government agreement, the New South Wales Government undertakes to ensure that the pooled fund will conform with the principles of the Commonwealth’s retirement incomes policy relating to preservation, vesting and reporting to members and that members’ benefits are adequately protected.
The New South Wales Government prudentially monitors and audits the pooled fund and the trustee board activities in a manner consistent with the prudential controls of the SIS legislation. These provisions are in addition to other legislative obligations on the trustee board and internal processes that monitor the trustee board’s adherence to the principles of the Commonwealth’s retirement incomes policy.
An actuarial investigation of the pooled fund is performed every three years. The last actuarial investigation was performed as at 30 June 2015. The next actuarial investigation will be performed at 30 June 2018.
Description of other entities’ responsibilities for the governance of the fund
The fund’s trustee is responsible for the governance of the fund. The trustee has a legal obligation to act solely in the best interests of fund beneficiaries. The trustee has the following roles:
> administration of the fund and payment to the beneficiaries from fund assets when required in accordance with the fund rules
> management and investment of the fund assets, and
> compliance with other applicable regulations.
Description of risks
There are a number of risks to which the fund exposes the employer. The more significant risks relating to the defined benefits are:
> Investment risk: The risk that investment returns will be lower than assumed and the employer will need to increase contributions to offset this shortfall.
> Longevity risk: The risk that pensioners live longer than assumed, increasing future pensions.
> Pension indexation risk: The risk that pensions will increase at a rate greater than assumed increasing future pensions.
> Salary growth risk: The risk that wages or salaries (on which future benefit amounts for active members will be based) will rise more rapidly than assumed increasing defined benefit amounts and thereby requiring additional employer contributions.
> Legislative risk: The risk is that legislative changes could be made that increase the cost of providing the defined benefits.
The defined benefit fund assets are invested with independent fund managers and have a diversified asset mix. The fund has no significant concentration of investment risk or liquidity risk.
Description of significant events
There were no fund amendments, curtailments or settlements during the year.
Expected contributions
The university expects to make the following contributions to the defined benefit plan during the next financial year:
SASS SANCS SSS Total
2016$
2015$
2016$
2015$
2016$
2015$
2016$
2015$
Expected employer contributions 571,565 475,986 164,997 138,513 453,267 393,559 1,189,829 1,008,058
Maturity profile of defined benefit obligation
The weighted average duration of the defined benefit obligation is 11.4 years (2015: 11.7 years).
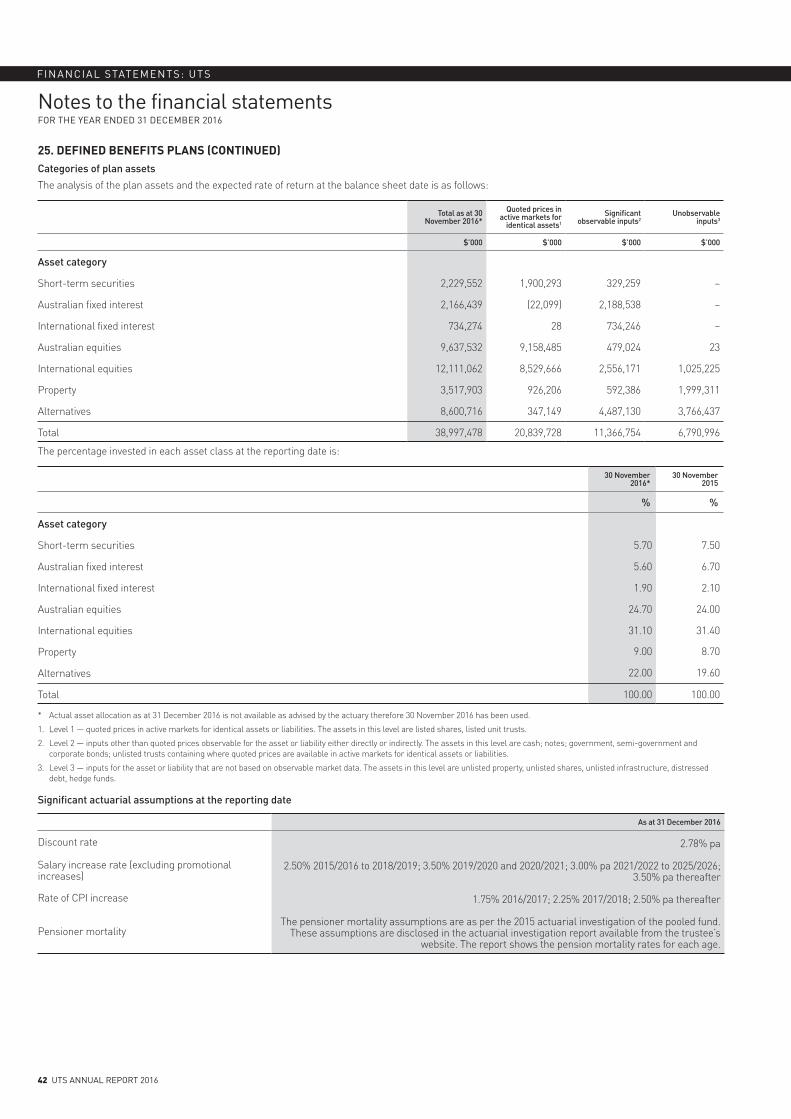
Notes to the financial statementsFOR THE YEAR ENDED 31 DECEMBER 2016
FINANCIAL STATEMENTS: UTS
42 UTS ANNUAL REPORT 2016
25. DEFINED BENEFITS PLANS (CONTINUED)Categories of plan assets
The analysis of the plan assets and the expected rate of return at the balance sheet date is as follows:
Total as at 30 November 2016*
Quoted prices in active markets for
identical assets1
Significant observable inputs2
Unobservable inputs3
$’000 $’000 $’000 $’000
Asset category
Short-term securities 2,229,552 1,900,293 329,259 –
Australian fixed interest 2,166,439 (22,099) 2,188,538 –
International fixed interest 734,274 28 734,246 –
Australian equities 9,637,532 9,158,485 479,024 23
International equities 12,111,062 8,529,666 2,556,171 1,025,225
Property 3,517,903 926,206 592,386 1,999,311
Alternatives 8,600,716 347,149 4,487,130 3,766,437
Total 38,997,478 20,839,728 11,366,754 6,790,996
The percentage invested in each asset class at the reporting date is:
30 November 2016*
30 November 2015
% %
Asset category
Short-term securities 5.70 7.50
Australian fixed interest 5.60 6.70
International fixed interest 1.90 2.10
Australian equities 24.70 24.00
International equities 31.10 31.40
Property 9.00 8.70
Alternatives 22.00 19.60
Total 100.00 100.00
* Actual asset allocation as at 31 December 2016 is not available as advised by the actuary therefore 30 November 2016 has been used.
1. Level 1 — quoted prices in active markets for identical assets or liabilities. The assets in this level are listed shares, listed unit trusts.
2. Level 2 — inputs other than quoted prices observable for the asset or liability either directly or indirectly. The assets in this level are cash; notes; government, semi-government and corporate bonds; unlisted trusts containing where quoted prices are available in active markets for identical assets or liabilities.
3. Level 3 — inputs for the asset or liability that are not based on observable market data. The assets in this level are unlisted property, unlisted shares, unlisted infrastructure, distressed debt, hedge funds.
Significant actuarial assumptions at the reporting date
As at 31 December 2016
Discount rate 2.78% pa
Salary increase rate (excluding promotional increases)
2.50% 2015/2016 to 2018/2019; 3.50% 2019/2020 and 2020/2021; 3.00% pa 2021/2022 to 2025/2026; 3.50% pa thereafter
Rate of CPI increase 1.75% 2016/2017; 2.25% 2017/2018; 2.50% pa thereafter
Pensioner mortalityThe pensioner mortality assumptions are as per the 2015 actuarial investigation of the pooled fund.
These assumptions are disclosed in the actuarial investigation report available from the trustee’s website. The report shows the pension mortality rates for each age.
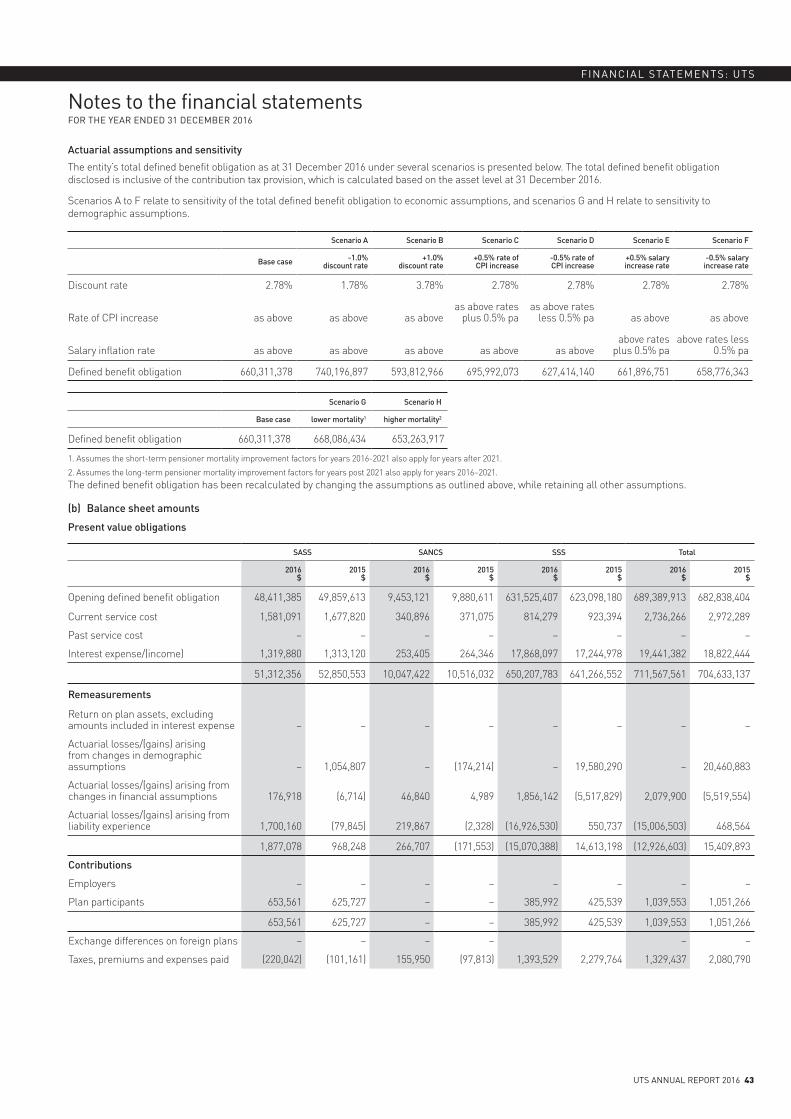
Notes to the financial statementsFOR THE YEAR ENDED 31 DECEMBER 2016
UTS ANNUAL REPORT 2016 43
FINANCIAL STATEMENTS: UTS
Actuarial assumptions and sensitivity
The entity’s total defined benefit obligation as at 31 December 2016 under several scenarios is presented below. The total defined benefit obligation disclosed is inclusive of the contribution tax provision, which is calculated based on the asset level at 31 December 2016.
Scenarios A to F relate to sensitivity of the total defined benefit obligation to economic assumptions, and scenarios G and H relate to sensitivity to demographic assumptions.
Scenario A Scenario B Scenario C Scenario D Scenario E Scenario F
Base case -1.0%discount rate
+1.0%discount rate
+0.5% rate ofCPI increase
-0.5% rate ofCPI increase
+0.5% salaryincrease rate
-0.5% salaryincrease rate
Discount rate 2.78% 1.78% 3.78% 2.78% 2.78% 2.78% 2.78%
Rate of CPI increase as above as above as aboveas above rates
plus 0.5% paas above rates
less 0.5% pa as above as above
Salary inflation rate as above as above as above as above as aboveabove rates
plus 0.5% paabove rates less
0.5% pa
Defined benefit obligation 660,311,378 740,196,897 593,812,966 695,992,073 627,414,140 661,896,751 658,776,343
Scenario G Scenario H
Base case lower mortality1 higher mortality2
Defined benefit obligation 660,311,378 668,086,434 653,263,917
1. Assumes the short-term pensioner mortality improvement factors for years 2016-2021 also apply for years after 2021.
2. Assumes the long-term pensioner mortality improvement factors for years post 2021 also apply for years 2016–2021.The defined benefit obligation has been recalculated by changing the assumptions as outlined above, while retaining all other assumptions.
(b) Balance sheet amounts
Present value obligations
SASS SANCS SSS Total
2016$
2015$
2016$
2015$
2016$
2015$
2016$
2015$
Opening defined benefit obligation 48,411,385 49,859,613 9,453,121 9,880,611 631,525,407 623,098,180 689,389,913 682,838,404
Current service cost 1,581,091 1,677,820 340,896 371,075 814,279 923,394 2,736,266 2,972,289
Past service cost – – – – – – – –
Interest expense/(income) 1,319,880 1,313,120 253,405 264,346 17,868,097 17,244,978 19,441,382 18,822,444
51,312,356 52,850,553 10,047,422 10,516,032 650,207,783 641,266,552 711,567,561 704,633,137
Remeasurements
Return on plan assets, excluding amounts included in interest expense – – – – – – – –
Actuarial losses/(gains) arising from changes in demographic assumptions – 1,054,807 – (174,214) – 19,580,290 – 20,460,883
Actuarial losses/(gains) arising from changes in financial assumptions 176,918 (6,714) 46,840 4,989 1,856,142 (5,517,829) 2,079,900 (5,519,554)
Actuarial losses/(gains) arising from liability experience 1,700,160 (79,845) 219,867 (2,328) (16,926,530) 550,737 (15,006,503) 468,564
1,877,078 968,248 266,707 (171,553) (15,070,388) 14,613,198 (12,926,603) 15,409,893
Contributions
Employers – – – – – – – –
Plan participants 653,561 625,727 – – 385,992 425,539 1,039,553 1,051,266
653,561 625,727 – – 385,992 425,539 1,039,553 1,051,266
Exchange differences on foreign plans – – – – – –
Taxes, premiums and expenses paid (220,042) (101,161) 155,950 (97,813) 1,393,529 2,279,764 1,329,437 2,080,790
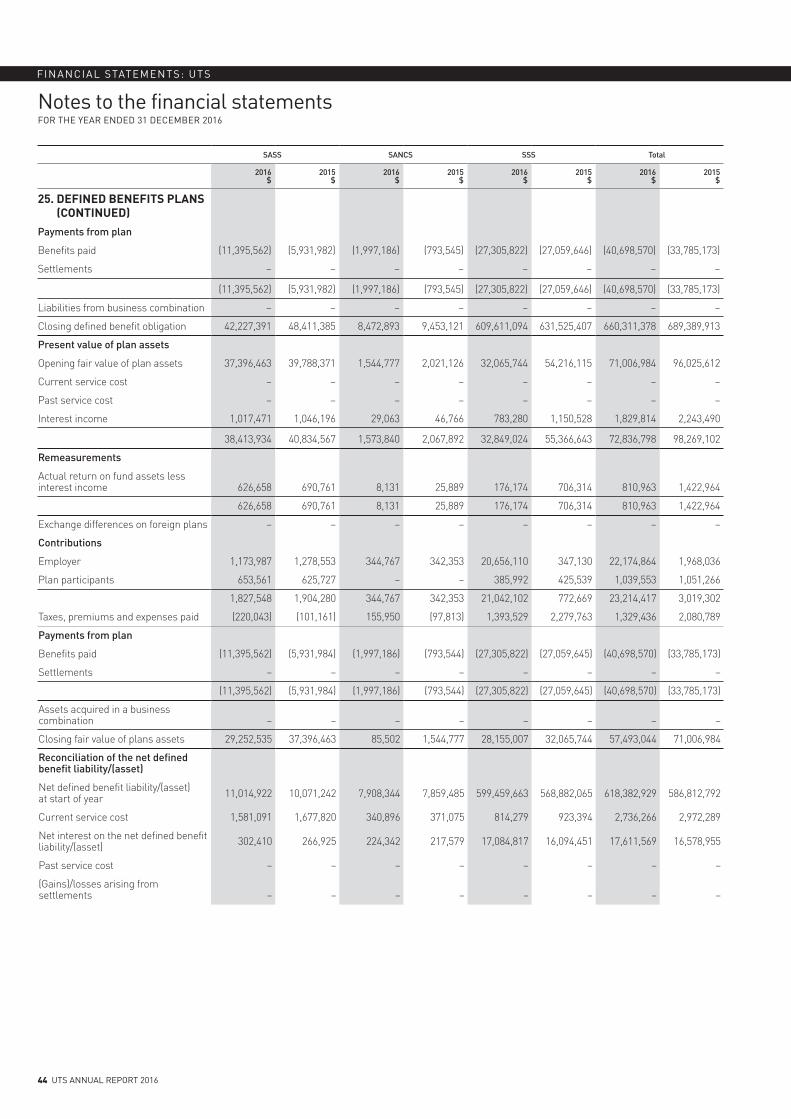
Notes to the financial statementsFOR THE YEAR ENDED 31 DECEMBER 2016
FINANCIAL STATEMENTS: UTS
44 UTS ANNUAL REPORT 2016
SASS SANCS SSS Total
2016$
2015$
2016$
2015$
2016$
2015$
2016$
2015$
25. DEFINED BENEFITS PLANS (CONTINUED)
Payments from plan
Benefits paid (11,395,562) (5,931,982) (1,997,186) (793,545) (27,305,822) (27,059,646) (40,698,570) (33,785,173)
Settlements – – – – – – – –
(11,395,562) (5,931,982) (1,997,186) (793,545) (27,305,822) (27,059,646) (40,698,570) (33,785,173)
Liabilities from business combination – – – – – – – –
Closing defined benefit obligation 42,227,391 48,411,385 8,472,893 9,453,121 609,611,094 631,525,407 660,311,378 689,389,913
Present value of plan assets
Opening fair value of plan assets 37,396,463 39,788,371 1,544,777 2,021,126 32,065,744 54,216,115 71,006,984 96,025,612
Current service cost – – – – – – – –
Past service cost – – – – – – – –
Interest income 1,017,471 1,046,196 29,063 46,766 783,280 1,150,528 1,829,814 2,243,490
38,413,934 40,834,567 1,573,840 2,067,892 32,849,024 55,366,643 72,836,798 98,269,102
Remeasurements
Actual return on fund assets less interest income 626,658 690,761 8,131 25,889 176,174 706,314 810,963 1,422,964
626,658 690,761 8,131 25,889 176,174 706,314 810,963 1,422,964
Exchange differences on foreign plans – – – – – – – –
Contributions
Employer 1,173,987 1,278,553 344,767 342,353 20,656,110 347,130 22,174,864 1,968,036
Plan participants 653,561 625,727 – – 385,992 425,539 1,039,553 1,051,266
1,827,548 1,904,280 344,767 342,353 21,042,102 772,669 23,214,417 3,019,302
Taxes, premiums and expenses paid (220,043) (101,161) 155,950 (97,813) 1,393,529 2,279,763 1,329,436 2,080,789
Payments from plan
Benefits paid (11,395,562) (5,931,984) (1,997,186) (793,544) (27,305,822) (27,059,645) (40,698,570) (33,785,173)
Settlements – – – – – – – –
(11,395,562) (5,931,984) (1,997,186) (793,544) (27,305,822) (27,059,645) (40,698,570) (33,785,173)
Assets acquired in a business combination – – – – – – – –
Closing fair value of plans assets 29,252,535 37,396,463 85,502 1,544,777 28,155,007 32,065,744 57,493,044 71,006,984
Reconciliation of the net defined benefit liability/(asset)
Net defined benefit liability/(asset) at start of year 11,014,922 10,071,242 7,908,344 7,859,485 599,459,663 568,882,065 618,382,929 586,812,792
Current service cost 1,581,091 1,677,820 340,896 371,075 814,279 923,394 2,736,266 2,972,289
Net interest on the net defined benefit liability/(asset) 302,410 266,925 224,342 217,579 17,084,817 16,094,451 17,611,569 16,578,955
Past service cost – – – – – – – –
(Gains)/losses arising from settlements – – – – – – – –

Notes to the financial statementsFOR THE YEAR ENDED 31 DECEMBER 2016
UTS ANNUAL REPORT 2016 45
FINANCIAL STATEMENTS: UTS
SASS SANCS SSS Total
2016$
2015$
2016$
2015$
2016$
2015$
2016$
2015$
Reconciliation of the net defined benefit liability/(asset) (continued)
Actual return on fund assets less interest income (626,658) (690,761) (8,130) (25,889) (176,174) (706,314) (810,962) (1,422,964)
Actuarial (gains)/losses arising from changes in demographic assumptions – 1,054,807 – (174,214) – 19,580,290 – 20,460,883
Actuarial (gains)/losses arising from changes in financial assumptions 176,918 (6,714) 46,840 4,989 1,856,142 (5,517,829) 2,079,900 (5,519,554)
Actuarial (gains)/losses arising from liability experience 1,700,160 (79,845) 219,867 (2,328) (16,926,530) 550,737 (15,006,503) 468,564
Adjustment for effect of asset ceiling – – – – – – – –
Employer contributions (1,173,987) (1,278,552) (344,767) (342,353) (20,656,110) (347,131) (22,174,864) (1,968,036)
Net defined benefit liability/ (asset) at end of year note 19 12,974,856 11,014,922 8,387,392 7,908,344 581,456,087 599,459,663 602,818,335 618,382,929
Impact of asset ceiling
Adjustment for the effect of asset ceiling at beginning of the year – – – – – – – –
Change in the effect of asset ceiling – – – – – – – –
Adjustment for the effect of asset ceiling at end of the year – – – – – – – –
Reimbursement rights
Opening value of reimbursement right 10,538,936 10,071,242 7,769,831 7,859,485 599,066,104 568,882,065 617,374,871 586,812,792
Expected return on reimbursement rights 1,864,355 467,694 452,564 (89,654) (18,063,284) 30,184,039 (15,746,365) 30,562,079
Closing value of reimbursement right 12,403,291 10,538,936 8,222,395 7,769,831 581,002,820 599,066,104 601,628,506 617,374,871
Net liability
Defined benefit obligation 42,227,391 48,411,385 8,472,893 9,453,121 609,611,094 631,525,407 660,311,378 689,389,913
Fair value of plan assets (29,252,535) (37,396,463) (85,502) (1,544,777) (28,155,007) (32,065,744) (57,493,044) (71,006,984)
Net liability note 19 12,974,856 11,014,922 8,387,391 7,908,344 581,456,087 599,459,663 602,818,334 618,382,929
Reimbursement right note 10 12,403,291 10,538,936 8,222,395 7,769,831 581,002,820 599,066,104 601,628,506 617,374,871
Net liability/(asset) in balance sheet 571,565 475,986 164,996 138,513 453,267 393,559 1,189,828 1,008,058
Amounts recognised in the statement of financial position
Liabilities
Provision for deferred government benefits for superannuation 12,974,856 11,014,922 8,387,391 7,908,344 581,456,087 599,459,663 602,818,334 618,382,929
Total liabilities recognised in statement of financial position 12,974,856 11,014,922 8,387,391 7,908,344 581,456,087 599,459,663 602,818,334 618,382,929
Assets
Receivable for deferred government contribution for superannuation 12,403,291 10,538,936 8,222,395 7,769,831 581,002,820 599,066,104 601,628,506 617,374,871
Total assets recognised in statement of financial position 12,403,291 10,538,936 8,222,395 7,769,831 581,002,820 599,066,104 601,628,506 617,374,871
Net liability recognised in the statement of financial position 571,565 475,986 164,996 138,513 453,267 393,559 1,189,828 1,008,058

Notes to the financial statementsFOR THE YEAR ENDED 31 DECEMBER 2016
FINANCIAL STATEMENTS: UTS
46 UTS ANNUAL REPORT 2016
SASS SANCS SSS Total
2016$
2015$
2016$
2015$
2016$
2015$
2016$
2015$
25. DEFINED BENEFITS PLANS (CONTINUED)
Amounts recognised in other statements
Amounts recognised in the income statement — expense recognised
Current service cost 1,581,091 1,677,820 340,896 371,075 814,279 923,394 2,736,266 2,972,289
Net interest 302,410 266,925 224,343 217,579 17,084,817 16,094,451 17,611,570 16,578,955
Expected return on plan assets – – – – – – – –
Past service costs – – – – – – – –
Losses/(gains) arising from curtailments or settlements – – – – – – – –
Expense/(income) 1,883,501 1,944,745 565,239 588,654 17,899,096 17,017,845 20,347,836 19,551,244
Other comprehensive income
Actuarial losses/(gains) on liabilities 1,877,078 968,248 266,707 (171,553) (15,070,388) 14,613,198 (12,926,603) 15,409,893
Actual return on fund assets less interest income (626,658) (690,761) (8,130) (25,889) (176,174) (706,314) (810,962) (1,422,964)
Recognised in other comprehensive income 1,250,420 277,487 258,577 (197,442) (15,246,562) 13,906,884 (13,737,565) 13,986,929
UniSuper Management LimitedThe university contributes to UniSuper for non-academic staff appointed since 1 July 1991 and academic staff appointed since 1 March 1998. UniSuper offers both a defined benefit scheme and an accumulation scheme with a range of investment options.
> The UniSuper Defined Benefit Division (DBD) is a defined benefit plan under superannuation law but is considered to be a defined contribution plan under Accounting Standard AASB 119.
> During the 2006 year clause 34 of the UniSuper Trust Deed was amended which substantially transfers the actuarial risks from the employer to the employee. The amendment to the trust deed has resulted in the UniSuper defined benefit fund to be reclassified as a defined contribution fund for the purposes of AASB 119 Employee Benefits.
> As at 30 June 2016, the assets of the DBD in aggregate were estimated to be $2.252 million above vested benefits, after allowing for various reserves. The vested benefit index based on funding assumptions was 112.2 per cent. The vested benefits are benefits that are not conditional upon continued membership (or any factor other than leaving the service of the participating institution) and include the value of indexed pensions being provided by the DBD.
> As at 30 June 2016, the assets of the DBD in aggregate were estimated to be $3.757 million above accrued benefits, after allowing for various reserves. The accrued benefit index based on best estimate assumptions was 122.2 per cent. The accrued benefits have been calculated as the present value of expected future benefit payments to members and indexed pensioners that arise from membership of UniSuper up to the reporting date.
> The vested benefit and accrued benefit liabilities were determined by the fund’s actuary using the actuarial demographic assumptions outlined in their report on the actuarial investigation of the DBD as at 1 July 2016. The financial assumptions used were:
Vested benefits
Accrued benefits
% pa % pa
Gross of tax investment return — DBD pensions 5.30 6.90
Gross of tax investment return — commercial rate indexed pensions 3.70 3.70
Net of tax investment return — non-pensioner members 4.60 6.10
Consumer Price Index 2.50 2.50
Inflationary salary increases long term 3.50 3.50
> Assets have been included at their net market value, that is allowing for realisation costs.
> Clause 34 monitoring periods were initiated following the 30 June 2012 and 30 June 2013 actuarial investigations.
> Following the end of the monitoring period commencing on 30 June 2012, the fund’s actuary advised that the trustee is not required to take any further action, and that monitoring period is now ceased.
> The monitoring period commencing on 30 June 2013 is still in place.
Notes to the financial statementsFOR THE YEAR ENDED 31 DECEMBER 2016
UTS ANNUAL REPORT 2016 47
FINANCIAL STATEMENTS: UTS
26. CONTINGENT ASSETS AND CONTINGENT LIABILITIES
(a) Contingent assets The university carries out various research projects and has developed intellectual properties and registered patents. At the commercialisation of these the university may realise a future monetary benefit.
(b) Contingent liabilities > Consequent upon the HIH Insurance Group being placed in provisional liquidation on 16 March 2001, the university may have an exposure to the
non-settlement of potential public liability claims. The extent of any potential exposure cannot be estimated.
> The federal and New South Wales governments have signed a memorandum of understanding (MOU) for the financial assistance of unfunded superannuation liabilities of New South Wales universities. Although the agreement provides funding to NSW universities for their liability in relation to the unfunded defined benefit plans any deemed liability resulting from payment of excess salaries (as defined in the MOU) is not covered under the agreement and therefore the liability remains with the university. To date an amount of $58,000 has been paid to the trustee for university employees who are members of the relevant superannuation plans. In addition there is an emerging excess salary liability of $1.19m, which has been recognised in the statement of other comprehensive income.
> There are ongoing legal matters where it is still not practical to estimate the potential effect of these matters but, legal advice indicates, based on current information, that any liabilities that may arise in the event that the claims are successful are unlikely to be significant in the context of the university’s business.
> The university has provided a financial guarantee for the Insearch Limited lease on 645 Harris St, Ultimo. The university does not expect a financial obligation to arise from this guarantee.
The university is not aware of any other contingent liabilities.
27. ECONOMIC DEPENDENCY
The university has no economic dependency on any other economic entity not clearly discernable in the income statement or statement of financial position.
28. SUBSIDIARIES
The consolidated financial statements incorporate the assets, liabilities and results of the following subsidiaries in accordance with the accounting policy specified in note 1(b).
Ownership interest/control Equity
Name of entity Principal activities
Principal place of business
2016%
2015%
2016$’000
2015$’000
Parent entity
University of Technology Sydney Education services Australia – – 1,654,711 1,460,458
Controlled entities
Insearch Limited (company limited by guarantee)1 Education services Australia 100 100 61,316 55,914
Insearch (Shanghai) Limited Education services China 100 100 474 379
Insearch Education International Pty Limited Education services Australia 100 100 184 184
accessUTS Pty Limited Consulting Australia 100 100 585 562
UTS Global Pty Ltd Marketing services Australia 100 100 247 134
UTS Beijing Ltd Marketing services China 100 100 (59) 59
Piivot Pty Ltd Australia 100 100 (309) (60)
1. Insearch Limited is a controlled entity limited by guarantee. The Insearch Limited constitution prohibits the income or property of the company to be paid directly or indirectly, by way of dividend, bonus or otherwise, to the members of the company.
The above companies are consolidated in the university statutory accounts under AASB10 Consolidated Financial Statements.
Notes to the financial statementsFOR THE YEAR ENDED 31 DECEMBER 2016
FINANCIAL STATEMENTS: UTS
48 UTS ANNUAL REPORT 2016
29. RELATED PARTIES(a) Parent entities
The ultimate parent entity within the group is the University of Technology Sydney.
(b) SubsidiariesInterests in subsidiaries are set out in note 28.
(c) Key management personnelDisclosures relating to responsible persons and executive officers are set out in note 7.
(d) Transactions with related parties in the wholly owned group
The parent entity entered into the following transactions during the period with related parties in the group.
> Donations amounting to $7,695,356 (2015: $7,408,751) were paid or payable to the ultimate controlling entity.
> Donations amounting to $470,000 (2015: $400,750) were paid by the ultimate controlling entity to subsidiaries.
> Sale of services and fees $28,931,784 (2015: $21,911,860) to the wholly owned University of Technology Sydney group.
> Purchase of services and fees $22,098,460 (2015: $15,314,709) by the wholly owned University of Technology Sydney group.
> Purchase of shares in a subsidiary $0 (2015: $100) by the wholly owned University of Technology Sydney group.
(e) Outstanding balances
Economic entity (Consolidated)
Parent entity(University)
2016$’000
2015$’000
2016$’000
2015$’000
Current receivables
Subsidiaries – – 1,825 1,487
Current receivables (loans)
Subsidiaries – – 335 335
Current payables
Subsidiaries – – 104 1,016
Included in the total doubtful debts provision in the parent entity is a provision of $0 (2015: $0) for doubtful debts for outstanding balances due from related parties.
Revenue Results Assets
2016$’000
2015$’000
2016$’000
2015$’000
2016$’000
2015$’000
30. DISAGGREGATION INFORMATION (CONSOLIDATED)
Geographical (consolidated entity)
Australia 928,862 821,468 68,636 32,953 2,768,089 2,605,586
China 6,707 5,658 3,519 3,997 3,435 3,273
United Kingdom – – – – 675 675
South-East Asia 9 87 (6) 41 – –
Total 935,578 827,213 72,149 36,991 2,772,199 2,609,534
(a) Includes discontinued operations.
31. EVENTS OCCURRING AFTER THE BALANCE SHEET DATE
The university is not aware of any other subsequent events which have affected the reported result.

Notes to the financial statementsFOR THE YEAR ENDED 31 DECEMBER 2016
UTS ANNUAL REPORT 2016 49
FINANCIAL STATEMENTS: UTS
Economic entity (Consolidated)
Parent entity (University)
2016$’000
2015$’000
2016$’000
2015$’000
32. RECONCILIATION OF NET RESULT AFTER INCOME TAX TO NET CASH FLOWS FROM OPERATING ACTIVITIES
Net result for the period 72,149 36,991 69,592 31,015
Depreciation, amortisation and impairment PPE and intangibles 81,692 77,884 76,738 73,817
Increase/(decrease) in provisions:
> annual leave 4,350 2,168 4,085 1,962
> doubtful debts 247 285 197 322
> long service leave 4,910 4,504 3,322 4,162
> deferred superannuation (15,565) 31,570 (15,565) 31,570
Decrease/(increase) in receivables (3,854) 195 (4,541) (123)
Decrease/(increase) in non-current receivables 15,746 (30,562) 15,746 (30,562)
Decrease/(increase) in prepayments and accrued income (9,972) 143 (9,228) (71)
(Decrease)/increase in accounts payable (8,206) 15,415 (4,605) 13,211
(Decrease)/increase in income in advance 7,791 (568) 5,853 752
Amortisation of prepaid borrowing costs 63 65 63 65
(Profit)/loss on sale of assets 454 287 (25) 248
Share of profit of joint venture not received as dividends or distribution 4,286 (1,077) – –
Fair value gains on other financial assets at fair value through profit or loss (1,064) (1,232) (1,064) (1,232)
Actuarial gain/(loss) on deferred superannuation (182) (1,008) (182) (1,008)
Net cash provided by operating activities 152,845 135,060 140,386 124,128
Notes to the financial statementsFOR THE YEAR ENDED 31 DECEMBER 2016
FINANCIAL STATEMENTS: UTS
50 UTS ANNUAL REPORT 2016
33. ACQUITTAL OF AUSTRALIAN GOVERNMENT FINANCIAL ASSISTANCE33.1 Education — CGS and other education grants
Parent entity (University) only
Commonwealth Grant Scheme1
Indigenous Support Program
Partnership and Participation Program2
Disability Support Program
Notes 2016$’000
2015$’000
2016$’000
2015$’000
2016$’000
2015$’000
2016$’000
2015$’000
Financial assistance received in cash during the reporting period (total cash received from the Australian Government for the program) 207,981 180,628 741 836 3,308 3,259 382 408
Net accrual adjustments 1,216 – – – – – – –
Revenue for the period 2.1 (a) 209,197 180,628 741 836 3,308 3,259 382 408
Surplus/(deficit) from the previous year – – – – – – – –
Total revenue including accrued revenue 209,197 180,628 741 836 3,308 3,259 382 408
Less expenses including accrued expenses (209,197) (180,628) (741) (836) (3,308) (3,259) (382) (408)
Surplus/(deficit) for reporting period – – – – – – – –
Parent entity (University) only
Promotion of Excellence in Teaching in Higher
Education
Australian Maths and Science Partnership
ProgramTotal
Notes 2016$’000
2015$’000
2016$’000
2015$’000
2016$’000
2015$’000
Financial assistance received in cash during the reporting period (total cash received from the Australian Government for the program) 1,173 123 819 603 214,404 185,857
Net accrual adjustments – – – – 1,216 –
Revenue for the period 1,173 123 819 603 215,620 185,857
Surplus/(deficit) from the previous year
Total revenue including accrued revenue 1,173 123 819 603 215,620 185,857
Less expenses including accrued expenses (1,173) (123) (819) (603) (215,620) (185,857)
Surplus/(deficit) for reporting period – – – – – –
1. Includes the basic CGS grant amount, CGS — regional loading, CGS — enabling loading, and CGS — special advances from future years.
2. Includes Access and Participation Fund.
33.2 Higher education loan programs (excluding OS-HELP)
Parent entity (University) only
HECS-HELP (Australian Government
payments only)
FEE-HELP
SA-HELP
Total
Notes 2016$’000
2015$’000
2016$’000
2015$’000
2016$’000
2015$’000
2016$’000
2015$’000
Cash payable/(receivable) at beginning of year 1,635 1,823 896 (58) 14 (13) 2,545 1,752
Financial assistance received in cash during the reporting period 142,460 128,559 43,104 40,416 3,057 2,941 188,621 171,916
Cash available for period 144,095 130,382 44,000 40,358 3,071 2,928 191,166 173,668
Net accrual adjustments 199 (1,635) (421) (896) 95 (14) (127) (2,545)
Revenue for the period 2.1 (b) 144,294 128,747 43,579 39,462 3,166 2,914 191,039 171,123
Cash payable/(receivable) at end of year (199) 1,635 421 896 (95) 14 127 2,545
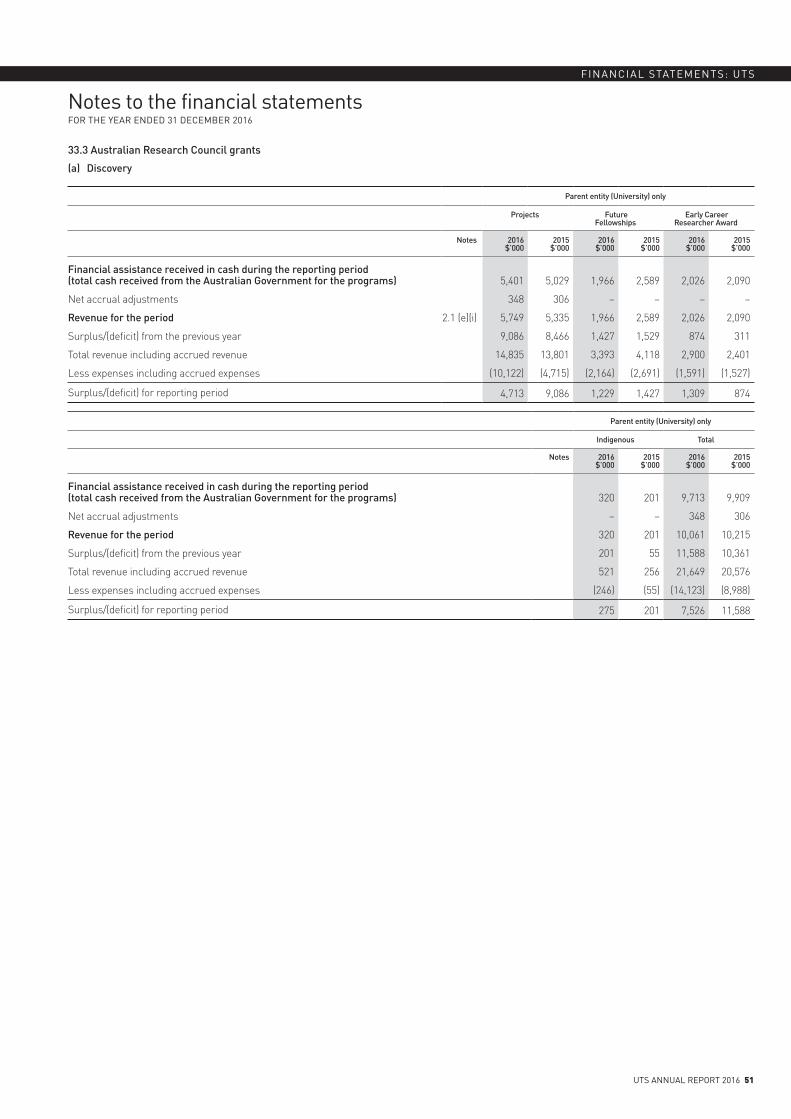
Notes to the financial statementsFOR THE YEAR ENDED 31 DECEMBER 2016
UTS ANNUAL REPORT 2016 51
FINANCIAL STATEMENTS: UTS
33.3 Australian Research Council grants
(a) Discovery
Parent entity (University) only
Projects Future Fellowships
Early Career Researcher Award
Notes 2016$’000
2015$’000
2016$’000
2015$’000
2016$’000
2015$’000
Financial assistance received in cash during the reporting period (total cash received from the Australian Government for the programs) 5,401 5,029 1,966 2,589 2,026 2,090
Net accrual adjustments 348 306 – – – –
Revenue for the period 2.1 (e)(i) 5,749 5,335 1,966 2,589 2,026 2,090
Surplus/(deficit) from the previous year 9,086 8,466 1,427 1,529 874 311
Total revenue including accrued revenue 14,835 13,801 3,393 4,118 2,900 2,401
Less expenses including accrued expenses (10,122) (4,715) (2,164) (2,691) (1,591) (1,527)
Surplus/(deficit) for reporting period 4,713 9,086 1,229 1,427 1,309 874
Parent entity (University) only
Indigenous Total
Notes 2016$’000
2015$’000
2016$’000
2015$’000
Financial assistance received in cash during the reporting period (total cash received from the Australian Government for the programs) 320 201 9,713 9,909
Net accrual adjustments – – 348 306
Revenue for the period 320 201 10,061 10,215
Surplus/(deficit) from the previous year 201 55 11,588 10,361
Total revenue including accrued revenue 521 256 21,649 20,576
Less expenses including accrued expenses (246) (55) (14,123) (8,988)
Surplus/(deficit) for reporting period 275 201 7,526 11,588

Notes to the financial statementsFOR THE YEAR ENDED 31 DECEMBER 2016
FINANCIAL STATEMENTS: UTS
52 UTS ANNUAL REPORT 2016
33. ACQUITTAL OF AUSTRALIAN GOVERNMENT FINANCIAL ASSISTANCE (CONTINUED)
33.4 Australian Research Council grants
(b) Linkages
Parent entity (University) only
Projects Infrastructure Special Research Initiatives
Notes 2016$’000
2015$’000
2016$’000
2015$’000
2016$’000
2015$’000
Financial assistance received in cash during the reporting period (total cash received from the Australian Government for the programs) 1,700 1,508 – 430 – –
Net accrual adjustments 275 304 240 12 13 13
Revenue for the period 2.1(e)(ii) 1,975 1,812 240 442 13 13
Surplus/(deficit) from the previous year 1,449 851 454 333 1 9
Total revenue including accrued revenue 3,424 2,663 694 775 14 22
Less expenses including accrued expenses (392) (1,214) (176) (321) 10 (21)
Surplus/(deficit) for reporting period 3,032 1,449 518 454 24 1
Parent entity (University) only
Industrial Transformation Research Hubs
Total
Notes 2016$’000
2015$’000
2016$’000
2015$’000
Financial assistance received in cash during the reporting period (total cash received from the Australian Government for the programs) 1,123 – 2,823 1,938
Net accrual adjustments – – 528 329
Revenue for the period 1,123 – 3,351 2,267
Surplus/(deficit) from the previous year – – 1,904 1,193
Total revenue including accrued revenue 1,123 – 5,255 3,460
Less expenses including accrued expenses – – (558) (1,556)
Surplus/(deficit) for reporting period 1,123 – 4,697 1,904

Notes to the financial statementsFOR THE YEAR ENDED 31 DECEMBER 2016
UTS ANNUAL REPORT 2016 53
FINANCIAL STATEMENTS: UTS
33.5 Australian Research Council grants
(c) Networks and centres
Parent entity (University) only
Centres Total
Notes 2016$’000
2015$’000
2016$’000
2015$’000
Financial assistance received in cash during the reporting period (total cash received from the Australian Government for the program) – – – –
Net accrual adjustments 530 552 530 552
Revenue for the period 2.1 (e)(iii) 530 552 530 552
Surplus/(deficit) from the previous year 263 274 263 274
Total revenue including accrued revenue 793 826 793 826
Less expenses including accrued expenses (728) (563) (728) (563)
Surplus/(deficit) for reporting period 65 263 65 263
33.6 Education research
Parent entity (University) only
Joint Research Engagement Program
JRE Engineering Cadetships
Research Training Scheme
Notes 2016$’000
2015$’000
2016$’000
2015$’000
2016$’000
2015$’000
Financial assistance received in cash during the reporting period (total cash received from the Australian Government for the program) 6,113 5,680 33 – 11,123 10,755
Net accrual adjustments – – – – – –
Revenue for the period 2.1 (d) 6,113 5,680 33 – 11,123 10,755
Surplus/(deficit) from the previous year (714) (713) (62) – – –
Total revenue including accrued revenue 5,399 4,967 (29) – 11,123 10,755
Less expenses including accrued expenses (6,175) (5,681) 29 (62) (11,123) (10,755)
Surplus/(deficit) for reporting period (776) (714) – (62) – –
Parent entity (University) only
Research Infrastructure Block
Grants
Sustainable Research Excellence in Universities
Total
Notes 2016$’000
2015$’000
2016$’000
2015$’000
2016$’000
2015$’000
Financial assistance received in cash during the reporting period (total cash received from the Australian Government for the program) 2,419 2,511 2,119 2,024 21,807 20,970
Net accrual adjustments – – – – – –
Revenue for the period 2,419 2,511 2,119 2,024 21,807 20,970
Surplus/(deficit) from the previous year 1,653 845 – – 877 132
Total revenue including accrued revenue 4,072 3,356 2,119 2,024 22,684 21,102
Less expenses including accrued expenses (2,418) (1,703) (2,119) (2,024) (21,806) (20,225)
Surplus/(deficit) for reporting period 1,654 1,653 – – 878 877
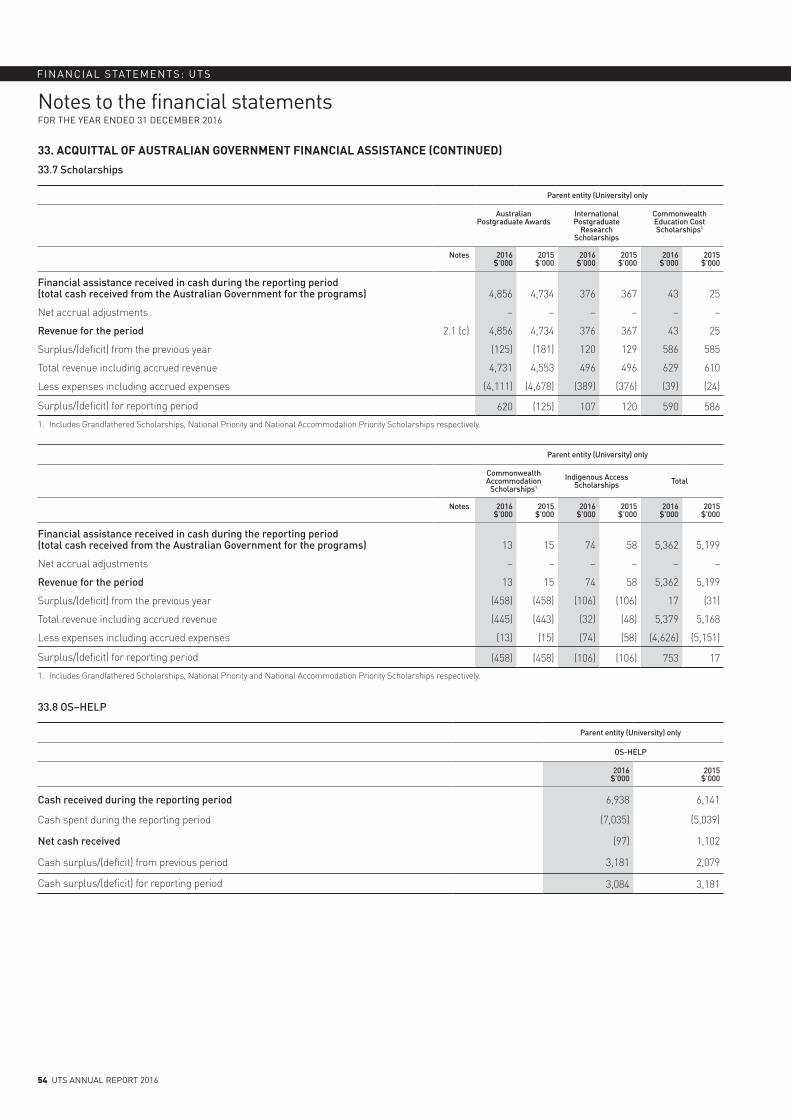
Notes to the financial statementsFOR THE YEAR ENDED 31 DECEMBER 2016
FINANCIAL STATEMENTS: UTS
54 UTS ANNUAL REPORT 2016
33. ACQUITTAL OF AUSTRALIAN GOVERNMENT FINANCIAL ASSISTANCE (CONTINUED)
33.7 Scholarships
Parent entity (University) only
Australian Postgraduate Awards
International Postgraduate
Research Scholarships
Commonwealth Education Cost Scholarships1
Notes 2016$’000
2015$’000
2016$’000
2015$’000
2016$’000
2015$’000
Financial assistance received in cash during the reporting period (total cash received from the Australian Government for the programs) 4,856 4,734 376 367 43 25
Net accrual adjustments – – – – – –
Revenue for the period 2.1 (c) 4,856 4,734 376 367 43 25
Surplus/(deficit) from the previous year (125) (181) 120 129 586 585
Total revenue including accrued revenue 4,731 4,553 496 496 629 610
Less expenses including accrued expenses (4,111) (4,678) (389) (376) (39) (24)
Surplus/(deficit) for reporting period 620 (125) 107 120 590 586
1. Includes Grandfathered Scholarships, National Priority and National Accommodation Priority Scholarships respectively.
Parent entity (University) only
Commonwealth Accommodation
Scholarships1
Indigenous Access Scholarships Total
Notes 2016$’000
2015$’000
2016$’000
2015$’000
2016$’000
2015$’000
Financial assistance received in cash during the reporting period (total cash received from the Australian Government for the programs) 13 15 74 58 5,362 5,199
Net accrual adjustments – – – – – –
Revenue for the period 13 15 74 58 5,362 5,199
Surplus/(deficit) from the previous year (458) (458) (106) (106) 17 (31)
Total revenue including accrued revenue (445) (443) (32) (48) 5,379 5,168
Less expenses including accrued expenses (13) (15) (74) (58) (4,626) (5,151)
Surplus/(deficit) for reporting period (458) (458) (106) (106) 753 17
1. Includes Grandfathered Scholarships, National Priority and National Accommodation Priority Scholarships respectively.
33.8 OS–HELP
Parent entity (University) only
OS-HELP
2016$’000
2015$’000
Cash received during the reporting period 6,938 6,141
Cash spent during the reporting period (7,035) (5,039)
Net cash received (97) 1,102
Cash surplus/(deficit) from previous period 3,181 2,079
Cash surplus/(deficit) for reporting period 3,084 3,181
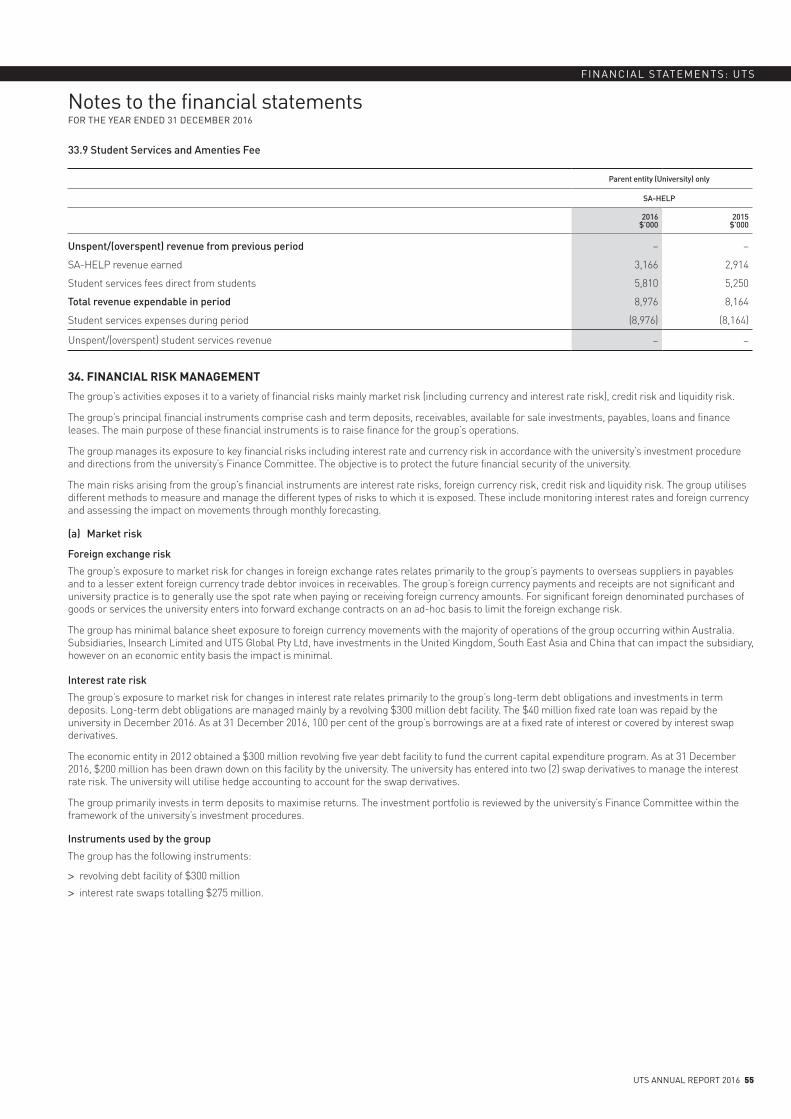
Notes to the financial statementsFOR THE YEAR ENDED 31 DECEMBER 2016
UTS ANNUAL REPORT 2016 55
FINANCIAL STATEMENTS: UTS
33.9 Student Services and Amenties Fee
Parent entity (University) only
SA-HELP
2016$’000
2015$’000
Unspent/(overspent) revenue from previous period – –
SA-HELP revenue earned 3,166 2,914
Student services fees direct from students 5,810 5,250
Total revenue expendable in period 8,976 8,164
Student services expenses during period (8,976) (8,164)
Unspent/(overspent) student services revenue – –
34. FINANCIAL RISK MANAGEMENT
The group’s activities exposes it to a variety of financial risks mainly market risk (including currency and interest rate risk), credit risk and liquidity risk.
The group’s principal financial instruments comprise cash and term deposits, receivables, available for sale investments, payables, loans and finance leases. The main purpose of these financial instruments is to raise finance for the group’s operations.
The group manages its exposure to key financial risks including interest rate and currency risk in accordance with the university’s investment procedure and directions from the university’s Finance Committee. The objective is to protect the future financial security of the university.
The main risks arising from the group’s financial instruments are interest rate risks, foreign currency risk, credit risk and liquidity risk. The group utilises different methods to measure and manage the different types of risks to which it is exposed. These include monitoring interest rates and foreign currency and assessing the impact on movements through monthly forecasting.
(a) Market risk
Foreign exchange risk
The group’s exposure to market risk for changes in foreign exchange rates relates primarily to the group’s payments to overseas suppliers in payables and to a lesser extent foreign currency trade debtor invoices in receivables. The group’s foreign currency payments and receipts are not significant and university practice is to generally use the spot rate when paying or receiving foreign currency amounts. For significant foreign denominated purchases of goods or services the university enters into forward exchange contracts on an ad-hoc basis to limit the foreign exchange risk.
The group has minimal balance sheet exposure to foreign currency movements with the majority of operations of the group occurring within Australia. Subsidiaries, Insearch Limited and UTS Global Pty Ltd, have investments in the United Kingdom, South East Asia and China that can impact the subsidiary, however on an economic entity basis the impact is minimal.
Interest rate risk
The group’s exposure to market risk for changes in interest rate relates primarily to the group’s long-term debt obligations and investments in term deposits. Long-term debt obligations are managed mainly by a revolving $300 million debt facility. The $40 million fixed rate loan was repaid by the university in December 2016. As at 31 December 2016, 100 per cent of the group’s borrowings are at a fixed rate of interest or covered by interest swap derivatives.
The economic entity in 2012 obtained a $300 million revolving five year debt facility to fund the current capital expenditure program. As at 31 December 2016, $200 million has been drawn down on this facility by the university. The university has entered into two (2) swap derivatives to manage the interest rate risk. The university will utilise hedge accounting to account for the swap derivatives.
The group primarily invests in term deposits to maximise returns. The investment portfolio is reviewed by the university’s Finance Committee within the framework of the university’s investment procedures.
Instruments used by the group
The group has the following instruments:
> revolving debt facility of $300 million
> interest rate swaps totalling $275 million.
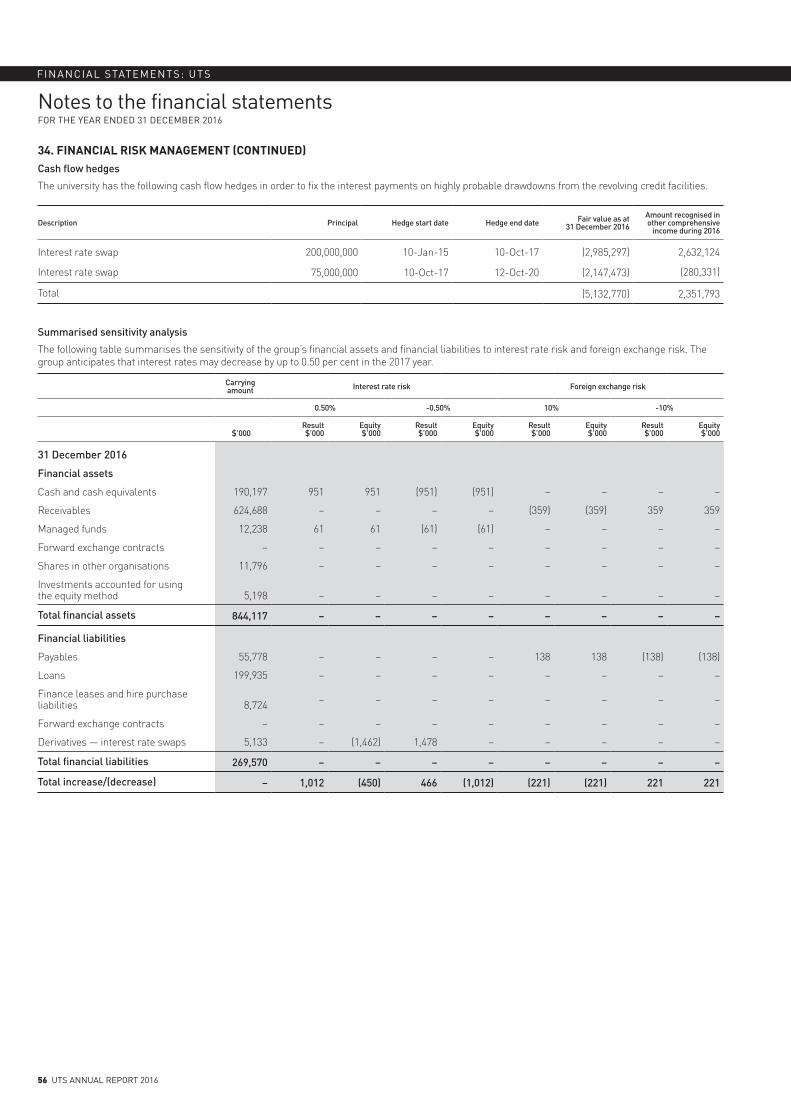
Notes to the financial statementsFOR THE YEAR ENDED 31 DECEMBER 2016
FINANCIAL STATEMENTS: UTS
56 UTS ANNUAL REPORT 2016
34. FINANCIAL RISK MANAGEMENT (CONTINUED)Cash flow hedges
The university has the following cash flow hedges in order to fix the interest payments on highly probable drawdowns from the revolving credit facilities.
Description Principal Hedge start date Hedge end date Fair value as at 31 December 2016
Amount recognised in other comprehensive
income during 2016
Interest rate swap 200,000,000 10-Jan-15 10-Oct-17 (2,985,297) 2,632,124
Interest rate swap 75,000,000 10-Oct-17 12-Oct-20 (2,147,473) (280,331)
Total (5,132,770) 2,351,793
Summarised sensitivity analysis
The following table summarises the sensitivity of the group’s financial assets and financial liabilities to interest rate risk and foreign exchange risk. The group anticipates that interest rates may decrease by up to 0.50 per cent in the 2017 year.
Carrying amount Interest rate risk Foreign exchange risk
0.50% -0.50% 10% -10%
$’000
Result $’000
Equity $’000
Result $’000
Equity $’000
Result $’000
Equity $’000
Result $’000
Equity $’000
31 December 2016
Financial assets
Cash and cash equivalents 190,197 951 951 (951) (951) – – – –
Receivables 624,688 – – – – (359) (359) 359 359
Managed funds 12,238 61 61 (61) (61) – – – –
Forward exchange contracts – – – – – – – – –
Shares in other organisations 11,796 – – – – – – – –
Investments accounted for using the equity method 5,198 – – – – – – – –
Total financial assets 844,117 – – – – – – – –
Financial liabilities
Payables 55,778 – – – – 138 138 (138) (138)
Loans 199,935 – – – – – – – –
Finance leases and hire purchase liabilities 8,724 – – – – – – – –
Forward exchange contracts – – – – – – – – –
Derivatives — interest rate swaps 5,133 – (1,462) 1,478 – – – – –
Total financial liabilities 269,570 – – – – – – – –
Total increase/(decrease) – 1,012 (450) 466 (1,012) (221) (221) 221 221
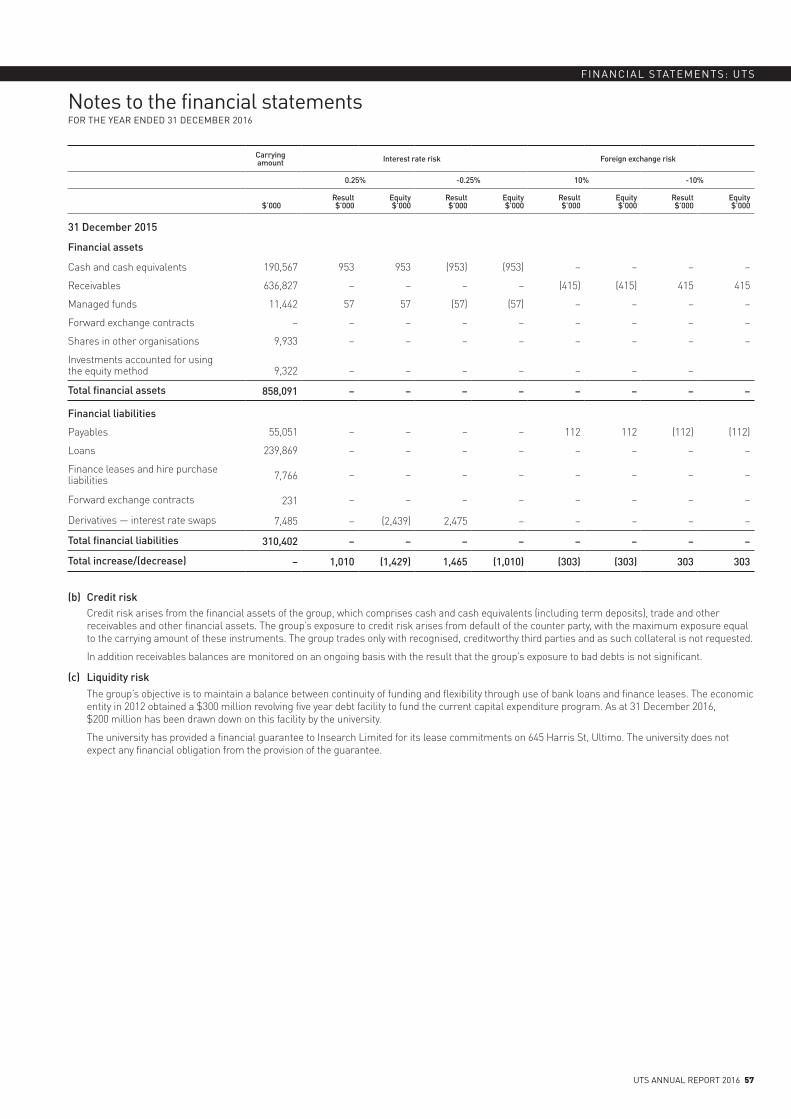
Notes to the financial statementsFOR THE YEAR ENDED 31 DECEMBER 2016
UTS ANNUAL REPORT 2016 57
FINANCIAL STATEMENTS: UTS
Carrying amount Interest rate risk Foreign exchange risk
0.25% -0.25% 10% -10%
$’000
Result $’000
Equity $’000
Result $’000
Equity $’000
Result $’000
Equity $’000
Result $’000
Equity $’000
31 December 2015
Financial assets
Cash and cash equivalents 190,567 953 953 (953) (953) – – – –
Receivables 636,827 – – – – (415) (415) 415 415
Managed funds 11,442 57 57 (57) (57) – – – –
Forward exchange contracts – – – – – – – – –
Shares in other organisations 9,933 – – – – – – – –
Investments accounted for using the equity method 9,322 – – – – – – –
Total financial assets 858,091 – – – – – – – –
Financial liabilities
Payables 55,051 – – – – 112 112 (112) (112)
Loans 239,869 – – – – – – – –
Finance leases and hire purchase liabilities 7,766 – – – – – – – –
Forward exchange contracts 231 – – – – – – – –
Derivatives — interest rate swaps 7,485 – (2,439) 2,475 – – – – –
Total financial liabilities 310,402 – – – – – – – –
Total increase/(decrease) – 1,010 (1,429) 1,465 (1,010) (303) (303) 303 303
(b) Credit riskCredit risk arises from the financial assets of the group, which comprises cash and cash equivalents (including term deposits), trade and other receivables and other financial assets. The group’s exposure to credit risk arises from default of the counter party, with the maximum exposure equal to the carrying amount of these instruments. The group trades only with recognised, creditworthy third parties and as such collateral is not requested.
In addition receivables balances are monitored on an ongoing basis with the result that the group’s exposure to bad debts is not significant.
(c) Liquidity riskThe group’s objective is to maintain a balance between continuity of funding and flexibility through use of bank loans and finance leases. The economic entity in 2012 obtained a $300 million revolving five year debt facility to fund the current capital expenditure program. As at 31 December 2016, $200 million has been drawn down on this facility by the university.
The university has provided a financial guarantee to Insearch Limited for its lease commitments on 645 Harris St, Ultimo. The university does not expect any financial obligation from the provision of the guarantee.
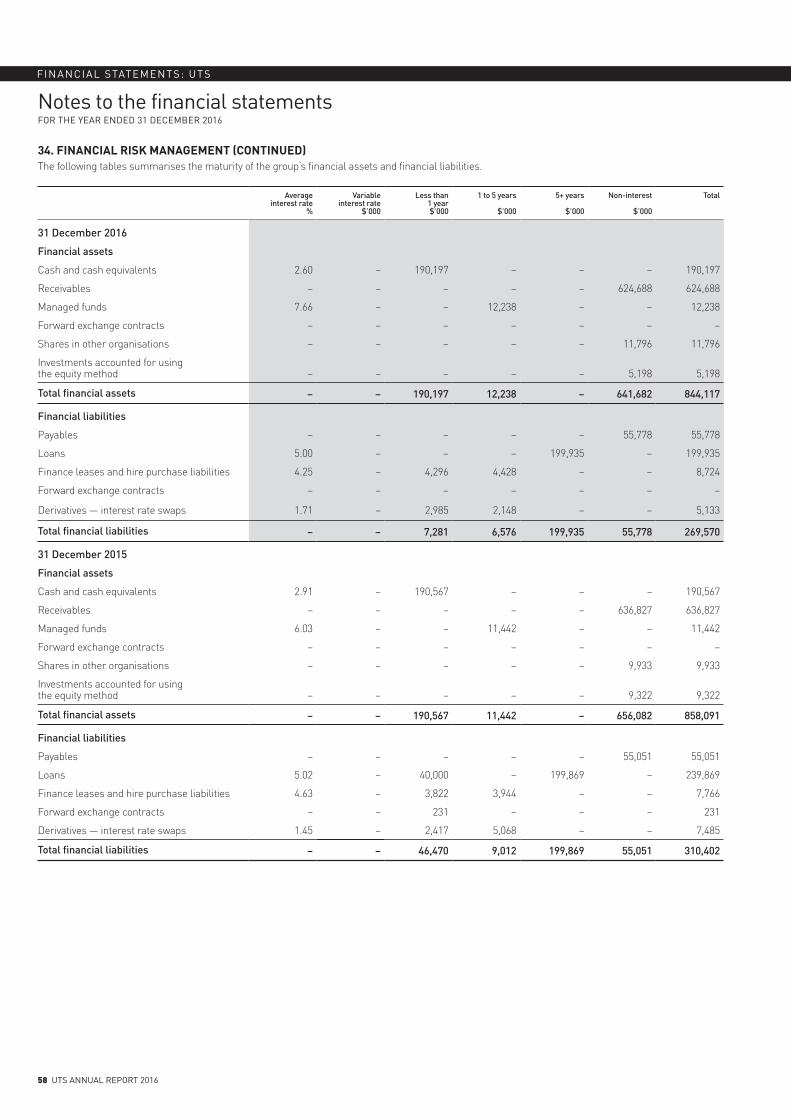
Notes to the financial statementsFOR THE YEAR ENDED 31 DECEMBER 2016
FINANCIAL STATEMENTS: UTS
58 UTS ANNUAL REPORT 2016
34. FINANCIAL RISK MANAGEMENT (CONTINUED)The following tables summarises the maturity of the group’s financial assets and financial liabilities.
Average interest rate
%
Variable interest rate
$’000
Less than 1 year $’000
1 to 5 years
$’000
5+ years
$’000
Non-interest
$’000
Total
31 December 2016
Financial assets
Cash and cash equivalents 2.60 – 190,197 – – – 190,197
Receivables – – – – – 624,688 624,688
Managed funds 7.66 – – 12,238 – – 12,238
Forward exchange contracts – – – – – – –
Shares in other organisations – – – – – 11,796 11,796
Investments accounted for using the equity method – – – – – 5,198 5,198
Total financial assets – – 190,197 12,238 – 641,682 844,117
Financial liabilities
Payables – – – – – 55,778 55,778
Loans 5.00 – – – 199,935 – 199,935
Finance leases and hire purchase liabilities 4.25 – 4,296 4,428 – – 8,724
Forward exchange contracts – – – – – – –
Derivatives — interest rate swaps 1.71 – 2,985 2,148 – – 5,133
Total financial liabilities – – 7,281 6,576 199,935 55,778 269,570
31 December 2015
Financial assets
Cash and cash equivalents 2.91 – 190,567 – – – 190,567
Receivables – – – – – 636,827 636,827
Managed funds 6.03 – – 11,442 – – 11,442
Forward exchange contracts – – – – – – –
Shares in other organisations – – – – – 9,933 9,933
Investments accounted for using the equity method – – – – – 9,322 9,322
Total financial assets – – 190,567 11,442 – 656,082 858,091
Financial liabilities
Payables – – – – – 55,051 55,051
Loans 5.02 – 40,000 – 199,869 – 239,869
Finance leases and hire purchase liabilities 4.63 – 3,822 3,944 – – 7,766
Forward exchange contracts – – 231 – – – 231
Derivatives — interest rate swaps 1.45 – 2,417 5,068 – – 7,485
Total financial liabilities – – 46,470 9,012 199,869 55,051 310,402
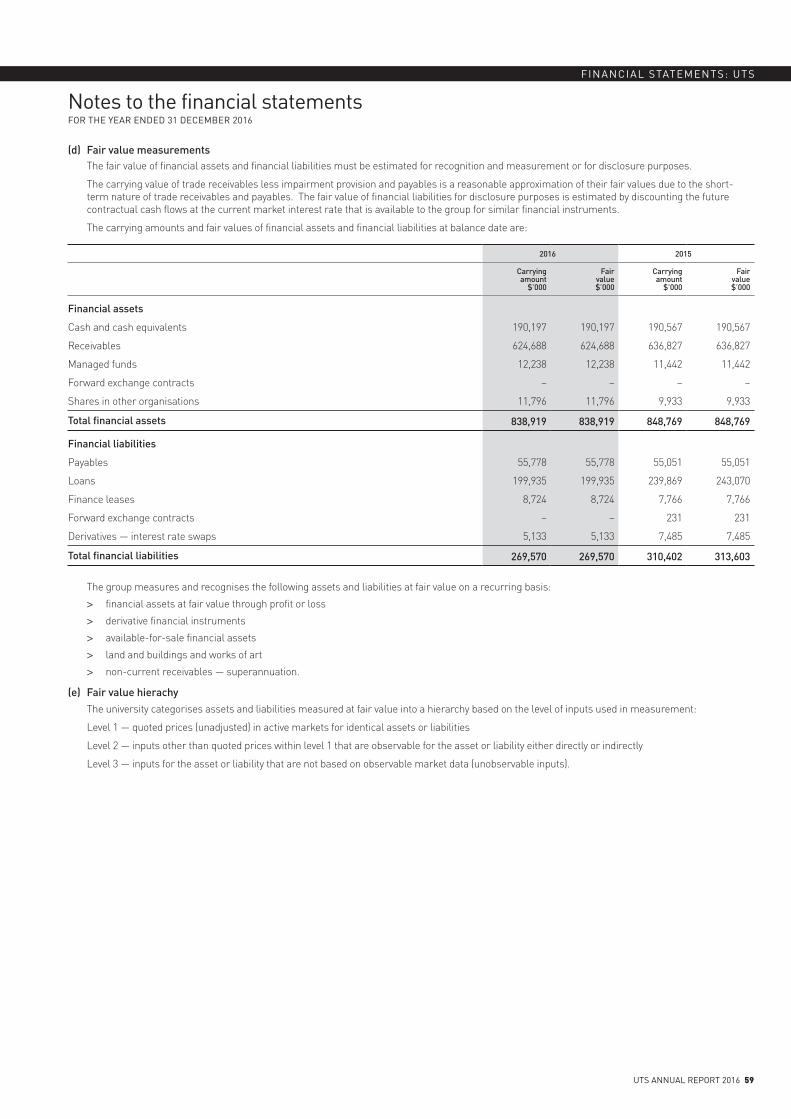
Notes to the financial statementsFOR THE YEAR ENDED 31 DECEMBER 2016
UTS ANNUAL REPORT 2016 59
FINANCIAL STATEMENTS: UTS
(d) Fair value measurementsThe fair value of financial assets and financial liabilities must be estimated for recognition and measurement or for disclosure purposes.
The carrying value of trade receivables less impairment provision and payables is a reasonable approximation of their fair values due to the short-term nature of trade receivables and payables. The fair value of financial liabilities for disclosure purposes is estimated by discounting the future contractual cash flows at the current market interest rate that is available to the group for similar financial instruments.
The carrying amounts and fair values of financial assets and financial liabilities at balance date are:
2016 2015
Carrying amount
$’000
Fair value$’000
Carrying amount
$’000
Fair value$’000
Financial assets
Cash and cash equivalents 190,197 190,197 190,567 190,567
Receivables 624,688 624,688 636,827 636,827
Managed funds 12,238 12,238 11,442 11,442
Forward exchange contracts – – – –
Shares in other organisations 11,796 11,796 9,933 9,933
Total financial assets 838,919 838,919 848,769 848,769
Financial liabilities
Payables 55,778 55,778 55,051 55,051
Loans 199,935 199,935 239,869 243,070
Finance leases 8,724 8,724 7,766 7,766
Forward exchange contracts – – 231 231
Derivatives — interest rate swaps 5,133 5,133 7,485 7,485
Total financial liabilities 269,570 269,570 310,402 313,603
The group measures and recognises the following assets and liabilities at fair value on a recurring basis:
> financial assets at fair value through profit or loss
> derivative financial instruments
> available-for-sale financial assets
> land and buildings and works of art
> non-current receivables — superannuation.
(e) Fair value hierachyThe university categorises assets and liabilities measured at fair value into a hierarchy based on the level of inputs used in measurement:
Level 1 — quoted prices (unadjusted) in active markets for identical assets or liabilities
Level 2 — inputs other than quoted prices within level 1 that are observable for the asset or liability either directly or indirectly
Level 3 — inputs for the asset or liability that are not based on observable market data (unobservable inputs).
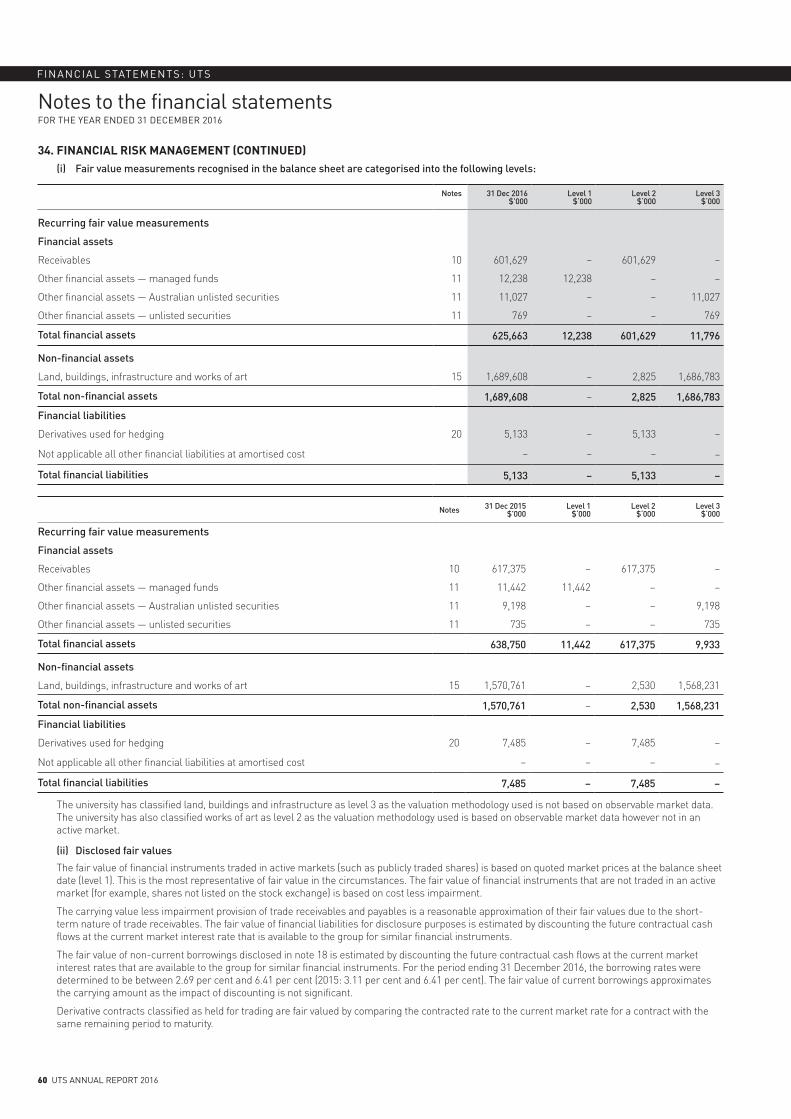
Notes to the financial statementsFOR THE YEAR ENDED 31 DECEMBER 2016
FINANCIAL STATEMENTS: UTS
60 UTS ANNUAL REPORT 2016
34. FINANCIAL RISK MANAGEMENT (CONTINUED)(i) Fair value measurements recognised in the balance sheet are categorised into the following levels:
Notes 31 Dec 2016$’000
Level 1$‘000
Level 2 $‘000
Level 3 $‘000
Recurring fair value measurements
Financial assets
Receivables 10 601,629 – 601,629 –
Other financial assets — managed funds 11 12,238 12,238 – –
Other financial assets — Australian unlisted securities 11 11,027 – – 11,027
Other financial assets — unlisted securities 11 769 – – 769
Total financial assets 625,663 12,238 601,629 11,796
Non-financial assets
Land, buildings, infrastructure and works of art 15 1,689,608 – 2,825 1,686,783
Total non-financial assets 1,689,608 – 2,825 1,686,783
Financial liabilities
Derivatives used for hedging 20 5,133 – 5,133 –
Not applicable all other financial liabilities at amortised cost – – – –
Total financial liabilities 5,133 – 5,133 –
Notes 31 Dec 2015$’000
Level 1$‘000
Level 2 $‘000
Level 3 $‘000
Recurring fair value measurements
Financial assets
Receivables 10 617,375 – 617,375 –
Other financial assets — managed funds 11 11,442 11,442 – –
Other financial assets — Australian unlisted securities 11 9,198 – – 9,198
Other financial assets — unlisted securities 11 735 – – 735
Total financial assets 638,750 11,442 617,375 9,933
Non-financial assets
Land, buildings, infrastructure and works of art 15 1,570,761 – 2,530 1,568,231
Total non-financial assets 1,570,761 – 2,530 1,568,231
Financial liabilities
Derivatives used for hedging 20 7,485 – 7,485 –
Not applicable all other financial liabilities at amortised cost – – – –
Total financial liabilities 7,485 – 7,485 –
The university has classified land, buildings and infrastructure as level 3 as the valuation methodology used is not based on observable market data. The university has also classified works of art as level 2 as the valuation methodology used is based on observable market data however not in an active market.
(ii) Disclosed fair values
The fair value of financial instruments traded in active markets (such as publicly traded shares) is based on quoted market prices at the balance sheet date (level 1). This is the most representative of fair value in the circumstances. The fair value of financial instruments that are not traded in an active market (for example, shares not listed on the stock exchange) is based on cost less impairment.
The carrying value less impairment provision of trade receivables and payables is a reasonable approximation of their fair values due to the short-term nature of trade receivables. The fair value of financial liabilities for disclosure purposes is estimated by discounting the future contractual cash flows at the current market interest rate that is available to the group for similar financial instruments.
The fair value of non-current borrowings disclosed in note 18 is estimated by discounting the future contractual cash flows at the current market interest rates that are available to the group for similar financial instruments. For the period ending 31 December 2016, the borrowing rates were determined to be between 2.69 per cent and 6.41 per cent (2015: 3.11 per cent and 6.41 per cent). The fair value of current borrowings approximates the carrying amount as the impact of discounting is not significant.
Derivative contracts classified as held for trading are fair valued by comparing the contracted rate to the current market rate for a contract with the same remaining period to maturity.
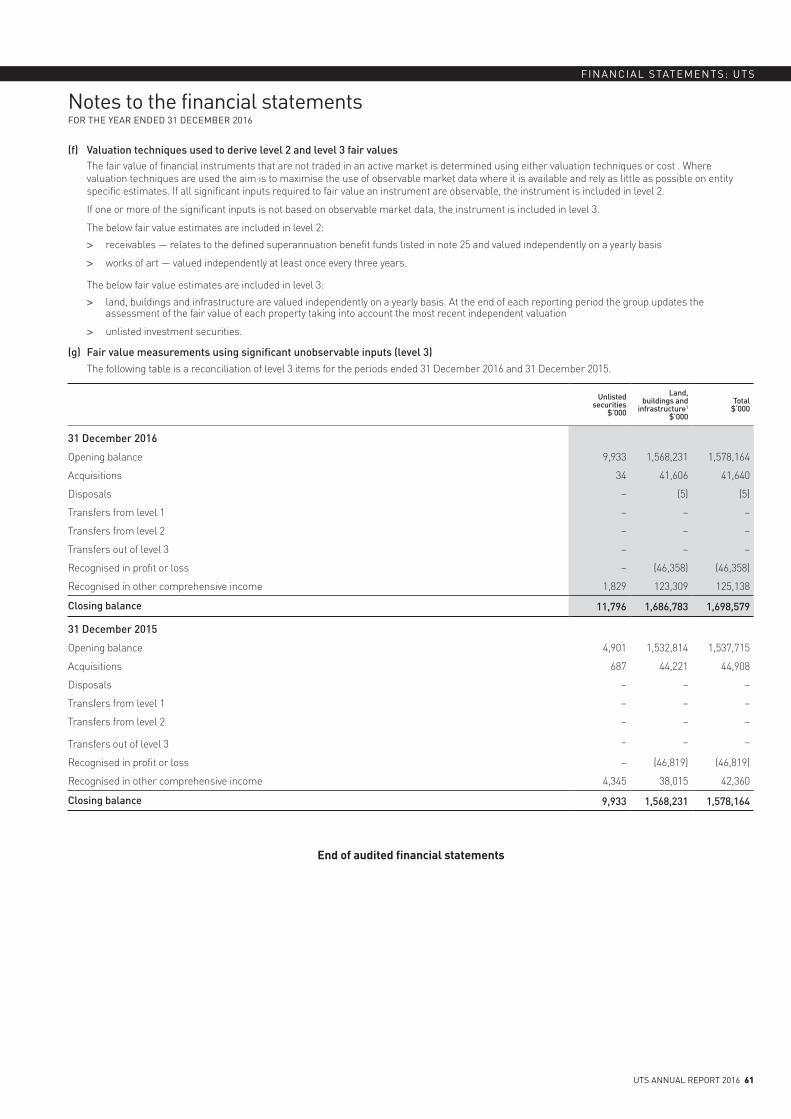
Notes to the financial statementsFOR THE YEAR ENDED 31 DECEMBER 2016
UTS ANNUAL REPORT 2016 61
FINANCIAL STATEMENTS: UTS
(f) Valuation techniques used to derive level 2 and level 3 fair valuesThe fair value of financial instruments that are not traded in an active market is determined using either valuation techniques or cost . Where valuation techniques are used the aim is to maximise the use of observable market data where it is available and rely as little as possible on entity specific estimates. If all significant inputs required to fair value an instrument are observable, the instrument is included in level 2.
If one or more of the significant inputs is not based on observable market data, the instrument is included in level 3.
The below fair value estimates are included in level 2:
> receivables — relates to the defined superannuation benefit funds listed in note 25 and valued independently on a yearly basis
> works of art — valued independently at least once every three years.
The below fair value estimates are included in level 3:
> land, buildings and infrastructure are valued independently on a yearly basis. At the end of each reporting period the group updates the assessment of the fair value of each property taking into account the most recent independent valuation
> unlisted investment securities.
(g) Fair value measurements using significant unobservable inputs (level 3)The following table is a reconciliation of level 3 items for the periods ended 31 December 2016 and 31 December 2015.
Unlisted securities
$’000
Land, buildings and
infrastructure1
$’000
Total $‘000
31 December 2016
Opening balance 9,933 1,568,231 1,578,164
Acquisitions 34 41,606 41,640
Disposals – (5) (5)
Transfers from level 1 – – –
Transfers from level 2 – – –
Transfers out of level 3 – – –
Recognised in profit or loss – (46,358) (46,358)
Recognised in other comprehensive income 1,829 123,309 125,138
Closing balance 11,796 1,686,783 1,698,579
31 December 2015
Opening balance 4,901 1,532,814 1,537,715
Acquisitions 687 44,221 44,908
Disposals – – –
Transfers from level 1 – – –
Transfers from level 2 – – –
Transfers out of level 3 – – –
Recognised in profit or loss – (46,819) (46,819)
Recognised in other comprehensive income 4,345 38,015 42,360
Closing balance 9,933 1,568,231 1,578,164
End of audited financial statements
62 UTS ANNUAL REPORT 2016
Directors’ report 63
Directors’ declaration 65
Statement in accordance with the Public Finance and Audit Act 66
Independent auditor’s report 67
Auditor’s independence declaration 69
Statement of comprehensive income 70
Statement of financial position 70
Statement of changes in equity 71
Statement of cash flows 71
Notes to the financial statements 72
1. Summary of significant accounting policies 72
2. Revenue from continuing operations 73
3. Expenses from continuing operations 73
4. Cash and cash equivalents 73
5. Receivables 73
6. Non-current assets 73
7. Payables 73
8. Retained earnings 74
9. Share capital 74
10. Remuneration of directors 74
11. Financial risk management 74
12. Notes to statement of cash flows 75
13. After balance date events 75
14. Contingent liabilities and contingent assets 75
15. Remuneration of auditors 75
16. Going concern 75
UTS Global Pty Ltd
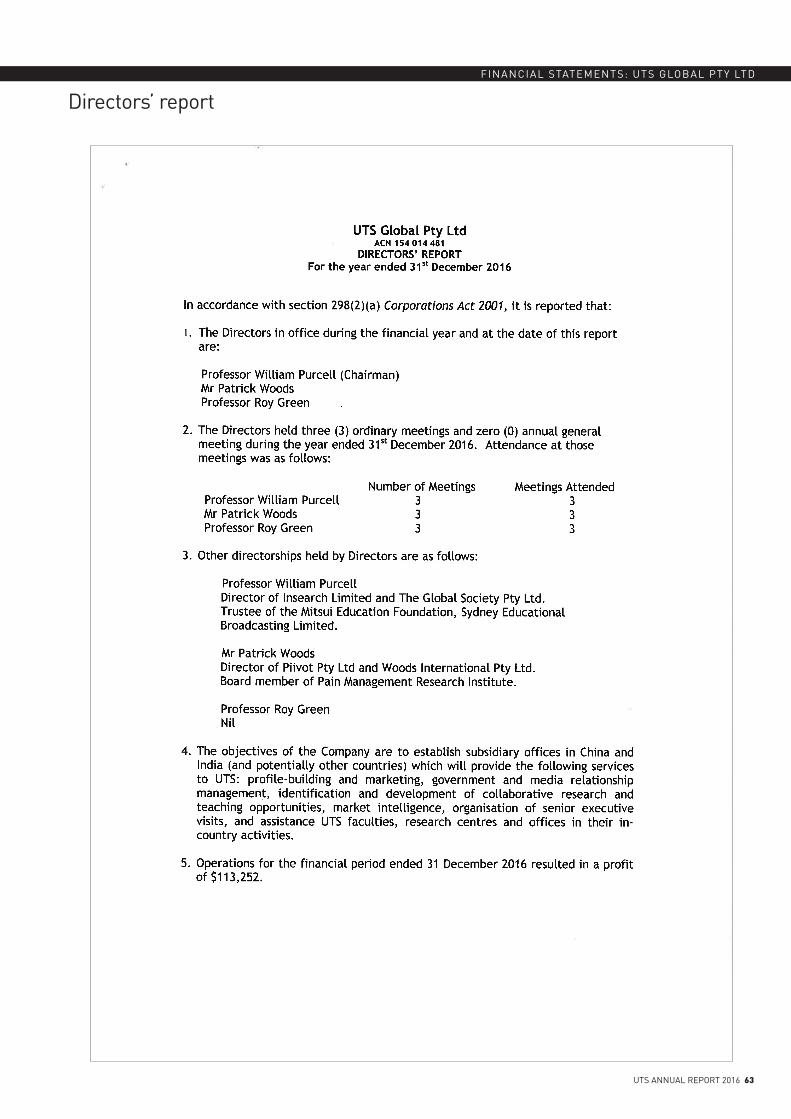
FINANCIAL STATEMENTS: UTS GLOBAL PTY LTD
UTS ANNUAL REPORT 2016 63
Directors’ report
FINANCIAL STATEMENTS: UTS GLOBAL PTY LTD
64 UTS ANNUAL REPORT 2016
Directors’ report (continued)
FINANCIAL STATEMENTS: UTS GLOBAL PTY LTD
UTS ANNUAL REPORT 2016 65
Directors’ declaration
FINANCIAL STATEMENTS: UTS GLOBAL PTY LTD
66 UTS ANNUAL REPORT 2016
Statement in accordance with the Public Finance and Audit Act

FINANCIAL STATEMENTS: UTS GLOBAL PTY LTD
UTS ANNUAL REPORT 2016 67
Independent auditor’s report
INDEPENDENT AUDITOR’S REPORT
UTS Global Pty Limited
To Members of the New South Wales Parliament and Members of UTS Global Pty Limited
Opinion I have audited the accompanying financial statements of UTS Global Pty Limited (the Company), which comprise the statement of financial position as at 31 December 2016, the statement of comprehensive income, the statement of changes in equity and the statement of cash flows for the year then ended, notes comprising a summary of significant accounting policies and other explanatory information, and the directors’ declaration.
In my opinion, the financial statements:
• are in accordance with the Corporations Act 2001, including: giving a true and fair view of the Company’s financial position as at 31 December 2016 -
and its performance for the year ended on that date complying with Australian Accounting Standards and the Corporations Regulations 2001 -
• are in accordance with section 41B of the Public Finance and Audit Act 1983 (PF&A Act) and the Public Finance and Audit Regulation 2015
My opinion should be read in conjunction with the rest of this report.
Basis for Opinion I conducted my audit in accordance with Australian Auditing Standards. My responsibilities under the standards are described in the ‘Auditor’s Responsibilities for the Audit of the Financial Statements’ section of my report.
I am independent of the Company in accordance with the requirements of the:
• Australian Auditing Standards • Corporations Act 2001 • Accounting Professional and Ethical Standards Board’s APES 110 ‘Code of Ethics for
Professional Accountants’ (APES 110).
I have also fulfilled my other ethical responsibilities in accordance with APES 110.
The PF&A Act further promotes independence by ensuring the Auditor–General and the Audit Office of New South Wales are not compromised in their roles by:
• providing that only Parliament, and not the executive government, can remove an Auditor–General • mandating the Auditor–General as auditor of public sector agencies, but precluding the provision
of non-audit services.
I believe the audit evidence I have obtained is sufficient and appropriate to provide a basis for my audit opinion.
FINANCIAL STATEMENTS: UTS GLOBAL PTY LTD
68 UTS ANNUAL REPORT 2016
Independent auditor’s report (continued)
Director’s Responsibility for the Financial Statements The directors of the Company are responsible for the preparation and fair presentation of the financial statements in accordance with Australian Accounting Standards, the PF&A Act and the Corporations Act 2001 and for such internal control as the directors determine is necessary to enable the preparation and fair presentation of the financial statements that are free from material misstatement, whether due to fraud or error.
In preparing the financial statements, the directors must assess the Company’s ability to continue as a going concern unless they intend to liquidate the Company or cease operations. The assessment must disclose, as applicable, matters related to going concern and the appropriateness of using the going concern basis of accounting.
Auditor’s Responsibility for the Audit of the Financial Statements My objectives are to:
• obtain reasonable assurance about whether the financial statements as a whole are free from material misstatement, whether due to fraud or error
• issue an Independent Auditor’s Report including my opinion.
Reasonable assurance is a high level of assurance, but does not guarantee an audit conducted in accordance with Australian Auditing Standards will always detect material misstatements. Misstatements can arise from fraud or error. Misstatements are considered material if, individually or in aggregate, they could reasonably be expected to influence the economic decisions users take based on the financial statements.
A description of my responsibilities for the audit of the financial statements is located at the Auditing and Assurance Standards Board website at: http://www.auasb.gov.au/auditors_files/ar3.pdf
The description forms part of my auditor’s report.
My opinion does not provide assurance:
• that the Company carried out its activities effectively, efficiently and economically • about the security and controls over the electronic publication of the audited financial
statements on any website where they may be presented • about any other information which may have been hyperlinked to/from the financial statements.
Caroline Karakatsanis Director, Financial Audit Services
27 April 2017 SYDNEY
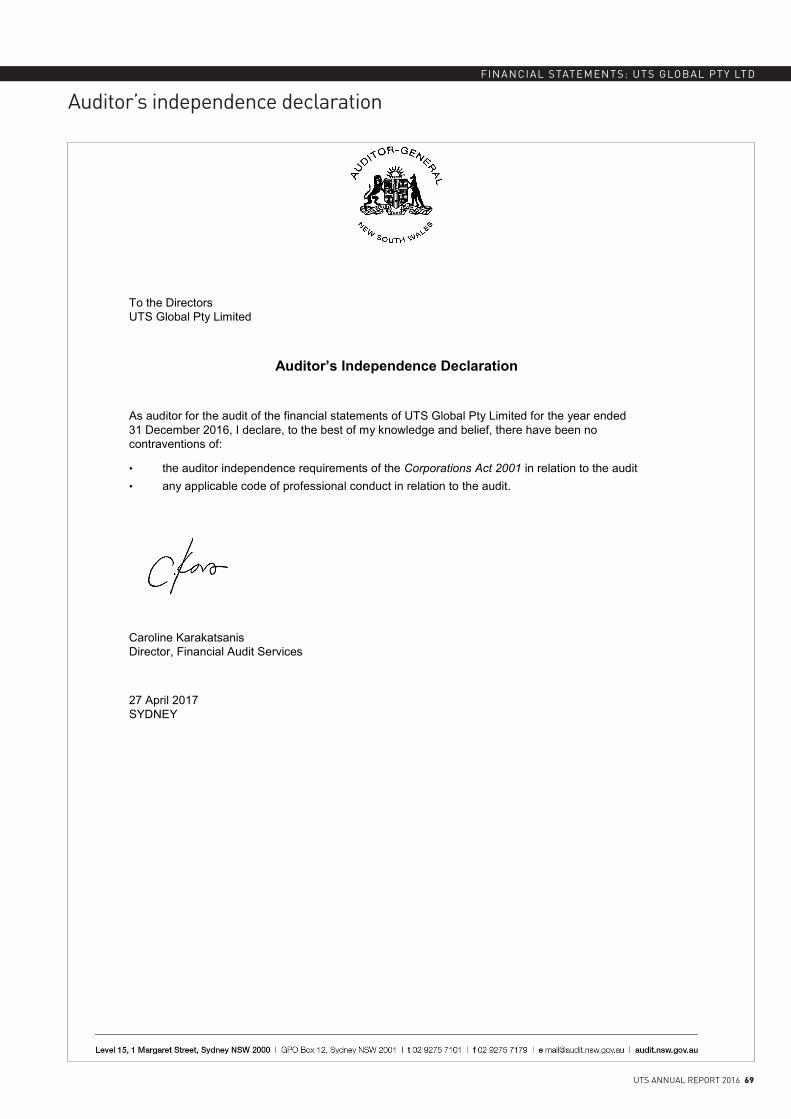
FINANCIAL STATEMENTS: UTS GLOBAL PTY LTD
UTS ANNUAL REPORT 2016 69
Auditor’s independence declaration
To the Directors UTS Global Pty Limited
Auditor’s Independence Declaration
As auditor for the audit of the financial statements of UTS Global Pty Limited for the year ended 31 December 2016, I declare, to the best of my knowledge and belief, there have been no contraventions of:
• the auditor independence requirements of the Corporations Act 2001 in relation to the audit • any applicable code of professional conduct in relation to the audit.
Caroline Karakatsanis Director, Financial Audit Services
27 April 2017 SYDNEY

FINANCIAL STATEMENTS: UTS GLOBAL PTY LTD
70 UTS ANNUAL REPORT 2016
Statement of comprehensive incomeFOR THE YEAR ENDED 31 DECEMBER 2016
Notes 2016$
2015$
Continuing operations
Revenue from continuing operations 2 470,835 386,003
Other expenses 3 357,583 288,904
Profit before income tax 113,252 97,099
Net result for the period for continuing operations 113,252 97,099
Net result for the period is attributable to the owners 113,252 97,099
Total comprehensive income is attributable to the owners 113,252 97,099
The above statement of comprehensive income should be read in conjunction with the accompanying notes.
Statement of financial positionAS AT 31 DECEMBER 2016
Notes 2016$
2015$
Assets
Current assets
Cash and cash equivalents 4 177,659 46,944
Receivables 5 3,025 1,278
Total current assets 180,684 48,222
Non-current assets
Other financial assets 6 100,000 100,000
Total non-current assets 100,000 100,000
Total assets 280,684 148,222
Liabilities
Current liabilities
Payables 7 33,271 14,062
Total current liabilities 33,271 14,062
Total liabilities 33,271 14,062
Net assets 247,413 134,161
Equity
Retained earnings 8 247,412 134,160
Share capital 9 1 1
Total equity 247,413 134,161
The above statement of financial position should be read in conjunction with the accompanying notes.
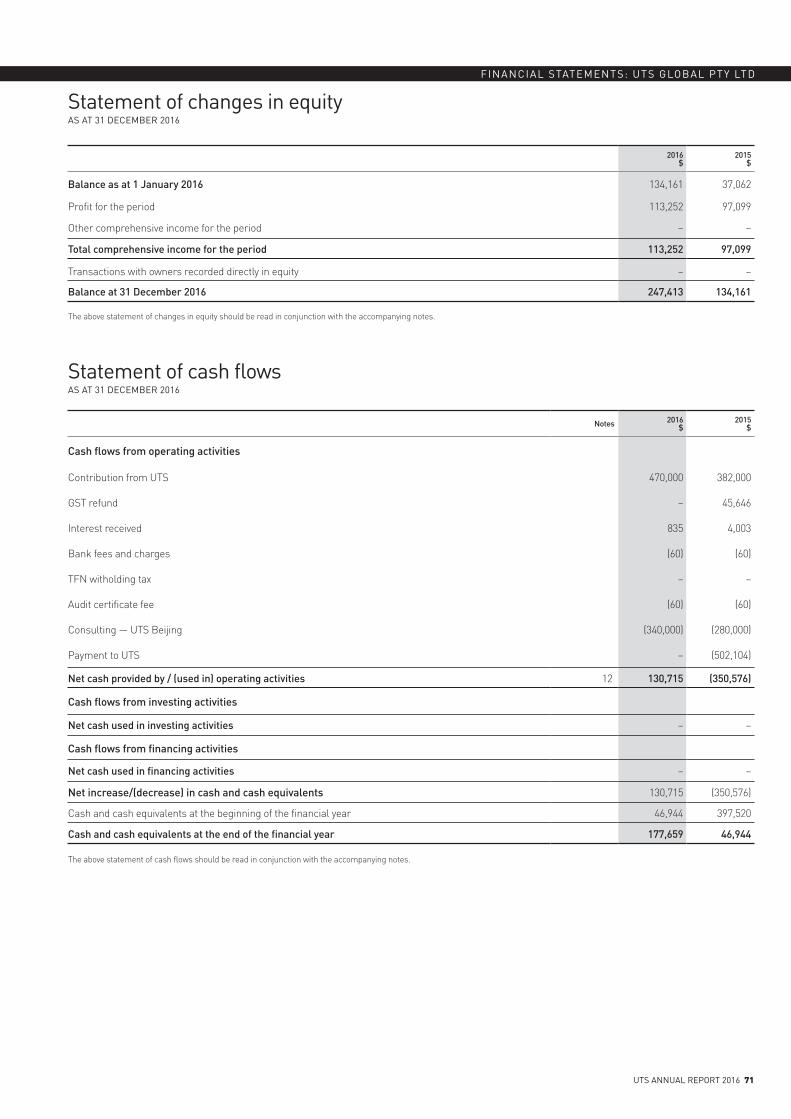
FINANCIAL STATEMENTS: UTS GLOBAL PTY LTD
UTS ANNUAL REPORT 2016 71
Statement of changes in equityAS AT 31 DECEMBER 2016
2016$
2015$
Balance as at 1 January 2016 134,161 37,062
Profit for the period 113,252 97,099
Other comprehensive income for the period – –
Total comprehensive income for the period 113,252 97,099
Transactions with owners recorded directly in equity – –
Balance at 31 December 2016 247,413 134,161
The above statement of changes in equity should be read in conjunction with the accompanying notes.
Statement of cash flowsAS AT 31 DECEMBER 2016
Notes 2016$
2015$
Cash flows from operating activities
Contribution from UTS 470,000 382,000
GST refund – 45,646
Interest received 835 4,003
Bank fees and charges (60) (60)
TFN witholding tax – –
Audit certificate fee (60) (60)
Consulting — UTS Beijing (340,000) (280,000)
Payment to UTS – (502,104)
Net cash provided by / (used in) operating activities 12 130,715 (350,576)
Cash flows from investing activities
Net cash used in investing activities – –
Cash flows from financing activities
Net cash used in financing activities – –
Net increase/(decrease) in cash and cash equivalents 130,715 (350,576)
Cash and cash equivalents at the beginning of the financial year 46,944 397,520
Cash and cash equivalents at the end of the financial year 177,659 46,944
The above statement of cash flows should be read in conjunction with the accompanying notes.
FINANCIAL STATEMENTS: UTS GLOBAL PTY LTD
72 UTS ANNUAL REPORT 2016
1. SUMMARY OF SIGNIFICANT ACCOUNTING POLICIES
UTS Global Pty Ltd is a not-for-profit company limited by shares, incorporated and domiciled in Australia and is a wholly owned subsidiary of the University of Technology Sydney.
The company’s principal business activities are to provide marketing and profile building services to UTS.
The company’s principal place of business is 15 Broadway, Broadway NSW 2007.
The principal accounting policies adopted in the preparation of these consolidated financial statements are set out below.
(a) Basis of preparationThese general purpose financial statements have been prepared in accordance with Australian Accounting Standards and interpretations issued by the Australian Accounting Standards Board and the Public Finance and Audit Act 1983, the Public Finance and Audit Regulation 2015 and the Corporations Act 2001. Where there are inconsistencies between the above requirements, the legislative provisions have prevailed.
These financial statements have been prepared on a historical cost basis and are presented in Australian dollars, rounded to the nearest dollar.
(b) Statement of complianceThe financial statements and notes comply with Australian Accounting Standards, which include Australian Accounting Interpretations.
(c) Financial instrumentsFinancial instruments give rise to positions that are financial assets or liabilities (or equity instruments) of either company or its counterparties. These include cash at bank, receivables and accounts payable. Note 11 discloses the risk and management of those risks regarding financial instruments.
(i) Cash
Cash comprises cash on hand and bank balances. Interest has been earned at the prevailing rates.
(ii) Receivables
Trade receivables are recorded at amounts due at balance date, less a provision for any uncollectible debts. An estimate for doubtful debts is made when collection of the full amounts is no longer probable. Bad debts are written off as incurred.
(iii) Payables
Trade accounts payable, other payables and accruals are recognised when the economic entity becomes obliged to make future payments as a result of purchase of goods and services.
(d) Investments and other financial assetsThe group classifies its investments in the following categories:
(i) Financial assets at fair value through profit or loss
The group’s investments in managed funds are classified as financial assets at fair value through profit or loss. The policy of management is to designate a financial asset if there exists the possibility it will be sold in the short term and the asset is subject to frequent changes in fair value. These assets are initially recognised at cost, being the fair value of the consideration given. They are subsequently recognised at fair value and gains or losses are recognised in the income statement.
(ii) Available-for-sale financial assets
Investments in listed securities have been classified as available-for-sale financial assets. These assets are initially recognised at cost including the acquisition charges associated with the investment, being the fair value of the consideration given. Available-for-sale financial assets are subject to review for impairment. Gains or losses on available-for-sale investments are recognised in equity until the investment is sold or until the investment is determined to be impaired, at which time the cumulative gain or loss previously reported in equity is included in the income statement.
(iii) Other financial assets
Equity instruments that are not quoted in an active market have been classified as other financial assets and have been recognised at cost less impairment.
(e) Revenue recognitionRevenue comprises fees received from UTS for marketing services provided. Revenue from marketing services is recognised when services are provided.
Grants from institutions are recognised when control of the grant or the right to receive the grant is obtained. Project revenue is recognised periodically during the course of the project and at its conclusion.
Revenue arising from the sale of assets is recognised on disposal.
Interest revenue is recognised as it accrues.
(f) Taxation
(i) Accounting for Goods and Services Tax
Revenues, expenses and assets are recognised net of the amount of goods and services tax (GST), except where the amount of GST incurred is not recoverable from the taxation authority it is recognised as part of the cost of acquisition of an asset or part of an item of expense, or for receivables and payables which are recognised inclusive of GST.
The net amount of GST recoverable from, or payable to, the taxation authority is included as part of receivables or payables.
Cash flows are included in the cash flow statement on a gross basis. The GST component of cash flows arising from investing and financing activities that is recoverable from, or payable to, the taxations authority is classified within operating activities.
Notes to the financial statementsFOR THE YEAR ENDED 31 DECEMBER 2016

Notes to the financial statementsFOR THE YEAR ENDED 31 DECEMBER 2016
FINANCIAL STATEMENTS: UTS GLOBAL PTY LTD
UTS ANNUAL REPORT 2016 73
(g) Judgements and estimatesThe preparation of the financial statements requires management to make judgements, estimates and assumptions that affect the reported amounts in the financial statements. Management continually evaluates its judgements and estimates in relation to assets, liabilities, contingent liabilities, revenue and expenses. Management bases its judgements and estimates on historical experience and on other various factors it believes to be reasonable under the circumstances.
(h) New accounting standards and interpretationsCertain new accounting standards and interpretations have been published that are not mandatory for the 31 December 2016 reporting period. UTS Global has not exercised the right to early adopt any new or revised accounting standard.
(i) Changes in accounting policyThere have been no changes to accounting policy in the 2016 year. .
Notes 2016$
2015$
2. REVENUE FROM CONTINUING OPERATIONS
Contribution from UTS 470,000 382,000
Interest earned 835 4,003
Total revenue from continuing operations 470,835 386,003
3. EXPENSES FROM CONTINUING OPERATIONS
Consulting 340,600 280,300
Recruitment fee 10,353 –
Audit fee 6,352 8,243
Bank fees and charges 120 120
Other 158 241
Total expenses from continuing operations 357,583 288,904
4. CASH AND CASH EQUIVALENTS
Cash at bank and on hand 177,659 46,944
Total cash and cash equivalents 177,659 46,944
5. RECEIVABLES
GST receivables 3,025 1,278
Total receivables 3,025 1,278
6. NON-CURRENT ASSETS
Shares in UTS Beijing Ltd 100,000 100,000
Total other non-financial assets 100,000 100,000
7. PAYABLES
Payables to parent 25,624 7,245
Accrual — audit 6,987 6,817
Accrual — company secretary fee 660 –
Total payables 33,271 14,062
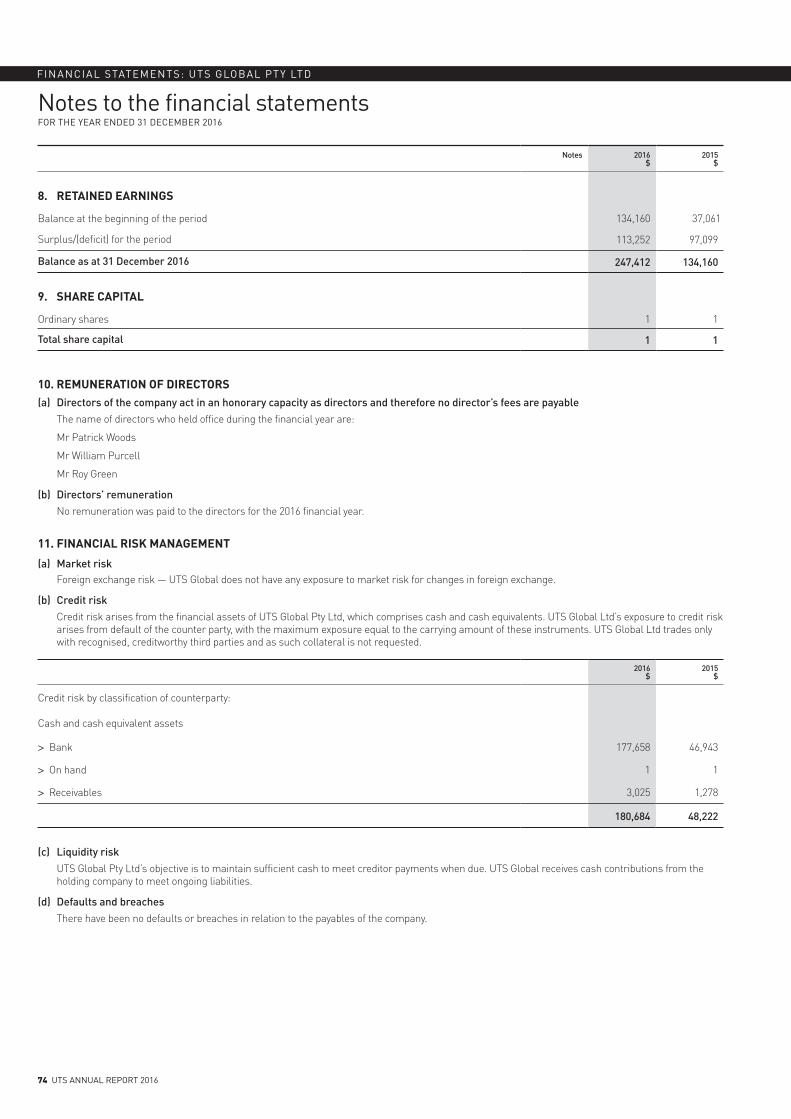
74 UTS ANNUAL REPORT 2016
Notes to the financial statementsFOR THE YEAR ENDED 31 DECEMBER 2016
FINANCIAL STATEMENTS: UTS GLOBAL PTY LTD
Notes 2016$
2015$
8. RETAINED EARNINGS
Balance at the beginning of the period 134,160 37,061
Surplus/(deficit) for the period 113,252 97,099
Balance as at 31 December 2016 247,412 134,160
9. SHARE CAPITAL
Ordinary shares 1 1
Total share capital 1 1
10. REMUNERATION OF DIRECTORS(a) Directors of the company act in an honorary capacity as directors and therefore no director’s fees are payable
The name of directors who held office during the financial year are:
Mr Patrick Woods
Mr William Purcell
Mr Roy Green
(b) Directors’ remunerationNo remuneration was paid to the directors for the 2016 financial year.
11. FINANCIAL RISK MANAGEMENT
(a) Market riskForeign exchange risk — UTS Global does not have any exposure to market risk for changes in foreign exchange.
(b) Credit riskCredit risk arises from the financial assets of UTS Global Pty Ltd, which comprises cash and cash equivalents. UTS Global Ltd’s exposure to credit risk arises from default of the counter party, with the maximum exposure equal to the carrying amount of these instruments. UTS Global Ltd trades only with recognised, creditworthy third parties and as such collateral is not requested.
2016$
2015$
Credit risk by classification of counterparty:
Cash and cash equivalent assets
> Bank 177,658 46,943
> On hand 1 1
> Receivables 3,025 1,278
180,684 48,222
(c) Liquidity riskUTS Global Pty Ltd’s objective is to maintain sufficient cash to meet creditor payments when due. UTS Global receives cash contributions from the holding company to meet ongoing liabilities.
(d) Defaults and breachesThere have been no defaults or breaches in relation to the payables of the company.
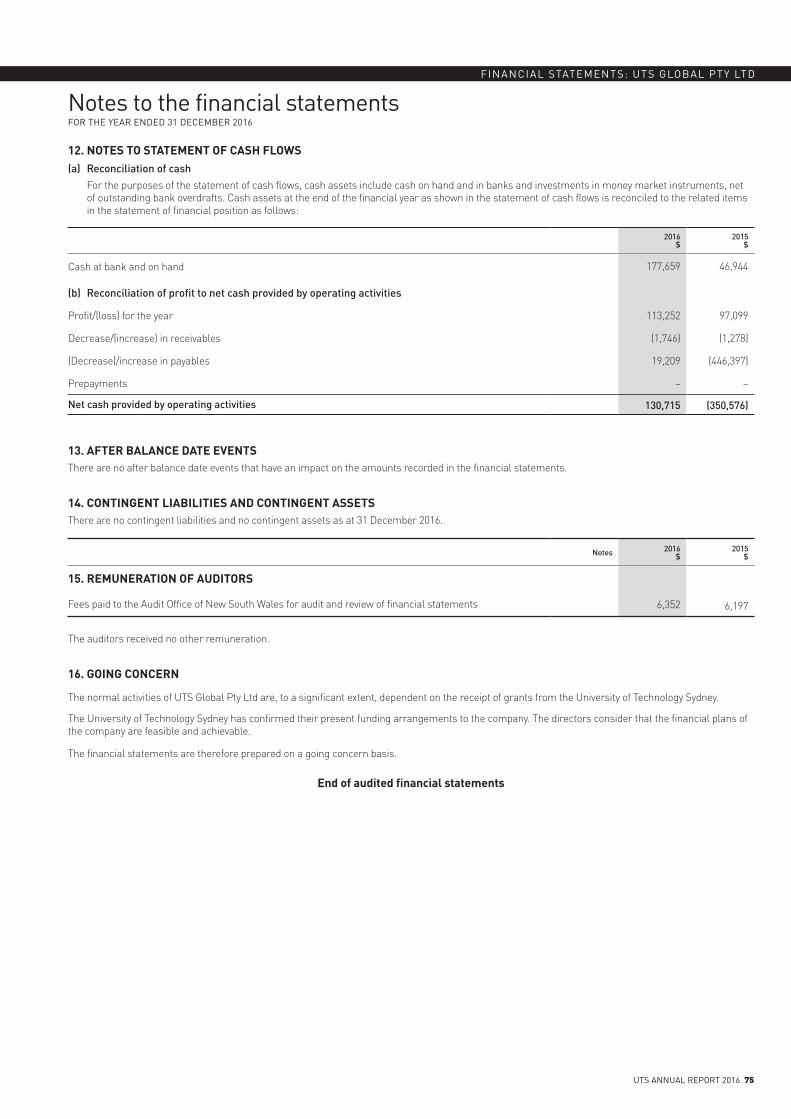
Notes to the financial statementsFOR THE YEAR ENDED 31 DECEMBER 2016
FINANCIAL STATEMENTS: UTS GLOBAL PTY LTD
UTS ANNUAL REPORT 2016 75
12. NOTES TO STATEMENT OF CASH FLOWS(a) Reconciliation of cash
For the purposes of the statement of cash flows, cash assets include cash on hand and in banks and investments in money market instruments, net of outstanding bank overdrafts. Cash assets at the end of the financial year as shown in the statement of cash flows is reconciled to the related items in the statement of financial position as follows:
2016$
2015$
Cash at bank and on hand 177,659 46,944
(b) Reconciliation of profit to net cash provided by operating activities
Profit/(loss) for the year 113,252 97,099
Decrease/(increase) in receivables (1,746) (1,278)
(Decrease)/increase in payables 19,209 (446,397)
Prepayments – –
Net cash provided by operating activities 130,715 (350,576)
13. AFTER BALANCE DATE EVENTSThere are no after balance date events that have an impact on the amounts recorded in the financial statements.
14. CONTINGENT LIABILITIES AND CONTINGENT ASSETSThere are no contingent liabilities and no contingent assets as at 31 December 2016.
Notes 2016$
2015$
15. REMUNERATION OF AUDITORS
Fees paid to the Audit Office of New South Wales for audit and review of financial statements 6,352 6,197
The auditors received no other remuneration.
16. GOING CONCERN
The normal activities of UTS Global Pty Ltd are, to a significant extent, dependent on the receipt of grants from the University of Technology Sydney.
The University of Technology Sydney has confirmed their present funding arrangements to the company. The directors consider that the financial plans of the company are feasible and achievable.
The financial statements are therefore prepared on a going concern basis.
End of audited financial statements
76 UTS ANNUAL REPORT 2016
Directors’ report 77
Statement in accordance with the Public Finance and Audit Act 80
Independent auditor’s report 81
Auditor’s independence declaration 83
Statement of comprehensive income 84
Statement of financial position 84
Statement of changes in equity 85
Statement of cash flows 85
Notes to the financial statements 86
1. Summary of significant accounting policies 86
2. Revenue from continuing operations 87
3. Expenses from continuing operations 87
4. Cash and cash equivalents 88
5. Receivables 88
6. Payables 88
7. Borrowings 88
8. Retained earnings 88
9. Share capital 88
10. Remuneration of directors 88
11. Financial risk management 89
12. Notes to statement of cash flows 89
13. After balance date events 89
14. Contingent liabilities and contingent assets 89
15. Remuneration of auditors 89
16. Related parties 90
17. Going concern 90
Piivot Pty Ltd
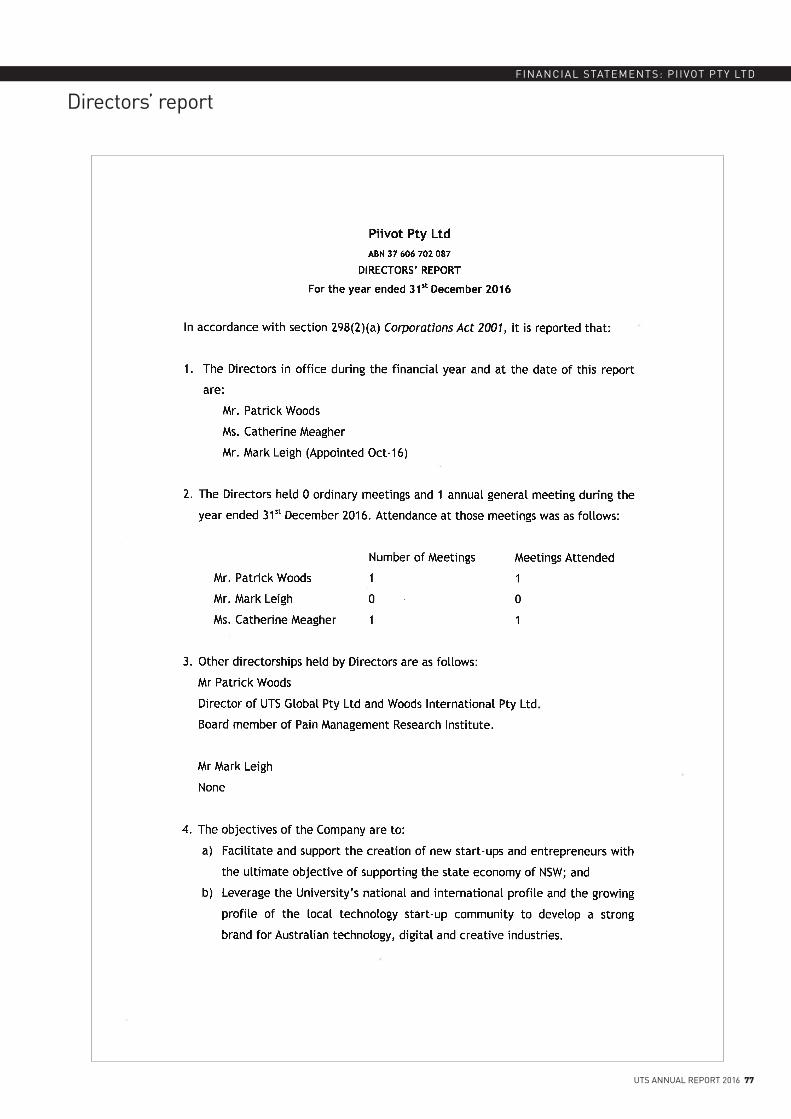
FINANCIAL STATEMENTS: PI IVOT PTY LTD
UTS ANNUAL REPORT 2016 77
Directors’ report
78 UTS ANNUAL REPORT 2016
FINANCIAL STATEMENTS: PI IVOT PTY LTD
Directors’ report (continued)
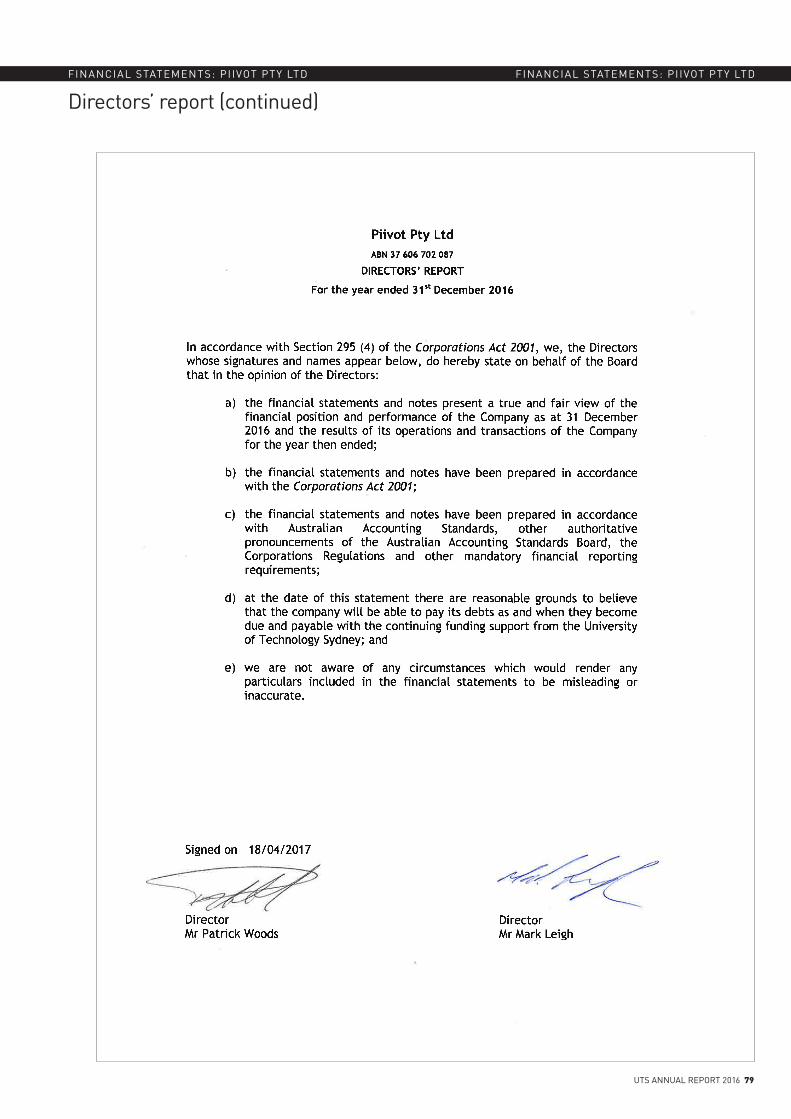
FINANCIAL STATEMENTS: PI IVOT PTY LTD
UTS ANNUAL REPORT 2016 79
Directors’ report (continued)FINANCIAL STATEMENTS: PI IVOT PTY LTD
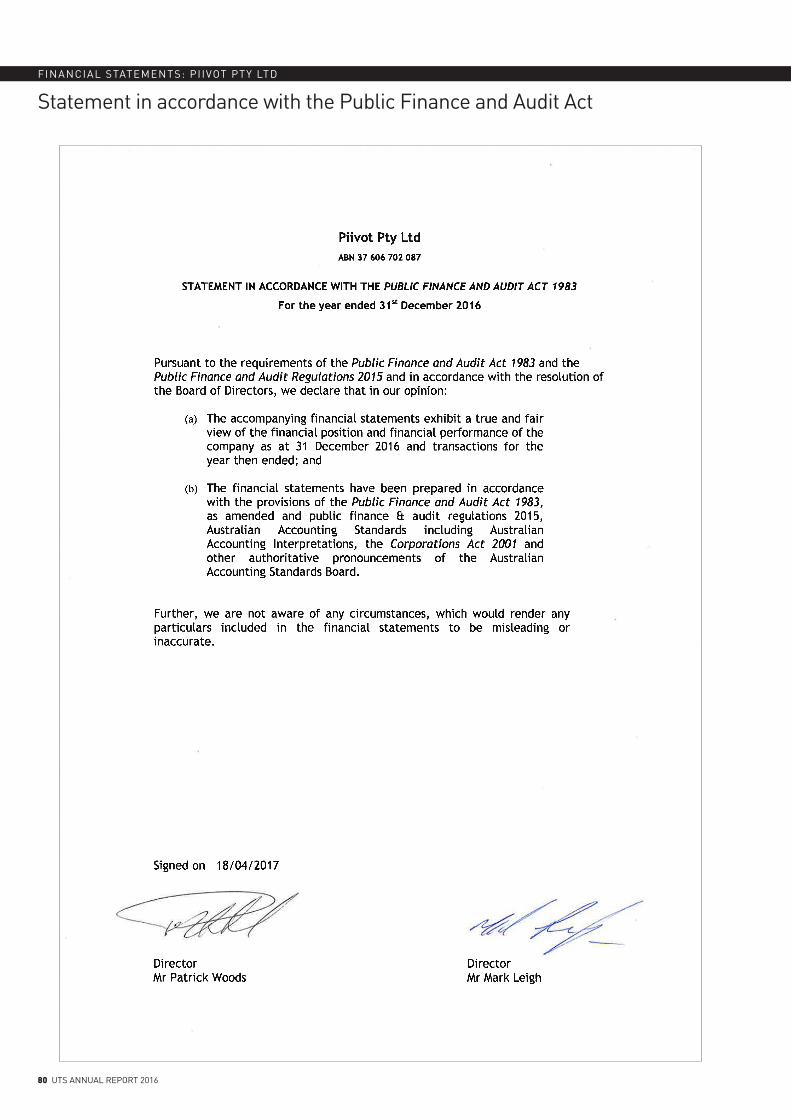
80 UTS ANNUAL REPORT 2016
FINANCIAL STATEMENTS: PI IVOT PTY LTD
Statement in accordance with the Public Finance and Audit Act
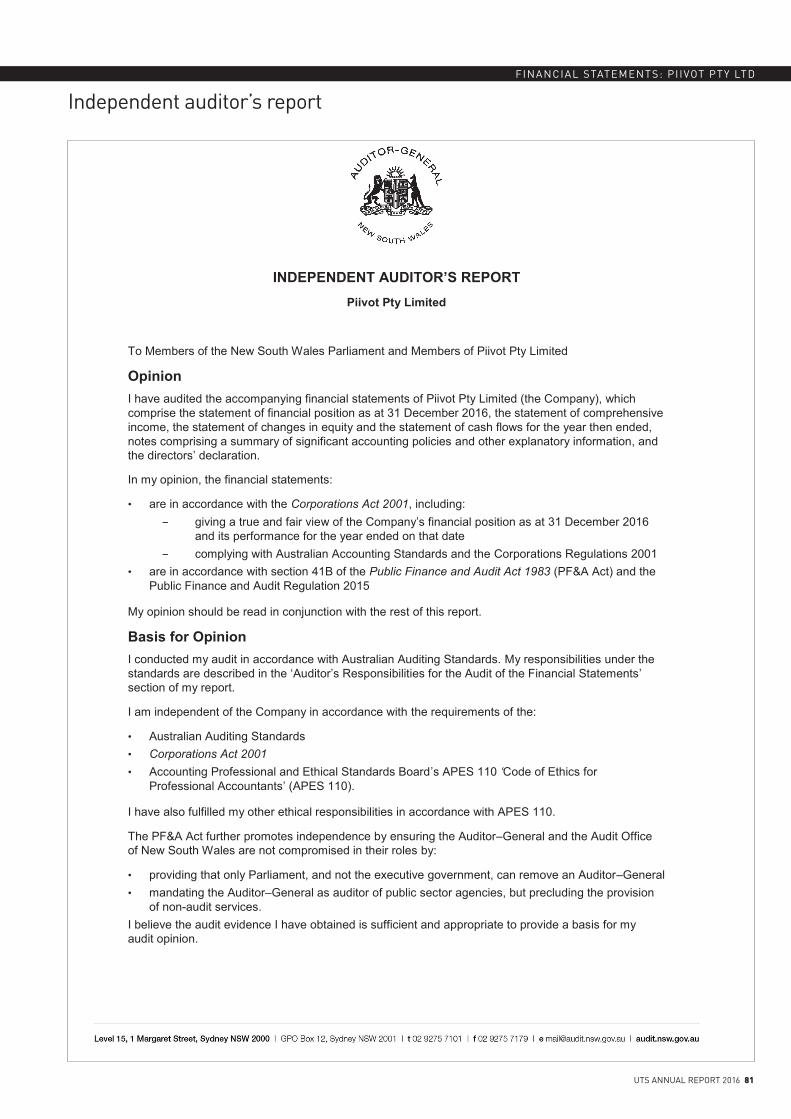
FINANCIAL STATEMENTS: PI IVOT PTY LTD
UTS ANNUAL REPORT 2016 81
Independent auditor’s report
INDEPENDENT AUDITOR’S REPORT Piivot Pty Limited
To Members of the New South Wales Parliament and Members of Piivot Pty Limited
Opinion I have audited the accompanying financial statements of Piivot Pty Limited (the Company), which comprise the statement of financial position as at 31 December 2016, the statement of comprehensive income, the statement of changes in equity and the statement of cash flows for the year then ended, notes comprising a summary of significant accounting policies and other explanatory information, and the directors’ declaration.
In my opinion, the financial statements:
• are in accordance with the Corporations Act 2001, including: giving a true and fair view of the Company’s financial position as at 31 December 2016
and its performance for the year ended on that date complying with Australian Accounting Standards and the Corporations Regulations 2001
• are in accordance with section 41B of the Public Finance and Audit Act 1983 (PF&A Act) and the Public Finance and Audit Regulation 2015
My opinion should be read in conjunction with the rest of this report.
Basis for Opinion I conducted my audit in accordance with Australian Auditing Standards. My responsibilities under the standards are described in the ‘Auditor’s Responsibilities for the Audit of the Financial Statements’ section of my report.
I am independent of the Company in accordance with the requirements of the:
• Australian Auditing Standards • Corporations Act 2001 • Accounting Professional and Ethical Standards Board’s APES 110 ‘Code of Ethics for
Professional Accountants’ (APES 110).
I have also fulfilled my other ethical responsibilities in accordance with APES 110.
The PF&A Act further promotes independence by ensuring the Auditor–General and the Audit Office of New South Wales are not compromised in their roles by:
• providing that only Parliament, and not the executive government, can remove an Auditor–General • mandating the Auditor–General as auditor of public sector agencies, but precluding the provision
of non-audit services. I believe the audit evidence I have obtained is sufficient and appropriate to provide a basis for my audit opinion.
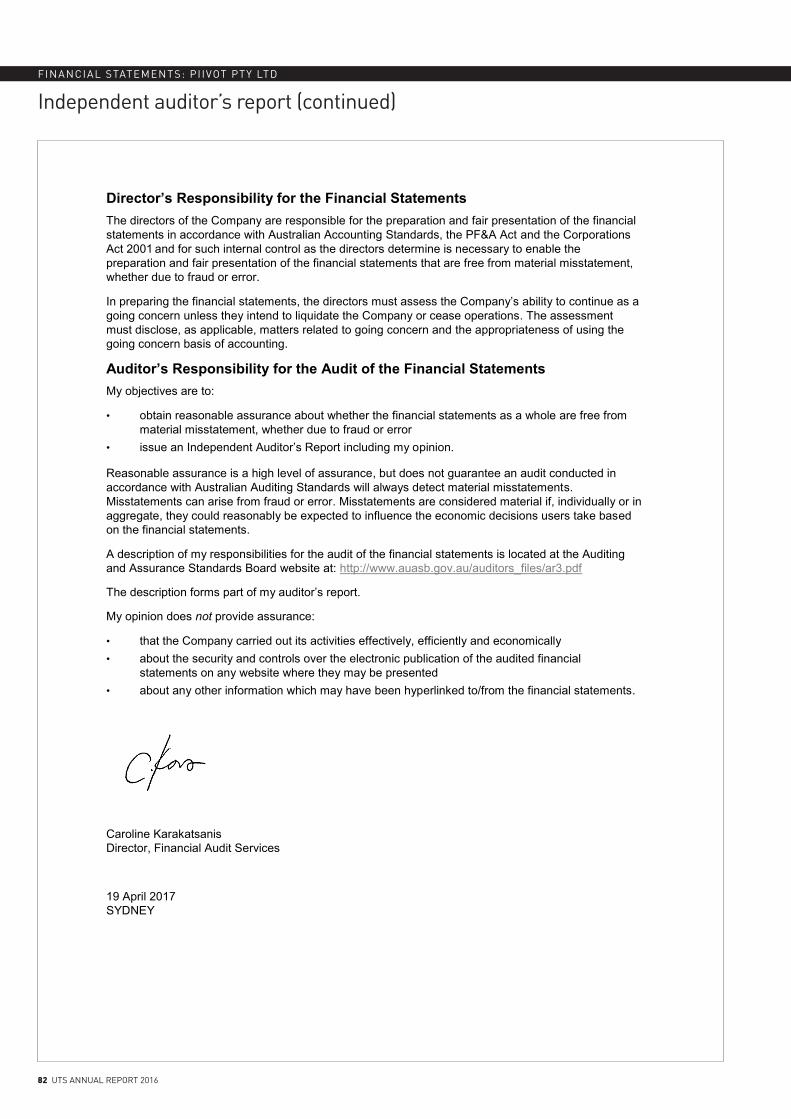
82 UTS ANNUAL REPORT 2016
FINANCIAL STATEMENTS: PI IVOT PTY LTD
Independent auditor’s report (continued)
Director’s Responsibility for the Financial Statements The directors of the Company are responsible for the preparation and fair presentation of the financial statements in accordance with Australian Accounting Standards, the PF&A Act and the Corporations Act 2001 and for such internal control as the directors determine is necessary to enable the preparation and fair presentation of the financial statements that are free from material misstatement, whether due to fraud or error.
In preparing the financial statements, the directors must assess the Company’s ability to continue as a going concern unless they intend to liquidate the Company or cease operations. The assessment must disclose, as applicable, matters related to going concern and the appropriateness of using the going concern basis of accounting.
Auditor’s Responsibility for the Audit of the Financial Statements My objectives are to:
• obtain reasonable assurance about whether the financial statements as a whole are free from material misstatement, whether due to fraud or error
• issue an Independent Auditor’s Report including my opinion.
Reasonable assurance is a high level of assurance, but does not guarantee an audit conducted in accordance with Australian Auditing Standards will always detect material misstatements. Misstatements can arise from fraud or error. Misstatements are considered material if, individually or in aggregate, they could reasonably be expected to influence the economic decisions users take based on the financial statements.
A description of my responsibilities for the audit of the financial statements is located at the Auditing and Assurance Standards Board website at: http://www.auasb.gov.au/auditors_files/ar3.pdf
The description forms part of my auditor’s report.
My opinion does not provide assurance:
• that the Company carried out its activities effectively, efficiently and economically • about the security and controls over the electronic publication of the audited financial
statements on any website where they may be presented • about any other information which may have been hyperlinked to/from the financial statements.
Caroline Karakatsanis Director, Financial Audit Services
19 April 2017 SYDNEY
FINANCIAL STATEMENTS: PI IVOT PTY LTD
UTS ANNUAL REPORT 2016 83
Auditor’s independence declaration
To the Directors Piivot Pty Limited
Auditor’s Independence Declaration
As auditor for the audit of the financial statements of Piivot Pty Limited for the year ended 31 December 2016, I declare, to the best of my knowledge and belief, there have been no contraventions of:
• the auditor independence requirements of the Corporations Act 2001 in relation to the audit • any applicable code of professional conduct in relation to the audit.
Caroline Karakatsanis Director, Financial Audit Services
19 April 2017 SYDNEY

84 UTS ANNUAL REPORT 2016
FINANCIAL STATEMENTS: PI IVOT PTY LTD
Statement of comprehensive incomeFOR THE YEAR ENDED 31 DECEMBER 2016
Notes 2016$
2015$
Continuing operations
Revenue from continuing operations
Grants and contributions 102,000 143,000
Other income 47,481 18,788
2 149,481 161,788
Other expenses 3 398,410 222,194
Loss before income tax (248,929) (60,406)
Income tax – –
Net result for the period for continuing operations (248,929) (60,406)
Net result for the period is attributable to the owners (248,929) (60,406)
Total comprehensive income is attributable to the owners (248,929) (60,406)
The above statement of comprehensive income should be read in conjunction with the accompanying notes.
Statement of financial positionAS AT 31 DECEMBER 2016
Notes 2016$
2015$
Assets
Current assets
Cash and cash equivalents 4 104,558 222,007
Receivables 5 3,919 43,539
Other non-financial assets – –
Total current assets 108,477 265,546
Non-current assets – –
Total non-current assets – –
Total assets 108,477 265,546
Liabilities
Current liabilities
Payables 6 117,712 25,852
Total current liabilities 117,712 25,852
Non-current liabilities
Loan from UTS 7 300,000 300,000
Total non-current liabilities 300,000 300,000
Total liabilities 417,712 325,852
Net liabilities (309,235) (60,306)
Equity
Retained earnings 8 (309,335) (60,406)
Share capital 9 100 100
Total equity (309,235) (60,306)
The above statement of financial position should be read in conjunction with the accompanying notes.

FINANCIAL STATEMENTS: PI IVOT PTY LTD
UTS ANNUAL REPORT 2016 85
Statement of changes in equityAS AT 31 DECEMBER 2016
2016$
2015$
Balance as at 1 January 2016 (60,306) –
Loss for the period (248,929) (60,406)
Other comprehensive income for the period – –
Total comprehensive income for the period (248,929) (60,406)
Transactions with owners recorded directly in equity – 100
Balance at 31 December 2016 (309,235) (60,306)
The above statement of changes in equity should be read in conjunction with the accompanying notes.
Statement of cash flowsAS AT 31 DECEMBER 2016
Notes 2016$
2015$
Cash flows from operating activities
Receipt from customers 155,717 –
GST refunds 22,403 –
Interest received 1,434 37
Creditor payments (296,877) (78,119)
Bank fees (126) (11)
Net cash used in operating activities 12 (117,449) (78,093)
Cash flows from investing activities – –
Net cash used in investing activities – –
Cash flows from financing activities
Loan from UTS – 300,000
Issuance of share capital – 100
Net cash provided by financing activities – 300,100
Net increase in cash and cash equivalents (117,449) 222,007
Cash and cash equivalents at the beginning of the financial year 222,007 –
Cash and cash equivalents at the end of the financial year 104,558 222,007
The above statement of cash flows should be read in conjunction with the accompanying notes.
86 UTS ANNUAL REPORT 2016
FINANCIAL STATEMENTS: PI IVOT PTY LTD
1. SUMMARY OF SIGNIFICANT ACCOUNTING POLICIESPiivot Pty Limited is a for-profit company limited by shares, incorporated and domiciled in Australia and is a wholly owned subsidiary of the University of Technology Sydney.
The company was set up in 2015 and its principal business activities are to facilitate and support the creation of new startups and entrepreneurs with the ultimate objective of supporting the state economy of NSW.
The company’s principal place of business is 15 Broadway, Broadway NSW 2007.
The principal accounting policies adopted in the preparation of these consolidated financial statements are set out below.
(a) Basis of preparationThese general purpose financial statements have been prepared in accordance with Australian Accounting Standards and interpretations issued by the Australian Accounting Standards Board and the Public Finance and Audit Act 1983, the Public Finance and Audit Regulation 2015 and the Corporations Act 2001. Where there are inconsistencies between the above requirements the legislative provisions have prevailed.
These financial statements have been prepared on an historical cost basis and are presented in Australian dollars, rounded to the nearest dollar. The financial statements were approved by the board of directors on 18 April 2016.
(b) Statement of complianceThe financial statements and notes comply with Australian Accounting Standards, which include Australian Accounting Interpretations.
(c) Financial instrumentsFinancial instruments give rise to positions that are financial assets or liabilities (or equity instruments) of either company or its counterparties. These include cash at bank, receivables, accounts payable and loans and borrowings. Note 11 discloses the risk and management of those risks regarding financial instruments.
(i) Cash
Cash comprises cash on hand and bank balances. Interest has been earned at the prevailing rates.
(ii) Receivables
Trade receivables are recorded at amounts due at balance date, less a provision for any uncollectible debts. An estimate for doubtful debts is made when collection of the full amounts is no longer probable. Bad debts are written off as incurred.
(iii) Payables
Trade accounts payable, other payables and accruals are recognised when the economic entity becomes obliged to make future payments as a result of purchase of goods and services.
(iv) Loans and borrowings
All loans are measured at the principal amount.
(d) Revenue recognitionGrants from institutions are recognised when control of the grant or the right to receive the grant is obtained. Project revenue is recognised periodically during the course of the project and at its conclusion.
Revenue arising from the sale of assets is recognised on disposal.
Interest revenue is recognised as it accrues.
(e) Taxation
(i) Accounting for Goods and Services Tax
Revenues, expenses and assets are recognised net of the amount of goods and services tax (GST), except where the amount of GST incurred is not recoverable from the taxation authority it is recognised as part of the cost of acquisition of an asset or part of an item of expense, or for receivables and payables which are recognised inclusive of GST.
The net amount of GST recoverable from, or payable to, the taxation authority is included as part of receivables or payables.
Cash flows are included in the cash flow statement on a gross basis. The GST component of cash flows arising from investing and financing activities that is recoverable from, or payable to, the taxation authority is classified within operating activities.
(ii) Income tax
The income tax expense on revenue for the period is the tax payable on the current period’s taxable income based on the national income tax rate for each jurisdiction adjusted by changes in deferred tax assets and liabilities and their carrying amounts in the financial statements and to unused tax losses.
Deferred tax assets and liabilities are recognised for temporary differences at the tax rates expected to apply when the assets are recovered or liabilities are settled, based on those tax rates which are enacted or substantively enacted for each jurisdiction.
Deferred tax assets are recognised for deductible temporary differences and unused tax losses only if it is probable that future taxable amounts will be available to utilise those temporary differences and losses.
Notes to the financial statementsFOR THE YEAR ENDED 31 DECEMBER 2016
Notes to the financial statementsFOR THE YEAR ENDED 31 DECEMBER 2016
FINANCIAL STATEMENTS: PI IVOT PTY LTD
UTS ANNUAL REPORT 2016 87
(f) Judgements and estimatesThe preparation of the financial statements requires management to make judgements, estimates and assumptions that affect the reported amounts in the financial statements. Management continually evaluates its judgements and estimates in relation to assets, liabilities, contingent liabilities, revenue and expenses. Management bases its judgements and estimates on historical experience and on other various factors it believes to be reasonable under the circumstances.
(g) New accounting standards and interpretations Certain new accounting standards and interpretations have been published that are not mandatory for the 31 December 2016 reporting period. Piivot has not exercised the right to early adopt any new or revised accounting standard.
(h) Changes in accounting policyThere have been no changes to accounting policy in the 2016 year.
(i) Going concernThe company is supported by the University of Technology Sydney and will be able to meet its financial obligations when they fall due as expressed in the letter of support from the university.
Notes 2016$
2015$
2. REVENUE FROM CONTINUING OPERATIONS
Grants and contributions 102,000 143,000
Other income
Ticket sales 46,106 –
UTS contribution – 18,750
Interest earned 1,434 38
Other income (58) –
47,481 18,788
Total revenue from continuing operations 149,481 161,788
3. EXPENSES FROM CONTINUING OPERATIONS
Consulting 300,922 138,700
Event entertainment 55,764 –
Audit fee 10,795 14,000
Fees and subscriptions 14,845 –
Contributions 5,000 –
Expensed IT equipment 8,500 –
Legal fees 2,213 –
Marketing and advertising – 50,058
Sponsorship – 16,591
Other 246 2,834
Bank fees and charges 126 11
Total expenses from continuing operations 398,410 222,194
88 UTS ANNUAL REPORT 2016
Notes to the financial statementsFOR THE YEAR ENDED 31 DECEMBER 2016
FINANCIAL STATEMENTS: PI IVOT PTY LTD
Notes 2016$
2015$
4. CASH AND CASH EQUIVALENTS
Cash at bank 104,558 222,007
Total cash and cash equivalents 104,558 222,007
5. RECEIVABLES
Accounts receivable 2,200 –
Receivable from parent – 37,391
GST receivable 1,719 6,148
Total receivables 3,919 43,539
6. PAYABLES
Payable to parent 104,297 –
Accrued expenses 13,415 25,852
Total payables 117,712 25,852
7. BORROWINGS
Loan from UTS 300,000 300,000
Total borrowings 300,000 300,000
8. RETAINED EARNINGS
Balance at the beginning of the period (60,406) –
Surplus/(deficit) for the period (248,929) (60,406)
Balance as at 31 December 2016 (309,335) (60,406)
9. SHARE CAPITAL
100 shares issued to UTS at $1 per share 100 100
Total share capital 100 100
10. REMUNERATION OF DIRECTORS(a) Directors of the company act in an honorary capacity as directors and therefore no director’s fees are payable
The name of directors who held office during the financial year are:
Ms Catherine Meagher
Mr Patrick Woods
Mr Mark Leigh
(b) Directors’ remunerationNo remuneration was paid to the directors for the 2016 financial year.
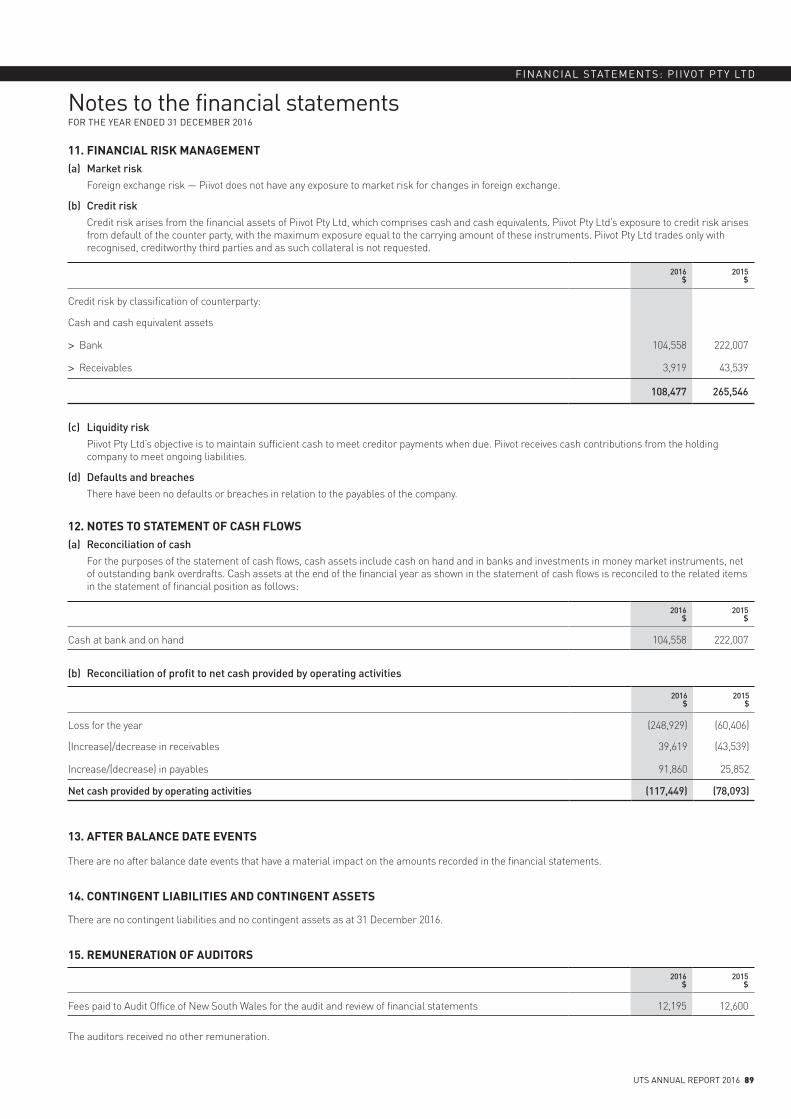
Notes to the financial statementsFOR THE YEAR ENDED 31 DECEMBER 2016
FINANCIAL STATEMENTS: PI IVOT PTY LTD
UTS ANNUAL REPORT 2016 89
11. FINANCIAL RISK MANAGEMENT(a) Market risk
Foreign exchange risk — Piivot does not have any exposure to market risk for changes in foreign exchange.
(b) Credit riskCredit risk arises from the financial assets of Piivot Pty Ltd, which comprises cash and cash equivalents. Piivot Pty Ltd’s exposure to credit risk arises from default of the counter party, with the maximum exposure equal to the carrying amount of these instruments. Piivot Pty Ltd trades only with recognised, creditworthy third parties and as such collateral is not requested.
2016$
2015$
Credit risk by classification of counterparty:
Cash and cash equivalent assets
> Bank 104,558 222,007
> Receivables 3,919 43,539
108,477 265,546
(c) Liquidity riskPiivot Pty Ltd’s objective is to maintain sufficient cash to meet creditor payments when due. Piivot receives cash contributions from the holding company to meet ongoing liabilities.
(d) Defaults and breachesThere have been no defaults or breaches in relation to the payables of the company.
12. NOTES TO STATEMENT OF CASH FLOWS(a) Reconciliation of cash
For the purposes of the statement of cash flows, cash assets include cash on hand and in banks and investments in money market instruments, net of outstanding bank overdrafts. Cash assets at the end of the financial year as shown in the statement of cash flows is reconciled to the related items in the statement of financial position as follows:
2016$
2015$
Cash at bank and on hand 104,558 222,007
(b) Reconciliation of profit to net cash provided by operating activities
2016$
2015$
Loss for the year (248,929) (60,406)
(Increase)/decrease in receivables 39,619 (43,539)
Increase/(decrease) in payables 91,860 25,852
Net cash provided by operating activities (117,449) (78,093)
13. AFTER BALANCE DATE EVENTS
There are no after balance date events that have a material impact on the amounts recorded in the financial statements.
14. CONTINGENT LIABILITIES AND CONTINGENT ASSETS
There are no contingent liabilities and no contingent assets as at 31 December 2016.
15. REMUNERATION OF AUDITORS
2016$
2015$
Fees paid to Audit Office of New South Wales for the audit and review of financial statements 12,195 12,600
The auditors received no other remuneration.
90 UTS ANNUAL REPORT 2016
Notes to the financial statementsFOR THE YEAR ENDED 31 DECEMBER 2016
FINANCIAL STATEMENTS: PI IVOT PTY LTD
16. RELATED PARTIES(a) Parent entityThe ultimate parent entity is the University of Technology Sydney.
(b) Transaction with related partiesContributions in kind were provided in the form of services to Piivot by the University of Technology Sydney, amounting to $169,469 during the year ended 31 December 2016.
17. GOING CONCERNThe normal activities of Piivot Pty Ltd are, to a significant extent, dependent on the receipt of grants from the University of Technology Sydney.
The University of Technology Sydney has confirmed their present funding arrangements to the company. The directors consider that the financial plans of the company are feasible and achievable.
The financial statements are therefore prepared on a going concern basis.
End of audited financial statements

UTS ANNUAL REPORT 2016 91
Report of the directors 92
Directors’ declaration 95
Independent auditor’s report 96
Auditor’s independence declaration 99
Statement of comprehensive income 100
Statement of financial position 101
Statement of changes in equity 102
Statement of cash flows 103
Notes to the financial statements 104
1. The company 104
2. Summary of significant accounting policies 104
3. Financial risk management 110
4. Revenue 113
5. Other income 113
6. Expenses 113
7. Cash and cash equivalents 114
8. Trade and other receivables 115
9. Investments accounted for using the equity method 116
10. Property, plant and equipment 117
11. Intangible assets 119
12. Other non-current assets 119
13. Trade and other payables 120
14. Finance lease liability 120
15. Provisions 120
16. Employee benefit obligations 121
17. Other current liabilities 122
18. Reserves and retained surplus 122
19. Key management personnel disclosures 122
20. Related party transactions 123
21. Subsidiaries 124
22. Remuneration of auditors 124
23. Commitments 124
24. Members’ guarantee 125
25. Events occurring after the reporting period 125
26. Cash flow information 125
Insearch Limited
92 UTS ANNUAL REPORT 2016
FINANCIAL STATEMENTS: INSEARCH LIMITED
Report of the directors
This report of the directors of INSEARCH Limited is made in accordance with a resolution of the directors in accordance with section 298(2)(a) of the Corporations Act 2001.
DirectorsThe names of directors in office during the year and at the date of this report are:
Date of appointment Date of retirement
Emeritus Professor RD Milbourne, AO 1 March 2016
Mr P Bennett 25 May 2011
Ms AM Dwyer 2 March 2015
Mr GA Freeland 28 March 2017
Ms DN Hill 27 March 2008 27 March 2017
Mr JM Hutchison, AM 27 Nov. 2008
Mr A Murphy 3 Sept. 2007
Professor WR Purcell 21 May 2009
Professor M Spongberg 1 July 2014Company secretaryThe name of the company secretary in office at the date of this report is:
Mr NL Patrick (appointed 21 October 2010)
Principal activitiesThe activities of the company during the financial year ended 31 December 2016 were the provision of English language, foundation and academic courses that are designed as pathways to university studies.
Review and result of operationsINSEARCH reported a surplus of $5.6m, after the payment of a donation to the University of Technology Sydney of $7.2m (note 6). This surplus added to the prior year accumulated surplus brings the balance of the accumulated funds to $61.8m.
Business strategies and future developmentsThe main objectives of the company are to provide pathway courses for undergraduate entry to the University of Technology Sydney and to pay donations to the university when appropriate. Scholarship programs and partnerships with other organisations to provide educational facilities/courses are also objectives of the company. The strategies of the company are focused on achieving these objectives.
Business strategies, prospects and future developments, which may affect the operations of the company in subsequent years, have been reported as appropriate elsewhere in this report. In the opinion of the directors, disclosure of any further information on future developments would be unreasonably prejudicial to the interests of the company.
Director’s benefitsNo director of the company has, during and since the end of the financial year, received or become entitled to receive a benefit, other than the benefit included in the aggregate amount of director’s compensation shown in note 19 of the financial report.
Insurance of directors and officersDuring the financial year a premium to insure directors and officers of the company was paid by the University of Technology Sydney to the amount of $6,407 (2015: $6,297) per sections 300 (1)(g), 300(8) and 300(9) of the Corporations Act 2001.
The liabilities insured include costs and expenses that may be brought against the directors and officers in their capacity as directors and officers of the company.
Information on directorsEmeritus Professor Ross Milbourne, AO, BCom, MCom (UNSW), PhD (Calif), FASSA, FAICD Chair of the Board, Non-Executive Director — March 2016
Emeritus Professor Milbourne became Chair of the INSEARCH Limited Board on 1 March 2016.
Emeritus Professor Milbourne was appointed Vice-Chancellor of the University of Technology Sydney (UTS) in 2002. During 12 years in the role, he led a major development of the university’s physical campus and infrastructure and the advancement of its national and international profile and reputation.
This followed a number of leadership roles in Australian universities since 1997: Deputy Vice-Chancellor (Research), University of Adelaide (1997–2000); Pro Vice-Chancellor (Research), University of New South Wales (2000–2001); Deputy Vice-Chancellor (Academic), University of Technology Sydney (2001–2002).
Other previous notable appointments include Reserve Bank of Australia Senior Fellow in Economic Policy, Visiting Professor to the London School of Economics, board member of Universities Australia, member and Chair of the Australian Research Council (ARC) Social Sciences Panel and Research Grants Committee, and Fellow of the Academy of Social Sciences in Australia (FASSA).
Emeritus Professor Milbourne is internationally recognised as an economist and researcher, and has been appointed by the Australian Government to major policy-oriented committees and reviews. He received the Centenary Medal in 2001 for service to Australian society through economics and university administration and was made an Officer of the Order of Australia (AO) in 2015 for his distinguished service to higher education.
Emeritus Professor Milbourne holds a Masters in Commerce from the University of New South Wales and completed his PhD at the University of California, Berkeley under the supervision of Nobel laureate George Akerlof. He is a Fellow of the Australian Institute of Company Directors.
Mr Jonathan Hutchison, AM, BCom, CPA Interim Chair of the Board — November 2015 to February 2016, Member of the Remuneration and Nominations Committee, Non-Executive Director
Mr Hutchison was elected Interim Chair of the Board in November 2015, following the retirement of Mr Mack Williams, who had held the position of Chair for seven years.
Mr Hutchison was senior advisor to Lendlease for the successful bid to redevelop Darling Harbour in 2012/13 and facilitated the inclusion of UTS in the proposed high tech IQ centre as part of that bid.
He was the Chief Executive Officer of Business Events Sydney from 1998 to 2011. Prior to that appointment, Mr Hutchison was the Managing Director of the Australian Tourist Commission, now known as Tourism Australia, following roles as NSW State Manager for Ansett and Chief Executive of Ansett Express Airlines.
Mr Hutchison is an Adjunct Professor at UTS and Chair of the UTS Australian Centre for Event Management Advisory Board. He is also Chair of Tasman Cargo Airlines and Presdyn Pty Ltd, and is a tourism and business events consultant.
In 2006, Mr Hutchison was awarded membership of the Order of Australia for his service to tourism and business through promoting Australia as a travel destination and in leadership and advisory roles with industry international and national organisations.
UTS ANNUAL REPORT 2016 93
FINANCIAL STATEMENTS: INSEARCH LIMITED
Report of the directors (continued)
Ms Dianne Hill, BA Accounting, FCA, FAICD Deputy Chair of the Board — November 2015 to March 2017, Chair of the Audit and Risk Committee — March 2017, Non-Executive Director — March 2017
Ms Hill has 30 years’ experience as a Chartered Accountant and is a former New South Wales President and National Councillor of Chartered Accountants Australia and New Zealand. She is a member of the Chartered Accountants Scholarship Fund and an advisory group that provides an ethical counselling service to Chartered Accountants.
Ms Hill has been a Non-Executive Director for 20 years and is a Fellow of the Australian Institute of Company Directors and a Trustee member of CEDA. She is also a member of the Australian Institute of Internal Auditors.
Ms Hill is a Director of CoAct Limited and Chair of its Audit and Risk Committee (ARC), Director of Scope Global Limited and Chair of its ARC, Director of accessUTS Pty Ltd, and of her management consulting company, Sector Research Pty Ltd. She is a member of the ARC of the NSW Department of Finance Services and Innovation, NSW Property Group, Service NSW, Land and Housing Corporation, and she is the Chair of the ARC and the Remuneration Commitee for the Audit Office of New South Wales and for the Sydney Children’s Hospital Network. She is also a facilitator for Company Directors.
She is a former Director of the Australian Consumers Association (awarded Life Membership) and the Internal Audit Bureau of New South Wales
Mr Alex Murphy, BA(Hons), MAICD Managing Director
Mr Murphy is Managing Director of INSEARCH Limited. He has 25 years’ experience with INSEARCH in education, marketing and senior management roles. Since assuming the MD role in late 2007, INSEARCH has more than doubled in size, extended its range of offshore partnerships delivering INSEARCH programs in the region and expanded its sponsorship of UTS initiatives, including UTS’s Indigenous strategy, alumni events and international student scholarships.
Mr Murphy has had a long interest in higher education, intercultural business and ethics, and has lived and worked in Indonesia. He studied linguistics, philosophy and Indonesia and Malayan studies at the University of Sydney, and undertook research at the University of Sydney and Macquarie University where he also lectured in linguistics.
Mr Murphy ensures that learning and development of staff is fully supported by INSEARCH and he accesses executive training programs and coaching regularly to support his own learning and development.
Mr Murphy has been a member of the St James Ethics Centre since 1997.
Mr Peter Bennett, BEc, DipEd (Monash), MBA (Melb), FCPA, GAICD, SA Fin Member of the Audit and Risk Committee, Member of the Remuneration and Nominations Committee, Non-Executive Director
Mr Bennett has 30 years’ experience in accounting and finance including holding senior executive positions in the finance industry and the consumer goods industry in the Asia–Pacific region.
He is also a member of the UTS Council and a Board member and Chair of the Audit and Risk Committee of Campbell Page.
Ms Anne Dwyer, BBus (CSU), MAICD Member of the Audit and Risk Committee, Member of the Remuneration and Nominations Committee, Non-Executive Director
Ms Dwyer has been the Deputy Vice-Chancellor and Vice-President (Corporate Services) at UTS since 2004. She joined UTS in 1999 as Director of the Information Technology Division and her current responsibilities include Human Resources, Information Technology, Student Administration, Marketing and Communication, Governance Support and Legal Services.
Ms Dwyer held several financial and administrative management roles at Ansett Air Freight before moving into information technology. She was
the Director of IT for Arthur Andersen’s Australian and New Zealand operations prior to joining UTS.
Professor William (Bill) Purcell, BCom(Hons), DipJapSt, PhD Chair of the Remuneration and Nominations Committee, Non-Executive Director
Professor Purcell is Deputy Vice-Chancellor and Vice-President (International & Advancement) at UTS. He was formerly Deputy Vice-Chancellor (International) at the University of Newcastle.
Professor Purcell is a Director of Sydney Educational Broadcasting Ltd, UTS Global Ltd, UTS Beijing Ltd and a Trustee of the Mitsui Education Foundation. He is a board member of the Art Gallery of New South Wales VisAsia Board and Study Overseas Foundation.
Professor Purcell’s other corporate board positions have included: Chair and Chief Executive Officer of UON Singapore Pte Ltd, IDP Education Australia Ltd and AHIEA Ltd. Professor Purcell has also served as a consultant and advisor to business and government across Australia and Asia in the area of business internationalisation and joint venturing. Professor Purcell’s academic specialisation includes Asian business and management systems, international joint venturing, and subsidiary location decision-making and start-up.
Professor Mary Spongberg, BA(Hons), PhD Non-Executive Director
Professor Spongberg has been Dean of the Faculty of Arts and Social Sciences at UTS since May 2013.
She was previously a Professor of Modern History and Associate Dean of Research in the Faculty of Arts at Macquarie University. Prior to joining Macquarie, Professor Spongberg was a National Health and Medical Research Centre postdoctoral fellow in Women’s Studies at the University of Sydney.
Professor Spongberg has taught Australian history, European history and women’s studies at Macquarie University and the University of Sydney.
Mr Guy Freeland, BCom, CA, GAICD Chair of the Audit and Risk Committee — from March 2017, Non-Executive Director — from March 2017
Mr Freeland has held senior executive financial and general management positions in the infrastructure construction, ICT, industrial products and non-profit international development sectors for more than two decades. Working predominantly for large global companies, including a period under private equity ownership, he has extensive experience in finance and business systems, financial control and risk management, and development of strategic and business operational plans. Prior to this, Mr Freeland spent 10 years with PwC in its audit and corporate services groups.
Mr Freeland is currently a Non-Executive Director of Thomas Holt, a residential and home-based aged care provider, and Chair of its Finance, Audit and Risk Management Committee. He is also an external Risk Committee member for Habitat for Humanity, an international NGO working across Australia and the Asia–Pacific region to address housing poverty.
Mr Freeland has been a Chartered Accountant for more than 35 years and is a Graduate Member of the AICD.
Information on Company SecretaryMr Nathan Patrick, BBus, GradDipACG, FCA, FGIA, FCIS, FAICD Chief Financial Officer and Company Secretary
Mr Patrick was appointed Chief Financial Officer (CFO) and Company Secretary of INSEARCH Limited in 2010.
As CFO/Company Secretary he is responsible for INSEARCH’s finance and governance activities. The governance portfolio includes the Program Management Office (PMO), campus planning, risk management, compliance (including liaising with regulators), offshore legal entities, legal and company secretariat.
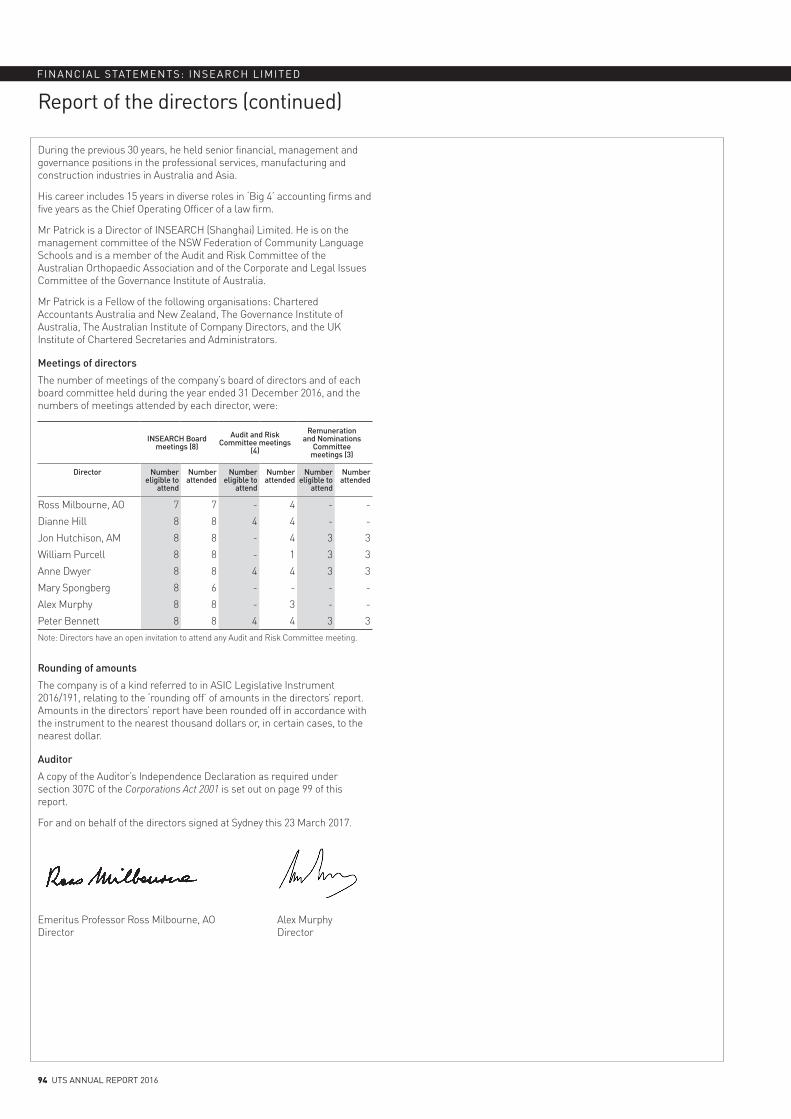
94 UTS ANNUAL REPORT 2016
FINANCIAL STATEMENTS: INSEARCH LIMITED
During the previous 30 years, he held senior financial, management and governance positions in the professional services, manufacturing and construction industries in Australia and Asia.
His career includes 15 years in diverse roles in ‘Big 4’ accounting firms and five years as the Chief Operating Officer of a law firm.
Mr Patrick is a Director of INSEARCH (Shanghai) Limited. He is on the management committee of the NSW Federation of Community Language Schools and is a member of the Audit and Risk Committee of the Australian Orthopaedic Association and of the Corporate and Legal Issues Committee of the Governance Institute of Australia.
Mr Patrick is a Fellow of the following organisations: Chartered Accountants Australia and New Zealand, The Governance Institute of Australia, The Australian Institute of Company Directors, and the UK Institute of Chartered Secretaries and Administrators.
Meetings of directors
The number of meetings of the company’s board of directors and of each board committee held during the year ended 31 December 2016, and the numbers of meetings attended by each director, were:
INSEARCH Board meetings (8)
Audit and Risk Committee meetings
(4)
Remuneration and Nominations
Committee meetings (3)
Director Number eligible to
attend
Number attended
Number eligible to
attend
Number attended
Number eligible to
attend
Number attended
Ross Milbourne, AO 7 7 - 4 - -
Dianne Hill 8 8 4 4 - -
Jon Hutchison, AM 8 8 - 4 3 3
William Purcell 8 8 - 1 3 3
Anne Dwyer 8 8 4 4 3 3
Mary Spongberg 8 6 - - - -
Alex Murphy 8 8 - 3 - -
Peter Bennett 8 8 4 4 3 3Note: Directors have an open invitation to attend any Audit and Risk Committee meeting.
Rounding of amounts
The company is of a kind referred to in ASIC Legislative Instrument 2016/191, relating to the ‘rounding off’ of amounts in the directors’ report. Amounts in the directors’ report have been rounded off in accordance with the instrument to the nearest thousand dollars or, in certain cases, to the nearest dollar.
Auditor
A copy of the Auditor’s Independence Declaration as required under section 307C of the Corporations Act 2001 is set out on page 99 of this report.
For and on behalf of the directors signed at Sydney this 23 March 2017.
Emeritus Professor Ross Milbourne, AO Alex Murphy Director Director
Report of the directors (continued)
UTS ANNUAL REPORT 2016 95
FINANCIAL STATEMENTS: INSEARCH LIMITED
Directors’ declaration
In accordance with a resolution of the directors of INSEARCH Limited, the directors of the company declare that:
(a) the financial statements and notes are in accordance with the Corporations Act 2001 and:
(i) comply with Accounting Standards and the Public Finance and Audit Act 1983 and the Public Finance and Audit Regulation 2015, as stated in accounting policy note 2 to the financial statements, and
(ii) give a true and fair view of the financial position as at 31 December 2016 and of its performance for the year ended on that date of the consolidated group.
(b) In the directors’ opinion there are reasonable grounds to believe that the company will be able to pay its debts as and when they become due and payable.
This declaration is made in accordance with a resolution of the directors pursuant to section 295(5) of the Corporations Act 2001.
Signed on behalf of the Board of Directors
Emeritus Professor Ross Milbourne, AO Alex Murphy Director Director
Sydney 23 March 2017
96 UTS ANNUAL REPORT 2016
FINANCIAL STATEMENTS: INSEARCH LIMITED
Independent auditor’s report
UTS ANNUAL REPORT 2016 97
FINANCIAL STATEMENTS: INSEARCH LIMITED
Independent auditor’s report (continued)

98 UTS ANNUAL REPORT 2016
FINANCIAL STATEMENTS: INSEARCH LIMITED
Independent auditor’s report (continued)
UTS ANNUAL REPORT 2016 99
FINANCIAL STATEMENTS: INSEARCH LIMITED
Auditor’s independence declaration
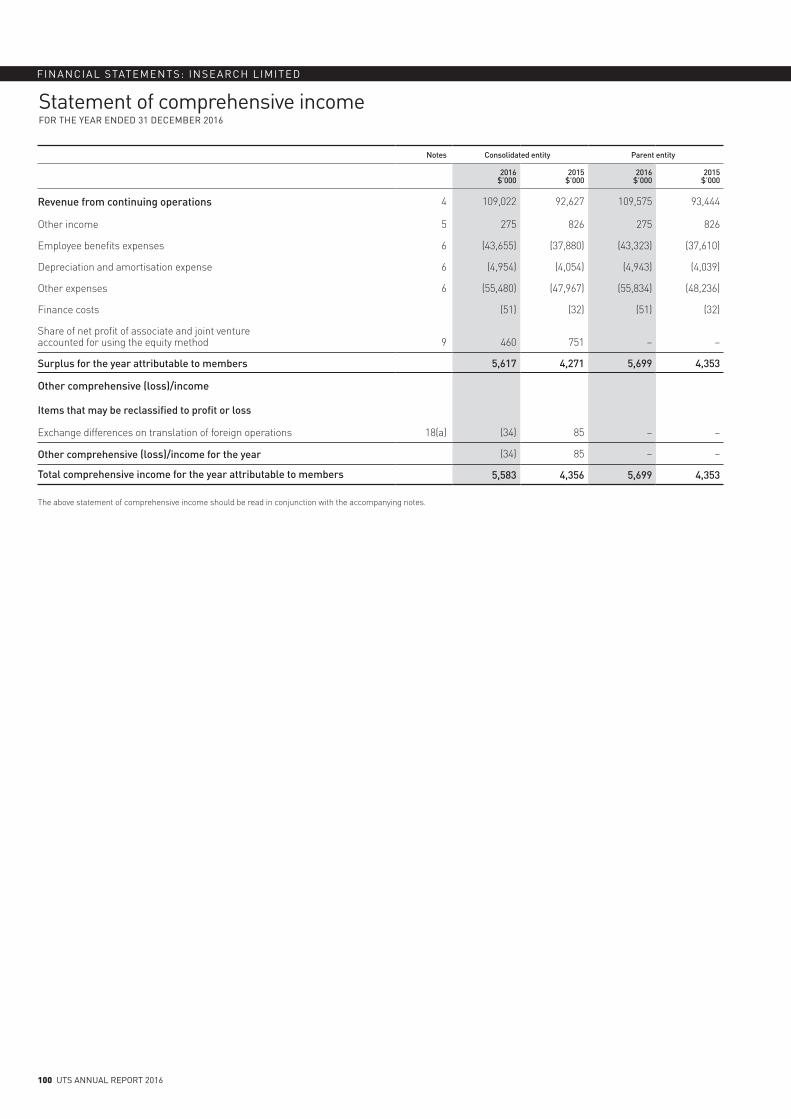
100 UTS ANNUAL REPORT 2016
FINANCIAL STATEMENTS: INSEARCH LIMITED
Statement of comprehensive incomeFOR THE YEAR ENDED 31 DECEMBER 2016
Notes Consolidated entity Parent entity
2016 $’000
2015 $’000
2016 $’000
2015 $’000
Revenue from continuing operations 4 109,022 92,627 109,575 93,444
Other income 5 275 826 275 826
Employee benefits expenses 6 (43,655) (37,880) (43,323) (37,610)
Depreciation and amortisation expense 6 (4,954) (4,054) (4,943) (4,039)
Other expenses 6 (55,480) (47,967) (55,834) (48,236)
Finance costs (51) (32) (51) (32)
Share of net profit of associate and joint venture accounted for using the equity method 9 460 751 – –
Surplus for the year attributable to members 5,617 4,271 5,699 4,353
Other comprehensive (loss)/income
Items that may be reclassified to profit or loss
Exchange differences on translation of foreign operations 18(a) (34) 85 – –
Other comprehensive (loss)/income for the year (34) 85 – –
Total comprehensive income for the year attributable to members 5,583 4,356 5,699 4,353
The above statement of comprehensive income should be read in conjunction with the accompanying notes.
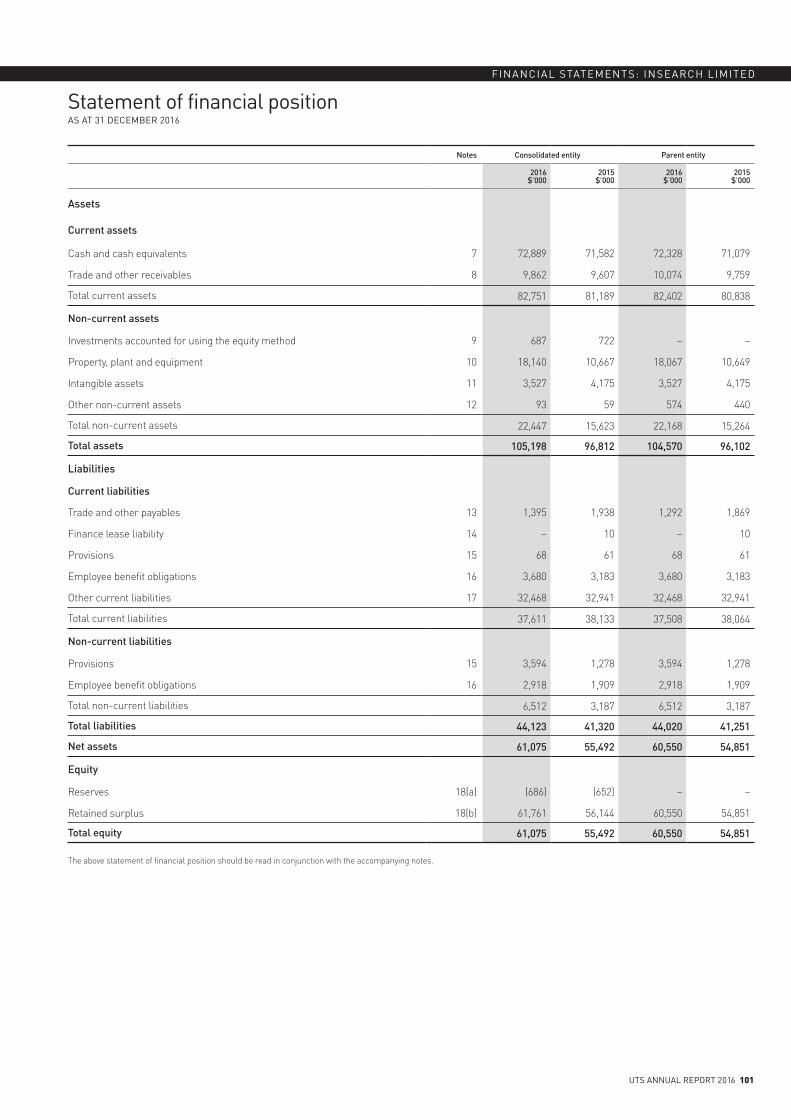
UTS ANNUAL REPORT 2016 101
FINANCIAL STATEMENTS: INSEARCH LIMITED
Statement of financial positionAS AT 31 DECEMBER 2016
Notes Consolidated entity Parent entity
2016 $’000
2015 $’000
2016 $’000
2015 $’000
Assets
Current assets
Cash and cash equivalents 7 72,889 71,582 72,328 71,079
Trade and other receivables 8 9,862 9,607 10,074 9,759
Total current assets 82,751 81,189 82,402 80,838
Non-current assets
Investments accounted for using the equity method 9 687 722 – –
Property, plant and equipment 10 18,140 10,667 18,067 10,649
Intangible assets 11 3,527 4,175 3,527 4,175
Other non-current assets 12 93 59 574 440
Total non-current assets 22,447 15,623 22,168 15,264
Total assets 105,198 96,812 104,570 96,102
Liabilities
Current liabilities
Trade and other payables 13 1,395 1,938 1,292 1,869
Finance lease liability 14 – 10 – 10
Provisions 15 68 61 68 61
Employee benefit obligations 16 3,680 3,183 3,680 3,183
Other current liabilities 17 32,468 32,941 32,468 32,941
Total current liabilities 37,611 38,133 37,508 38,064
Non-current liabilities
Provisions 15 3,594 1,278 3,594 1,278
Employee benefit obligations 16 2,918 1,909 2,918 1,909
Total non-current liabilities 6,512 3,187 6,512 3,187
Total liabilities 44,123 41,320 44,020 41,251
Net assets 61,075 55,492 60,550 54,851
Equity
Reserves 18(a) (686) (652) – –
Retained surplus 18(b) 61,761 56,144 60,550 54,851
Total equity 61,075 55,492 60,550 54,851
The above statement of financial position should be read in conjunction with the accompanying notes.
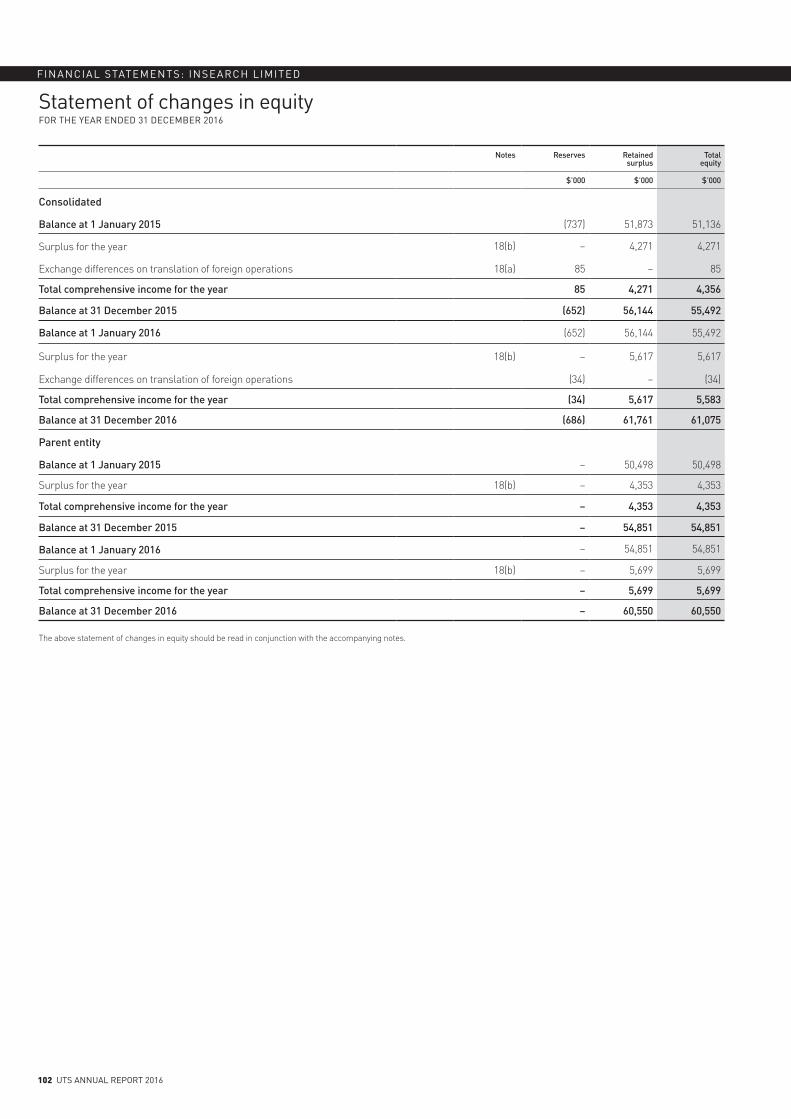
102 UTS ANNUAL REPORT 2016
FINANCIAL STATEMENTS: INSEARCH LIMITED
Statement of changes in equityFOR THE YEAR ENDED 31 DECEMBER 2016
Notes Reserves Retained surplus
Total equity
$’000 $’000 $’000
Consolidated
Balance at 1 January 2015 (737) 51,873 51,136
Surplus for the year 18(b) – 4,271 4,271
Exchange differences on translation of foreign operations 18(a) 85 – 85
Total comprehensive income for the year 85 4,271 4,356
Balance at 31 December 2015 (652) 56,144 55,492
Balance at 1 January 2016 (652) 56,144 55,492
Surplus for the year 18(b) – 5,617 5,617
Exchange differences on translation of foreign operations (34) – (34)
Total comprehensive income for the year (34) 5,617 5,583
Balance at 31 December 2016 (686) 61,761 61,075
Parent entity
Balance at 1 January 2015 – 50,498 50,498
Surplus for the year 18(b) – 4,353 4,353
Total comprehensive income for the year – 4,353 4,353
Balance at 31 December 2015 – 54,851 54,851
Balance at 1 January 2016 – 54,851 54,851
Surplus for the year 18(b) – 5,699 5,699
Total comprehensive income for the year – 5,699 5,699
Balance at 31 December 2016 – 60,550 60,550
The above statement of changes in equity should be read in conjunction with the accompanying notes.
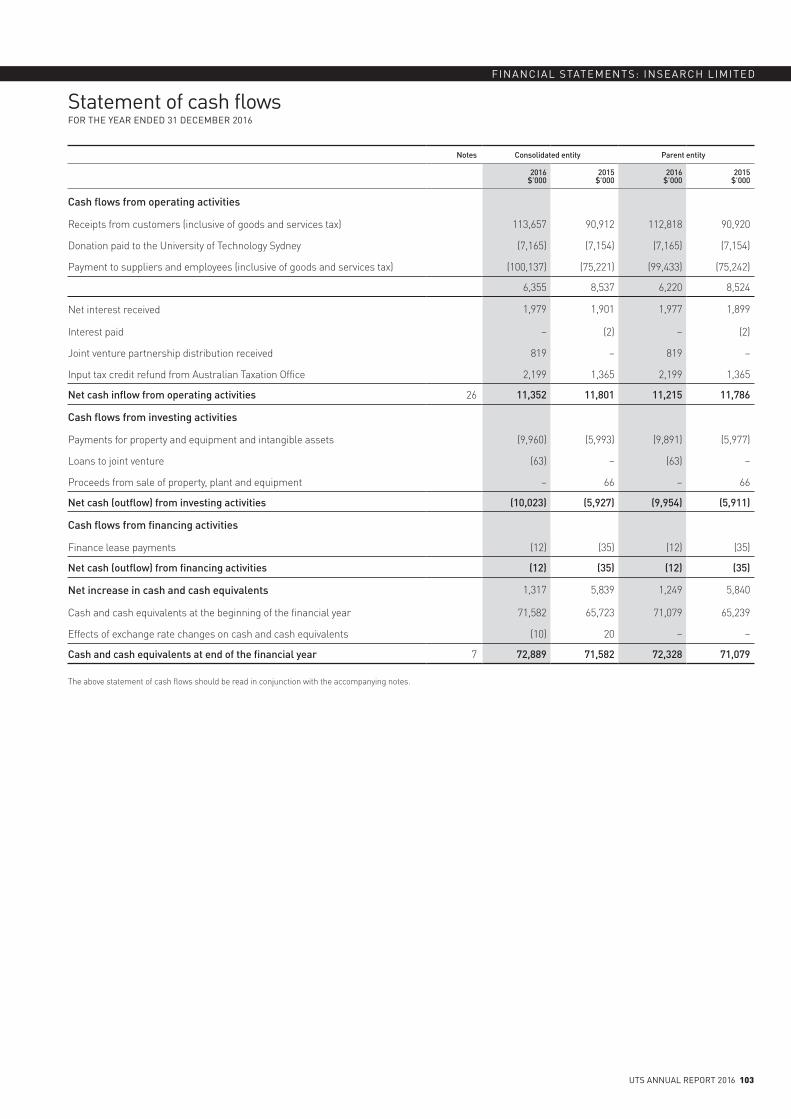
UTS ANNUAL REPORT 2016 103
FINANCIAL STATEMENTS: INSEARCH LIMITED
Statement of cash flowsFOR THE YEAR ENDED 31 DECEMBER 2016
Notes Consolidated entity Parent entity
2016 $’000
2015 $’000
2016 $’000
2015 $’000
Cash flows from operating activities
Receipts from customers (inclusive of goods and services tax) 113,657 90,912 112,818 90,920
Donation paid to the University of Technology Sydney (7,165) (7,154) (7,165) (7,154)
Payment to suppliers and employees (inclusive of goods and services tax) (100,137) (75,221) (99,433) (75,242)
6,355 8,537 6,220 8,524
Net interest received 1,979 1,901 1,977 1,899
Interest paid – (2) – (2)
Joint venture partnership distribution received 819 – 819 –
Input tax credit refund from Australian Taxation Office 2,199 1,365 2,199 1,365
Net cash inflow from operating activities 26 11,352 11,801 11,215 11,786
Cash flows from investing activities
Payments for property and equipment and intangible assets (9,960) (5,993) (9,891) (5,977)
Loans to joint venture (63) – (63) –
Proceeds from sale of property, plant and equipment – 66 – 66
Net cash (outflow) from investing activities (10,023) (5,927) (9,954) (5,911)
Cash flows from financing activities
Finance lease payments (12) (35) (12) (35)
Net cash (outflow) from financing activities (12) (35) (12) (35)
Net increase in cash and cash equivalents 1,317 5,839 1,249 5,840
Cash and cash equivalents at the beginning of the financial year 71,582 65,723 71,079 65,239
Effects of exchange rate changes on cash and cash equivalents (10) 20 – –
Cash and cash equivalents at end of the financial year 7 72,889 71,582 72,328 71,079
The above statement of cash flows should be read in conjunction with the accompanying notes.
104 UTS ANNUAL REPORT 2016
FINANCIAL STATEMENTS: INSEARCH LIMITED
Notes to the financial statementsFOR THE YEAR ENDED 31 DECEMBER 2016
Notes to the financial statementsFOR THE YEAR ENDED 31 DECEMBER 2016
1. THE COMPANY
INSEARCH Limited is a public company, limited by guarantee of its members, having no share capital. The company is incorporated and domiciled in Australia. Its registered place of business is level 9, 187 Thomas Street, Sydney NSW 2000. The company provides education services in English language, business and other disciplines to Australian and overseas students in Australia.
INSEARCH Limited is a controlled entity of the University of Technology Sydney. This status is a reflection of the terms of the INSEARCH Constitution and the structure of the INSEARCH Board.
The company has the wholly owned entities, INSEARCH Education International Pty Limited and INSEARCH (Shanghai) Limited. INSEARCH Education International Pty Limited is a private company, incorporated in Australia and formed in 1995. INSEARCH (Shanghai) Limited provides consulting, marketing support and other services to INSEARCH Limited. INSEARCH (Shanghai) Limited was formed in 2001 in the People’s Republic of China.
2. SUMMARY OF SIGNIFICANT ACCOUNTING POLICIES
The principal accounting policies adopted in the preparation of these consolidated financial statements are set out below. These policies have been consistently applied to all the years presented, unless otherwise stated. The financial statements include separate financial statements for the parent entity and the group comprising INSEARCH Limited and its subsidiaries.
(a) Basis of preparationThese general purpose financial statements have been prepared in accordance with Australian Accounting Standards and Interpretations issued by the Australian Accounting Standards Board and the Public Finance and Audit Act 1983, the Public Finance and Audit Regulation 2015 and the Corporations Act 2001. Where there are inconsistencies between the above requirements, the legislative provisions have prevailed. INSEARCH Limited is a not-for-profit entity for the purpose of preparing the financial statements.
The consolidated financial statements for the year ended 31 December 2016 were authorised for issue in accordance with a resolution of the directors on 22 March 2017.
(i) Statement of compliance
The parent entity’s financial statements and accompanying notes comply with Australian Accounting Standards, which include Australian Accounting Interpretations.
Generally accepted accounting principles, authoritative pronouncements of the AASB, including interpretations, the Public Finance and Audit Act 1983, the Public Finance and Audit Regulation 2015, and the Corporations Act 2001 have been used to prepare the subsidiaries’ financial statements.
(ii) Historical cost convention
These financial statements have been prepared under the historical cost convention.
(iii) New and amended standards adopted by the group
The group has applied the following standards and amendments for the first time in its annual reporting period commencing 1 January 2016:
> AASB 2014-3 Amendments to Australian Accounting Standards — Accounting for Acquisitions of Interests in Joint Operations
> AASB 2014-4 Amendments to Australian Accounting Standards — Clarification of Acceptable Methods of Depreciation and Amortisation
> AASB 2015-1 Amendments to Australian Accounting Standards — Annual Improvements to Australian Accounting Standards 2012–2014 Cycle, and
> AASB 2015-2 Amendments to Australian Accounting Standards — Disclosure Initiative: Amendments to AASB 101.
The adoption of these standards did not have any impact on the current period or any prior period and is not likely to affect future periods.
The group also elected to adopt the following amendments early:
> AASB 2016-2 Amendments to Australian Accounting Standard — Disclosure Initiative: Amendments to AASB 107.
This amendment requires disclosure of changes in liabilities arising from financing activities.
(iv) New standards and interpretations not yet adopted
Certain new accounting standards and interpretations have been published that are not mandatory for 31 December 2016 reporting periods and have not been early adopted by the group. The group’s assessment of the impact of these new standards and interpretations is set out below.
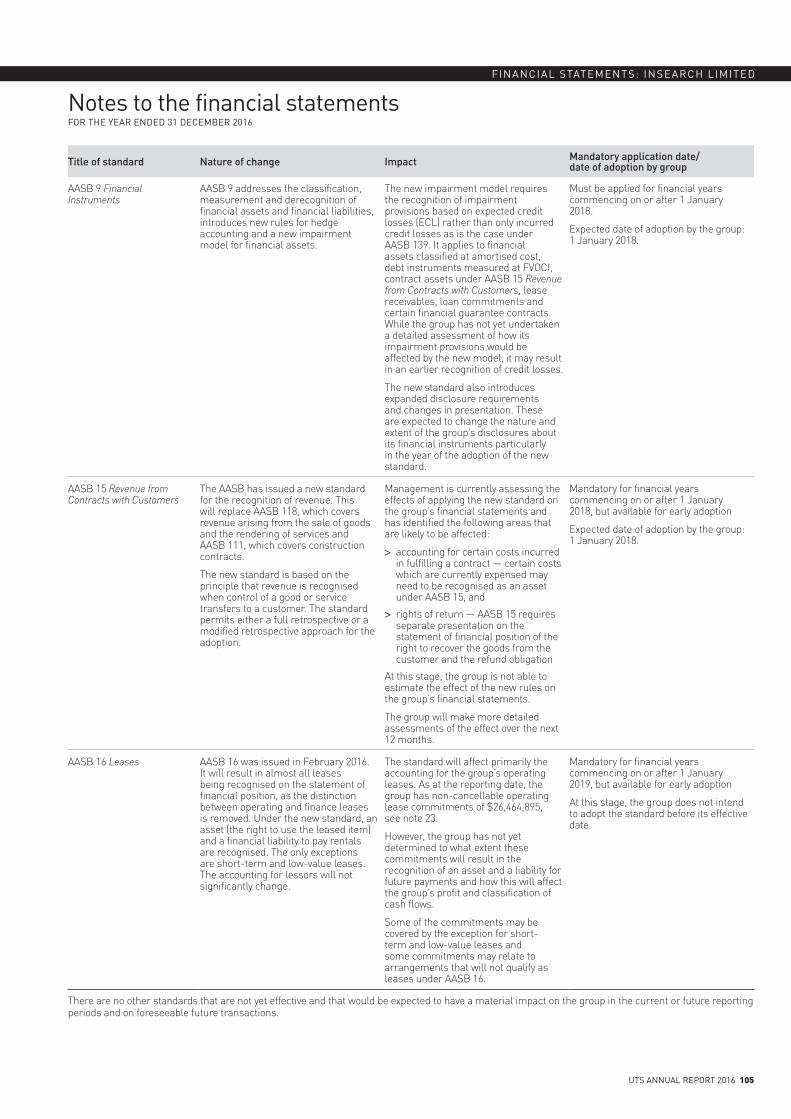
UTS ANNUAL REPORT 2016 105
FINANCIAL STATEMENTS: INSEARCH LIMITED
Notes to the financial statementsFOR THE YEAR ENDED 31 DECEMBER 2016
Title of standard Nature of change Impact Mandatory application date/ date of adoption by group
AASB 9 Financial Instruments
AASB 9 addresses the classification, measurement and derecognition of financial assets and financial liabilities, introduces new rules for hedge accounting and a new impairment model for financial assets.
The new impairment model requires the recognition of impairment provisions based on expected credit losses (ECL) rather than only incurred credit losses as is the case under AASB 139. It applies to financial assets classified at amortised cost, debt instruments measured at FVOCI, contract assets under AASB 15 Revenue from Contracts with Customers, lease receivables, loan commitments and certain financial guarantee contracts. While the group has not yet undertaken a detailed assessment of how its impairment provisions would be affected by the new model, it may result in an earlier recognition of credit losses.
The new standard also introduces expanded disclosure requirements and changes in presentation. These are expected to change the nature and extent of the group’s disclosures about its financial instruments particularly in the year of the adoption of the new standard.
Must be applied for financial years commencing on or after 1 January 2018.
Expected date of adoption by the group: 1 January 2018.
AASB 15 Revenue from Contracts with Customers
The AASB has issued a new standard for the recognition of revenue. This will replace AASB 118, which covers revenue arising from the sale of goods and the rendering of services and AASB 111, which covers construction contracts.
The new standard is based on the principle that revenue is recognised when control of a good or service transfers to a customer. The standard permits either a full retrospective or a modified retrospective approach for the adoption.
Management is currently assessing the effects of applying the new standard on the group’s financial statements and has identified the following areas that are likely to be affected:
> accounting for certain costs incurred in fulfilling a contract — certain costs which are currently expensed may need to be recognised as an asset under AASB 15, and
> rights of return — AASB 15 requires separate presentation on the statement of financial position of the right to recover the goods from the customer and the refund obligation
At this stage, the group is not able to estimate the effect of the new rules on the group’s financial statements.
The group will make more detailed assessments of the effect over the next 12 months.
Mandatory for financial years commencing on or after 1 January 2018, but available for early adoption
Expected date of adoption by the group: 1 January 2018.
AASB 16 Leases AASB 16 was issued in February 2016. It will result in almost all leases being recognised on the statement of financial position, as the distinction between operating and finance leases is removed. Under the new standard, an asset (the right to use the leased item) and a financial liability to pay rentals are recognised. The only exceptions are short-term and low-value leases. The accounting for lessors will not significantly change.
The standard will affect primarily the accounting for the group’s operating leases. As at the reporting date, the group has non-cancellable operating lease commitments of $26,464,895, see note 23.
However, the group has not yet determined to what extent these commitments will result in the recognition of an asset and a liability for future payments and how this will affect the group’s profit and classification of cash flows.
Some of the commitments may be covered by the exception for short-term and low-value leases and some commitments may relate to arrangements that will not qualify as leases under AASB 16.
Mandatory for financial years commencing on or after 1 January 2019, but available for early adoption
At this stage, the group does not intend to adopt the standard before its effective date.
There are no other standards that are not yet effective and that would be expected to have a material impact on the group in the current or future reporting periods and on foreseeable future transactions.
106 UTS ANNUAL REPORT 2016
FINANCIAL STATEMENTS: INSEARCH LIMITED
Notes to the financial statementsFOR THE YEAR ENDED 31 DECEMBER 2016
2. SUMMARY OF SIGNIFICANT ACCOUNTING POLICIES (CONTINUED)(v) Critical accounting estimates
The preparation of financial statements requires the use of certain critical accounting estimates. It also requires management to exercise its judgement in the process of applying the group’s accounting policies.
INSEARCH Limited has made estimates on the valuation of its associate and joint venture investments. Estimates are based on the historical experience and other factors that are considered to be relevant, including latest available management information of financial performance and position. Actual results may differ from these estimates. The estimates and underlying assumptions are reviewed on an ongoing basis.
(b) Principles of consolidation and equity accounting
(i) Subsidiaries
The consolidated financial statements incorporate the assets and liabilities of all subsidiaries of INSEARCH Limited (‘company’ or ‘parent entity’) as at 31 December 2016 and the results of all subsidiaries for the year then ended. INSEARCH Limited and its subsidiaries together are referred to in these financial statements as the group or the consolidated entity.
Subsidiaries are all entities (including structured entities) over which the group has control. The group controls an entity when the group is exposed to, or has rights to, variable returns from its involvement with the entity and has the ability to affect those returns through its power to direct the activities of the entity. Subsidiaries are fully consolidated from the date on which control is transferred to the group. They are deconsolidated from the date that control ceases.
The acquisition method of accounting is used to account for business combinations by the group.
Intercompany transactions, balances and unrealised gains on transactions between group companies are eliminated. Unrealised losses are also eliminated unless the transaction provides evidence of the impairment of the asset transferred. Accounting policies of subsidiaries have been changed where necessary to ensure consistency with the policies adopted by the group.
(ii) Associates
Investments in associates are accounted for in the parent entity financial statements using the cost method and in the consolidated financial statements using the equity method of accounting, after initially being recognised at cost.
The group’s share of its associates’ post-acquisition profits or losses is recognised in profit or loss, and its share of post-acquisition other comprehensive income is recognised in other comprehensive income. The cumulative post-acquisition movements are adjusted against the carrying amount of the investment. Distributions receivable from associates are recognised in the parent entity statement of comprehensive income, while in the consolidated financial statements they are recognised as a reduction in the carrying amount of the investment.
When the group’s share of losses in an associate equals or exceeds its interest in the associate, including any other unsecured long-term receivables, the group does not recognise further losses, unless it has incurred obligations or made payments on behalf of the associate.
Unrealised gains on transactions between the group and its associates are eliminated to the extent of the group’s interest in the associates. Unrealised losses are also eliminated unless the transaction provides evidence of an impairment of the asset transferred.
(iii) Joint ventures
The interest in a joint venture partnership is accounted for using the equity method after initially being recognised at cost. Under the equity method, the share of the profits or losses of the partnership is recognised in profit or loss, and the share of post-acquisition movements in other comprehensive income is recognised in other comprehensive income. Details relating to the partnership are set out in note 9. Initial investment in the joint venture in the form of a loan is recognised as a financial asset.
Profits or losses on transactions establishing the joint venture partnership and transactions with the joint venture are eliminated to the extent of the group’s ownership interest until such time as they are realised by the joint venture partnership on consumption or sale. However, a loss on the transaction is recognised immediately if the loss provides evidence of a reduction in the net realisable value of current assets, or an impairment loss.
(c) Foreign currency translation
(i) Functional and presentation currency
Items included in the financial statements of each of the group’s entities are measured using the currency of the primary economic environment in which the entity operates (‘the functional currency’). The consolidated financial statements are presented in Australian dollars ($), which is INSEARCH Limited’s functional and presentation currency.
(ii) Transactions and balances
Foreign currency transactions are translated into the functional currency using the exchange rates prevailing at the dates of the transactions. Foreign exchange gains and losses resulting from the settlement of such transactions and from the translation at year end exchange rates of monetary assets and liabilities denominated in foreign currencies are recognised in profit or loss, except when they are deferred in equity as qualifying cash flow hedges and qualifying net investment hedges or are attributable to part of the net investment in a foreign operation.
Foreign exchange gains and losses that relate to borrowings are presented in the statement of comprehensive income, within finance costs. All other foreign exchange gains and losses are presented in the statement of comprehensive income on a net basis within other income or other expenses.
(iii) Group companies
The results and financial position of foreign operations (none of which has the currency of a hyperinflationary economy) that have a functional currency different from the presentation currency are translated into the presentation currency as follows:
> assets and liabilities for each statement of financial position presented are translated at the closing rate at the date of that statement of financial position
UTS ANNUAL REPORT 2016 107
FINANCIAL STATEMENTS: INSEARCH LIMITED
Notes to the financial statementsFOR THE YEAR ENDED 31 DECEMBER 2016
> income and expenses for each income statement and statement of comprehensive income are translated at average exchange rates (unless this is not a reasonable approximation of the cumulative effect of the rates prevailing on the transaction dates, in which case income and expenses are translated at the dates of the transactions), and
> all resulting exchange differences are recognised in other comprehensive income.
(iv) Foreign currency translation reserve
The foreign currency translation reserve is used to record exchange differences arising from the translation of the financial statements of foreign operations.
(d) Revenue recognitionRevenue is measured at the fair value of the consideration received or receivable. Amounts disclosed as revenue are net of returns, trade allowances, rebates and amounts collected on behalf of third parties.
The group recognises revenue when the amount of revenue can be reliably measured, it is probable that future economic benefits will flow to the entity and specific criteria have been met for each of the group’s activities as described below. The group bases its estimates on historical results, taking into consideration the type of customer, the type of transaction and the specifics of each arrangement.
Revenue is recognised for the major business activities using the methods outlined below.
(i) Fees
Education fees are recognised as revenue in advance upon student enrolment and are then disbursed to revenue at the time of course delivery. Education revenue is disclosed net of refunds.
(ii) Other fees and charges
Fees are recognised as revenue when services are provided.
(iii) Other income
Other income includes net gain or loss on disposal of non-current assets.
(e) Expense recognition
(i) Direct expenses
Costs associated with delivering educational programs are recognised at the time of course delivery. Direct expenses incurred for courses not delivered are treated as prepayments.
(ii) Other expenses
All other expenses are charged against revenue when the liability has been recognised.
(f) Income taxNo income tax has been provided in the attached accounts for the Australian operation as the company is exempt from income tax under section 50-55 of the Income Tax Assessment Act 1997.
Income tax has been provided, where appropriate, for the other overseas entities.
(g) Goods and Services Tax (GST)Revenues, expenses and assets are recognised net of the amount of associated GST, unless the GST incurred is not recoverable from the taxation authority. In this case it is recognised as part of the cost of acquisition of the asset or as part of the expense.
Receivables and payables are stated inclusive of the amount of GST receivable or payable. The net amount of GST recoverable from, or payable to, the taxation authority is included with other receivables or payables in the consolidated statement of financial position.
Cash flows are presented on a gross basis. The GST components of cash flows arising from investing or financing activities which are recoverable from, or payable to the taxation authority, are presented as operating cash flows.
(h) Acquisition of assetsThe purchase method of accounting is used to account for all acquisitions of assets. Assets are initially recorded at their cost at the date of acquisition. Cost is measured as the fair value of the consideration provided at the date of exchange and incidental costs directly attributable to the acquisition.
(i) Impairment of assetsIntangible assets that have an indefinite useful life are not subject to amortisation and are tested annually for impairment, or more frequently if events or changes in circumstances indicate that they might be impaired. Other assets are tested for impairment whenever events or changes in circumstances indicate that the carrying amount may not be recoverable. An impairment loss is recognised for the amount by which the asset’s carrying amount exceeds its recoverable amount. The recoverable amount is the higher of an asset’s fair value less costs to sell and value-in-use. For the purposes of assessing impairment, assets are grouped at the lowest levels for which there are separately identifiable cash inflows which are largely independent of the cash inflows from other assets or groups of assets (cash-generating units).
(j) Cash and cash equivalentsFor the purpose of presentation in the statement of cash flows, cash and cash equivalents includes cash on hand, deposits held at call with financial institutions, other short-term, highly liquid investments with original maturities of three months or less that are readily convertible to known amounts of cash and which are subject to an insignificant risk of changes in value.
Cash at bank is interest rate bearing with interest rates between 0.10% and 0.90% (2015: 0.10% and 1.40%). Deposits at call are bearing a floating interest rate at 1.40% (2015: 1.90%). Fixed term deposits are bearing interest rates between 1.95% and 2.70% (2015: 2.70% and 2.85%).
108 UTS ANNUAL REPORT 2016
FINANCIAL STATEMENTS: INSEARCH LIMITED
Notes to the financial statementsFOR THE YEAR ENDED 31 DECEMBER 2016
2. SUMMARY OF SIGNIFICANT ACCOUNTING POLICIES (CONTINUED)(k) Trade and other receivables
Trade receivables are recognised initially at fair value and subsequently measured at amortised cost using the effective interest method, less provision for impairment. Trade receivables are generally due for settlement within 30 days. They are presented as current assets unless collection is not expected for more than 12 months after the reporting date
The collectibility of trade receivables is reviewed on an ongoing basis. Debts which are known to be uncollectible are written off by reducing the carrying amount directly. A provision for impairment is established when there is objective evidence that the group will not be able to collect all amounts due according to the original terms of the receivables.
The amount of the impairment loss is recognised in the statement of comprehensive income within other expenses. When a trade receivable for which an impairment allowance had been recognised becomes uncollectible in a subsequent period, it is written off against the allowance account. Subsequent recoveries of amounts previously written off are credited against other expenses in the statement of comprehensive income.
(l) Investments and other financial assets
Classification
The group classifies its financial assets in the following categories:
> financial assets at fair value through profit or loss
> financial assets at amortised cost
> loans and receivables
> held-to-maturity investments, and
> available-for-sale financial assets.
The classification depends on the purpose for which the investments were acquired. Management determines the classification of its investments at initial recognition and, in the case of assets classified as held-to-maturity, re-evaluates this designation at the end of each reporting period.
(m) Property, plant and equipmentProperty, plant and equipment is stated at historical cost less depreciation. Capitalisation threshold for all assets is $1000. Historical cost includes expenditure that is directly attributable to the acquisition of the items.
Subsequent costs are included in the asset’s carrying amount or recognised as a separate asset, as appropriate, only when it is probable that future economic benefits associated with the item will flow to the group and the cost of the item can be measured reliably. The carrying amount of any component accounted for as a separate asset is derecognised when replaced. All other repairs and maintenance are charged to the statement of comprehensive income during the reporting period in which they are incurred.
Depreciation is calculated on a straight-line basis to write off the net cost of each item of plant and equipment over its expected useful life in the group. The Capital Review Committee reviews the estimated useful lives, residual values and depreciation method of assets at the end of each annual reporting period, with the effect of any changes recognised on a prospective basis. The expected useful lives for the parent entity are as follows:
Furniture and fittings Period of the lease
Office equipment 3–5 years
Motor vehicles 3–4 years
Computer equipment 3–5 years
The cost of improvements to leasehold properties has been integrated into the asset class of furniture and fittings, and has been depreciated in line with the expected unexpired period of the lease.
The assets’ residual values and useful lives are reviewed, and adjusted if appropriate, at the end of each reporting period.
An asset’s carrying amount is written down immediately to its recoverable amount if the asset’s carrying amount is greater than its estimated recoverable amount (note 2(i)).
Gains and losses on disposals are determined by comparing proceeds with carrying amount. These are included in the statement of comprehensive income.
(n) Intangible assets
(i) IT development and software
Software is initially recorded at historical cost and amortised. Subsequently software is reported at its recoverable amount, as the carrying amount of each asset is reviewed annually by the Capital Review Committee to determine whether it is in excess of its recoverable amount at the end of the reporting period.
Amortisation is calculated on a straight-line basis over periods generally ranging from two to seven years.
UTS ANNUAL REPORT 2016 109
FINANCIAL STATEMENTS: INSEARCH LIMITED
Notes to the financial statementsFOR THE YEAR ENDED 31 DECEMBER 2016
(ii) Curriculum and course development and validation expenses
Curriculum and course development represents the costs associated with developing the curriculum and teaching materials for a course to be delivered. These have a finite useful life and are carried at cost less accumulated amortisation and impairment losses, if any.
Amortisation is calculated on a straight-line basis over periods generally ranging from three to five years.
(iii) Website development
The costs associated in developing, building and enhancing websites designed for external access, to the extent they represent future economic benefits, are controlled and can be reliably measured, have been capitalised and amortised over the period of the expected benefits.
Amortisation is calculated on a straight-line basis to write off the net cost of each asset over its expected useful life of three years.
(o) LeasesLeases of property, plant and equipment where the group, as lessee, has substantially all the risks and rewards of ownership are classified as finance leases (notes 10, 14, and 23). Finance leases are capitalised at the lease’s inception at the fair value of the leased property or, if lower, the present value of the minimum lease payments.
The corresponding rental obligations, net of finance charges, are included in other short-term and long-term payables. Each lease payment is allocated between the liability and finance cost. The finance cost is charged to profit or loss over the lease period so as to produce a constant periodic rate of interest on the remaining balance of the liability for each period. The property, plant and equipment acquired under finance leases is depreciated over the asset’s useful life or over the shorter of the asset’s useful life and the lease term if there is no reasonable certainty that the group will obtain ownership at the end of the lease term.
Leases in which a significant portion of the risks and rewards of ownership are not transferred to the group as lessee are classified as operating leases (note 23). Payments made under operating leases (net of any incentives received from the lessor) are charged to profit or loss on a straight-line basis over the period of the lease.
Lease commitments are reported inclusive of GST with the input tax recoverable from the Australian Taxation Office.
(p) Trade and other payablesThese amounts represent liabilities for goods and services provided to the group prior to the end of financial year which are unpaid. The amounts are unsecured and are usually paid within 30 days of recognition. Trade and other payables are presented as current liabilities unless payment is not due within 12 months from the reporting date. They are recognised initially at their fair value and subsequently measured at amortised cost using the effective interest method.
(q) ProvisionsThe provisions of the group are recognised when the group has a present legal or constructive obligation as a result of past events and it is probable that an outflow of resources will be required to settle the obligation and that the amount can be reliably estimated. Provisions are measured at the present value of management’s best estimate of the expenditure required to settle the present obligation at the end of the reporting period.
(r) Employee benefits
(i) Short-term obligations
Liabilities for wages and salaries, including non-monetary benefits that are expected to be settled wholly within 12 months after the end of the period in which the employees render the related service, are recognised in respect of employees’ services up to the end of the reporting period and are measured at the amounts expected to be paid when the liabilities are settled. The liabilities are presented as current employee benefit obligations in the statement of financial position.
(ii) Other long-term employee benefit obligations
The recorded liability for provision of annual leave includes annual leave entitlements accrued but not expected to be taken within one year. These entitlements are measured at the present value of expected future payments to be made, including on costs of leave accrued by employees up to the end of the reporting period. The expected future payments of this leave provision is discounted using published market yield of the two-year Treasury Bond at the end of the reporting period of 1.86% (2015: 2.02%).
The provision for long service leave is recognised as a liability and measured as the present value of expected future payments to be made in respect of services provided by employees up to the end of the reporting period. Consideration is given to on costs, expected future wage and salary levels, experience of employee departures and periods of service. Expected future payments are discounted using published market yield of the 10-year Treasury Bond at the end of each reporting period of 2.76% (2015: 2.88%).
The obligations are presented as current liabilities in the statement of financial position if the entity does not have an unconditional right to defer settlement for at least 12 months after the reporting date, regardless of when the actual settlement is expected to occur.
(iii) Superannuation
INSEARCH Limited complies with the Superannuation Guarantee (Administration) Act 1992.
(s) Rounding of amountsThe company is of a kind referred to in ASIC Legislative Instrument 2016/191, relating to the ‘rounding off’ of amounts in the financial statements. Amounts in the financial statements have been rounded off in accordance with the instrument to the nearest thousand dollars or, in certain cases, the nearest dollar.
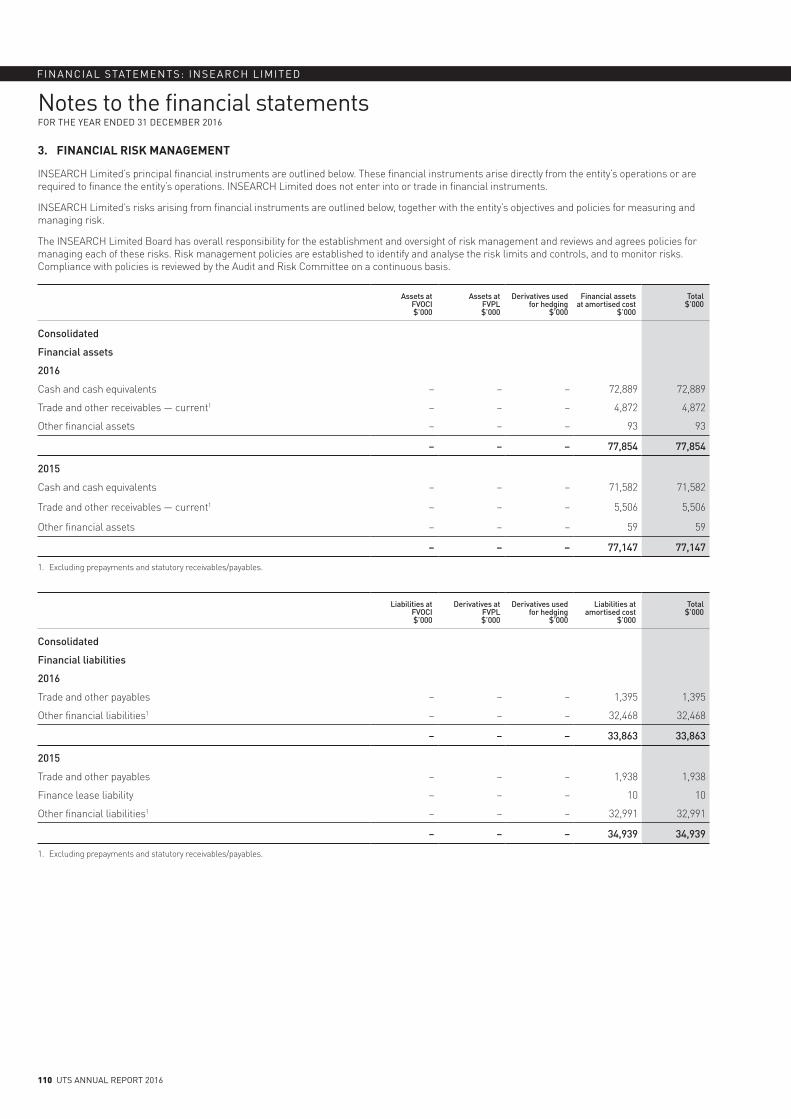
110 UTS ANNUAL REPORT 2016
FINANCIAL STATEMENTS: INSEARCH LIMITED
Notes to the financial statementsFOR THE YEAR ENDED 31 DECEMBER 2016
3. FINANCIAL RISK MANAGEMENT
INSEARCH Limited’s principal financial instruments are outlined below. These financial instruments arise directly from the entity’s operations or are required to finance the entity’s operations. INSEARCH Limited does not enter into or trade in financial instruments.
INSEARCH Limited’s risks arising from financial instruments are outlined below, together with the entity’s objectives and policies for measuring and managing risk.
The INSEARCH Limited Board has overall responsibility for the establishment and oversight of risk management and reviews and agrees policies for managing each of these risks. Risk management policies are established to identify and analyse the risk limits and controls, and to monitor risks. Compliance with policies is reviewed by the Audit and Risk Committee on a continuous basis.
Assets atFVOCI$’000
Assets atFVPL$’000
Derivatives used for hedging
$’000
Financial assets at amortised cost
$’000
Total$’000
Consolidated
Financial assets
2016
Cash and cash equivalents – – – 72,889 72,889
Trade and other receivables — current1 – – – 4,872 4,872
Other financial assets – – – 93 93
– – – 77,854 77,854
2015
Cash and cash equivalents – – – 71,582 71,582
Trade and other receivables — current1 – – – 5,506 5,506
Other financial assets – – – 59 59
– – – 77,147 77,147
1. Excluding prepayments and statutory receivables/payables.
Liabilities atFVOCI$’000
Derivatives atFVPL$’000
Derivatives used for hedging
$’000
Liabilities at amortised cost
$’000
Total$’000
Consolidated
Financial liabilities
2016
Trade and other payables – – – 1,395 1,395
Other financial liabilities1 – – – 32,468 32,468
– – – 33,863 33,863
2015
Trade and other payables – – – 1,938 1,938
Finance lease liability – – – 10 10
Other financial liabilities1 – – – 32,991 32,991
– – – 34,939 34,939
1. Excluding prepayments and statutory receivables/payables.
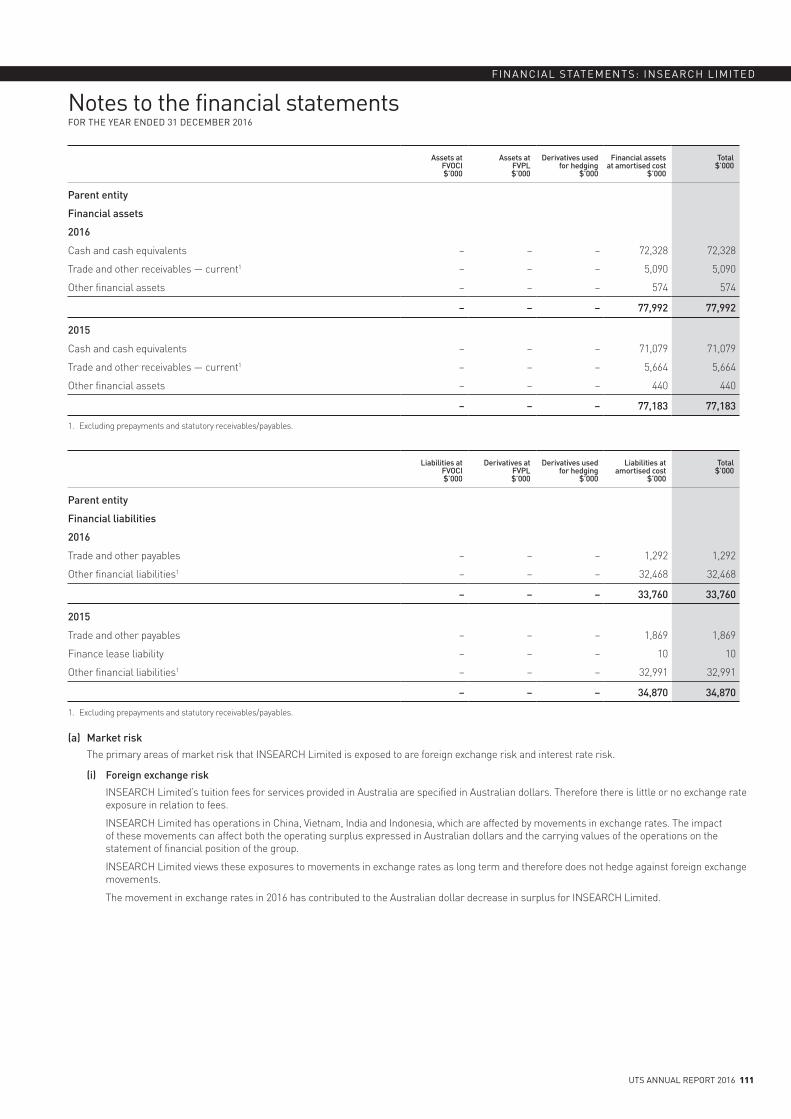
UTS ANNUAL REPORT 2016 111
FINANCIAL STATEMENTS: INSEARCH LIMITED
Notes to the financial statementsFOR THE YEAR ENDED 31 DECEMBER 2016
Assets atFVOCI$’000
Assets atFVPL$’000
Derivatives used for hedging
$’000
Financial assets at amortised cost
$’000
Total$’000
Parent entity
Financial assets
2016
Cash and cash equivalents – – – 72,328 72,328
Trade and other receivables — current1 – – – 5,090 5,090
Other financial assets – – – 574 574
– – – 77,992 77,992
2015
Cash and cash equivalents – – – 71,079 71,079
Trade and other receivables — current1 – – – 5,664 5,664
Other financial assets – – – 440 440
– – – 77,183 77,183
1. Excluding prepayments and statutory receivables/payables.
Liabilities atFVOCI$’000
Derivatives atFVPL$’000
Derivatives used for hedging
$’000
Liabilities at amortised cost
$’000
Total$’000
Parent entity
Financial liabilities
2016
Trade and other payables – – – 1,292 1,292
Other financial liabilities1 – – – 32,468 32,468
– – – 33,760 33,760
2015
Trade and other payables – – – 1,869 1,869
Finance lease liability – – – 10 10
Other financial liabilities1 – – – 32,991 32,991
– – – 34,870 34,870
1. Excluding prepayments and statutory receivables/payables.
(a) Market riskThe primary areas of market risk that INSEARCH Limited is exposed to are foreign exchange risk and interest rate risk.
(i) Foreign exchange risk
INSEARCH Limited’s tuition fees for services provided in Australia are specified in Australian dollars. Therefore there is little or no exchange rate exposure in relation to fees.
INSEARCH Limited has operations in China, Vietnam, India and Indonesia, which are affected by movements in exchange rates. The impact of these movements can affect both the operating surplus expressed in Australian dollars and the carrying values of the operations on the statement of financial position of the group.
INSEARCH Limited views these exposures to movements in exchange rates as long term and therefore does not hedge against foreign exchange movements.
The movement in exchange rates in 2016 has contributed to the Australian dollar decrease in surplus for INSEARCH Limited.
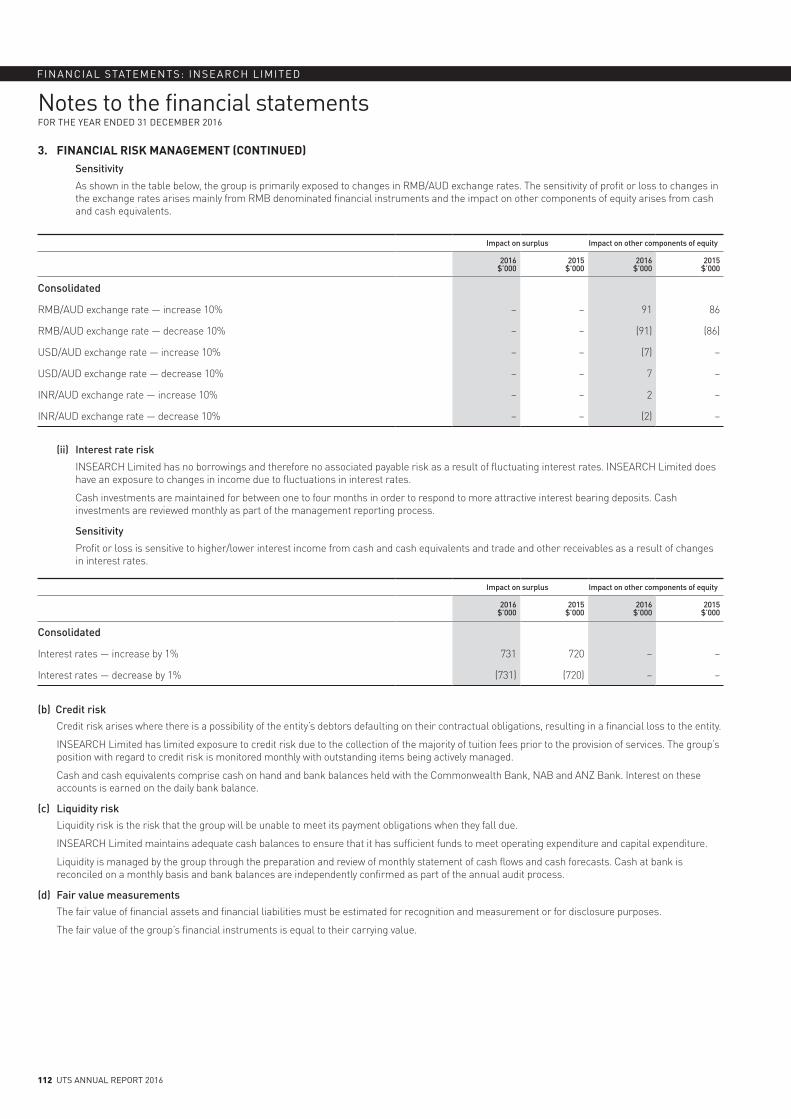
112 UTS ANNUAL REPORT 2016
FINANCIAL STATEMENTS: INSEARCH LIMITED
Notes to the financial statementsFOR THE YEAR ENDED 31 DECEMBER 2016
3. FINANCIAL RISK MANAGEMENT (CONTINUED)Sensitivity
As shown in the table below, the group is primarily exposed to changes in RMB/AUD exchange rates. The sensitivity of profit or loss to changes in the exchange rates arises mainly from RMB denominated financial instruments and the impact on other components of equity arises from cash and cash equivalents.
Impact on surplus Impact on other components of equity
2016$’000
2015$’000
2016$’000
2015$’000
Consolidated
RMB/AUD exchange rate — increase 10% – – 91 86
RMB/AUD exchange rate — decrease 10% – – (91) (86)
USD/AUD exchange rate — increase 10% – – (7) –
USD/AUD exchange rate — decrease 10% – – 7 –
INR/AUD exchange rate — increase 10% – – 2 –
INR/AUD exchange rate — decrease 10% – – (2) –
(ii) Interest rate risk
INSEARCH Limited has no borrowings and therefore no associated payable risk as a result of fluctuating interest rates. INSEARCH Limited does have an exposure to changes in income due to fluctuations in interest rates.
Cash investments are maintained for between one to four months in order to respond to more attractive interest bearing deposits. Cash investments are reviewed monthly as part of the management reporting process.
Sensitivity
Profit or loss is sensitive to higher/lower interest income from cash and cash equivalents and trade and other receivables as a result of changes in interest rates.
Impact on surplus Impact on other components of equity
2016$’000
2015$’000
2016$’000
2015$’000
Consolidated
Interest rates — increase by 1% 731 720 – –
Interest rates — decrease by 1% (731) (720) – –
(b) Credit riskCredit risk arises where there is a possibility of the entity’s debtors defaulting on their contractual obligations, resulting in a financial loss to the entity.
INSEARCH Limited has limited exposure to credit risk due to the collection of the majority of tuition fees prior to the provision of services. The group’s position with regard to credit risk is monitored monthly with outstanding items being actively managed.
Cash and cash equivalents comprise cash on hand and bank balances held with the Commonwealth Bank, NAB and ANZ Bank. Interest on these accounts is earned on the daily bank balance.
(c) Liquidity riskLiquidity risk is the risk that the group will be unable to meet its payment obligations when they fall due.
INSEARCH Limited maintains adequate cash balances to ensure that it has sufficient funds to meet operating expenditure and capital expenditure.
Liquidity is managed by the group through the preparation and review of monthly statement of cash flows and cash forecasts. Cash at bank is reconciled on a monthly basis and bank balances are independently confirmed as part of the annual audit process.
(d) Fair value measurementsThe fair value of financial assets and financial liabilities must be estimated for recognition and measurement or for disclosure purposes.
The fair value of the group’s financial instruments is equal to their carrying value.
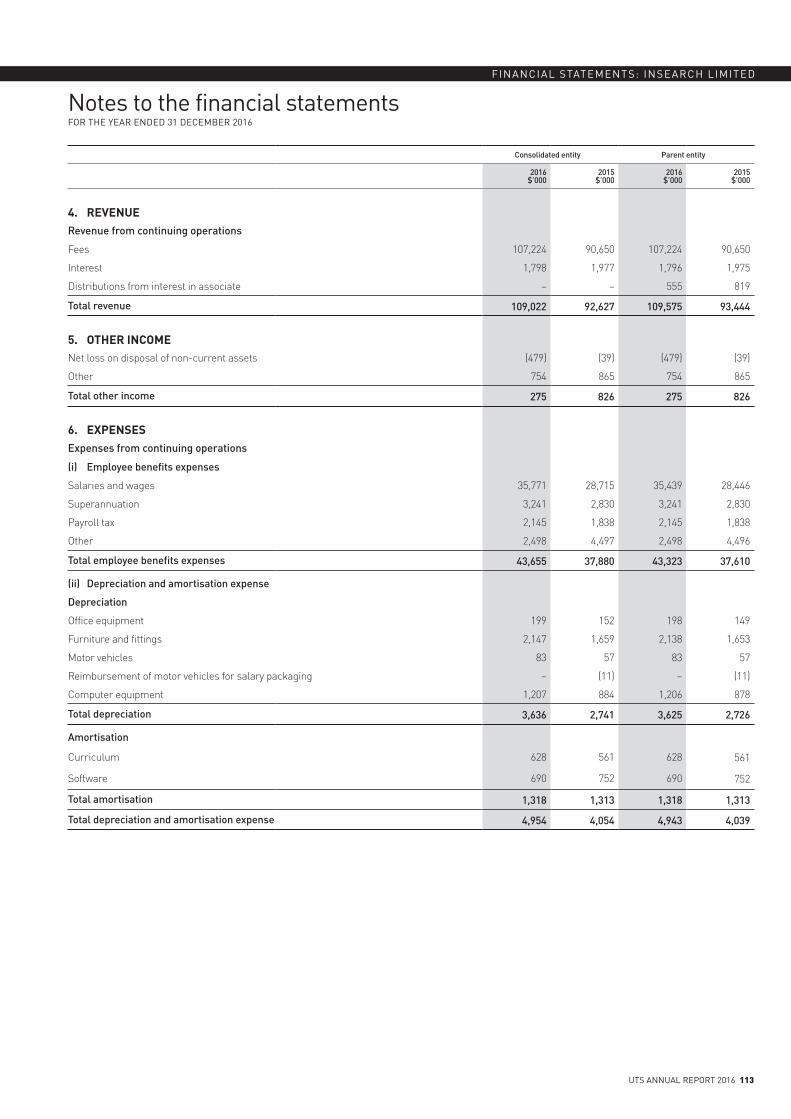
UTS ANNUAL REPORT 2016 113
FINANCIAL STATEMENTS: INSEARCH LIMITED
Notes to the financial statementsFOR THE YEAR ENDED 31 DECEMBER 2016
Consolidated entity Parent entity
2016$’000
2015$’000
2016$’000
2015$’000
4. REVENUERevenue from continuing operations
Fees 107,224 90,650 107,224 90,650
Interest 1,798 1,977 1,796 1,975
Distributions from interest in associate – – 555 819
Total revenue 109,022 92,627 109,575 93,444
5. OTHER INCOMENet loss on disposal of non-current assets (479) (39) (479) (39)
Other 754 865 754 865
Total other income 275 826 275 826
6. EXPENSES Expenses from continuing operations
(i) Employee benefits expenses
Salaries and wages 35,771 28,715 35,439 28,446
Superannuation 3,241 2,830 3,241 2,830
Payroll tax 2,145 1,838 2,145 1,838
Other 2,498 4,497 2,498 4,496
Total employee benefits expenses 43,655 37,880 43,323 37,610
(ii) Depreciation and amortisation expense
Depreciation
Office equipment 199 152 198 149
Furniture and fittings 2,147 1,659 2,138 1,653
Motor vehicles 83 57 83 57
Reimbursement of motor vehicles for salary packaging – (11) – (11)
Computer equipment 1,207 884 1,206 878
Total depreciation 3,636 2,741 3,625 2,726
Amortisation
Curriculum 628 561 628 561
Software 690 752 690 752
Total amortisation 1,318 1,313 1,318 1,313
Total depreciation and amortisation expense 4,954 4,054 4,943 4,039
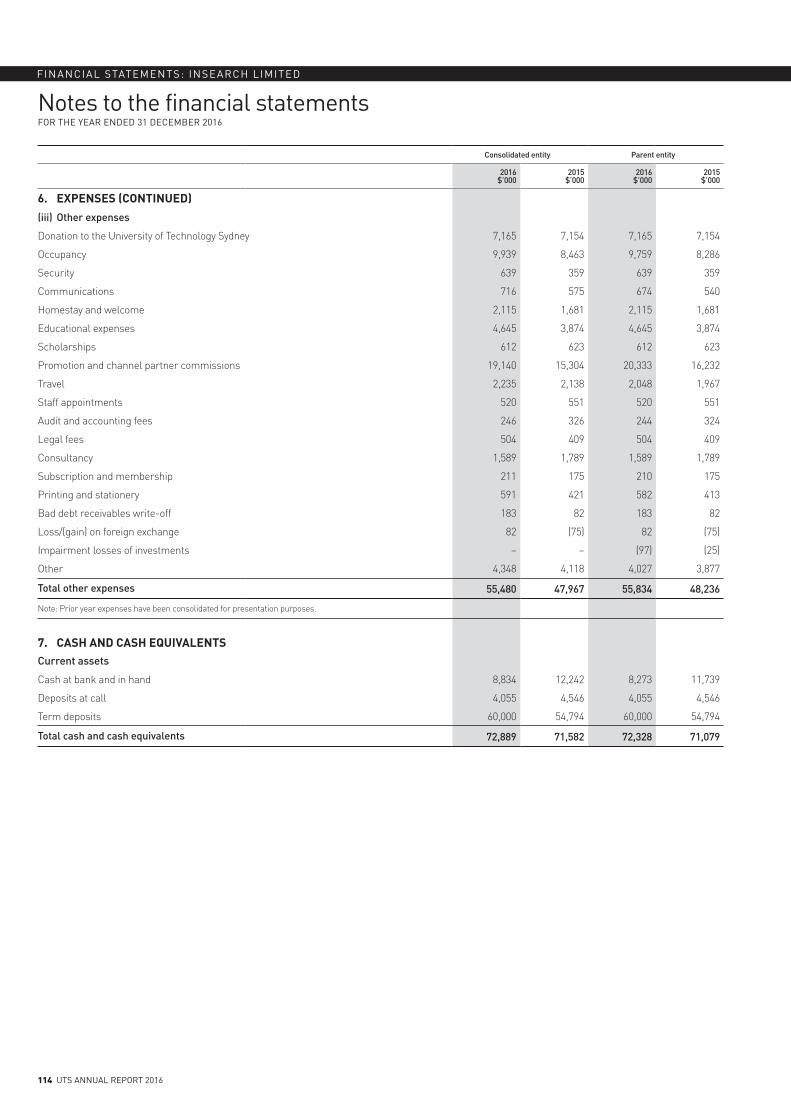
114 UTS ANNUAL REPORT 2016
FINANCIAL STATEMENTS: INSEARCH LIMITED
Notes to the financial statementsFOR THE YEAR ENDED 31 DECEMBER 2016
Consolidated entity Parent entity
2016$’000
2015$’000
2016$’000
2015$’000
6. EXPENSES (CONTINUED)(iii) Other expenses
Donation to the University of Technology Sydney 7,165 7,154 7,165 7,154
Occupancy 9,939 8,463 9,759 8,286
Security 639 359 639 359
Communications 716 575 674 540
Homestay and welcome 2,115 1,681 2,115 1,681
Educational expenses 4,645 3,874 4,645 3,874
Scholarships 612 623 612 623
Promotion and channel partner commissions 19,140 15,304 20,333 16,232
Travel 2,235 2,138 2,048 1,967
Staff appointments 520 551 520 551
Audit and accounting fees 246 326 244 324
Legal fees 504 409 504 409
Consultancy 1,589 1,789 1,589 1,789
Subscription and membership 211 175 210 175
Printing and stationery 591 421 582 413
Bad debt receivables write-off 183 82 183 82
Loss/(gain) on foreign exchange 82 (75) 82 (75)
Impairment losses of investments – – (97) (25)
Other 4,348 4,118 4,027 3,877
Total other expenses 55,480 47,967 55,834 48,236
Note: Prior year expenses have been consolidated for presentation purposes.
7. CASH AND CASH EQUIVALENTSCurrent assets
Cash at bank and in hand 8,834 12,242 8,273 11,739
Deposits at call 4,055 4,546 4,055 4,546
Term deposits 60,000 54,794 60,000 54,794
Total cash and cash equivalents 72,889 71,582 72,328 71,079
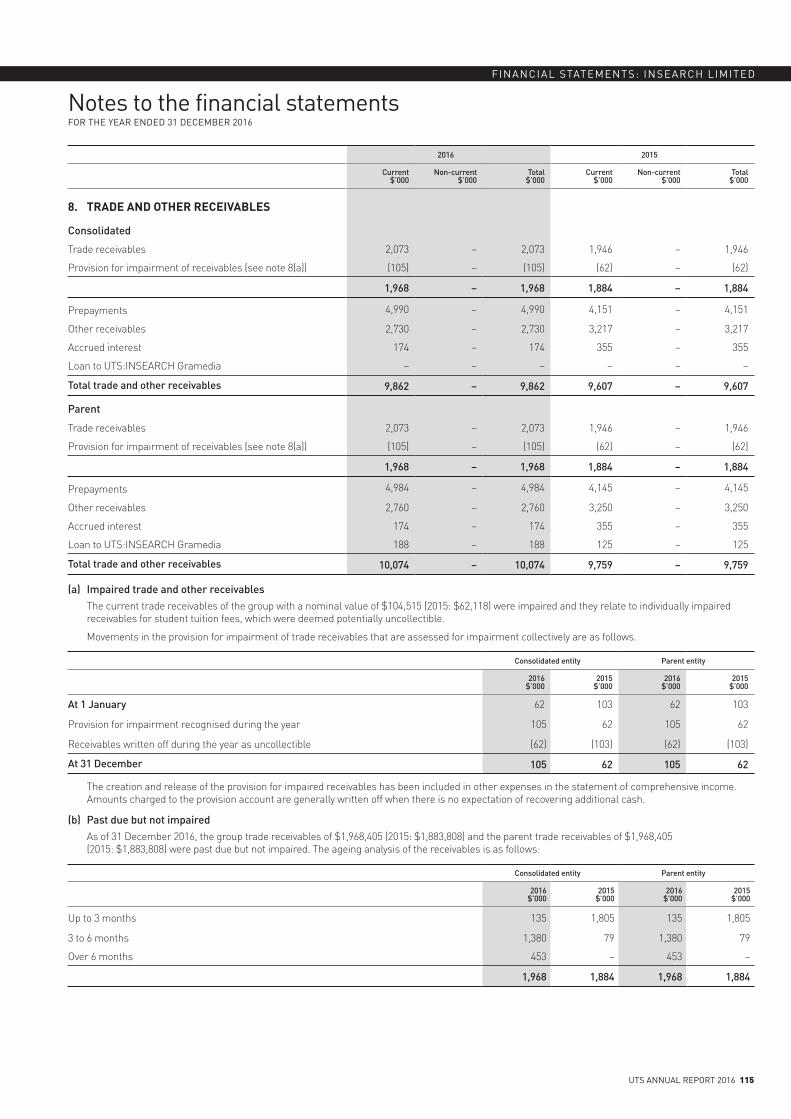
UTS ANNUAL REPORT 2016 115
FINANCIAL STATEMENTS: INSEARCH LIMITED
Notes to the financial statementsFOR THE YEAR ENDED 31 DECEMBER 2016
2016 2015
Current $’000
Non-current $’000
Total$’000
Current $’000
Non-current $’000
Total$’000
8. TRADE AND OTHER RECEIVABLES
Consolidated
Trade receivables 2,073 – 2,073 1,946 – 1,946
Provision for impairment of receivables (see note 8(a)) (105) – (105) (62) – (62)
1,968 – 1,968 1,884 – 1,884
Prepayments 4,990 – 4,990 4,151 – 4,151
Other receivables 2,730 – 2,730 3,217 – 3,217
Accrued interest 174 – 174 355 – 355
Loan to UTS:INSEARCH Gramedia – – – – – –
Total trade and other receivables 9,862 – 9,862 9,607 – 9,607
Parent
Trade receivables 2,073 – 2,073 1,946 – 1,946
Provision for impairment of receivables (see note 8(a)) (105) – (105) (62) – (62)
1,968 – 1,968 1,884 – 1,884
Prepayments 4,984 – 4,984 4,145 – 4,145
Other receivables 2,760 – 2,760 3,250 – 3,250
Accrued interest 174 – 174 355 – 355
Loan to UTS:INSEARCH Gramedia 188 – 188 125 – 125
Total trade and other receivables 10,074 – 10,074 9,759 – 9,759
(a) Impaired trade and other receivablesThe current trade receivables of the group with a nominal value of $104,515 (2015: $62,118) were impaired and they relate to individually impaired receivables for student tuition fees, which were deemed potentially uncollectible.
Movements in the provision for impairment of trade receivables that are assessed for impairment collectively are as follows.
Consolidated entity Parent entity
2016$’000
2015$’000
2016$’000
2015$’000
At 1 January 62 103 62 103
Provision for impairment recognised during the year 105 62 105 62
Receivables written off during the year as uncollectible (62) (103) (62) (103)
At 31 December 105 62 105 62
The creation and release of the provision for impaired receivables has been included in other expenses in the statement of comprehensive income. Amounts charged to the provision account are generally written off when there is no expectation of recovering additional cash.
(b) Past due but not impairedAs of 31 December 2016, the group trade receivables of $1,968,405 (2015: $1,883,808) and the parent trade receivables of $1,968,405 (2015: $1,883,808) were past due but not impaired. The ageing analysis of the receivables is as follows:
Consolidated entity Parent entity
2016$’000
2015$’000
2016$’000
2015$’000
Up to 3 months 135 1,805 135 1,805
3 to 6 months 1,380 79 1,380 79
Over 6 months 453 – 453 –
1,968 1,884 1,968 1,884
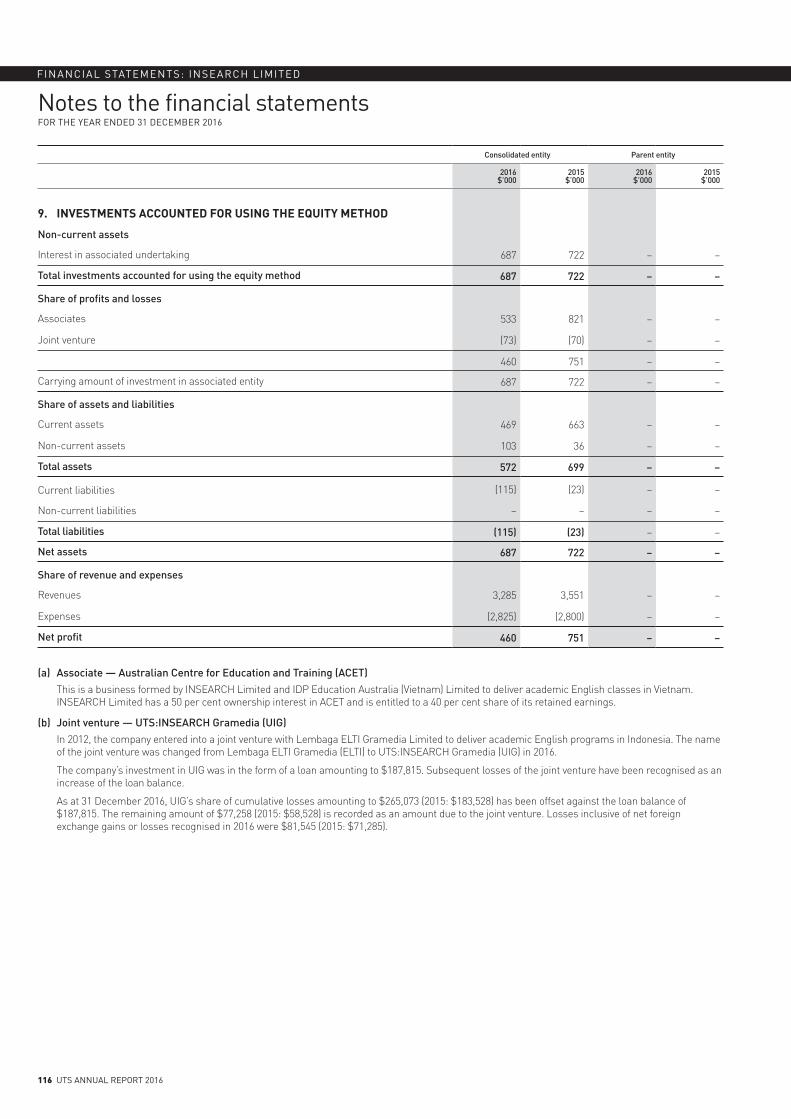
116 UTS ANNUAL REPORT 2016
FINANCIAL STATEMENTS: INSEARCH LIMITED
Notes to the financial statementsFOR THE YEAR ENDED 31 DECEMBER 2016
Consolidated entity Parent entity
2016$’000
2015$’000
2016$’000
2015$’000
9. INVESTMENTS ACCOUNTED FOR USING THE EQUITY METHOD
Non-current assets
Interest in associated undertaking 687 722 – –
Total investments accounted for using the equity method 687 722 – –
Share of profits and losses
Associates 533 821 – –
Joint venture (73) (70) – –
460 751 – –
Carrying amount of investment in associated entity 687 722 – –
Share of assets and liabilities
Current assets 469 663 – –
Non-current assets 103 36 – –
Total assets 572 699 – –
Current liabilities (115) (23) – –
Non-current liabilities – – – –
Total liabilities (115) (23) – –
Net assets 687 722 – –
Share of revenue and expenses
Revenues 3,285 3,551 – –
Expenses (2,825) (2,800) – –
Net profit 460 751 – –
(a) Associate — Australian Centre for Education and Training (ACET)This is a business formed by INSEARCH Limited and IDP Education Australia (Vietnam) Limited to deliver academic English classes in Vietnam. INSEARCH Limited has a 50 per cent ownership interest in ACET and is entitled to a 40 per cent share of its retained earnings.
(b) Joint venture — UTS:INSEARCH Gramedia (UIG)In 2012, the company entered into a joint venture with Lembaga ELTI Gramedia Limited to deliver academic English programs in Indonesia. The name of the joint venture was changed from Lembaga ELTI Gramedia (ELTI) to UTS:INSEARCH Gramedia (UIG) in 2016.
The company’s investment in UIG was in the form of a loan amounting to $187,815. Subsequent losses of the joint venture have been recognised as an increase of the loan balance.
As at 31 December 2016, UIG’s share of cumulative losses amounting to $265,073 (2015: $183,528) has been offset against the loan balance of $187,815. The remaining amount of $77,258 (2015: $58,528) is recorded as an amount due to the joint venture. Losses inclusive of net foreign exchange gains or losses recognised in 2016 were $81,545 (2015: $71,285).
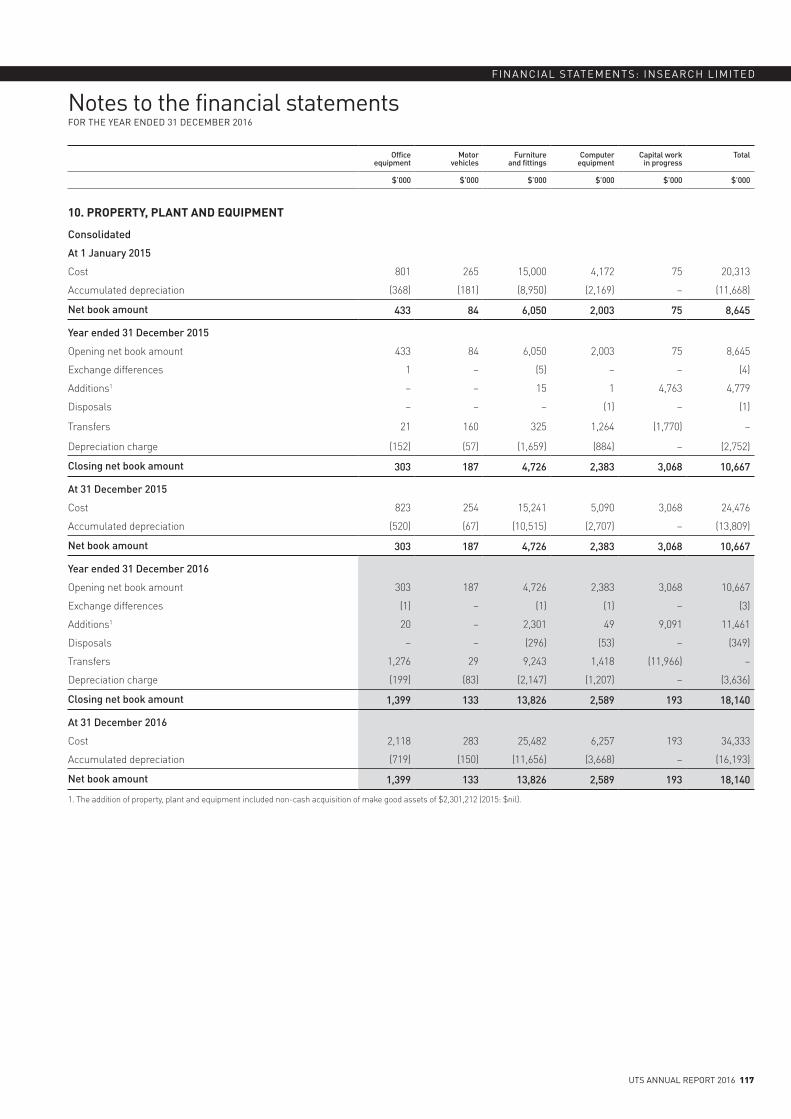
UTS ANNUAL REPORT 2016 117
FINANCIAL STATEMENTS: INSEARCH LIMITED
Notes to the financial statementsFOR THE YEAR ENDED 31 DECEMBER 2016
Office equipment
Motor vehicles
Furniture and fittings
Computer equipment
Capital work in progress
Total
$’000 $’000 $’000 $’000 $’000 $’000
10. PROPERTY, PLANT AND EQUIPMENT
Consolidated
At 1 January 2015
Cost 801 265 15,000 4,172 75 20,313
Accumulated depreciation (368) (181) (8,950) (2,169) – (11,668)
Net book amount 433 84 6,050 2,003 75 8,645
Year ended 31 December 2015
Opening net book amount 433 84 6,050 2,003 75 8,645
Exchange differences 1 – (5) – – (4)
Additions1 – – 15 1 4,763 4,779
Disposals – – – (1) – (1)
Transfers 21 160 325 1,264 (1,770) –
Depreciation charge (152) (57) (1,659) (884) – (2,752)
Closing net book amount 303 187 4,726 2,383 3,068 10,667
At 31 December 2015
Cost 823 254 15,241 5,090 3,068 24,476
Accumulated depreciation (520) (67) (10,515) (2,707) – (13,809)
Net book amount 303 187 4,726 2,383 3,068 10,667
Year ended 31 December 2016
Opening net book amount 303 187 4,726 2,383 3,068 10,667
Exchange differences (1) – (1) (1) – (3)
Additions1 20 – 2,301 49 9,091 11,461
Disposals – – (296) (53) – (349)
Transfers 1,276 29 9,243 1,418 (11,966) –
Depreciation charge (199) (83) (2,147) (1,207) – (3,636)
Closing net book amount 1,399 133 13,826 2,589 193 18,140
At 31 December 2016
Cost 2,118 283 25,482 6,257 193 34,333
Accumulated depreciation (719) (150) (11,656) (3,668) – (16,193)
Net book amount 1,399 133 13,826 2,589 193 18,140
1. The addition of property, plant and equipment included non-cash acquisition of make good assets of $2,301,212 (2015: $nil).
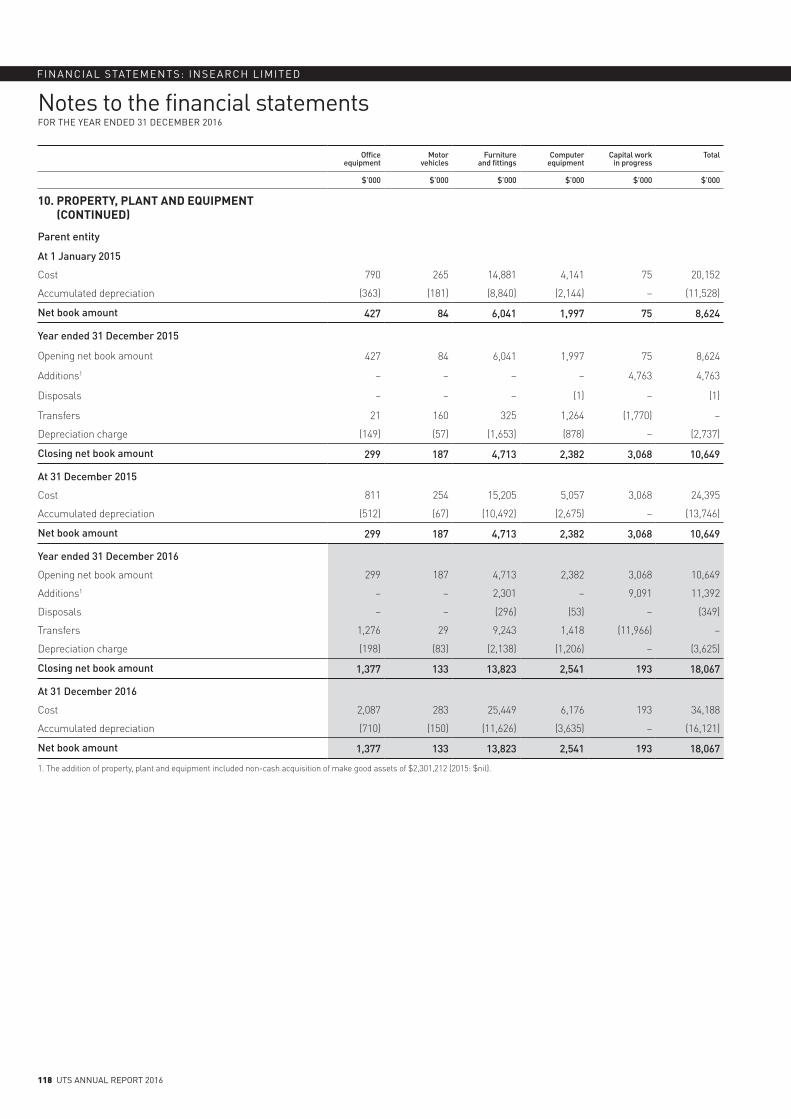
118 UTS ANNUAL REPORT 2016
FINANCIAL STATEMENTS: INSEARCH LIMITED
Notes to the financial statementsFOR THE YEAR ENDED 31 DECEMBER 2016
Office equipment
Motor vehicles
Furniture and fittings
Computer equipment
Capital work in progress
Total
$’000 $’000 $’000 $’000 $’000 $’000
10. PROPERTY, PLANT AND EQUIPMENT (CONTINUED)
Parent entity
At 1 January 2015
Cost 790 265 14,881 4,141 75 20,152
Accumulated depreciation (363) (181) (8,840) (2,144) – (11,528)
Net book amount 427 84 6,041 1,997 75 8,624
Year ended 31 December 2015
Opening net book amount 427 84 6,041 1,997 75 8,624
Additions1 – – – – 4,763 4,763
Disposals – – – (1) – (1)
Transfers 21 160 325 1,264 (1,770) –
Depreciation charge (149) (57) (1,653) (878) – (2,737)
Closing net book amount 299 187 4,713 2,382 3,068 10,649
At 31 December 2015
Cost 811 254 15,205 5,057 3,068 24,395
Accumulated depreciation (512) (67) (10,492) (2,675) – (13,746)
Net book amount 299 187 4,713 2,382 3,068 10,649
Year ended 31 December 2016
Opening net book amount 299 187 4,713 2,382 3,068 10,649
Additions1 – – 2,301 – 9,091 11,392
Disposals – – (296) (53) – (349)
Transfers 1,276 29 9,243 1,418 (11,966) –
Depreciation charge (198) (83) (2,138) (1,206) – (3,625)
Closing net book amount 1,377 133 13,823 2,541 193 18,067
At 31 December 2016
Cost 2,087 283 25,449 6,176 193 34,188
Accumulated depreciation (710) (150) (11,626) (3,635) – (16,121)
Net book amount 1,377 133 13,823 2,541 193 18,067
1. The addition of property, plant and equipment included non-cash acquisition of make good assets of $2,301,212 (2015: $nil).
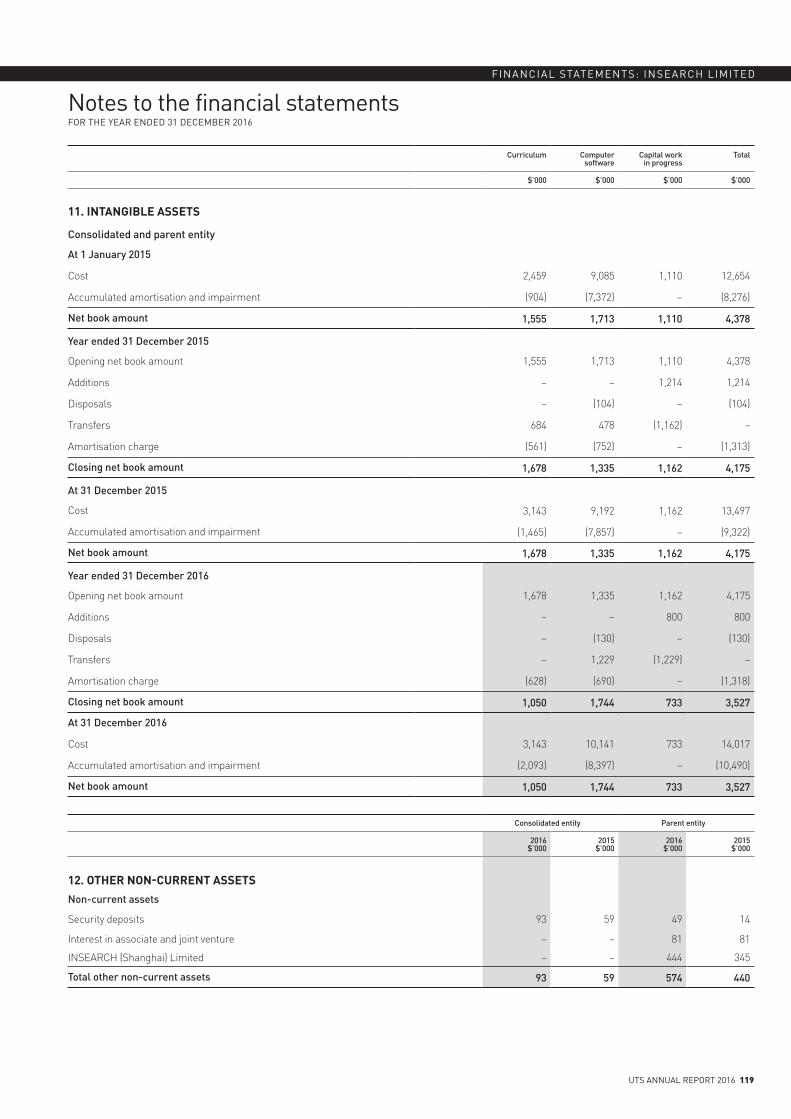
UTS ANNUAL REPORT 2016 119
FINANCIAL STATEMENTS: INSEARCH LIMITED
Notes to the financial statementsFOR THE YEAR ENDED 31 DECEMBER 2016
Curriculum Computer software
Capital work in progress
Total
$’000 $’000 $’000 $’000
11. INTANGIBLE ASSETS
Consolidated and parent entity
At 1 January 2015
Cost 2,459 9,085 1,110 12,654
Accumulated amortisation and impairment (904) (7,372) – (8,276)
Net book amount 1,555 1,713 1,110 4,378
Year ended 31 December 2015
Opening net book amount 1,555 1,713 1,110 4,378
Additions – – 1,214 1,214
Disposals – (104) – (104)
Transfers 684 478 (1,162) –
Amortisation charge (561) (752) – (1,313)
Closing net book amount 1,678 1,335 1,162 4,175
At 31 December 2015
Cost 3,143 9,192 1,162 13,497
Accumulated amortisation and impairment (1,465) (7,857) – (9,322)
Net book amount 1,678 1,335 1,162 4,175
Year ended 31 December 2016
Opening net book amount 1,678 1,335 1,162 4,175
Additions – – 800 800
Disposals – (130) – (130)
Transfers – 1,229 (1,229) –
Amortisation charge (628) (690) – (1,318)
Closing net book amount 1,050 1,744 733 3,527
At 31 December 2016
Cost 3,143 10,141 733 14,017
Accumulated amortisation and impairment (2,093) (8,397) – (10,490)
Net book amount 1,050 1,744 733 3,527
Consolidated entity Parent entity
2016$’000
2015$’000
2016$’000
2015$’000
12. OTHER NON-CURRENT ASSETSNon-current assets
Security deposits 93 59 49 14
Interest in associate and joint venture – – 81 81
INSEARCH (Shanghai) Limited – – 444 345
Total other non-current assets 93 59 574 440
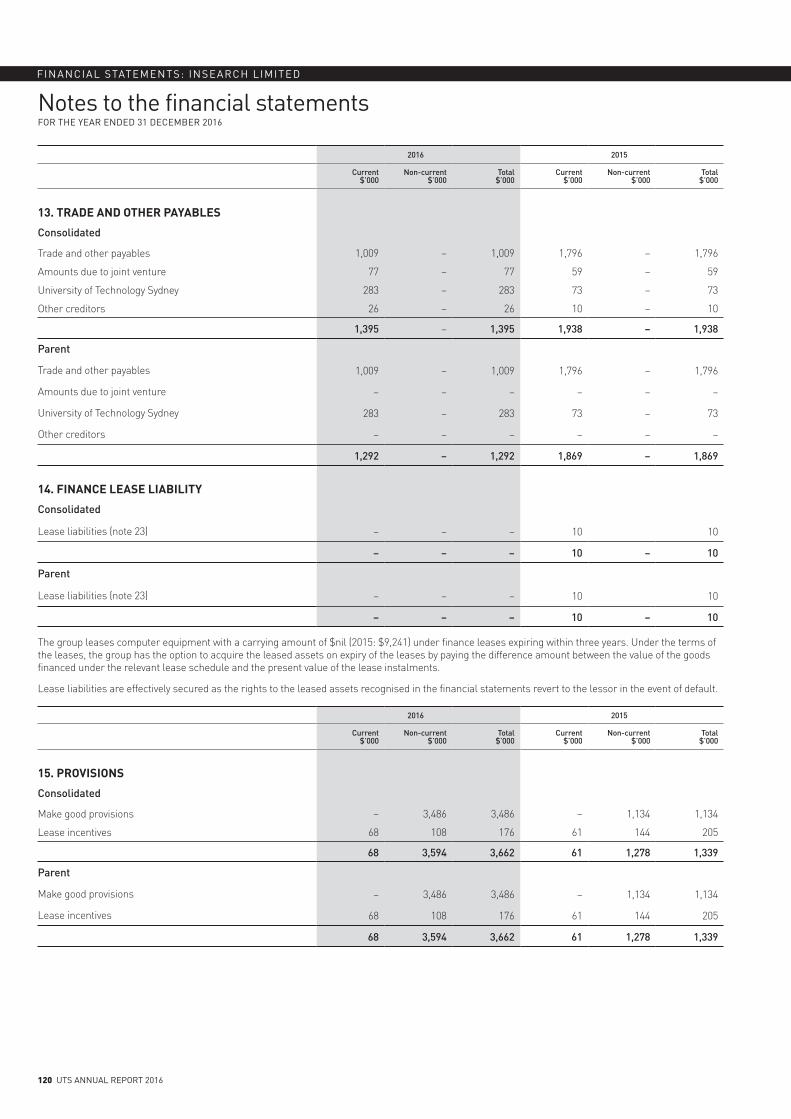
120 UTS ANNUAL REPORT 2016
FINANCIAL STATEMENTS: INSEARCH LIMITED
Notes to the financial statementsFOR THE YEAR ENDED 31 DECEMBER 2016
2016 2015
Current $’000
Non-current $’000
Total$’000
Current $’000
Non-current $’000
Total$’000
13. TRADE AND OTHER PAYABLES
Consolidated
Trade and other payables 1,009 – 1,009 1,796 – 1,796
Amounts due to joint venture 77 – 77 59 – 59
University of Technology Sydney 283 – 283 73 – 73
Other creditors 26 – 26 10 – 10
1,395 – 1,395 1,938 – 1,938
Parent
Trade and other payables 1,009 – 1,009 1,796 – 1,796
Amounts due to joint venture – – – – – –
University of Technology Sydney 283 – 283 73 – 73
Other creditors – – – – – –
1,292 – 1,292 1,869 – 1,869
14. FINANCE LEASE LIABILITY
Consolidated
Lease liabilities (note 23) – – – 10 10
– – – 10 – 10
Parent
Lease liabilities (note 23) – – – 10 10
– – – 10 – 10
The group leases computer equipment with a carrying amount of $nil (2015: $9,241) under finance leases expiring within three years. Under the terms of the leases, the group has the option to acquire the leased assets on expiry of the leases by paying the difference amount between the value of the goods financed under the relevant lease schedule and the present value of the lease instalments.
Lease liabilities are effectively secured as the rights to the leased assets recognised in the financial statements revert to the lessor in the event of default.
2016 2015
Current $’000
Non-current $’000
Total$’000
Current $’000
Non-current $’000
Total$’000
15. PROVISIONS
Consolidated
Make good provisions – 3,486 3,486 – 1,134 1,134
Lease incentives 68 108 176 61 144 205
68 3,594 3,662 61 1,278 1,339
Parent
Make good provisions – 3,486 3,486 – 1,134 1,134
Lease incentives 68 108 176 61 144 205
68 3,594 3,662 61 1,278 1,339
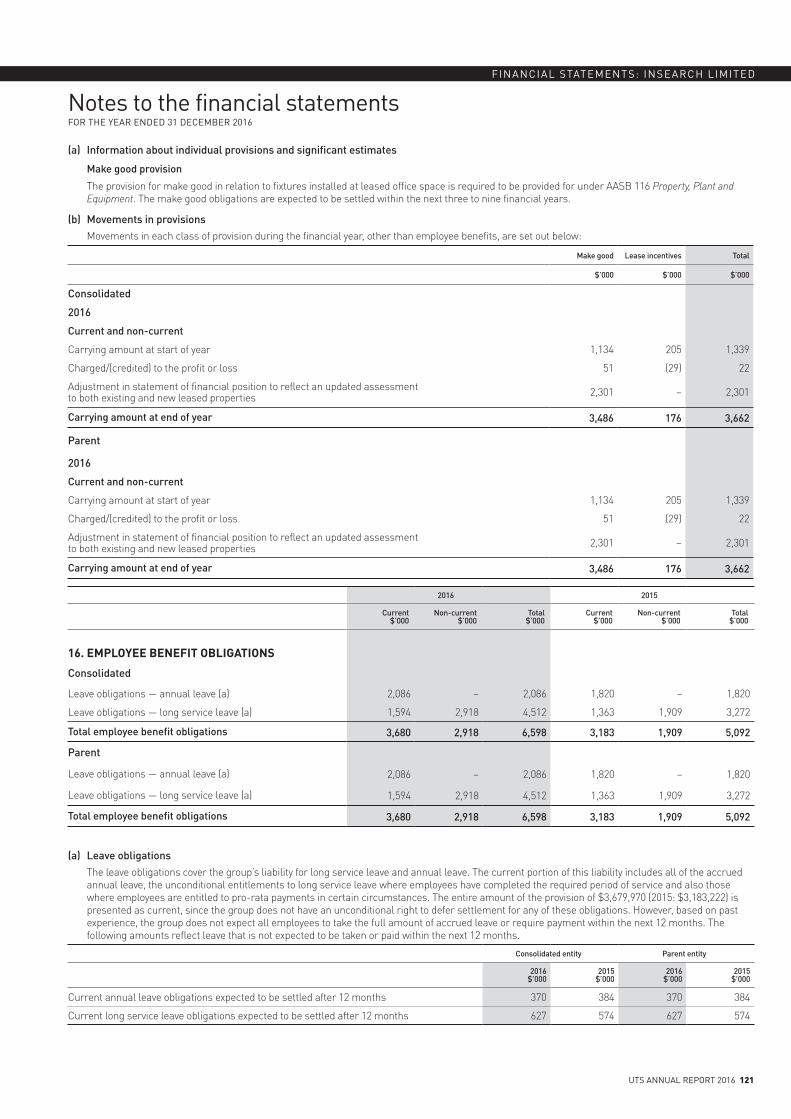
UTS ANNUAL REPORT 2016 121
FINANCIAL STATEMENTS: INSEARCH LIMITED
Notes to the financial statementsFOR THE YEAR ENDED 31 DECEMBER 2016
(a) Information about individual provisions and significant estimates
Make good provision
The provision for make good in relation to fixtures installed at leased office space is required to be provided for under AASB 116 Property, Plant and Equipment. The make good obligations are expected to be settled within the next three to nine financial years.
(b) Movements in provisionsMovements in each class of provision during the financial year, other than employee benefits, are set out below:
Make good Lease incentives Total
$’000 $’000 $’000
Consolidated
2016
Current and non-current
Carrying amount at start of year 1,134 205 1,339
Charged/(credited) to the profit or loss 51 (29) 22
Adjustment in statement of financial position to reflect an updated assessment to both existing and new leased properties 2,301 – 2,301
Carrying amount at end of year 3,486 176 3,662
Parent
2016
Current and non-current
Carrying amount at start of year 1,134 205 1,339
Charged/(credited) to the profit or loss 51 (29) 22
Adjustment in statement of financial position to reflect an updated assessment to both existing and new leased properties 2,301 – 2,301
Carrying amount at end of year 3,486 176 3,662
2016 2015
Current $’000
Non-current $’000
Total$’000
Current $’000
Non-current $’000
Total$’000
16. EMPLOYEE BENEFIT OBLIGATIONS
Consolidated
Leave obligations — annual leave (a) 2,086 – 2,086 1,820 – 1,820
Leave obligations — long service leave (a) 1,594 2,918 4,512 1,363 1,909 3,272
Total employee benefit obligations 3,680 2,918 6,598 3,183 1,909 5,092
Parent
Leave obligations — annual leave (a) 2,086 – 2,086 1,820 – 1,820
Leave obligations — long service leave (a) 1,594 2,918 4,512 1,363 1,909 3,272
Total employee benefit obligations 3,680 2,918 6,598 3,183 1,909 5,092
(a) Leave obligationsThe leave obligations cover the group’s liability for long service leave and annual leave. The current portion of this liability includes all of the accrued annual leave, the unconditional entitlements to long service leave where employees have completed the required period of service and also those where employees are entitled to pro-rata payments in certain circumstances. The entire amount of the provision of $3,679,970 (2015: $3,183,222) is presented as current, since the group does not have an unconditional right to defer settlement for any of these obligations. However, based on past experience, the group does not expect all employees to take the full amount of accrued leave or require payment within the next 12 months. The following amounts reflect leave that is not expected to be taken or paid within the next 12 months.
Consolidated entity Parent entity
2016$’000
2015$’000
2016$’000
2015$’000
Current annual leave obligations expected to be settled after 12 months 370 384 370 384
Current long service leave obligations expected to be settled after 12 months 627 574 627 574
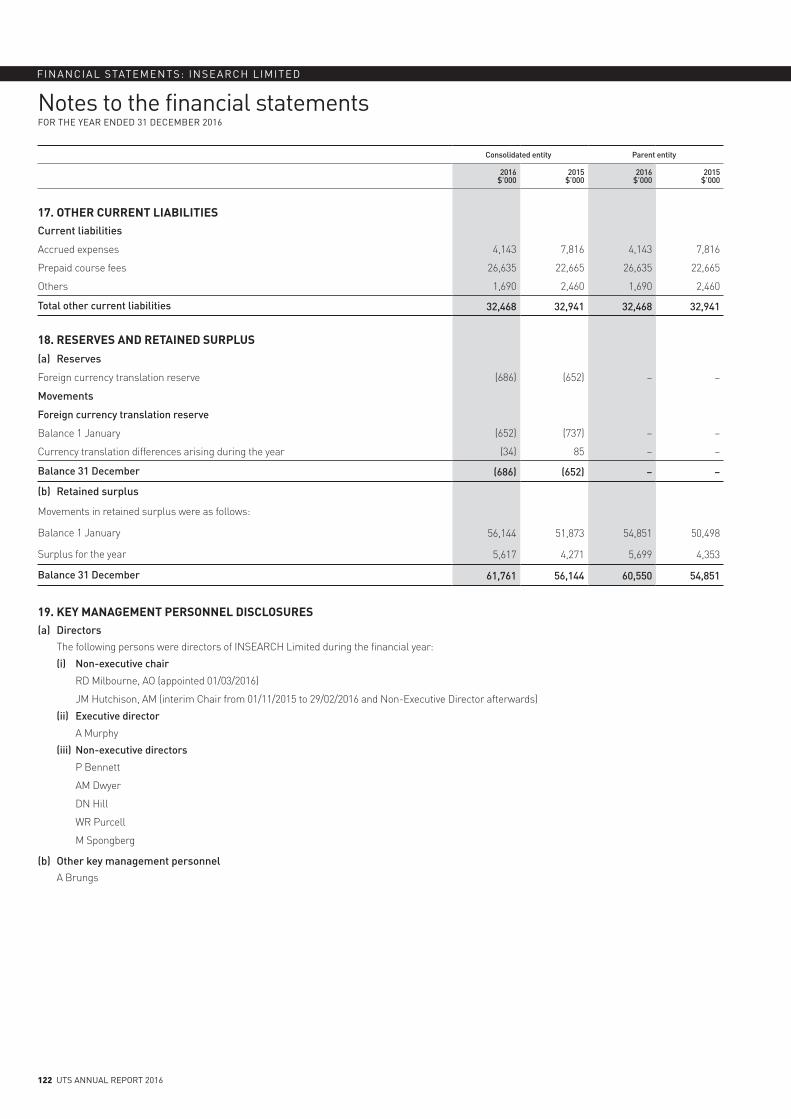
122 UTS ANNUAL REPORT 2016
FINANCIAL STATEMENTS: INSEARCH LIMITED
Notes to the financial statementsFOR THE YEAR ENDED 31 DECEMBER 2016
Consolidated entity Parent entity
2016$’000
2015$’000
2016$’000
2015$’000
17. OTHER CURRENT LIABILITIESCurrent liabilities
Accrued expenses 4,143 7,816 4,143 7,816
Prepaid course fees 26,635 22,665 26,635 22,665
Others 1,690 2,460 1,690 2,460
Total other current liabilities 32,468 32,941 32,468 32,941
18. RESERVES AND RETAINED SURPLUS(a) Reserves
Foreign currency translation reserve (686) (652) – –
Movements
Foreign currency translation reserve
Balance 1 January (652) (737) – –
Currency translation differences arising during the year (34) 85 – –
Balance 31 December (686) (652) – –
(b) Retained surplus
Movements in retained surplus were as follows:
Balance 1 January 56,144 51,873 54,851 50,498
Surplus for the year 5,617 4,271 5,699 4,353
Balance 31 December 61,761 56,144 60,550 54,851
19. KEY MANAGEMENT PERSONNEL DISCLOSURES(a) Directors
The following persons were directors of INSEARCH Limited during the financial year:
(i) Non-executive chair
RD Milbourne, AO (appointed 01/03/2016)
JM Hutchison, AM (interim Chair from 01/11/2015 to 29/02/2016 and Non-Executive Director afterwards)
(ii) Executive director
A Murphy
(iii) Non-executive directors
P Bennett
AM Dwyer
DN Hill
WR Purcell
M Spongberg
(b) Other key management personnelA Brungs
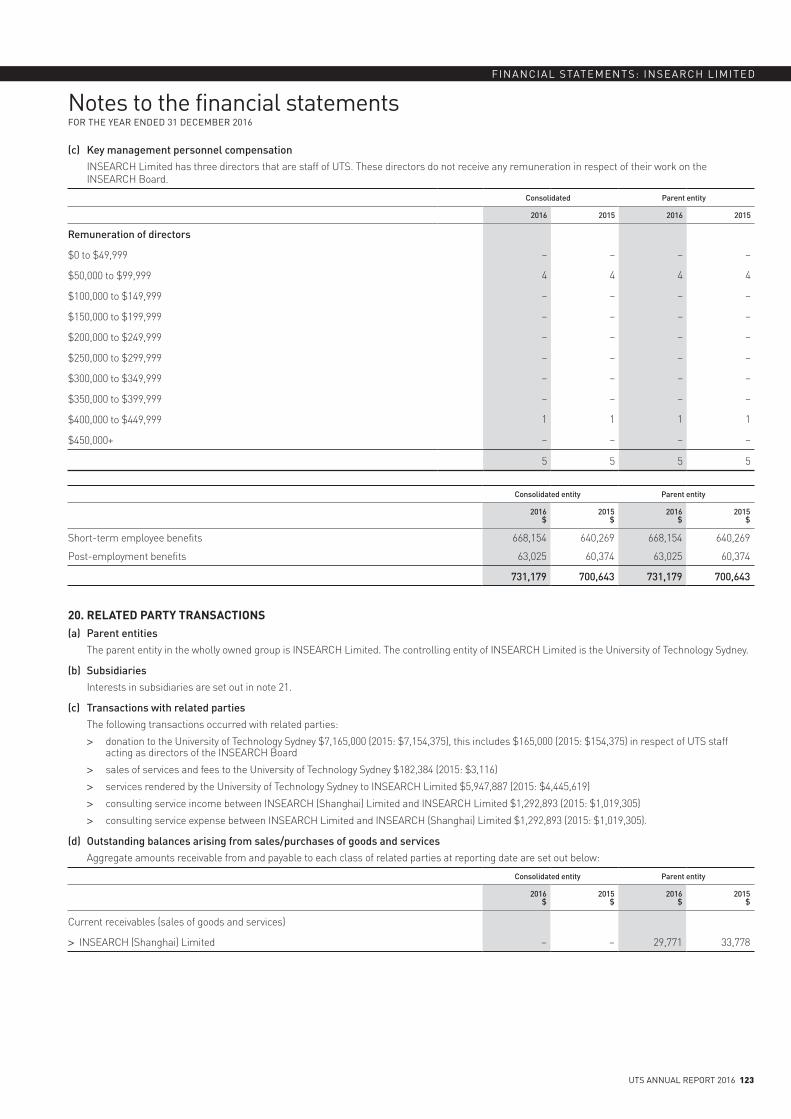
UTS ANNUAL REPORT 2016 123
FINANCIAL STATEMENTS: INSEARCH LIMITED
Notes to the financial statementsFOR THE YEAR ENDED 31 DECEMBER 2016
(c) Key management personnel compensationINSEARCH Limited has three directors that are staff of UTS. These directors do not receive any remuneration in respect of their work on the INSEARCH Board.
Consolidated Parent entity
2016 2015 2016 2015
Remuneration of directors
$0 to $49,999 – – – –
$50,000 to $99,999 4 4 4 4
$100,000 to $149,999 – – – –
$150,000 to $199,999 – – – –
$200,000 to $249,999 – – – –
$250,000 to $299,999 – – – –
$300,000 to $349,999 – – – –
$350,000 to $399,999 – – – –
$400,000 to $449,999 1 1 1 1
$450,000+ – – – –
5 5 5 5
Consolidated entity Parent entity
2016$
2015$
2016$
2015$
Short-term employee benefits 668,154 640,269 668,154 640,269
Post-employment benefits 63,025 60,374 63,025 60,374
731,179 700,643 731,179 700,643
20. RELATED PARTY TRANSACTIONS (a) Parent entities
The parent entity in the wholly owned group is INSEARCH Limited. The controlling entity of INSEARCH Limited is the University of Technology Sydney.
(b) SubsidiariesInterests in subsidiaries are set out in note 21.
(c) Transactions with related partiesThe following transactions occurred with related parties:
> donation to the University of Technology Sydney $7,165,000 (2015: $7,154,375), this includes $165,000 (2015: $154,375) in respect of UTS staff acting as directors of the INSEARCH Board
> sales of services and fees to the University of Technology Sydney $182,384 (2015: $3,116)
> services rendered by the University of Technology Sydney to INSEARCH Limited $5,947,887 (2015: $4,445,619)
> consulting service income between INSEARCH (Shanghai) Limited and INSEARCH Limited $1,292,893 (2015: $1,019,305)
> consulting service expense between INSEARCH Limited and INSEARCH (Shanghai) Limited $1,292,893 (2015: $1,019,305).
(d) Outstanding balances arising from sales/purchases of goods and servicesAggregate amounts receivable from and payable to each class of related parties at reporting date are set out below:
Consolidated entity Parent entity
2016$
2015$
2016$
2015$
Current receivables (sales of goods and services)
> INSEARCH (Shanghai) Limited – – 29,771 33,778
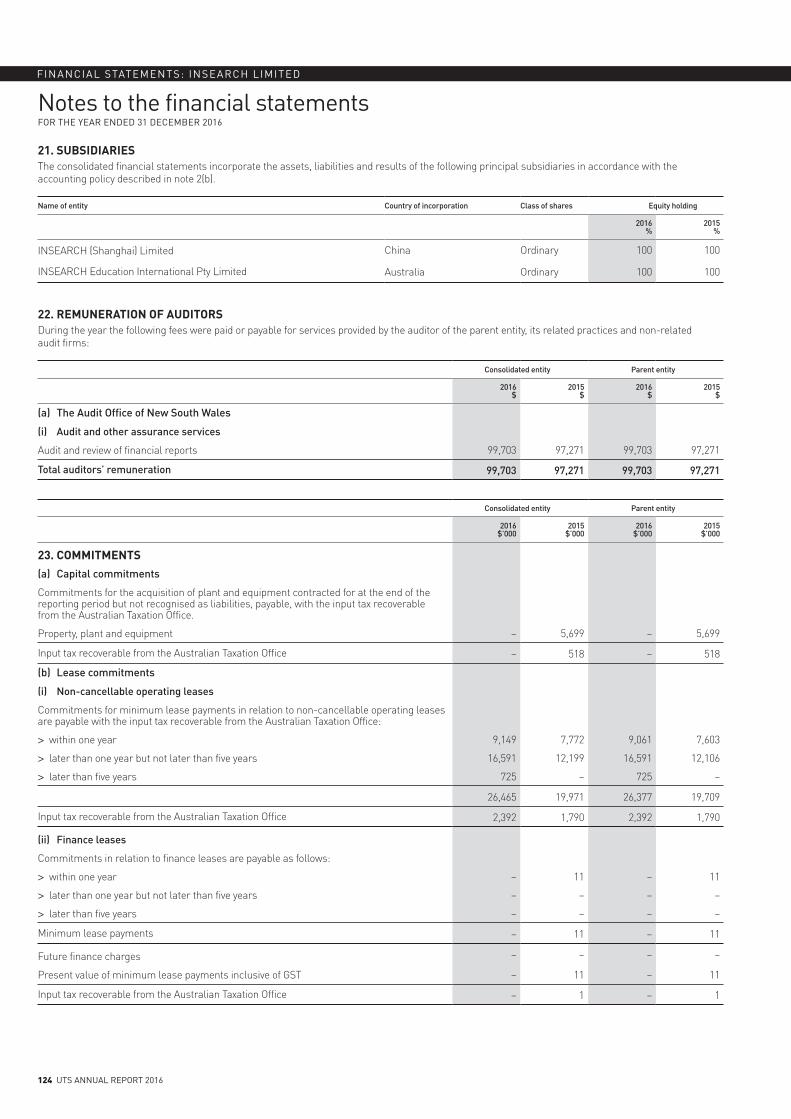
124 UTS ANNUAL REPORT 2016
FINANCIAL STATEMENTS: INSEARCH LIMITED
Notes to the financial statementsFOR THE YEAR ENDED 31 DECEMBER 2016
21. SUBSIDIARIESThe consolidated financial statements incorporate the assets, liabilities and results of the following principal subsidiaries in accordance with the accounting policy described in note 2(b).
Name of entity Country of incorporation Class of shares Equity holding
2016 %
2015 %
INSEARCH (Shanghai) Limited China Ordinary 100 100
INSEARCH Education International Pty Limited Australia Ordinary 100 100
22. REMUNERATION OF AUDITORSDuring the year the following fees were paid or payable for services provided by the auditor of the parent entity, its related practices and non-related audit firms:
Consolidated entity Parent entity
2016$
2015$
2016$
2015 $
(a) The Audit Office of New South Wales
(i) Audit and other assurance services
Audit and review of financial reports 99,703 97,271 99,703 97,271
Total auditors’ remuneration 99,703 97,271 99,703 97,271
Consolidated entity Parent entity
2016$’000
2015$’000
2016$’000
2015$’000
23. COMMITMENTS(a) Capital commitments
Commitments for the acquisition of plant and equipment contracted for at the end of the reporting period but not recognised as liabilities, payable, with the input tax recoverable from the Australian Taxation Office.
Property, plant and equipment – 5,699 – 5,699
Input tax recoverable from the Australian Taxation Office – 518 – 518
(b) Lease commitments
(i) Non-cancellable operating leases
Commitments for minimum lease payments in relation to non-cancellable operating leases are payable with the input tax recoverable from the Australian Taxation Office:
> within one year 9,149 7,772 9,061 7,603
> later than one year but not later than five years 16,591 12,199 16,591 12,106
> later than five years 725 – 725 –
26,465 19,971 26,377 19,709
Input tax recoverable from the Australian Taxation Office 2,392 1,790 2,392 1,790
(ii) Finance leases
Commitments in relation to finance leases are payable as follows:
> within one year – 11 – 11
> later than one year but not later than five years – – – –
> later than five years – – – –
Minimum lease payments – 11 – 11
Future finance charges – – – –
Present value of minimum lease payments inclusive of GST – 11 – 11
Input tax recoverable from the Australian Taxation Office – 1 – 1
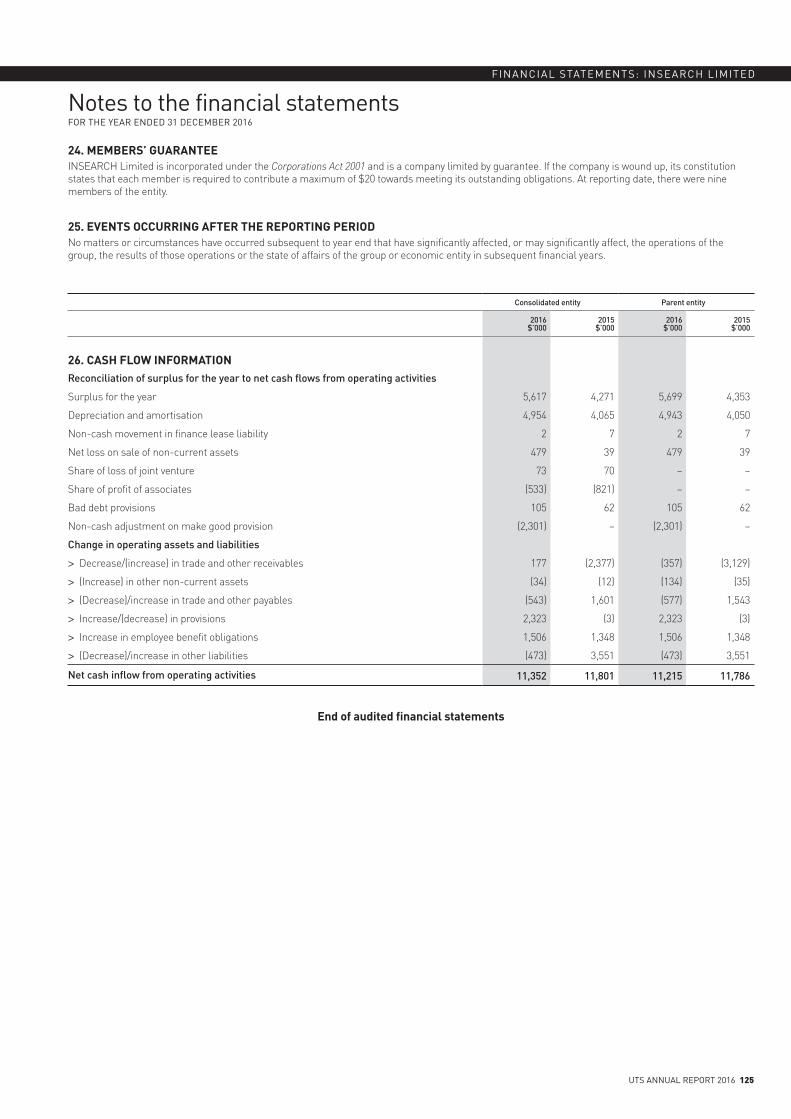
UTS ANNUAL REPORT 2016 125
FINANCIAL STATEMENTS: INSEARCH LIMITED
Notes to the financial statementsFOR THE YEAR ENDED 31 DECEMBER 2016
24. MEMBERS’ GUARANTEEINSEARCH Limited is incorporated under the Corporations Act 2001 and is a company limited by guarantee. If the company is wound up, its constitution states that each member is required to contribute a maximum of $20 towards meeting its outstanding obligations. At reporting date, there were nine members of the entity.
25. EVENTS OCCURRING AFTER THE REPORTING PERIODNo matters or circumstances have occurred subsequent to year end that have significantly affected, or may significantly affect, the operations of the group, the results of those operations or the state of affairs of the group or economic entity in subsequent financial years.
Consolidated entity Parent entity
2016$’000
2015$’000
2016$’000
2015$’000
26. CASH FLOW INFORMATIONReconciliation of surplus for the year to net cash flows from operating activities
Surplus for the year 5,617 4,271 5,699 4,353
Depreciation and amortisation 4,954 4,065 4,943 4,050
Non-cash movement in finance lease liability 2 7 2 7
Net loss on sale of non-current assets 479 39 479 39
Share of loss of joint venture 73 70 – –
Share of profit of associates (533) (821) – –
Bad debt provisions 105 62 105 62
Non-cash adjustment on make good provision (2,301) – (2,301) –
Change in operating assets and liabilities
> Decrease/(increase) in trade and other receivables 177 (2,377) (357) (3,129)
> (Increase) in other non-current assets (34) (12) (134) (35)
> (Decrease)/increase in trade and other payables (543) 1,601 (577) 1,543
> Increase/(decrease) in provisions 2,323 (3) 2,323 (3)
> Increase in employee benefit obligations 1,506 1,348 1,506 1,348
> (Decrease)/increase in other liabilities (473) 3,551 (473) 3,551
Net cash inflow from operating activities 11,352 11,801 11,215 11,786
End of audited financial statements
126 UTS ANNUAL REPORT 2016
accessUTS Pty Limited
Directors’ report 128
Directors’ declaration 129
Independent auditor’s report 130
Auditor’s independence declaration 132
Statement of comprehensive income 133
Statement of financial position 134
Statement of changes in equity 135
Statement of cash flows 135
Notes to the financial statements 136
1. Reporting entity 136
2. Summary of significant accounting policies 136
3. Expenses excluding losses 137
4. Revenue 138
5. Income tax expense 138
6. Cash and cash equivalents 138
7. Receivables 138
8. Prepayments 138
9. Payables 139
10. Provisions 139
11. Other current liabilities 139
12. Income tax payable 139
13. Contributed equity 139
14. Accumulated profits 139
15. Reconciliation of operating profit for the year with cash flows from operating activities 140
16. Auditors’ remuneration 140
17. Key management personnel disclosures 140
18. Contingent assets and contingent liabilities 140
19. Significant events after the balance date 140
20. Economic dependency 140
21. Related party transactions 141
22. Financial risk and management objectives and policies 141
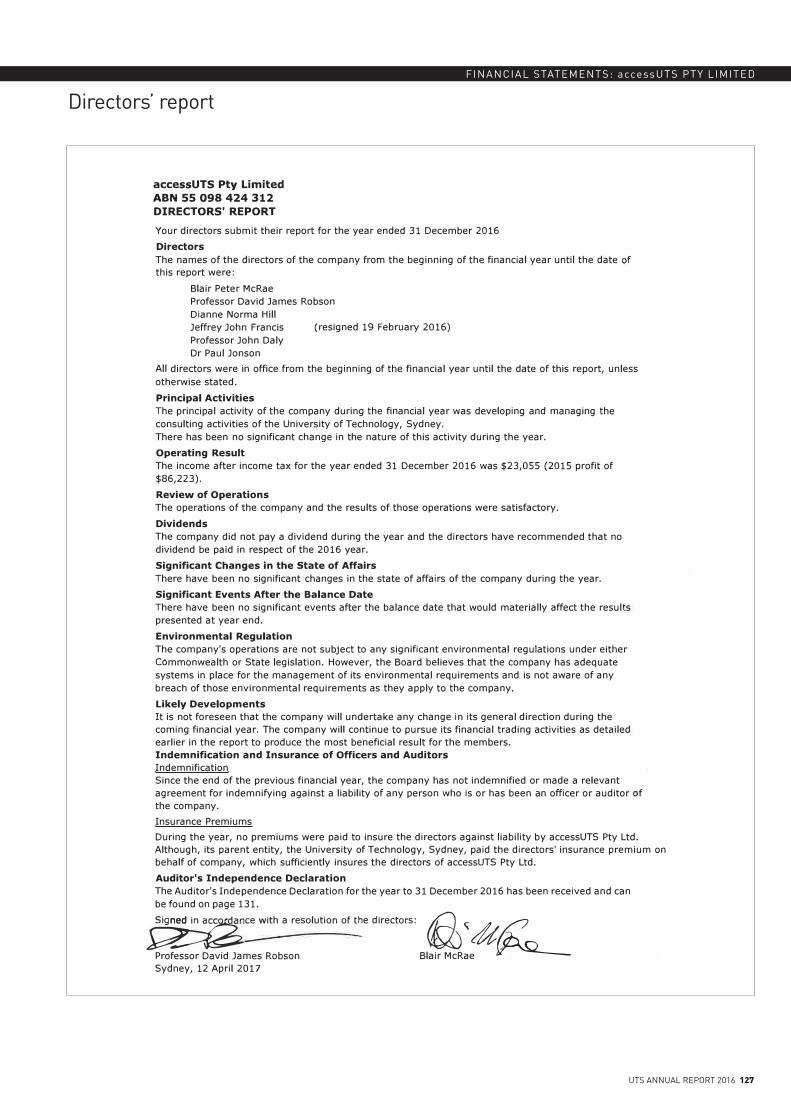
UTS ANNUAL REPORT 2016 127
FINANCIAL STATEMENTS: accessUTS PTY LIMITED
Directors’ report
accessUTS Pty Limited ABN SS 098 424 312 DIRECTORS'REPORT
Your directors submit their report for the year ended 31 December 2016 Directors The names of the directors of the company from the beginning of the financial year until the date of this report were:
Blair Peter McRae Professor David James Robson Dianne Norma Hill Jeffrey John Francis (resigned 19 February 2016) Professor John Daly Dr Paul Jonson
All directors were in office from the beginning of the financial year until the date of this report, unless otherwise stated. Principal Activities The principal activity of the company during the financial year was developing and managing the consulting activities of the University of Technology, Sydney. There has been no significant change in the nature of this activity during the year. Operating Result The income after income tax for the year ended 31 December 2016 was $23,055 (2015 profit of $86,223). Review of Operations The operations of the company and the results of those operations were satisfactory. Dividends The company did not pay a dividend during the year and the directors have recommended that no dividend be paid in respect of the 2016 year. Significant Changes in the State of Affairs There have been no significant changes in the state of affairs of the company during the year. Significant Events After the Balance Date There have been no significant events after the balance date that would materially affect the results presented at year end. Environmental Regulation The company's operations are not subject to any significant environmental regulations under either Commonwealth or State legislation. However, the Board believes that the company has adequate systems in place for the management of its environmental requirements and is not aware of any breach of those environmental requirements as they apply to the company. Likely Developments It is not foreseen that the company will undertake any change in its general direction during the coming financial year. The company will continue to pursue its financial trading activities as detailed earlier in the report to produce the most beneficial result for the members. Indemnification and Insurance of Officers and Auditors Indemnification Since the end of the previous financial year, the company has not indemnified or made a relevant agreement for indemnifying against a liability of any person who is or has been an officer or auditor of the company. Insurance Premiums During the year, no premiums were paid to insure the directors against liability by accessUTS Pty Ltd. Although, its parent entity, the University of Technology, Sydney, paid the directors' insurance premium on behalf of company, which sufficiently insures the directors of accessUTS Pty Ltd. Auditor's Independence Declaration The Auditor's Independence Declaration for the year to 31 December 2016 has been received and can be found on page 131.
w�ce w;th a ,esolut;on of �e d;,ectocs, � '&,�
Professor David James Robson Blair McRae � Sydney, 12 April 2017
Page 1
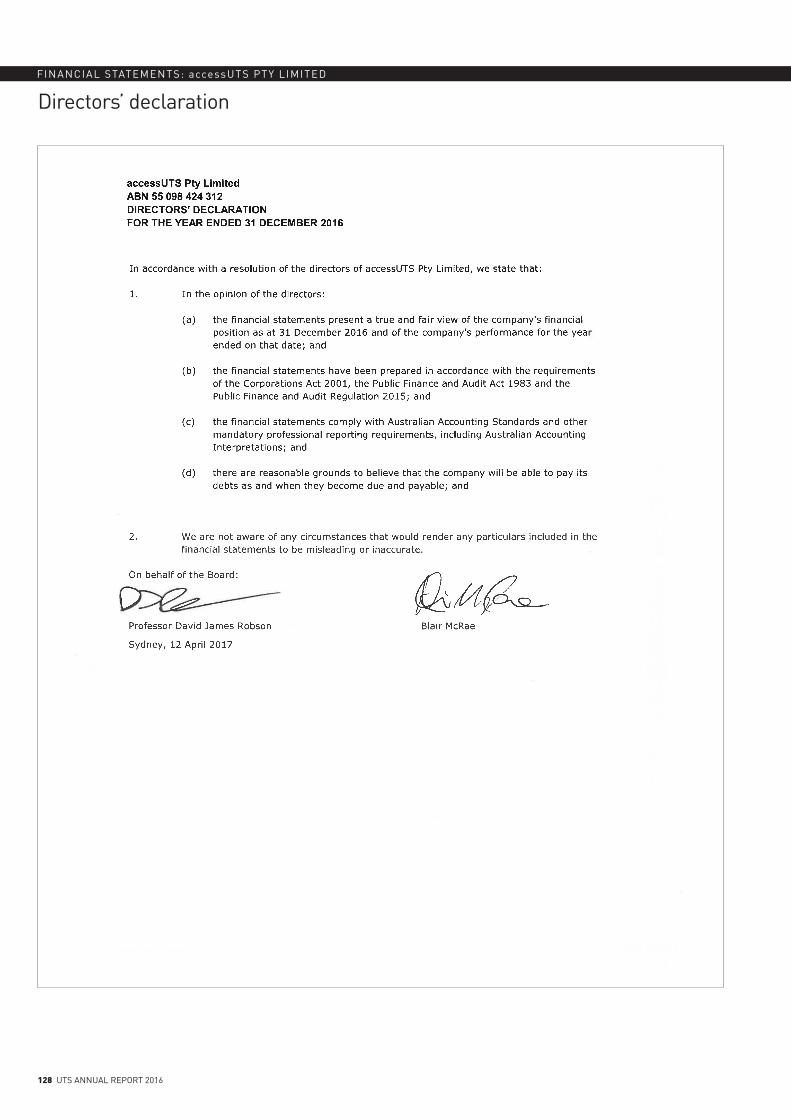
128 UTS ANNUAL REPORT 2016
FINANCIAL STATEMENTS: accessUTS PTY LIMITED
Directors’ declaration
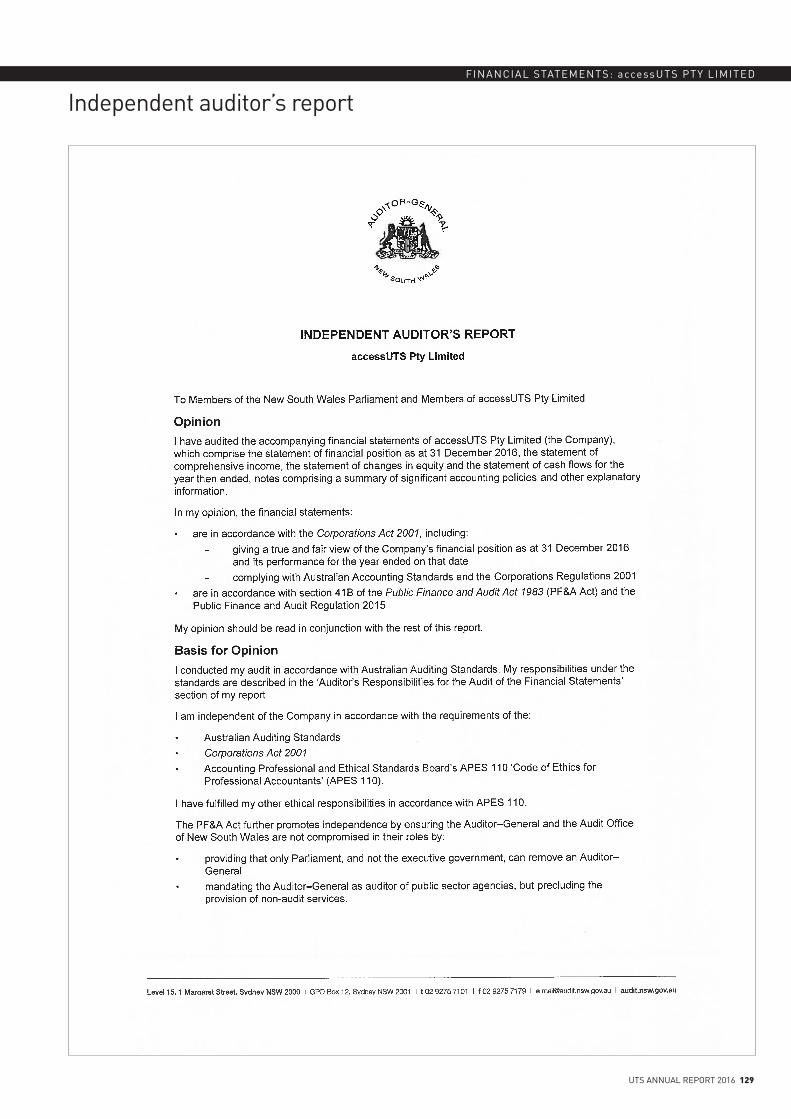
UTS ANNUAL REPORT 2016 129
FINANCIAL STATEMENTS: accessUTS PTY LIMITED
Independent auditor’s report
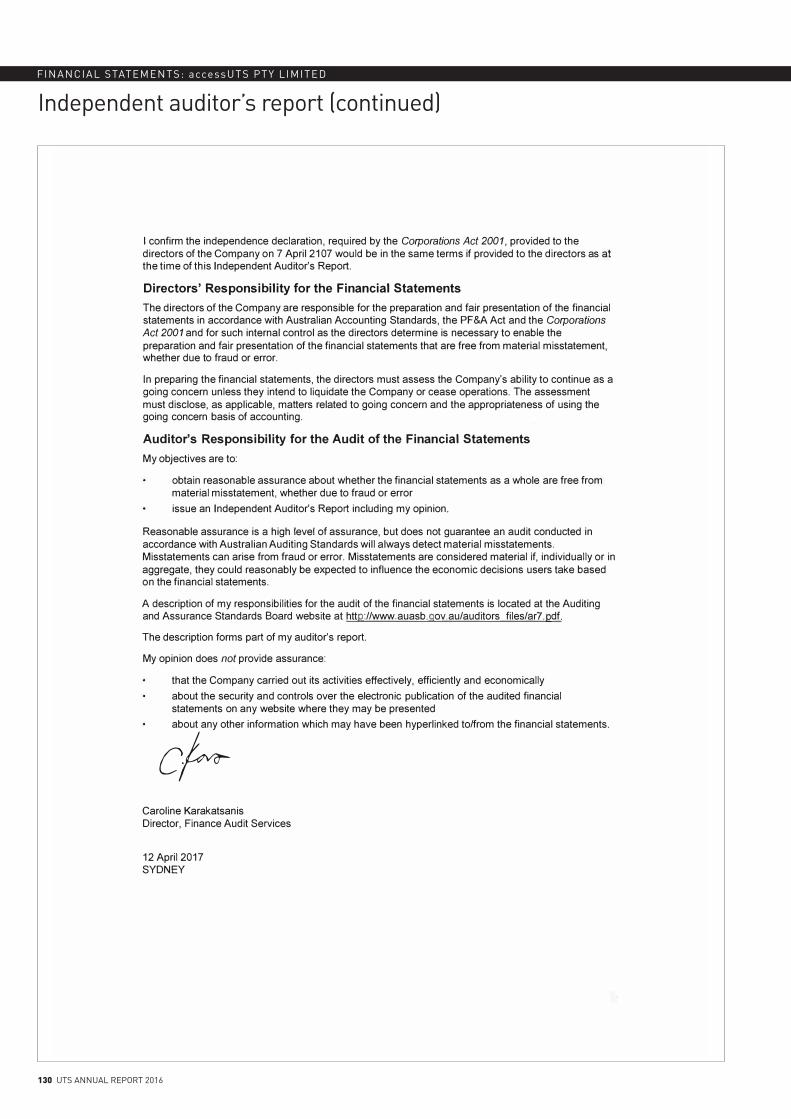
130 UTS ANNUAL REPORT 2016
FINANCIAL STATEMENTS: accessUTS PTY LIMITED
Independent auditor’s report (continued)
I confirm the independence declaration, required by the Corporations Act 2001, provided to the directors of the Company on 7 April 2107 would be in the same terms if provided to the directors as at the time of this Independent Auditor's Report.
Directors' Responsibility for the Financial Statements The directors of the Company are responsible for the preparation and fair presentation of the financial statements in accordance with Australian Accounting Standards, the PF&A Act and the Corporations Act 2001 and for such internal control as the directors determine is necessary to enable the preparation and fair presentation of the financial statements that are free from material misstatement, whether due to fraud or error.
In preparing the financial statements, the directors must assess the Company's ability to continue as a going concern unless they intend to liquidate the Company or cease operations. The assessment must disclose, as applicable, matters related to going concern and the appropriateness of using the going concern basis of accounting.
Auditor's Responsibility for the Audit of the Financial Statements My objectives are to:
obtain reasonable assurance about whether the financial statements as a whole are free from material misstatement, whether due to fraud or error issue an Independent Auditor's Report including my opinion.
Reasonable assurance is a high level of assurance, but does not guarantee an audit conducted in accordance with Australian Auditing Standards will always detect material misstatements. Misstatements can arise from fraud or error. Misstatements are considered material if, individually or in aggregate, they could reasonably be expected to influence the economic decisions users take based on the financial statements.
A description of my responsibilities for the audit of the financial statements is located at the Auditing and Assurance Standards Board website at http://www.auasb.qov.au/auditors files/ar7.pdf.
The description forms part of my auditor's report.
My opinion does not provide assurance:
that the Company carried out its activities effectively, efficiently and economically about the security and controls over the electronic publication of the audited financial statements on any website where they may be presented about any other information which may have been hyperlinked to/from the financial statements.
c� Caroline Karakatsanis Director, Finance Audit Services
12 April 2017 SYDNEY
UTS ANNUAL REPORT 2016 131
FINANCIAL STATEMENTS: accessUTS PTY LIMITED
Auditor’s independence declaration
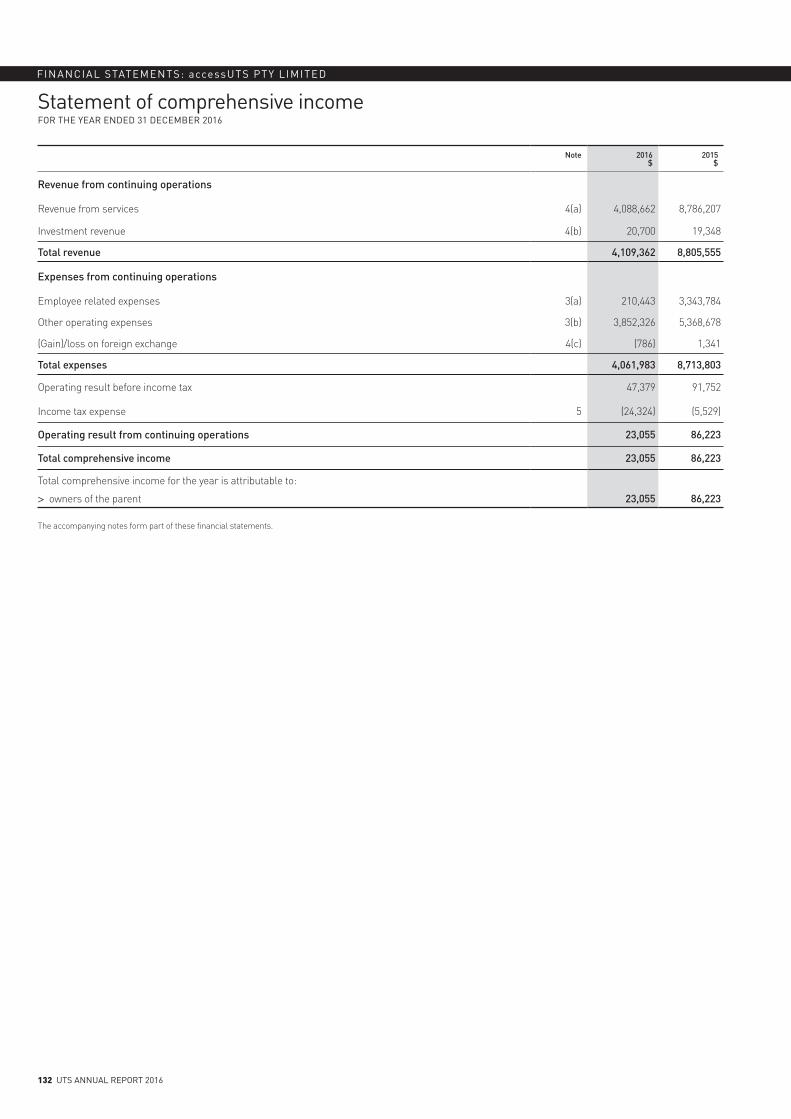
132 UTS ANNUAL REPORT 2016
FINANCIAL STATEMENTS: accessUTS PTY LIMITED
Note 2016$
2015$
Revenue from continuing operations
Revenue from services 4(a) 4,088,662 8,786,207
Investment revenue 4(b) 20,700 19,348
Total revenue 4,109,362 8,805,555
Expenses from continuing operations
Employee related expenses 3(a) 210,443 3,343,784
Other operating expenses 3(b) 3,852,326 5,368,678
(Gain)/loss on foreign exchange 4(c) (786) 1,341
Total expenses 4,061,983 8,713,803
Operating result before income tax 47,379 91,752
Income tax expense 5 (24,324) (5,529)
Operating result from continuing operations 23,055 86,223
Total comprehensive income 23,055 86,223
Total comprehensive income for the year is attributable to:
> owners of the parent 23,055 86,223
The accompanying notes form part of these financial statements.
Statement of comprehensive incomeFOR THE YEAR ENDED 31 DECEMBER 2016
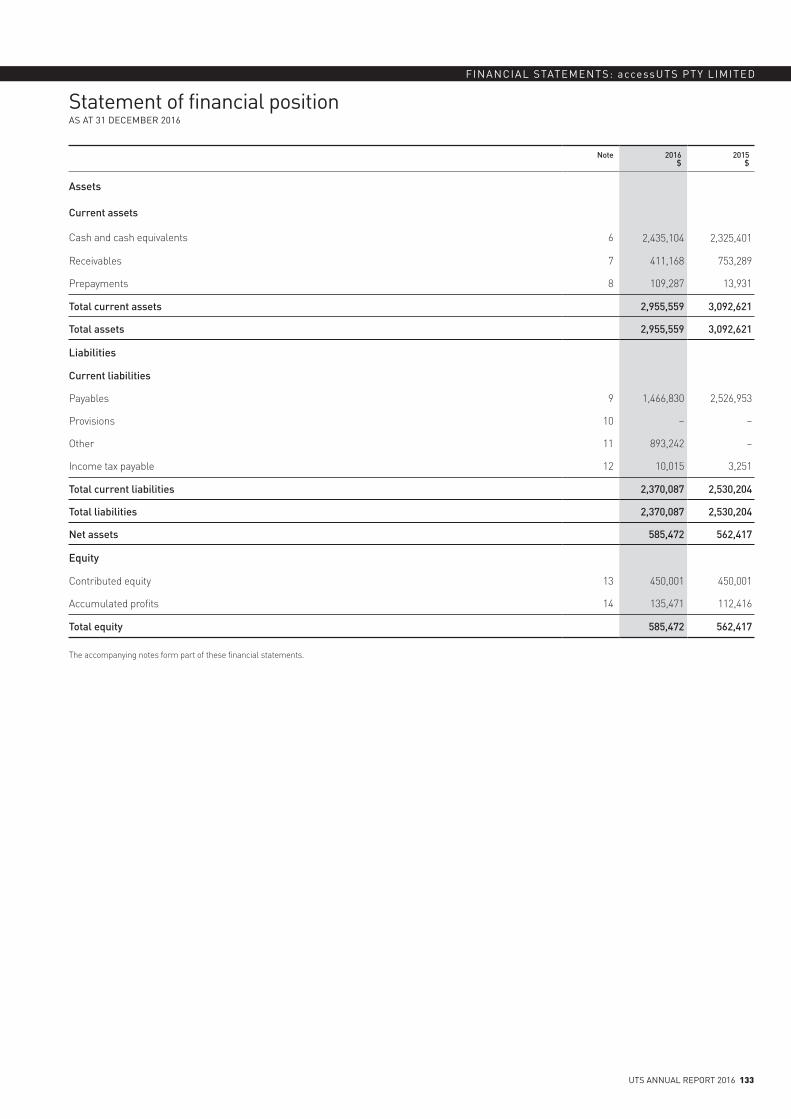
UTS ANNUAL REPORT 2016 133
FINANCIAL STATEMENTS: accessUTS PTY LIMITED
Note 2016$
2015$
Assets
Current assets
Cash and cash equivalents 6 2,435,104 2,325,401
Receivables 7 411,168 753,289
Prepayments 8 109,287 13,931
Total current assets 2,955,559 3,092,621
Total assets 2,955,559 3,092,621
Liabilities
Current liabilities
Payables 9 1,466,830 2,526,953
Provisions 10 – –
Other 11 893,242 –
Income tax payable 12 10,015 3,251
Total current liabilities 2,370,087 2,530,204
Total liabilities 2,370,087 2,530,204
Net assets 585,472 562,417
Equity
Contributed equity 13 450,001 450,001
Accumulated profits 14 135,471 112,416
Total equity 585,472 562,417
The accompanying notes form part of these financial statements.
Statement of financial positionAS AT 31 DECEMBER 2016
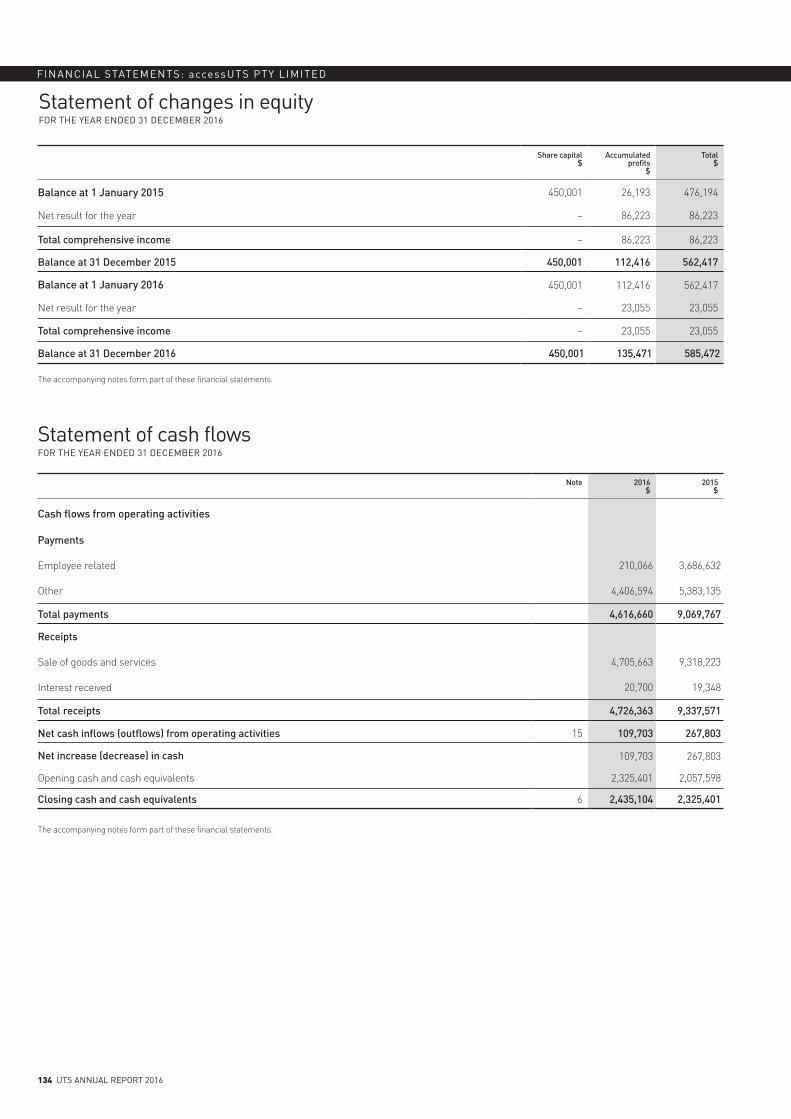
134 UTS ANNUAL REPORT 2016
FINANCIAL STATEMENTS: accessUTS PTY LIMITED
Share capital$
Accumulated profits
$
Total$
Balance at 1 January 2015 450,001 26,193 476,194
Net result for the year – 86,223 86,223
Total comprehensive income – 86,223 86,223
Balance at 31 December 2015 450,001 112,416 562,417
Balance at 1 January 2016 450,001 112,416 562,417
Net result for the year – 23,055 23,055
Total comprehensive income – 23,055 23,055
Balance at 31 December 2016 450,001 135,471 585,472
The accompanying notes form part of these financial statements.
Statement of cash flowsFOR THE YEAR ENDED 31 DECEMBER 2016
Note 2016$
2015$
Cash flows from operating activities
Payments
Employee related 210,066 3,686,632
Other 4,406,594 5,383,135
Total payments 4,616,660 9,069,767
Receipts
Sale of goods and services 4,705,663 9,318,223
Interest received 20,700 19,348
Total receipts 4,726,363 9,337,571
Net cash inflows (outflows) from operating activities 15 109,703 267,803
Net increase (decrease) in cash 109,703 267,803
Opening cash and cash equivalents 2,325,401 2,057,598
Closing cash and cash equivalents 6 2,435,104 2,325,401
The accompanying notes form part of these financial statements.
Statement of changes in equityFOR THE YEAR ENDED 31 DECEMBER 2016
UTS ANNUAL REPORT 2016 135
FINANCIAL STATEMENTS: accessUTS PTY LIMITED
Notes to the financial statementsFOR THE YEAR ENDED 31 DECEMBER 2016
FINANCIAL STATEMENTS: accessUTS PTY LIMITED
1. REPORTING ENTITYaccessUTS Pty Limited is a for-profit company limited by shares and is incorporated and domiciled in Australia and is a wholly owned subsidiary of the University of Technology Sydney. The registered office of accessUTS Pty Limited is level 14, Building 1, 1–9 Broadway, Ultimo NSW 2007.
These financial statements for the year ended 31 December 2016 were authorised for issue in accordance with a resolution of the directors on 12 April 2017.
2. SUMMARY OF SIGNIFICANT ACCOUNTING POLICIES(a) Basis of preparation
These general purpose financial statements have been prepared on an accruals basis, in accordance with applicable accounting standards and other mandatory professional reporting requirements (including Australian Accounting Interpretations), the requirements of the Corporations Act 2001, the Public Finance and Audit Act 1983 and the Public Finance and Audit Regulation 2015.
These financial statements have been prepared on an historical cost basis and are presented in Australian dollars. The accounting policies set out below have been consistently applied to all years presented unless otherwise stated.
(b) Statement of complianceThese financial statements comply with Australian Accounting Standards, including Australian Accounting Interpretations.
(c) Critical accounting estimates and judgementsThe directors evaluate estimates and judgements incorporated into the financial statements based on historical knowledge and best available current information. Estimates assume a reasonable expectation of future events and are based on current trends and economic data, obtained from both external and internal sources.
(d) Goods and Services Tax (GST)Revenue, expenses and assets are recognised net of the amount of GST, except:
> the net amount of GST recoverable from or payable to the taxation authority is included within payables or receivables in the balance sheet
> where the amount of GST is not recoverable from the Australian Taxation Office, in which case the GST is recognised as part of the cost of acquisition of the asset or as part of the expense item, as applicable
> cash flows are presented in the statement of cash flows on a gross basis, except for the GST component of investing and financing activities, which are disclosed as operating cash flows.
(e) RevenueRevenue is recognised to the extent that it is probable that the economic benefits will flow to the entity and the revenue can be reliably measured. Revenue is measured at the fair value of the consideration received or receivable.
Fee revenue
Service fee revenue represents revenue from services provided by the entity and is recognised when the services are provided.
Training course revenue
Training course revenue represents revenue from courses delivered in the period and is recognised when the courses are scheduled to run.
Investment income
Interest income is recognised as it accrues.
Asset sales
The net proceeds from the sale of assets is included as revenue of the entity. The profit or loss on disposal of assets is brought to account at the date an unconditional contract of sale occurs.
Other revenue
Other revenue is brought to account when it becomes due and receivable.
(f) Income taxIncome taxes are accounted for using the comprehensive balance sheet liability method whereby:
> the tax consequences of recovering (settling) all assets (liabilities) are reflected in the financial statements
> current and deferred tax is recognised as income or expense except to the extent that the tax relates to equity items or to a business combination
> a deferred tax asset is recognised to the extent that it is probable that future taxable profit will be available to realise the asset
> deferred tax assets and liabilities are measured at the tax rates that are expected to apply to the period when the asset is realised or the liability settled.
(g) Cash and cash equivalentsFor the purposes of presentation in the statement of cash flows, cash and cash equivalents includes deposits at call that are readily convertible to cash on hand and that are used in the cash management function on a day-to-day basis, net of any outstanding bank overdrafts.
(h) Trade and other receivablesTrade receivables, which generally have 30 day terms, are recognised at fair value less an allowance for any uncollectible amounts.
Collectability of trade receivables is reviewed on an ongoing basis. Debts that are known to be uncollectible are written off when identified. An allowance for doubtful debts is raised when there is objective evidence that the entity will not be able to collect the debt.
136 UTS ANNUAL REPORT 2016
FINANCIAL STATEMENTS: accessUTS PTY LIMITED
Notes to the financial statementsFOR THE YEAR ENDED 31 DECEMBER 2016
2. SUMMARY OF SIGNIFICANT ACCOUNTING POLICIES (CONTINUED)(i) Investments
Investments are valued either at cost less amounts written off for permanent diminution in the value of the investments, or at directors’ valuation. Dividends and interest are brought to account when received.
(j) Trade and other payablesLiabilities for trade creditors and other amounts are carried at cost, which is the fair value of the consideration to be paid in the future for goods and services received, whether or not billed to the entity. These amounts represent liabilities for goods and services provided to the entity prior to the end of the financial year and which are unpaid. The amounts are unsecured and are usually paid within 30 days of recognition.
Payables to related parties are carried at the principal amount. Interest, when charged by the lender, is recognised as an expense on an accruals basis.
(k) Other liabilities — income received in advanceAmounts received from clients are recognised as income in advance to the extent that they relate to work to be conducted or services to be performed in the future.
(l) Employee benefits and other provisions
Salaries and wages, annual leave, sick leave and on costs
Liabilities for salaries and wages (including non-monetary benefits), annual leave and paid sick leave that are due to be settled within 12 months after the end of the period in which the employees render the service are recognised and measured in respect of employees’ services up to the reporting date at undiscounted amounts based on the amounts expected to be paid when the liabilities are settled.
Unused non-vesting sick leave does not give rise to a liability as it is not considered probable that sick leave taken in the future will be greater than the benefits accrued in the future.
The outstanding amounts of payroll tax, workers’ compensation insurance premiums and fringe benefits tax, which are consequential to employment, are recognised as liabilities and expenses where the employee benefits to which they relate have been recognised.
(m) Loans and borrowingsAll loans are measured at the principal amount.
(n) New and revised Australian Accounting Standards
Where new or revised accounting standards and interpretations have been published that are not mandatory for 31 December 2016 reporting period, accessUTS Pty Limited has not exercised the right to early adopt any such accounting standard.
(o) Translation of foreign currency transactionsOn initial recognition in Australian currency, transactions in foreign currencies are recorded by applying the rate of exchange as at the date of the transaction.
Exchange differences arising on the settlement of monetary items or on translating monetary items at rates different from those at which they were initially translated during the period, or in the previous financial statements, are recognised in profit or loss in the period in which they arise.
At each balance date, foreign currency monetary items are reported using the closing rate on the balance date.
2016$
2015$
3. EXPENSES EXCLUDING LOSSES
(a) Employee-related expenses
Directors fees 1,500 7,000
Contractors 208,943 3,336,784
210,443 3,343,784
(b) Other operating expenses
Auditor’s remuneration
> audit of the financial statements 23,415 19,611
Consulting fees 2,485,146 4,362,512
Service level agreement — Commercial Services Unit 735,719 883,797
General and administrative expenses 608,046 102,758
3,852,326 5,368,678
UTS ANNUAL REPORT 2016 137
FINANCIAL STATEMENTS: accessUTS PTY LIMITED
Notes to the financial statementsFOR THE YEAR ENDED 31 DECEMBER 2016
2016$
2015$
4. REVENUE
(a) Revenue from services
Consulting fees 1,751,132 7,634,427
Training courses 2,337,530 1,151,780
4,088,662 8,786,207
(b) Investment revenue
Interest received or receivable 20,700 19,348
20,700 19,348
(c) Gain/(loss) on foreign exchange
Foreign exchange gains/(losses) 786 (1,341)
786 (1,341)
5. INCOME TAX EXPENSE
The income tax expense provided in the accounts is calculated as follows:
> tax on operating profit/(loss) at 30% 14,214 27,526
Add/(less)
> current year temporary difference not brought to account previously 10,110 (21,997)
> tax losses not previously tax effected — recouped this year – –
Income tax expense 24,324 5,529
Deferred tax assets/(liabilities) have not been recognised in the statement of financial position in respect of:
> deductible temporary differences 18,335 36,186
6. CASH AND CASH EQUIVALENTS
Cash at bank 2,014,369 1,911,363
Cash on deposit 420,735 414,038
2,435,104 2,325,401
7. RECEIVABLES
Current
Trade and other receivables 344,524 657,175
Allowance for doubtful accounts (10,644) (3,575)
Receivable from parent entity (unsecured) – 4,488
GST refundable 77,288 95,201
411,168 753,289
8. PREPAYMENTS
Current
Prepayments 109,287 13,931
109,287 13,931
138 UTS ANNUAL REPORT 2016
FINANCIAL STATEMENTS: accessUTS PTY LIMITED
Notes to the financial statementsFOR THE YEAR ENDED 31 DECEMBER 2016
2016$
2015$
9. PAYABLES
Current
Trade creditors 50,172 43,653
Accrued expenses 316,948 91,888
Amounts payable to parent entity 1,010,815 1,476,590
Loan from parent entity (unsecured) 35,000 35,000
Other payables 53,895 879,822
1,466,830 2,526,953
Loan from parent entity
The loan from the parent entity is unsecured, interest-free and repayable on demand.
10. PROVISIONS
Current
Provision for annual leave – –
– –
11. OTHER CURRENT LIABILITIES
Current
Income received in advance 893,242 –
893,242 –
12. INCOME TAX PAYABLE
Income tax payable 10,015 3,251
10,015 3,251
13. CONTRIBUTED EQUITY
Issued and paid up capital
Ordinary shares fully paid 450,001 450,001
Movements in shares on issue
Issued capital at the beginning of the year 450,001 450,001
Capital issued during the year – –
Issued capital at the end of the year 450,001 450,001
14. ACCUMULATED PROFITS
Accumulated profits / (losses) at the beginning of the year 112,416 26,193
Net profit attributable to the member 23,055 86,223
Accumulated profits at the end of the year 135,471 112,416
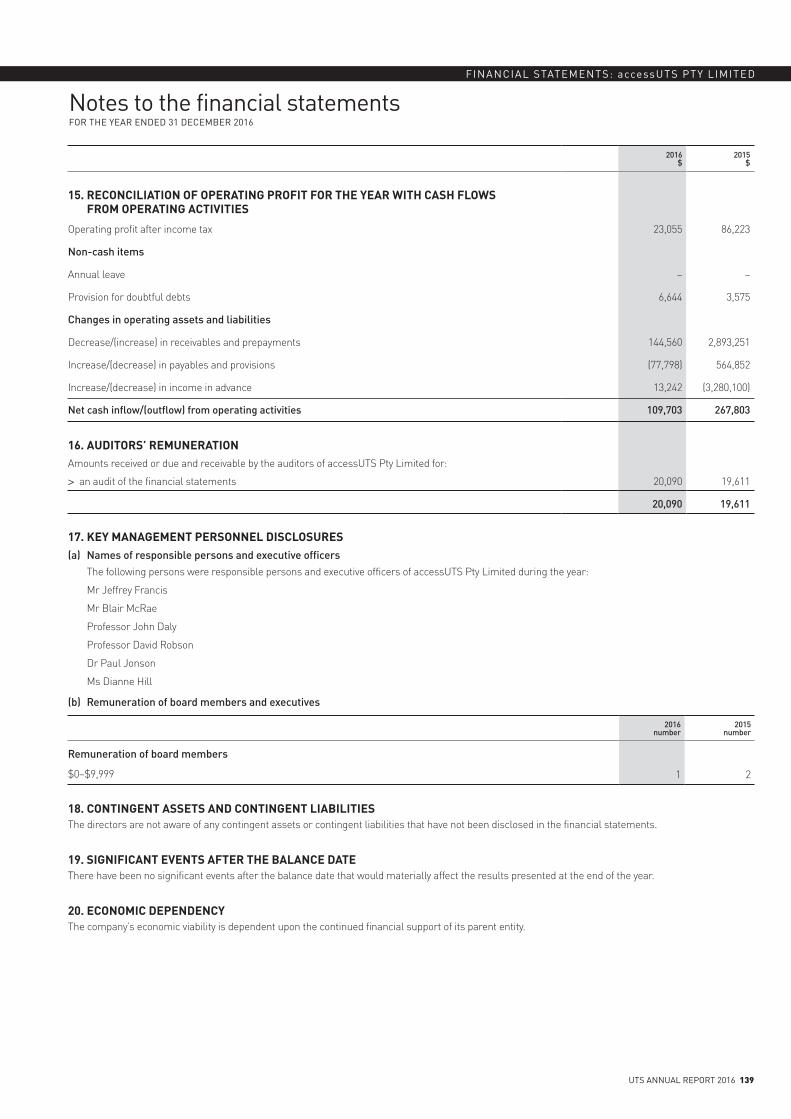
UTS ANNUAL REPORT 2016 139
FINANCIAL STATEMENTS: accessUTS PTY LIMITED
Notes to the financial statementsFOR THE YEAR ENDED 31 DECEMBER 2016
2016$
2015$
15. RECONCILIATION OF OPERATING PROFIT FOR THE YEAR WITH CASH FLOWS FROM OPERATING ACTIVITIES
Operating profit after income tax 23,055 86,223
Non-cash items
Annual leave – –
Provision for doubtful debts 6,644 3,575
Changes in operating assets and liabilities
Decrease/(increase) in receivables and prepayments 144,560 2,893,251
Increase/(decrease) in payables and provisions (77,798) 564,852
Increase/(decrease) in income in advance 13,242 (3,280,100)
Net cash inflow/(outflow) from operating activities 109,703 267,803
16. AUDITORS’ REMUNERATIONAmounts received or due and receivable by the auditors of accessUTS Pty Limited for:
> an audit of the financial statements 20,090 19,611
20,090 19,611
17. KEY MANAGEMENT PERSONNEL DISCLOSURES(a) Names of responsible persons and executive officers
The following persons were responsible persons and executive officers of accessUTS Pty Limited during the year:
Mr Jeffrey Francis
Mr Blair McRae
Professor John Daly
Professor David Robson
Dr Paul Jonson
Ms Dianne Hill
(b) Remuneration of board members and executives
2016 number
2015 number
Remuneration of board members
$0–$9,999 1 2
18. CONTINGENT ASSETS AND CONTINGENT LIABILITIES The directors are not aware of any contingent assets or contingent liabilities that have not been disclosed in the financial statements.
19. SIGNIFICANT EVENTS AFTER THE BALANCE DATEThere have been no significant events after the balance date that would materially affect the results presented at the end of the year.
20. ECONOMIC DEPENDENCYThe company’s economic viability is dependent upon the continued financial support of its parent entity.
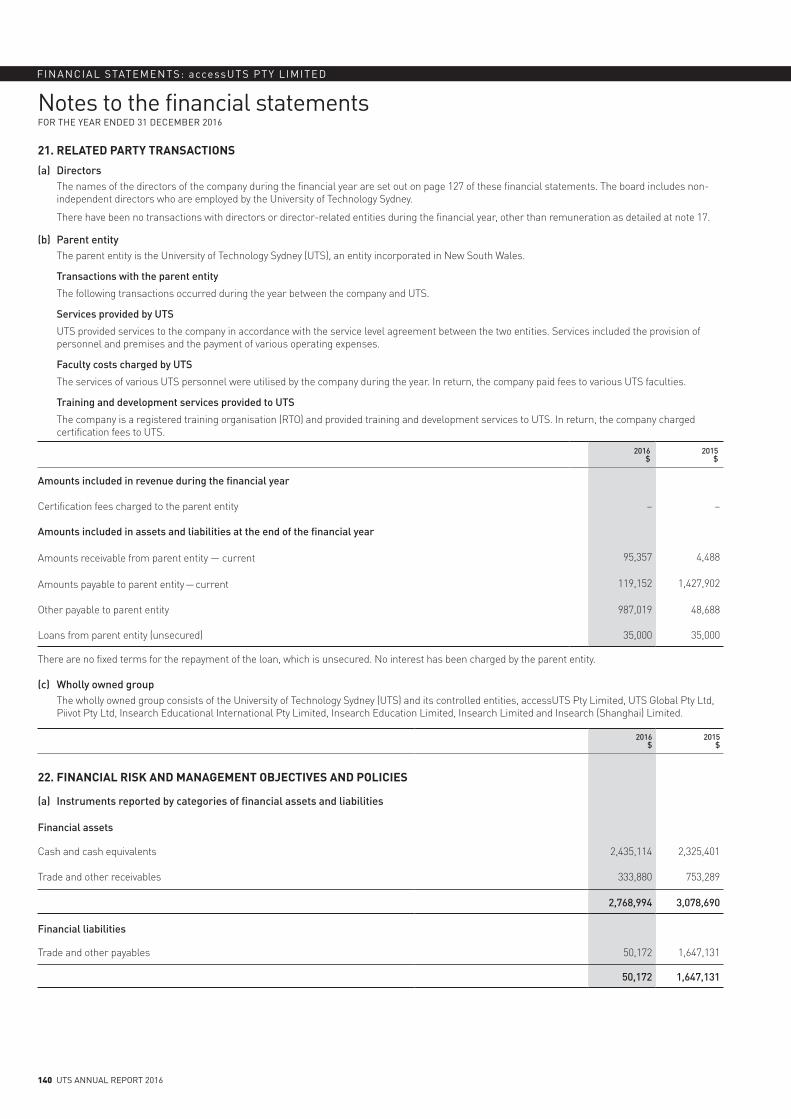
140 UTS ANNUAL REPORT 2016
FINANCIAL STATEMENTS: accessUTS PTY LIMITED
Notes to the financial statementsFOR THE YEAR ENDED 31 DECEMBER 2016
21. RELATED PARTY TRANSACTIONS
(a) DirectorsThe names of the directors of the company during the financial year are set out on page 127 of these financial statements. The board includes non-independent directors who are employed by the University of Technology Sydney.
There have been no transactions with directors or director-related entities during the financial year, other than remuneration as detailed at note 17.
(b) Parent entity The parent entity is the University of Technology Sydney (UTS), an entity incorporated in New South Wales.
Transactions with the parent entity
The following transactions occurred during the year between the company and UTS.
Services provided by UTS
UTS provided services to the company in accordance with the service level agreement between the two entities. Services included the provision of personnel and premises and the payment of various operating expenses.
Faculty costs charged by UTS
The services of various UTS personnel were utilised by the company during the year. In return, the company paid fees to various UTS faculties.
Training and development services provided to UTS
The company is a registered training organisation (RTO) and provided training and development services to UTS. In return, the company charged certification fees to UTS.
2016$
2015$
Amounts included in revenue during the financial year
Certification fees charged to the parent entity – –
Amounts included in assets and liabilities at the end of the financial year
Amounts receivable from parent entity — current 95,357 4,488
Amounts payable to parent entity — current 119,152 1,427,902
Other payable to parent entity 987,019 48,688
Loans from parent entity (unsecured) 35,000 35,000
There are no fixed terms for the repayment of the loan, which is unsecured. No interest has been charged by the parent entity.
(c) Wholly owned groupThe wholly owned group consists of the University of Technology Sydney (UTS) and its controlled entities, accessUTS Pty Limited, UTS Global Pty Ltd, Piivot Pty Ltd, Insearch Educational International Pty Limited, Insearch Education Limited, Insearch Limited and Insearch (Shanghai) Limited.
2016$
2015$
22. FINANCIAL RISK AND MANAGEMENT OBJECTIVES AND POLICIES
(a) Instruments reported by categories of financial assets and liabilities
Financial assets
Cash and cash equivalents 2,435,114 2,325,401
Trade and other receivables 333,880 753,289
2,768,994 3,078,690
Financial liabilities
Trade and other payables 50,172 1,647,131
50,172 1,647,131
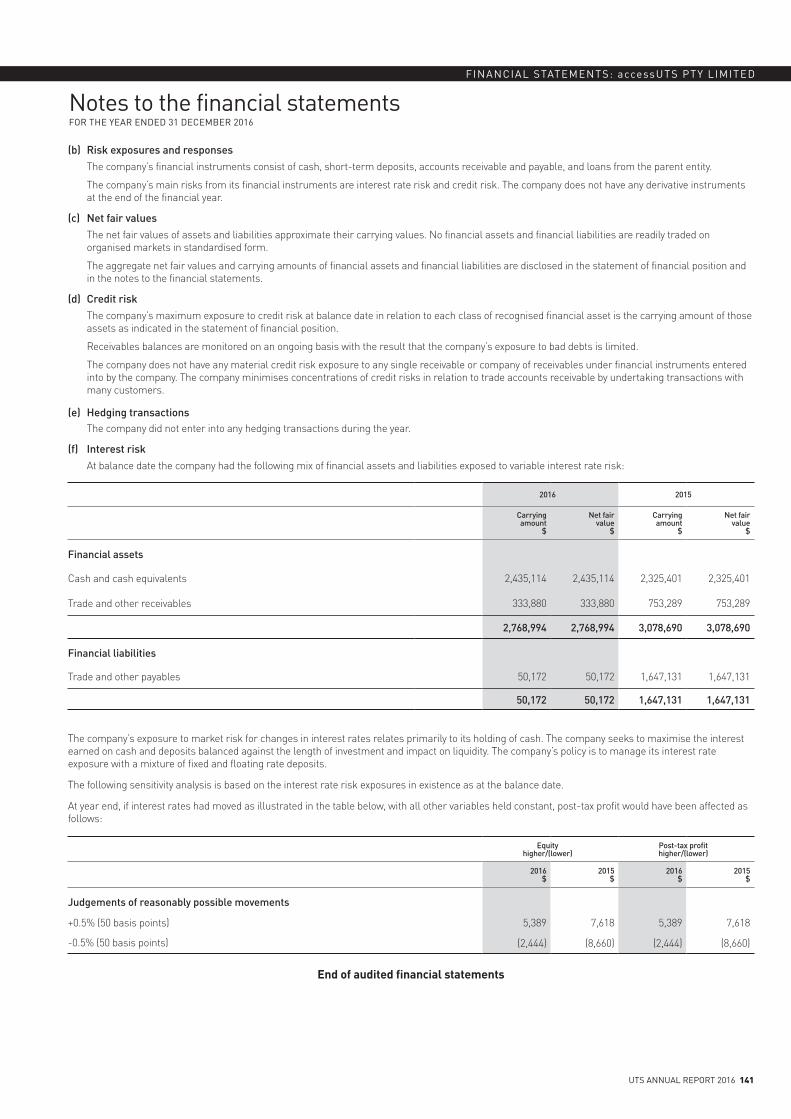
UTS ANNUAL REPORT 2016 141
FINANCIAL STATEMENTS: accessUTS PTY LIMITED
Notes to the financial statementsFOR THE YEAR ENDED 31 DECEMBER 2016
(b) Risk exposures and responsesThe company’s financial instruments consist of cash, short-term deposits, accounts receivable and payable, and loans from the parent entity.
The company’s main risks from its financial instruments are interest rate risk and credit risk. The company does not have any derivative instruments at the end of the financial year.
(c) Net fair valuesThe net fair values of assets and liabilities approximate their carrying values. No financial assets and financial liabilities are readily traded on organised markets in standardised form.
The aggregate net fair values and carrying amounts of financial assets and financial liabilities are disclosed in the statement of financial position and in the notes to the financial statements.
(d) Credit riskThe company’s maximum exposure to credit risk at balance date in relation to each class of recognised financial asset is the carrying amount of those assets as indicated in the statement of financial position.
Receivables balances are monitored on an ongoing basis with the result that the company’s exposure to bad debts is limited.
The company does not have any material credit risk exposure to any single receivable or company of receivables under financial instruments entered into by the company. The company minimises concentrations of credit risks in relation to trade accounts receivable by undertaking transactions with many customers.
(e) Hedging transactionsThe company did not enter into any hedging transactions during the year.
(f) Interest riskAt balance date the company had the following mix of financial assets and liabilities exposed to variable interest rate risk:
2016 2015
Carrying amount
$
Net fair value
$
Carrying amount
$
Net fair value
$
Financial assets
Cash and cash equivalents 2,435,114 2,435,114 2,325,401 2,325,401
Trade and other receivables 333,880 333,880 753,289 753,289
2,768,994 2,768,994 3,078,690 3,078,690
Financial liabilities
Trade and other payables 50,172 50,172 1,647,131 1,647,131
50,172 50,172 1,647,131 1,647,131
The company’s exposure to market risk for changes in interest rates relates primarily to its holding of cash. The company seeks to maximise the interest earned on cash and deposits balanced against the length of investment and impact on liquidity. The company’s policy is to manage its interest rate exposure with a mixture of fixed and floating rate deposits.
The following sensitivity analysis is based on the interest rate risk exposures in existence as at the balance date.
At year end, if interest rates had moved as illustrated in the table below, with all other variables held constant, post-tax profit would have been affected as follows:
Equity higher/(lower)
Post-tax profit higher/(lower)
2016 $
2015 $
2016 $
2015 $
Judgements of reasonably possible movements
+0.5% (50 basis points) 5,389 7,618 5,389 7,618
-0.5% (50 basis points) (2,444) (8,660) (2,444) (8,660)
End of audited financial statements
AcknowledgementsCompliance
The report was written to comply with relevant legislation including the Annual Reports (Statutory Bodies) Act 1984 (NSW) and the Annual Reports (Statutory Bodies) Regulation 2015 (NSW).
In its structure and writing we have striven for best practice reporting, taking into account annual reporting guidelines from state and national annual reporting awards and recommendations from the NSW Treasury and the Audit Office of New South Wales.
Availability
The university’s annual reports are available in Portable Document Format (PDF) from the UTS website:
www.uts.edu.au
They are also available by request to:
Editor Governance Support Unit University of Technology Sydney PO Box 123 Broadway NSW 2007
Acknowledgements
The UTS Annual Report 2016 was produced by the Governance Support Unit, Division of the Deputy Vice-Chancellor and Vice-President (Corporate Services).
Editor: Bridget Shipstone (Governance Support Unit)
Design: Claudia Iacovella (Marketing and Communication Unit)
Printer: UTS Printing Services
Paper: Precision
ABN 77 257 686 961
ContactsPostal address
University of Technology Sydney PO Box 123 Broadway NSW 2007 Australia +61 2 9514 2000
www.uts.edu.au
Street address
University of Technology Sydney City campus 15 Broadway Ultimo NSW 2007
UTS Student Centres
1300 ask UTS (1300 275 887)
+61 2 9514 1222
www.ask.uts.edu.au
UTS International
1800 774 816 (within Australia)
+61 3 9627 4816 (international)
CRICOS provider code 00099F
Access
UTS is open for general business from 9am to 5pm weekdays.
Many sections of the university are open at other times.
*Times Higher Education 150 Under 50 rankings, 2016.QS World University Rankings Top 50 Under 50, 2016–2017.
UTS RANKEDAUSTRALIA’S #1
YOUNG* UNI
1NO.

ISSN 1031–8690 (PRINT) ISSN 1837–0209 (ONLINE)
ISSN 1031–8690 (PRINT) ISSN 1837–0209 (ONLINE)
The UTS Annual Report 2016 provides a record of the university’s performance and activities for the year. It is presented in two volumes: volume one is a review of our operations and statutory reporting; and volume two contains our financial statements.
ISSN 1031–8690 (PRINT) ISSN 1837–0209 (ONLINE)