utilizing layer of protection analysis (lopa) in...
TRANSCRIPT

Utilizing Layer of Protection Analysis (LOPA) in Verification of Safety Integrity Level (SIL) of Instrumented System
by
Wan Mohd Fakhirin Bin Mohamed Hassan
Dissertation submitted in partial fulfilment of
the requirements for the
Bachelor of Engineering (Hons)
(Chemical Engineering)
JULY 2010
Universiti Teknologi PETRONAS Bandar Seri Iskandar 31750 Tronoh Perak Darul Ridzuan

CERTIFICATION OF APPROVAL
Utilizing Layer of Protection Analysis (LOPA) in Verification of Safety Integrity
Level (SIL) of Instrumentation System
by
Wan Mohd Fakhirin Bin Mohamed Hassan
A project dissertation submitted to the
Chemical Engineering Programme
Universiti Teknologi PETRONAS
in partial fulfilment of the requirement for the
BACHELOR OF ENGINEERING (Hons)
(CHEMICAL ENGINEERING)
Approved by, _____________________ (DR. MOHANAD M.A.A EL-HARBAWI)
UNIVERSITI TEKNOLOGI PETRONAS
TRONOH, PERAK
July 2010

CERTIFICATION OF ORIGINALITY
This is to certify that I am responsible for the work submitted in this project, that the
original work is my own except as specified in the references and acknowledgements,
and that the original work contained herein have not been undertaken or done by
unspecified sources or persons.
___________________________________________ WAN MOHD FAKHIRIN BIN MOHAMED HASSAN

i
ABSTRACT
The project is aimed to utilize layer of protection analysis (LOPA) to verify safety
integrity level (SIL) of safety instrumented system. Safety instrumented system (SIS) is
the last resort in case of emergency happened in plant. Determining the specific safety
requirement of safety systems is a vital part to ensure accidents are prevented. Previous
study is carried out till classification of Safety Integrity Levels (SIL) for hazardous
installation by using the risk assessment techniques. In this study, the focus will be on
SIL classification and verification in safety instrumented system (SIS).
The program is developed using Microsoft Excel based on established
methodology found in the literatures. Thorough literature surveys are expected in order
to gather appropriate SIL verification information which will further integrate in existing
spreadsheet. The program is tested using two case studies related to process plant
industries. The results obtained show the sufficiency of the protection system and
provide risk control strategy including number of SIL required in case of the protection
is insufficient. If the protection system is sufficient, it will ensure the design is the
optimum. Reliability and accurateness of the result are vital due to main function of the
program is to assess and validate the SIS.
The application is used either in designing the SIS or in auditing the effectiveness
of the installed SIS. The verification of assigned SIL to a particular Safety Instrumented
Function (SIF) is still new compared to SIL classification. Based on industrial
perspective, there is no established method on verification of an installed SIS. Most
scenarios can be catered by enhancing the existing design rather than adding safety
protection layer.
Future study shall be continued to improve the relevancy and reliability of the
tool by integrating more parameters in assessing a case.

ii
ACKNOWLEDGEMENT
First of all, I would like to take this opportunity to praise to God, the Most
Merciful and Most Grateful for His Permission so that I am able to finish my
dissertation. Millions of thanks to my kind supervisor, Dr. Mohanad M.A.A El-Harbawi
for his help and advice upon accomplishment of my final year project. I would like to
thank to those who help me in contributing the idea and useful feedbacks either directly
or indirectly to improve my thesis.

iii
TABLE OF CONTENT
ABSTRACT……………………………………………………………………………… i ACKNOWLEDMENT…………………………………………………………………... ii TABLE OF CONTENT………………………………………………………………… iii LIST OF FIGURES……………………………………………………………………... iv
LIST OF TABLES………………………………………………………………………. v
CHAPTER 1:INTRODUCTION…………………………………………………………1
1.1 Project' s Background…. ...................................................................................... 1
1.2 Problem Statement…. .......................................................................................... 2
1.3 Objective…. ......................................................................................................... 2
1.4 Scope of the Project…. ......................................................................................... 3
1.4.1 Relevancy of the Project… ............................................................................ 3
1.4.2 Feasibility of the Project within the Scope and Time Frame…… ................... 3
CHAPTER 2 :LITERATURE REVIEW… .................................................................... 4
2.1. Layer of Protection Analysis… ........................................................................... 4
2.2. Limitation of LOPA method…. ........................................................................... 6
2.3 Safety Integrity Level (SIL)… .............................................................................. 8
2.4 SIL and SIS Development… .............................................................................. 10
CHAPTER 3 : METHODOLOGY… ........................................................................... 15
3.1 Method of SIL Classification… .......................................................................... 15
3.2 Method of SIL evaluation on SIS… .................................................................... 18
3.3 Tool Development…. ......................................................................................... 25
CHAPTER 4: RESULT AND DISCUSSION ….......................................................... 26
4.1 SIS Evaluation… ................................................................................................ 26
CHAPTER 5: CONCLUSION AND RECOMMENDATION.. .................................... 36
REFERENCE…. ......................................................................................................... 37

iv
LIST OF FIGURES
Figure 1: Layer of defense against possible accidents 4
Figure 2: Comparison of LOPA and event tree analysis 5
Figure 3: Spectrum of tool for risk-based decision making 7
Figure 4: Event tree analysis of pressure vessel relief valve failure 11
Figure 5: Result from the spreadsheet 12
Figure 6: Event tree analysis of pump seal failure 13
Figure 7: Result yields from spreadsheet 13
Figure 8: Relationship between SIL, SIF and SIS 17
Figure 9: Consequence severity dropdown list 19
Figure 10: Initiating event frequency 19
Figure 11: Interface of the system where list of IPLs are available 20
Figure 12: Effectiveness of protection 21
Figure 13: Reduced frequency 22
Figure 14: Risk control strategy interface 23
Figure 15: Flow chart of SIS evaluation 25
Figure 16: Process Flow diagram of absorber section 26
Figure 17: Spreadsheet interface and result of case 1 28
Figure 18: Revamped P&ID 30
Figure 19: Chemical reactor with alarm and inlet feed solenoid 31
Figure 20: Spreadsheet interface and result of case 2 32
Figure 21: Semi-quantitative guide for consequence category selection
based on size of release 34
Figure 22: Semi-quantitative guide for consequence category selection
according to consequence on production and facilities. 35

v
LIST OF TABLES
Table 1: PFD of IPLs in example 1 11
Table 2: PFD of IPLs in example 2 12
Table 3: Risk tolerability of initiating event 14
Table 4: Safety Integrity Levels and corresponding PFD and RRF 15
Table 5: Definitions of SILs for High Demand/ Continuous Mode 17
Table 6: Threshold frequency numbers for each consequence category 18
Table 7: Probability of Failure on demand indexes 21
Table 8: Determination of required SIL from SADD number 23
Table 9: Comment for each condition 24
Table 10: HAZOP study 27
Table 11: Input data for case 1 27
Table 12: Input data of case 2 31

1
CHAPTER 1
INTRODUCTION
1.1 Project’s Background
Accidents at any plant either offshore or onshore may result in casualties and economic
loss. Safety instrumented system (SIS) is the last automatic protection system in case of
emergency happened in plant. Determining the specific safety requirement of safety
systems is vital part in ensuring that accidents are prevented. In the 1990s the standards
IEC 61508 and IEC 61511 emerged and the need for documenting compliance with
these in a consistent manner led to the introduction of the layer of protection analysis
(LOPA) (Lassen, 2008).
LOPA method is being used to determine if there are sufficient layers of protection
against an accident scenario. A scenario may require one or many protection layer
depending on complexity and potential severity of the process. For a given scenario,
only one layer must work successfully for the consequence to be prevented. (CCPS,
2001). Due to no layer is perfectly effective, sufficient protection layer must be
provided to minimize the risk of accident tolerable.
In this project, the framework of LOPA method is combined with framework of safety
integrity level (SIL) to assess the effectiveness of SIS. The SIL is the key design
parameter specifying the amount of risk reduction that the safety equipment is required
to achieve for a particular function in question. It is based on probability of failure on
demand (PFD) for a specific safety instrumentation function (SIF) in safety instrumented
system. The suitable SIL assigned is inline with the concept of as low as reasonably
practicable (ALARP) which it reduce the risk to a tolerable level.

2
1.2 Problem statement Various methods in selecting safety integrity levels (SILs) have been proposed and
adopted by industry. The result of using poor methods to select SILs is typically either
an overdesigned or an under designed safety instrumented system (SIS). In today
practice, evaluation and verification of SIL on SIS is rarely being applied. SIL
classification is only performed during design phase. This situation has lead to
decrement of independent protection layer (IPL)’s audit-ability which violating the
IPL’s rule. Other problem is lack of a comprehensive discussion of SIL verification
compared to SIL classification. Therefore, this study will focus on classification and
verification of SIL on SIS which it is hoped that it will be the initiating step for further
development of proper SIL verification method. However, the subject is still new since
the literature of the subject is small in amount and moreover is scattered among various
periodicals and symposia. Hence, a rigorous literature reviews and discussion with
expert from industries are expected throughout the study.
1.3 Objective The objectives of this study are listed as follows:
• To utilize Layer of Protection Analysis (LOPA) method in the verification of Safety
Integrity Level (SIL) of instrumentation system.
• To develop framework of LOPA and SIL including a common terminology and
worksheet.
• To implement LOPA and SIL procedures in a practical case study.

3
1.4 Scope of the Project
The scope of study will involve the utilization LOPA method in the determining the
safety integrity level (SIL) of instrumented system. The project will focus on
combining the framework of SIL and LOPA and implement both procedures in a
practical case study. Apart from that, the study also will focus on classification and
verification of SIL on Safety Instrumented System (SIS). In this project, the case
study related to one of the oil and gas industries will be discussed.
1.4.1 Relevancy of the Project
The purpose of this project is to combine the framework of LOPA and SIL and
implement both of the procedure in industry case study. The subject is still new
since the literature of the subject is small in amount and moreover is scattered
among various periodicals and symposia. Hence, a comprehensive discussion of
the process of selecting SILs is a need and the application of the combination
between LOPA and SIL method will be shown in the study.
1.4.2 Feasibility of the Project within the Scope and Time Frame
This project will start by collecting the reading material such as the books,
journals, related website, thorough discussion with supervisor and collaboration
from industrial practitioners. At the end of Final Year Project (FYP) 1, it is
expected that the literature survey on LOPA approaches have been carried out
and understand all the basic concept of the LOPA approach. Meanwhile, for
Final Year Project (FYP) 2, the study will focus on implementing the approach
by collecting the information and case study from industry.

4
CHAPTER 2
LITERATURE REVIEW
2.1. Layer of Protection Analysis
Layer of protection analysis is a semi-quantitative risk analysis technique that is
applied following qualitative hazard identification tool such as HAZOP. LOPA is
described as semi-qualitative due to the technique does use numbers and generate a
numerical risk estimate. The primary purpose of LOPA is to determine if there are
sufficient layers of protections against an accident scenario (CCPS, 2001).
.
Figure 1: Layer of defense against possible accidents (Lassen, 2008).

5
Based on Figure 1, many type of protection layer are possible. A scenario may require
one or many protection layers depending on the process complexity and potential
severity of a consequence (CCPS, 2001). Theoretically, only one layer is enough to
prevent the consequence. However in reality, no layer is perfectly effective. Therefore,
sufficient protection layer must be provided to minimize the risk of accident.
For LOPA, the term Independent protection layer (IPL) is used rigorously to describe
the protection layer. An IPL must be effective in reducing risk and must be auditable
(Wei et al., 2008). Each layer should be analyzed to determine its basic independence
from the initiating event and from the other protection layers. A probability of failure on
demand (PFD) is assigned to an IPL to account for its reliability to respond to system
demand.
LOPA is limited to evaluating a single cause-consequence pair as a scenario. In this
context, a LOPA scenario represents one path. Normally the path to the worst
consequence is selected via an event tree. Figure 2 shows an event tree for a given
initiating event. The limitation of LOPA method will be further discussed in next
section.
Figure 2: Comparison of LOPA and event tree analysis (CCPS, 2001).

6
According to Marszal and Scharpf, (2002), LOPA can be viewed as a special type of
event tree analysis (ETA) as illustrated in Figure 2, which has the purpose of
determining the frequency of unwanted consequence that can be prevented by a set of
protection layers. As mentioned before, the approach evaluates a worst-case scenario
where all the protection layers must fail in order for the consequence to occur. Assuming
the layers are determined to be independent, the final mitigated event frequency, f iC , is
calculated by multiplying the initial cause frequency, f i1, by the PFDs of the individual
IPLs, PFDij , as shown in Equation 1 (CCPS, 2001).
𝑓𝑓iC = f iC ×∏ 𝑃𝑃𝑃𝑃𝑃𝑃ij
𝑗𝑗𝑗𝑗=𝑖𝑖
(1)
2.2. Limitation of LOPA method
It is important to fully understand the limitation of the selected approach to ensure the
LOPA works best and delivers accurate and reliable result. LOPA is limited to
evaluating a single-cause consequence pair as a scenario. A method such as fault tree or
event tree analysis is more suitable in case of more detailed and complex issues. Besides
that, LOPA may be inappropriate for a very high consequence event according to Figure
3. Based on ANSI /ISA S84.01, if the consequence estimation is too severe or the
likelihood too aggressive, the final selected Safety Integrity Level may be too high
which result in an over designed and over costly Safety Instrument System (SIS). The
topic will be further explained in next chapter.

7
Figure 3: Spectrum of tool for risk-based decision making (CCPS, 2001).
Moreover, the LOPA breaks down with human initiated events covered by human
initiated safeguard with little or no equipment intervention (equipment failure,
equipment sensing, equipment activated functions) (PETRONAS Group Technology
Solution, 2009). Human errors are very difficult to quantify and can be easily extend
outside the capabilities of limited database driven methodology such as LOPA. It works
best when the scenario being evaluated is dominated by equipment/instrument failures,
sensors and logic driven field element with little or no human intervention. Another
caution is to avoid incorporating an IPL failure into the initiating event frequency. As
described in (CCPS, 2001) it will jeopardize the PFD for a human IPL.

8
2.3 Safety Integrity Level (SIL) The concept of safety integrity levels (SILs) was introduced during the development of
BS EN 61508 (BSI 2002) as a measure of the quality or dependability of a system which
has a safety function- a measure of the confidence with which the system can be
expected to perform that function (Gulland, 2004). In other word, SIL is a way to
indicate the tolerable failure of a particular safety function. The method of SIL
classification is described in next chapter.
There are several people developed LOPA application. For example Markowski and
Mannan, (2009) have developed pfLOPA tool for pipeline industries. The fuzzy piping
risk assessments enable a better pipelines risk assessment output compare to classical
LOPA in term of incident scenario risk and appropriate selection and assessment of layer
protection. Wei et al., (2009) have developed a simplified semi-quantitative risk analysis
model using LOPA to evaluate a highly reactive process and furthermore it illustrates
the benefits of risk assessment to follow HAZOP hazard analysis. Guo and Yang (2007)
developed a simple reliability block diagram (RBD) method for safety integrity
verification. The RBD analysis is carried out to compute the PFDavg of voted group and
it yield the result that is accordance with those in IEC 61508-6. This method can be
applied to the quantitative SIL verification. Besides, it helps those take IEC 61508-6 as
their guidance.
On the other hand, Kosmowski, (2006) have proposed a formal method to describe web
applications by means of process algebra which can be automatically verified by a
model checker. Andrews and Bartlett, (2005) introduced a branching search approach.
The approach has proven to be effective for High Integrity Protection System (HIPS)
safety system optimization. This method shows potential for application to a wider range
of problem. According to Mannan et al., (2004), using point values in calculating the
overall system safety availability or SIL may lead result in misleading evaluation of SIL
of an SIS. In the paper, they proposed practical and efficient procedures to deal with data
uncertainty in determining SIL for an SIS and identify the inputs that may lead to a

9
change in the estimation of SIL. This methodology will guide SIS designers and process
hazard analysts toward a more accurate SIL estimation and avoid misleading results due
to data uncertainty.
Stavrianidis and Bhimavarapu, (1998) have discussed two performance safety standards
(ANSI/ISA S84.01 IEC d61508). In order to comply to the standard requires a hazards
and risk analysis to establish the safety requirements for safety instrumented functions in
terms of SIL. The identified safety instrumented functions were then conceptually
integrated into an SIS.

10
2.4 SIL and SIS Development The concept of SIL was initially introduced during the development of BS EN 61508
(BSI 2002) as a measure of the quality or dependability of a system which has a safety
function.
Previous study completed until determination of scenario frequencies and making risk
decision (SIL selection) where SIL is determined using LOPA method which follows 6
steps shown below:
Step 1: Estimating Consequences and Severity
Step 2: Developing Scenarios
Step 3: Identifying Initiating Event Frequency
Step 4: Identifying Related IPLs
Step 5: Determining Scenario Frequency
Step 6: Making Risk Decision. Determine SIL
The scenarios or sequence of events are developed using event tree analysis from
initiating event till results in an undesirable outcomes. Figure 4 is the example of the
event tree developed from previous study by Zatil, (2009). Based on the 2 examples
given below, the previous study uses spreadsheet tool to calculate the required SIL of
each initiating event based on the event tree analysis. The scenario frequency is then
calculated using equation 1 prior computing the LOPA ratio shown in Equation 2
(CCPS, 2001). From the LOPA ratio gained using equation 2, the SIL target can be
determined using Table 4. However, it does not specifically indicate the
recommendation required for each case. In other word, it studied on SIL evaluation on
safety instrumented function (SIF). As mentioned before, the current study will continue
the previous work by focusing SIL evaluation on SIS which will give well and more
specific recommendation for each case which will be further discussed in next chapter.
LOPA ratio, LR = Risk ToleranceScenario frequency
(2)

11
According to PETRONAS Group Technology Solution, (2009) if LR ≥ 1, there is no
need to add other IPL otherwise additional IPL is required.
Zatil, (2009) has developed a tool, which is capable to determine SIL. In example 1, the
initiating event is pressure vessel residual failure where the failure rate is 0.000001.
Table 1 shows four Independent Protection Layers (IPLs) to prevent the undesirable
outcomes to occur which initiated by pressure vessel residual failure. Event Tree
Analysis (ETA) method as shown in Figure 4 is used to develop the scenario of each
initiating event. Scenario frequency is determined using ETA method and is the result is
shown in Figure 5.
Table 1: PFD of IPLs in example 1 (Zatil, 2009)
Example 1: Pressure Vessel Residual Failure (0.000001)
Safety Function:
Inherently Safe Design
Critical Alarms & Human Intervention
Safety Instrumented Function (SIF)
Relief Valve
Identifier B C D E PFD 0.01 0.1 0.01 0.01
Figure 4: Event tree analysis of pressure vessel relief valve failure (Zatil, 2009)

12
Based on Figure 5, once the scenario frequency is gained, the LOPA ratio can be
calculated. The ratio gained will determine the SIL required.
Figure 5: Result from the spreadsheet (Zatil, 2009)
The methodology used in example 1 is same with example 2. The initiating event for
this case is pump seal failure which its probability to occur is 0.1. The lists of available
IPLs are shown in Table 2. The probability of failure of each IPLs also available which
can be obtained in CCPS database.
Example 2: Pump Seal Failure (0.1)
Table 2: PFD of IPLs in example 2 (Zatil, 2009)
Safety Function: Inherently Safe Design Operator Response Identifier B C
PFD 0.01 0.1
In order to compute the scenario frequency, again the ETA method is used and is shown
in Figure 6. The calculated LOPA ratio is then shown in Figure 7.

13
Figure 6: Event tree analysis of pump seal failure (Zatil, 2009)
Figure 7: Result yields from spreadsheet (Zatil, 2009)
14
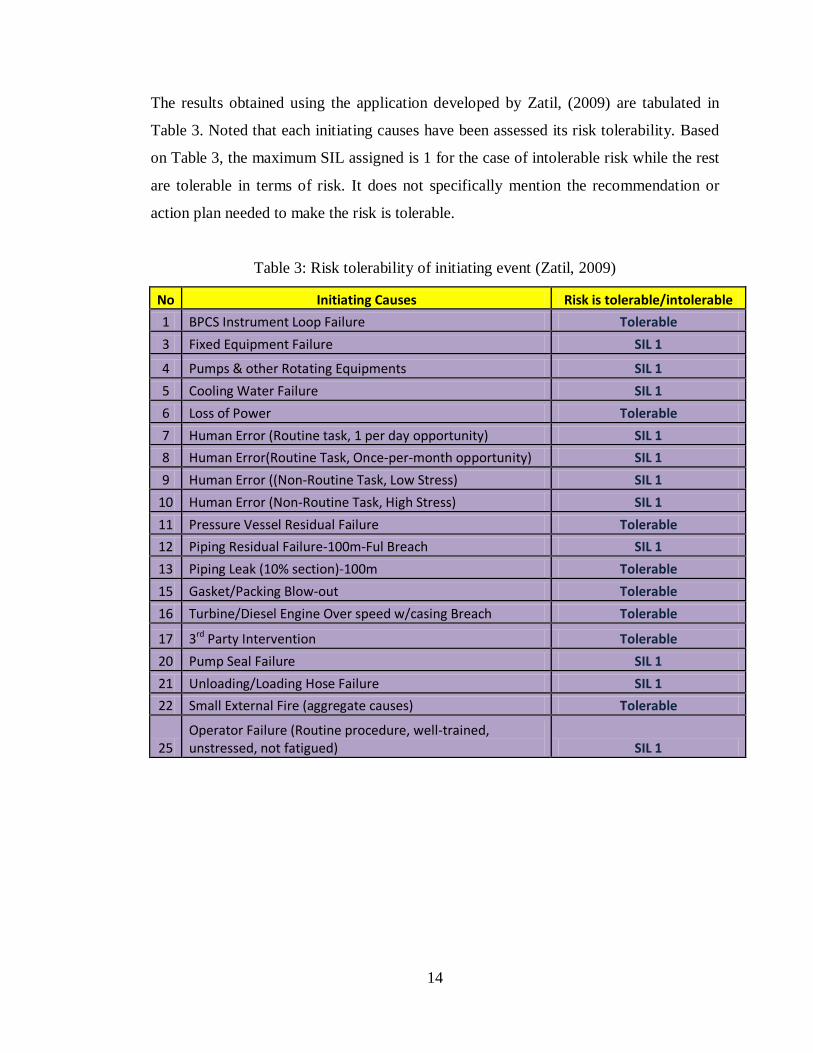
The results obtained using the application developed by Zatil, (2009) are tabulated in
Table 3. Noted that each initiating causes have been assessed its risk tolerability. Based
on Table 3, the maximum SIL assigned is 1 for the case of intolerable risk while the rest
are tolerable in terms of risk. It does not specifically mention the recommendation or
action plan needed to make the risk is tolerable.
Table 3: Risk tolerability of initiating event (Zatil, 2009)
No Initiating Causes Risk is tolerable/intolerable 1 BPCS Instrument Loop Failure Tolerable 3 Fixed Equipment Failure SIL 1 4 Pumps & other Rotating Equipments SIL 1 5 Cooling Water Failure SIL 1 6 Loss of Power Tolerable 7 Human Error (Routine task, 1 per day opportunity) SIL 1 8 Human Error(Routine Task, Once-per-month opportunity) SIL 1 9 Human Error ((Non-Routine Task, Low Stress) SIL 1
10 Human Error (Non-Routine Task, High Stress) SIL 1 11 Pressure Vessel Residual Failure Tolerable 12 Piping Residual Failure-100m-Ful Breach SIL 1 13 Piping Leak (10% section)-100m Tolerable 15 Gasket/Packing Blow-out Tolerable 16 Turbine/Diesel Engine Over speed w/casing Breach Tolerable 17 3rd Party Intervention Tolerable 20 Pump Seal Failure SIL 1 21 Unloading/Loading Hose Failure SIL 1 22 Small External Fire (aggregate causes) Tolerable
25 Operator Failure (Routine procedure, well-trained, unstressed, not fatigued) SIL 1

15
CHAPTER 3
METHODOLOGY
This project is mainly to develop an application n which will utilize layer of protection
analysis (LOPA) method to verify the safety integrity level of instrumented system. The
development of this application has been done using information and communication
technology (ICT) and simple programming software such as Microsoft Excel 2007 to
perform the study.
3.1 Method of SIL Classification
Safety integrity levels are categorized based on the probability of failure on demand
(PFD) for a specific safety instrumented function (SIF). The categories PFD range has
two types. According to ANSI/ISA 84.01-1996, the categories of PFD range from one to
three. Meanwhile, as defined in IEC 61508 and 61511, the categories PFD range from
one to four. Table 4 show the PFD ranges and associated risk reduction factor (RRF)
ranges that correspond to each SIL.The degree of consequence of event will directly
affect the SIL selection as discussed earlier.
Based on Table 4, the highest SIL is 4 and the corresponding PFD is 10-5. Therefore, it
has the limitation when the consequence of the event is too severe which further lead to
very low of probability of failure on demand (PFD). In this case, the PFD that is beyond
the range, will end up with too high of final SIL selection. An overdesign and high cost
of SIS are expected.
Table 4: Safety Integrity Levels and corresponding PFD and RRF (CCPS, 2001)
LOPA ratio SIL PFD Range RRF range
10-4 4 10-4 – 10-5 10000 – 100000
10-3 3 10-3 – 10-4 1000 – 10000
10-2 2 10-2 – 10-3 100 – 1000
10-1 1 10-1 – 10-2 10 – 100

16
Before going further, the fundamental question on how frequently will failures of either
type of function lead to accidents need to be clarified. There are two type of function
which are functions with low demand rate and functions with high demand rate or
operate continuously. For functions with a low demand rate, the accident rate is a
combination of two parameters:
• The frequency of demands
• The probability of function fails on demand (PFD)
The appropriate measure of performance of the function for this case is PFD or its
reciprocal, Risk Reduction Factor (RRF). Based on that, the Table 9 gives the definition
of SILs for low demand mode. On the other hand, for functions which have a high
demand rate (operate continuously), the accident rate is the failure rate, λ, which is the
suitable measure of performance. An alternative measure is mean time to failure
(MTTF) of the function. Noted that the failure must be exponentially distributed and
MTTF is the reciprocal of λ.
According to Gulland (2004), the parameters discussed above are related each other and
can expressed as showed in Equation 3 and 4:
PFD = λT2
or PFD = T(2 ×MTTF )
(3)
RRF = 2(λT)
or RRF = (2×MTTF )T
(4)
Where:
λ = failure rate
T = time
MTTF = reciprocal of λ
PFD = Probability failure on demand
RRF = Risk Reduction Factor, reciprocal of PFD

17
The function can be proof-tested at a frequency which is greater than the demand rate.
The term T indicates the proof-test interval. (Note that to significantly reduce the
accident rate below the failure rate of the function, the test frequency should be at least 2
and preferably ≥ 5 times the demand frequency.). Table 5 indicates definitions of SILs
for functions which have a high demand rate or continuous mode.
Table 5: Definitions of SILs for High Demand/ Continuous Mode (CCPS, 2001)
SIL Range of 𝛌𝛌 (failures per hour) Ranges of MTTF (yr)2
4 10-9 ≤ λ < 10-8 100000 ≥ MTTF > 10000
3 10-8 ≤ λ < 10-7 10000 ≥ MTTF > 1000
2 10-7 ≤ λ < 10-6 1000 ≥ MTTF > 100
1 10-6 ≤ λ < 10-5 100 ≥ MTTF > 10
SIL is determined based on PFD on a particular SIF. Safety instrumented function is an
action a safety instrumented system (SIS) takes to bring the process or the equipment
under control to a safe state (Marszal and Scharpf, 2002). This function is single set of
actions that protects against a sing specific hazards.A SIF’s sensors, logic solver and
final elements act in concert to detect a hazard and bring the process to a safe state.
Meanwhile, the safety instrumented system (SIS) is comprised of safety function (see
SIF above) with collection of sensors, logic solvers and actuators. The SIS is
implemented to protect the same process/project acts as backup to basic process
controlled system (BPCS). Figure 8 shows the relationship between SIL, SIF and SIS.
Every SIS has one or more safety functions (SIFs) and each affords a measure of risk
reduction indicated by its safety integrity level (SIL).
Figure 8: Relationship between SIL, SIF and SIS (Magnetrol Bulletin, 2009)

18
3.2 Method of SIL evaluation on SIS 3.2.1 Identify a hazardous event and assess its severity Start this methodology with a hazard and operability (HAZOP) study, the most
commonly used methodology for process plant hazard evaluation from which the highest
potential risk scenario are selected. Highest potential risk scenarios are scenario with
high initiating event (cause) frequency and high unmitigated consequences. These
scenarios can be easily detected by looking at the amount of existing or proposed
protection systems (in the safeguards and recommendation columns) where a high
number of protections can be related with high risk, or by searching explosion , fire or
toxic release potential mentioned in consequences which can be referred in Table 6.
Table 6 : Threshold frequency numbers for each consequence category (CCPS, 2001)
Consequence severity Max. acceptable frequency Threshold Frequency Index,
Ft
Category 5 - Catastrophic 1/10000 3
Category 4 – Major 1/1000 4
Category 3 – Critical 1/100 5
Category 2 – Minor 1/10 6
Category 1 - Negligible 1 7

19
In the system, consequence severity of each category can be selected from the dropdown
list as shown in Figure 9.
Figure 9: Consequence severity dropdown list
3.2.2 Identify the initiating event and access its frequency
The initial event for a scenario is taken from the cause column in the HAZOP study.
When each scenario has been evaluated with a risk matrix, its frequency can be
determined from the evaluation. This value must be compared with ranges available in
literature for validation. The system developed allow user to key in the initiating event
frequency as shown in Figure 10.
Figure 10: Initiating event frequency column that need to be filled

20
3.2.3 Identify the applicable independent protection layers and evaluate their
effectiveness
Assumption:
For this method, the BPCS layer would not be considered because in a HAZOP, its
failures are normally the initiating events. The emergency response layers are not taken
into account because the objective is to end up not needing these protection layers. Thus,
the following protection layers are considered in this methodology (Alarms and human
response, SISs and relief systems).
(a) (b)
Figure 11: Interface of the system where list of IPLs are available to be selected.
Figure 11 (a) shows the interface of the system where users are allowed to key in the
PFD for each IPLs. In case of the PFD of each IPLs are not available, Figure 11 (b)
shows the other option where users can select type of IPLs from the drop down list.
Notice that once either the PFD value or types of IPLs are being selected, the SPFD will
be displayed automatically.

21
3.2.3.1 Effectiveness of layers
Each layer evaluated using an index related to the order of magnitude of the PFD (SPFD)
according to Table 7. The SPFD numbers allows us to translate the PFD in a value that is
easy to manage. A low SPFD numbers indicates a protection with a low effectiveness and
very high probability of failure in case we need it. The effectiveness of the protection
can be determined using Equation 5 (Campa and Cruz-Gomez, 2009).
Effectiveness of the protections which demoted as ES is shown in equation 5 while the
system will calculate and display the ES value once all the IPLs have been specified as
shown in Figure 12.
𝐸𝐸𝐸𝐸 = ∑𝐸𝐸PFD (5)
The main advantage of using indexes instead of exponent numbers is shown here, where
a multiplication of probabilities is handled as adding integer numbers.
Figure 12: Output of the summation of all SPFD
Table 7 : Probability of Failure on demand indexes (CCPS, 2001)
Probability of failure on demand
index (Spfd) Probability range
Expected failure based on
1000 demand
0 1 > 1000
1 1 to 10-1 100 to 1000
2 10-1 to 10-2 10 to 100
3 10-2 to 10-3 1 to 10
4 10-3 to 10-4 0.1 to 1
5 10-4 to 10-5 0.01 to 0.1

22
3.2.4 Calculate the expected frequency for the hazardous event
The total protection effectiveness number is used to calculate the expected frequency for
the hazardous event taking into account the IPLs. This frequency is called reduced
frequency Fr. It can be found using Equation 6 (Campa and Cruz-Gomez, 2009).
Fr = Fi - ES (6)
Where:
Fr = Frequency reduction
Fi = Initiating index frequency
ES = Effectiveness of protection
The system will perform the calculation using equation 6 and display the result in the
system interface.
Figure 13: Output of the subtraction of Fi and ES
3.2.5 Determine the need for additional layers of protection and the required SIL if
a SIS is recommended.
Once the reduced frequency (Fr) is obtained, it is necessary to compare it with the
threshold frequency (Ft) for the selected scenario in Table 9. If the protection is
sufficient, there is no risk control strategy will be suggested as shown in Figure 14.

23
However, the system will check whether it is overdesigned or not based on parameter
which can be specified by users. In the risk control strategy column, no recommendation
required which is denoted as NILL as shown in Figure 14.
Figure 14: Risk control strategy interface
3.2.6 Determination of required SIL for an already installed SIS To determine the required SIL of previously installed SIS, it can be done by evaluating
the risk of scenario without considering the SIS protection layer. Table 8 shows the
value of SADD that will give the required SIL for the SIS. Equation 7 shows how the
SADD is calculated.
𝐸𝐸𝐴𝐴𝑃𝑃𝑃𝑃 = 𝑃𝑃𝑟𝑟 − 𝑃𝑃𝑡𝑡 (7)
Table 8 : Determination of required SIL from SADD number ( CCPS, 2001)
Sadd Required SIL PFD Range
4 3 10-3 – 10-4
3 2 10-2 – 10-3
2 1 10-1 – 10-2

24
Table 9: Comment and suggestion for each condition (Campa and Cruz-Gomez, 2009)
Condition Comment
Fr ≤ Ft Protection are sufficient for risk scenario (if Fr << Ft, then there is an over design according the acceptability criteria
Fr > Ft The protection are insufficient for the risk scenario (the combined IPLs effectiveness are not enough to reduce the initiating event frequency to the maximum acceptable frequency for the scenario Need to establish a risk control strategy based on the required effectiveness. Frequency reduction, SADD = Fr - Ft
If we already have IPLs , we need to recommend improving the effectiveness of these layers (more frequent and systematized maintenance program, enhance operators response to alarms by training / emergency drill
Case 1: SADD ≤ 1
If there are no IPL applicable, need to recommend installing a non-SIS PL. Only if no non-SIS layers can be applied, we could suggest using a SIS with SIL 1
Non-SIS protection layers and existing protection layer improvement must be suggested if possible and reevaluated to determine if this is enough. If no non-SIS protection layers can be suggested and existing protection have been improved, we can suggest installing a SIS.
Case 2: 2 ≤ SADD ≤ 4
The value of SADD is very high and a SIS protection would not be enough to mitigate the risk. Therefore reevaluation of the equipment or process searching for a high effectiveness solutions and second, implement several SIS and non-SIS protection layers until the risk is at acceptable level.
Case 3: SADD > 4
If a SIS is recommended, the required SIL can be determined from the SADD value after considering the other non-SIS alternatives using Table 8.

25
3.3 Tool Development The flow chart of the system is shown by Figure 15. It describes how the system works
from raw data, processing it into useful information. Based on Figure 15, there are five
main processes involve which are data key-in, input processing, display, calculation and
output. There are three type of data required - consequence of severity, initiating event
frequency and types of IPLs. Several equations mentioned in previous subchapter are
used to calculate and assess the reliability of the SIS.
SAFETY INTERLOCK SYSTEM (SIS) EVALUATION
CA
LCU
LATI
ON
DIS
PLA
YP
roce
ssin
g in
put
data
OU
TPU
TIn
serti
ng in
put
Select consequence of severity
Insert initiating event frequency (IEF)
Comparing input data with databaseThreshold
frequency index Table
Probability of failure on demand
index Table
PFD of IPL available?
Insert PFD of each IPL
Select IPL in drop-down
lost
Comparing input data with database
Initiative Frequency Index, Fi
Threshold Frequency Index, Fr
PFD Index, Spfd
Comparing input data with database
PFD Index of IPL Table
Efficiency of protection, ES = ∑SPFD
Reduced Frequency, Fr = Fi - ES
Is Fr ≤ Ft?YES NO
Is it overdesigned?
Fr – Ft ≤ 5
The protection system is sufficient
The protection system is NOT
sufficient
YES NO
Sadd = Fr - Ft
SIL required?
YES NO
Comparing input data with
database
Revise current design
Design is economical
Recommendation
Figure 15: Flow chart of Safety Interlock System (SIS) Evaluation

26
CHAPTER 4
RESULT AND DISCUSSION
4.1 SIS Evaluation In this chapter a complete simulation for SIL evaluation on SIS is discussed thoroughly.
The simulation is built using the Microsoft Excel 2007 as the platform. The case study
varies from different sources including literature reviews and industries. Several case
studies are used in this study to test the simulation.
Case 1: Failure of level transmitter (LT) indicating a false high level in a high pressure
sour gas amine treatment unit
(Campa and Cruz-Gomez, 2009).
Figure 16 shows the simplified process flow of the absorber section of a high pressure
sour gas amine treatment unit. Sour gas is a natural gas containing hydrogen sulfide
(H2S). Lean amine is used to remove H2S in absorber column, T-1. Based on HAZOP
study of the process as shown in Table 10, the following scenario is selected (Node:
High pressure amine absorber (T-1) and Deviation: high level).
Figure 16: Process Flow diagram of for the absorber section of a sour gas treatment unit
(Campa and Cruz-Gomez, 2009)

27
From Table 10, the essential information can be extracted and shown in Table 11. All
the input data gained is then keyed in into the Safety Interlock System (SIS) Evaluation.
Table 10: Hazards and Operability (HAZOP) study of the process Cause Consequence Safeguards Recommendations Failure of LT indicating a false high level
LV fully opens Loss of liquid seal in T-1 column (LG indication is unreliable in this case)
High pressure alarm in V-1 PIC and operator response
Consider adding a SIS and implement a SIF for this scenario
High pressure gas flows to low pressure flash tank V-1 is not designed for this scenario
Lock LV bypass valve in closed position
LV bypass valve could be erroneously opened in an attempt to control the 'high level' in t-1, worsening the scenario
Update emergency operation procedures with this scenario and train operators accordingly
Potential explosion of V-1
.
Table 11: Input data of case 1
Consequence Description/Category Assuming Facility spacing is adequate. Personal concentrated in bunker control room at sufficient distance. Category 4: Major ( Based on risk matrix )
Initiating event frequency Failure of a level transmitter indicating false high level ( 0.1)
Independent Protection Layers 1. BPCS alarm and Human Action 1 × 10⁻¹ 2. Level Gauge (LG) LG indication is unreliable in this scenario
3. PSV PSV in the absorber is not designed for this scenario.

28
Figure 17: Result for Case 1

29
The consequence severity assigned is category 4: Major. It is categorized based sizes of
release and consequences of production and facilities according to Figure 13 and 14.
The initiating frequency for this scenario is 0.1, which give clear information of high
probability of occurrence in plant lifetime and the corresponding index frequency
denoted as 6.
Although there are 3 IPLs as stated in Table 11, only one is applicable. Whereas,
another two IPLs are not applicable due to reasons as already mentioned in Table 11.
The only applicable protection is process alarm associated with operator response that
yield a low effectiveness (SPFD = 1). Just one IPL with low SPFD number, the protection
system is insufficient which cause the reduced frequency index is greater than threshold
frequency index based on Figure 17. Due to insufficient protection system, the risk
control strategy plays essential role to counter the problem.
In this case, the program gives solutions which are arranged systematically as listed
below:
o If IPLs already exist, improve the protection layers (more frequent and
systematized maintenance program, enhance operators response to
alarms by training /emergency drill.
o If there are no IPL applicable, need to recommend installing a non-SIS
Protection Layer.
o Only if no non-SIS layers can be applied, suggesting on using a SIS with
SIL 1.
The solutions are arranged in that manner is means to reduce the cost and to achieve
ALARP philosophy.

30
In response to the suggestion given in the SIS Evaluation program, assume that the
preventive maintenance is already being applied systematically and scheduled training
and emergency drill have been carried out and no non-SIS is available, thus SIS with
SIL 1 is recommended. SIL 1 is selected because the effectiveness required (frequency
reduction), SADD is 1. The SIF is to shut down the emergency shutdown valve (ESV)
which is installed in series. In normal practice, single valve will not be enough to meet
SIL 1 requirement. Therefore, another ESV is need based on redundancy philosophy. A
solenoid 3-way valve is needed on air pressure control line to control both ESVs
installed in series. The conceptual design is shown in Figure 18.
Figure 18: Revamped Design Piping & Instrumentation diagram (P&ID)

31
Case 2: Cooling water failure with runaway reaction and potential for reactor
overpressure, leakage, rupture, injuries and fatalities. Agitation is assumed (Crowl and
Louvar, 2002)
Figure 19 shows a safety system in a certain chemical reactor. The reactor contains a
high-pressure alarm to alert the operator in the event of dangerous reactor pressures. It
consists of a pressure switch within the reactor connected to an alarm light indicator. An
automatic high-pressure reactor shutdown system is installed. The system is activated at
a pressure higher than the alarm system and consists of a pressure switch connected to a
solenoid valve in the reactor feed line. The automatic system stops the flow of reactant
in the event of dangerous pressures.
PT
PIC
PT
PIAAlarm at P > PA
Figure 19: Chemical reactor with an alarm and an inlet feed solenoid
Table 12: Input data for case 2
Consequence Description/Category
Runaway reaction and potential for reactor
overpressure, leakage, rupture, injuries and
fatalities. Category 5: Catastrophic
Initiating event frequency BPCS instrument loop failure ( 0.1)
Independent Protection Layers
1. Inherent safe design 1 × 10⁻¹
2. Operator response 1 × 10⁻²

32
Figure 20: Spreadsheet interface and result of case 2

33
Figure 20 shows the result of the case 2. For case 2, the result indicates that the
protection system is adequate to mitigate the undesired scenario. In the consequence
severity box, catastrophic category is selected from the drop-down list which is shown
in Figure 9. The corresponding threshold frequency index will then appeared which give
the maximum acceptability criteria. The initiating event frequency inserted is 0.1, a
medium probability of occurrence in the plant lifetime. The corresponding index 6
appears in the cell.
A protection with low SPFD number gives an indication that it is low effectiveness and
has a high probability of failure in case it is needed. The first IPL in this case is
inherently safe design. Assumption made is that if it is properly implemented, the design
can eliminate scenarios or significantly reduce the consequences associated with a
scenario. That is among the reason why the index for inherent safe design is high which
give high reliability of the IPL. The second IPL is human response to alarm assuming
that the procedures are clearly understood, with low stress. The SPFD is 1 indicating that
it has low effective and has high probability of failure when it is in demand since it
involves many external factors like lack of operation training and inadequate or
nonexistent of management of change. .
However, the protection system is still sufficient as Frequency reduction, Fr is less than
Threshold frequency, Ft. Thus, no risk control strategy and SIL required. If Fr is low
than Ft, the protection system is overdesigned. Another question arises when it comes to
‘how much protection layer really needed?’, ‘is it overdesigned?’. It is vital for everyone
to know the minimum IPL needed as noticed that any additional IPL will skyrocketing
the investment cost. There are no such references that give the minimum criteria value
to be considered as overdesigned. Every company has their own standard value. In this
case, the spreadsheet is set to allow any changes to ensure it meets the standard, one
required.

34
Figu
re 2
1: S
emi-q
uant
itativ
e gu
ide
for c
onse
quen
ce c
ateg
ory
sele
ctio
n ba
sed
on si
ze o
f rel
ease
(Cam
pa &
Cru
z-G
omez
, 200
9)

35
Figu
re 2
2: S
emi-q
uant
itativ
e gu
ide
for c
onse
quen
ce c
ateg
ory
sele
ctio
n ac
cord
ing
to c
onse
quen
ce o
n pr
oduc
tion
and
faci
litie
s.
(Cam
pa &
Cru
z-G
omez
, 200
9)

36
CHAPTER 5
CONCLUSION AND RECOMMENDATION
Prior determination of the appropriate SIL on a particular SIF requires one to evaluate
thoroughly the concept of independent protection layer (IPL) to avoid intentionally
incorporating an IPL failure into the initiating event frequency which will jeopardize the
entire analysis. A concept of semi-quantitative risk analysis is used throughout the
study where it involves combination of HAZOP, LOPA technique and concept of SIL
and SIS. Prior estimating the consequence and severity, HAZOP is used to select the
most severe consequence which initiated by an event. Then, initiating event frequency
can be specified. The system developed gives user two alternative in specifying the
IPLs. In case of PFD value is not available, there are many types of IPLs can be selected
from the drop down list. Otherwise, user can key in the PFD value in the designated
column. All the input data is converted from exponent number into index number for
ease of adding the multiplication of probabilities. Analysis on the SIS is performed to
check on the reliability and economical of the design. Recommendation is given based
on the sufficiency of the protection. If the protection is insufficient, several strategies
will be given - improving existing layer, installing non-SIS protection layer and
installing a SIS with specific SIL. It is not always necessary to have a lot protection
layer. Most scenarios can be catered by enhancing the existing design and
instrumentation which minimizes the magnitude and frequency of deviation of the
process. Therefore, dependency on safety system can be reduced. The tool developed
can be used either in decision making which related in investment in additional of safety
protection layer or improving the existing protection layer. Future study shall be
continued to enhance the relevancy and reliability of the tool by considering more
parameters in assessing a case. Thorough discussion with experts from industries is
required to ensure the study is relevant and applicable in industry.

37
REFERENCE
Andrew, J. D. and Bartlett, L. M. (2005). A Branching Search Approach method to Safety System Design Optimization, Reliability Engineering and System Safety, 87, 1, pp23-30.
Baybutt, P. (2003). Layer of Protection Analysis for Human Factor (LOPA-HF): An improved method for addressing human failure in process hazard analysis. American Society of Safety Engineer , 163-175.
Campa, H. J., and Cruz-Gomez, M. (2009). Determine SIS and SIL using HAZOPS. Mexico City: Wiley Interscience.
CCPS. (2001). Layer of Protection Analysis : Simplified Process Risked Assessment. New York: CCPS.
Connor, M. K. (2009, November 3-4). Safety Integrity Level verification. Texas, USA.
Crowl, D. A., and Louvar, J. F. (2002). Risk Assessment. In J. F. Daniel A.Crowl, Chemical Process Safety: Fundamentals with Application (pp. 471-507). New Jersey: Pearson Prentice Hall.
Dowell, A. M., and Hendershot, D. C. (2002). Simplified Risk Analysis : Layer of Protection Analysis. AIChE National Meeting , 1-6.
Group Safety User. (2007, August). SIL : Tools and references. San Jose, California, USA.
Gulland, W. G. (2004). Requirement Pro and Con. In W. G. Gulland, Method of Determining Safety Integrity Level (pp. 1 - 16).
Guo, H. and Yang, X. (2007). A Simple Reliability Block Diagram method for Safety Integrity level Verification, Reliability Engineering and System Safety, 92, 9, pp1267 - 1273. Kosmowski, K. T. (2006). Functional Safety Concept for Hazardous Systems and New Challenges, Journal of Loss Prevention in the Process Industries, 19, 2-3, pp 298-305.

38
Lassen, C. A. (2008). Layer of Protection Analysis (LOPA) for Determination of Safety Integrity Level (SIL). Snaroya: Norwegian University of Science and Technology.
Magnetrol Bulletin. (2009). Understanding Safety Integrity Level. USA: Magnetrol International.
Mannan, M. S., Wang, Y., and West, H. H. (2004). The Impact of Data Uncertainty in Determining Safety Integrity Level , Process Safety and Environmental Protection, 82, 6, pp 393 - 397. Markowski, A. S. and Mannan, M. S. (2009). Fuzzy Logic for Piping Risk Asessment (pfLOPA), Journal of Loss Prevention in the Process Industries, 22, 6, pp 921 - 927 Marszal, E. M., and Scharpf, E. W. (2002). Safety Integrity Level Selection: Systematic Methods Including Layer of Protection Analysis. United States: Instrumentation, Systems and Automation (ISA).
PETRONAS Group Technology Solution. (2009). Layer of Protection Analysis (LOPA) Briefing package. Layer of Protection Analysis (LOPA) Briefing package . Kuala Lumpur, Malaysia: PETRONAS Group Technology Solution.
Scott, M. D. Burner Management Safety Integrity Level Selection. Greenville: AE Solution.
Stavrianidis, P and Bhimavarapu, K. (1998). Performance-based Standards: Safety Instrumented Functions and Safety Integrity Level, Journal of Hazardous Materials, 71, 1-3, pp 449-465.
Summers, A. E. (2003). Introduction to layer protection analysis. Journal of Hazardous Materials , 163 - 168.
Wei, C., Rogers, W. J., and Mannan, M. S. (2008). Layer of protection analysis for reactive chemical risk assessment. Journal of Hazardous Material , 19-24.
Zatil, A. R. (2009). Using Layer of Protection Analysis (LOPA) to Determine Safety Integrity Level (SIL) for Hazardous Installation, Bachelor Thesis, Universiti Teknologi PETRONAS, Malaysia.