utilization of lidar technology to assess vertical
TRANSCRIPT

Western Kentucky University Western Kentucky University
TopSCHOLAR® TopSCHOLAR®
Masters Theses & Specialist Projects Graduate School
Fall 2020
Utilization of LiDAR Technology to Assess Vertical Clearances of Utilization of LiDAR Technology to Assess Vertical Clearances of
Civil Infrastructure Civil Infrastructure
Daniel Levi McIntosh Western Kentucky University, [email protected]
Follow this and additional works at: https://digitalcommons.wku.edu/theses
Part of the Structural Engineering Commons, and the Transportation Engineering Commons
Recommended Citation Recommended Citation McIntosh, Daniel Levi, "Utilization of LiDAR Technology to Assess Vertical Clearances of Civil Infrastructure" (2020). Masters Theses & Specialist Projects. Paper 3471. https://digitalcommons.wku.edu/theses/3471
This Thesis is brought to you for free and open access by TopSCHOLAR®. It has been accepted for inclusion in Masters Theses & Specialist Projects by an authorized administrator of TopSCHOLAR®. For more information, please contact [email protected].

UTILIZATION OF LIDAR TECHNOLOGY TO ASSESS VERTICAL CLEARANCES OF CIVIL INFRASTRUCTURES
A Thesis Presented to
The Faculty of the School of Engineering and Applied SciencesWestern Kentucky University
Bowling Green, Kentucky
In Partial Fulfillment Of the Requirements for the Degree
Master of Science
By Daniel Levi McIntosh
December 2020

UTILIZATION OF LIDAR TECHNOLOGY TO ASSESS VERTICAL CLEARANCES OF CIVIL INFRASTRUCTURES
Date Recommended ______________________
_______________________________________ Dr. Mark Revels
_______________________________________ Dr. Bashar Haddad
_______________________________________ Dr. Shane Palmquist
_____________________________________
12-3-20
Mark Revels, Ph.D.Digitally signed by Mark Revels, Ph.D.Date: 2020.12.03 11:04:19 -06'00'
Bashar Haddad Digitally signed by Bashar Haddad Date: 2020.12.03 13:54:03 -06'00'
Stacy Wilson Digitally signed by Stacy Wilson Date: 2020.12.15 10:09:05 -06'00'

CONTENTS
Problem Statement………………………………………………………………………...1
Significance of Research…………………………………………………………………..2
Purpose of Research……………………………………………………………………….2
Research Questions………………………………………………………………………..3
Assumptions……………………………………………………………………………….3
Limitations………………………………………………………………………………...4
List of Acronyms………………………………………………………………………….5
Literature Review………………………………………………………………………….6
Methodology…………………………………………………………………………..…31
References………………………………………………………………………………..49
Appendix.……………………………………………………………….………………..53

iv
LIST OF FIGURES
Figure 1. Apollo 15 Laser Altimeter……………………………………………………...6 Figure 2. SA Transtion…………………………………………………………………...8 Figure 3. MLS Architecture……………………………………......……………………12 Figure 4. I-265 tunnel scan with and without intensity values…………...…..........…….13 Figure 5. MLS Accuracy Matrix ...................................................................................... 14 Figure 6. Chevron…………………………………………………...……..…………….15 Figure 7. Bridge Impacts by State…...……………………………...……..…………….18 Figure 8. Oversized Load Damage………………………………………………….…...20 Figure 9. Oversized Vehicle Damage………..…………………………………….…….20 Figure 10. Collapsed Skagit River Bridge………………………….…………………...20 Figure 11. Skagit River Bridge Portal……………………………………………….…..21 Figure 12. Approximate Location of Pilot Vehicle………………………………….…..22 Figure 13. Salado, TX bridge……...………………………………...………………….23 Figure 14. Typical Truck Dimensions…………………………………………………...24 Figure 15. REM Method………………….....………………………...………………...26 Figure 16. TLS scan positions……………………………………………...............…...29 Figure 17. Optech LYNX Mobile Mapper…….……………………...………………...32 Figure 18. Specte Laser meter……………………………………….…...................…..33 Figure 19. Survey measurement rod ................................................................................33 Figure 20. Nikon NPL-332 total station……………………………………..............….34 Figure 21. Cincinatti Road Location….……………………………………..............….34 Figure 22. Rogers Gap Location……...……………………………………..............….35

v
Figure 23. Alexandria Dr. Location…..……………………………………..............….35 Figure 24. Survey Rod, prism, bipod………………………………………..............….37 Figure 25. Total station setup………………………………………………..............….37 Figure 26. Optech Mobile Mapper…………………………………………..............….38 Figure 27. POSPAC control network………………………………………..............….39 Figure 28. Boresight area point cloud...……………………………………..............….41 Figure 29. Detected planar surfaces…..……………………………………..............….41 Figure 30. Cincinatti Road point cloud.……………………………………..............….42 Figure 31. Rogers Gap cross section….……………………………………..............….43 Figure 32. Alexandria Road cross section….………………………………..............….43 Figure 33. Cincinatti Road cross section….…………………..……………..............….43

vi
LIST OF TABLES
Table 1. Ranges for Minimum Vertical Clearances……………………………………..16 Table 2. LiDAR Measurements…………………………………………………………44 Table 3. Hypothesis Summary…………………………………………………………..45

vii
APPLICATION OF LIDAR TECHNOLOGY TO ASSESS VERTICAL CLEARANCES OF CIVIL INFRASTRUCTURES
Daniel McIntosh December 2020 59 Pages
Directed by: Dr. Mark Revels, Dr. Bashar Haddad, and Dr. Shane Palmquist
School of Engineering and Applied Sciences Western Kentucky University
The issue of vertical clearances along highway systems impact the functionality
of the road network. Extracting current routing clearances for each structure can be a
challenging and hazardous task. Pavement changes and roadway rehabilitation projects
can alter roadway geometry, complicating efforts to maintain accurate clearance
databases. Vertical clearance measurements may vary from one lane to another beneath
overhead structures and are often difficult to obtain due to high traffic volumes.
Inherently, traditional methods that are used to obtain the measurements routinely impede
the flow of traffic and subject workers to dangerous environments. This study will
examine the use of a Mobile LiDAR system and its applicability and accuracy to obtain
vertical clearances on bridge structures. Further, the study will investigate the impact of
utilizing a Mobile LiDAR system on traffic disruption and worker safety. The
measurements extracted from LiDAR point clouds are compared to measurements
obtained from traditional techniques using a laser tape meter and total station. Results
will be analyzed to assist in quantifying the potential error between field and LiDAR
measurements. Furthermore, the impact on work zone safety and traffic disruption is
investigated. The results obtained from this study can be used to help identify the most
effective method to extract infrastructure clearances and aid in future assessments.

1
Problem Statement
As of 2017, the state of Kentucky maintains a total of 14,265 bridges, supporting
an estimated traffic volume of more than 64.3 million daily crossings (KY Chamber,
2017). Obtaining accurate clearances from overhead structures provides essential
information for the safe routing of oversized vehicles, especially along highly traveled
routes such as interstates and parkways. According to the Bureau of Transportation
Statistics (BTS, 2017) a total of 10,776 million tons of freight was transported using U.S.
highways in 2015, with a projected growth to 14,829 million tons by 2045. The Federal
Highway Administration (FHWA) has established design guidelines for overhead
structures which accommodate for the safe travel of most vehicles. However, extracting
current routing clearances for each structure can be challenging. Pavement changes and
roadway rehabilitation projects can alter roadway geometry, complicating efforts to
maintain accurate clearance databases.
Significance of the Research
Although many technologies have been successful in extracting vertical
clearances, a recommended methodology has not been established. Current practices
routinely involve disruptive lane closures, exposing workers and public motorists to
dangerous environments. A report published by the FHWA (2015), compiled data on the
frequency of work zone crashes in the US. The study found that in 2015 work zone
accidents occurred once every 5.4 minutes. Utilizing Mobile LiDAR technology greatly
diminishes the need for work zones and may prove to be an alternative tool in Civil
engineering practices.

2
Purpose of the Research
The purpose of this study is to evaluate the extraction of vertical clearances along
active highway systems using a Mobile LiDAR system (MLS). Data collected from three
overpasses using a laser tape, mobile LiDAR, and total station will be used to test the
theory of utilizing MLS to determine safe routing clearances. Measurements from each
method will be recorded and categorized into three groups: (1) MLS, (2) total station and
(3) laser tape. A statistical analysis using a one-way anova model will be used to
determine differences between methods. The resulting relationship of data and collection
procedures obtained from this study can help aid in future infrastructure assessments.
Research Questions
For the purpose of this study the following research questions will be determined to test
the applicability of Mobile LiDAR.
1. Does Mobile LiDAR technology provide an accurate alternative to traditional
methods used to extract vertical clearances from civil infrastructures?
2. Can Mobile LiDAR technology be recommended for future infrastructure
assessments?
3. How do traditional collection methods compare to MLS procedures?
4. Does the use of Mobile LiDAR alleviate exposure to dangerous environments?
5. Do Mobile LiDAR collection procedures impact routine traffic operations?
6. Does the data collected represent an allowable accuracy in the extraction of
overpass clearances?

3
Assumptions
The following assumptions were made while conducting this study
1. Processing software is able to accurately extract measurements.
2. Traditional methods used adhere to known collection standards.
3. Instruments have been properly calibrated for accuracy.
Limitations
The study had the following limitations:
1. Proper weather conditions.
2. GPS signal quality.
3. LiDAR equipment is calibrated and functional.
4. Limited traffic flow at testing locations.

4
List of Acronyms
LiDAR - Light Detection and Ranging
MLS- Mobile LiDAR System
FHWA - Federal Highway Administration
GPS - Global Positioning System
IMU - Inertial Measurement Unit
FOV - Field of View
TOF - Time of Flight
NCHRP - National Cooperative Highway Research Program
CMV – Commercial Motor Vehicle
MMS- Mobile Mapping System MLS- Mobile LiDAR System DMI – Distance Measurement Indicator GNSS- Global Navigation Satellite System DOT – Department of Transportation EDM – Electronic Distance Measurement
REM – Remote Elevation Method
TLS – Terrestrial Laser Scanning
SBET- Smoothed Best Estimate of Trajectory
CORS – Continuously Operating Reference Station
SA- Selective Availability

5
Review of Literature
History and Advancements
In 1971, Apollo 15’s lunar module (Falcon) landed on the surface of the moon.
Concurrently, the control center module (Endeavor) remained in orbit conducting tests
using an array of cameras and sensors. One of the mission’s objectives was to measure
surface profiles of the moon using a laser measurement device. NASA’s experiment
emitted light pulses from a laser altimeter, recording the elapsed time of reflectance from
the lunar surface. The control center module carrying the device as shown in figure 1,
obtained measurements approximately every 20 seconds for the duration of 4.5 orbits.
The results provided spatial coordinates consisting of X, Y and Z values that were used to
recreate lunar surface profiles. Subsequent missions also carried the laser altimeter
aboard Apollo 16 and 17 (Abshire, 2010).
Figure 1. Apollo 15 mission carrying the laser altimeter. Adapted from “NASA’s Space Lidar Measurements of the Earth and Planets” by J, Abshire, (2011). Retrieved from http://ewh.ieee.org/r2/wash_nova/photonics/archive/IeeeSpaceLidAbshireFinal4-5-11.pdf

6
NASA’s experiment proved successful in remotely obtaining measurements to
recreate surface profiles. However, the lack of Global Positioning Systems (GPS) and
Inertial Measurement Unit (IMU) solutions hindered the commercial development of
sensor positioning technologies. In 1983, President Reagan announced that the United
States GPS would be made available for civilian use. Although, due to national security
concerns, the signal was intentionally degraded. Known as selective availability (SA),
consumers were unable to acquire location accuracies under 328 feet. In efforts to
improve upon the limitations of SA, the private market began developing DGPS or
differential GPS in 1995. By using a network of fixed ground-based reference stations,
the difference between the GPS satellite signal and the known coordinates of the
reference station could be identified and corrected, greatly improving accuracies (Cunha
& LoPiccalo 2008).
By the late-1990’s laser scanner manufacturers were producing aerial LiDAR
sensors capable of 2,000 to 25,000 pulses per second. Outfitted to planes, the sensors
could produce high resolution topographic maps that rivaled the established practice of
aerial photogrammetry. Although primitive by today’s standards, these instruments
proved to advance the growing belief that LiDAR technology was the way of the future
(Gaurav, 2017).
In 2000, President Clinton announced that the US would eliminate intentional
degradation of the GPS signal. The decision was part of an ongoing effort to make GPS
more responsive to civil and commercial users worldwide (Clinton, 2000). Figure 2
shows the horizontal and vertical positional errors before and after the transition.

7
Figure 2. SA Transition. Retrieved from: https://www.gps.gov/systems/gps/modernization/sa/data/timeline.gif
Glennie (2009), recounts the history of the first Mobile Lidar System (MLS).
Constructed in 2003, sensors from a helicopter based aerial system were removed and
mounted in the bed of a pickup truck. The newly configured MLS system was used to
survey Highway 1 in Afghanistan, a potentially dangerous corridor for helicopter-based
scanning. The initial system had many downfalls, primarily its limited field of view that
accompanies aerial systems. However, its successful implementation demonstrated the
potential value of MLS (Williams, Olsen, Roe, and Glennie, 2013).
Since the introduction of the laser altimeter by NASA, laser measurement systems
have evolved to support an extensive array of platforms. This study will focus on Mobile
LiDAR, a term widely used for laser scanners that are deployed on a variety of vehicles
such as cars, trains, boats and other land-based platforms.
8
Recent Studies
Previous studies have shown promising results from LiDAR technology. Coiner
& Bruno (2002), found that when compared to traditional surveying methods, LiDAR
data provides a significantly higher level of true geometric completeness and detail of the
site. Using a conventional total station or GPS equipment, the experienced surveyor
typically captures the minimal amount of data needed to represent the targeted surface or
feature. As with all highway measurement techniques, this process is prone to costly
errors and/or omissions in the data and can sometimes be impossible to collect due to
traffic or inaccessible regions. The authors state that laser scanning may eliminate many
of these errors due to the high resolution of the point cloud. Features or targets missed in
the field can be extracted from the data without returning to the site. Recommendations
for use of LiDAR for are proposed, highlighting benefits such as lower costs, higher
productivity, and increased safety conditions. Furthermore, the authors state that LiDAR
provides a detailed, reliable, and accurate solution to many surveying and measurement
problems (Coiner & Bruno, 2002).
A study by Chang, Findley, Cunningham and Tsia (2014), evaluated the use of
Mobile LiDAR systems for transportation agencies. The authors found that the use of
LiDAR is becoming increasingly popular across the United States and agencies are
adopting this technology for practical uses in transportation related applications. The
primary factors behind this trend are that surveyors, engineers, and technicians are
becoming more educated and increasingly open to LiDAR and its applications, providing
a cost-effective alternative to traditional surveying technologies. Transportation agencies
have discovered many benefits in using LiDAR technology such as higher levels of

9
safety, productivity, applicability, and detail acquisition. A definitive advantage of
mobile LiDAR over traditional methods is its ability to collect data from a distance at
highway speeds, thus reducing or eliminating the need for lane closures and exposure to
potentially hazardous environments. Inherently, MLS technology improves the safety of
field personnel as well as the traveling public during data collection efforts (Chang,
Findley, Cunningham & Tsia, 2014).
The authors also explore challenges in utilizing LiDAR systems for
transportation applications. The study found that as with many new technologies,
widespread acceptance of laser scanning to replace traditional methods has not been fully
embraced. The main factors conveyed are that laser scanning systems are still expensive,
workflows are complicated, and the size of collected data sets tend to be overpowering
for most computer systems. The data also requires the knowledge of trained staff and
technicians to post-process and extract accurate deliverables. The study concludes that
there is little more than anecdotal evidence to determine when a specific LiDAR platform
should be applied over traditional methods for various applications (Chang et al, 2014).
Additionally, this study is unique in that it incorporates considering factors for
transportation agencies such as budget restrictions, current methods/workflows, hardware
and software costs, external contracts, employee training, and resource allocation.
Work Zone Safety
One of the key advantages in utilizing mobile LiDAR is its ability to collect data
at highway speeds, resulting in minimal traffic impacts and diminishing the need for lane
closures. Additionally, LiDAR systems are not limited to daylight conditions and are

10
capable of operating in dark environments when traffic flow is off-peak. The mobility of
the system allows for data to be collected without exposing workers to high speed traffic.
Static LiDAR systems, total stations, and physical measurements all require personnel on
the ground, requiring the support of work zones where areas are often established to
provide a safety buffer between traffic and employees. Statistics from an FHWA report
state that in 2015 there were an estimated 96,626 crashes in work zones, an increase of
7.8% over 2014. This continues a rise in work zone accidents since a low of 67,887 in
2013. The report also compiled data on the frequency of work zone crashes stating that
in 2015, accidents occurred an average of once every 5.4 minutes (FHWA, 2015).
Williams et al. (2008) found that drivers may become distracted by survey instruments,
diverting their focus from safely passing through the workzone. Additionally, surveyors
routinely have no other option but to place themselves in precarious situations to acquire
necessary measurements, whereas mobile LiDAR requires little to no need for surveyor
and vehicular interaction.
The deployment of Mobile LiDAR systems will likely reduce or eliminate the
need for establishing work zones, thus minimizing the threat of potential accidents and
exposure to hazardous working environments. Although traffic disruption is minimal, it
should be noted that when utilizing Mobile LiDAR technology, heavily congested areas
or vehicles traveling in the LiDAR sensor(s) FOV (Field of View) can obstruct the
instrument from reaching the targeted surface.
MLS technology Positioning components. Mobile LiDAR Systems (MLS) can be broken down into two
sub-systems, comprised of geo-positioning and LiDAR components. The geopositioning

11
system is composed of Global Navigation Satellite System (GNSS) receiver(s), a Digital
Measurement Indicator (DMI), and an Inertial Measurement Unit (IMU). Geo-
referencing for MLS is determined by time variable position and orientation parameters.
The three components of the geopositioning sub-system work together to synchronize
outputs from the sensor(s). The GNSS antenna(s) collect satellite positioning data, the
IMU records inertial measurements and orientation such as pitch, roll and yaw, while the
DMI collects speed and linear distance information (Sokolova, Morrison & Haakonsen,
2015). Post processing of data gathered by the positioning components yields an accurate
representation of the vehicle’s orientation parameters along the traveled route.
LiDAR components. The LiDAR system is made up of laser scanner(s), a control unit, a
logging computer for data synchronization, and a laptop PC used to control system
functions. Laser scanners measure surroundings using light pulses to obtain range and
angle measurements. Figure 3 illustrates common components of an MLS system. Using
Time-Of-Flight (TOF), the scanner sends a short laser pulse to the target, the time
difference between the emitted and received pulses are used to determine the range from
the scanner. The range R can be calculated using the following expression:
R = ⅟₂ c∆t
Where c is the speed of light and ∆t is the time of flight of the pulse (Puente et. al 2013).

12
Figure 3. Typical MMS components. Retrieved from Guidelines for the use of Mobile LiDAR in Transportation applications, 2013, p.55 MLS Operations
During operational procedures the MLS system collects synchronized location
and orientation data from the GNSS antennas(s), IMU and DMI along with spatial data
from the LiDAR sensors. Post processing navigational data produces a trajectory
depicting a 3-dimensional representation of the traveled route. The generated trajectory
is then used to synchronize LiDAR scanner outputs correlating to the time of incidence.
The resulting data is an accurate 3D collection of surface measurements also referred to
as a point cloud.
In addition to spatial collection the LiDAR scanners(s) are also capable of
extracting surface reflectance properties. Each scanned point can be assigned an intensity
value based off of the return strength of the pulse. Varying surface properties affect the

13
amplitude of the return pulses. Intensity values are assigned within a defined numeric
range which can be displayed over graduated color tables. Intensity properties allow
visualization software to differentiate between low reflectance surfaces such as pavement
and structures with highly reflective surfaces such as lane striping and signage. Figure 4
shows the differences in point cloud data with and without intensity values.
Figure 4. I-264 tunnel w/intensity and w/o intensity values.
Guidelines for MLS Accuracy
The National Cooperative Highway Research Program (NCHRP) report by Olsen
et al. (2013), suggests guidelines for the use of Mobile Mapping systems in regards to
specific applications. The suggested accuracy and resolution requirements as shown in
figure 5 for clearances suggest an accuracy of <0.16 ft. and point densities >9 points per
square foot. It should be noted the graphic indicates that accuracies may be relaxed for
clearance applications are subject to change based on specific DOT requirements.

14
Figure 5. Suggested accuracy Matrix. NCHRP guidelines, 2013, p.14
It is important to note that the Kentucky Transportation Cabinet (KYTC) has also
established certain guidelines for the use of MLS data. Procedures outlined in HD-302.5
of the Highway Design Manual require the data to be referenced to validation points
spaced along 500’ intervals with respect to the KY Single Zone Coordinate System
(KYTC, 2006). This method requires the use of survey personnel to collect highly
accurate coordinates and mark corresponding points on the roadway surface. Painted
chevrons are commonly used providing a visual location in the point cloud to reference or
“tie” lidar data to known coordinates. Control points are collected from a recognizable
point such as the tip of a chevron, as shown in Figure 6.

15
Figure 6. Chevron representing control point location. Retrieved from: http://www.pobonline.com/articles/98850-three-acronyms-you-should-know-in-mobile-mapping
Establishing control points allows the point cloud data to be tested for accuracy against
known coordinates. Depending on the application, the guidelines state vertical and
horizontal accuracies that should be met when utilizing LiDAR data for state level
projects.
Clancy (2009), found that data used to determine under height clearances for
bridge overpasses does not benefit from absolute accuracy provided by established
control. The determination of minimum clearances only requires the data to have a high
relative accuracy between points. The data collected for this project is not subject to the
guidelines discussed in HD-302.5. This project will be analyzed from a Cartesian
perspective. Establishing control and aligning point cloud data to a defined coordinate
system does not alter spatial point distances or aid in the intent of this study.
Highway Design Guidelines
A report published by the American Association of State Highway and
Transportation Officials (AASHTO, 2016), established design guidelines for minimum
vertical clearances allowed for each roadway type. Regarding freeways, the report states

16
that the vertical clearance to structures passing over freeways should be at least 16 feet
over the entire roadway width, including auxiliary lanes and the usable width of
shoulders with an allowance for future resurfacing. Additionally, because of their lesser
resistance to impacts, vertical clearance to sign trusses and pedestrian overpasses should
be 17 feet. The study also establishes guidelines for minimum vertical clearances on
arterial roads as 14-16 feet, and local roads as 14 feet in both rural and urban areas
(AASHTO, 2016). Table 1 illustrates the minimum vertical clearances allowed for each
roadway design. The guidelines specify that vertical clearances should provide additional
height for future resurfacing, indicating that the allowable clearance is subject to change
due to roadway maintenance or design alterations.
Table 1.
Minimum vertical clearances.
Type of Roadway Rural Urban
US (feet) Metric (meters) US (feet) Metric (meters)
Freeway 14-16* 4.3-4.9* 14-16* 4.3-4.9*
Arterial 14-16 4.3-4.9 14-16 4.3-4.9
Collector 14 4.3 14 4.3
Local 14 4.3 14 4.3
* 17 feet (5.1 meters) for sign trusses and pedestrian overpasses.
Oversize Load Impacts
Impacts between vehicles and bridge components can result in damage or failure
to the bridge structure, injuries, traffic hazards, and loss of lives. Lee, Mai Tong, & Yen

17
(2006), compiled data on bridge failures and found that the second leading cause of
bridge failure or collapse is due to collision damage from vehicle or vessel impacts.
Currently, there is no nationwide database for tracking overheight collisions. However,
references to the problem appear frequently in related research. Harik, Shaaban, Gesung,
Valli & Wang (1990), studied U.S. bridge failures over a span of 38 years between 1951
and 1988. Of the 79 bridge failures analyzed, 11 (14%) were precipitated by truck
collisions. Hilton (1973), investigated bridge related accidents in Virginia and found
“inadequate vertical clearance” as a key contributing factor. In 1988 the Michigan
Department of Transportation reported an increase of 36% in overheight collisions in a
span of one year (MRC, 1988). The Mississippi State Highway Department installed
warning systems on some rural bridges after an increase in damage to bridge structures
from overheight logging trucks (Hanchey and Exley, 1990).
A study by Fu, Burhouse and Chang (2004), quantifies the problem of over-height
impacts using collision statistics for structures in Maryland. The authors compiled data
on 1496 bridges and found that 116 over-height collisions occurred between 1995 and
2000, an increase of 81%. Police reports were reviewed to classify the type of vehicles
involved. Results indicated that box trucks were involved in 36% of accidents, flatbed
trailers carrying oversized loads such as construction equipment accounted for 31%,
dump trucks 16% and 17% involved mobile homes, refuse trucks, and other large
vehicles.
A study by Agrawal, Xu and Chen (2011), discussed contributing factors to
bridge impacts in the state of New York. The authors found that impacts from collisions
were the third leading cause of structure collapse, trailing flooding and overweight

18
vehicles. In an effort to perceive the problem on a national scale the authors proposed a
survey focused on bridge impacts at the state level. The survey asked state transportation
agencies, “Do you consider bridge hits to be a major problem in your state?” Out of the
50 states polled, 44 responses were received and analyzed. The results were mapped
along with bridge impact data from 2005-2008 as shown in figure 7.
Figure 7. Bridge Impacts by State. Reprinted from “Bridge Vehicle Impact Assessment,” by A. Agrawal, X. Xu and Z. Chen, 2011, p.27
The results of the survey show that over-height load strikes occur frequently with
the majority of states considering it a major problem. On average, roughly four
overheight load strikes occurred per day in the United States during the 4-year period
spanning 2005 –2008. The results of this survey are somewhat skewed as each state
records bridge impacts differently. Louisiana for instance only reports impacts resulting

19
in serious damage, however, Missouri records all impacts. Furthermore, it is likely that a
high percentage of minor bridge impacts are never reported (Agrawal et al. 2011).
In March of 2015, the National Transportation Safety Board (NTSB) released a
safety alert regarding the importance of preplanning and acquiring permits for oversized
loads. The report states that “Commercial motor vehicle carriers transporting oversize
loads on the nation’s highway system are continuing to impact bridge structures. These
impacts often lead to catastrophic events that result in fatalities and injuries, as well as
enormous costs to repair the bridge structures” (NTSB, 2015 p.1). The report
investigated two recent bridge impacts where vehicles transporting an oversized load
collided with bridge structures resulting in partial collapses of the span.
Skagit River Bridge. The first instance in Mt. Vernon, Washington occurred on May
23, 2013 when an oversized load collided with the Skagit River Bridge leading to
collapse and a replacement cost of $8.5 million. A follow up review by Stark,
Benekohal, Fahnestock, LaFave, He and Wittenkeller (2006), investigated factors leading
up to the incident. The report states that a truck was hauling an oversized steel container
traveling Southbound on Interstate 5 when it struck an overhead beam. The impact
caused a 160 ft. bridge span to collapse and fall into the Skagit River along with four
other passenger vehicles.
Permitting for oversized vehicle routing is not federally regulated, therefore states
establish individual requirements. Some states such as the Washington Department of
Transportation (WSDOT) allow private companies to create their own oversize permit
without agency oversight. In this case, the truck shown in figures 8 and 9, obtained an
oversized load permit for a maximum vertical clearance of 15’9” and a width of 11’6”.

20
Figure 8. Oversized Load. Figure 9. Damage to trailer
Figure 10. Collapsed Bridge Span. Reprinted from “Collapse of the Interstate 5 Skagit River Bridge,” NTSB, 2013, p.12
The southbound portal dimensions, as shown in figure 11, show a published
height of 17’9” above the left lane line and 14’5” above the right edge of the shoulder, a
difference of 3’4”. Vertical clearance variability, which changes based on roadway and
overhead structure geometry was a major attributing factor in this incident. The height of
the oversized vehicle was greater than the minimum southbound vertical clearance of
14’8” as listed in the WSDOT Bridge List (WSDOT 2015c, d). Consequently, the
potential for inadequate vertical clearance was not recognized. The authors state that
along a permitted route, different lanes may have different clearances. The oversized

21
load measuring 15’9” vertical height exceeds the vertical clearance of the bridge over a
portion of the right lane and all of the right shoulder, while it does not exceed the vertical
clearance of the bridge over the left lane. If the truck was travelling in the left lane, the
bridge impact may not have occurred (Stark, et al. 2016).
Figure 11. Southbound Portal Dimensions. Reprinted from “I-5 Skagit River Bridge Collapse Review,” T. Stark, R, Benekohal, L. Fahnestock, J. LaFave, J. He, and C. Wittenkeller, 2016, Journal of Performance of Constructed Facilities, 30, p.3.
Pilot vehicles provide an additional level of redundancy for identifying inadequate
vertical clearances. Using a height rod, pilot vehicles travel ahead of the oversized load
and relay information about possible overhead obstructions. The pilot vehicle in the
Skagit River Bridge incident carried a height rod set at 16’2”, 5” higher than the
oversized load (Stark, et al. 2016). However, the rod was installed at an angle reducing
the overall vertical height as shown in figure 12. Given the variable bridge geometry, the
height pole was not positioned to detect the inadequate clearance. The NTSB report
found that due to changing bridge geometry, the pilot vehicle was not positioned below

22
the lowest point of the structure along the right edge line and therefore was not alerted to
the insufficient clearance (NTSB, 2015).
Figure 12. Appoximate depiction of Pilot Vehicle. Reprinted from “Collapse of the Interstate 5 Skagit River Bridge,” NTSB, 2013, p.42
The accident resulted in a replacement cost in excess of 8 million and induced a
major economic impact for the state, however, no fatalities were reported. The probable
cause of the incident as stated in the NTSB report found multiple deficiencies: (1)
insufficient route planning by the trucking company and the oversize combination vehicle
driver; (2) failure of the certified pilot/escort vehicle to perform required duties and
communicate potential hazards; and (3) inadequate evaluation of oversize load permit
requests and no provision of low-clearance warning signs in advance of the bridge by
WSDOT (NTSB, 2015).
The second incident occurred on March 26, 2015 in Salado, Texas. The NTSB
report states that a commercial vehicle transporting a boom lift was traveling northbound
on Interstate 35 when it collided with bridge structures supporting the Farm-to-Market
Road overpass. The impact caused two concrete beams to collapse and fall into the travel
lanes resulting in one fatality, three injuries, and about $150,000 of structural damage.

23
The report states that the vehicle was operating without a permit and was considered an
over-height load, measuring approximately 14’-7” at its highest point. Under Texas law,
no vehicles over 14’ may be operated on state highways without a permit. Additionally,
the truck was stated to have passed several low clearance signs indicating an approaching
clearance of 13’6”. Probable cause of the incident was attributed to the failure of the
commercial motor vehicle carrier to obtain a permit for transporting the oversized load,
stating that a permit would have included a route map illustrating detours around all
bridges that had insufficient vertical clearances (NTSB, 2015).
Figure 13. Salado, Texas overpass impact. Retrieved from: http://www.statesman.com/news/local/bridge-collapse-near-salado/JxaB1MxnFqOYjcDGxng6MK/
According to the FHWA, there is no Federal vehicle height requirement for
Commercial Motor Vehicles (CMV). Thus, states may set their own height restrictions.
Most height limits range from 13’6” to 14’ with exceptions granted for lower clearances
on designated roads. (FHWA, 2014).
Information regarding legal dimensions of overweight/oversized loads for the
24
state of Kentucky show that the allowable height is regulated at a maximum of 13’6” for
all vehicles except car haulers which are allowed 14’ (Over-dimensional Legal
Dimensions, 2020).
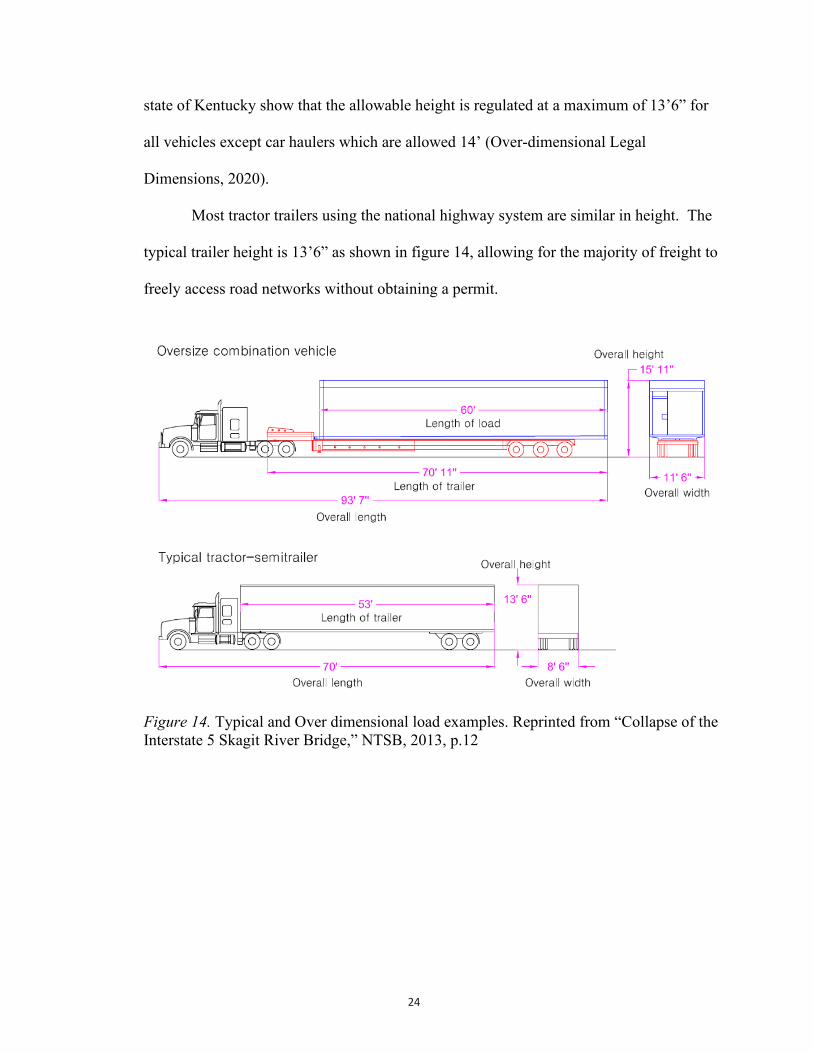
Most tractor trailers using the national highway system are similar in height. The
typical trailer height is 13’6” as shown in figure 14, allowing for the majority of freight to
freely access road networks without obtaining a permit.
Figure 14. Typical and Over dimensional load examples. Reprinted from “Collapse of the Interstate 5 Skagit River Bridge,” NTSB, 2013, p.12
25
Review of current and previous methods
Design guidelines for minimum vertical clearances have been established but
extraction methods have not been specified. The decision has been left to state
Department of Transportation (DOT) agencies to utilize the best method to obtain the
necessary measurements. Although a variety of tools and techniques exist for acquiring
minimum vertical clearances, a defined approach has not been determined. As new
technologies are introduced, these methods continuously change. A review of previous
and current techniques are outlined below.
Grade Rods. Most likely due to the simplistic approach, research for this method is
sparse but mentioned as a previous extraction method and a current quality control
technique. Normally used for surveying applications, grade rods are an extendable
measurement device with graduated units used to determine differences in elevation. A
study by Lauzon (2000), notes that vertical clearance extraction performed by ConnDOT
utilized a fiberglass measurement rod to determine the minimum vertical clearances of
overpasses. Measurements were taken from each lane line and recorded to overhead
clearance diagrams. The study also notes that this method requires traffic protection,
which can be substantial on interstates and in urban areas.
Total station. Total stations combine electronic EDM (Electronic Distance
Measurement) technology and theodolites into a single unit, they are capable of digitally
calculating horizontal, vertical and slope distances and angles. Using an internal or

26
external microprocessor, these digital data observations can be adjusted and transformed
to local X, Y, Z coordinates (US Army Corps of Engineers 2007).
A few key measurements are required when utilizing a total station to determine
the height of overhead objects. The graphic in figure 15 illustrates the typical parameters
needed to calculate object heights, also referred to as remote elevation (REM).
Figure 15. Remote Elevation Method. Leica user Manual, 2014, Adapted from http://surveyequipment.com/PDFs/Leica_FlexLine_UserManual.pdf
The principle of the REM method is explained through figure 15, where a base
point P1 is positioned vertically below point P2. From the instrument P0, a measurement
is taken at the prism above base point P1, providing the slope distance d1. A subsequent
measurement at P2 is used to calculate the angular difference α, from P1. Given the
height of the prism, the height (a) can then be calculated internally by the total station.

27
Traditional surveying techniques and equipment such as the total station are
widely used and accepted by the Civil Engineering, surveying and mapping community.
However, these operations often expose workers to dangerous conditions especially in
highway applications. The Kentucky Highway Design Manual states that “surveyors
work in hazardous environments, such as rugged terrain or in the vicinity of construction
equipment and high-speed traffic. Working in these conditions requires a constant
awareness of the need for safety” (KTC, 2006, p.812). Additionally, safety measures
taken to protect surveyors and field personnel can directly affect traffic flow.
Laser Tape Measure. Techniques commonly used to aid in structural measurement
include tape measurements combined with hand recording and optical methods (Banister,
Raymond & Baker, 1998). Since the publication of this study in 1998, advancements in
distance measuring devices such as the laser tape measure have been introduced.
Utilizing laser tape meters has proven to be a more efficient and simplified method to
extract vertical clearances over analog methods. The device can be operated by a single
individual providing quick and accurate measurements displayed in a digital format.
Although an improvement over previous methods, extracting overpass clearances via
laser tape is not without its challenges. Accurate readings are obtainable, though many
aspects of height extraction are subject to the individual operator. Human error and
judgement can adversely affect the quality of the data. Visually assessing and
determining the location of the lowest point overhead can be difficult, especially with
changing roadway and structure geometry. Additionally, failure to hold a perpendicular
angle to the roadway can result in inaccurate measurements.

28
Terrestrial Laser Scanner. In recent years, the use of terrestrial laser scanners (TLS) in
engineering surveys has gained an increasing interest due to the advantages of high
accuracy and rapid data collection. Millions of 3-D points can be delivered by this
technology in a short period of time providing efficient data collection for large scale
engineering applications such as roads, bridges and tunnels (Wang, Zhao, Huang,
Vimarlund & Wang, 2014).
Stationary terrestrial laser scanning technology refers to laser scanning
applications that are performed from a static point on the surface of the earth (CDOT,
2011). Utilizing many of the same principles found in MLS systems, terrestrial scanners
differ in their platform. Often mounted atop a tripod, TLS scanners remain stationary
during operation. Due to its static location, TLS systems are capable of highly accurate
and rapid data collection. A study by Zhang, Arditi and Chen (2013), used a terrestrial
laser scanner to measure the vertical clearances of thirty-seven bridges along the Circle
Interchange in Chicago, IL. The study reports the data collection procedures undertaken
to complete the project. Over the course of a month, 150 scans were completed using a
Leica C10 terrestrial scanner. Scanning at midnight to avoid traffic disruption and data
noise, each bridge consisted of four static scans per structure as depicted graphically in in
figure 16.

29
Figure 16. Representation of scan locations. Reprinted from “Applications of Terrestrial laser scanning,” by C. Zhang, D. Arditi, and Z. Chen, 2013, Journal of traffic and Transportation Engineering, 1(5), p. 328.
Collected data was aligned and post processed to determine the minimum vertical
clearances. The extracted measurements were then compared to AASHTO design
guidelines and published into clearance reports for the state DOT. The authors state that
data collection through the use of a total station would provide adequate results, although
laser scanning is more accurate, generating millions of points as opposed to a limited
number of specified points (Zhang et al, 2013). The study also notes that due to security
concerns, some of the data was not available to the public. The scope of this study does
not provide accuracy statistics, as structures were only tested to meet minimum clearance
guidelines. Additionally, while TLS scanners were proven effective in measuring
vertical clearances, traffic disruption and employee safety were not discussed.

30
Additional Technologies. Additional technologies have been developed; however, most
are proprietary or developed privately. Little research is available and therefore were not
included in this review.

31
Methodology
To compare differences between Mobile LiDAR and traditional methods, the
research will identify procedures and workflows currently used to extract vertical
clearances from civil infrastructures. Three different locations will be chosen for this
study. Mobile LiDAR data will be collected using an Optech Lynx Mobile Mapping
System, utilizing two V100 laser scanners. Traditional extraction methods will utilize a
Spectre laser meter and a Nikon NPL-332 total station. Measurements extracted from the
LiDAR data will be processed using CAD software. Vertical clearances will be extracted
from each outside beam using roadway edge lines as a perpendicular reference. This
study will collect measurements obtained using each technique from the same location.
Graphical representations of the data will be analyzed along with a review of collection
procedures and its perceived impact on traffic and safety.

32
Software Tools. Four software tools were used in this study: Microstation Connect Version 5,
Topodot Version 3.7, Optech LMS Pro Version 3.2, and Applanix PosPac MMS Version
7.2. Microstation is a computer aided drafting program created by Bentley. PosPac MMS
(Mobile Mapping Suite) is a software tool used in post processing GNSS data collected by the
POS system (Positional Orientation System). Optech LMS Pro is a post processing platform
which aligns laser scan data with trajectories exported from PosPac. Topodot is an add-on
application running within Microstation used for extracting features, measurements, topographies,
and 3D models from LiDAR point clouds.
Hardware. LiDAR Mobile Mapping System. This study utilizes an Optech LYNX V100
mapping system, as shown in figure 17. The system uses dual 360° scanners, capable of a
combined collection rate of 200,000 points per second with an absolute accuracy of ± 5cm (1 σ).
An Applanix POS LV sub-system composed of an LN-420 IMU, DMI, and dual Trimble Zephyr
2 GNSS antennas will also be used to log correlational position and orientation data.
Figure 17. Optech LYNX Mobile Mapping System

33
Laser Meter. A Spectra Precision QM55 Laser distance meter will be used to measure
vertical clearances as shown in figure 18. This device will be mounted to surveying
prism pole as shown in figure 19 to provide perpendicular vertical measurements.
Manufacturer’s specifications list a maximum range of 165' with an accuracy of ± 1/16".
Figure 18. Spectre QM55 Laser Meter Figure 19. Prism Pole attachment
Total station. A Nikon NPL-332 total station will be used obtain vertical clearance
measurements as shown in figure 20. Manufacturers specifications list an accuracy of ±
(2+2 ppm × D)mm for measuring distances, and a 5s resolution for measuring angles. To

34
limit human error, a bipod and prism pole will be incorporated to aid in extraction of
bridge clearances.
Figure 20. Nikon NPL-332 Total Station
Location Selection. Three locations were chosen for this project as shown in figures 21-
23. The areas were selected based on site conditions where safety concerns for the
traveling public and researchers could be adequately managed.
Figure 21. Cincinnati Rd at I-75 - Sadieville, KY.

35
Figure 22. Rogers Gap Rd at I-75 - Stamping Ground, KY.
Figure 23. Alexandria Rd at New Circle - Lexington, KY.

36
Procedures
The experimental procedures conducted are the same for each test area and are described
as follows:
Laser Tape. The laser tape device was affixed to a survey rod and bipod to ensure level,
perpendicular measurements from the roadway surface. Through the use of the
integrated laser, the center of each beam was located and measured from roadway edge
lines. In areas where no lane lines were present, a distance from 6” from the pavement
edge was used. A PK nail was driven into the asphalt to ensure location accuracy
between methods. The average of three measurements were taken from each location and
recorded. The height of the instrument was measured from the ground and added to each
measurement to calculate total height.
Total Station. Using the PK nail as a reference, the pole, bipod, and prism were placed
under the targeted beam as shown in figure 24. The total station was set up and leveled
as shown in figure 25. Using the REM method, measurements were collected and
recorded for each location.

37
Figure 24. Survey Pole, prism, bipod set up.
Figure 25. Total station setup.
Mobile LiDAR. An Optech Lynx Mobile Mapping System as shown in fig x was used to
scan the project areas after the field measurements were completed. A boresight
procedure as discussed below was performed in order to calibrate the system for the

38
upcoming scan. Travelling at a constant speed of 40MPH, data was collected from each
structure.
Figure 26. Optech Lynx Mobile Mapping System.
Post Processing. Trajectory and GPS information collected from the POS (Position
Orientation System) during scanning operations was post processed through Applanix
POSPAC MMS software. Using data from continuously operating reference stations
(CORS) to compute a set of corrections for the roving receiver, the software is capable of
exporting an accurate overall position and orientation solution. The exported smoothed
best estimate of trajectory (SBET) file is GPS timestamped and used to align with
correlational LiDAR outputs. Data used in this study was processed with six CORS

39
stations, KYBO, KYTF, GRTN, KYTI, KYBU and KYTG as shown in figure 27. The
solution was then exported using the Kentucky Single Zone coordinate system.
Additional metrics for the trajectory solution can be found in Appendix A.
Figure 27. POSPAC Basestation control network
System calibration/boresight. System calibration parameters were obtained using a
boresight scan. Data was collected in order to calculate differences in like planar
surfaces detected from each sensor. Multiple passes produce a set of point clouds
covering redundant surface observations. Recommended conditions for the boresight
area should include objects with multiple planar surfaces in various orientations. Areas
with tall buildings or tree canopies should be avoided in order to retain consistent GPS
data. During post-processing LMS software detects differences in planar surface
40
orientations. Using the method of leastsquares, the software determines a set of unknown
parameters from a set of redundant observations. Misalignments between the
measurement axes of the IMU and laser scanners are calculated. The software applies a
correctional value to offset errors in laser range, scan angle, sensor position and
orientation. The values are then applied to the instrument in order to produce corrected
data for the scan project (Optech LMS Manual, 2013).
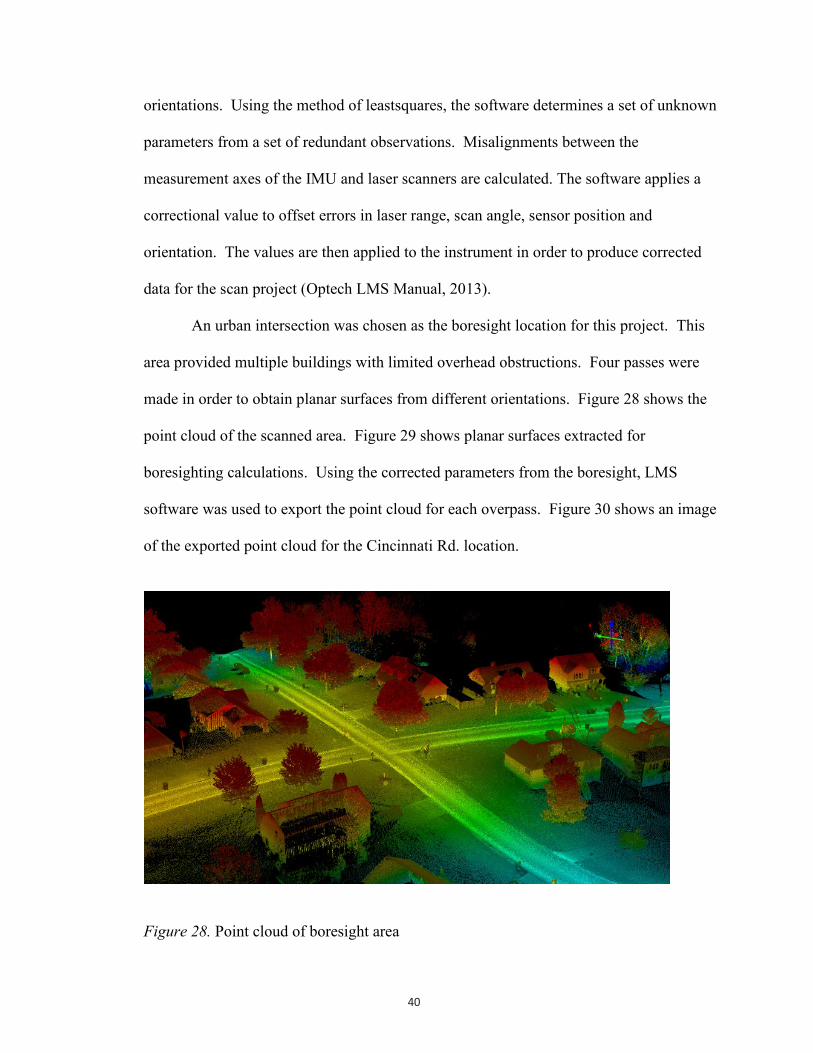
An urban intersection was chosen as the boresight location for this project. This
area provided multiple buildings with limited overhead obstructions. Four passes were
made in order to obtain planar surfaces from different orientations. Figure 28 shows the
point cloud of the scanned area. Figure 29 shows planar surfaces extracted for
boresighting calculations. Using the corrected parameters from the boresight, LMS
software was used to export the point cloud for each overpass. Figure 30 shows an image
of the exported point cloud for the Cincinnati Rd. location.
Figure 28. Point cloud of boresight area

41
Figure 30. Cincinnati Rd. point cloud.
Clearance Extraction. A combination of Bentley Openroads Designer and TopoDOT
software was used to extract minimum clearances from the point clouds. Visualizing the
Figure29. Detected planar surfaces extracted from boresight.

42
data by intensity values, exterior lane lines were used as a reference path for the
extraction tools. Given the referenced line, the software calculates the clearance values
between the roadway and the above structure. Cross section examples for each project
location depicting minimum clearances are shown in figures 31-33. Table 2 shows the
clearance values for all measurement methods.
Figure 31. Rogers Gap cross section.
Figure 32. Alexandria Dr. cross section.

43
Figure 33. Cincinnati Rd. cross section
Table 2.
Measurement Results in feet
Alexandria Dr. at New Circle Rd. Location LMS Laser Tape REM
Southern Beam NB 15.615 15.655 15.609 Northern Beam NB 20.963 20.977 20.910 Southern Beam SB 16.125 16.182 16.125 Northern Beam SB 21.393 21.412 21.317
Cincinnati Rd at I-75 Location LMS Laser Tape REM
Southern Beam NB 17.626 17.646 17.588 Northern Beam NB 21.877 21.888 21.810 Southern Beam SB 16.701 16.723 16.664 Northern Beam SB 20.824 20.837 20.789
Rogers Gap Rd at I-75 Location LMS Laser Tape REM
Southern Beam NB 16.856 16.844 16.861 Northern Beam NB 15.938 15.957 15.906 Southern Beam SB 16.405 16.439 16.431 Northern Beam SB 15.679 15.693 15.691
44
Method of Data Analysis
The results of this study can be divided into two parts. First a One-Way Anova test was
run to statistically show how each method of clearance extraction performed relative to
the others under the same conditions. The researcher tested the hypothesis that the Laser
tape, REM, and LiDAR methods did not show statistical differences between each
collected dataset using an α=0.05. Table 3 provides a summary of the defined alternative
hypotheses (H1) as well as the null hypotheses (H0). The null hypothesis (H0) will be
rejected if the one-way ANOVA test falls into the rejection region (p<.5). Otherwise, the
null hypothesis would be retained. The laser tape group is represented by μ1, REM
method by μ2, and LiDAR by μ3. Sample size for each group is represented by n. Second,
the researcher compared each method on operational procedures, impact on work zone
safety and traffic disruption.
Table 3 Hypothesis Summary.
Threats to Validity
Several factors could threaten the validity of this study. First, Mobile LiDAR
technology can be affected by rain, fog, snow, or dust present in the scanning
atmosphere. Data collection performed during these conditions can adversely affect data
quality. Additionally, the GPS component is dependent on satellite coverage and signal
H0: μ1 = μ2 = μ3
H1: Means are not all equal

45
strength. The precision of the GPS can vary day-to-day depending on atmospheric
conditions. Traffic can also affect the collection of LiDAR data; any surrounding
vehicles can prevent the laser from reaching its target surface. Laser tape and total
station methods require precise setup and operational decisions that could impact the
quality of data acquired.
Results and discussion
Statistical analysis. A one-way ANOVA was conducted to determine if collected
measurements were statistically different for groups using different collection methods.
Methods were classified into three groups: Laser tape (n = 12), Mobile LiDAR (n = 12),
and REM (n = 12). There were no outliers, as assessed by boxplot (Appendix B). The
mean of measurement increased from the REM (n = 12, M = 17.958, SD = 2.433), to
Mobile LiDAR (n = 12, M = 18.00, SD = 2.481), to Laser Tape (n = 12, M = 18.021, SD
= 2.477) measurement method groups, in that order, but the differences between these
groups were not statistically significant, F(2, 33) = 0.002, p = .998. The group means
were not statistically different (p > .05). Therefore, we cannot reject the null hypothesis
and we cannot accept the alternative hypothesis. The second analysis looks to discuss
operational procedures as well as each methods impact on traffic and safety. Due to
safety concerns, site selection for this project was based on locations with low traffic
flow. However, the procedures undertaken can be theoretically applied to high traffic
areas.
Remote Elevation Method. Data collected using the REM method proved to be the most
challenging. The magnified sights of the total station limited the field of view, dark

46
conditions and similar materials made it difficult to distinguish features and locate
individual beam centers. Small changes in vertical inclination of the instrument can
significantly change the result of the intended measurement, this effect was apparent
when performing operations at close range. Setup and data acquisition time was
moderate, multiple setups for each structure were required in order to retain a line of sight
to the intended target. Multiple setups introduce a greater possibility for error. Improper
leveling and varying instrument heights can skew results. This method requires workers
to occupy areas of interest below the structure, potentially exposing them to hazardous
situations. Depending on site layout and bridge design this method may require the use
of traffic control measures to provide a safe working environment.
Laser Tape. The laser tape proved to be the fastest method of acquiring vertical
clearance data when a limited number of data points are needed. Results are obtained in
real time and the operation can be carried out by a single individual. This method
directly subjects workers to vehicular traffic hazards for the longest duration. Individuals
must level the instrument under the overhead target while acquiring measurements,
potentially distracting them from surrounding hazards. The Laser tape, when added to a
bipod and prism pole can mitigate human error when used properly. However, if the pole
is out of level the correct value may not be obtained. Depending on site conditions, this
method may require additional traffic control measures.
MLS. This method did not require any workers to be present under the structures and
had little to no impact on traffic. Traffic control measures are usually not required unless
needed under special circumstances. Unlike the REM and laser tape method, LiDAR

47
technology does not provide real time data. Additional time is needed to post process the
trajectory and point cloud data before extracting results. Boresighting procedures are
also recommended before data collection. Unforeseen complications in GPS signal
quality or hardware components can negatively impact accuracies. LiDAR systems
require additional resources such as hardware, software, and trained personnel and
therefore may not be always be a feasible option.
Data collected for this study concentrated on extracting clearance heights from
exterior lane lines. However, changing roadway geometry and bridge designs can result
in overhead clearance variability, reducing minimum clearances in other locations below
the structure. In these scenarios, additional traffic control measures may be needed to
properly access and measure these areas when using the REM or laser tape methods.
Conclusion
No significant statistical differences were observed between the laser tape, REM,
and MLS methods. Therefore, the study found that all three methods of vertical
clearance extraction are capable of providing accurate measurements under the right
conditions. The selection of which technology to utilize involves multiple factors such as
site conditions, time, environmental conditions, resource availability, and safety
provisions. The laser tape and REM methods provide a proven option to extract
clearances on small scale projects in low traffic areas where safety concerns can be
adequately managed. Mobile LiDAR is best suited for projects involving multiple
structures, variable overhead clearances, hazardous conditions or areas prone to traffic
congestion such as interstates or parkways.

48
Future Research
While the current research provides a solid basis for the use of MLS systems to
determine minimum clearances for bridge structures, the technology is not a one size fits
all approach. This study identifies several key points; however, it does not discuss cost
variability between methods. A cost benefit analysis encompassing all aspects of various
projects and methods would further aid in future decision-making processes.

49
References
Association of State Highway and Transportation Officials. (2016). Policy on geometric design of highways and streets. Washington, DC.
Abshire, J. B. (2010). NASA’s space lidar measurements of earth and planetary surfaces.
Frontiers in Optics (p. SMB1). Optical Society of America. Agrawal, A. K., & Chen, C. (2011). Bridge vehicle impact assessment. University
Transportation Research Center, No. C-07-10, New York State Department of Transportation.
Bannister, A., Raymond, S., and Baker, R. (1998). Surveying. Addison- Wesley, New
York. Bureau of Transportation Statistics. (2007). Freight facts and figures. Retrieved from:
https://www.bts.gov/sites/bts.dot.gov/files/docs/FFF_2017.pdf Brown, L. N. (2004). Reflectorless Revolution. Point of Beginning. Retrieved from
http://www.pobonline.com/articles/85241-reflectorless-revolution Chang, J., Findley, D., Cunningham, C., & Tsai, M. (2014). Considerations for effective
LIDAR deployment by transportation agencies. Transportation Research Record: Journal of the Transportation Research Board, (2440), 1-8. doi: http://dx.doi.org.ezproxy.uky.edu/10.3141/2440-01
Clancy, S. (2011). The importance of applied control. LIDAR Magazine; Volume 1(2), pg.
26–30. Retrieved from: http://LIDARnews.com/emag/2011/vol1no2/index.html Clinton, B. (2000). Statement by the President regarding the United States’ decision to
stop degrading global positioning system accuracy. Office the the Press Secretary, The White House.
Coiner, C. M., Bruno, A.P. (2002). 3D Laser scanning for common surveying
applications. San Ramon, CA. Retrieved from: http://rgasurveying.com/wp-content/uploads/LaserScanningSurve.pdf
Cunha, J. M., & LoPiccalo, K. (2014). Case: The global positioning system. (No. NPS-
GSBPP-14-002). Naval Postgraduate School, Monterey CA, Graduate School of Business and Public Policy.
Federal Highway Administration. (2004). Federal size regulations for commercial motor vehicles. Retrieved from: https://ops.fhwa.dot.gov/freight/publications/size_regs_final_rpt/size_regs_final_rpt.pdf

50
Federal Highway Administration. (2015). Facts and statistics of work zone safety. Retrieved from: https://ops.fhwa.dot.gov/wz/resources/facts_stats/safety.htm
Flood, M. (1999). Commercial development of airborne laser altimetry. International Archives of Photogrammetry and Remote Sensing, 32(Part 3), W14.
Fu, C. C., Burhouse, J. R., & Chang, G. (2004). Study of over-height vehicle collisions with highway bridges. Transportation Research Record: Journal of the Transportation Research Board, 1865(1), 80–88.
Gaurav, S. (2017). Light detection and ranging (LiDAR): Technologies and global markets. Volume 2(1), pg.2.
Glennie, C. (2009). Kinematic terrestrial light-detection and ranging system for scanning. Transportation Research Record, 2105, 135–141.
Harik, I. E., Shaaban, A. M., Gesund, H., Valli, G. Y. S., & Wang, S. T. (1990). United States bridge failures, 1951–1988. Journal of Performance of Constructed Facilities, 4(4), 272-277.
Hanchey, C. M. and Exley, S. F. (1990). Overheight vehicle warning systems in Mississippi, ITE Journal, 60(6), 24-29.
Hecht, J. (2010). A short history of laser development. Applied optics, 49(25), F99-F122.
Hilton, M. H. (1973). Some Case Studies of Highway Bridges Involved in Accidents, Highway Research Record, 432, 41-51.
Jáuregui, D. V., White, K. R., Woodward, C. B., & Leitch, K. R. (2003). Noncontact photogrammetric measurement of vertical bridge deflection. Journal of Bridge Engineering, 8(4), 212–222. http://doi.org/10.1061/(ASCE)1084-0702(2003)8:4(212)
Kentucky Chamber. (2017). A Citizens Guide to Kentucky’s Infrastructure. Retrieved from: https://www.kychamber.com/sites/default/files/pdfs/A%20Citizens%20Guide%20to%20Kentucky%20Infrastructure%20May%202017_0_1.pdf
Kentucky Transportation Center, Division of Highway Design. (2006). Surveying: Survey Control, (HD-303). Retrieved from: http://transportation.ky.gov/Highway-design/Highway%20Design%20Manual/Surveying.pdf
Lauzon, R. G. (2000). Automated vertical clearance measurement during photolog operations. Report No. 2220-F-2000-4.

51
Lee, G. C., Tong, M., & Yen, W. P. (2006). Design of highway bridges against extreme hazard events: Issues, principles and approaches.
LMS for Lynx User’s Manual. (2013). Optech, Vaughan, ON, Canada.
MRC. (1988). 5 Span Damage Rate Rising. Michigan roads and construction, 85(50).
National Transportation Safety Board. (2013). Collapse of the Interstate 5 Skagit River bridge following a strike by an oversize combination vehicle. Accident Rep. (NTSB/HAR-14)01, Washington, DC.
National Transportation Safety Board. (2015). NTSB Safety Alert. Retrieved from https://www.ntsb.gov/safety/safety-alerts/Documents/SA_049.pdf
Olsen, M. J., Roe, G. V, Glennie, C., Persi, F., Consulting, P., Reedy, M, Tuss, H. (2013). NCHRP Guidelines for the use of mobile lidar in transportation applications, NCHRP report, 15(44), pg. 7-14.
Overweight / Over-dimensional Legal Dimensions. (2017). Retrieved from: https://drive.ky.gov/motor-carriers/Pages/OWOD-Legal-Dimensions.aspx
Puente, I., González-Jorge, H., Martínez-Sánchez, J., & Arias, P. (2013). Review of mobile mapping and surveying technologies. Measurement: Journal of the International Measurement Confederation, 46(7), 2127–2145. http://doi.org/10.1016/j.measurement.2013.03.006
Sokolova, N., Morrison, A., & Haakonsen, T. A. (2015). Public road infrastructure inventory in degraded global navigation satellite system signal environments. Journal of Geodetic Science, 5(1), 17-18. http://doi.org/10.1515/jogs-2015-0002
Stark, T. D., Benekohal, R., Fahnestock, L. A., LaFave, J. M., He, J., & Wittenkeller, C. (2016). I-5 Skagit River Bridge Collapse Review. Journal of Performance of Constructed Facilities, 30(6). http://doi.org/10.1061/(ASCE)CF.1943-5509.0000913
Toschi, I., Rodríguez-Gonzálvez, P., Remondino, F., Minto, S., Orlandini, S., & Fuller, A. (2015). Accuracy evaluation of a mobile mapping system with advanced statistical methods. The International Archives of Photogrammetry, Remote Sensing and Spatial Information Sciences, 40(5), 245. Retrieved from http://www.int-arch-photogramm-remote-sens-spatial-inf-sci.net/XL-5-W4/245/2015/
US Army Corps of Engineers. (2007). Engineering and design control and topographic
surveying. The Army Corps of Engineers. Retrieved from: http://publications.usace.army.mil/publications/eng-manuals/EM_

52
Wang, W., Zhao, W., Huang, L., Vimarlund, V., & Wang, Z. (2014). Applications of terrestrial laser scanning for tunnels: a review. Journal of Traffic and Transportation Engineering, 1(5), 325–337. http://doi.org/10.1016/S2095-7564 (15)30279-8
Williams, K., Olsen, M., Roe, G., & Glennie, C. (2013). Synthesis of transportation applications of mobile LiDAR. Remote Sensing, 5(9), 4652-4692.
Yen, K. S., Ravani, B., & Lasky, T. A. (2011). LiDAR for data efficiency. (No. WA-RD 778.1). Washington Dept. of Transportation. Office of Research and Library Services.
Zhang, C., Arditi, D., & Chen, Z. (2013). Using terrestrial laser scanners to calculate and map vertical bridge clearance. International Archives of the Photogrammetry, Remote Sensing and Spatial Information Sciences, XL (11), 133–139. http://doi.org/10.5194/isprsarchives-XL-2-W2-133-201

53
APPENDIX A
Trajectory and GPS Tracking information and metrics.
Rover Data QC Raw IMU Import QC Summary
IMU data input file imu_Mission 1.dat IMU data check log file imudt_Mission 1.log IMU Records Processed 275371 Termination Status Normal IMU Anomalies 0
Primary Observables & Satellite Data L1 Satellite Lock/Elevation

54
GPS L1 SNR
GPS L2 SNR

55
Satellite Lock/Elevation
Smoothed Trajectory Information Top View
56
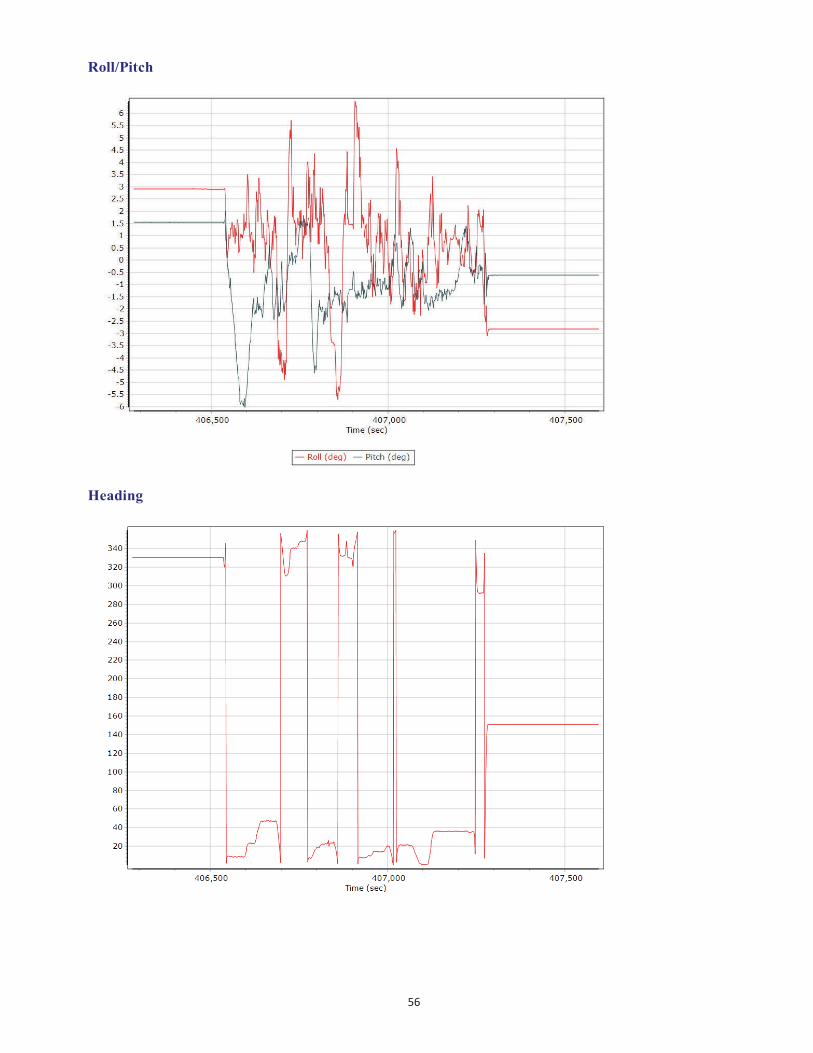
Roll/Pitch
Heading

57
North/East Velocity
Down VelocityBody Acceleration

58
Altitude

59
APPENDIX B
One-way Anova Descriptives and Boxplot.
Measurement
Sum of Squares df Mean Square F Sig Between Groups .025 2 .012 .002 .998 Within Groups 200.345 33 6.071 Total 200.369 35
Measurement 95% Confidence Interval for Mean
N Mean Std. Deviation
Lower Bound
Upper Bound
Minimum Maximum
Laser Tape 12 18.02117 2.447189 16.44724 19.59510 15.655 21.889 REM 12 17.95842 2.433109 16.41249 19.41249 15.609 21.810 Mobile LiDAR 12 18.00058 2.481262 16.42406 19.57710 15.631 21.877 Total 36 17.99339 2.392662 17.18383 18.80295 15.609 21.889